Article

Noisy ECG Signal Analysis for Automatic Peak Detection

1
INNOIT s.r.l., Via Einaudi, 10 – 70010 Locorotondo, Bari, Italy
2
Dipartimento di Ingegneria Elettrica e dell’Informazione, Politecnico di Bari, via E. Orabona, 4 – 70125 Bari, Italy
*
Author to whom correspondence should be addressed.
Information 2019, 10(2), 35; https://doi.org/10.3390/info10020035
Submission received: 29 October 2018 / Revised: 17 January 2019 / Accepted: 18 January 2019 / Published: 22 January 2019
(This article belongs to the Special Issue eHealth and Artificial Intelligence)

Abstract

:
Cardiac signal processing is usually a computationally demanding task as signals are heavily contaminated by noise and other artifacts. In this paper, an effective approach for peak point detection and localization in noisy electrocardiogram (ECG) signals is presented. Six stages characterize the implemented method, which adopts the Hilbert transform and a thresholding technique for the detection of zones inside the ECG signal which could contain a peak. Subsequently, the identified zones are analyzed using the wavelet transform for R point detection and localization. The conceived signal processing technique has been evaluated, adopting ECG signals belonging to MIT-BIH Noise Stress Test Database, which includes specially selected Holter recordings characterized by baseline wander, muscle artifacts and electrode motion artifacts as noise sources. The experimental results show that the proposed method reaches most satisfactory performance, even when challenging ECG signals are adopted. The results obtained are presented, discussed and compared with some other R wave detection algorithms indicated in literature, which adopt the same database as a test bench. In particular, for a signal to noise ratio (SNR) equal to 6 dB, results with minimal interference from noise and artifacts have been obtained, since Se e +P achieve values of 98.13% and 96.91, respectively.

1. Introduction

The electrocardiogram (ECG) is often contaminated by noise and/or interference that is external (i.e., electrode contact noise) or internal in origin (i.e., other physiological processes in the body), which could impair the reliability of diagnoses in clinical applications and practices. ECG signal variability and its morphology change over time and are dependent on each individual. Due to its dynamic nature, the ECG exhibits stochastic and nonstationary behavior. Therefore, the study of such a signal is a time-consuming task, with a high probability of physicians missing vital information [1,2].
Various approaches have been implemented to improve the accuracy of QRS complex detection. Without aiming to provide an exhaustive review of R peak detector procedures indicated in literature, some examples of the most recent and popular tools that adopt the standard MIT-BIH arrhythmia database are described below.
The well-known Pan and Tompkins method, which is a benchmark in the R peak detection field, is based on the slope, amplitude and width of the ECG signal [3]. After a preprocessing phase aimed at removing the noise, smoothing the waveform and amplifying the QRS slope and width, two sets of thresholds are applied to the signal in order to localize true positive R peaks. An evolution of the Pan and Tompkins method is indicated in [4], which reproduces the same preprocessing stage of [3] but optimizes the decision rules by the performance test of three estimators (mean, median and an iterative peak level) for the adaptive threshold placing.
A real time algorithm for QRS detection which is composed of four stages is proposed in [5]. To remove baseline wander and power-line interference from the ECG, a band-pass filter is applied, while to enhance the QRS complex, a five-point first-order differentiation, absolute and backward cumulation operation were used. For an accurate location of local maxima in ECGs with different morphologies, a K-nearest neighbor-based peak-finding algorithm and particle swarm optimization method were implemented.
In [6], a robust algorithm which adopts the Hilbert transform is indicated. For muscular artifact removal, the ECG signal is filtered by adopting a band-pass Finite Impulse Response (FIR) filter window, adopting a Kaiser Bessel window, while for the elimination of motion artifacts and base line noise, the first differential of the filtered signal is performed. Then, the first differential of the ECG signal is Hilbert transformed and undergoes adaptive threshold detection for an accurate R peak localization. A multiresolution analysis is used in [7] for the ECG signal enhancement and the signal mirroring is designed to avoid missing detections. To locate R peaks, local maximums are calculated by the first-order forward differential approach and are truncated by the amplitude and time interval thresholds.
In [8], authors applied simplification methods from computer graphics for data reduction, based on the observation that the ECG is essentially a graphical representation of heart electrical activity. In particular, a method named the vectorization process is applied, which is similar to that of converting bitmap images into vector images in computer graphics. After vectorization, the ECG signal is reduced to 11 slope types and the signal sequence of slopes is treated as a sequence of alphabetic symbols that can be recognized by a finite automata recognizer. To eliminate false positive detections of R peaks, a probabilistic analysis is performed.
A four stage R peak detection method which implements nonlinear transformation and a peak-finding strategy is presented in [9]. With the aim of enhancing QRS complexes and reducing out-of-band noise, the band-pass filtering and differentiation operations are implemented in the first stage, while for limiting the false positives/false negative detections, a nonlinear transformation based on energy thresholding, Shannon energy computation and smoothing processes is performed in the second stage. A peak-finding strategy based on the first order Gaussian differentiator is developed in the last two stages. In [10], the similarity between a template QRS pattern and potential QRSs is exploited through the use of a matched filter, while the Hilbert transform is used for the R peak localization. In case of multiple ambiguous R peaks, the possible occurrences in time are limited by a dynamic time window which depends on the standard deviation of previously detected R intervals. Subsequently, the selection of the R peaks is computed using the cross-correlation between potential QRSs and the selected template.
A combination of derivatives, wavelet and Hilbert transforms was adopted in [11] for the QRS enhancement. The combination of first and second derivative was applied on the signal obtained from the wavelet transform to accentuate the QRS complex and suppress P and T waves. Further, the Hilbert transform was applied to have an envelope for R peaks for a single sided threshold mechanism. The envelope peak was then detected by adding a high-frequency signal whose amplitude depended on the QRS complex.
With the aim to implementing a real-time system which is able to monitor the heart rate every few seconds, an adaptive thresholding-based ECG R peak detection procedure which combines the ECG segmentation method with the adaptive thresholding is indicated in [12]. The signal under test is initially band-passed through a zero-phase filter to remove baseline wander and high-frequency noise, and then differentiated to enlarge high-frequency components of QRS complexes and to suppress low-frequency components of P and T waves. The signal is successively squared and integrated to emphasize the correlation between samples and to merge the multiple peaks. The integrator, using the adaptive threshold algorithm, produces a smooth, pulse-like peak for each QRS peak which is used to detect the R peaks.
Instead of using a threshold based on amplitudes as in the previous paper, a threshold based on the sampling frequency is adopted in the peak detection logic indicated in [13], which is based on the second derivative.
As the presence of noise makes the extraction of accurate features from the ECG signal difficult, a hybrid linearization method involving the extended Kalman filter and the discrete wavelet transform is adopted in [14] for denoising. Thereafter, principal component analysis is applied to noise-free ECG signals for R peak localization.
The technique presented in [15] requires minimal preprocessing steps and simple decision rules. It is based on the root mean square of a cubed ECG signal, which boosts the signal strength of QRS complex more as compared to noise, artifacts and P and T waves. As the technique is based on a threshold, a two-step median filter is used to remove the baseline drift. A Savitzky–Golay filter is used for smoothing the ECG signal. This is because this type of filter minimizes the least-squares error in fitting a polynomial to each frame of noisy data. Kurtosis is determined to distinguish between prominent T waves and R peaks.
The nonstationary QRS morphology and noise is overcome in [16] with a multi-stage method for R peak detection which uses the Shannon energy envelope. In the first stage, noise is suppressed and the QRS complex is enhanced by adopting a Chebyshev type I filter, first order differentiation and amplitude normalization. Successively, the Shannon energy envelope is extracted and then the signal is passed through a zero-shift moving average filter in order to get a smooth Shannon energy envelope. In the last stage, the location of R peaks are detected.
The aim of this paper is the development of a computer aided detection (CADe) system, able to detect and localize QRS complexes in noisy ECG signals. As the main problem is to evaluate the heart rate, this study aims to solve this problem using a procedure oriented towards R characteristic point detection: The algorithm presented estimates the heart rate as inverse of the time interval between two consecutive R peaks. Heart rate variability (HVR) analysis has been increasingly recognized as a useful tool for understanding autonomic regulation during sleep, as well as patient screening in obstructive sleep apnea syndrome, congestive heart failure and other disorders [1,2]. The procedure presented is different from other published works because it is an appropriate means for parallel processing architecture. Moreover, the implemented system is quite independent of time-varying morphologies in QRS complexes, in fact, any initialization/modification of any data-dependent parameter is not needed.

2. Artifacts/Noises Affecting the ECG

The ECG signal can be contaminated by several noises, having different characteristics and properties. Some artifacts originate from stationary sources, while others have a non-stationary nature and are time-varying phenomena. For these artifacts, the noise presence and its ratio to the ECG signal is variable and difficult to anticipate over time [17,18].
The main sources of noise in the ECG signal are:
  • Baseline wander.
  • Power line interference.
  • Motion artifacts.
  • Muscle noise.
  • Other interference.

2.1. Baseline Wander

Baseline wander is slow-varying artifact, which is mainly due to the variation of the electrode-skin impedance, appearing in the form of a low-frequency component added to the ECG [19]. Impedance modification can occur as consequence of patient breath, electrode–skin contact and smooth movements.

2.2. Power Line Interference

This noise is generated by the power line electromagnetic field and exhibits its peak at 50 or 60 Hz. Its nature is stationary in terms of frequency in the affected intervals, even if the presence of these artifacts are not foreseeable in terms of the onset, offset, length and power in the corrupted intervals [18].

2.3. Motion Artifacts

These artifacts are generated by the electrode motions away from the contact zone on the skin. They are hard contaminations, as their morphology and frequency are unpredictable.

2.4. Muscle Noise

This contamination is due to the electromyographic signal (EMG), originating from skeletal muscle contractions. During ECG recording, the EMG signal overlaps with the ECG as if they have the same frequency spectrum, both of which are characterized by significant energy.

2.5. Other Interferences

Other noise sources affect the ECG signal, such as instrumentation noise produced by the equipment composing the recording section (probes, cables, analog to digital converter, etc.). Obviously, these types of interferences could be significantly reduced by a careful choice of high-quality devices.

3. Methods

3.1. Adopted Techniques

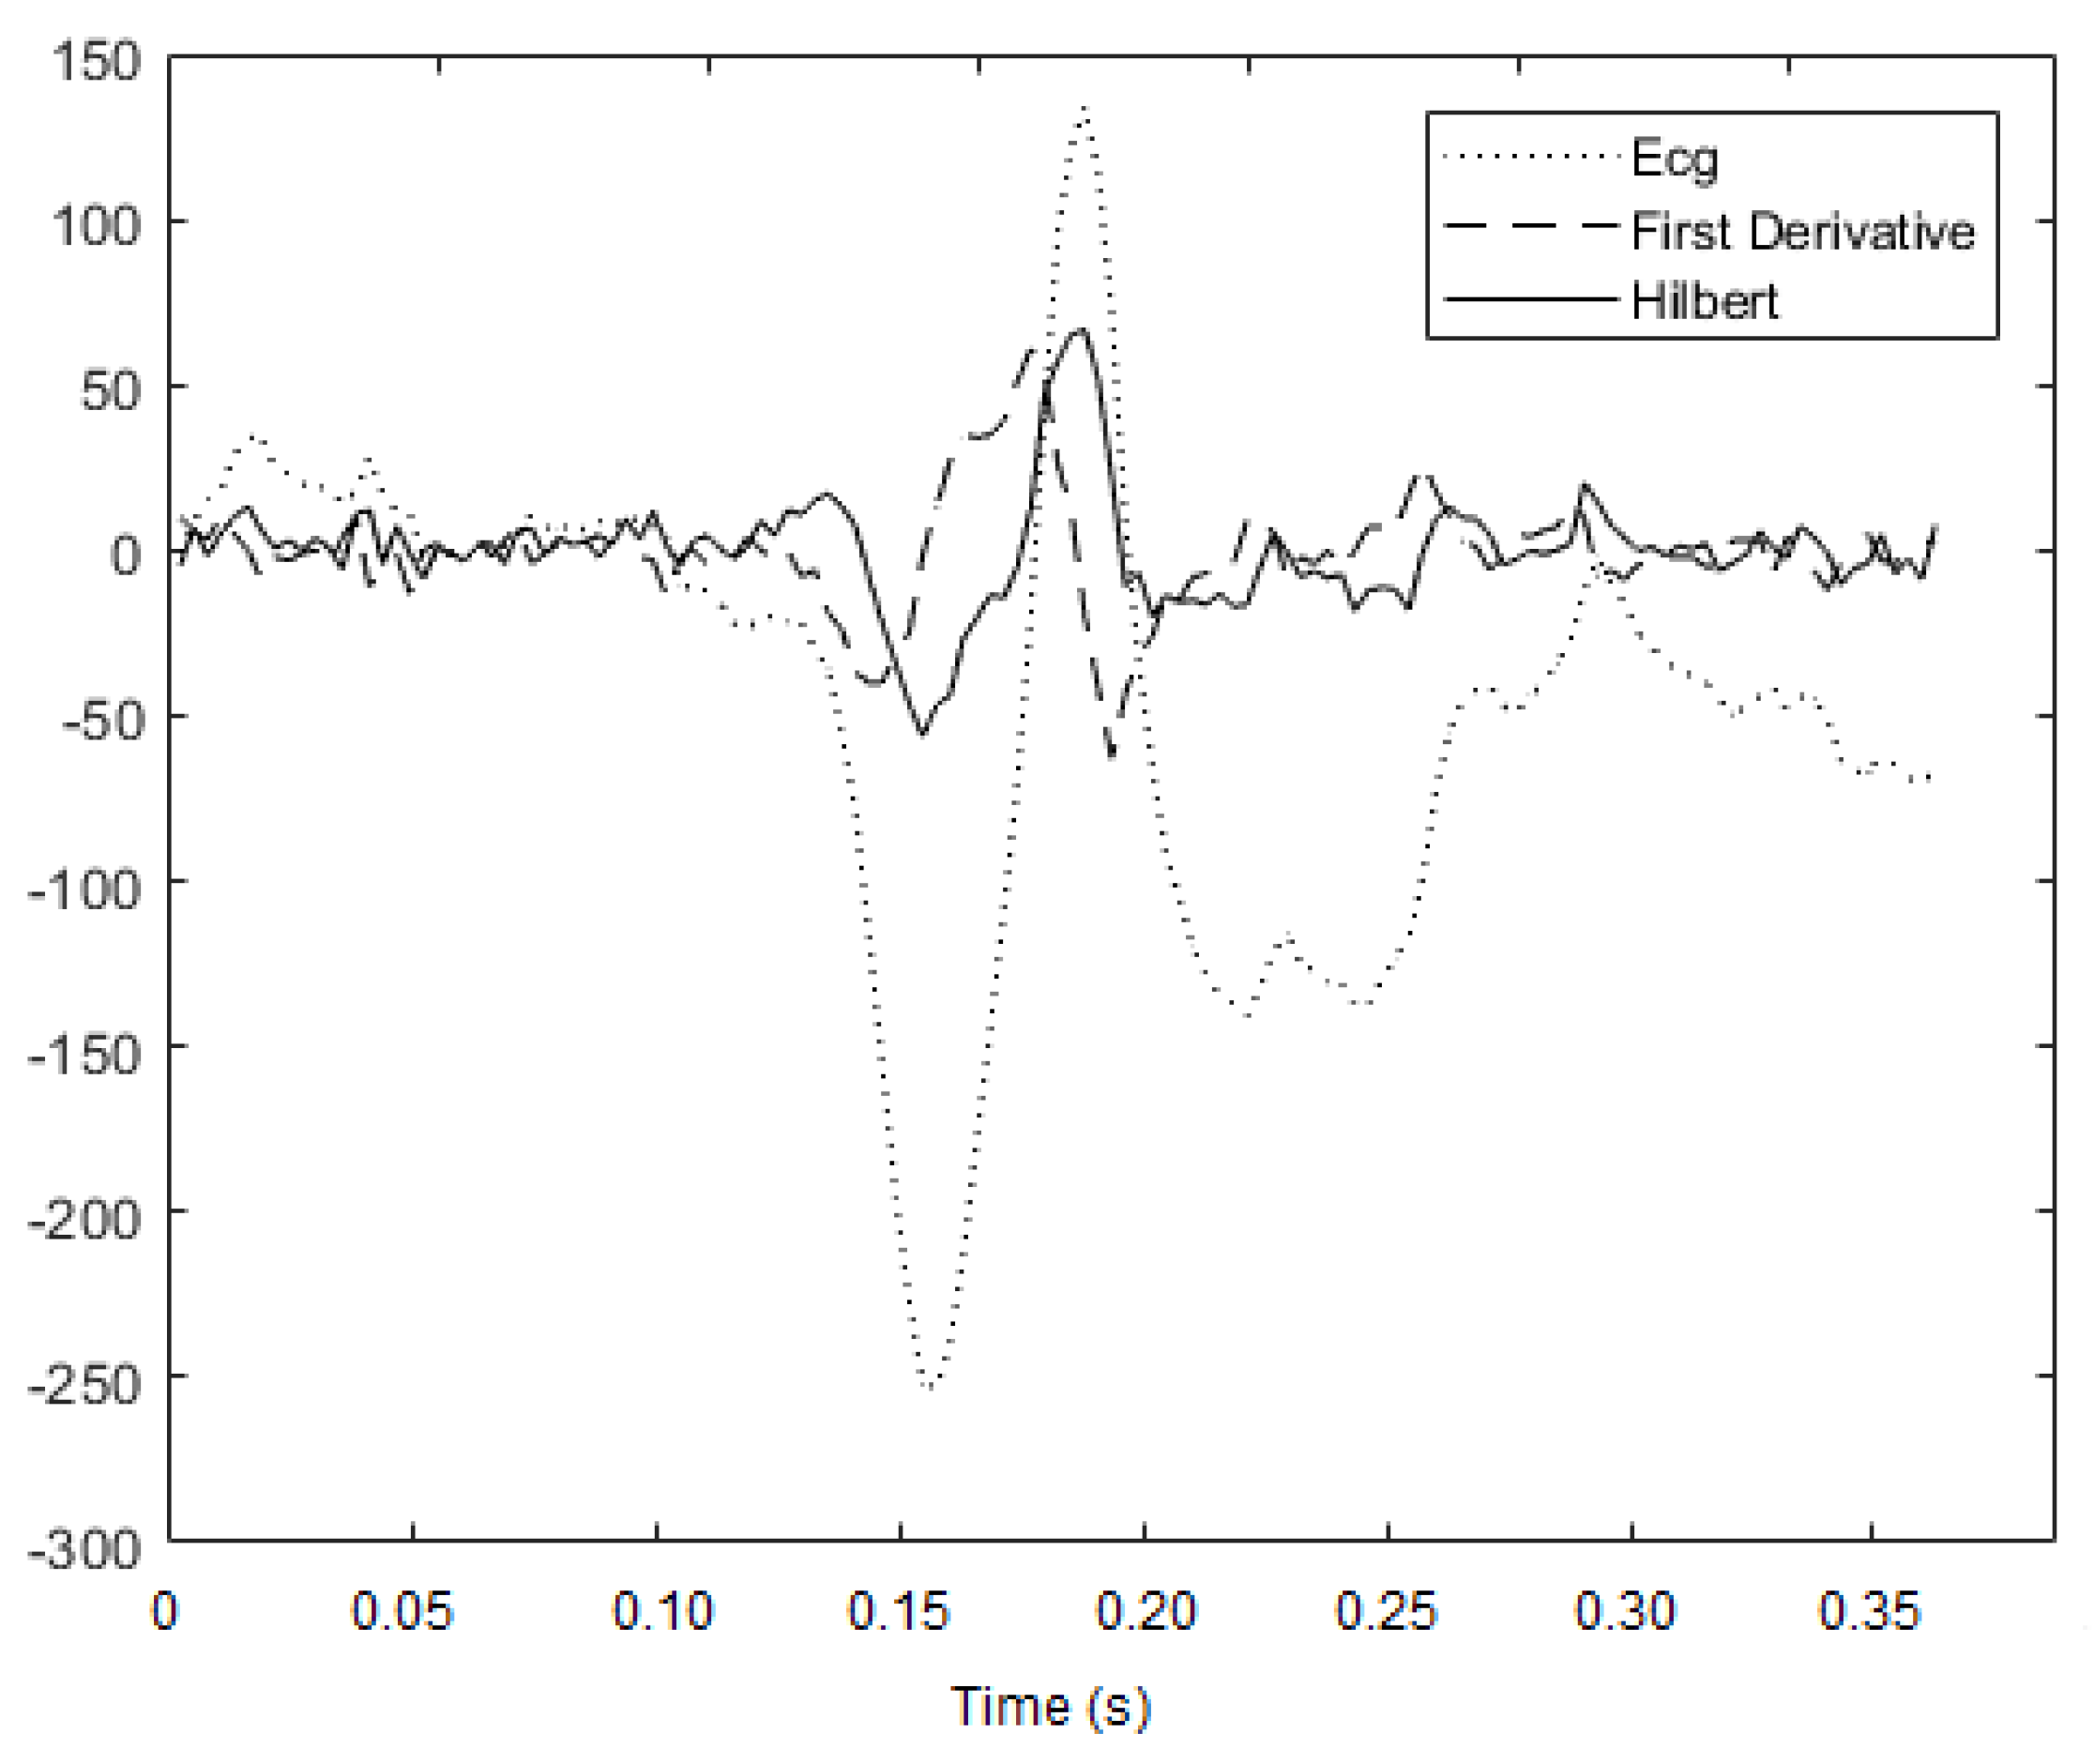
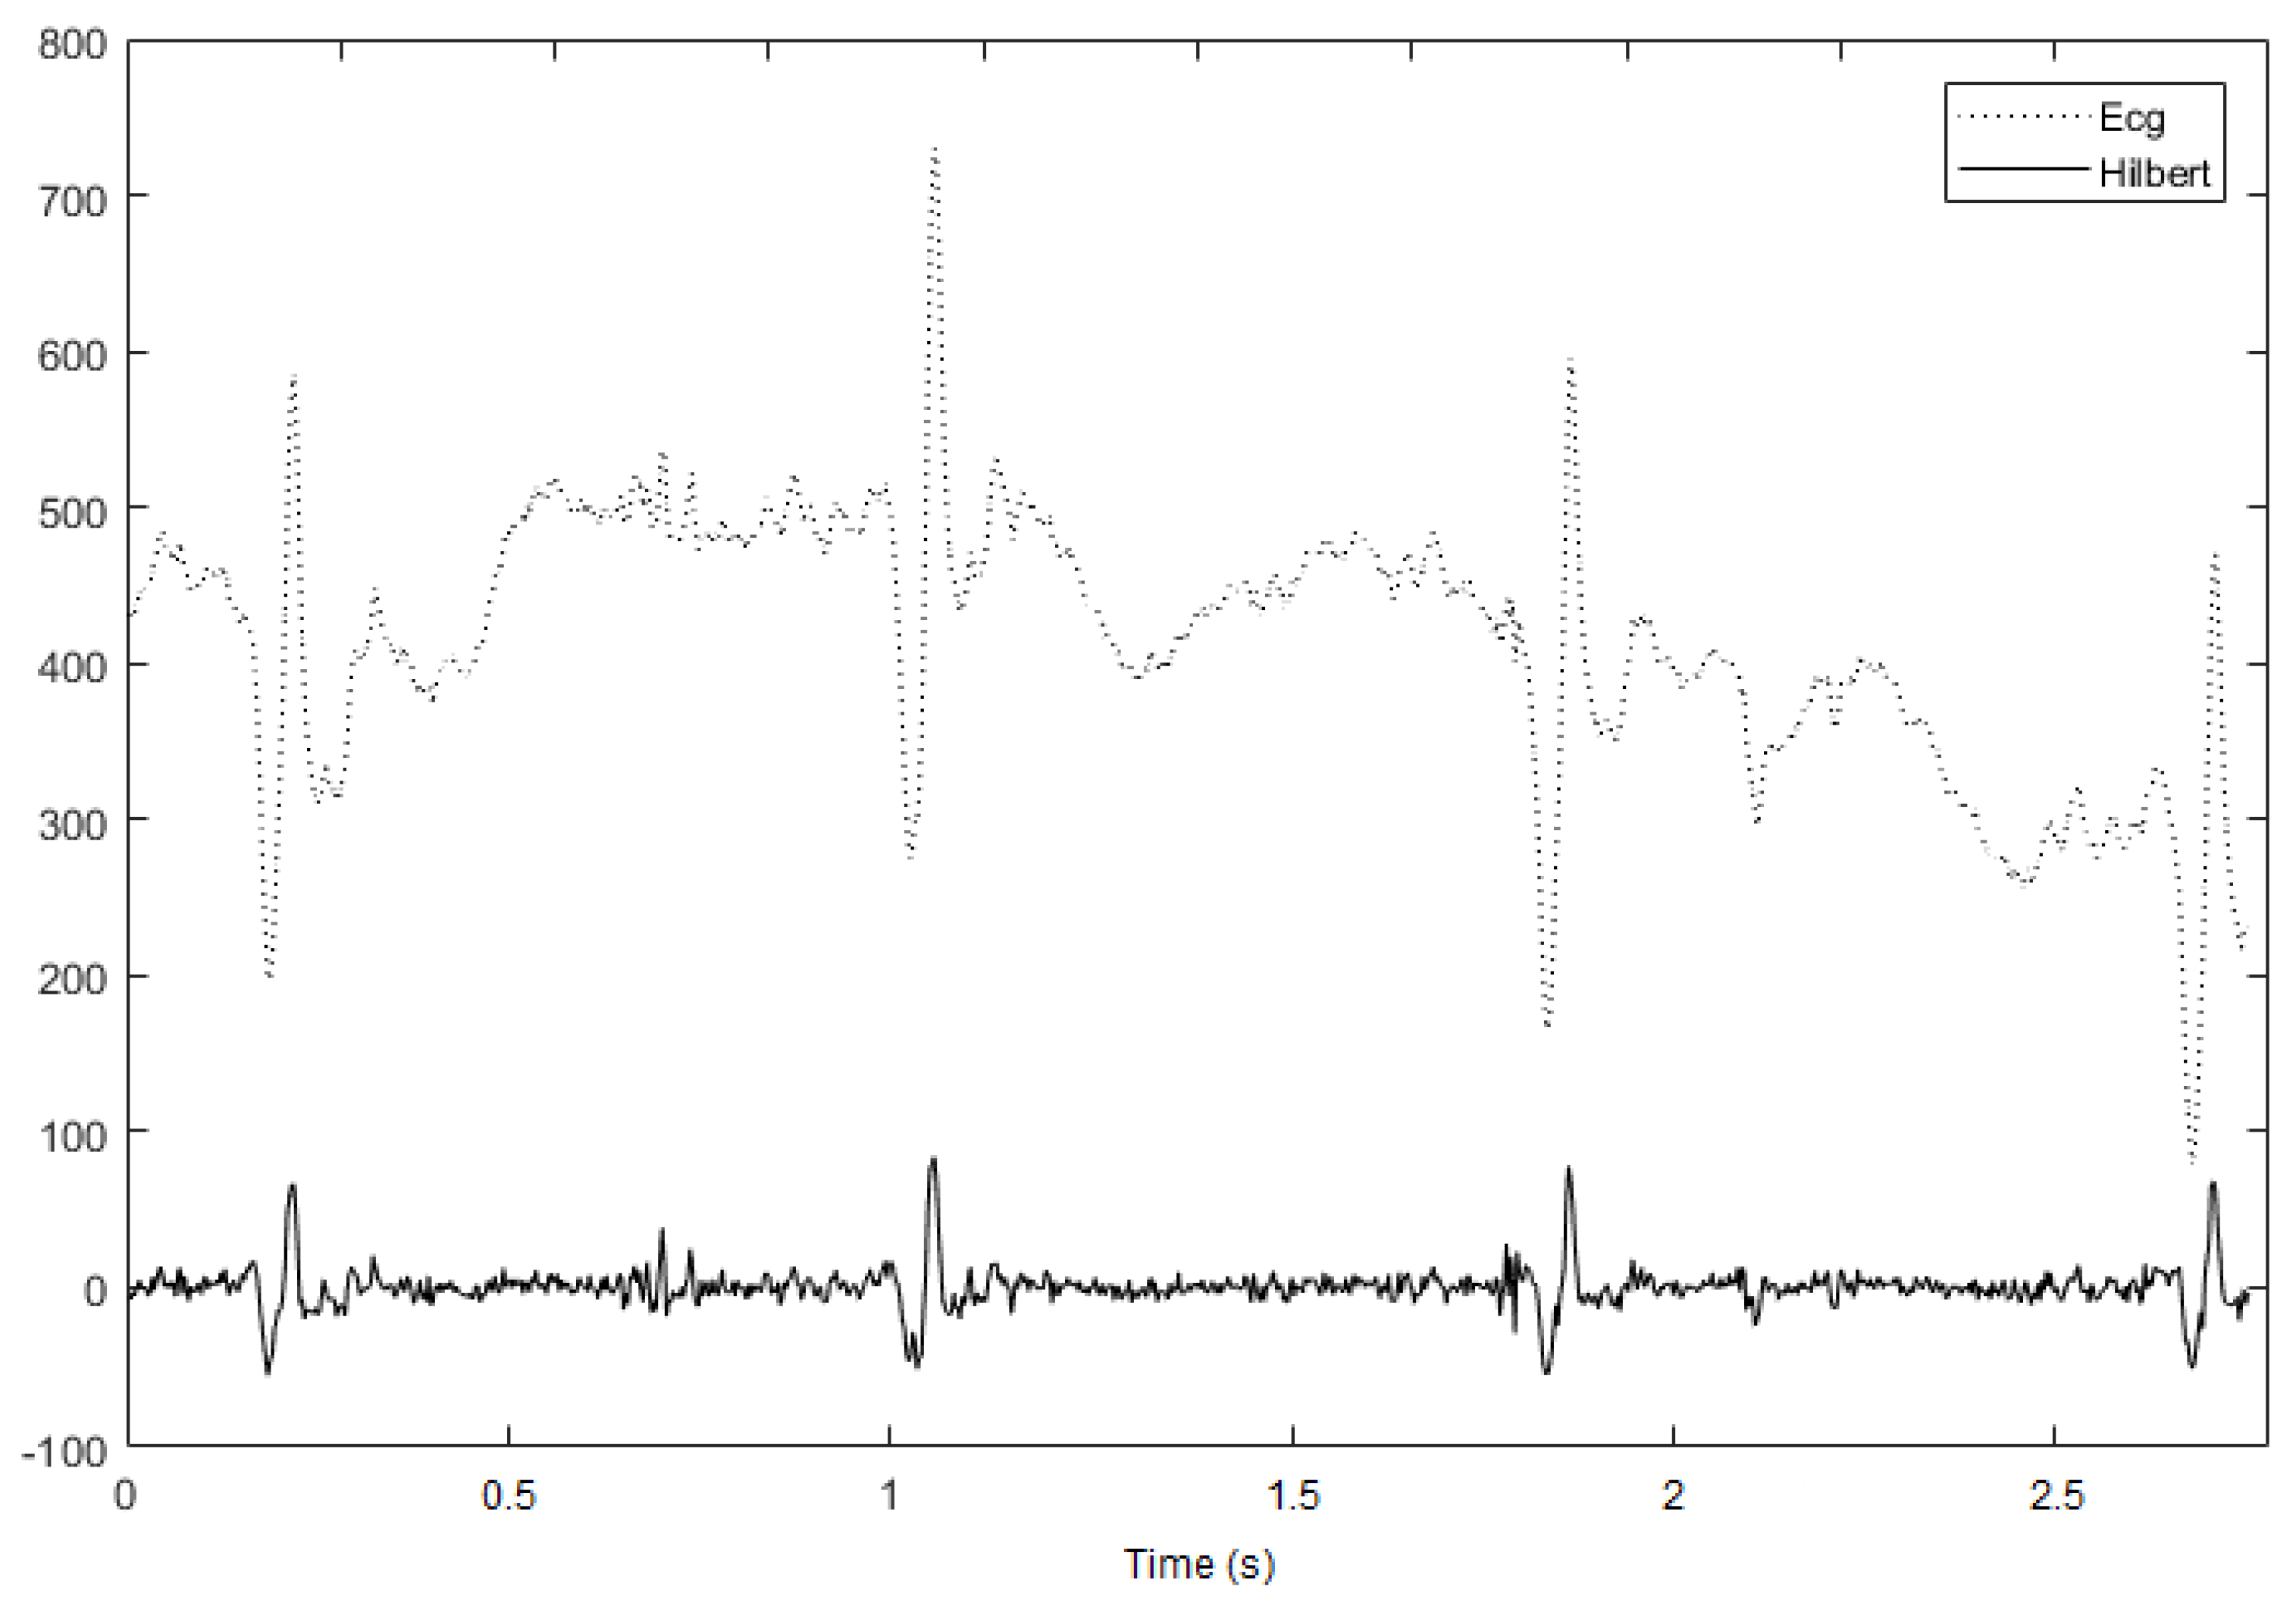
3.1.1. Hilbert Transform

The Hilbert transform, xH(t), of a real function, x(t), is defined as [20]:
x H ( t ) = 1 π + x ( τ ) 1 t τ d τ = x ( t ) 1 π t
Therefore, xH(t) is both a time dependent function and a linear function of x(t). In fact, it is obtained from x(t), applying the convolution with (πt)−1. Equation (1) shows that xH(t) is obtained by filtering the signal x(t) through a linear time-invariant filter with an impulse response equal to (πt)−1. Because the integrand has a singularity and the limits of integration are finite, the Hilbert transform is properly defined as the Cauchy principal value of the integral in (1) whenever this value exists.
Considering the frequency domain and applying the Fourier transform results in the following:
F { x H ( t ) } = j     sgn F { x ( t ) }
where j is the imaginary unit and
s n g F { x ( t ) } = { + 1 f > 0 0 f = 0 1 f < 0
Therefore, the Hilbert transform shifts all positive frequency components by −90° and all negative frequency components by +90°, while the amplitude of F[x(t)] remains constant. Thus, it is found that: x(t) and xH(t) are orthogonal and that xH(t) represents the harmonic conjugate of x(t).
The function x(t) and its transform, xH(t), are related to each other and they together create an analytic signal that is expressed as:
z ( t ) = x ( t ) + j x H ( t )
The envelope of z(t) is:
B ( t ) = x 2 ( t ) + x H 2 ( t )
It is evident that B(t) and x(t) have common tangents and the same values in the points where xH(t) is zero. In fact, B(t) evaluated with expression (4) has the same slope and magnitude of signal x(t) at or near its local maxima. Hence, the maximum contribution to the envelope at points where x(t) = 0 is given by the Hilbert transform.

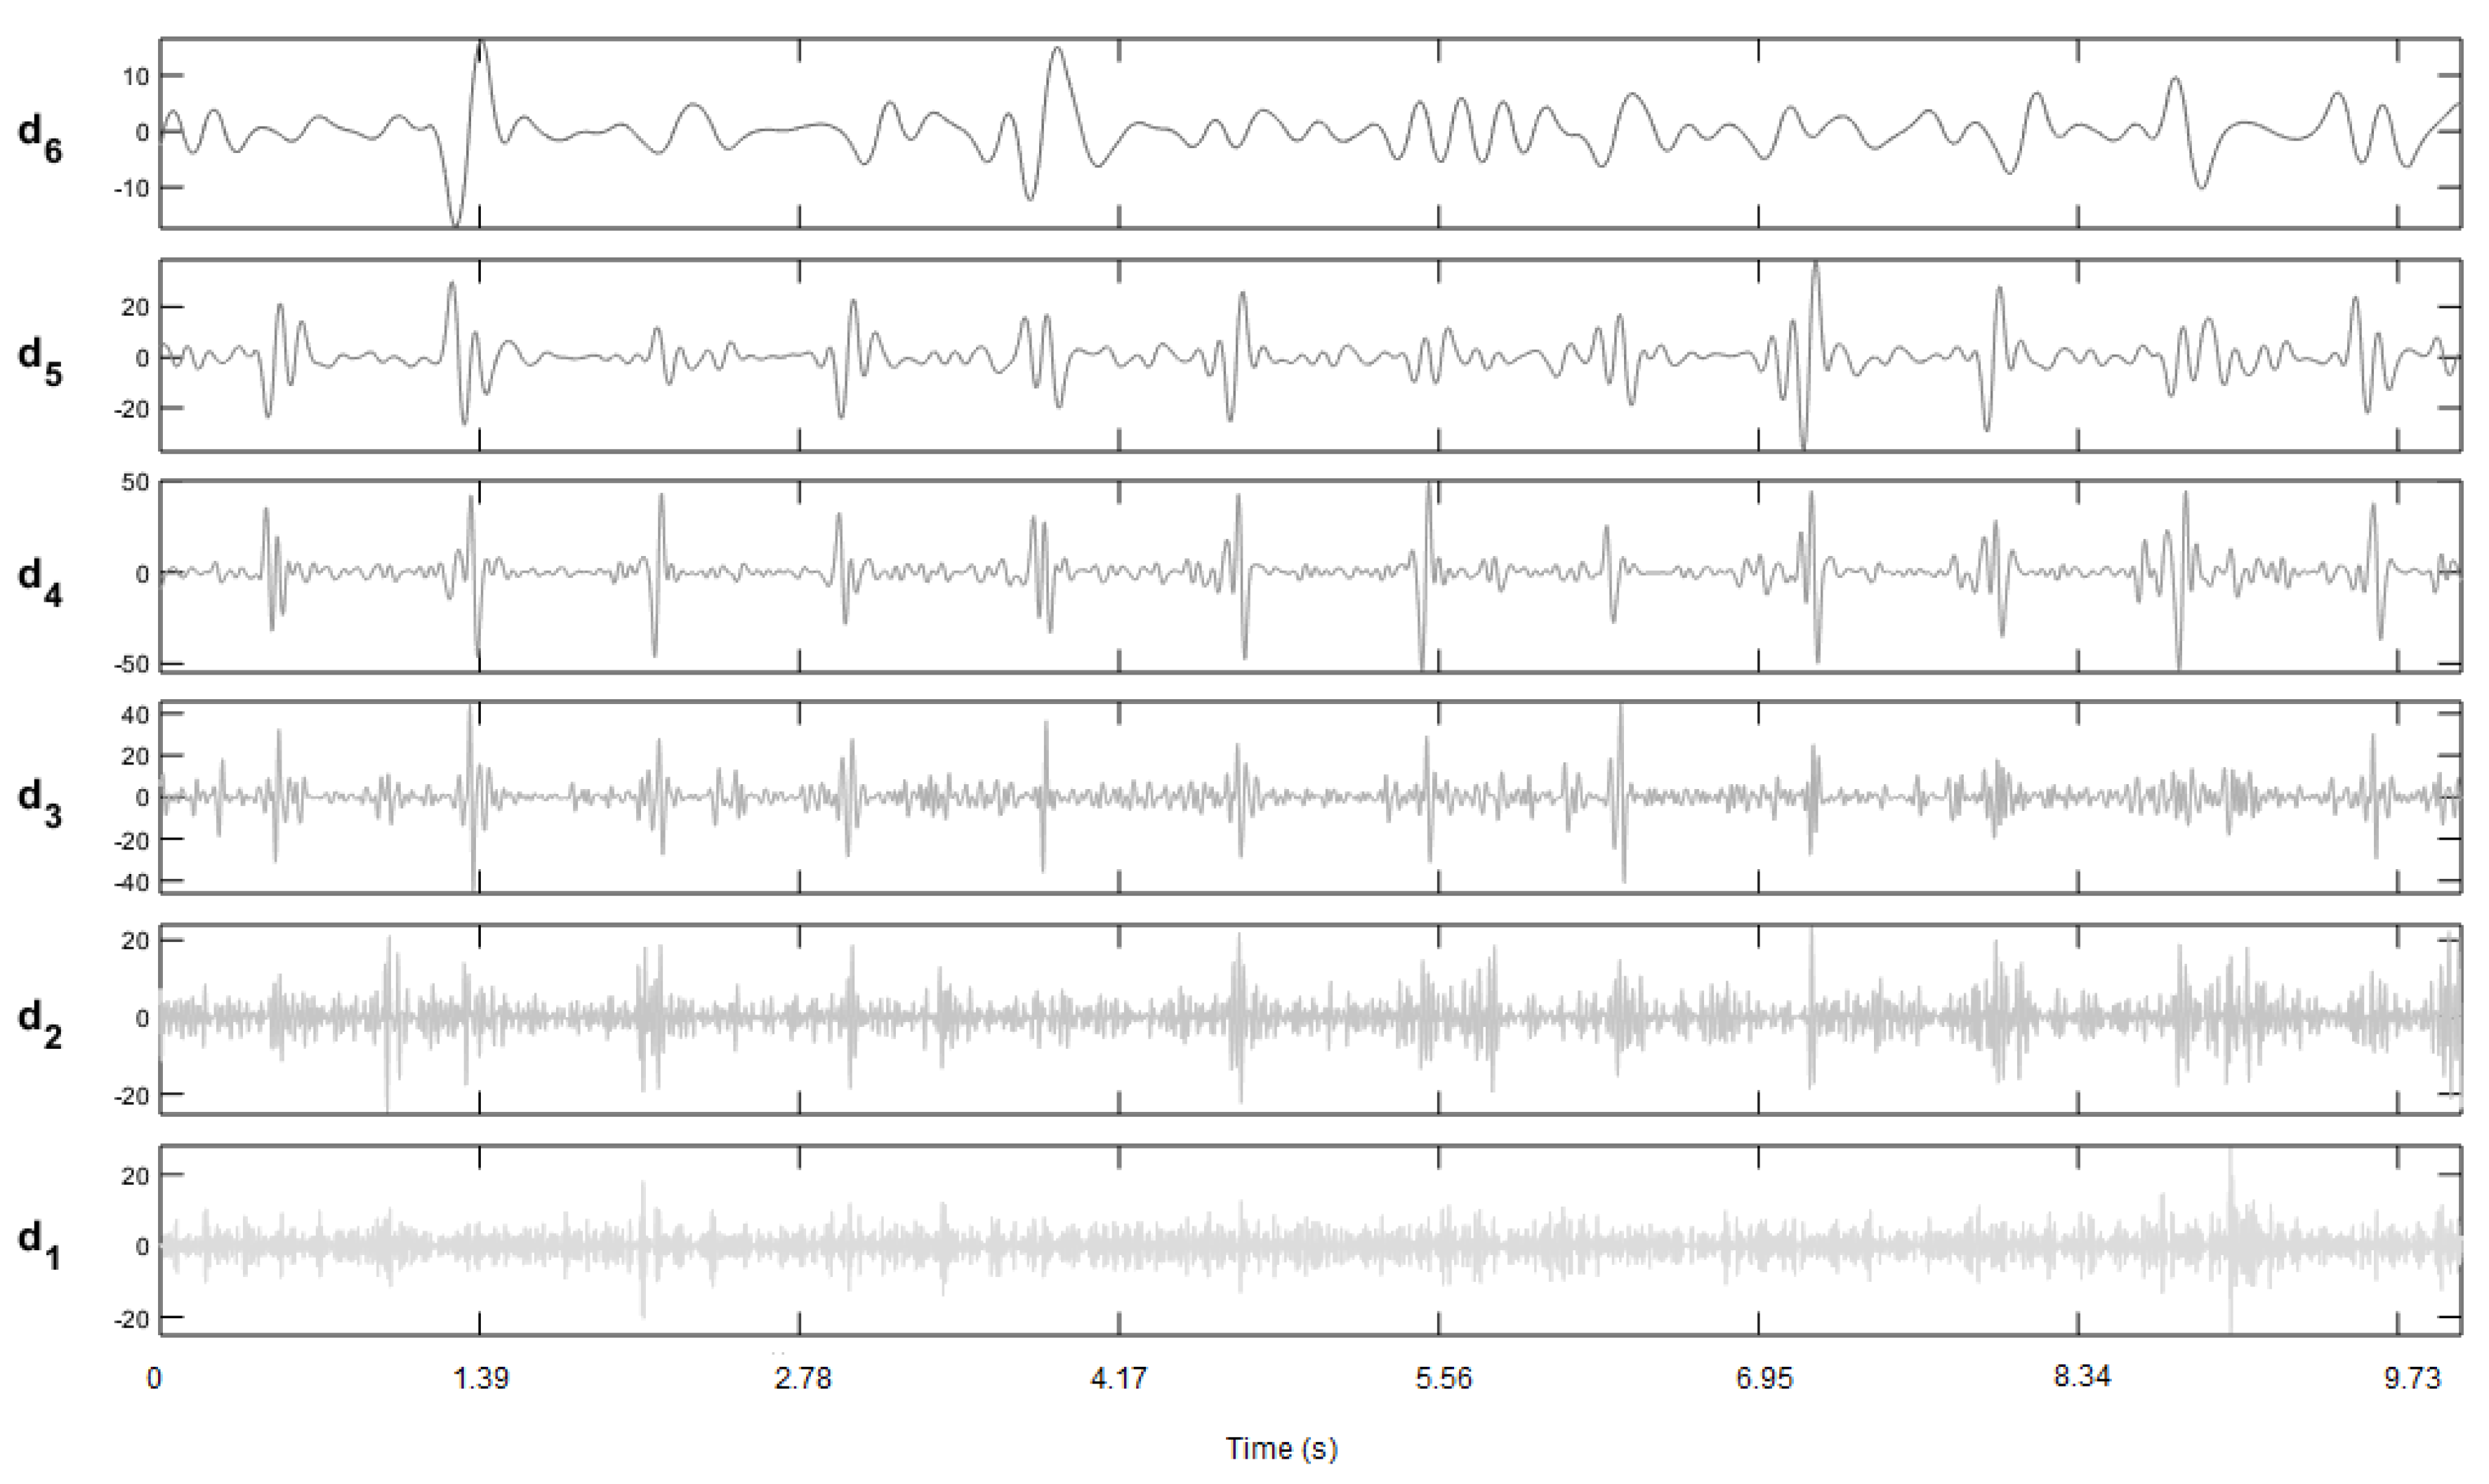
3.1.2. Wavelet Transform

The wavelet transform is a suitable tool for studying non-stationary signals. Therefore, it can identify useful information for R point detection and discard signal bands which provide a scant contribution to the study [21].
Since wavelet functions are compact, wavelet coefficients only measure the variations around a small region of a data array. This feature makes wavelet analysis particularly useful for signal processing; the “localized” nature of the wavelet transform allows us to pick out features in analyzed data with ease, such as spikes (i.e., noise or discontinuities), discrete objects, edges of objects and so forth. Moreover, wavelet coefficients at one location are not affected by coefficients at other locations in the data under study.
As the aim of this paper is the implementation of a fast algorithm, a non-redundant wavelet decomposition has been chosen. To determine the best wavelet function to be used, the ECG signal properties have been studied, such as the shape and the time localization of events, in particular the P wave, PR interval, PR segment, J point, ST segment, T wave, U wave and Qt duration have been studied.
As the temporal ECG shape is an important parameter, the wavelet to be adopted should be a symmetrical function to avoid the introduction of a non-linear phase shift. Spline wavelets have properties satisfying the previous requirements. The higher order of the spline wavelet results in the sharper frequency response of the equivalent FIR filter, which is always desirable. However, the FIR equivalent filter of the higher order spline wavelet has longer a coefficient series, leading to more computational time consumption. Therefore, the cubic spline wavelet is assumed to have an order high enough for this application.

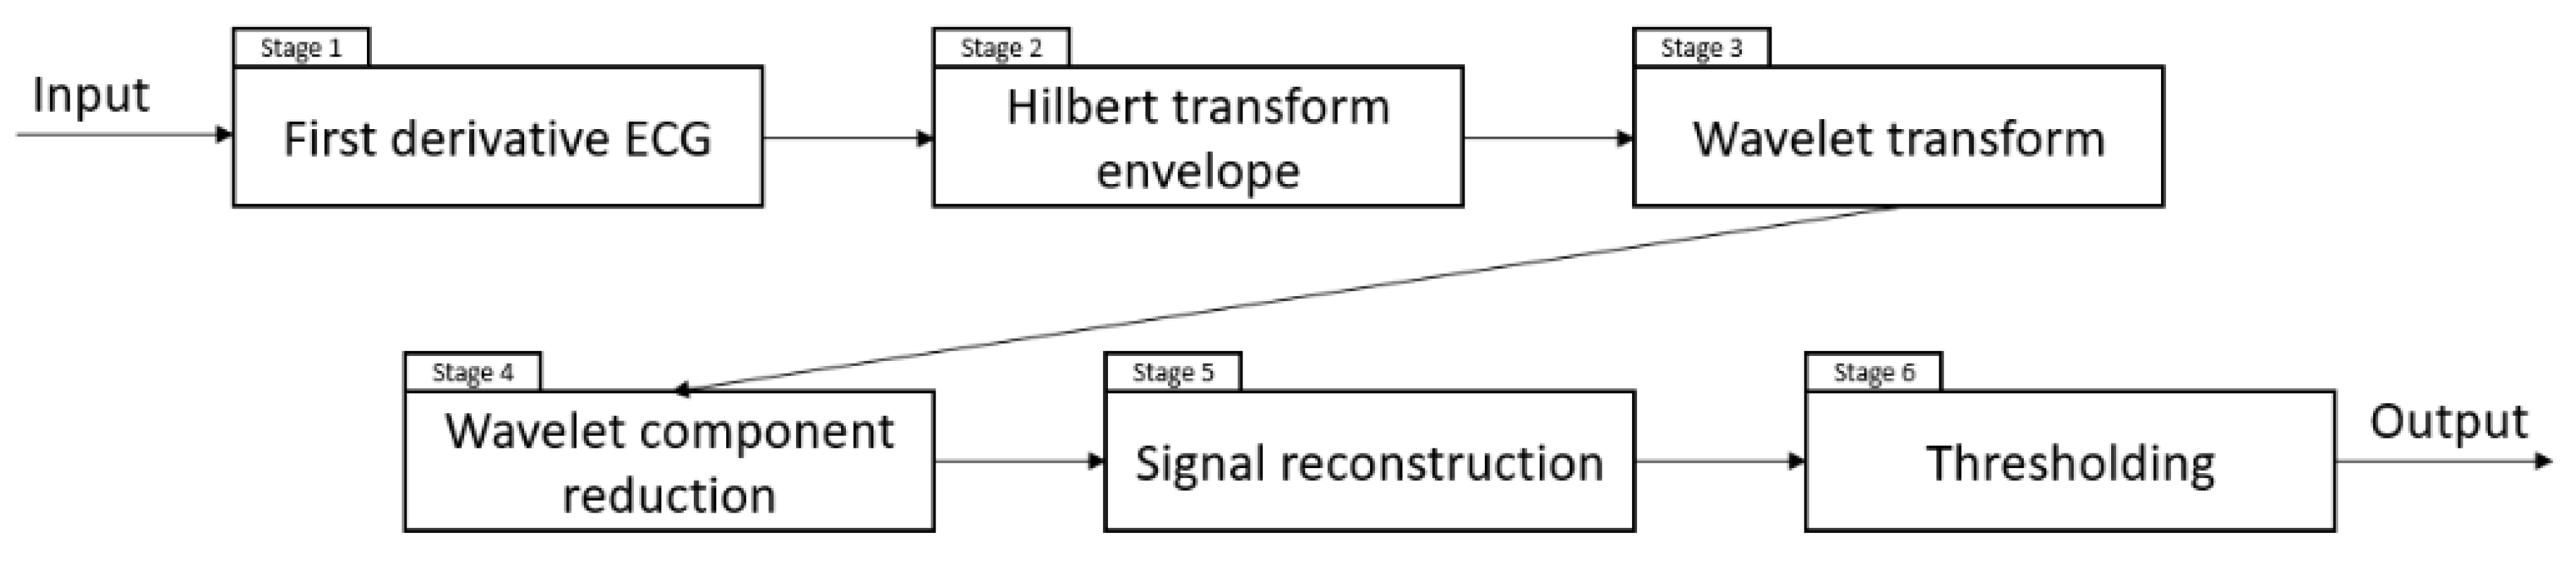
3.2. Implemented Method

The proposed system is composed of six stages (Figure 1) and it is developed using the MATLAB software environment.
The first stage is the pre-processing phase, in which the first derivative of the ECG signal was evaluated to provide information about the slope of the QRS complexes. In this way, both falling edges of signal from R to S and rising edges from Q to R are enhanced. In fact, the first derivative signal has a maximum point in correspondence to the rising slope of the R wave and a minimum in correspondence to the falling slope (Figure 2).
Furthermore, the zero crossing points of the first derivative signal represent regions of interest (ROIs) as they could be R peaks of the ECG signal.
The second stage performs the Hilbert transform envelope of the first derivative of the ECG waveform. In particular, the property of the Hilbert transform to bean odd function is exploited. Therefore, the Hilbert transform of a signal crosses zero on the x-axis when an inflexion point in the original waveform is present. Similarly, a crossing of zero between consecutive positive and negative inflexion points in the differentiated ECG waveform is represented as a peak in the Hilbert transform envelope of the differentiated ECG signal [22]. The Hilbert transform assists to accentuate the QRS complex compared to other components (Figure 2 and Figure 3).
In order to guarantee an accurate detection of R peaks, the other four stages are necessary.
The third stage decomposes the output signal of the second stage into six dyadic scales, adopting the wavelet Bior 3.3 (Figure 4).
The fourth stage performs a wavelet component reduction, in which only the information necessary for the detection and location of R points is preserved. The implemented method adopts both an evolution of the classical Mallat decomposition, called an à trous algorithm, and equivalent parallel filter banks [23].
The fifth stage performs the signal reconstruction. After various tests are carried out that take into account the power spectra of the input signal of the fifth stage, only the contribution of signals located in scales 3 and 4 are considered. A hard threshold is adopted for signal reconstruction over the selected dyadic scales, therefore the coefficients whose absolute value are lower than the threshold are set to zero. The threshold values for scales 3 and 4 are set equal to 12% and 53%, respectively, where they are the scale maximum peak values observed in the time period starting one second before the sample under test.
The sixth stage locates R peaks using a simple thresholding technique. The threshold value is set as 45% of the last R peak value detected.
In Figure 5, the output of the signal reconstruction stage is indicated.

4. Results and Discussion

4.1. ECG Database Used as Test Bench

The proposed method is evaluated using the MIT-BIH Noise Stress Test Database [24], which includes twelve half-hour ECG recordings and three half-hour recordings of noise typical in ambulatory ECG recordings.
The ECG recordings were created by adding calibrated amounts of noise to clean ECG recordings from the MIT-BIH Arrhythmia Database. Baseline wander, electrode motion artifact and muscle noise are the type of noises considered in MIT-BIH. In order to evaluate the worst situation, only the files provided directly from the database (files 118 and 119) are used in the test. They are only affected by noise of EM type (electrode motion artifact noise).
Noise was added beginning after the first 5 minutes of each record, during two-minute segments, alternating with two-minute clean segments. Instead, the three noise records were assembled from the recordings by selecting intervals that contained an electrode motion artifact, which is the most difficult to handle because it can mimic the appearance of ectopic beats.
With the aim of comparing the performance of the implemented method with the results of some significant R peak detectors indicated in literature, only the first channel of each ECG record is processed. Moreover, a two-fold cross-validation procedure has been used: File 118 was used to choose the best parameters and file 119 for testing the system.

4.2. Performance Evaluation and Results

For the performance evaluation of the method, sensitivity, positive prediction and detection error rate are taken into account. The sensitivity (Se) is defined as the probability of detecting a R point when a R point actually exists; the positive prediction (+P) represents the probability of detecting a R point among the detected ECG peaks. They are computed by adopting the following expressions:
Sensitivity :   S e = T P T P + F N
Positive   Prediction :   P + = T P T P + F P
Detection   error   rate :   D E R = F P + F N T P + F N
where TP (the number of true positives) is the number of correct identifications of R points present in the signal under test; FN (the number of false negatives) is the number of R points present in the signal that the algorithm is not able to detect; FP (the number of false positive) is the number of R points detected by the algorithm that are not actually in the signal.
Different signal to noise ratio (SNR) levels for the same ECG record are analyzed; in particular values ranging from 24 dB to 0 dB are tested.
A tolerance window of 150 ms, centered at the reference annotation, has been used in order to classify peaks detected by the procedure.
In Figure 6 and Figure 7, the system performance related to different SNR value of the same ECG record is shown.
An analysis of performance shows that when increasing the noise contribution, FN remains almost constant while a small growth in FP is observed, which makes the performance worse. It is evident that the Se parameter is almost constant, depending on FN parameter, therefore it is rather unaffected by noise corrupting the ECG signal. The obtained performance confirms that the algorithm is immune to noise up to SNR values equal to 6 dB. In fact, for SNR = 6 dB, results with minimum interferences from noise and artifacts have been obtained, since Se e +P achieves values of 98.13% and 96.91%, respectively. More specifically, during the test phase, 1987 beats have been analyzed, obtaining TP = 1950, FN = 37 and FP = 62.
For SNR values lower than 6 dB, +P and Se are dependent on the amount of noise signal, decreasing as FP and FN grow. By an assessment of the results achieved for SNR values equal to 0 dB, it is noted that FN and FP raise by almost identical proportions if compared with the corresponding values obtained with a SNR equal to 6 dB. In particular, Se and +P reach values of 78.98 and 75.25, respectively.

4.3. Performance Assessment and Comparisons

In order to compare the obtained performance with some procedure results available in literature, the same test procedure indicated by Vollmer in [25] has been adopted. In [25], Vollmer has analyzed the algorithms of Pangerc et al. [26], Antink et al. [27], de Cooman et al. [28] and Vollmer [29] for the evaluation of their robustness against noise using the MIT-BIH Noise Stress Test Database as a test bench. The aforementioned procedures were the top-ranked algorithms during the PhysioNet/Computing in Cardiology Challenge in 2014 [30].
Table 1 shows a comparative study among the performance of the procedure detailed in this paper and the results of the selected algorithms as reported in [25]. The average SE and +P values of noisy records (118 and 119) are listed for SNRs of 6 dB and 0 dB.
The procedure presented in this paper shows good results compared to other methods indicated in literature. More specifically, it achieves the most effective +P value compared to all the analyzed algorithms and a quite satisfactory Se value.
In comparison with a noise resistant procedure previously published by the authors [23], the method implemented in this paper reaches better performance and has lower computational complexity, avoiding signal reconstruction in the time domain.

5. Conclusions

Bioelectrical signals are very useful in detecting pathological conditions and in controlling the effectiveness of drugged treatments. In particular, ECG signal processing is an important diagnostic tool for the monitoring of heart functional status. The proposed CADe system adopts the Hilbert transform combined with a threshold technique and the wavelet transform to localize R peaks, even if noisy signals and peaked T and P waves are present.
The noise robustness of the implemented method is quantified adopting the MIT-BIH Noise Stress Database as a test bench. Experimental results show the method’s validity. In fact, results with minimum interferences from noise and artifacts have been obtained up to SNRs equal to 6 dB. For SNR values lower than 6 dB, the method performance gets worse, since an increase of FP and FN is observed. The method is suitable to be used in parallel architecture for real-time analysis applications. The method’s weakness is related to the sampling rate and the resolution of the ECG records: In fact, the method has poor performance as soon as the ECG sampling rate and resolution decrease, compared to the parameters of the MIT-BIH database.

Author Contributions

Conceptualization, M.D., M.R.; Data curation, M.D. and M.R.; Formal analysis, M.D. and M.R.; Investigation, M.D., M.R. and A.L.; Methodology, M.D. and M.R.; Project administration, M.R.; Resources, M.D. and A.L.; Software, M.D. and A.L.; Supervision, M.D. and M.R.; Validation, M.D. and M.R.; Writing—original draft, M.D. and M.R.

Funding

This research received no external funding.

Acknowledgments

The work is carried out in the project “Biomedical digital signal processing” conducted by INNOIT s.r.l., whose scientific responsible is Maria Rizzi.

Conflicts of Interest

The authors declare no conflict of interest.

References

  1. Pentel, T. ANS and heart rate variability in normal sleep and sleep disorders. Sleep Med. 2007, 8, 44–45. [Google Scholar]
  2. Agrawal, A.; Gawali, D.H. FPGA-based peak detection ECG signal using histogram approach. In Proceedings of the International Conference on Recent Innovations in Signal Processing and Embedded Systems (RISE 2017), Bhopal Madhya Pradesh, India, 27–29 October 2017. [Google Scholar]
  3. Pan, J.; Tompking, W.J. A real-time QRS detection algorithm. IEEE Trans. Biomed. Eng. 1985, 32, 230–236. [Google Scholar] [CrossRef] [PubMed]
  4. Hamilton, P.S.; Tompkins, W.J. Quantitative investigation of QRS detection rules using MIT/BIH arrhythmia database. IEEE Trans. Biomed. Eng. 1986, 12, 1157–1165. [Google Scholar] [CrossRef]
  5. He, R.; Wang, K.; Li, Q.; Yuan, Y.; Zhao, N.; Liu, Y.; Zhang, H. A novel method for the detection of R-peaks in ECG based on K-Nearest Neighbors and Particle Swarm Optimization. EURASIP J. Adv. Signal Process. 2017, 2017. [Google Scholar] [CrossRef] [Green Version]
  6. Benitez, D.; Gaydecki, P.A.; Zaidi, A.; Fitzpatrick, A.P. The use of the Hilbert transform in ECG signal analysis. Comput. Biol. Med. 2001, 31, 399–406. [Google Scholar] [CrossRef]
  7. Qin, Q.; Li, J.; Yue, Y.; Liu, C. An Adaptive and Time-Efficient ECG R-Peak Detection Algorithm. J. Healthc. Eng. 2017, 2017. [Google Scholar] [CrossRef] [PubMed]
  8. Pang, D.; Igasaki, T. A Combined Syntactical and Statistical Approach for R Peak Detection in Real-Time Long-Term Heart Rate Variability Analysis. Algorithms 2018, 11, 83. [Google Scholar] [CrossRef]
  9. Kathirvel, P.; Sabarimai Manikandan, M.; Prasanna, S.R.M.; Soman, K.P. An efficient R-peak detection based on new nonlinear transformation and first-order Gaussian differentiator. Cardiovasc. Eng. Technol. 2011, 2, 408–425. [Google Scholar] [CrossRef]
  10. Chanwimalueang, T.; von Rosenberg, W.; Mandic, D.P. Enabling R-peak Detection in Wearable ECG: Combining Matched Filtering and Hilbert Transform. In Proceedings of the 2015 IEEE International Conference on Digital Signal Processing (DSP), Singapore, 21–24 July 2015. [Google Scholar] [CrossRef]
  11. Sabherwal, P.; Agrawal, M.; Singh, L. Automatic detection of the R peaks in single-lead ECG signal. Circuits Syst. Signal Process. 2017, 36, 4637–4652. [Google Scholar] [CrossRef]
  12. Khriji, L.; Al-Busaidi, A.M. New Adaptive Thresholding-based ECG R-peak Detection Technique. In Proceedings of the 2018 IEEE 4th Middle East Conference on Biomedical Engineering (MECBME), Gammarth, Tunisia, 28–30 March 2018; pp. 147–152. [Google Scholar]
  13. Falconi, J.A.; Osman, H.A.; El Saddik, A. R-Peak Detection Algorithm Based on Differentiation. In Proceedings of the 2015 IEEE 9th International Symposium on Intelligent Signal Processing (WISP), Siena, Italy, 15–17 May 2015. [Google Scholar] [CrossRef]
  14. Kaur, H.; Rajni, R. Electrocardiogram signal analysis for R-peak detection and denoising with hybrid linearization and principal component analysis. Turk. J. Electr. Eng. Comput. Sci. 2017, 25, 2163–2175. [Google Scholar] [CrossRef]
  15. Dev Sharma, L.; Sunkaria, R.K. A robust QRS detection using novel pre-processing techniques and kurtosis based enhanced efficiency. Measurement 2016, 87, 194–204. [Google Scholar] [CrossRef]
  16. Rakshit, M.; Panigrahy, D.; Sahu, P.K. An improved method for R-peak detection by using Shannon energy envelope. Sadhana 2016, 41, 469–477. [Google Scholar] [CrossRef]
  17. Clifford, G.D.; Azuaje, F.; Mesharry, P. ECG statistics, noise artifacts and missing data. In Advanced Methods and Tools for ECG Data Analysis; Artech. House Inc.: London, UK, 2006. [Google Scholar]
  18. Gaceck, A.; Pedryez, W. (Eds.) ECG Signal Processing, Classification and Interpretation: A Comprehensive Framework of Computational Intelligence; Springer: Berlin, Germany, 2011. [Google Scholar]
  19. Gupta, P.; Sharma, K.K.; Joshi, D. Baseline wander removal of electrocardiogram signals using multivariate empirical mode decomposition. Healthc. Technol. Lett. 2015, 2, 164–166. [Google Scholar] [CrossRef] [PubMed] [Green Version]
  20. Kschischang, F.R. The Hilbert Transform. Available online: http://www.comm.utoronto.ca/frank/notes/hilbert.pdf (accessed on 19 January 2019).
  21. Rizzi, M.; D’Aloia, M.; Castagnolo, B. Computer aided detection of microcalcifications in digital mammograms adopting a wavelet decomposition. Integr. Comput.-Aided Eng. 2009, 16, 91–103. [Google Scholar] [CrossRef]
  22. Wilson, J.D.; Govindan, R.B.; Hatton, J.O.; Lowery, C.L.; Preissl, H. Integrated approach for fetal QRS detection. IEEE Trans. Biomed. Eng. 2008, 55, 2190–2197. [Google Scholar] [CrossRef] [PubMed]
  23. Shensa, M.J. The discrete wavelet transform: Wedding the a’ trous and Mallat algorithms. IEEE Trans. Signal Process. 1992, 40, 2464–2482. [Google Scholar] [CrossRef]
  24. MIT-BIH Noise Stress Test Database. Available online: https://physionet.org/physiobank/database/nstdb/ (accessed on 19 January 2019).
  25. Vollmer, M. Noise resistance of several top-scored heart beat detectors. In Proceedings of the 2017 Computing in Cardiology (CinC), Rennes, France, 24–27 September 2017. [Google Scholar]
  26. Pangerc, U.; Jager, F. Robust detection of heart beats in multimodal records using slope and peak sensitive band-pass filters. Physiolog. Meas. 2015, 36. [Google Scholar] [CrossRef] [PubMed]
  27. Antink, C.H.; Brüser, C.; Leonhardt, S. Detection of heart beats in multimodal data: A robust beat-to-beat interval estimation approach. Physiolog. Meas. 2015, 36. [Google Scholar] [CrossRef]
  28. De Cooman, T.; Goovaerts, G.; Varon, C.; Widjaja, D.; Willemen, T.; Van Huffel, S. Heart beat detection in multimodal data using automatic relevant signal detection. Physiolog. Meas. 2015, 36. [Google Scholar] [CrossRef]
  29. Vollmer, M. Robust detection of heart beats using dynamic thresholds and moving windows. Comput. Cardiol. 2014, 41, 569–572. Available online: http://cinc.org/archives/2014/pdf/0569.pdf (accessed on 19 January 2019).
  30. Moody, G.; Moody, B.; Silva, I. Robust detection of heart beats in multimodal data: The PhysioNet/Computing in Cardiology Challenge 2014. Comput. Cardiol. 2014, 41, 549–552. [Google Scholar]
Figure 1. Block diagram of the implemented method.
Information 10 00035 g001
Figure 2. Details of processed signal at stage 1 and 2.
Information 10 00035 g002
Figure 3. Overview of the signal at the output of stage 2 compared to the original signal.
Information 10 00035 g003
Figure 4. Decomposition of Hilbert signal over six dyadic scales.
Information 10 00035 g004
Figure 5. Comparison between the output after the Hilbert transform stage and the reconstructed signal, adopting the implemented method.
Information 10 00035 g005
Figure 6. Algorithm behavior as a function of different signal to noise ratio (SNR) values.
Information 10 00035 g006
Figure 7. Detection error rate achieved as a function of different SNR values.
Information 10 00035 g007
Table 1. Se and +P values obtained using the MIT-BIH Noise Stress Test Database, with a SNR = 6 dB and 0 dB.
SNR = 6 dBSNR = 0 dB
MethodSe+PSe+P
Pangerc U. et al.99.9195.9183.9768.92
Antink C.H. et al.84.8976.4072.2066.37
De Cooman T. et al.99.4773.3096.5159.36
Vollmer M.98.5096.7377.1074.91
This study98.1396.9178.9875.25

