Article

Precision of a Streamlined Life Cycle Assessment Approach Used in Eco-Rating of Mobile Phones

by
Anders S. G. Andrae
1,* and
Mikko Samuli Vaija
2
1
Huawei Technologies Sweden AB, Skalholtsgatan 9, 16494 Kista, Sweden
2
Orange Labs, 4 Rue du Clos Courtel, 35510 Cesson-Sevigné, France
*
Author to whom correspondence should be addressed.
Challenges 2017, 8(2), 21; https://doi.org/10.3390/challe8020021
Submission received: 15 June 2017 / Revised: 14 August 2017 / Accepted: 15 August 2017 / Published: 17 August 2017

Abstract

:
There is a lack of prescribed databases and approaches in place for performing comparable Life Cycle Assessments (LCAs) of smartphones and other electronic devices in a coherent manner. Hence there is a need within certain eco-rating initiatives for simplified, yet still precise enough, approaches that are expert independent. Here, five independently published Full LCAs (FLCA) of smartphones—and a metal content declaration of a tablet—are analyzed and compared with the simplified LCA method (Open Eco Rating LCA, OLCA) used by the open eco rating (OER) sustainability assessment. OLCA is described in detail. The comparisons use the same characterization factors that are used for climate change and abiotic resource depletion (ARD) midpoint impact categories. The tablet is only analyzed for the ARD indicator (ARDI). The results show that the difference between the FLCAs and the OLCA is up to 20% for the Global Warming Potential indicator (GWPI). The difference is explained by significantly different emission intensities used in FLCAs and OLCA, especially for integrated circuit and screen production. The life cycle use of metals relevant for ARDI is identified in one of the FLCAs of mobile phones, and used in OLCA and compared with the corresponding FLCA ARDI score. The total FLCA ARDI score is 67% (2.0 vs. 1.2 grams Sb—eq.) and 32% (4.98 vs. 3.76 grams Sb—eq.) higher than OLCA ARDI for the mobile phone and the tablet, respectively. The reason is that OLCA only captures a few of the most relevant metals (gold, silver, tin, indium, and tantalum) for the ARDI. However, cobalt—and to some degree copper and lithium—are significant gaps in the OLCA. The conclusion is that OLCA is an efficient and fair approach for LCAs that are focused on the GWPI of smartphones as the divergence to FLCA can easily be explained. However, the circular footprint formulae, renewable electricity options, and ARD characterization indices for cobalt, copper and lithium should be added to OLCA for further precision. The next step is to compare the Product Environmental Footprint (PEF) FLCA method with OLCA for GWPI and ARDI evaluations of new smartphones. Moreover, the effect of adding more midpoint or single score indicators could be tested in OLCA.

1. Introduction

Information and Communication Technology and ‘Entertainment and Media’ are two of the fastest growing industries and a future is foreseen where almost all electronic devices are connected [1,2]. The annually shipped number of mobile devices can be counted in billions. As such smartphone sales are currently around 1500 million units and tablets around 350 million [1]. Smartphones usually have a relatively short operating lifetime of 2 to 4 years which negatively influences eco-environmental impacts such as abiotic resource depletion (ARD) and climate change (CC) [3].
Life Cycle Assessment (LCA) is a systematic analytical method and model by which eco-environmental effects for product systems can be estimated with a precision of around an order of magnitude [4]. The applicability of LCA for electronics has been questioned due to numerous constraints like the complexity of the manufacturing chain and short innovation cycles, making data collection difficult [5]. However, several attempts to address the issues have been made for machine tools and laptops [6,7,8,9]. The overarching challenge addressed here is how to perform LCAs of millions of different products—in this case mobile phones—using streamlined approaches with good precision. There is an increasing global interest in developing and using Environmental Product Declarations (EPDs) to communicate life cycle based environmental performance of products [10]. LCA is a cornerstone of any EPD. The common wisdom is that simplified LCA approaches do not have enough precision compared to Full LCA (FLCA) when applied to the rather complex life cycle of smartphones and tablets. The Product Environmental Footprint (PEF) method is expected to be the state-of-the-art for FLCA [11]. PEF has very strict data quality requirements as product comparisons need good quality data. Ojala et al. [12] argued that PEF Category Rules (PEFCR) developers should devote time to finding the most appropriate methodological choices.

1.1. Review of Prior Knowledge Observations

FLCA studies of smartphones are common [4,13,14,15,16] so the major hot spots—e.g., for the Global Warming Potential indicator (GWPI) are well known as: integrated circuit (IC) production, screen production, use, and distribution. Depending on the midpoint indicator, the ARD indicator (ARDI) scores for mobile phones, tablets etc. is significantly influenced by indium if the products contain more than 1 mg of this metal [17].
Studies comparing FLCA with simplified LCA have been published [18,19,20,21,22], showing high usability of the streamlined approaches. Teehan and Kandlikar [23] developed a parameterized formula for GWPI of production of electronics based on FLCAs. The formula is based on the masses of main parts such as battery, printed circuit board assembly (PCBA), and screen. It is uncertain whether this model can reflect the characteristics of quickly developing smartphone designs well enough, or if more complex forms of simplified LCA models are called for.
Further, Moberg et al. compared an FLCA for one mobile phone with five different simplification strategies for streamlined LCA of the same phone [24]. They recommended that simplified LCAs of mobile phones should focus the data collection on energy use in production and use, raw material acquisition of specific metals, air transport, and key components such as ICs [24].
Andrae and Vaija attempted to quantify the difference between two FLCA approaches for the same smartphone [4]. They also mentioned that a previous version of eco-rating LCA (Section 15.3.1 in [25]) produced a very similar GWPI score as the FLCA by Vaija for the smartphone at hand. However, recent FLCAs of smartphones are not comparable to older versions of eco-rating LCA [25] because they use different GWPI data for several unit processes—e.g., screen production and use—than the present eco-rating LCA, discussed in Section 1.2.
Andrae presented a short review of 14 LCA tools for consumer electronics [26]. He concluded that the previous eco-rating LCA methods are fast, have a relatively high precision for GWPIs of mobile phones, give comparable results, give a specific result for each mobile phone, and they could be improved to mimic product category rules (PCR). Andrae claimed that eco-rating LCA has a high precision for GWPI scores compared with FLCAs [26].
The International Telecommunication Union (ITU) published a baseline assessment framework and defined a minimum set of criteria to be considered when assessing the environmental performance of mobile phones [27]. Especially Annex V in the ITU report [27] discusses upstream life cycle based metrics of relevance for the present research.

1.2. Open Eco Rating LCA

Open Eco Rating (OER) is a recent rating of sustainability credentials for mobile phones [28] aligned with the ITU Recommendation on eco-rating program for mobile phones [27]. Product environmental impact is one important part of OER and a simplified LCA approach (OLCA) is used for the GWPI and ARDI calculations. The OLCA model equations are based on a large number of FLCAs performed by Orange since 2010. These LCAs were either carried out on entire products (in order to identify the key sub-assemblies) or on specific sub-assemblies such as cameras or PCBAs. The reasons for limiting the OLCA to include GWPI and ARDI are communication friendliness towards consumers and to some degree data availability. As the main purpose of OER and OLCA is customer information, commonly known indicators are considered appropriate. In this context, the French Environment and Energy Management Agency (ADEME) set up a web platform, Base IMPACTS® [29], being the official database of the French program for the environmental labeling of consumer goods. For mobile phones GWPI and ARDI were selected as they were deemed to be the most relevant, reliable and implementable by companies.
OLCA uses the midpoint indicators for CC and ARD as prescribed by the International Life Data System 2011 Midpoint+ version 1.08 (ILCD) [30]. The similarities between OLCA and the SENSE tool for the food industry are obvious as SENSE is “a web-based tool which allows the environmental impact calculation for a food product in a simplified way” [31].
OLCA is similarly intended to give a very good indication of the FLCA GWPI and ARDI scores of mobile phones. Further it is judged that tablets could also be estimated with OLCA after some development which reflects tablet product characteristics.
OER and OLCA are not analyzed much in the literature however Ercan et al. [13] mentioned that there is an increasing interest in eco-rating as a way to provide product related sustainability information to customers. Andrae and Vaija [4] suggested that eco-rating LCA methods [25] show similar results as further simplified methods. Andrae et al. [3] explained how eco-rating is linked to eco-design and argued that OLCA facilitates a balance between improved material efficiency and linearly increasing GWPI scores.
The most important product metrics in eco-rating LCA were defined as a result of FLCAs [4] and therefore the GWPI scores obtained by OLCA are likely to have a high precision. In this research, the precision will be investigated quantitatively.
As product category rules (≈simplified LCA) is a trend in eco-design product policy [32,33], the findings from this research are important for decision-making on policy for smartphones and tablets.
In summary, no study is found that compares specific FLCAs with OLCA presenting details of GWPI and ARDI.

1.3. Objectives

This study researches to which degree those FLCA approaches with higher resolution and flexibility—using state-of-the-art LCA tools, ISO and ETSI standardized frameworks, primary LCI data and state-of-the art secondary LCI databases such as Ecoinvent and GaBi—differ from a rather simplified approach based on product metrics OLCA.
The difference is studied for five smartphones on the GWPI and for a tablet and one of the smartphones on the ARDI. The tablet has been included to understand development potentials for the OLCA.
It is expected that FLCA will score significantly higher than OLCA, especially on the ARDI of the tablet and one of the smartphones.
The overall question of this research is: How well do GWPI and ARDI results calculated with OLCA, based on metrics for products—here specifically for smartphones and a tablet—coincide with published GWPI and ARDI results based on FLCA for the same products?
An overall objective is also to show many details on how the OLCA model can be applied and developed further.

1.4. Hypotheses

Hypothesis 1 (H1).
The FLCA scores are >50% higher than OLCA scores for Phones A–E for GWPI.
Hypothesis 2 (H2).
The FLCA score is >50% higher than the OLCA score for Phone A for ARDI.
Hypothesis 3 (H3).
The ARDI score based on metal contents of the tablet is >50% higher than the OLCA ARDI.
A comprehensive review of prior knowledge is given in Section 1. Full disclosure of methods, data and other relevant information is given in Section 2 as well as the validity and reliability of the data used, and the validity of the methods used. The conclusions provided in Section 5 are consistent with the evidence.

2. Materials and Methods—Full LCAs Used and OLCA

In this section the methods, data and other relevant information—as well as the validity and reliability of the data and methods used—are described.
FLCA case studies of mobile phones are chosen based on publication year, availability of transparent facts useful for OLCA and general credibility. Freely available sources are also used to complement the facts given by the FLCA reports. The chosen FLCAs of Phone A [13], Phone B [14], and Phones C–E [15] from 2016 are expected to use the latest and best possible LCI data and advanced knowledge. The degree to which Phones A–E fulfill the requirements of the strict PEF Guidance for FLCA is not analyzed [11]. Likewise, the current OLCA model is from 2016 and 2017 with the latest knowledge e.g., for screen and camera production GWPI scores—so older FLCAs of mobile phones might not be comparable to the present OLCA.

2.1. Functional Units

The functional units used to study Phones A–E are simplistic and not in line with the PEF Guidance [11]. The functional units are merely stated as “one phone used during three years” [13,14,15] and therefore the absolute values of Phones A–E FLCAs are not comparable. Moreover the calculation rules and use scenario for each LCA study are different. This simplicity however fits a comparison with OLCA very well as OLCA also uses a relatively simplistic use scenario of charging the battery of the mobile phone. OLCA uses two years as default lifetime and therefore two years of the annual kWh consumption (“heavy user scenario” is two years as shown in Table II in [13]) times 0.6 kgCO2—eq./kWh is used for Phone A [13]. Correspondingly 2/3 of GWPI scores for the use stage of Phones B–E [14,15] is used for the FLCAs. Table 1 shows some important characteristics of the FLCAs used compared to the OLCA.

2.2. System Boundaries

The system boundaries for Phones A–E are shown in Table 2 and can be compared with OLCA.

2.3. ARDI Scores for Tablet and OLCA

Although tablets are not intended to be evaluated using OLCA, an attempt is done to test the precision of OLCA on ARDI for a tablet. The ARDI score for the tablet [34], which can be compared to the corresponding OLCA ARDI score, is derived from its metal content. As shown in Equations (1) and (2), this metal content—expressed in kg—is derived by dividing the total scores for each metal in Figure 3a–c in [36] with the characterization factors for ReCiPe (H) metal depletion, CML 2013 baseline and EPS2000, respectively.
Equations (1) and (2) describe the relation between the mass of a metal used by the tablet, total ARDI score and the characterization factor for metals in an ARD midpoint impact category:
m a s s i , j = ( A R D i , t o t a l , j A R D i , f a c t o r , j )
m a s s ¯ j = ( m a s s i , j a = 1 n a + n )
where
  • m a s s i , j = mass of metal j used by tablet based on LCIA method i, [kg j].
  • m a s s ¯ j = average mass of metal j used by tablet based on several LCIA methods i, [kg j].
  • a = number of life cycle impact assessment impact categories which include metal j [36].
  • n = 1,2.
  • i = life cycle impact assessment impact category indicator for ARD (ReCiPe (H) midpoint; Centrum voor Milieuwetenschappen Leiden (CML) CML 2013 baseline; Environmental Priority Strategies (EPS2000) depletion of metal reserves) [36].
  • j = metal type, (e.g., gold, silver).
  • A R D i , t o t a l , j = Total score for i for metal j, [kg Fe—eq.; kg Sb—eq.; Environmental Load Unit (ELU)].
  • A R D i , f a c t o r , j = Characterisation factor for metal j in i, [kg Fe—eq./kg j; kg Sb—eq./kg j; ELU/kg j].
Note that CML 2013 baseline is different to ILCD with respect to ARD characterization factors. There are several complementary impact assessment methods for ARD [37].
For example for gold Equations (3)–(6) give the average mass:
m a s s Re C i P e , A u = ( A R D i , t o t a l , j A R D i , f a c t o r , j ) = ( 3.6 69,900 ) = 5.15 × 10 5
m a s s C M L 2013 , A u = ( 2 × 10 3 52 ) = 3.85 × 10 5
m a s s E P S 2000 , A u = ( 65 1.19 × 10 6 ) = 5.46 × 10 5
m a s s ¯ A u = ( ( 5.15 + 3.85 + 5.46 ) × 10 5 3 ) = 4.82 × 10 5
Table 3 shows the average masses and ILCD ARDI results for the tablet which is compared with the OLCA ARDI result.
As shown in Table 2 tin contributes ≈6% of the total ILCD ARDI score. The OLCA ARDI score that corresponds to 4.98 g Sb—eq. in Table 2 is 3.76 g Sb—eq. based on gold, silver and tin. The other metals—such as cobalt and lithium—are not yet included in the OLCA ARDI.

2.4. ARDI Scores for Phone A with FLCA and OLCA

The ARDI score for Phone A is 0.002 kg Sb—eq. from ≈43% gold, ≈18% cobalt, ≈18% silver and ≈5% lithium and ≈16% others (Figure 4 in [13]). Equation (7) is used to derive the masses:
m a s s i , j = ( S A R D i , t o t a l , j × A R D i , t o t a l , j A R D i , f a c t o r , j )
where
  • S A R D i , t o t a l , j = Share of total score for i for metal j, [kg Sb—eq.].
For example for gold in Phone A, Equation (8) gives the mass:
m a s s A R D I L C D , A u = ( 0.43 × 0.002 36 ) = 2.388 × 10 5
where
  • ARDILCD = life cycle impact assessment impact category for ARD in ILCD.
Hence it can be concluded that 23.88 mg gold, 42.8 mg silver, 14,000 mg cobalt and 7500 mg lithium are used in the life cycle of Phone A. It is important to stress that these values do not refer to the metal content but the metal use in the life cycle. Based on the data given in [13] it is not possible to identify the masses of other metals used such as tin and copper. This leads to an OLCA ARDI score of 1.22 g Sb—eq., i.e., 40% lower than for the FLCA of 2 g Sb—eq. [13]. Compared to FLCA it is clear that the present OLCA has room for improvement of the ARDI precision. If cobalt and lithium were to be included in the OLCA ARDI, the score for Phone A would become 1.68 g eq.—i.e., 16% lower than for the FLCA.
Phone B uses a different indicator for ARD, CML2001 instead of than ILCD. Moreover the report [14] is not complete enough to derive the material contents, preventing a similar exercise as for the tablet in Section 2.3. Therefore the FLCA ARDI cannot be compared to OLCA ARDI for Phone B.

2.5. Product Metrics and Carbon Intensities Used to Compare FLCA and OLCA

Table 4 shows product metrics used to compare OLCA to FLCA. Uncertainty factors (UF) corresponding to one standard deviation in a lognormal distribution are given next to each value where applicable. UFs are based on the uncertainty range for the LCI databases used.
Siarea for Phone B is likely underestimated, however identifying irregularities in the FLCA reports of Phones A–E is not the target for this research.
Table 5 shows CO2—eq. intensities used in FLCA and OLCA.
Phone B comprises different system boundaries for screen and camera production than OLCA.

2.6. Carbon Footprint Modeling in OLCA

This section shows details for two examples (ICs/PCBA parts and Cameras) of the modeling of GWPI intensities in OLCA. The others are found in Supplementary Materials Sections 1, 3, 5–10.

2.6.1. Integrated Circuit and other PCBA Parts Production

Each mobile phone contains hundreds, if not thousands, of electronic parts and it is not possible to consider them all in a simplified LCA model. The first model for PCBA parts implemented by Orange was based on the PCBA mass. This model was precise enough as long as the PCBA designs for the mobile phones were similar. With the introduction of touch-panels the mobile phones were divided into two categories: the phones with a physical keyboard, designed with a large (and thus heavy) PCBA; and second the phones featuring a touch-screen, allowing for a smaller PCBA. In 2010, Orange developed an improved model by separating the electronic parts and the PCB, the latter being assessed according to its technology, area and number of copper layers (see Section 3. Rigid and flexible PCB production in Supplementary Materials).
For the ICs and other PCBA parts, in order to establish a ratio between the precision obtained and the effort needed, a study was carried out for ten printed PCBAs of mobile phones, ranging from a simple feature phone to a high-end smartphone.
For that study ten mobile phone electronics sub-assemblies were disassembled and for each one the following items were assessed:
-
Total surface of silicon dies (Siarea) in ICs. Stacked dies (e.g., in NAND memory) and wafer level chip scale package—WL-CSP also known as flip chips—were also taken into account,
-
Total mass of IC and total IC packaging surface. The different types of packaging—e.g., ball grid array, dual/quad flat no-lead, small outline package—were also considered thanks to specific models available in the databases of the LCA tool Environmental Impact Made Easy (EIME©) [35]. Previous use of EIME has been reported by Ma et al. [41] and Andrae and Vaija [4].
-
Total mass of transistors, diodes, and surface mounted Light Emitting Diodes (LEDs). The different types of packaging—e.g., small outline transistor, small outline diode—were also considered based on specific models available in EIME©.
-
Total mass of passive components, such as resistors, capacitors, inductors, Surface Acoustic Wave (SAW) filters and crystals. The different types of technology (e.g., multilayer ceramic chip capacitors or tantalum capacitors) were also considered based on specific models available in EIME©.
-
Total mass of electro-mechanical components—e.g., microphone, headset jack, Subscriber Identification Module (SIM) card socket, antennas. For these items materials declarations sheets (MDS) were used in order to create cradle-to-gate LCA models combining materials (e.g., polyamide, liquid crystal polymer, stainless steel) and manufacturing processes such as injection molding, deep drawing and extrusion.
-
Total mass of soldering paste. All the soldering dots (for wave soldering) and pads (for reflow soldering) were counted and sorted according to their size—e.g., 0201, 0402, 0603 for Surface Mount Devices (SMD) soldering pads. Documentation from PCBA parts manufacturers was used to assess the quantity of solder paste per pad. The total mass of soldering paste was then assessed by multiplying the number of dots/pads by the quantity of solder paste per dot/pad. Both wave and reflow solder paste were considered as tin-silver-copper (SAC) type.
-
Total surface of surface treatment on printed circuit boards, such as electroless nickel immersion gold (ENIG).
Within this paper these components and processes will be noted as PCBA parts. All these data were then imported to Version 4—database Version 11.0 of EIME© LCA tool [35]. The PEP ecopassport®—PCR 2.1 method [42] was used to obtain environmental impact category results for CC, ARD, water depletion, primary energy depletion and ozone depletion.
The environmental impact indicator results (e.g., kg CO2—eq. for the GWPI for each mobile phone) and key parameters, such as Siarea, total IC mass and total IC packaging surface, were then combined in a statistical analysis software [43] to obtain the correlation factors and regression formulae.
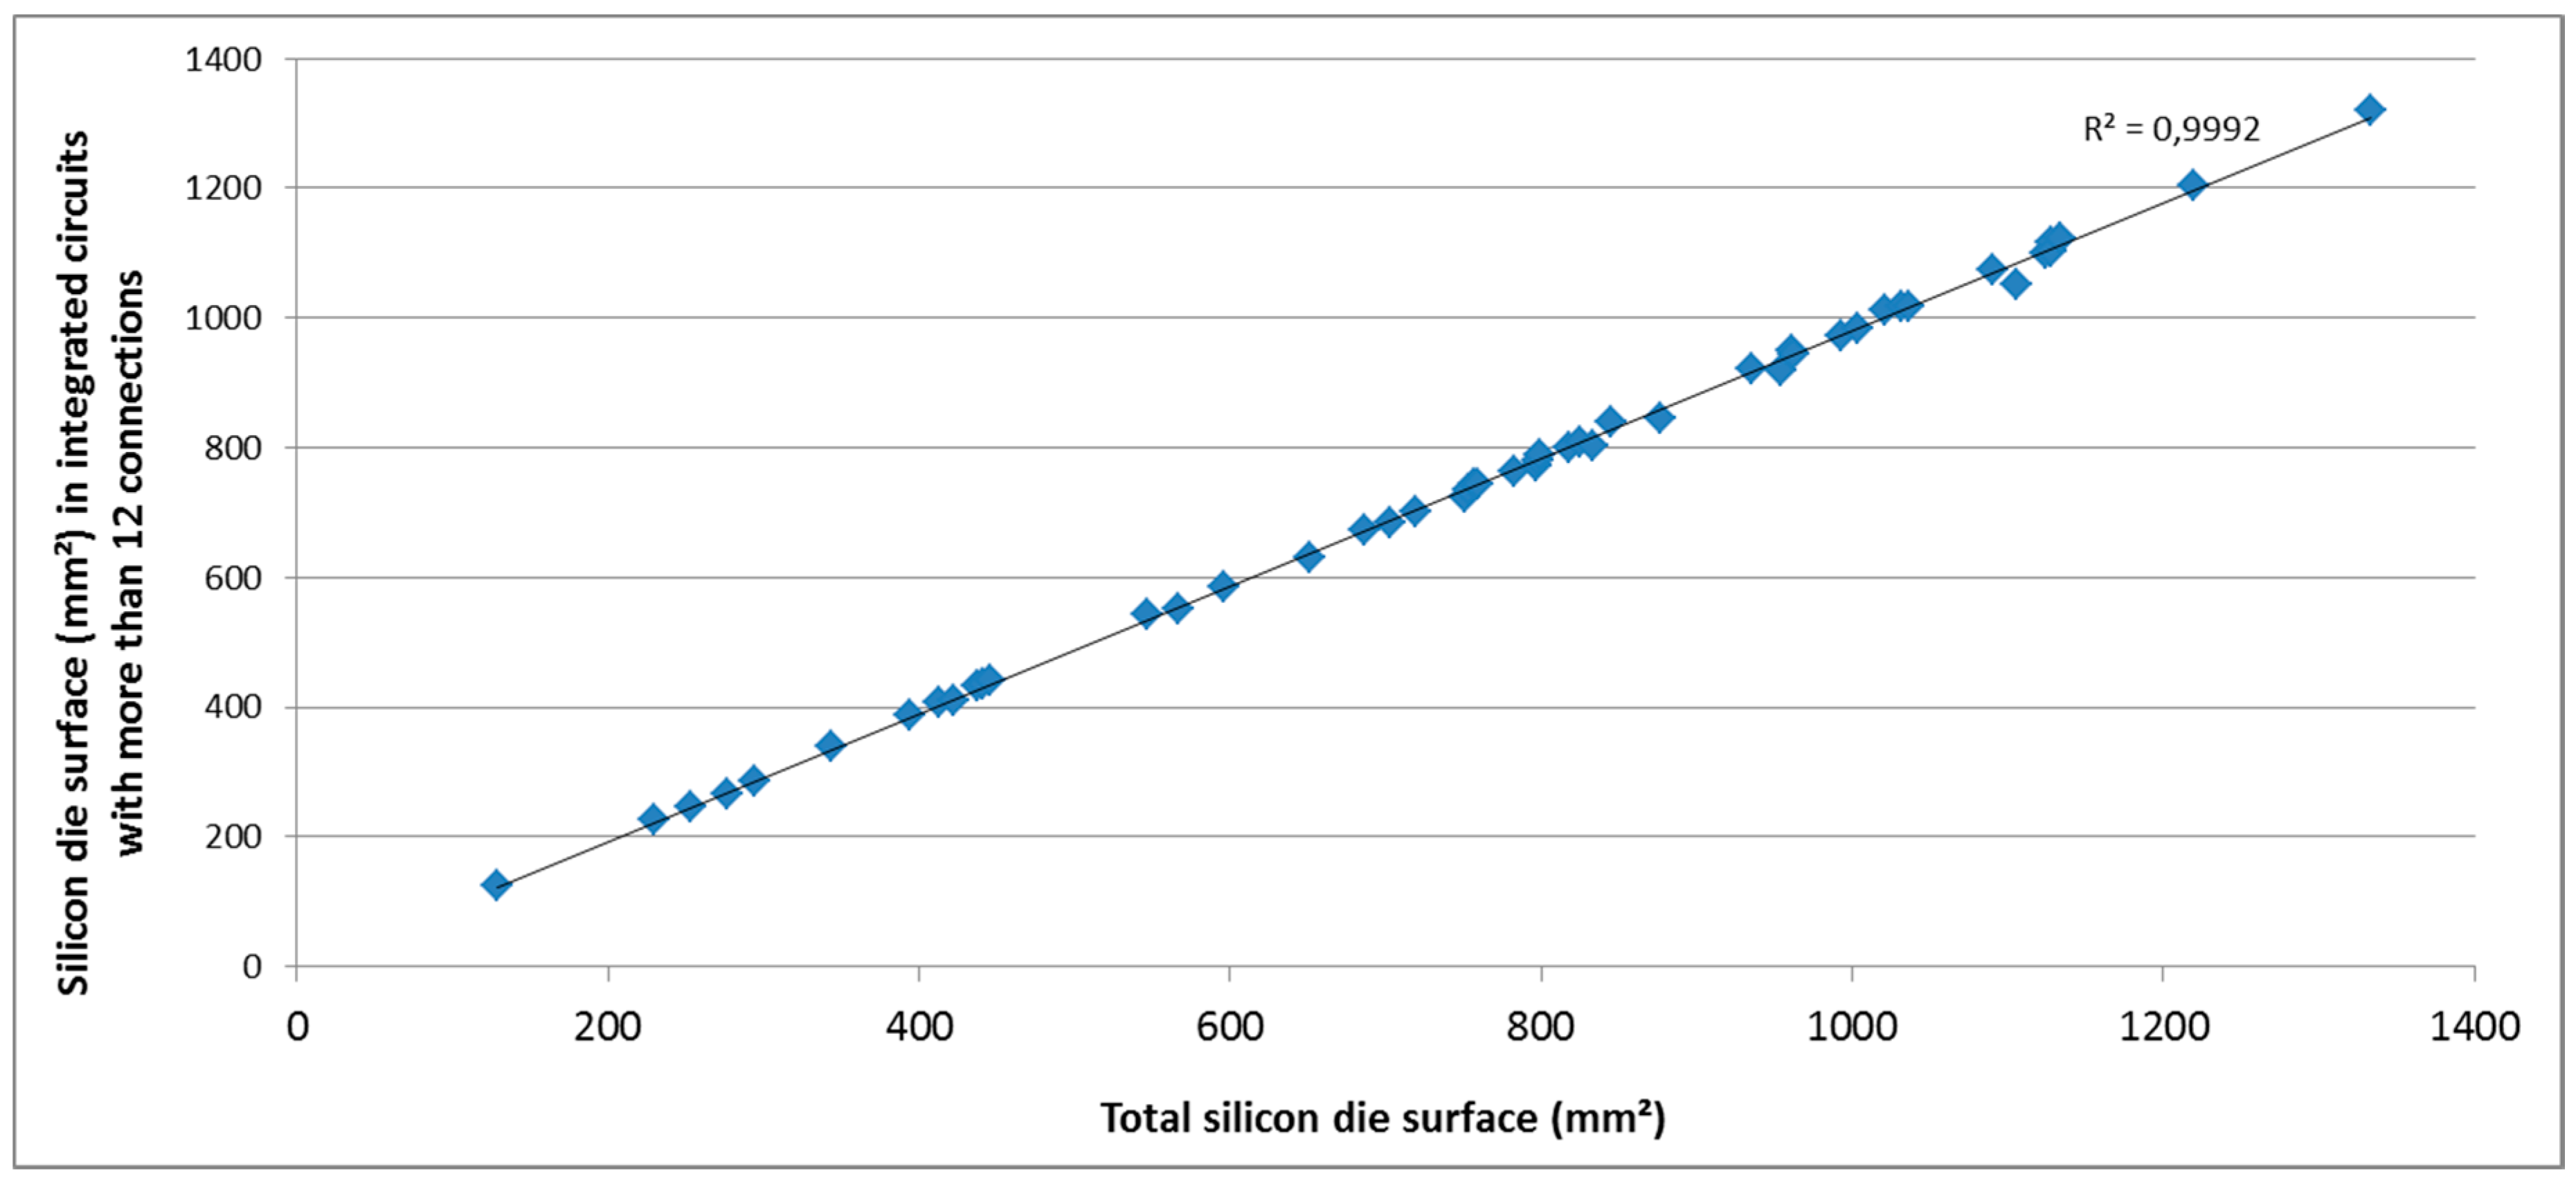
For GWPI the Siarea in ICs was determined to have the highest R2 factor (see Figure 1).
However, as high end mobile phones might contain several dozens of ICs a supplementary assessment was carried out on the Siarea distribution. This extra study was conducted on 50 mobile phones (range for Siarea: 128.19–1333.09 mm2) showing that ICs with more than 12 connections contain more than 95% of the total Siarea (min: 95.02%; mean 98.04%; max 99.37%). The result for the 50 mobile phones is displayed in Figure 2.
By combining Figure 1 and Figure 2 it was possible—by means of linear regression modeling—to assess GWPI for PCBA parts with acceptable precision (the linear regression coefficient, R2, is equal to 0.9991). Moreover, the Siarea is rather straight-forward to obtain from mobile phone manufacturers. For 2010 conditions for the PCBA parts GWPI calculation, Equation (9) was derived.
I , S i a r e a + I , P C B A , o t h = P C B A   G W P   ( k g   C O 2   e q . ) = 0.0137 × S i a r e a   ( m m ² ) + 0.3368
In 2015 this method was updated thanks to a major life cycle inventory update in EIME©. Indeed, in 2010 the only wafer model available in the EIME© database was “Wafer, from silicon; before dies slicing; at plant; FR©”. That model uses a French electricity mix (≈149 g CO2—eq./kWh) for manufacturing of silicon dies, whereas greenhouse gas (GHG) electricity emissions in China are ≈1111 g CO2—eq./kWh [44]. In the 2015 EIME© database three wafer models were available (France (FR), China (CN) and Europe (RER), thus allowing an update of Equation (9).
Data on global wafer capacity for seven countries or geographic areas were gathered [45] (Table 6).
For each country, region or geographical area the grid electricity mix GHG models available were compared with the EIME© wafer country models. For some countries or geographical areas, such as China or Europe, a direct match was possible as the corresponding models were available. For others, like Chinese Taipei, a mix consisting of several wafer models was created in order to close the gap (column “Wafer model selected in EIME© databases” in Table 5).
The result is Equation (10) representing a 2015 global average for GHG emissions emitted by manufacturing of silicon wafers and remaining PCBA parts.
I , S i a r e a + I , P C B A , o t h = P C B A   G W P   ( k g   C O 2   e q . ) = 0.0202 × S i a r e a   ( m m ² ) + 0.142

2.6.2. Camera Production

In 2015 Orange conducted a study on ten mobile phone cameras in order to assess the GWPI scores (I,Cam) and to understand how these sub-assemblies may be added to OLCA. Mobile phone cameras contain sensors that in turn contain ICs and PCBs with well-established GWPI intensities (e.g., I,Siarea and I,PCB,r,area). Moreover, the most advanced mobile phone cameras also feature systems like optical zoom or Optical Image Stabilization (OIS), for which the GWPI intensities are less apparent.
Cameras were selected in order to cover a wide range of cases:
-
rear or front camera type,
-
resolution from 1.2 to 16 Megapixels,
-
directly soldered on the motherboard or featuring a flexible PCB fastened on the motherboard with a “board-to-board” connector,
-
without flash, with LED flash or with Xenon flash,
-
with fixed focus or with autofocus,
-
without zoom, with digital zoom or with optical zoom.
The devices were disassembled in Orange’s laboratory followed by a metal-alloy identification step using an X-ray Fluorescence (XRF) analyzer. Data were also provided by camera manufacturers, especially for back-side illuminated (BSI) complementary metal oxide semiconductor (CMOS) sensors, which are designed with two bonded wafers (one for pixel section and another one for logic circuit). Sample teardown reports available from commercial consultants [46] were also used to identify the different parts and their respective functions—e.g., voice coil motors (VCM)—used for the autofocus feature.
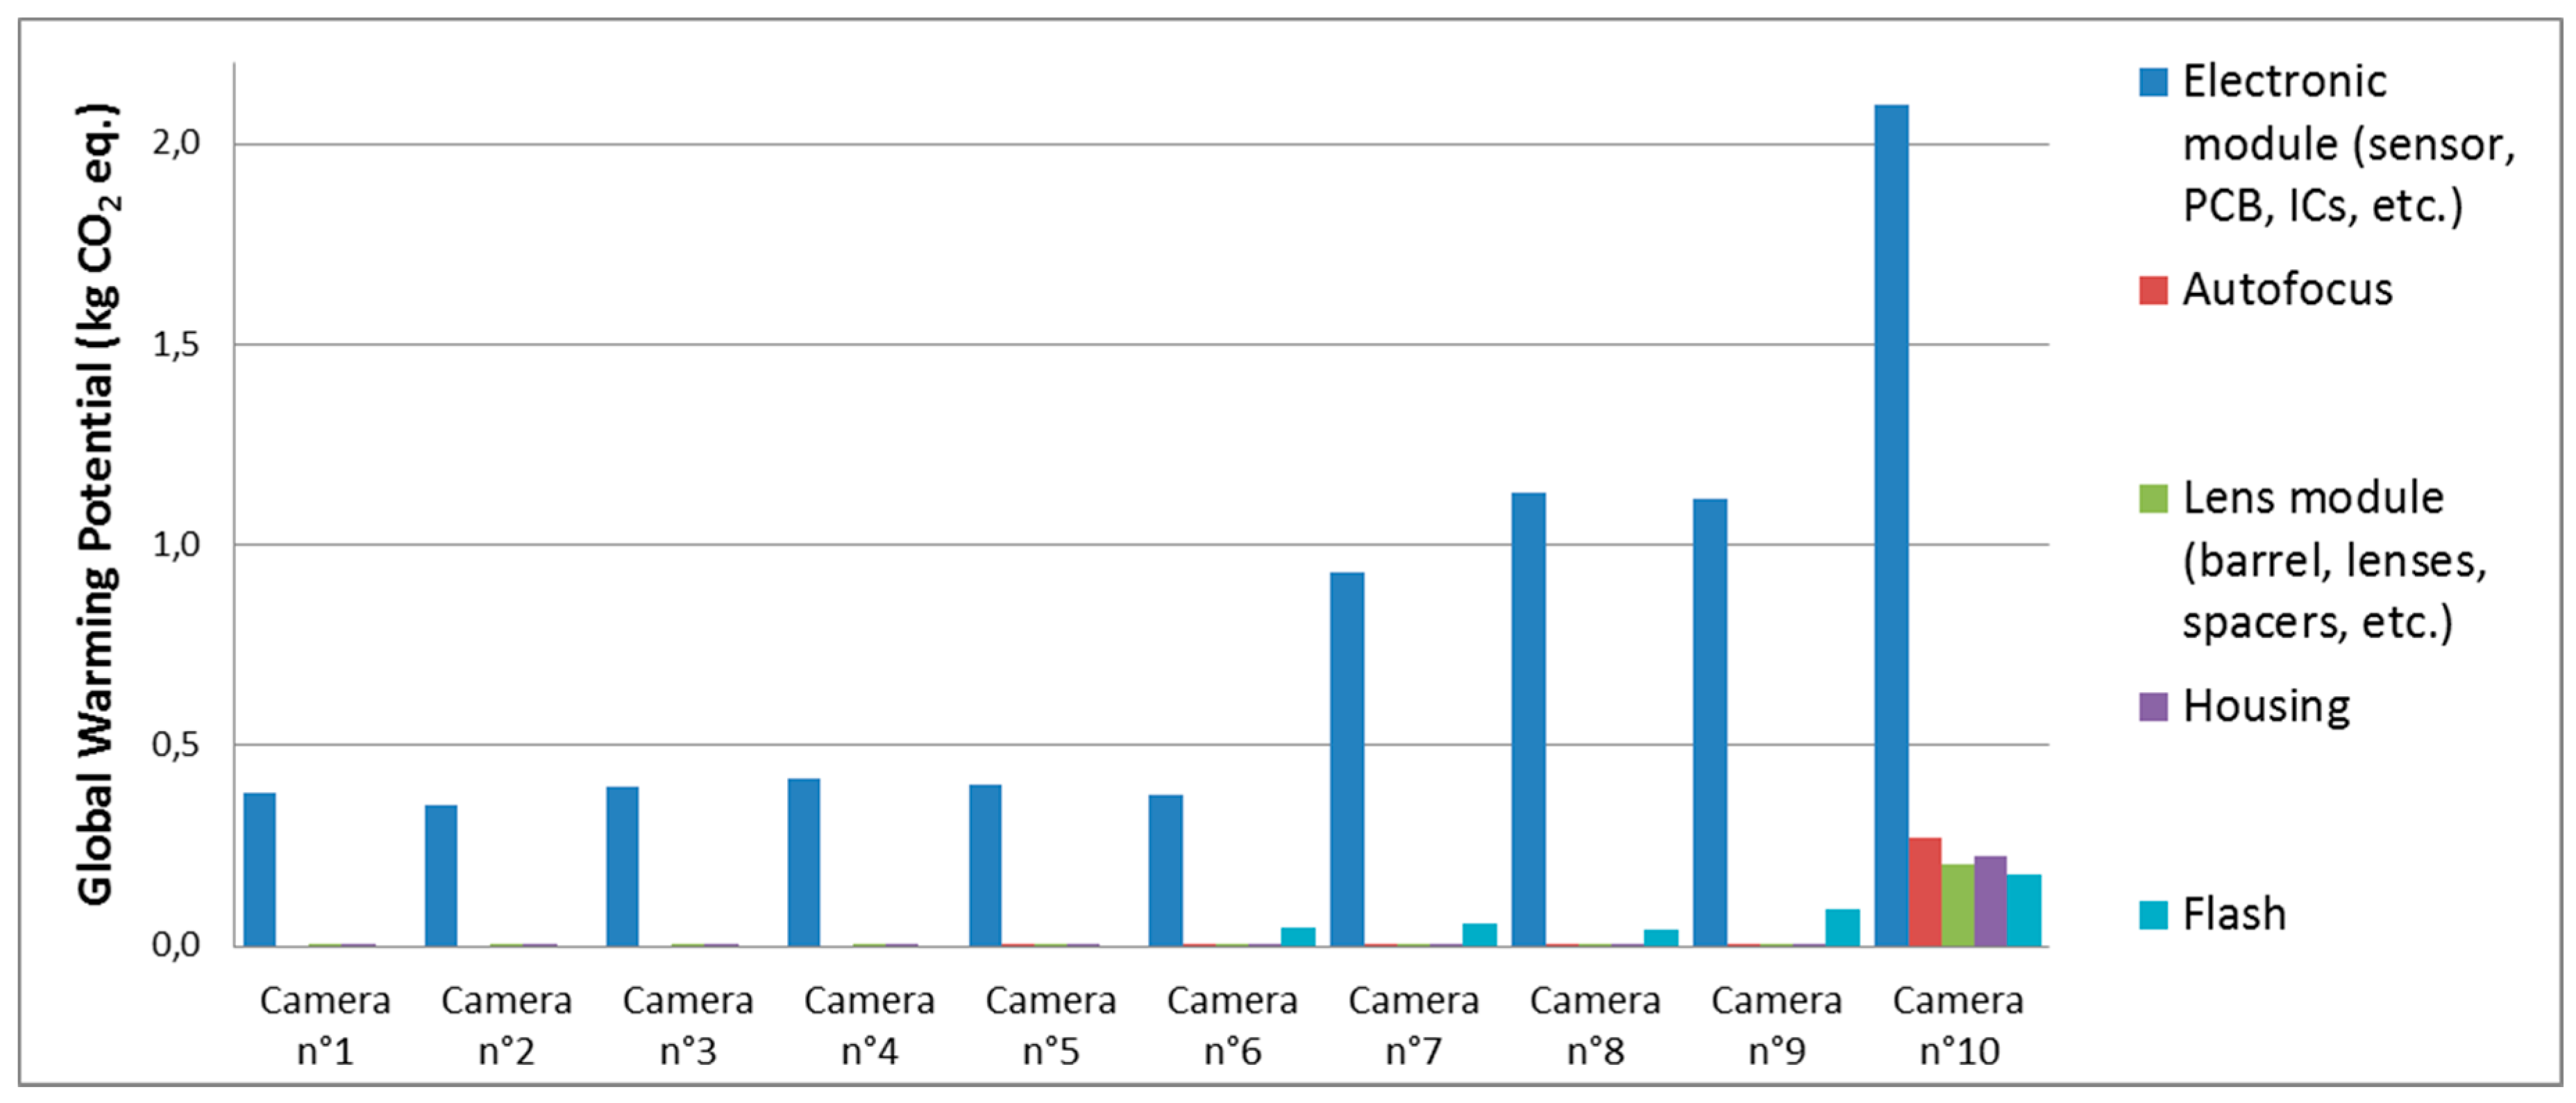
Each camera’s LCI model was modeled in the EIME© 04_2014 database according to its identified materials and manufacturing processes. In order to identify the critical parts for the GWPI the different parts of the camera were grouped into five blocks (electronics, autofocus, lens, housing and flash) (see Figure 3).
For front cameras (models n°1—°2) and simple rear cameras (models n°3—°6), the total GWPI results are quite similar (ranging from ≈0.355 kg CO2—eq. for model n°2 to ≈0.431 kg CO2—eq. for model n°6). These models share similar technology with a BSI CMOS sensor designed with a single wafer, featuring two separate sections (pixel and logic circuit). Camera models n°5 and °6 were the only ones to include an autofocus feature. However, as the autofocus module is mainly based on mechanical parts—e.g., for model n°5, five magnets each weighing 53 mg, 37 mg copper wire and 82 mg Liquid Crystal Polymer-glass fiber reinforced frame—the total GWPI score of this function/feature is not significant. Model n°6 was the only one to include a flash. Even if its design was quite simple (single LED type) the small piece of wafer required for the LED gave rise to ≈0.49 kg CO2—eq.
The second group of cameras (models n°7—°9) included devices designed for high-end smartphones. These devices all feature LED flashes and auto-focus. Models n°8 and n°9 also include an OIS, thus requiring an extra IC acting as a controller.
The design of camera model n°10 is similar of that of a compact digital camera, featuring a large ×10 optical zoom system. It also weighs ≈65.4 g whereas other models weigh from ≈0.23 to ≈1.65 g. Model n°10 also includes a Xenon type flash. Despite all of this extra material the electronic module’s footprint is still the most significant at 70.3% of the total ≈2.98 kg CO2—eq.
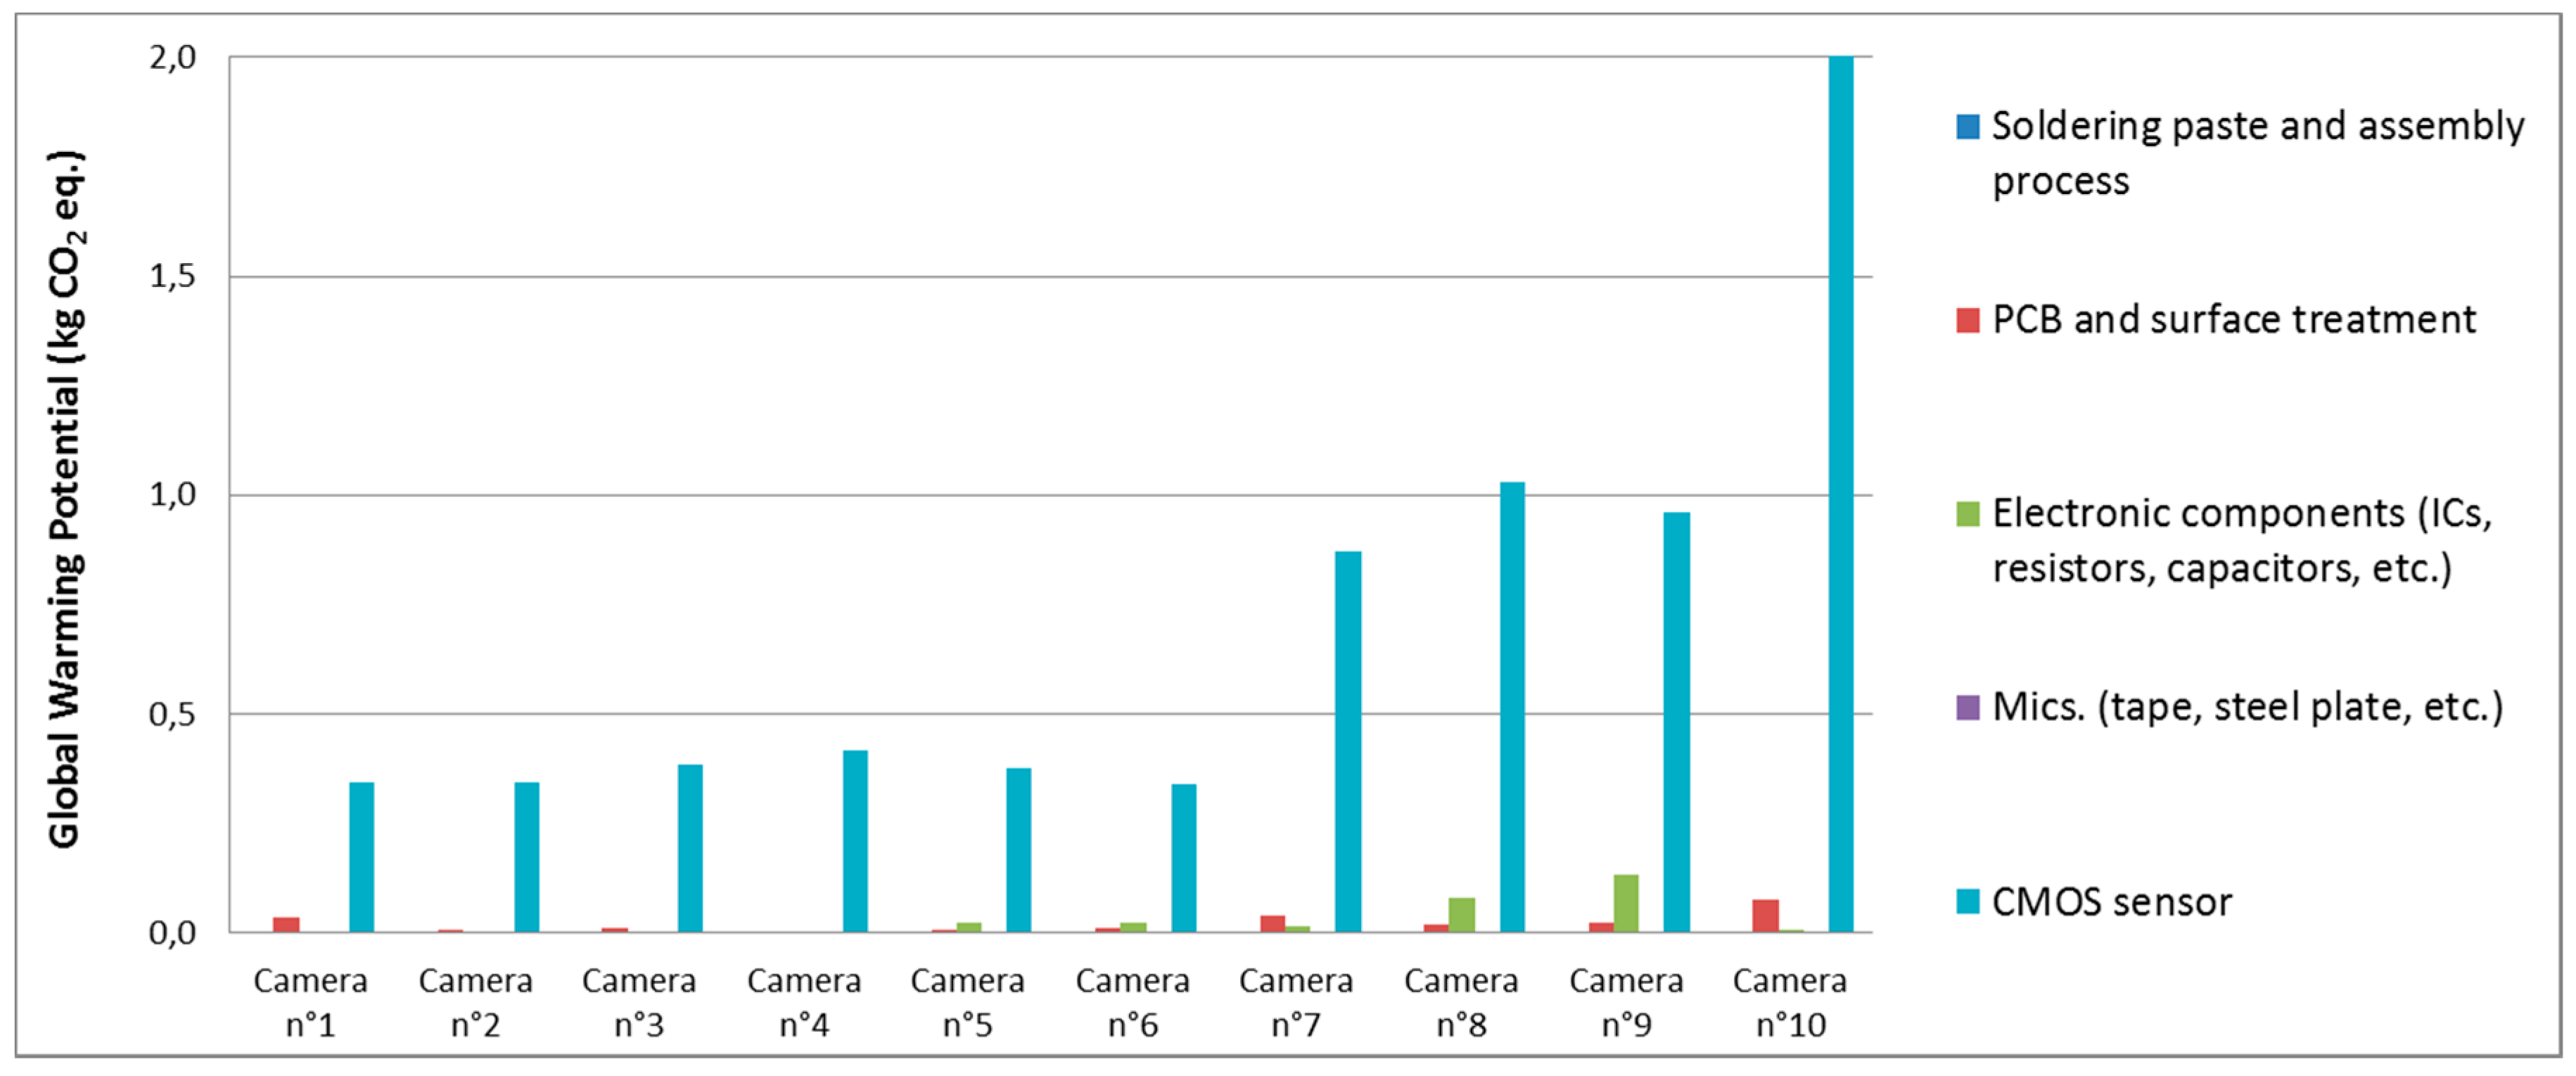
For the smaller camera models (n°1—°9) the electronic modules are even more important (87–99% of the total CO2—eq.). Therefore, in order to identify the main driver, a complementary study was carried out with a focus on the electronic modules. For this assessment the electronic parts were classified into five categories:
-
Soldering paste and assembly process,
-
PCB and surface treatment (solder mask deposition and ENIG finish for example),
-
Electronic parts (including ICs such as OIS Driver, Microelectromechanical systems (MEMS) OIS Gyroscope, Autofocus VCM Driver or Serial Flash Memory),
-
Miscellaneous (including a large variety of small mechanical parts such as tape or steel/plastic reinforcement plates),
-
CMOS sensor.
For each camera’s electronic module the CO2—eq. repartition is shown in Figure 4.
For all the models the conclusion is that the CMOS sensor is the key driver for CO2—eq. emissions. The CMOS sensors account for at least 85.8% of the module’s footprint. Model n°9 includes several ICs such as an OIS Driver, a MEMS OIS Gyroscope, an Autofocus VCM Driver and a Serial Flash Memory.
Eco-rating systems in general—and OER with OLCA in particular—aim to obtain the best CO2—eq. precision per mobile phone for the network operators with minimum data collection effort for the phone manufacturers. Therefore, some simplifications were carried out for the implementation of the camera model:
-
For front cameras (models n°1 and n°2) and simple rear cameras (models n°3—°6 and all featuring a resolution ≤5 Megapixels) a single model was created based on the GWPI scores (average value ~400 g CO2—eq.) of camera models n°1—°6. Indeed, for these camera models the CMOS sensor sizes are of the same order of magnitude (about 24.5 mm2 +/− 10%),
-
For camera models with a compact digital camera design—e.g., featuring a large optical zoom—a single model was created (~3000 g CO2—eq.),
-
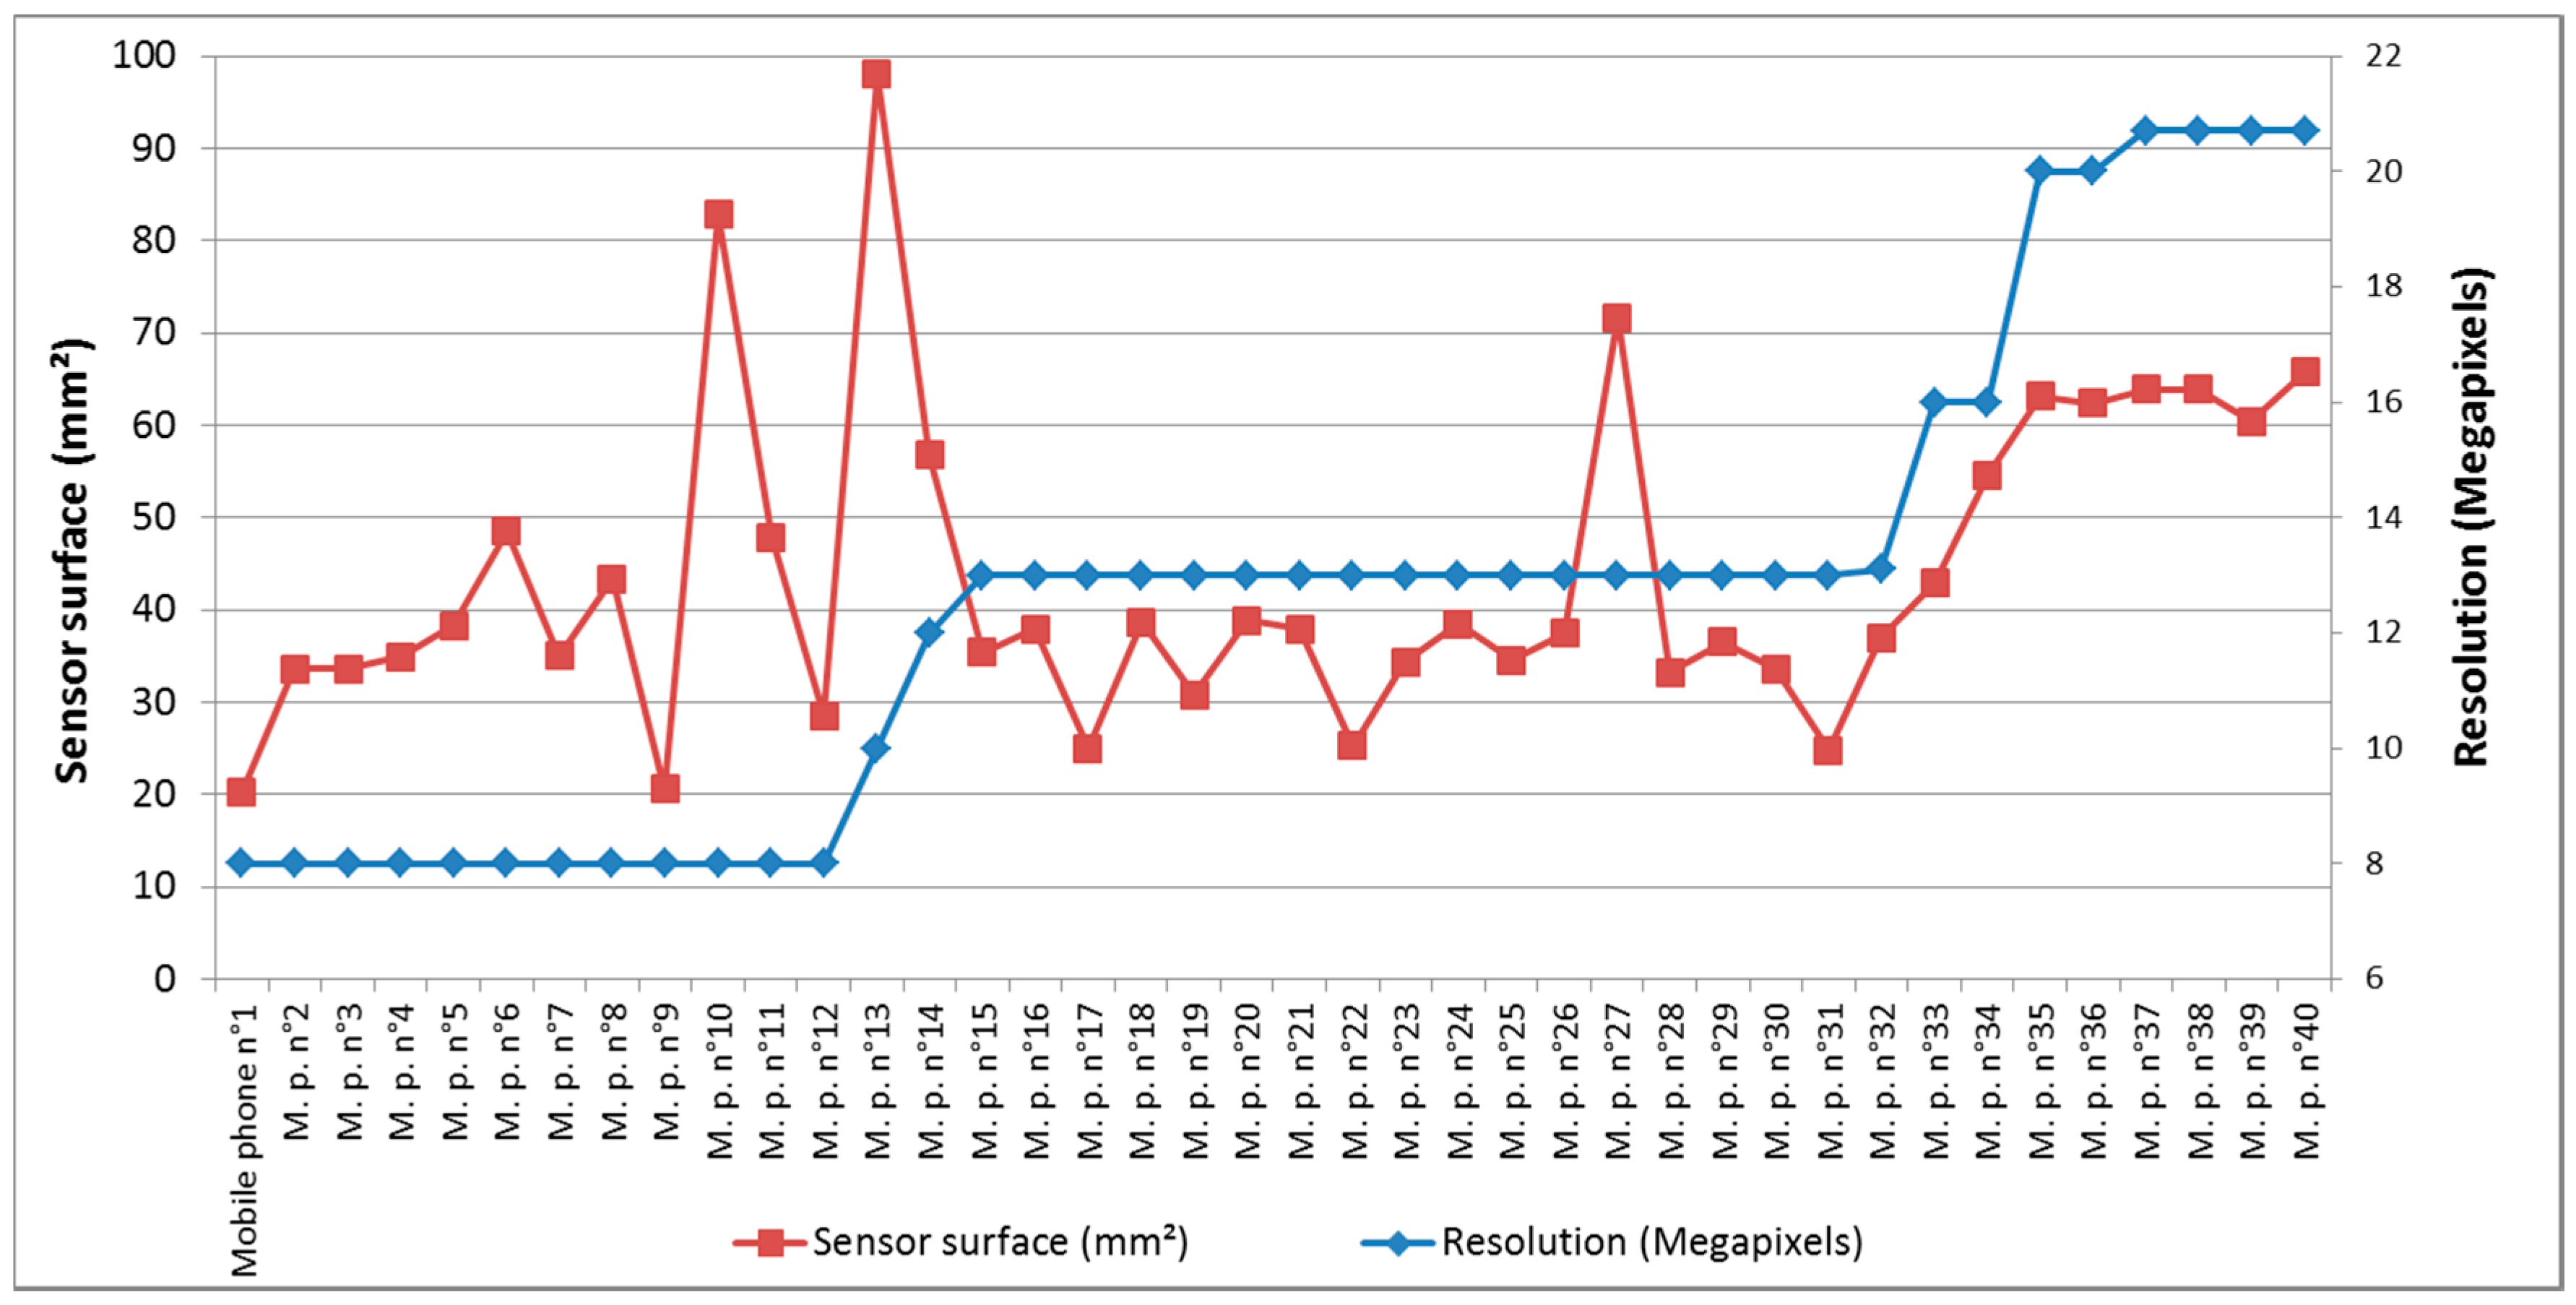
For the remaining camera models (n°7—°9)—i.e., those with a resolution >5 Megapixels and not designed as the one for compact digital cameras—a complementary assessment of 40 mobile phones was carried out. It demonstrated that, unlike cameras with resolution ≤5 Megapixels, the size of the CMOS sensors of these more complex cameras varied a lot (see Figure 5).
Consequently, for these more complicated camera models, an average GWPI score based on models n°7—°9 would not capture all possible configurations, and the sensor surface parameter had to be introduced into the Life Cycle Inventory (LCI) model. For this purpose the CMOS sensor’s size—expressed as a fraction of an inch—was used to simplify the data collection for the phone manufacturers (see Figure 6). Indeed, unlike the sensor surface, the sensor size is routinely provided [39,40] by camera manufacturers.
By relating the sensor size—expressed as a fraction of an inch—to its surface in mm2 it was possible to create 16 models (ranging from 1/4" to 2/3”) for CMOS sensor’s GWPI scores. On the top of the sensor’s CO2—eq. score, a single model, based on an average of camera models n°7—°9, was designed for the others parts of the camera (i.e., autofocus, lens module, housing, flash and electronic components).
Hence, in the OLCA method the only input for calculating the GWPI score of a camera model—with a >5 Megapixels resolution and not designed as a digital compact camera—is the sensor size. Depending on the sensor size the GWPI score for any camera model will range from ≈515 g CO2—eq. (1/4” sensor size) to ≈2060 gCO2—eq. (2/3” sensor size).

3. Results

Figure 7, Figure 8, Figure 9, Figure 10 and Figure 11 show the key results of the present paper.
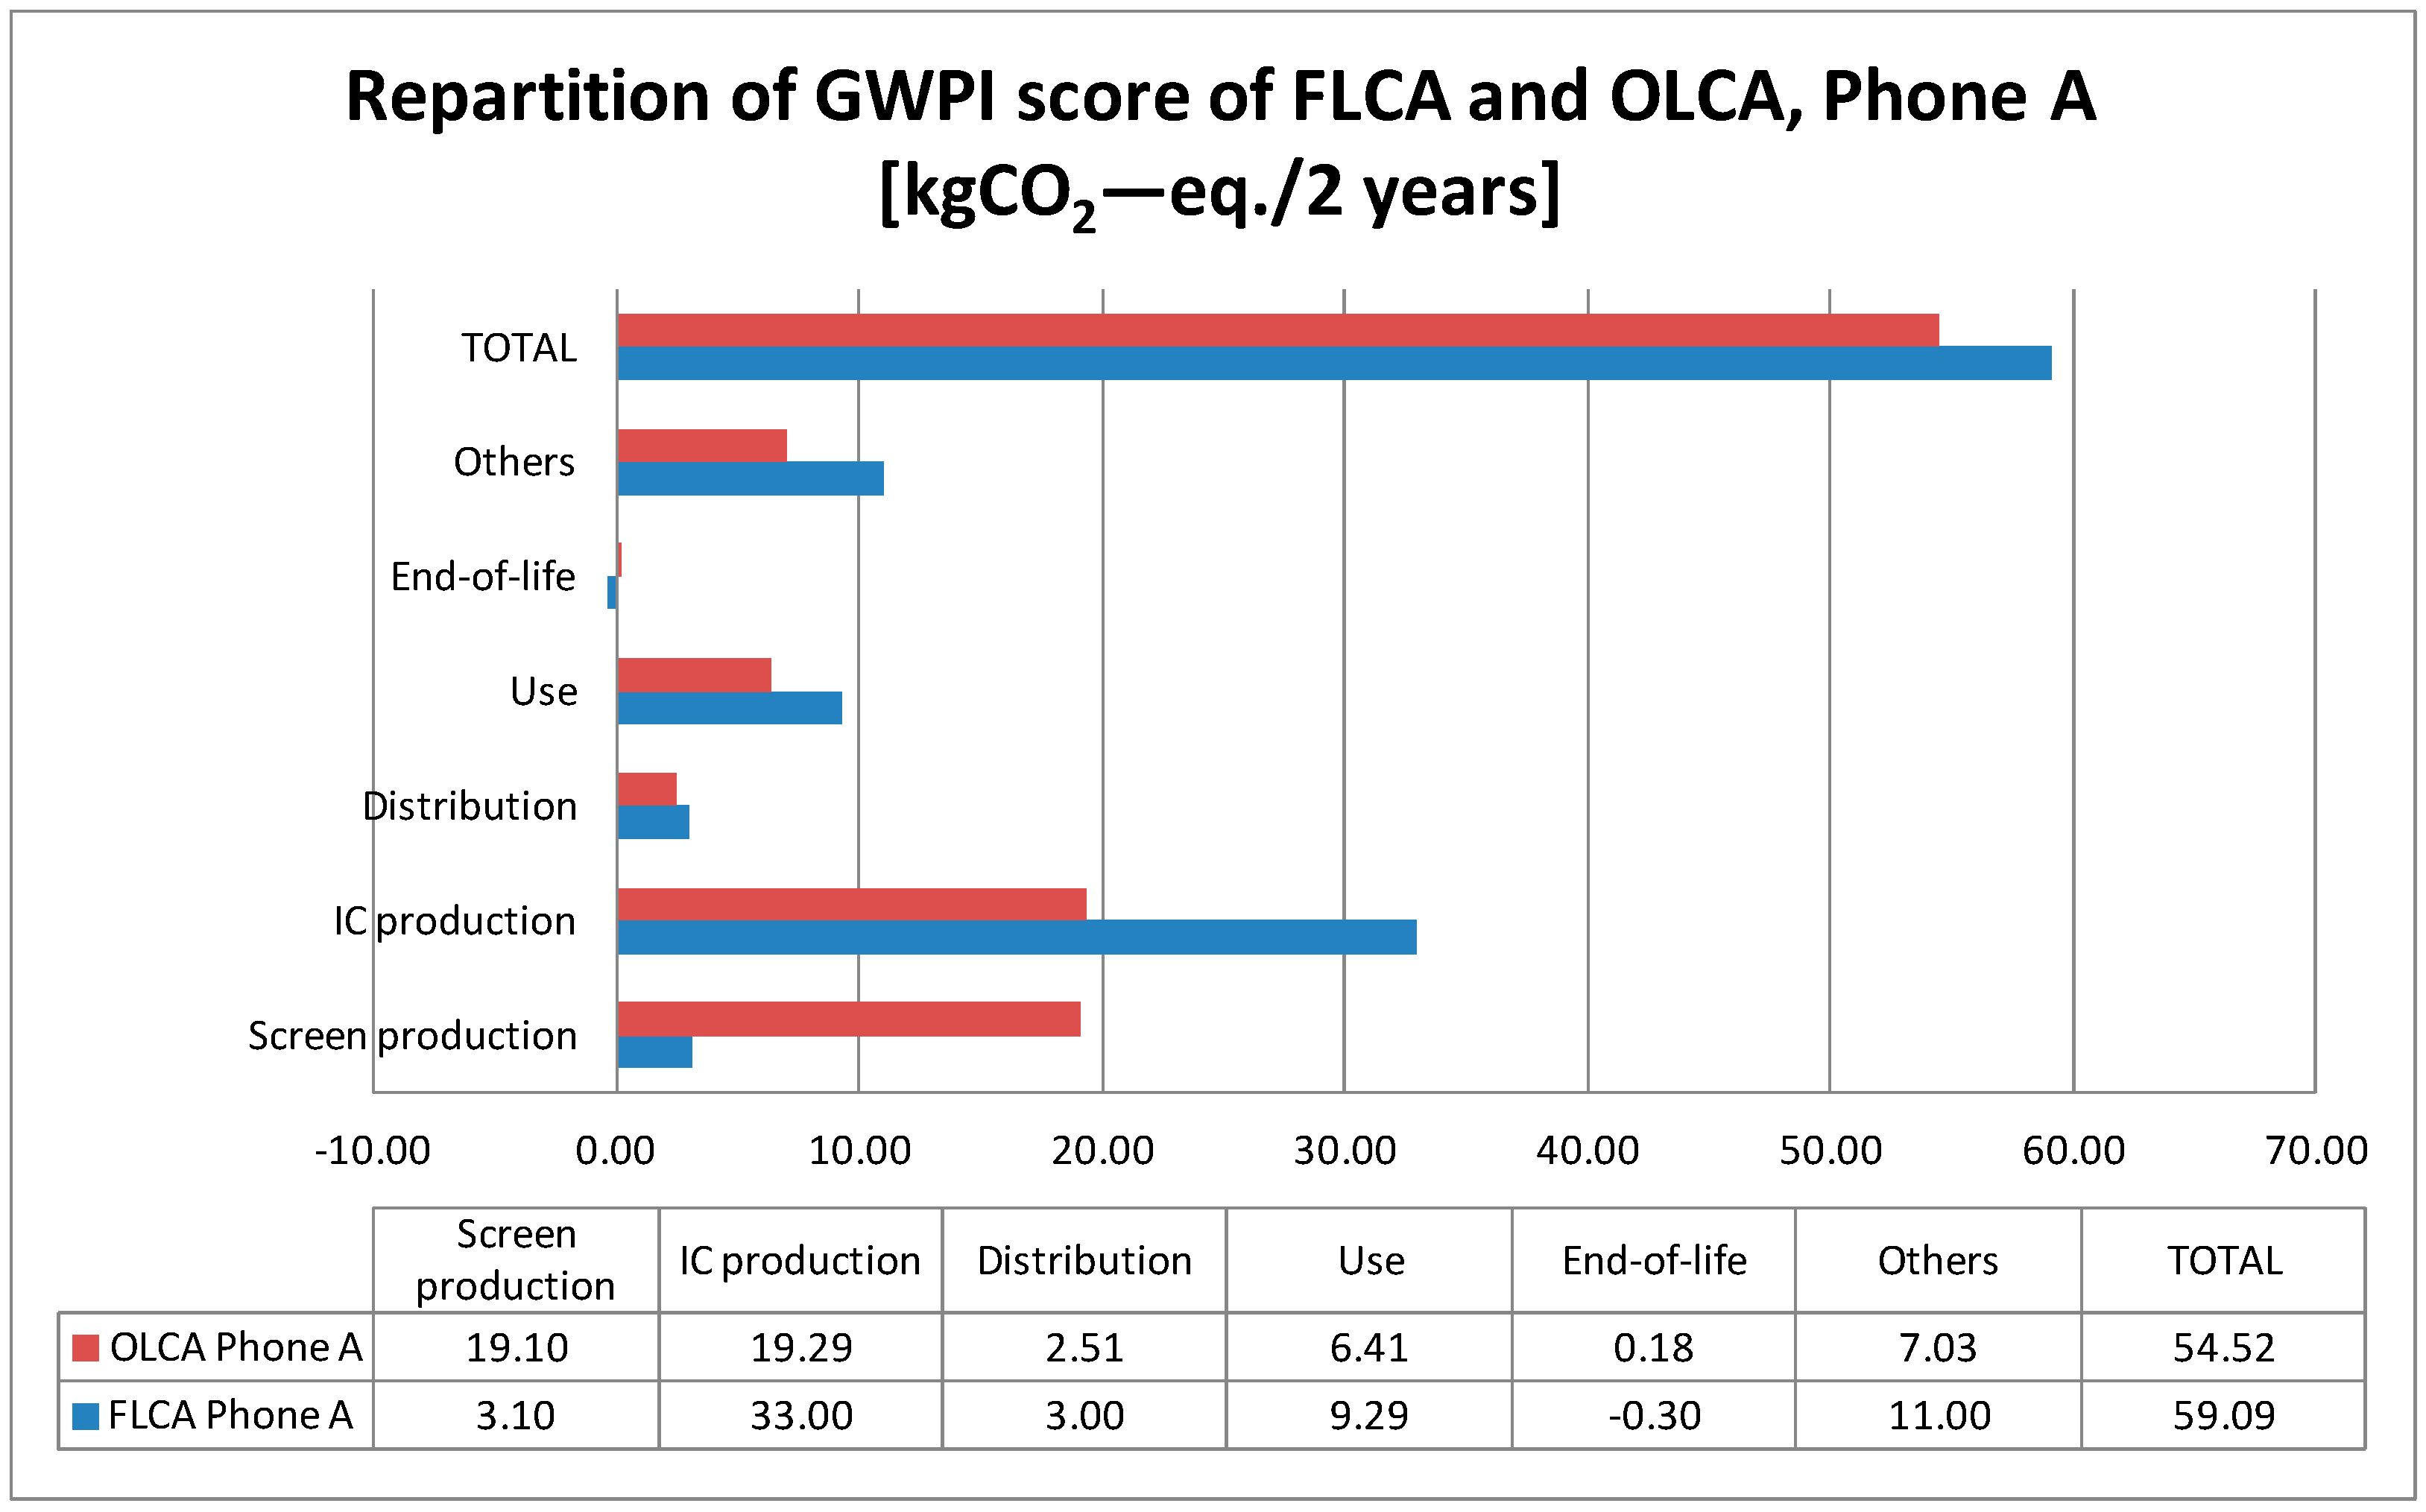
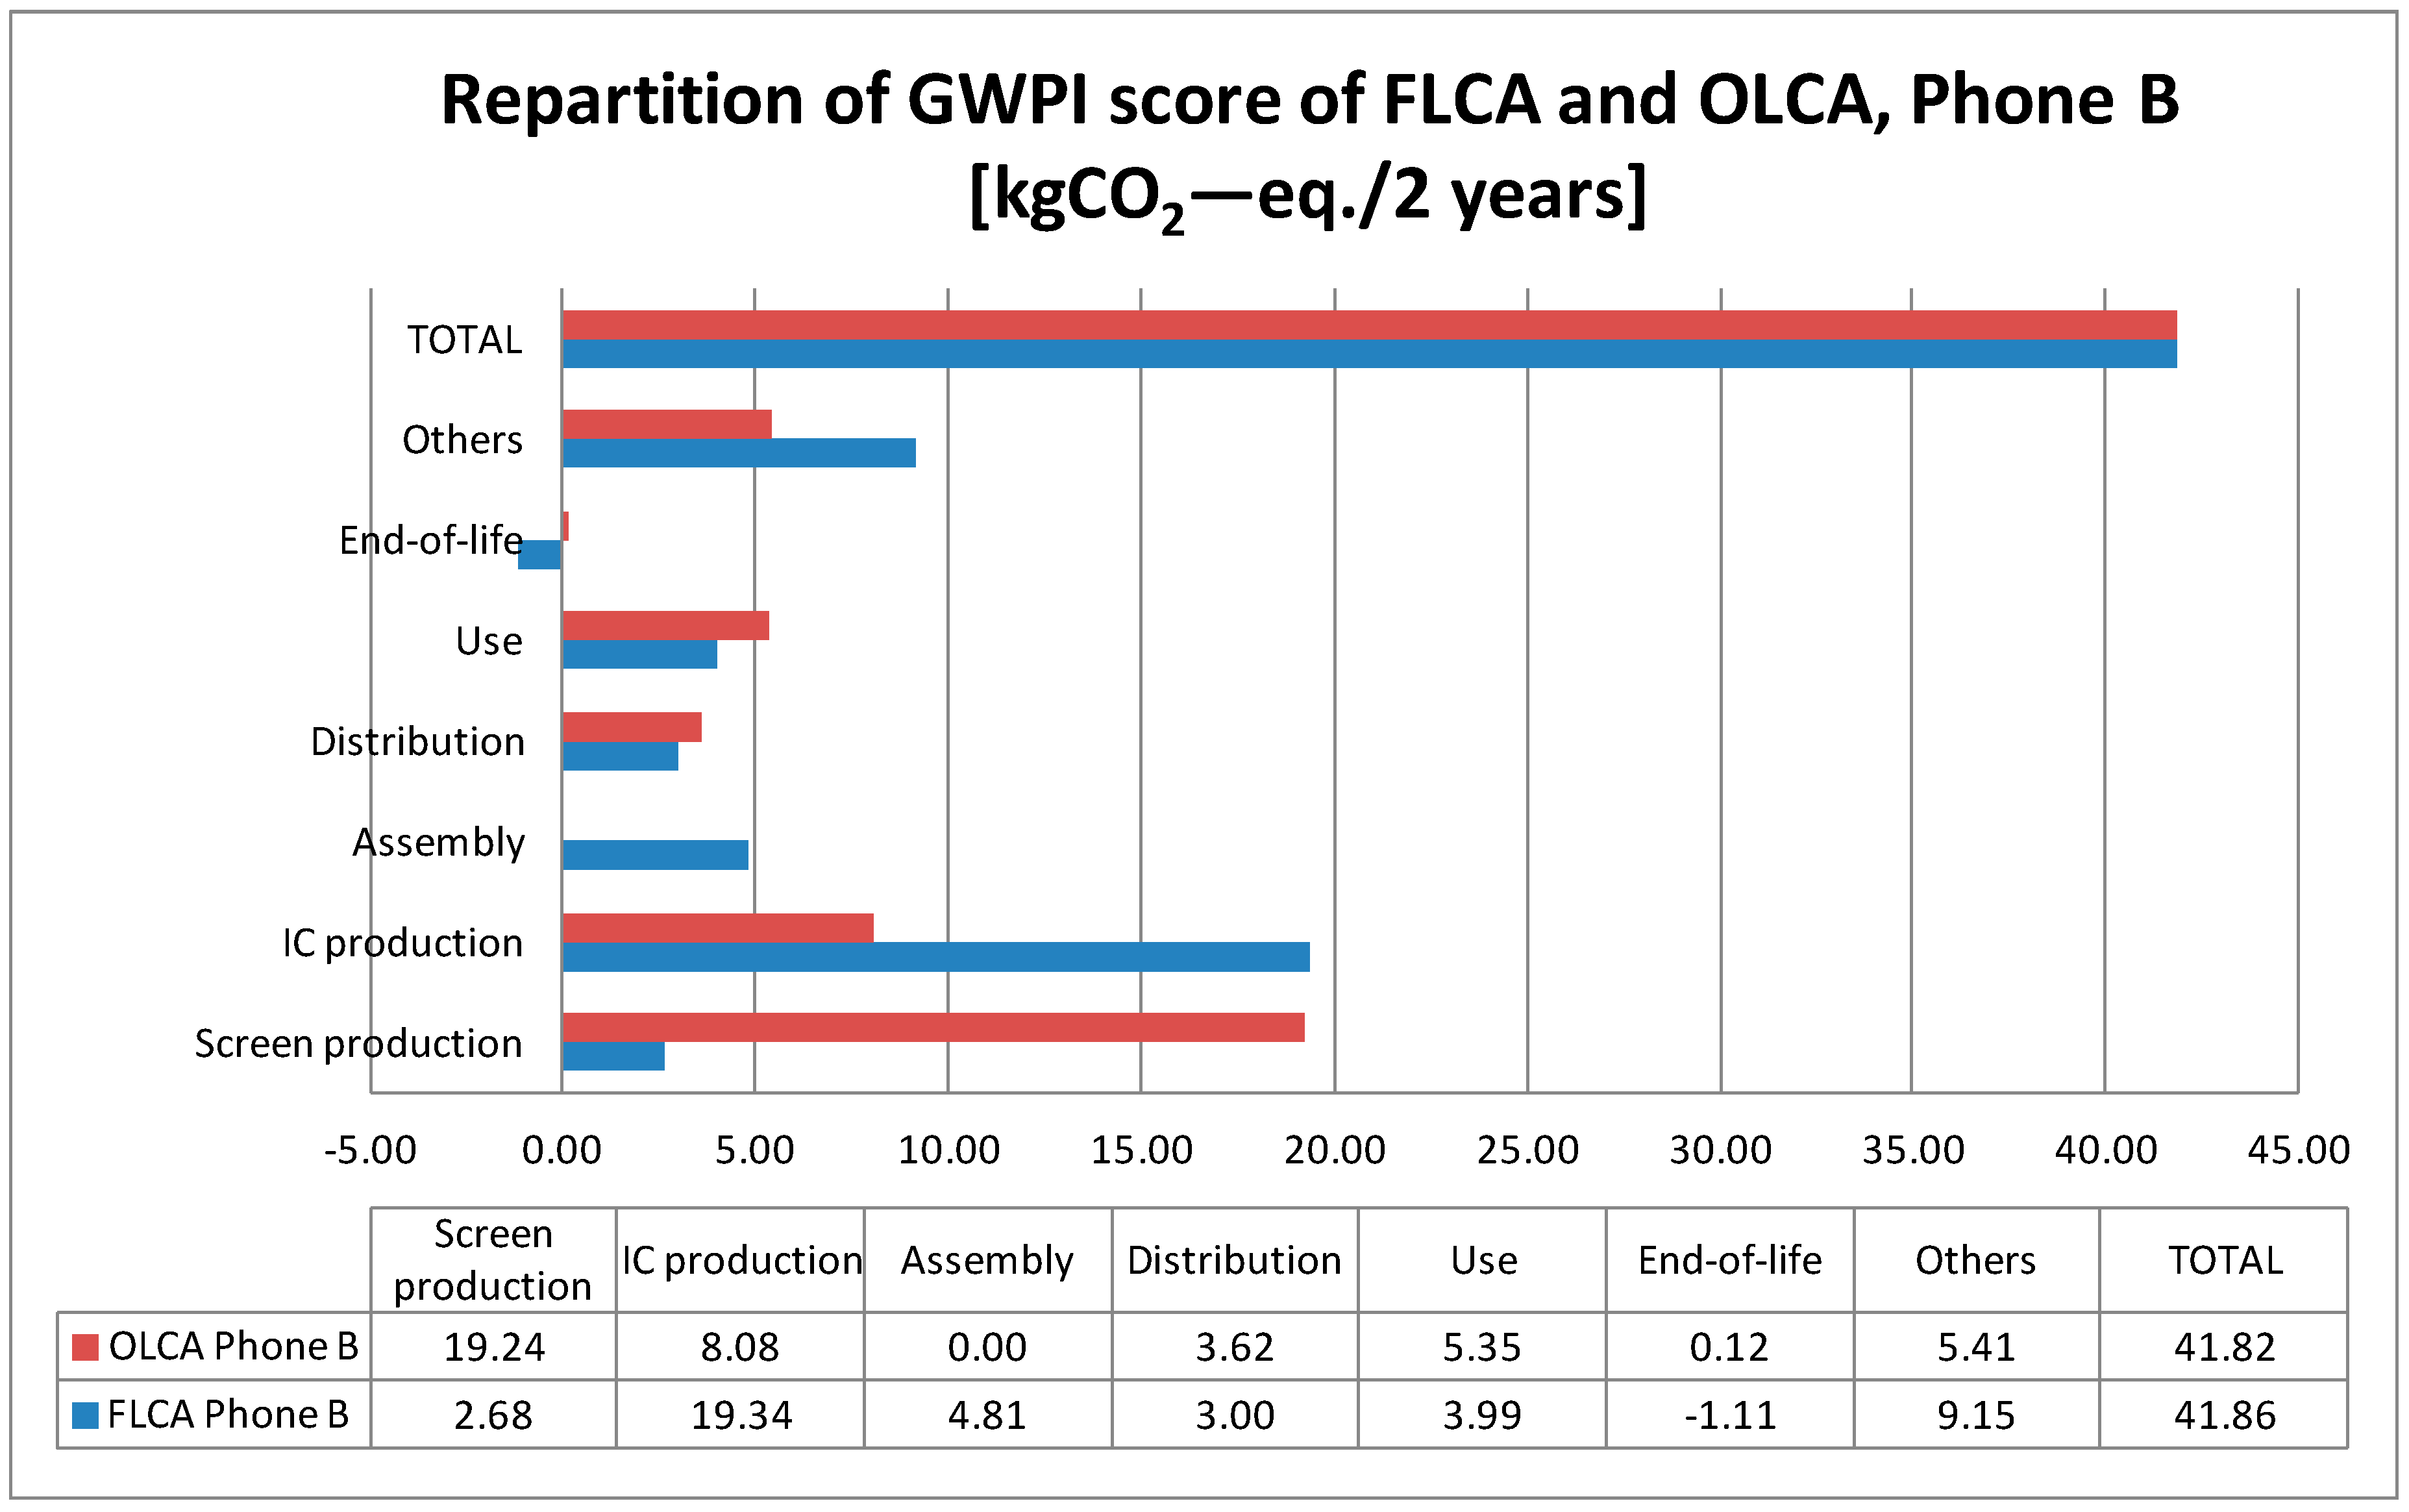
The differences for Screen and IC production balance each other for Phones A and B (Figure 8 and Figure 9).
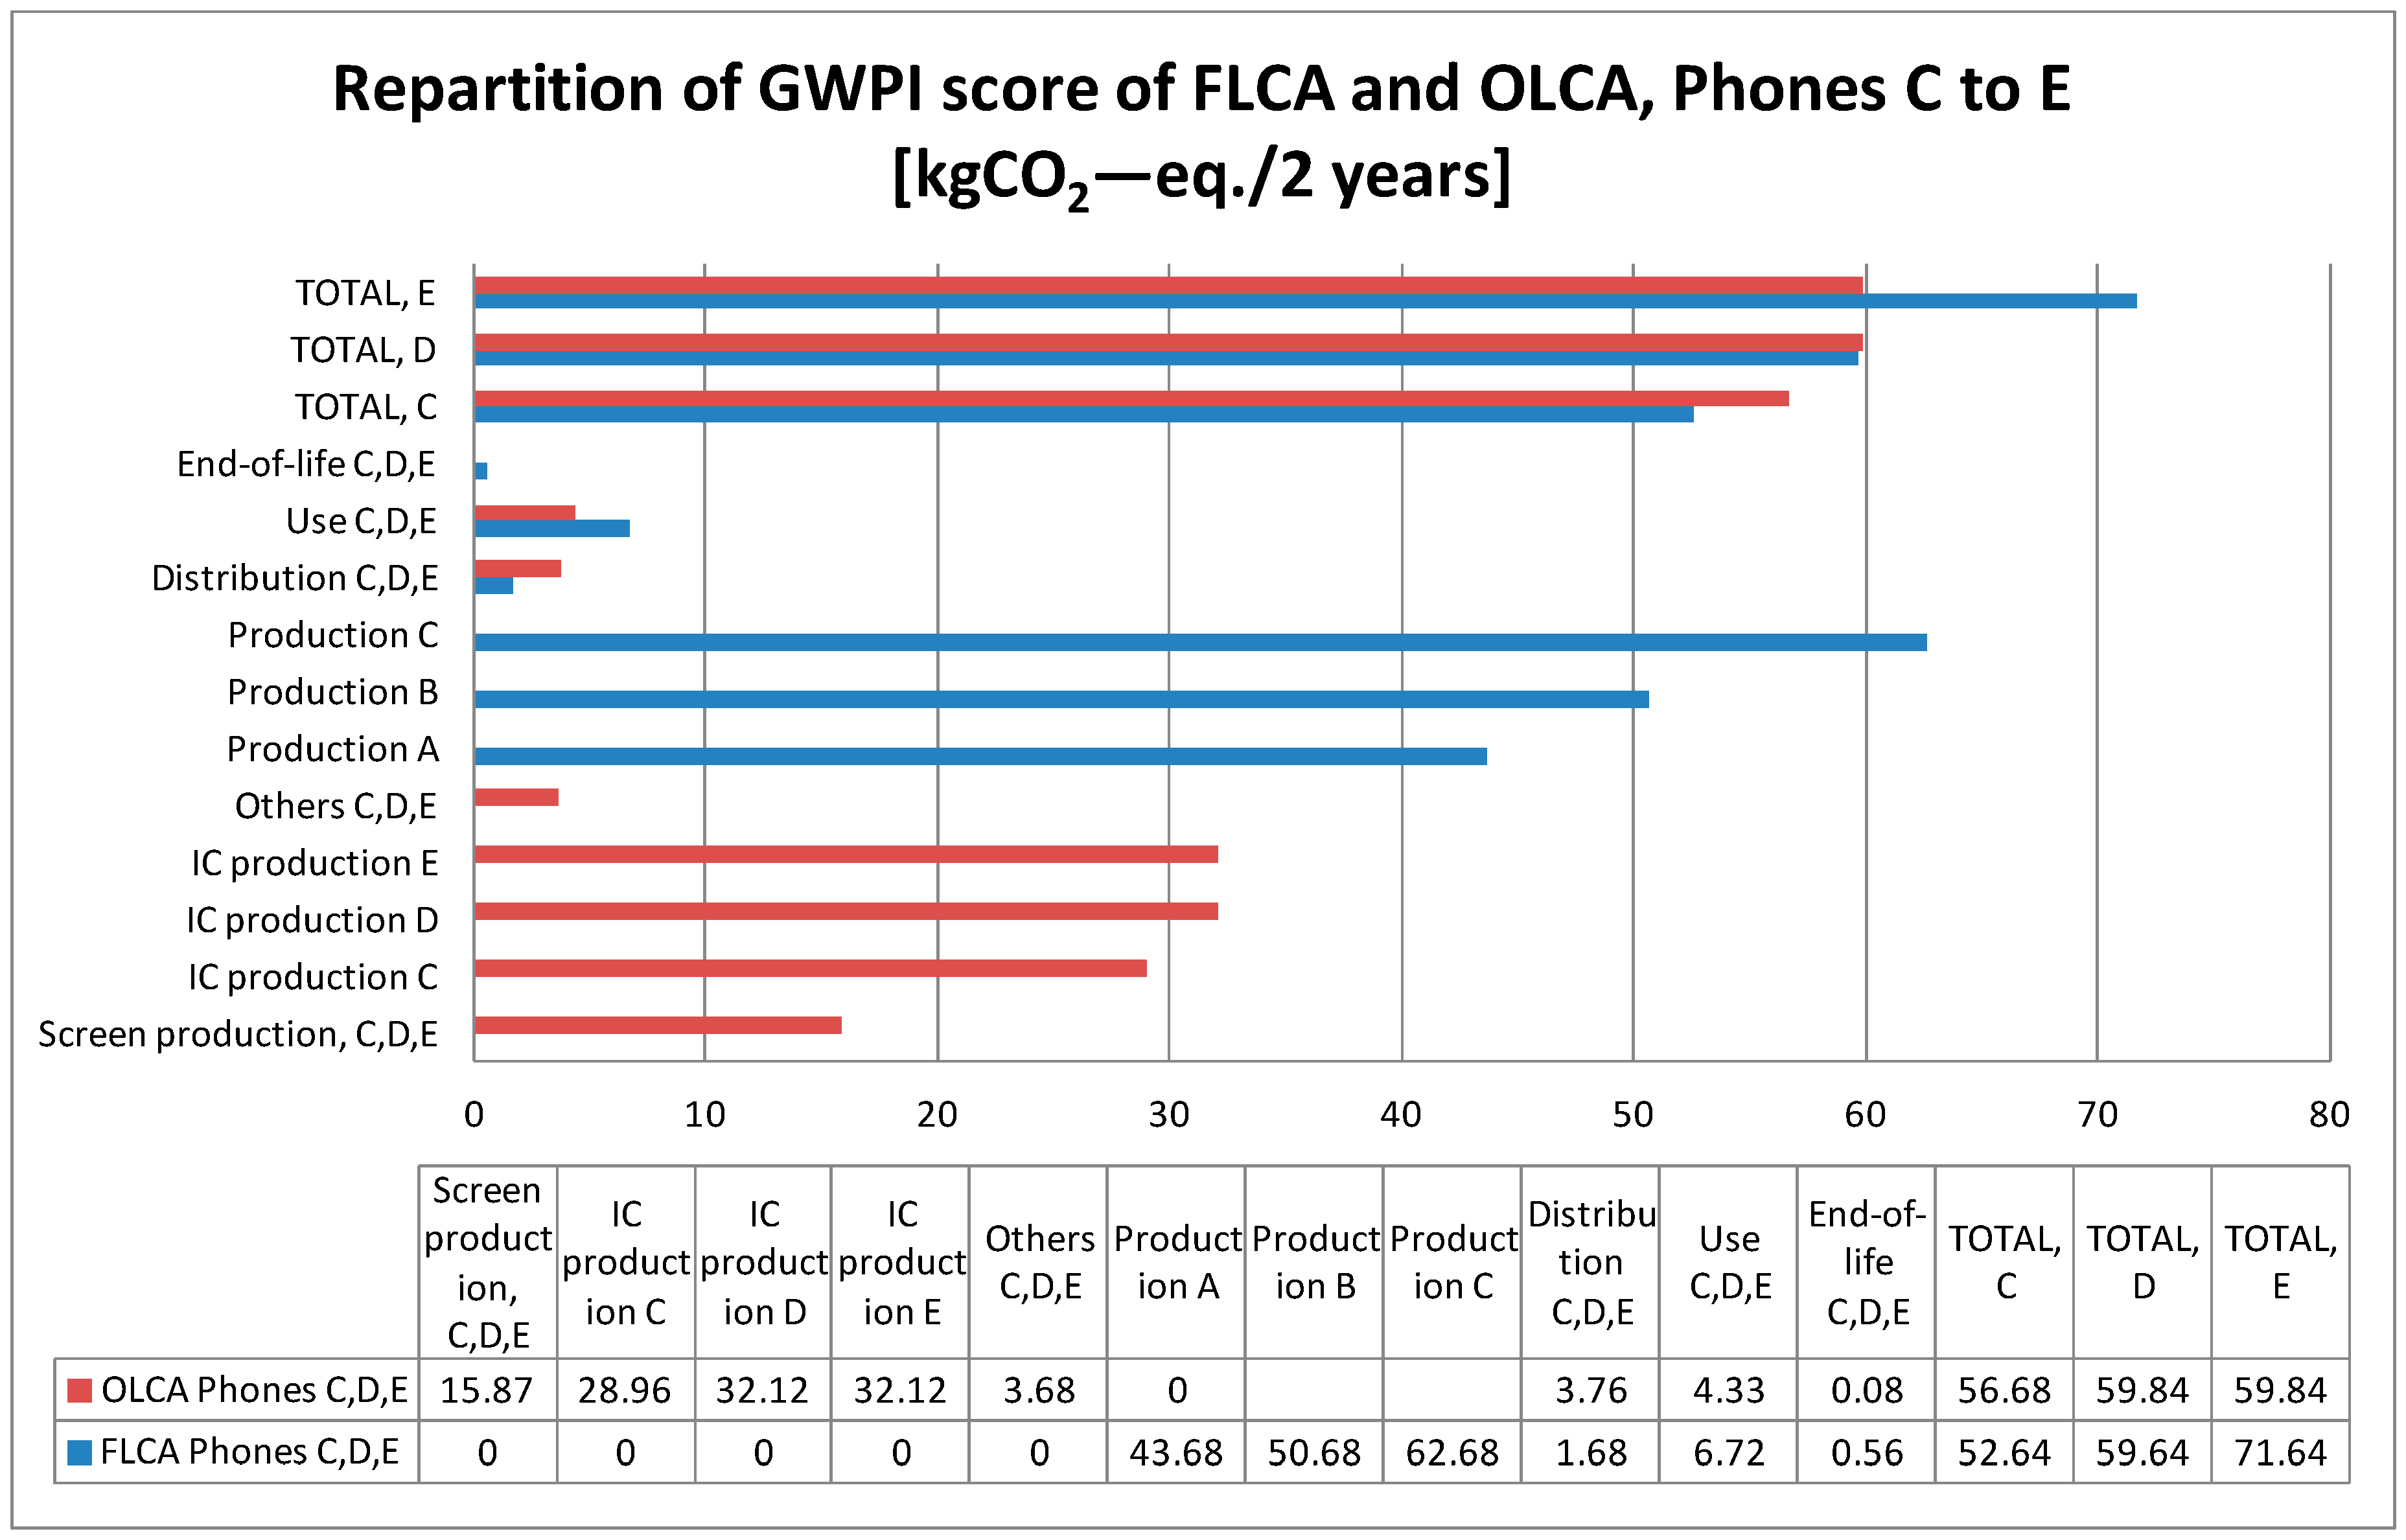
The lack of knowledge of the Si,area of Phone E could be an explanation for the large difference with OLCA (Figure 10).
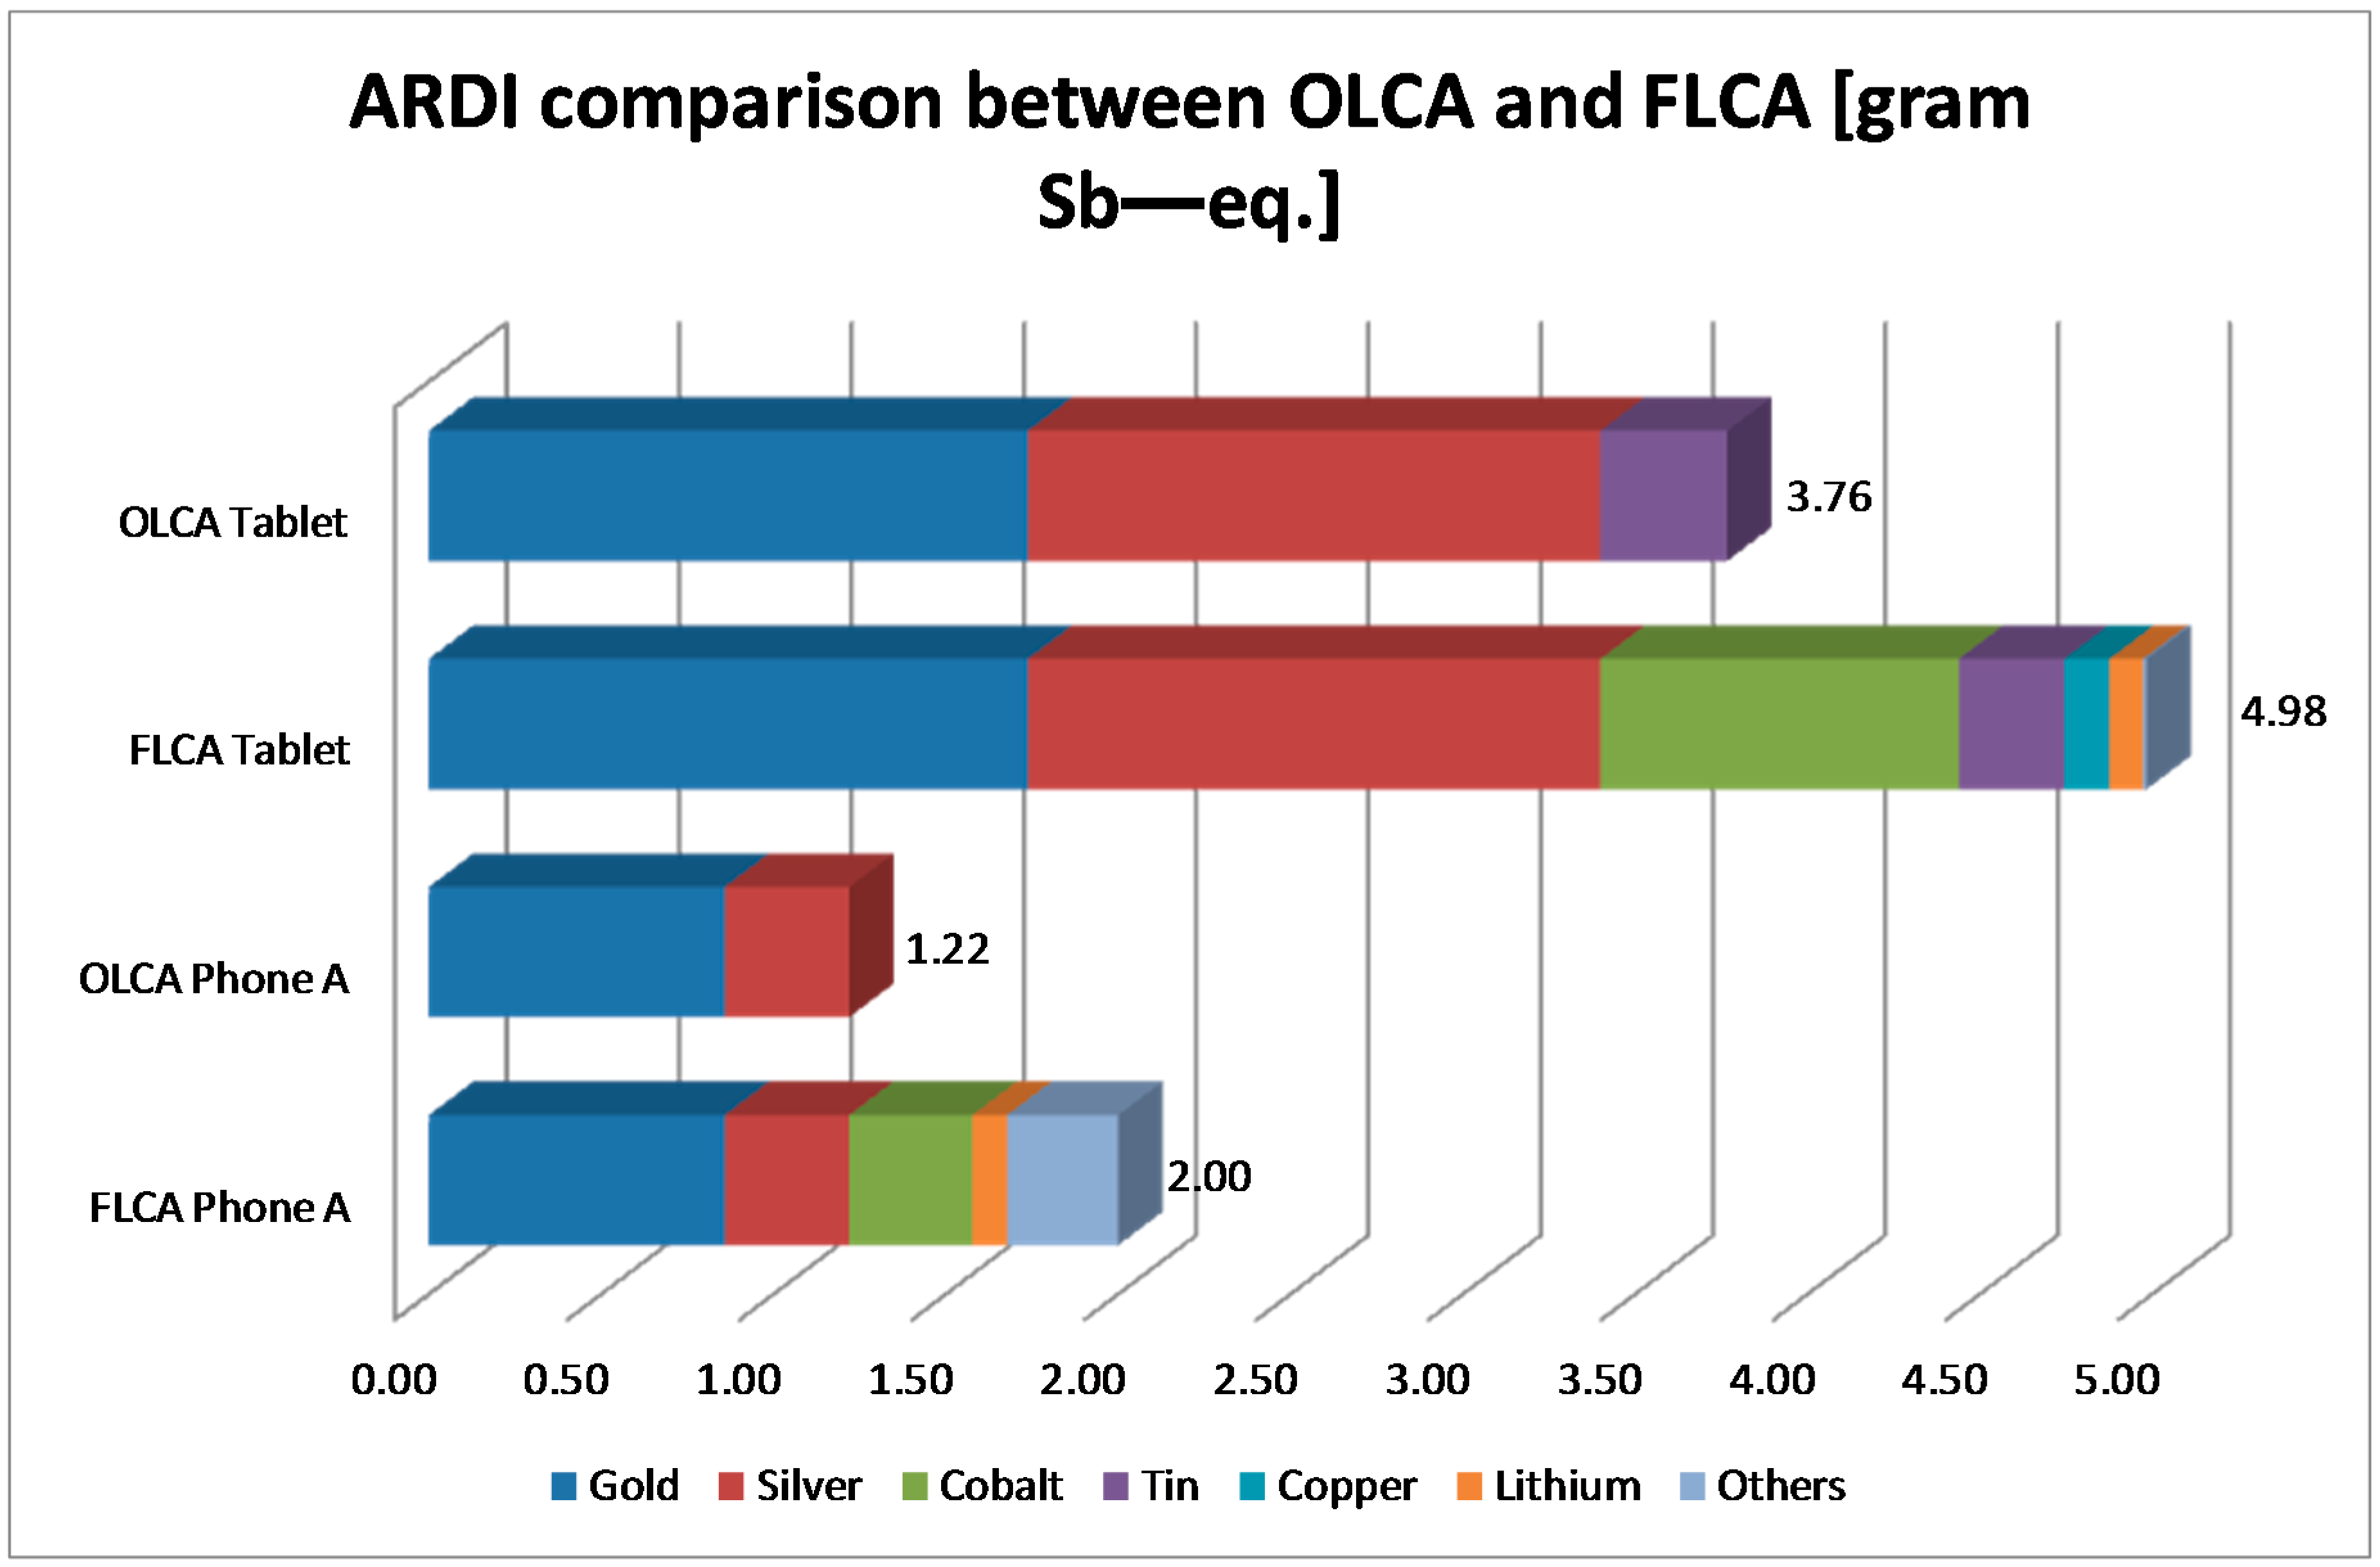
Figure 11 shows the difference between FLCA and OLCA for ARDI evaluation of Phone A and the tablet.
It seems important to update OLCA with a question for cobalt content.

4. Discussion

This research discusses the precision of a simplified approach—OLCA—for estimation of the carbon and antimony footprints of smartphones and tablets. On one hand individual practitioners want and need freedom to produce detailed and advanced FLCAs based on the ISO and ETSI LCA standards [34], but on the other hand these FLCAs should not be compared by consumers. The main reasons are that not all assumptions are transparent and might differ, and that “apples are not compared to apples” in a strict sense.
While comparability is the ultimate aim of the PEF FLCA method, it will require very high data quality. Here instead OLCA is suggested for smartphones which will lead to comparability with enough data quality even before any PEF legislation has been enacted. The reason for this insight is that all assumptions are controlled within OLCA and that the FLCA and OLCA scores for GWPI and ARDI do not differ beyond recognition.
Ultimately comparability is sought by many smartphone consumers. Usually the price, performance and design of the phones are compared before the decision. Can the GWPI and ARDI scores of smartphones also be compared? The ETSI FLCA standard [34] allows comparisons of GWPI and ARDI scores (and other LCIA scores for other impact indicators) between two external FLCAs if these four requirements are fulfilled:
(i)
same calculation rules are used,
(ii)
same LCA tool is used,
(iii)
same LCI databases are used,
(iv)
and a third party review is conducted.
OLCA fulfils all of these requirements as a common web tool is used with embedded calculation rules, the same GWPI and ARDI intensities are used for all unit processes, as well as the same algorithms for all, and finally the OLCA method is third party reviewed.
OLCA is not yet designed for tablets—this becomes apparent by the absence of a cobalt parameter. Currently tablets use relatively large amounts of cobalt in their batteries. Indeed, the current selection of metals in the OLCA method is based on the material content of two mobile phones determined from material content declarations from electronic component manufacturers and X-ray Fluorescence analysis. Cobalt was identified in this analysis to be just outside the top five contributors to ARDI.
Furthermore, OLCA merely estimates two midpoint categories and PEF compliant FLCAs need to estimate at least 15 [11]. Prescribed weighting will be an interesting solution to this dilemma of multidimensional midpoint categories [11,47].
Besides, the suitability of OLCA for working out clear-cut ecodesign recommendations is somewhat dubious as specific supply chains are not analyzed. Be that as it may, general ecodesign suggestions are possible to extract, especially since the whole OER [28] is much wider than OLCA.
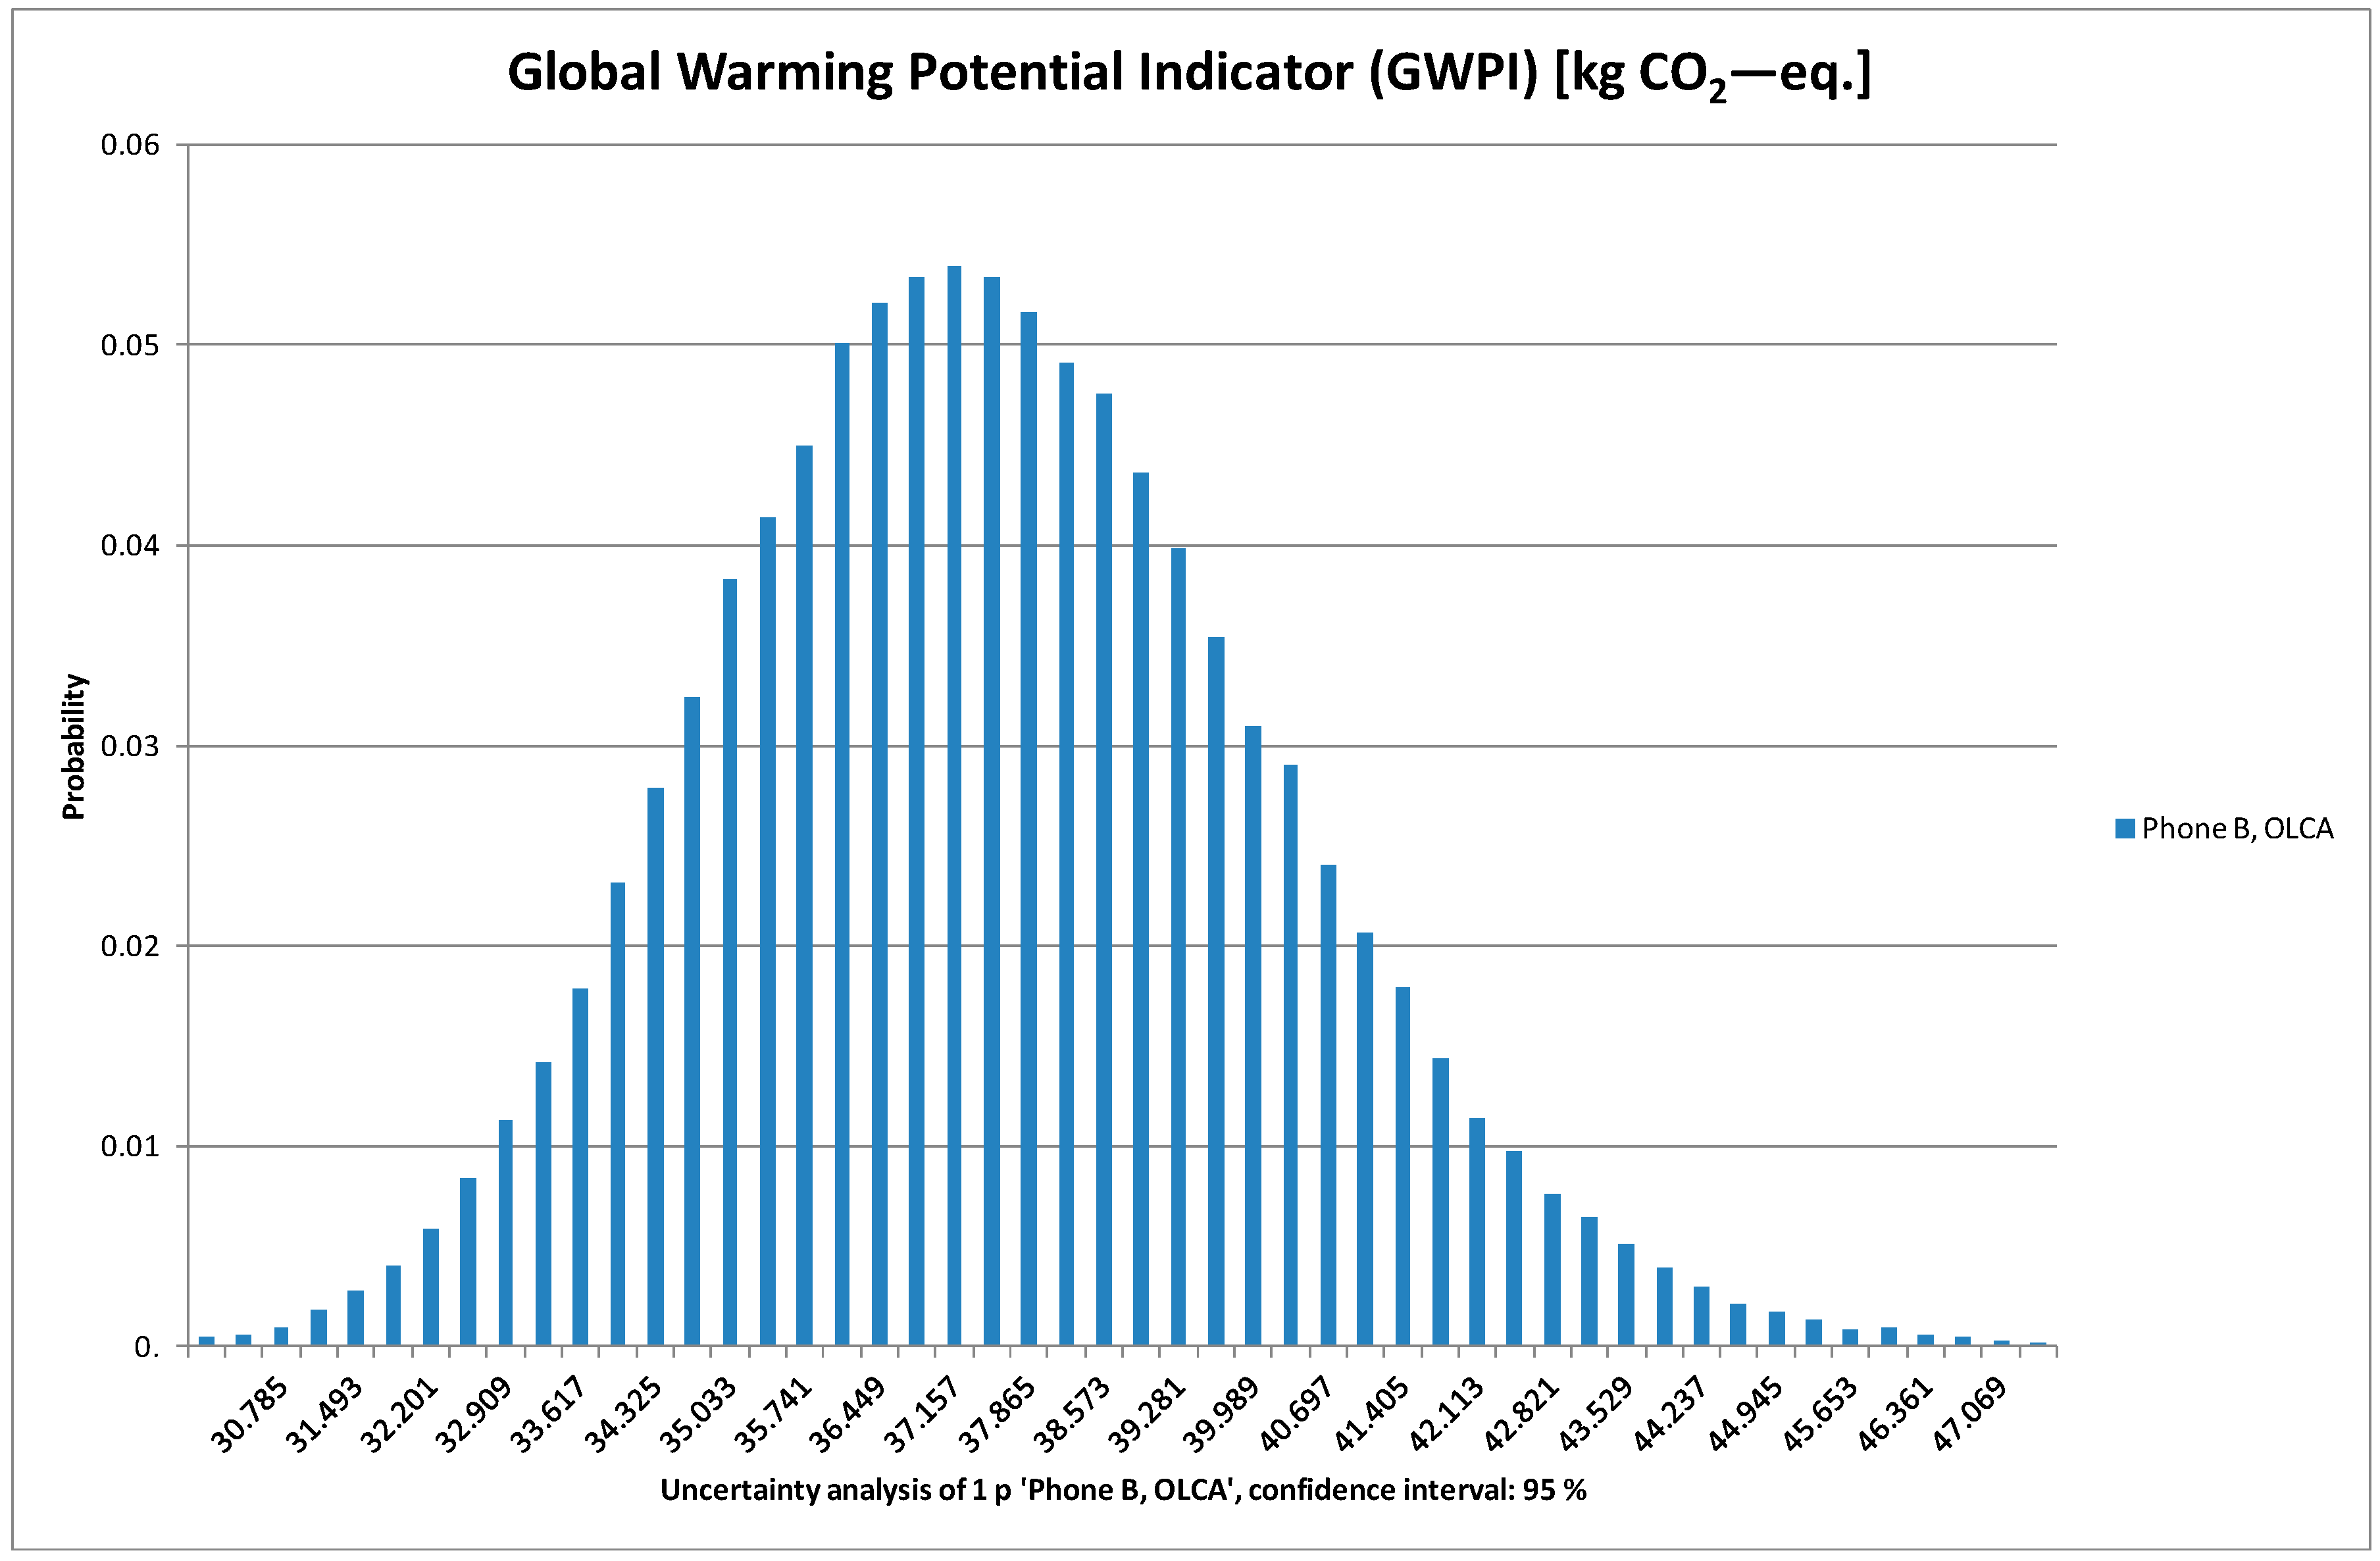
By inserting all Equations of OLCA—e.g., Equation (10)—as parameters and intensities into the LCA tool SimaPro 8.2.3.0, and adding appropriate uncertainty ranges for each (Table 4 and Table 5), a suggestion of the 95% confidence interval is obtained via 100,000 Monte Carlo simulations as 33 to 43 kg CO2—eq. for Phone B GWPI score in OLCA (Figure 12). This suggests that the FLCA score of Phone B for GWPI has a high probability of being equal (41.8 kg) to the OLCA score for Phone B for GWPI.
It can be argued that the intensities and parameters/metrics of OLCA are ‘wrong’ compared with those in FLCA (e.g., I,ScreenA and Siarea). However, OLCA can conveniently be updated with the best practice to enhance its (already good) precision compared to FLCA. The updates will be crucial due to the rapid changes in material and processing technology that might occur. In that sense the camera model was developed and introduced in the OLCA system to improve its precision. The next evolution of the OLCA model could be to assess the environmental footprint of fingerprint scanners. If their impact is significant, a model could be designed with inputs such as the scanner technology (e.g., capacitive or ultrasonic e.g.,) or the sensor’s die area. Indeed a quick review of 20 recent mobile phones conducted within Orange showed that this component area ranges from about 20 to 80 mm², thus it might be possible to use it as a key parameter in an impact assessment model.
Furthermore, if e.g., thallium, is somehow started to be used in large quantities (for infrared optics or glass for e.g.,), and the OLCA is not updated, the error for ARDI will become unnecessarily large as thallium’s characterization factor for ARDI is about 80 times higher than the one for gold.
Additionally, within the 10 next years, Indium Tin Oxide (ITO) used in screens could be replaced by metal mesh, silver nanowires, silver nanoparticles, carbon nanotubes, Poly(3,4-ethylenedioxythiophene) (PEDOT), or graphene. Then indium might have to be removed from the ARDI part of OLCA and be replaced by other metals. Anyway, the smartphone industry can agree on which parameters OLCA should contain and also the most appropriate intensity values for the most important parts such as screens, batteries, cameras, and chargers. OLCA development is as such similar to the development of PEFCR or PCR.
OLCA is a natural predecessor to PEF, or even its replacement if PEF for some reason never happens for smartphones. The reason is that PEF LCA presumably has to be performed for all smartphones sold in the EU which will require streamlined approaches and PEFCR. Those PEFCR could, after some adjustment, be agreed as the OLCA.
Moreover, the GWPI result of Phone D [15] shows a very strong similarity to OER—59.6 kg compared to 59.8 kg in OLCA—based on neither knowing Siarea nor I,Siarea, I,ScreenA or I,Use. This comparison underlines the good precision of OLCA compared to FLCA for GWPI. However, Phone E diverges 20% from OLCA (Figure 10) as the Siarea is not transparent and the IC production has to be approximated with SiNAND which is less precise than Siarea.
The difference between the FLCA ARDI score for Phone B and the OLCA ARDI can partly be explained by metal recycling, which benefits of which are not yet considered in OLCA. Moreover, the characterization factors used for ARDI are different.
The FLCA ARDI score for Phone A also includes metal recycling [13]. As shown in Supplementary Materials Section 10, OLCA includes collection of 100% of all phones, transports, sorting and pyrometallurgical treatment and incineration of plastics and the GWPI scores of all. The credits for metal recycling and landfill emissions are not yet considered, neither are the storage/use of phones at the customers’ homes. So far, no clear way of including the recycling credits has been agreed for OLCA.
The present OLCA is global for two midpoint indicators and cannot mimic local FLCAs as well as it resembles global FLCAs. An OLCA, intended for the Chinese market, might have to focus more on end-of-life-treatment and other impact categories such as particulate matter.
The mass of tin used by Phone A is not possible to identify with Equation (8), but tin likely contributes to “Others” (see Figure 5 in [13]). If the mass of tin used by Phone A is around 1200 mg, the OLCA ARDI score will rise to 1.36 g Sb—eq., however still far from 2. It is logical that ARDI deviation is higher than it is for GWPI. The reason is that the FLCA score is based on life cycle emissions whereas ARDI in OLCA is just based on the metal content, including neither losses in the upstream nor recycling in the downstream.
OLCA adopts the principle of “equal error margin for all” instead of “random error margins by all.”
FLCA is usually performed for one phone by one manufacturer, giving one result. FLCAs are also carried out at a relatively high cost and performed quite slowly. OLCA is performed for many phones by mobile network operators at a relatively low cost and fast manner. This research shows that the precision for OLCA is still quite high, at least for GWPI.
It can be argued that the sample of five smartphones and one tablet is too small to draw reliable conclusions, however, the quality of the included FLCA is judged to be relatively high.

5. Conclusions

In conclusion the present research shows that:
  • (H1) The FLCA scores are <50% higher than OLCA scores for Phones A—E for GWPI at ≈20%, so H1 is falsified;
  • (H2) The FLCA score is >50% higher than the OLCA score for Phone A for ARDI at ≈70%, so H2 is not falsified;
  • (H3) The ARDI score based on metal content of the tablet is <50% higher than OLCA ARDI at ≈30%, so H3 is falsified;
  • Differences in silicon die manufacturing intensity, screen production intensity and missing assembly emissions in OLCA mainly explain the GWPI differences;
  • Cobalt missing from OLCA for the most part explains the ARDI differences.

6. Looking Ahead

The next step is the comparison of OLCA with other LCA methodologies for smartphones, such as PEF [48] and Product Attribute to Impact Algorithm (PAIA) [49], analyzing the differences compared with the individual FLCAs [13,14,15] based on ETSI or ISO LCA standards. In the coming years, it is expected that PEF will become the dominant approach for FLCA. However, more research is needed in the area of strengths and weaknesses of PEF compared with the other FLCA approaches, e.g., for smartphones. Typically the so called circular footprint formulae (CFF) [11] are highly recommended to add to the OLCA model. CFF is a combination of material, energy and disposal parameters (for each product) which determine the environmental impact of the end-of-life stage. Including CFF would enable an understanding of reduction effects—of e.g., ARDI and GWPI scores—of a myriad of waste strategies such as recycled content, recycling, and energy recovery. Weighted single scores, weighing many midpoint impact categories including CC and ARD, also need to be evaluated for OLCA. Andrae recently attempted single score weighting for a virtual reality headset [47]. It remains to be analyzed whether such single score weighting, or instead adding more midpoint categories, is the best way forward for OLCA.

Supplementary Materials

The following are available online at www.mdpi.com/link/2078-1547/8/2/21/s1. In the freely available Word file in the Supplementary Materials the details for OLCA modeling of screens, PCBs, plastic parts, aluminum parts, steel parts, chargers, packaging, distribution, use and end-of-life are shown.

Acknowledgments

Anonymous reviewers are greatly appreciated for comments, which improved this paper. M.S. VAIJA would like to thank the Orange contributors who worked of the Open Eco-rating project for LCAs or project management: Catherine Jay Garcia, Gemma Ricci, Olivier Laurent, Karine Renault and Antoine De Clerck.

Author Contributions

Anders S. G. Andrae wrote the paper except for Section 2.6, parts of Section 1.2 and Section 4, and the Supplementary Materials written by Mikko Samuli Vaija.

Conflicts of Interest

The authors declare no conflict of interest. The views of this paper are the authors own and not those of the companies.

References

  1. Andrae, A.S.G.; Edler, T. On electricity usage of communication technology: Trends to 2030. Challenges 2015, 6, 117–157. Available online: www.mdpi.com/2078-1547/6/1/117 (accessed on 17 May 2017). [CrossRef]
  2. Andrae, A.S.G.; Corcoran, P. Emerging Trends in Electricity Consumption for Consumer ICT. Available online: https://aran.library.nuigalway.ie/bitstream/handle/10379/3563/CA_MainArticle14_all-v02.pdf?sequence=4&isAllowed=y (accessed on 15 June 2017).
  3. Andrae, A.S.G.; Xia, M.; Zhang, J.; Tang, X. Practical Eco-Design and Eco-Innovation of Consumer Electronics—The Case of Mobile Phones. Challenges 2016, 7, 3. Available online: https://www.mdpi.com/2078-1547/7/1/3 (accessed on 17 May 2017). [CrossRef]
  4. Andrae, A.S.G.; Vaija, M.S. To Which Degree does Sector Specific Standardization Make Life Cycle Assessments Comparable?—The Case of Global Warming Potential of Smartphones. Challenges 2014, 5, 409–429. Available online: https://www.mdpi.com/2078-1547/5/2/409/htm (accessed on 17 May 2017). [CrossRef]
  5. Hagelüken, M.; Schischke, K.; Müller, J.; Griese, H.J. Welcome to the Jungle—Survival of the Fittest Environmental Screening Indicators? In Proceedings of the Electronics Goes Green 2004+, Berlin, Germany, 6–8 September 2004; Available online: http://www.ecodesignarc.info/servlet/is/652/Welcome%20to%20the%20Jungle%20-%20Survival%20of%20the%20Fittest%20Environmental.pdf?command=downloadContent&filename=Welcome%20to%20the%20Jungle%20-%20Survival%20of%20the%20Fittest%20Environmental.pdf (accessed on 29 May 2017).
  6. Pamminger, R.; Krautzer, F.; Wimmer, W.; Schischke, K. “LCA to Go”—Environmental Assessment of Machine Tools According to Requirements of Small and Medium-Sized Enterprises (SMEs)—Development of the Methodological Concept. In Re-Engineering Manufacturing for Sustainability, 1st ed.; Nee, A.Y.C., Song, B., Ong, S.K., Eds.; Springer: Singapore, 2013; Volume 1, pp. 481–486. [Google Scholar] [CrossRef] [Green Version]
  7. Schischke, K.; Nissen, N.F.; Lang, K.D. Translating product specifications into environmental evidence—Carbon Footprint Models explained on the example of a netbook, a consumer laptop and an ultrabook. In Proceedings of the Going Green CARE INNOVATION 2014, Vienna, Austria, 17–20 November 2014; Available online: http://publica.fraunhofer.de/eprints/urn_nbn_de_0011-n-3159403.pdf (accessed on 29 May 2017).
  8. Schischke, K.; Proske, M.; Schulz, G.; Husemann, J.; Trenner, T.; Sonnenberg, T.; Huck, W.; Kelm, K.; Tempel, N.; Wunderlich, P.; et al. Methodology Guidance—Energy Profiles and Carbon Footprint Data for Passive Components and Connectors, version 1.2; Fraunhofer IZM: Berlin, Germany, 2015; Available online: http://publica.fraunhofer.de/eprints/urn_nbn_de_0011-n-3349766.pdf (accessed on 29 May 2017).
  9. Schischke, K.; Nissen, N.F.; Lang, K.D. Experiences of Small Electronics Companies to Underpin Circular Economy Approaches by Means of Simplified Life Cycle Indicator. In Proceedings of the World Resources Forum, Davos, Switzerland, 12–14 October 2015; Available online: http://www.wrforum.org/wp-content/uploads/2015/10/SS1-Schischke.pdf (accessed on 29 May 2017).
  10. Del Borghi, A. LCA and communication: environmental product declaration. Int. J. Life Cycle Assess. 2013, 18, 293–295. Available online: https://link.springer.com/content/pdf/10.1007%2Fs11367-012-0513-9.pdf (accessed on 28 May 2017). [CrossRef]
  11. European Commission. Environmental Footprint Guidance document—Guidance for the development of Product Environmental Footprint Category Rules (PEFCRs), Version 6.0, November 2016. Available online: http://ec.europa.eu/environment/eussd/smgp/pdf/Guidance_products.pdf (accessed on 20 April 2017).
  12. Ojala, E.; Uusitalo, V.; Virkki-Hatakka, T.; Niskanen, A.; Soukka, R. Assessing product environmental performance with PEF methodology: Reliability, comparability, and cost concerns. Int. J. Life Cycle Assess. 2016, 21, 1092–1105. [Google Scholar] [CrossRef]
  13. Ercan, M.; Malmodin, J.; Bergmark, P.; Kimfalk, E.; Nilsson, E. Life Cycle Assessment of a Smartphone. 2016. Available online: http://www.atlantis-press.com/php/download_paper.php?id=25860375 (accessed on 20 April 2017).
  14. Proske, M.; Clemm, C.; Richter, N. Life Cycle Assessment of the Fairphone 2. 2016. Available online: https://www.fairphone.com/wp-content/uploads/2016/11/Fairphone_2_LCA_Final_20161122.pdf (accessed on 20 April 2017).
  15. Apple iPhone7 Environmental Report. 2016. Available online: http://images.apple.com/environment/pdf/products/iphone/iPhone_7_PER_sept2016.pdf (accessed on 20 April 2017).
  16. Andrae, A.S.G.; Andersen, O. Life cycle assessments of consumer electronics—Are they consistent? Int. J. Life Cycle Assess. 2010, 15, 827–836. [Google Scholar] [CrossRef]
  17. Andrae, A.S.G.; Vaija, M.S. Life Cycle Assessments of an Optical Network Terminal and a Tablet: Experiences of the Product Environmental Footprint Methodology. In Advances in Environmental Research, 1st ed.; Daniels, J.A., Ed.; Nova Science Publishers: Hauppauge, NY, USA, 2017; Volume 55, pp. 31–46. [Google Scholar]
  18. Nissen, N.F.; Griese, H.; Middendorf, A.; Müller, J.; Pötter, H.; Reichl, H. Comparison of simplified environmental assessments versus full life cycle assessment (LCA) for the electronics designer. In Life Cycle Networks, 1st ed.; Krause, F.L., Seliger, G., Eds.; Springer Science + Business Media: Dordrecht, The Netherlands, 1997; Volume 55, pp. 301–312. [Google Scholar]
  19. Bribián, I.Z.; Usón, A.A.; Scarpellini, S. Life cycle assessment in buildings: State-of-the-art and simplified LCA methodology as a complement for building certification. Build. Environ. 2009, 44, 2510–2520. [Google Scholar] [CrossRef]
  20. Padey, P.; Girard, R.; Le Boulch, D.; Blanc, I. From LCAs to simplified models: A generic methodology applied to wind power electricity. Environ. Sci. Technol. 2013, 47, 1231–1238. [Google Scholar] [CrossRef] [PubMed]
  21. Bala, A.; Raugei, M.; Benveniste, G.; Gazulla, C.; Fullana-i-Palmer, P. Simplified tools for global warming potential evaluation: When ‘good enough’is best. Int. J. Life Cycle Assess. 2010, 15, 489–498. [Google Scholar] [CrossRef]
  22. Arzoumanidis, I.; Salomone, R.; Petti, L.; Mondello, G.; Raggi, A. Is there a simplified LCA tool suitable for the agri-food industry? An assessment of selected tools. J. Clean. Product. 2017, 149, 406–425. [Google Scholar] [CrossRef]
  23. Teehan, P.; Kandlikar, M. Comparing embodied greenhouse gas emissions of modern computing and electronics products. Env. Sci. Technol. 2013, 47, 3997–4003. [Google Scholar] [CrossRef] [PubMed]
  24. Moberg, Å.; Borggren, C.; Ambell, C.; Finnveden, G.; Guldbrandsson, F.; Bondesson, A.; Malmodin, J.; Bergmark, P. Simplifying a life cycle assessment of a mobile phone. Int. J. Life Cycle Assess. 2014, 19, 979–993. [Google Scholar] [CrossRef]
  25. Corcoran, P.M.; Andrae, A.S.G.; Vaija, S.M.; Garcia, C.; Dechenaux, E. Effect of Modeling Approach on Climate Change Focused Life Cycle Assessments for a Contemporary Smartphone Device 2014. Available online: http://aran.library.nuigalway.ie/xmlui/handle/10379/4522 (accessed on 20 April 2017).
  26. Andrae, A.S.G. A review of methodological approaches for life cycle assessment (LCA) of consumer electronics. IEEE Consum. Electron. Mag. 2016, 5, 51–60. [Google Scholar] [CrossRef]
  27. International Telecommunication Union. L.Sup32: Supplement for Eco-Specifications and Rating Criteria for Mobile Phones Eco-Rating Programmes 2016. Available online: http://www.itu.int/rec/T-REC-L.Sup32-201610-I (accessed on 20 April 2017).
  28. Open Eco Rating. Available online: http://openecorating.com/ (accessed on 17 May 2017).
  29. Base IMPACTS®. Available online: http://www.base-impacts.ademe.fr/ (accessed on 2 August 2017).
  30. European Commission-Joint Research Centre. Recommendations Based on Existing Environmental Impact Assessment Models and Factors for Life Cycle Assessment in European Context. 2011. Available online: eplca.jrc.ec.europa.eu/uploads/ILCD-Recommendation-of-methods-for-LCIA-def.pdf (accessed on 20 April 2017).
  31. Ramos, S.; Larrinaga, L.; Albinarrate, U.; Jungbluth, N.; Ingolfsdottir, G.M.; Yngvadottir, E.; Landquist, B.; Woodhouse, A.; Olafsdottir, G.; Esturo, A.; et al. SENSE tool: Easy-to-use web-based tool to calculate food product environmental impact. Int. J. Life Cycle Assess. 2016, 21, 710–721. Available online: https://link.springer.com/content/pdf/10.1007%2Fs11367-015-0980-x.pdf (accessed on 20 April 2017). [CrossRef]
  32. Subramanian, V.; Ingwersen, W.; Hensler, C.; Collie, H. Comparing product category rules from different programs: Learned outcomes towards global alignment. Int. J. Life Cycle Assess. 2012, 17, 892–903. [Google Scholar] [CrossRef]
  33. Minkov, N.; Schneider, L.; Lehmann, A.; Finkbeiner, M. Type III environmental declaration programmes and harmonization of product category rules: Status quo and practical challenges. J. Clean. Product. 2015, 94, 235–246. [Google Scholar] [CrossRef]
  34. European Telecommunication Standards Institute. 2014. Available online: http://www.etsi.org/deliver/etsi_es/203100_203199/203199/01.02.01_60/es_203199v010201p.pdf (accessed on 20 April 2017).
  35. CODDE. EIME Base. Available online: https://codde.fr/en/our-software/eime-en/eime-base (accessed on 5 June 2017).
  36. Son, K.B.; Lee, D.S.; Lim, S.R. Effect of technology convergence for tablet PC on potential environmental impacts from heavy metals. Int. J. Sustain. Dev. World Ecol. 2016, 23, 154–162. [Google Scholar] [CrossRef]
  37. Van Oers, L.; Guinée, J. The Abiotic Depletion Potential: Background, Updates, and Future. Resources 2016, 5, 16. Available online: www.mdpi.com/2079-9276/5/1/16 (accessed on 28 May 2017). [CrossRef]
  38. Centrum voor Milieuwetenschappen. CML-IA Characterisation Factors. 2016. Available online: https://www.universiteitleiden.nl/en/research/research-output/science/cml-ia-characterisation-factors (accessed on 20 April 2017).
  39. GSM Arena. Available online: http://www.gsmarena.com/sony_xperia_z5-7534.php (accessed on 20 April 2017).
  40. GSM Arena. Available online: http://www.gsmarena.com/apple_iphone_7-8064.php (accessed on 20 April 2017).
  41. Ma, J.; Yin, F.; Liu, Z.; Zhou, X. The eco-design and green manufacturing of a refrigerator. Proc. Environ. Sci. 2012, 16, 522–529. [Google Scholar] [CrossRef]
  42. PEP Ecopassport Program. Available online: http://www.pep-ecopassport.org/fileadmin/webmaster-fichiers/version_anglaise/PEP-PCR-ed_2.1-EN-2012_12_11.pdf (accessed on 5 June 2017).
  43. Stratgraphics. Centurion—Version 16.1.05. Available online: http://www.statgraphics.com/centurion-xvii (accessed on 5 June 2017).
  44. Treeze. Life Cycle Inventories of Electricity Mixes and Grid—Version 1.3. Available online: http://esu-services.ch/fileadmin/download/publicLCI/itten-2012-electricity-mix.pdf (accessed on 5 June 2017).
  45. IC Insights. Global Wafer Capacity. Available online: http://www.icinsights.com/services/global-wafer-capacity/ (accessed on 5 June 2017).
  46. SystemPlus. Available online: http://www.systemplus.fr/available-reports/ (accessed on 5 June 2017).
  47. Andrae, A.S.G. Life Cycle Assessment of a Virtual Reality Device. Challenges 2017, 8, 15. [Google Scholar] [CrossRef]
  48. Manfredi, S.; Allacker, K.; Pelletier, N.; Schau, E.; Chomkhamsri, K.; Pant, R.; Pennington, D. Comparing the European Commission product environmental footprint method with other environmental accounting methods. Int. J. Life Cycle Assess. 2015, 20, 389–404. [Google Scholar] [CrossRef]
  49. Alcaraz Ochoa, M.D.L. Development of metrics for streamlined life cycle assessments: A case study on tablets, 2016. Available online: https://dspace.mit.edu/handle/1721.1/107098 (accessed on 20 April 2017).
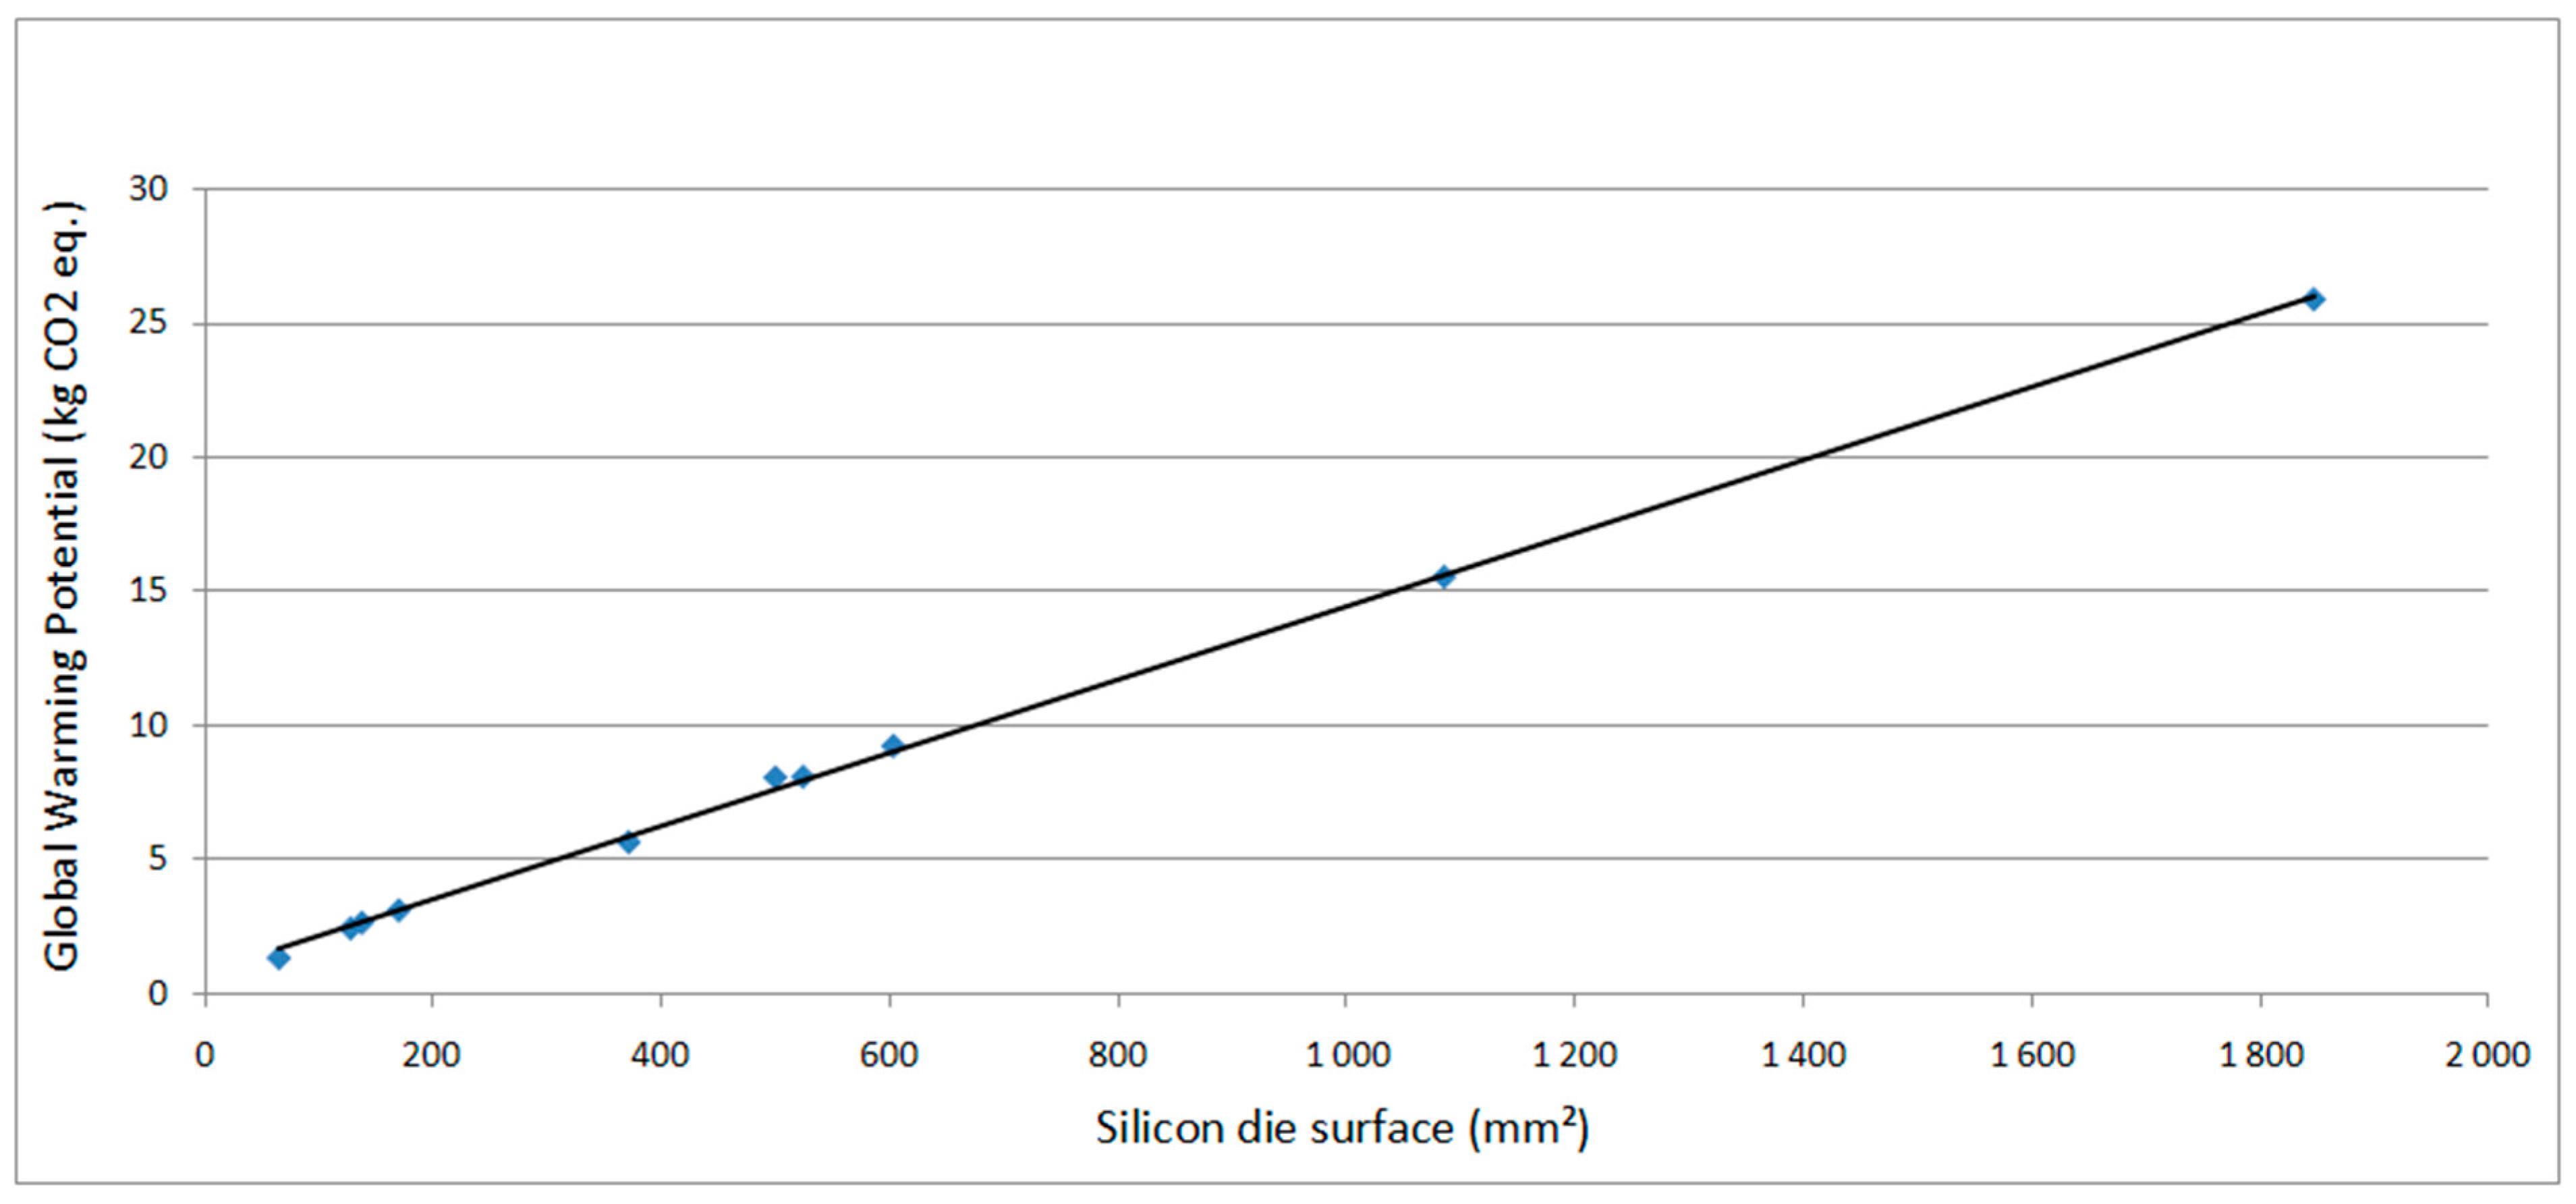
Figure 1. Silicon die surface (Siarea) used for the Global Warming Potential Indicator (GWPI) in OLCA.
Challenges 08 00021 g001
Figure 2. Assessment of the silicon die surface contained in the largest ICs with 50 mobile phones.
Challenges 08 00021 g002
Figure 3. GWPI results for ten different camera modules.
Challenges 08 00021 g003
Figure 4. GWPI details for each camera electronic module.
Challenges 08 00021 g004
Figure 5. Relationship between camera resolution and sensor surface.
Challenges 08 00021 g005
Figure 6. Examples of different complementary metal oxide semiconductor (CMOS) sensor sizes used in current mobile phone cameras.
Challenges 08 00021 g006
Figure 7. GWPI scores for FLCA of Phones A–E compared to OLCA.
Challenges 08 00021 g007
Figure 8. Repartition for FLCA and OLCA GWPI scores for Phone A.
Challenges 08 00021 g008
Figure 9. Repartition for FLCA and OLCA GWPI scores for Phone B.
Challenges 08 00021 g009
Figure 10. Repartition for FLCA and OLCA GWPI scores for Phones C–E.
Challenges 08 00021 g010
Figure 11. Repartition for ARDI for Phone A and tablet comparing FLCA and OLCA.
Challenges 08 00021 g011
Figure 12. Probability distribution for the OLCA GWPI score of Phone B.
Challenges 08 00021 g012
Table 1. Main characteristics of Full Life Cycle Assessment (FLCA) studies and Open Eco Rating LCA (OLCA) model.
FeatureFLCA of Phone A [13]FLCA of Phone B [14]FLCAs of Phones C–E [15]OLCA for All Phones
Life Cycle Assessment (LCA) conceptual modelAttributional LCA (ALCA)ALCAALCAALCA
Standard followedISO 14040 and ISO 14044, ETSI 203 199 [34]NoneISO 14040 and ISO 14044None (OLCA itself is however based on FLCAs following ISO 14040 and 14044 standards)
Number of midpoint indicators included12 {GWP100, ODP, HumToxCan, HumTox, PM, POCP, AP, EP fresh, EP terr, EcoTox, Water, ADP}5 {GWP100 ADP elements, ADP fossil, HumTox, EcoTox}1 {GWP100}2 {GWP100 and ADP}
Reference for midpoint indicatorsInternational Life Data System 2011 Midpoint + version 1.08 [30]CML 2001Intergovernmental Panel on Climate Change (IPCC)International Life Data System 2011 Midpoint + version 1.08 [30]
Functional unit“life time usage (3 years) of the smartphone device and its accessories for a representative usage scenario”“an intensive smartphone use over three years”“a three-year period for power use by first owners”“life time usage (2 years) of the smartphone device and its accessories for a representative usage scenario”
Temporal scope1 to 3 years3 years3 years2 years
Geographical scope, intended market for useGlobalEuropeGlobalGlobal
Life cycle scopeCradle-to-graveCradle-to-graveCradle-to-graveCradle-to-grave
Metal recycling creditedYesYesNoNo
Secondary data sourcesGaBi, ecoinventGaBi, ecoinventNot transparentEnvironmental Impact Made Easy (EIME©) [35].
Table 2. Comparison of studied product system for Phone A, B and the OLCA model of phones.
Main Unit ProcessFLCA of Phone AFLCA of Phone BFLCAs of Phone C–EOLCA for All Phones
Gold productionYes (ʹ)Yes (ʹ)Not transparent (N.T.)Yes (ʹ)
Screen productionʹʹN.T.ʹ
IC productionʹʹN.T.ʹ
Flexible Printed Circuit Board (PCB) productionʹʹN.T.ʹ
Rigid PCB productionʹʹN.Tʹ
Production of other electronic parts on the PCB Assemblies (PCBAs)ʹʹN.Tʹ
Camera productionʹʹN.T.ʹ
Plastics productionʹʹN.T.ʹ
Aluminum productionʹʹʹʹ
Steel productionʹʹN.T.ʹ
Battery productionʹʹN.Tʹ
Charger productionʹʹN.T.ʹ
Other Parts productionʹʹN.T.ʹ
Manual productionʹʹN.T.ʹ
Packaging productionʹʹN.T.ʹ
AssemblyʹʹN.T.ʹ
Distributionʹʹʹʹ
Useʹʹʹʹ
End-of-lifeʹʹʹʹ
Support activitiesʹNoN.T.No
Table 3. Average masses of metals in the tablet [36] used in OLCA for ARDI comparison.
Metal in TabletARDCML2013,total,j [kg Sb—eq.]Mass,CML2013,j [kg]ARDReCiPe,total,j [kg Fe—eq.]Mass,ReCiPe,j [kg]ARDEPS2000,total,j [ELU]Mass,EPS2000,j [kg]Average Mass, m a s s ¯ j , (kg)ARDILCD,factor,j [kg Sb—eq./kg] [38]ARDILCD,total,j Result [kg Sb—eq.]
Cr1.00 × 10−72.26 × 10−49.00 × 10−33.61 × 10−45.00 × 10−25.89 × 10−43.92 × 10−42.53 × 10−59.92 × 10−9
Au2.00 × 10−33.85 × 10−53.65.15 × 10−5655.46 × 10−54.82 × 10−5361.74 × 10−3
Co7.00 × 10−74.46 × 10−25.00 × 10−24.95 × 10−272.73 × 10−24.05 × 10−22.56 × 10−21.04 × 10−3
Cu1.00 × 10−47.30 × 10−21.533.58 × 10−2104.81 × 10−25.23 × 10−22.50 × 10−31.31 × 10⁻⁴
Fe2.00 × 10−103.82 × 10−35.00 × 10−35.00 × 10−35.00 × 10−35.20 × 10−34.67 × 10−31.67 × 10−67.78 × 10−9
Mo2.00 × 10−71.12 × 10−55.00 × 10−32.40 × 10−54.00 × 10−21.89 × 10−51.80 × 10−57.11 × 10−21.28 × 10−6
Ni6.00 × 10−89.45 × 10−48.00 × 10−36.40 × 10−41.00 × 10−16.25 × 10−47.37 × 10−44.18 × 10−33.08 × 10−6
Sn5.00 × 10−53.09 × 10−33.002.36 × 10−332.52 × 10−32.66 × 10−31.15 × 10−13.06 × 10−4
V3.00 × 10−123.90 × 10−63.00 × 10−45.36 × 10−64.63 × 10−64.93 × 10−32.28 × 10−8
Zn1.00 × 10−61.86 × 10−34.00 × 10−31.78 × 10−38.00 × 10−21.40 × 10−31.68 × 10−33.65 × 10−36.13 × 10−6
Li1.00 × 10−78.70 × 10−36.00 × 10−46.00 × 10−37.35 × 10−31.33 × 10−29.77 × 10−5
Mn1.00 × 10−93.94 × 10−44.00 × 10−25.22 × 10−45.00 × 10−38.87 × 10−46.01 × 10−42.35 × 10−51.41 × 10−8
Ti1.00 × 10−103.58 × 10−36.00 × 10−36.30 × 10−34.94 × 10−31.52 × 10−37.51 × 10−6
Ag2.00 × 10−41.69 × 10−47.00 × 10−22.45 × 10−49.51.76 × 10−41.97 × 10−48.421.66 × 10−3
Al1.00 × 10−109.17 × 10−22.00 × 10−32.22 × 10−29.00 × 10−32.05 × 10−24.48 × 10−22.53 × 10−51.13 × 10−6
Ba1.00 × 10−101.66 × 10−57.00 × 10−51.57 × 10−51.61 × 10−53.37 × 10−35.44 × 10−8
Pb5.00 × 10−77.89 × 10−58.00 × 10−34.57 × 10−56.23 × 10−51.50 × 10−29.34 × 10−7
TOTAL4.98 × 10−3
Table 4. Summary of product metrics useful for comparing the reliability of OLCA compared with FLCA.
Metric Essential in OLCA Identified in FLCA Reports and on GSM Arena Web SitePhone A [13]Phone B [14]Phones C–E [15]Tablet [36]
Length [cm], L14.6 [39]Not transparent (N.T.)13.83 [40]Not applicable (N.A.)
Width [cm], W7.2 [39]N.T.6.71 [40]N.A.
Screen-to-body ratio [%], STB69.6 [39]N.T.65.6 [40]N.A.
Screen area, ScreenA [cm2], L × W × STB73.2, UF = 1.0173.7 (p. 17 in [14]), UF = 1.0160.8N.A.
Printed Circuit Board (PCB) area, PCBA [cm2]N.T.125.3 (Table 3-6 in [14]), UF = 1.1N.T.N.A.
Silicon die area, Siarea [cm2]9.5 (p. 125 in [13]), UF = 1.13.94 (p. 27 in [14]), UF = 1.1N.T.N.A.
Not AND (NAND) flash memory capacity, SiNAND [GB]Not usedNot used32, 128 and 256 [15]N.A.
Camera resolution, Cam,res [MP]23 [39]8 (p. 21 in [14])12N.A.
Camera sensor size, Cam,sensize [inch, "], a fraction of an inch of the sensor size is used1/2.3" [39]N.T.1/3" [40]N.A.
Plastics mass, massPla [g]N.T.20 (p. 64 in [14]), UF = 1.17 [15]N.A.
Aluminium mass, massAlu [g]N.T.N.T.24 [15]N.A.
Steel mass, massSteel [g]N.T.2.99 (Tables 4–9 in [14]), UF = 1.123 [15]N.A.
Battery mass, massBat [g]N.T38 (Tables 3-1 [14]), UF = 1.0526 [15]N.A.
Charger mass, massCha [g]N.T.0 (p. 13 [14])N.T.N.A.
Others mass, massOth [g]N.T.112 (Tables 3-1 and 3-14 in [14]), UF = 1.16 [15]N.A.
Total mass, massTot = massCha + massPla + massAlu + massSteel massOth + massBat + massMan + massPack + [g]N.T.344 (Table 3-14 in [14]), UF = 1.1308 [15]N.A.
Manual mass, massMan [g]N.T.N.T.N.T.N.A.
Packaging materials mass, massPack [g]N.T171 (Table 3-10 in [14]), UF = 1.05170 [15]N.A.
Location of manufacturing siteAsiaAsiaN.T.N.A.
Location of distribution marketGlobalEuropeGlobalN.A.
Main mode of transportAirAirN.T.N.A.
Battery capacity, Batt,Cap [mAh]2900 [39], UF = 1.052420 (Table 3-11 in [14]), UF = 1.051960 [40]N.A.
Battery voltage, Batt,Vol [V]N.T.3.8 (Table 3-11 in [14]), UF = 1.01N.TN.A.
Charging frequency, ChaFre2 (=every other day Table III in [13]). 1 (=daily) is used in comparison with OLCA1 (Table 3-11 (=daily) in [14])N.T.N.A.
Lifetime [years], LT3 (Table III in [13]). 2 is used in the comparison with OLCA3 (Table 3-11 in [14]), 2 is used in the comparison with OLCA3 [15]. 2 is used in the comparison with OLCAN.A.
Abiotic Resource Depletion, International Life Data System 2011 Midpoint+ version 1.08 (ARDILCD,total [g Sb—eq.])2.0 (Figure 4 in [13])0.61 (Tables 4-3 to 4-8 in [14]). Note that a different ARDI is used in [14].N.T.4.98 see Table 2. (derived from Figure 3a–c in [36])
Table 5. CO2—eq. intensities and values used in FLCAs of Phones A and B and in OLCA.
Unit ProcessPhone A [13]Phone B [14]Phones C–E [15]OLCA
Screen production, I,ScreenA47.9 g/cm2 (Figure 3 {3500/73.2} in [13])39 g/cm2 (Table 4-3, p. 58, {2680/73} in [14])N.T.See more details in Supplementary Materials file Section 1
Gold production, I,AuNot transparent (N.T.)N.T.N.T.See more details in Supplementary Materials file Section 3
Integrated Circuit (IC) production, I,Siarea3.5 kg/cm2 “known good die” (page 127 in [13])5.4 kg/cm2 “die node 32 nm” (Table 3-8 in [14])N.T.I,Siarea (kg CO2—eq.) = (0.0202 × Siarea cm2) × 100) + 0.142, [UF {0.0202} = 1.1, UF {0.142} = 1.1] in Section 2.6.1
Flexible Printed Circuit Board (PCB) production, I,PCB,f,areaN.T.N.T.N.T.See more details in Supplementary Materials file Section 3
Rigid PCB production, I,PCB,r,areaN.T.25 g/cm2 (3.13 kg, {Table 4-4}/125.3 cm2 {Table 3-6} in [14])N.T.See more details in Supplementary Materials file Section 3
Production of other electronic parts than ICs located on the PCB Assemblies (PCBAs), I,PCBA,othN.T.N.T.N.T.Included in the IC production, See more details Section 2.6.1
Camera production, I,CamN.T.1709 g/g. (1.93 kg {Table 4-3} divided by, 1129 mg {p. 21} [14]) or 507 g/g. (1.93 kg {Table 4-3} divided by 3.8 g {Table 3-1} in [14]) Optical zoom and sensor size N.T.N.T.See more details in Section 2.6.2
Plastics production, I,PlastN.T.N.T.N.T.See more details in Supplementary Materials file Section 5
Aluminum production, I,AluN.T.N.T.N.T.See more details in Supplementary Materials file Section 5
Steel production, I,SteelN.T.N.T.N.T.See more details in Supplementary Materials file Section 5
Battery production, I,BattN.T51 g/g (Tables 4-3 and 3-1 in [14])N.T.See more details in Supplementary Materials file Section 5
Charger production, I,ChaN.T.N.A.N.T.I,Cha (kg CO2—eq.) = ((0.647 × 0.78) + (0.647 × 0.12 × ((massCha in grams − 35.6)/22.5)), [UF {0.647} = 1.1, UF {0.78} = 1.1, UF {0.12} = 1.1, UF {35.6} = 1.1, UF {22.5} = 1.1]. See more details in Supplementary Materials file Section 6
Other Parts production, I,OthN.T.N.T.N.T.See more details in Supplementary Materials file Section 7
Manual production, I,ManN.T.N.T.N.T.See more details in Supplementary Materials file Section 7
Packaging production, I,PackN.T.1.17 g/g. ([200 g {Table 4-5}/170 g {Table 3-10} in [14])N.T.49.8 + 0.737 × (massMan + massPack), [UF {49.8} = 1.1, UF {0.737} = 1.1]. See more details in Supplementary Materials file Section 7
Assembly, I,F.A.N.T.4810 g/phone (Table 4-3 in [14])N.T.See more details in Section 2.6.2
Distribution, I,DistN.T.N.T.N.T.See more details in Supplementary Materials file Section 8
Use, I,UseChaFre = 1ChaFre = 1N.T.BattCap × BattVol/1000 × 1/0.65 × 365/ChaFre × LT × 0.515; [UF {0.65} = 1.1, UF {0.515} = 1.1]. See more details in Supplementary Materials file Section 9
End-of-life, I,EoLTN.T.N.T.N.T.See more details in Supplementary Materials file Section 10
Support activities, I,SuppN.T.N.T.N.T.Not included (N.I.)
Table 6. Silicon wafer geographic distribution and modeling with the EIME© database.
Country, Region or Geographical Area≈Share (%) of IC Wafer DeliveryWafer Model Selected in EIME© Databases
South Korea20.61RER
Chinese Taipei20.5350% RER–50% CN
Japan18.88RER
North America14.32RER
Singapore & Malaysia9.5150% RER–50%
China8.95CN
Europe7.19RER