
Article

Transforming Development Metrics: Embedding Nature’s Value Through Gross Ecosystem Product (GEP) in India

by
Muniyandi Balasubramanian
Centre for Ecological Economics and Natural Resources, Institute for Social and Economic Change, Dr. VKRV Rao Road, Nagarabhavi, Bengaluru 560072, India
Challenges 2026, 17(3), 30; https://doi.org/10.3390/challe17030030 (registering DOI)
Submission received: 1 December 2025 / Revised: 14 August 2026 / Accepted: 18 August 2026 / Published: 28 August 2026
(This article belongs to the Section Biodiversity, Ecosystems, and Microbiomes)

Abstract

Planetary health recognizes that human health, well-being, and sustainable development depend fundamentally on the integrity of natural ecosystems that regulate climate, maintain biodiversity, secure food and water resources, and protect populations from environmental risks. As environmental degradation increasingly threatens this life-support system, there is a growing need for economic indicators that explicitly recognize the value of natural capital alongside conventional measures of development. Gross Ecosystem Product (GEP) has emerged as comprehensive metric for quantifying the monetary value of ecosystem services and informing evidence-based policy. This study estimates India’s GEP for the period 2011–2012 to 2020–2021 using an ecosystem accounting framework aligned with the System of Environmental Economic Accounting (SEEA). The analysis integrates provisioning services (timber, non-timber forest products, fuelwood, and fisheries), regulating services (carbon sequestration), and cultural services (nature-based tourism) using market price, replacement cost, and benefit transfer methods based on secondary data from national and published sources. India’s total GEP is estimated at US$207.05 billion, highlighting the substantial but under-recognized contribution of ecosystems to the national economy and societal well-being. Regulating services dominate GDP, with carbon sequestration alone accounting for US$166.73 billion, followed by provisioning services, while cultural services contribute a relatively smaller share. These findings reveal a significant gap between ecosystem contributions and their representation in conventional metrics such as Gross Domestic Product (GDP), underscoring the limitations of growth-centric development frameworks. By integrating ecosystem values into national accounting, GEP provides a practical tool for advancing planetary health, strengthening climate resilience, conserving biodiversity, supporting ecosystem-based management, and guiding policies that align economic development with ecological sustainability and long-term human well-being.

1. Introduction

Gross Ecosystem Product (GEP) refers to the aggregate monetary value of final ecosystem goods and services across various landscapes. Current economic performance indicators, such as Gross Domestic Product (GDP) and Human Development Index (HDI), largely fail to capture the value of ecosystem goods and services. Furthermore, the prevailing capitalism-driven model of economic growth and development has contributed to several ecological problems, including biodiversity loss, air and water pollution, climate change, and other related environmental challenges at local, national and global levels. Ecosystem goods and services make vital contributions to human well-being. In this regard, the Millennium Ecosystem Assessment, 2005, highlights the significance of the contributions of ecosystem services to human well-being, such as providing basic materials for a good life, good social relations, freedom of choice, security and health based on four major categories: provisioning services (food, water, and energy materials); regulating services (carbon sequestration, water quality regulation, pollination, and other related services); and cultural services (tourism, recreation, and religious services) [1,2]. Several ecosystem goods and services are not traded in the market due to lack of market prices or public goods characteristics [3]. Nature’s contribution to economic growth and development has not been fully recognized due to a lack of understanding of the importance of ecosystem services and local policymakers [2]. Further, the stock of ecosystem goods and flow of services have drastically declined due to loss of biodiversity, land use and land cover changes. The loss of biodiversity and ecosystem services is expected to impact the global gross domestic product by about 2.3 percent annually by 2030 [4].
The planetary health perspective provides an important conceptual basis for rethinking the relationship between economic development, ecosystems, and human well-being. It recognizes that human health and societal prosperity are closely connected to the capacity of Earth’s natural systems to sustain essential ecological functions [5]. From this perspective, economic performance cannot be assessed independently of the ecological systems that underpin human welfare and livelihoods. Conventional economic indicators therefore need to be complemented by measures that recognize nature’s contribution to human well-being and development [2]. Integrating GEP with planetary health can help make the economic dependence on ecosystems more visible in policy and development decisions. It also provides a basis for examining whether economic progress is compatible with maintaining the ecological foundations of human health and well-being. Such integration can strengthen the application of ecosystem accounting in support of sustainable health-oriented development pathways.
GEP can further contribute to sustainable planetary health by providing an economic basis for recognizing, monitoring, and protecting the ecological assets that underpin human well-being. GEP can help policymakers identify the trade-offs between economic activities and ecosystem integrity, support investment in ecosystem conservation and restoration, and promote development pathways that maintain the long-term capacity of nature to support healthy society. In this way, GEP can complement conventional economic indicators and provide a practical bridge between ecosystem health, human well-being and sustainable economic development [6,7].
Therefore, the value of ecosystem goods and services has been increasingly recognized in local policy decision-making processes since the 1990s, particularly following Costanza’s pioneering work on the valuation of natural capital across global biodiversity regions. In addition, several works have estimated the value of natural capital, for example [8,9], estimated the value of ecosystem services at US$ 33 trillion in 1997 and US$ 125, respectively, and other studies [10,11], have carried out similar estimations. At the national level, for example, Japan [12]; China [13]; India [14,15]; Australia [16]; Malaysia [17]; Brazil [18]; and Africa [19] have estimated the value of ecosystem services. Recent studies related to the accounting of ecosystem services include a global-level review [11]; accounting for forest ecosystem services in the USA [20], Finland [21], Norway [22], Spain [23], China [24], and Taiwan [25]; and water ecosystem accounting in Turkey [26]. Ecosystem accounting has been implemented in various countries at both national and sub-national levels—for example, it was implemented at the national level in Mexico, India, Uganda, the United Kingdom, Italy and Croatia; at the national and subnational levels in the United States, Canada, Australia, South Africa, Madagascar and Colombia; and at the subnational level in China, Peru, Spain and Norway [27].
In addition, GEP is a single matrix that includes all ecosystem goods and services contributing to the well-being of society. The concept of Gross Ecosystem Product was developed by the Chinese Academy of Sciences through the Natural Capital Project at Stanford University. Gross Ecosystem Product is defined as “economic value of ecosystem goods and services summarized in the single matrix” [6]. Further, ref. [28] define gross ecosystem product as “a measure of the aggregate monetary value of final ecosystem-related goods and services in a specific area and for a given accounting period." There are several works that have estimated GEP at the national and subnational levels. For example, China has conducted research on services in various landscapes, such as forest, water, and wetland ecosystem services. Ref. [29] calculated the gross ecosystem product for Chengdu, Kunming and Guiyang in China. This study compared gross domestic products and gross ecosystem products per km2, based on the basic hypothesis that high-biodiversity areas are positively correlated with high-gross ecosystem products, and high-gross domestic products are negatively correlated with gross ecosystem products in the study area. This study found that a high-biodiversity area positively correlated with a high level of gross ecosystem product, especially in Chengdu, Kunming and Nanning. In addition, this study found a high-level biodiversity, low-level gross ecosystem product, especially in the Hengduan and Daxue mountains. estimated the gross ecosystem product for Miyun County, China. The value of gross ecosystem products was estimated at 254 billion yuan, with respect to provisioning regulations and cultural services, based on the GEP aggregation method. GEP was calculated for various areas, such as Beijing (15%), Tianjin (14%), Tangshan (16%) and Cangzhou (11%).
Several initiatives have been undertaken in China to advance GEP accounting. GEP accounting has been extensively implemented at various sub-national levels, particularly for the protection and restoration of forests and other ecosystem services through diverse ecological compensation mechanisms [30,31]. In addition, ref. [32] noted China’s initiatives towards protecting and restoring the natural resource base through various policies. Furthermore, in China, several positive changes have been observed with respect to forest, wetlands, and grass ecosystem services; however, an imbalance still exists between ecological conservation and economic development [33]. Ecosystem accounting through GEP calculation has direct positive implications for human well-being [6,34,35,36] and gross ecosystem products can also help in the design of economic instruments such as Payment for Ecosystem Services (PES) for ecological conservation and restoration in China [6]. GEP calculation also helps promote ecological sustainability through green finance policies in China [37].
Gross Ecosystem Product (GEP) represents a shift from conventional production-based accounting toward an ecological–economic framework that integrates natural capital into development measurement. This complements GDP by capturing the monetary value of ecosystem services that remain excluded from traditional economic indicators. Theoretically, Gross Ecosystem Product (GEP) challenges the growth-centric development paradigm by recognizing ecological assets as fundamental components of national wealth. This aligns with ecological economics, which views the economy as embedded within and constrained by ecological systems. Gross Ecosystem Product extends national accounting by incorporating both market and non-market values of nature within a unified valuation framework. It provides a corrective to Gross Domestic Product by making visible the economic significance of ecosystem degradation and service loss. The framework supports a transition from flow-based accounting to stock-flow integrated approaches that emphasize natural capital. This is consistent with sustainability-oriented frameworks such as SEEA and inclusive wealth theory. Gross Ecosystem Product strengthens the conceptual basis for sustainable development by linking ecosystem integrity with long-term human well-being and resilience. Finally, it redefines development as a balanced interaction between economic growth, ecological sustainability, and intergenerational equity.
In the Indian context, several works have estimated the value of ecosystem services in various landscapes, such as forests, wetlands, water bodies, and other terrestrial areas. For example, ref. [38] estimated the value of forest ecosystem services in the Himalayan region; refs. [14,39,40] calculated the economic value of agroecosystem services in eastern India; ref. [41] estimated the economic value of different tiger reserves in India; refs. [42] calculated the economic value of Corbett tiger reserves; ref. [43] estimated the value of marine ecosystem services in India; and wetland ecosystem services and economic valuation were studied [44,45,46,47]. Ecosystem accounting calculations have been started through the Natural Capital and Valuation of Ecosystem Services (NCAVES), supported by the United Nations, such as ecosystem extent accounts, ecosystem condition accounts, supply and use accounts (food from cropland, timber from forests, non-timber forest products, carbon retention, and nature-based tourism), biodiversity thematic accounts, forest extent accounts, forest condition accounts, and forest ecosystem services [48].
Gross Ecosystem Product (GEP) calculation in India is in the initial stages; the previous section presents a detailed account of economic valuation, ecosystem accounting and implementation in India. Two studies have calculated gross ecosystem products: first, ref. [49] estimated gross environmental products for air, water, soil, and forest resources in Uttarakhand, based on the Monte Carlo simulation model. This study found that human interventions in air, forest, water and soil positively correlated with ecological growth. The policy implication of the study is that the calculation of GEP helps policymakers promote the sustainable utilization and effective management of ecological resources. The second study, the [50], was a pilot study in Karnataka using a partial implementation of the gross ecosystem product methodology. This study used various data related to provisioning services, regulating services, and cultural services, based on both the primary and secondary data from various agro-ecological regions of Karnataka. This study calculated the value of forest ecosystem services at 2841 billion and that of agricultural ecosystem services at 779 billion in Indian rupees, respectively, accounting for 18.1 percent of the state domestic product. This study also found that forest ecosystem services had declined by 35.4 % due to ecological degradation in Karnataka.
Why are Gross Ecosystem Product (GEP) calculations required for India? There are several reasons: First, due to economic growth, the stock of ecological resources has declined, and the cost of degradation has not been integrated into the policy-making [51]. Second, climate change has had negative impacts on socio-economic and ecological well-being. For instance, more than 700 million people live in rural India, and most of them are directly and indirectly dependent on climate-sensitive sectors, such as agriculture, forestry, and fisheries, as major sources of livelihood. Low-income and vulnerable households remain adversely affected due to climate change [52,53] Third, considerable loss of natural capital negatively impacts human well-being. Fourth, financial mechanisms such as payment for ecosystem services are urgently required for the conservation of nature and the livelihood of the local communities. Planetary health recognizes that the health and well-being of present and future generations are inseparable from the health of the Earth’s natural systems. Healthy ecosystems provide essential life-support functions by regulating climate, conserving biodiversity, maintaining clean air and water, supporting food production, and reducing exposure to environmental hazards. However, accelerating ecosystem degradation, biodiversity loss, climate change, land-use change, pollution, and the depletion of natural capital are increasingly undermining these ecological functions, threatening human health, livelihood, economic resilience, and social equity worldwide. These interconnected environmental challenges disproportionately affect vulnerable populations that depend directly on ecosystem services for food, fuel, water, income and cultural identity, while also reducing the capacity of ecosystems to mitigate climate change and support sustainable development. From a planetary perspective, protecting and restoring natural capital is therefore not only an environmental priority but also a public health, economic, and integrational equity imperative. Recognizing and accounting for the economic contributions of ecosystems has consequently become central to informing policies that balance economic growth with ecological sustainability and human well-being.
This paper provides a detailed account of the gross ecosystem products in India and is structured as follows: the Section 2 outlines the materials and methods used, including data, indicators and methods of analysis; Section 3 presents the results and a discussion of various ecosystem service values and aggregate methods at the national level, including all states; Section 4 presents and discusses the conclusions, implications, and limitations of the study.

2. Material and Methods

2.1. Study Area

India is endowed with rich biological diversity, from the Himalayas, which spread across 13 Indian states, such as Jammu and Kashmir, Manipur, Arunachal Pradesh, Uttarakhand, Ladakh, Himachal Pradesh, Sikkim, Tripura, West Bengal, and Meghalaya, to the Western Ghats, spread over 1500 km across six states, including Gujarat, Goa, Maharashtra, Karnataka, Kerala, and Tamil Nadu. Indo-Burma is located in the Bay of Bengal, Andaman Sea region and Sundaland. In addition, India is home to many flora and fauna, with 91,200 animal species and 45,000 plant species. Furthermore, India exhibits different types of ecosystem landscapes, such as forest (23.39%), wetlands (4.7%), grasslands (24%), coastal areas (7517 km), mangroves (4445 km2), and desert (4.56%), with an average annual temperature of 26.90C and rainfall of 119 cm [54]. As per a recent study, the total economic value of terrestrial ecosystem services amounts to US$ 1.8 trillion/year [55].

2.2. Data Sources

This study attempts to estimate the gross ecosystem products for provisioning services, regulating services and cultural services (Table 1). The data from various sources obtained for the period 2011–12 to 2020–21 for gross ecosystem products of India relates to provisioning services, especially timber products, non-timber forest products, fish provisioning services, regulating services such as carbon retention, and cultural services, such as nature-based tourism.

2.3. Provisioning Services

Timber, Non-Timber Forest and Firewood Products

The Gross Value Added (GVA) for timber provisioning services (e.g., rosewood, jungle wood, and teakwood) and non-timber forest products (NTFPs), including food materials (such as fish), fuel, medicinal plants, fiber, biochemicals, and products derived from other sources, is estimated by the Central Statistical Office (CSO), Ministry of Statistics and Programme Implementation (MoSPI), in the Forestry and Logging sector using the production approach. The production of timber and price details were provided by the state forest department. The value of timber and non-timber forest products was estimated as “Value of services = forest rent/gross value of output X value of timber output and non-timber forest products” [48]. Firewood data was obtained from the National Sample Survey Organization’s (NSSO) 68th round, based on firewood utilization by population and data related to firewood used for industrial purposes, from the Annual Survey of Industry (ASI), and price details from the Directorate of Economics and Statistics for all the states in India. This study used a constant price (2011–12) for estimating the value of firewood in the development of gross ecosystem products in India. The calculation method is presented in the following formula: value of output (total value of firewood at base year (2011–12) price minus value of agricultural byproducts used as firewood at base year (2011–12) price ∗ 1.0764) [56].

2.4. Fish Production

This study used the value of marine and inland fish for provisioning services when estimating the gross ecosystem product of India. The data was obtained from the Department of Animal Husbandry and Dairying from 2011–12 to 2020–21. Fish production data and price details were obtained from the Directorate of Economics of Statistics from all the state governments. Further, the value of fish-provisioning services was calculated based on the following formula: value of output = quantity of fish sold in raw form ∗ at base year price (2011–12) plus quantity of salted fish sold ∗ at base year (2011–12) price plus the quantity of sundried fish ∗ based year (2011–12) price plus the quantity of fish kept in deep freeze let in for freezing ∗ base year (2011–12) price [56].

2.5. Regulating Services

Carbon Retention

The value of carbon retention was estimated for only three years: 2015–16, 2017–18 and 2019–20 based on data obtained from the India State Forest Report, Forest Survey of India. The economic value of carbon retention is estimated based on the following formula: first, estimate the total carbon stock = above-ground-level biomass plus below-ground-level biomass plus dead wood plus litter plus soil organic carbon (data obtained from India state forest report); second, calculate the carbon stock = carbon content ∗ 3.67 based on the IPCC conventions (data obtained from previous research [57] estimates for India per ton of social cost of carbon US$ 86 for the year 2017–18). Finally, the economic value of carbon stock in Indian rupee is equivalent to the value of carbon stock in the US$ exchange rate (based on a constant price exchange rate for the base year 2011–12.

2.6. Nature-Based Tourism

The economic value of nature-based tourism is estimated based on direct expenditure method data taken from annual tourism statistics publications from the Ministry of Tourism for the calendar years from 2011 to 2018. The direct expenditure method estimates based on average expenditure per person per day/on a trip, including the duration of stay, the number of total visitors and their expenditure per person per day multiplied by average length of day multiplied by the total number of visitors [50]. The value of tourism is estimated using a two-step approach. First, the average expenditure per person per tourism visit is derived from the Domestic Tourism Survey conducted by the Ministry of Statistics and Programme Implementation (MoSPI), which provides expenditure estimates for different travel purposes, including leisure and recreation, pilgrimage, and religious tourism. Second, the total number of domestic and foreign tourists visits to destinations across all states is obtained from statistics published by the Ministry of Tourism. The tourism value is then estimated by combining the average expenditure per visit with the corresponding number of tourists visits. Provisioning services such as timber, non-timber forest products, and fisheries are valued using the market price method for spatial aggregation at the national level. Regulating services, particularly carbon sequestration, are estimated using the social cost of carbon and avoided damage cost approaches, with unit carbon values derived from published global benchmarks. Cultural services, including nature-based tourism, are valued using expenditure-based proxy methods, assuming that tourism expenditure reflects the minimum willingness to pay for ecosystem access. These assumptions are now more explicitly stated in the revised manuscript to ensure analytical transparency. In addition, we clarified the treatment of temporal price adjustments and currency standardization. All monetary values are converted into constant 2020–21 prices using the national GDP deflator, while inter-temporal comparability is maintained through the application of consistent inflation-adjusted price series across the study period (2011–12 to 2020–21). Conversion to U.S. dollars was based on the official annual average exchange rates published by the Reserve Bank of India to ensure international comparability. Furthermore, in response to the reviewer’s recommendation, we included a consolidated methodological summary that presents the ecosystem service categories, biophysical indicators, valuation methods, and data sources, as well as the price base year and deflators used. This addition significantly enhances the clarity, transparency, and reproducibility of the Gross Ecosystem Product (GEP) estimation framework.

2.7. Gross Ecosystem Product Calculation

Gross ecosystem products are estimated based on the value of various types of ecosystem services, for example, provisioning services, regulating services, and cultural services, and finally aggregates the value based on the current price method. The present study calculates GEP, based on data obtained from the Ministry of Statistics and Program Implementation (MoSPI) for various government departments from all the states in India. For example, provisioning services data was collected from all the state governments, including the quantity of output along with the price of timber, non-timber, and firewood production. The data related to regulating ecosystem services, especially carbon retention, was collected from the Forest Survey of India. Further, biomass was converted to carbon stock for various forest types in India. The economic value of carbon sequestration was calculated based on the social cost of carbon estimates based on the work of [57]. The data related to the value of nature-based tourism was obtained from the Ministry of Statistics and Program Implementation. Finally, we aggregated the value of all ecosystem services, including timber, non-timber forest products, firewood production, carbon retention and nature-based tourism. This study used the following formula:
GEP = EPV + ERV + ECV
The previous literature followed the same method, such as that of [6,37] who calculated the gross ecosystem products for China. In addition, many other studies followed the same method, for instance [35,37,58,59,60].

Top of Form

This study represents a partial Gross Ecosystem Product (GEP) assessment rather than a fully comprehensive national ecosystem account. The selection of ecosystem services was primarily guided by data availability, methodological robustness, and the consistency of datasets across the study period (2011–12 to 2020–21). Accordingly, the estimated GEP values should be interpreted as a policy-relevant approximation capturing key ecosystem services for which reliable and nationally consistent data are available. To improve transparency, we added a detailed explanation in the Methods section, stating that provisioning, regulating, and cultural services were selected based on three major considerations: the availability of long-term national datasets, the existence of relatively well-established valuation methodologies with lower uncertainty, and their direct policy relevance in the Indian context, particularly with respect to forestry, livelihoods, climate mitigation, and tourism. These services also represent high-value and policy-sensitive ecosystem contributions and serve as practical entry points for developing a scalable national GEP framework. Furthermore, we expanded the discussion to clarify that the current GEP estimates are conservative and likely underestimate the total economic value of ecosystem services in India. The exclusion of several regulating and cultural services may bias the results toward market-visible or more easily quantifiable ecosystem contributions, while many cultural and non-market ecosystem values remain systematically undervalued due to measurement limitations. To strengthen the conceptual contributions of this study, we reframed the analysis not merely as a data-constrained exercise, but as a foundational and replicable framework for national-level GEP accounting that can be progressively expanded as ecological datasets and valuation methodologies improve.

3. Results

3.1. Results

Timber and Non-Timber Forest Products Plus Firewood

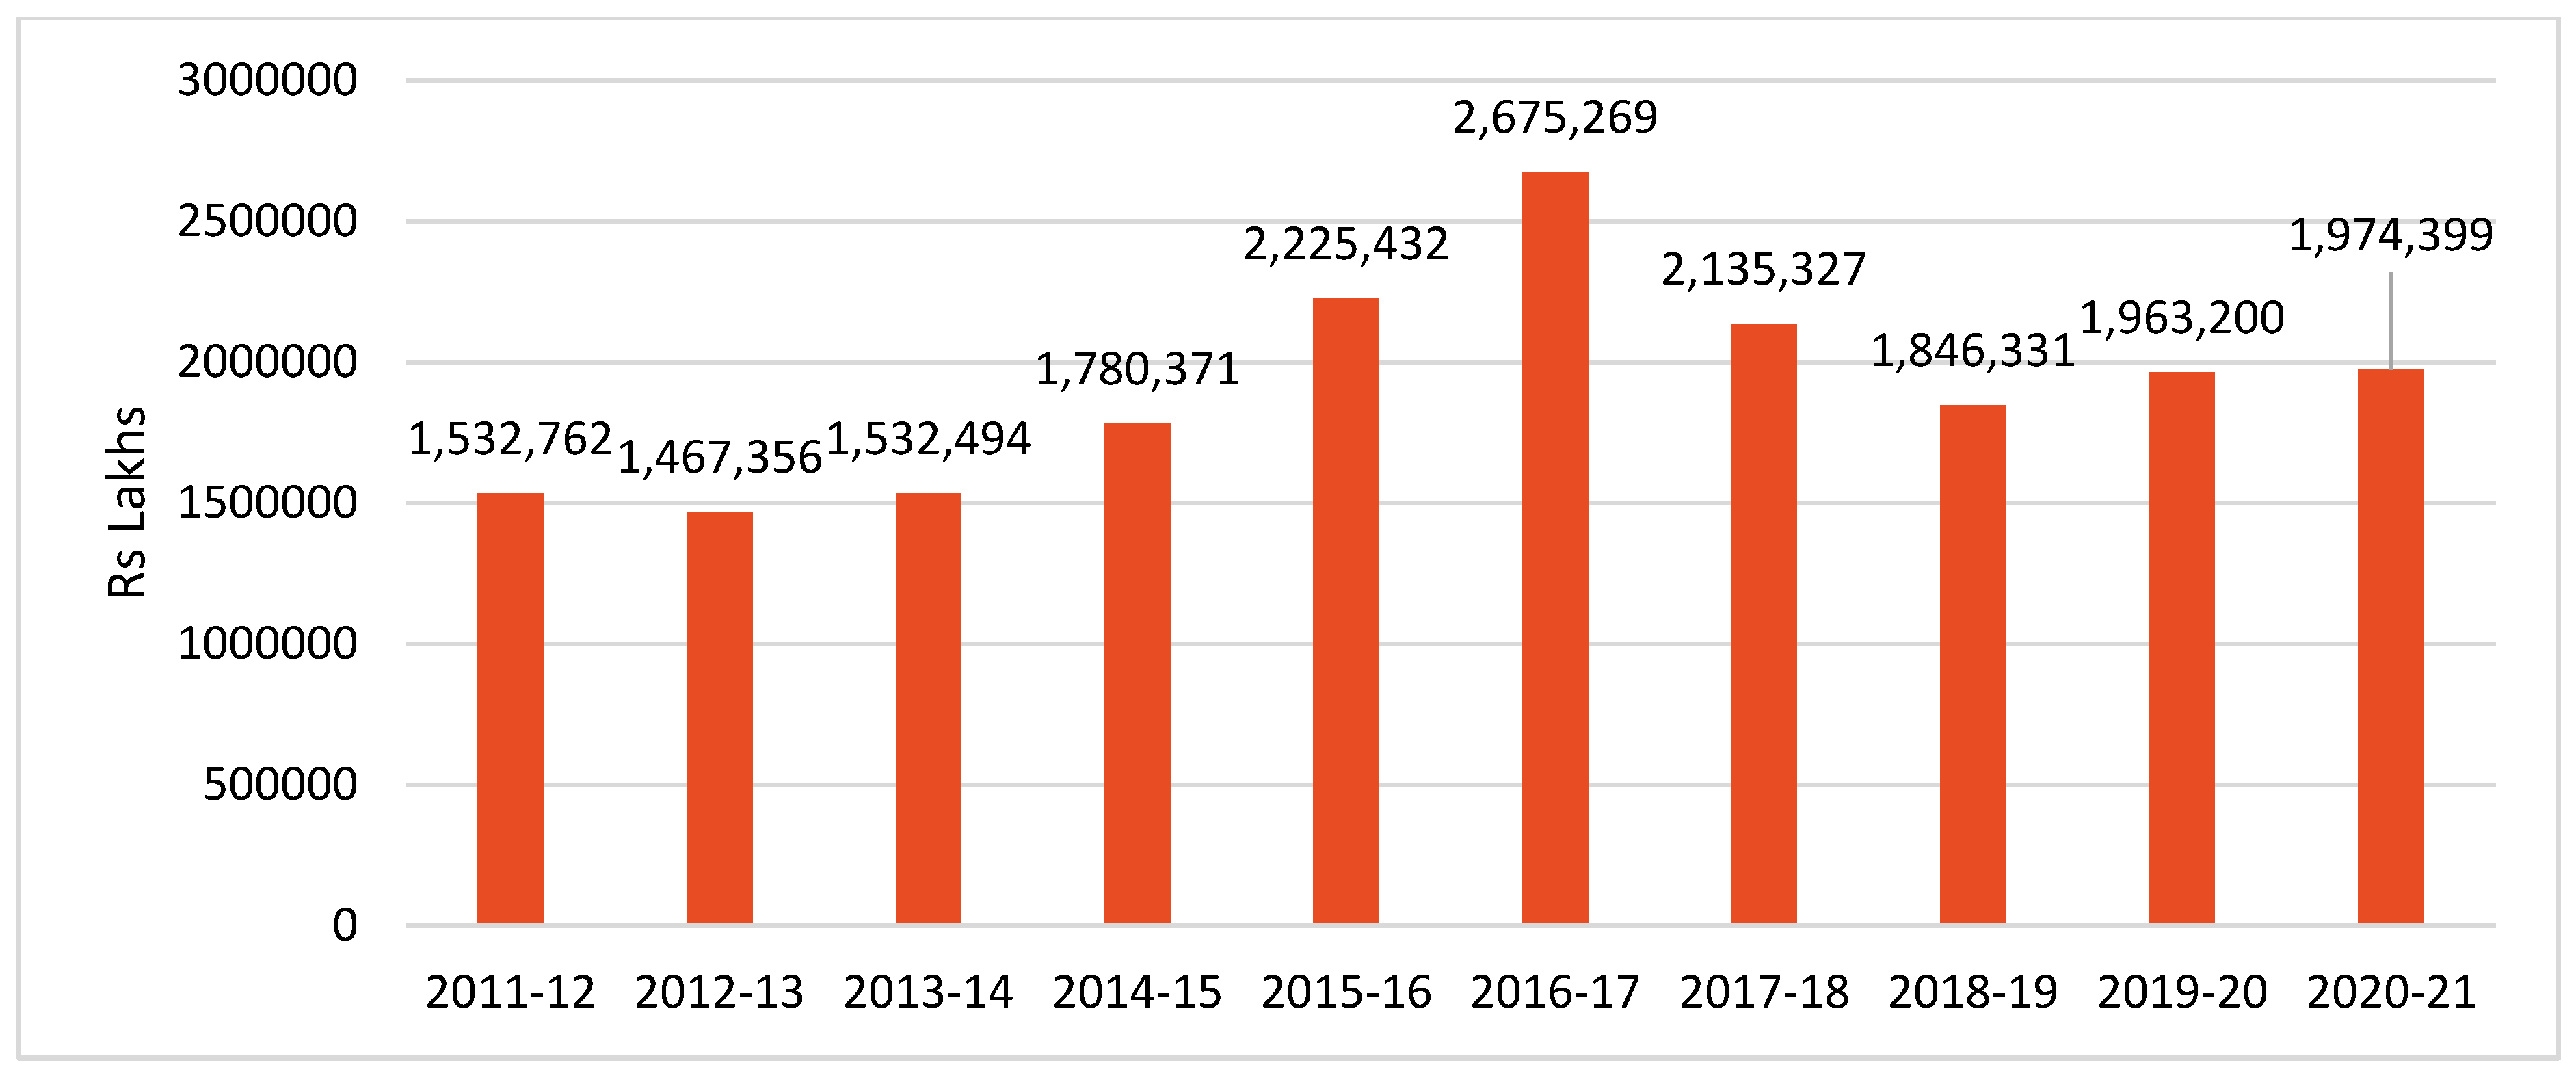
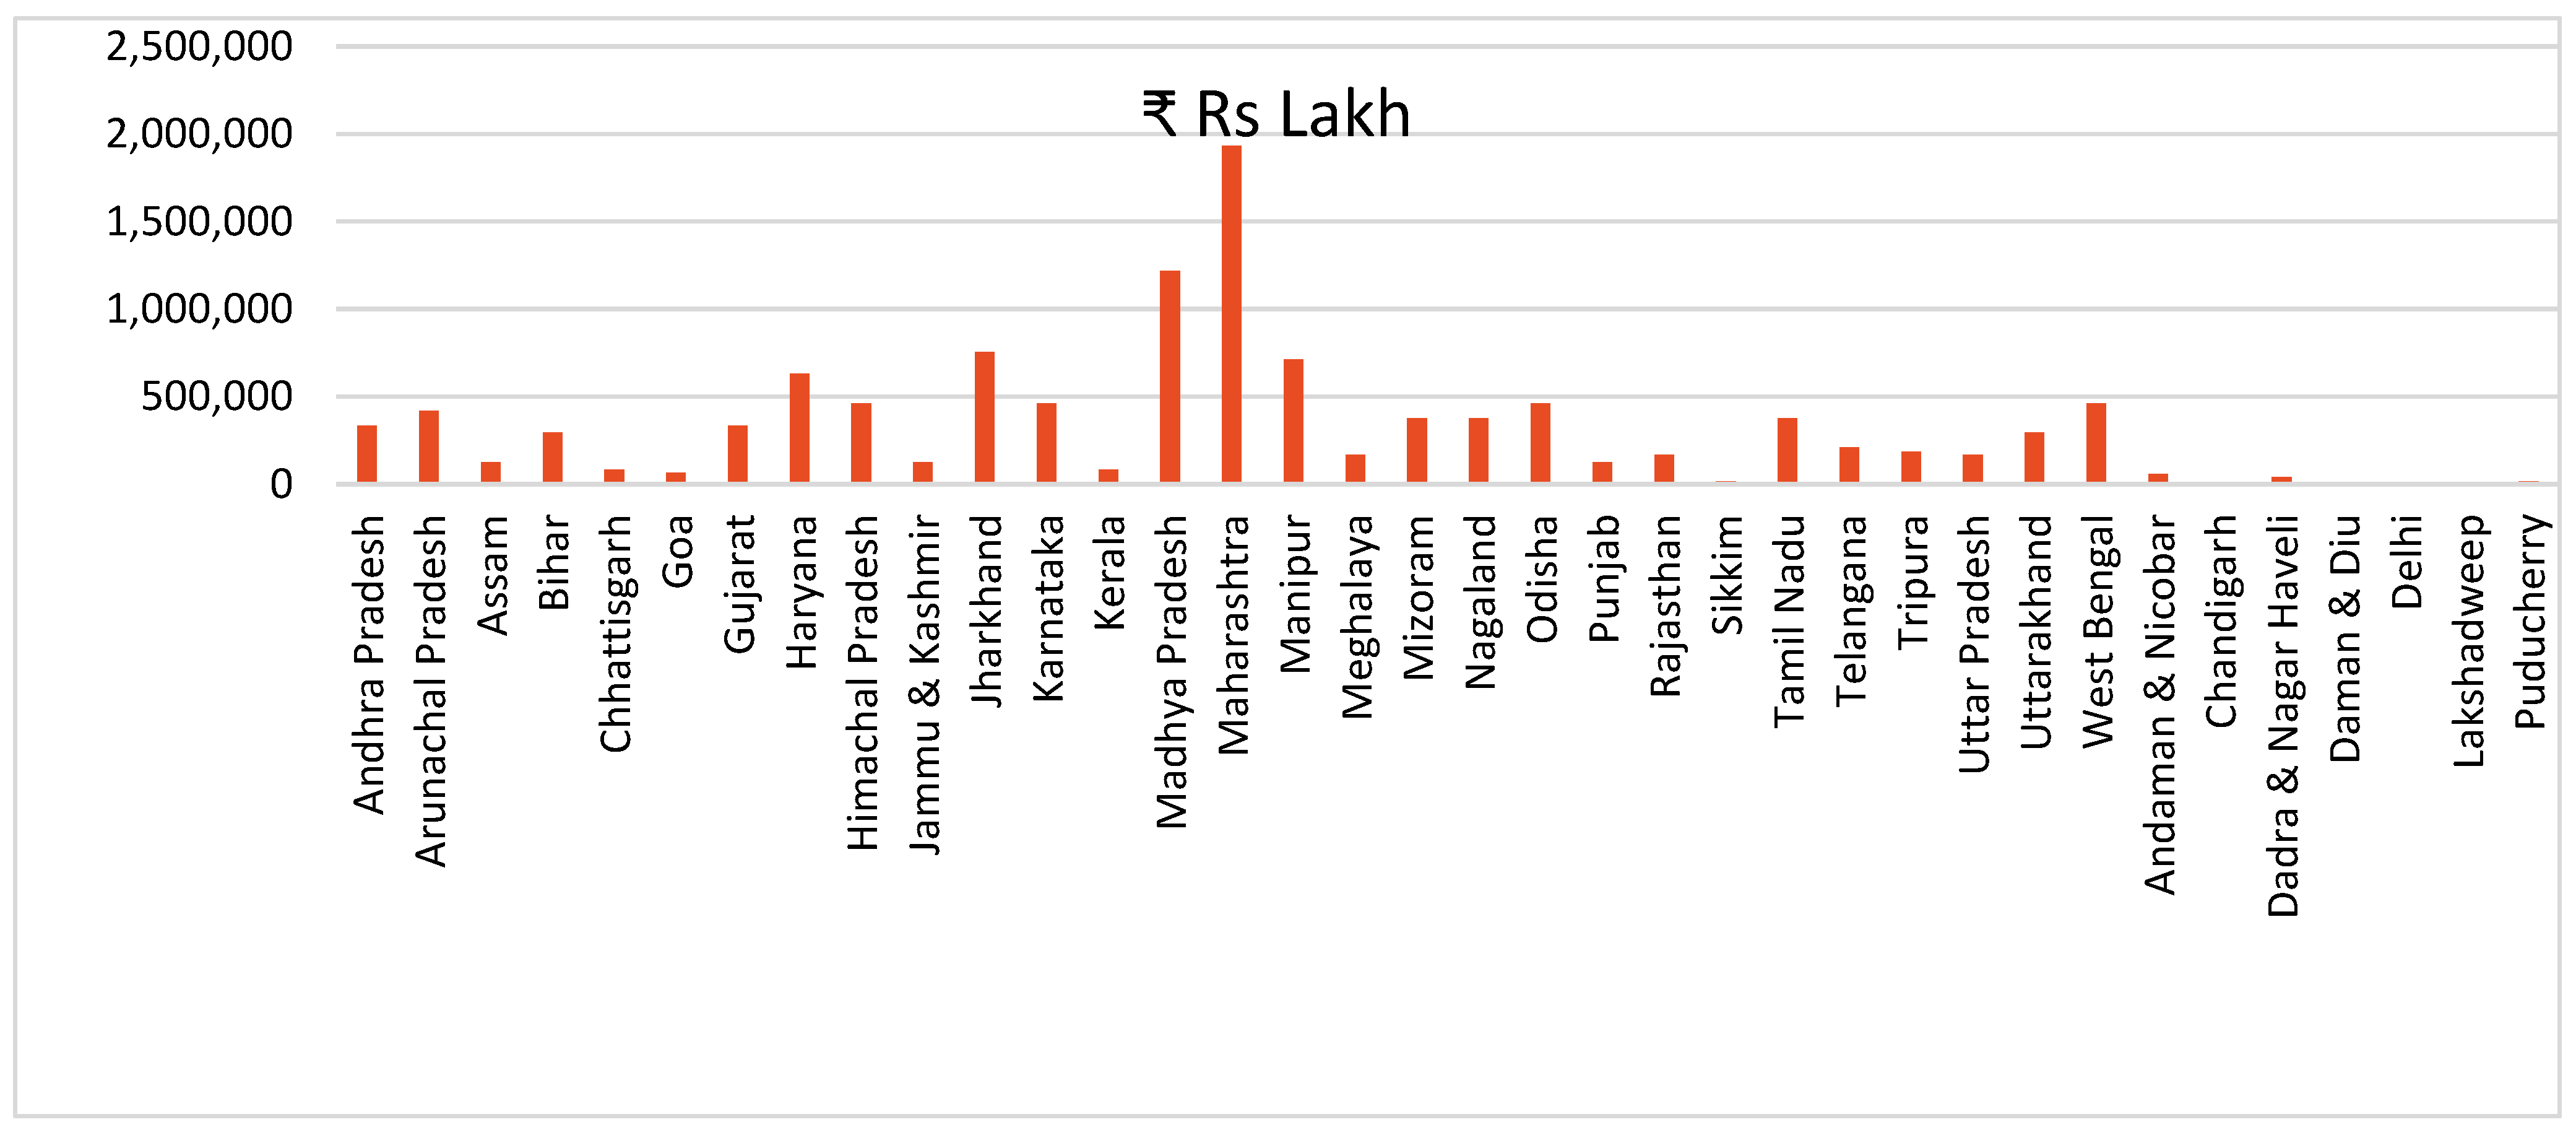
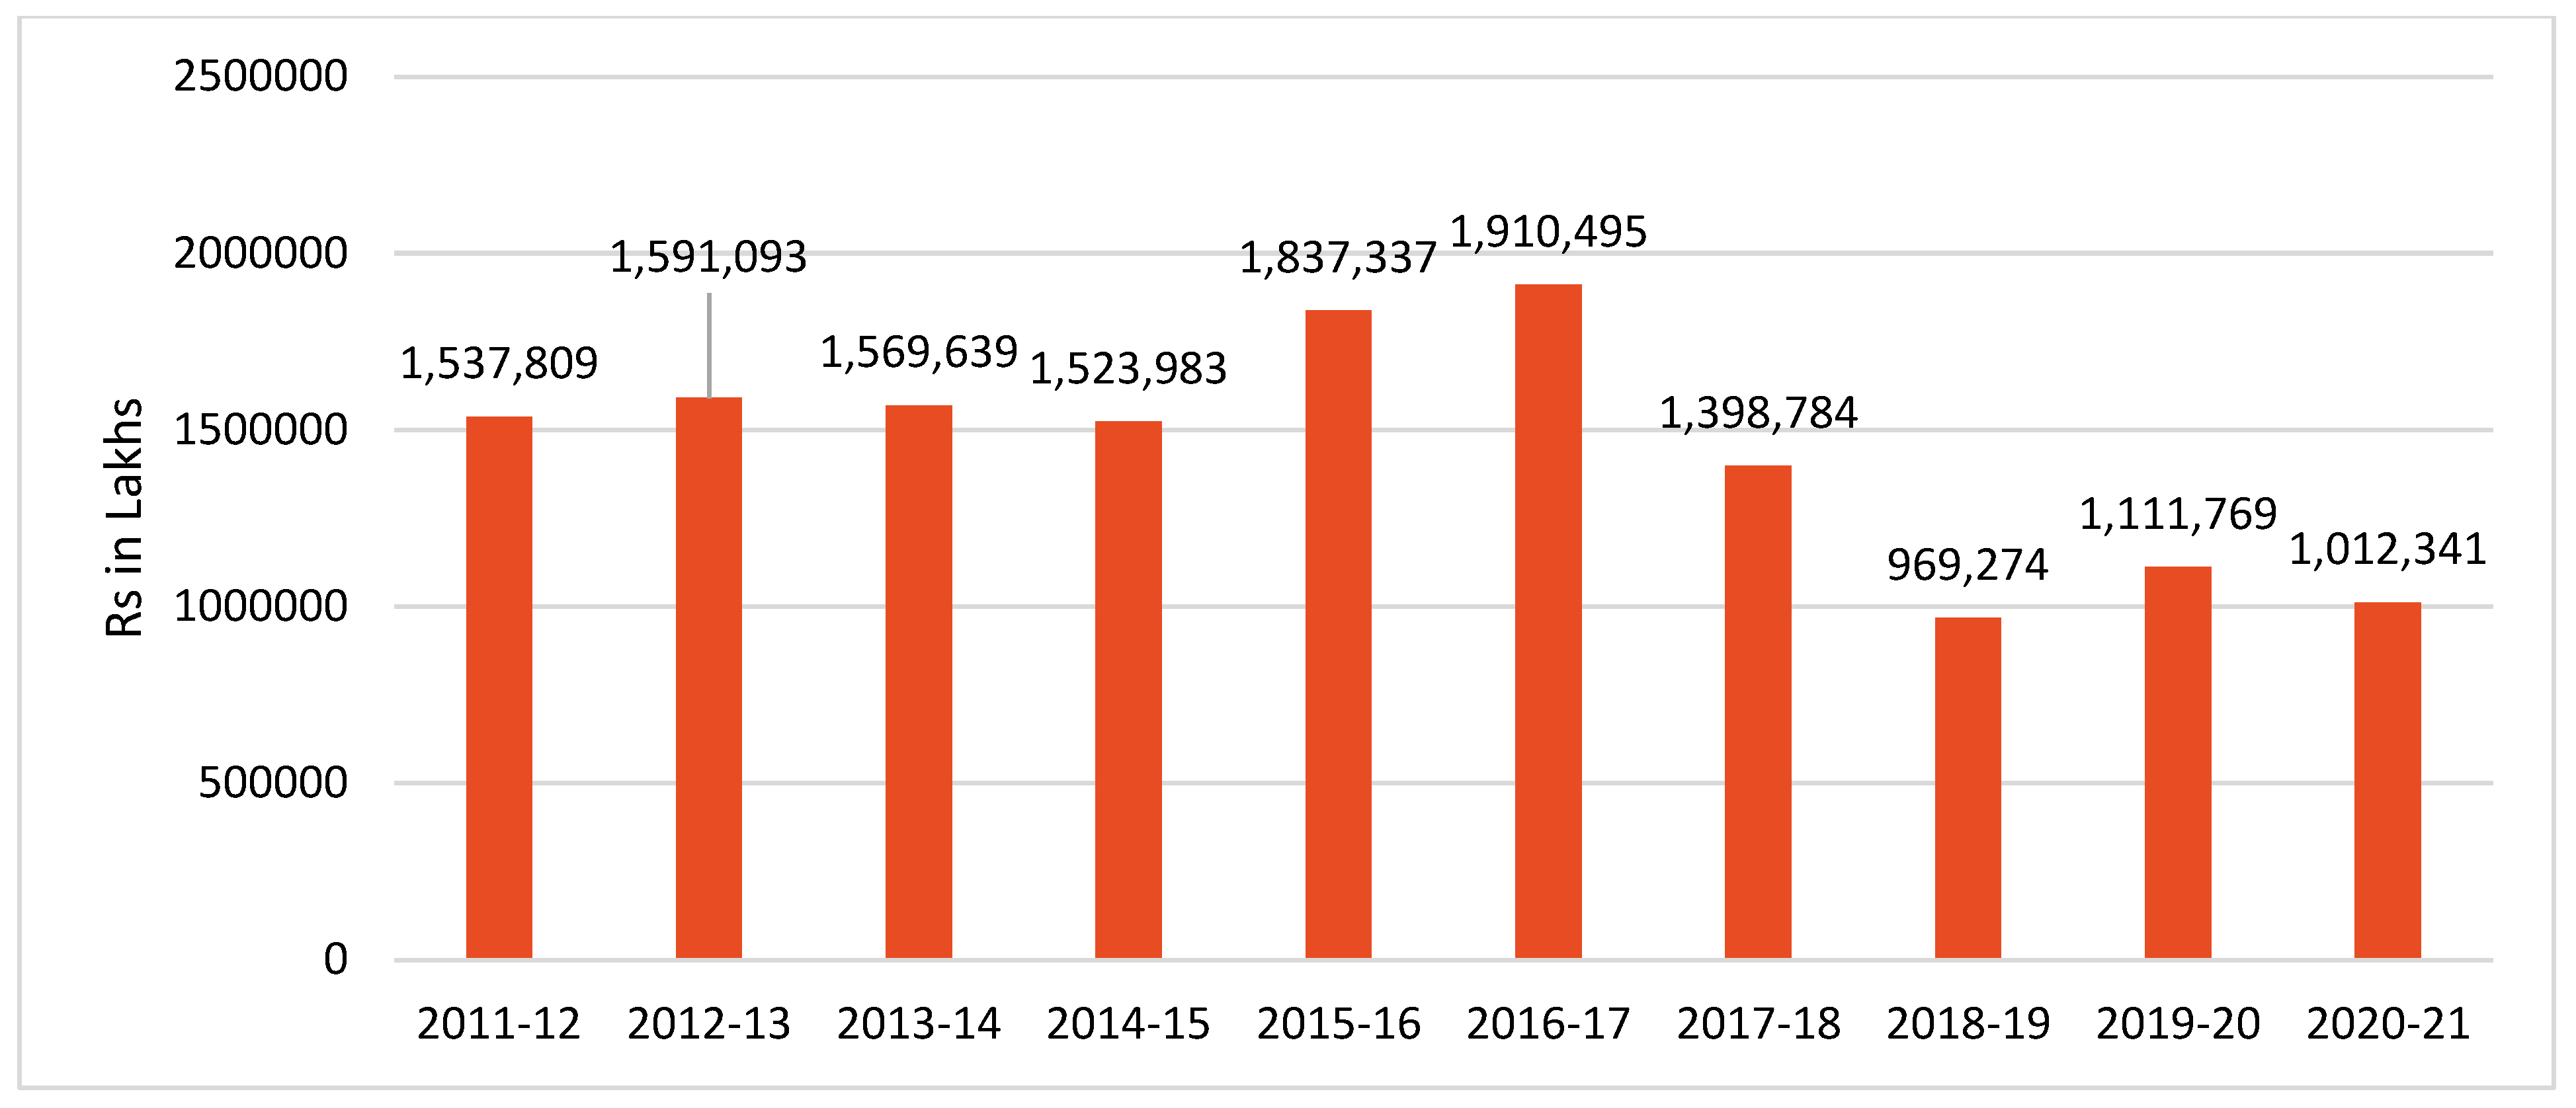
Figure 1 presents the value of timber provisioning services for various states in India. Timber provisioning services include the forests and trees in the area during the study period. The state of Maharashtra accounts for the highest share, at US$ 2306 million (located in the Western Ghats states), followed by Madhya Pradesh (US$ 1436 million), which is the state with the highest forest cover in India. Both states contribute the most economic value to timber provisioning services. In addition, other western Ghats states, such as Gujarat (US$ 408.9 million), Goa (US$ 80.2 million), Karnataka (US$ 577.5 million), Kerala (US$ 103.3 million), and Tamil Nadu (US$ 443.9 million), contribute to the value of timber provisioning services in India. Further, northeastern states, such as Arunachal Pradesh (US$ 511.2 million), Himachal Pradesh (US$ 570.3 million), and Manipur (US$ 848.8 million), contribute to the value of timber provisioning services in India. The total value of timber provisioning services from 2011–12 to 2020–21 has been estimated at Rs 1913 billion (US$ 22.78 billion) (see Figure 2). The total value of timber provisioning services has increased significantly for various socio-economic reasons, such as the growth in the building and construction sectors and other forms of economic development in India.
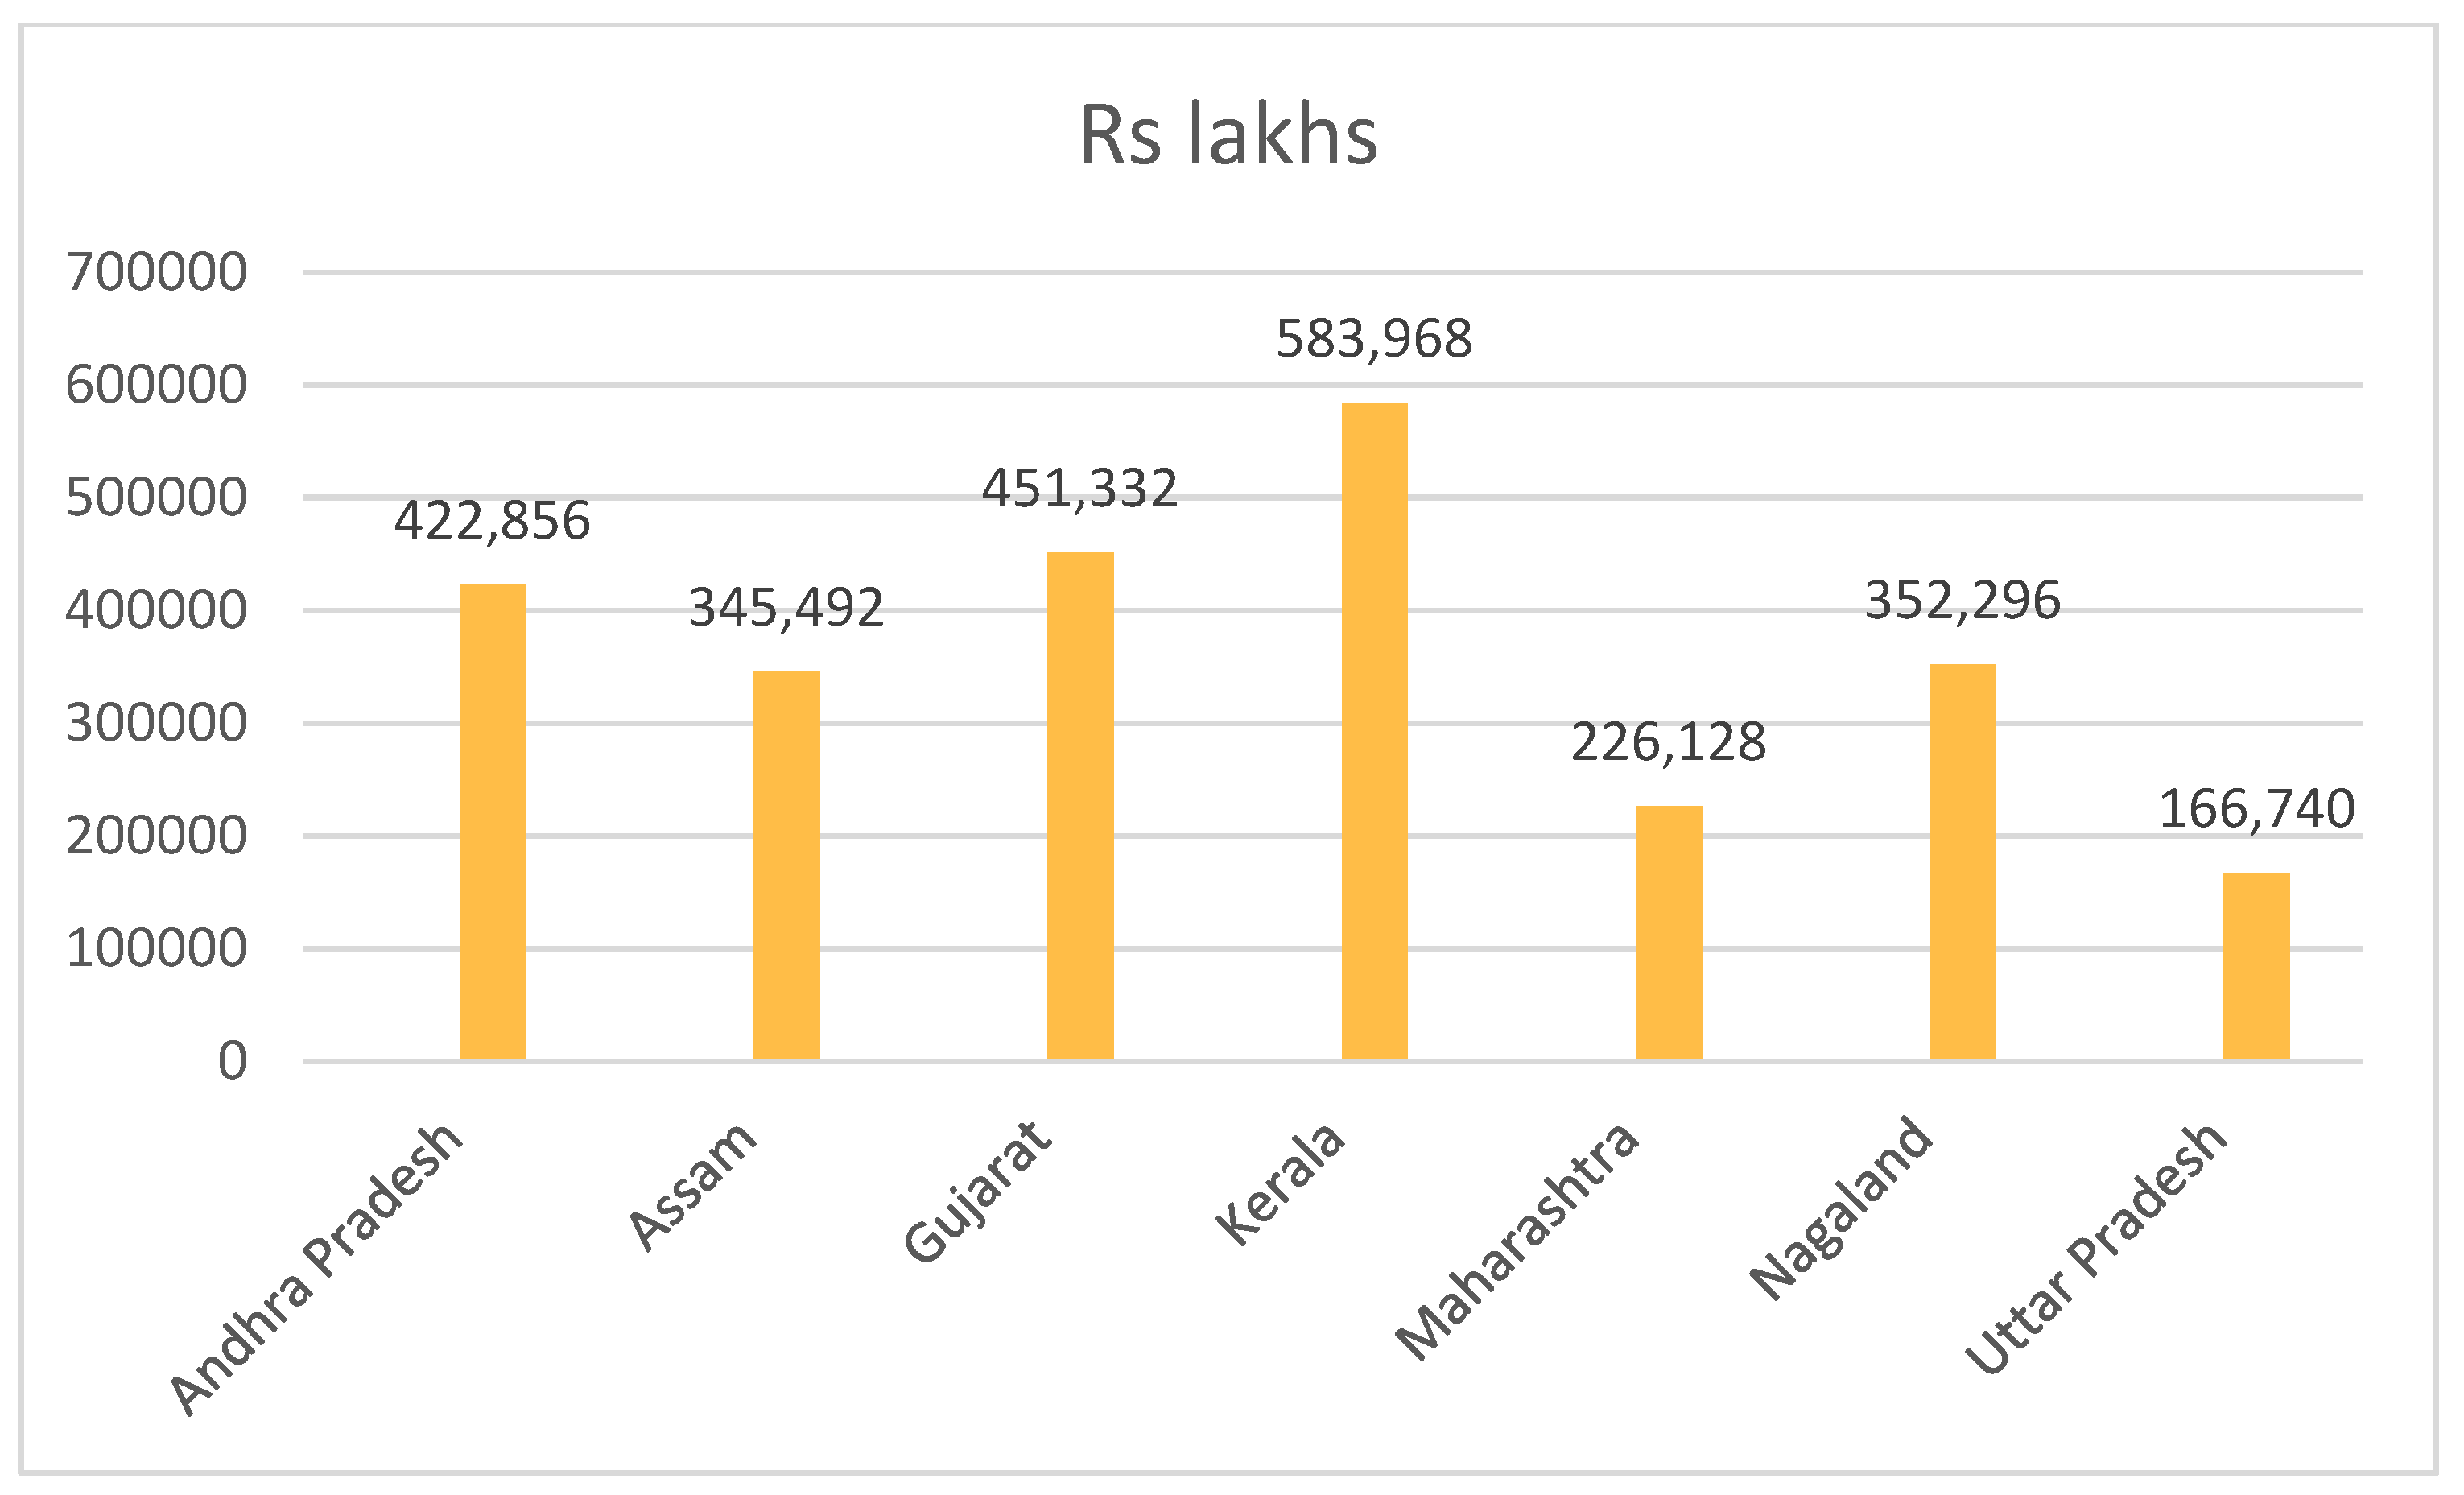
Figure 3 explains the value of non-timber forest products for all the states in India. According to the Ministry of Statistics and Program Implementation (MoSPI) data, Maharashtra accounts for highest share, at US$ 3872 million, followed by Madhya Pradesh (US$ 1391.8 million), for non-timber forest products. The Indian state of Madhya Pradesh produces a high rate of minor forest products, including medicinal plants, nuts, fish, vegetables, fruits, resins, as compared to other states. In addition, most of the northeastern states, such as Arunachal Pradesh (US$ 942.4 million) and Meghalaya (US$ 496 million), significantly contribute to the production of minor forest products. Further, Figure 4 presents the economic value of non-timber forest products (NTFPs) in India. The total value of NTFPs was estimated at US$1,446.78 million for the period from 2011–12 to 2020–21. Figure 5 presents the economic value of fish provisioning services, with the total value estimated at Rs 11.65 billion during the same period (2011–12 to 2020–21).

3.2. Value of Carbon Retention

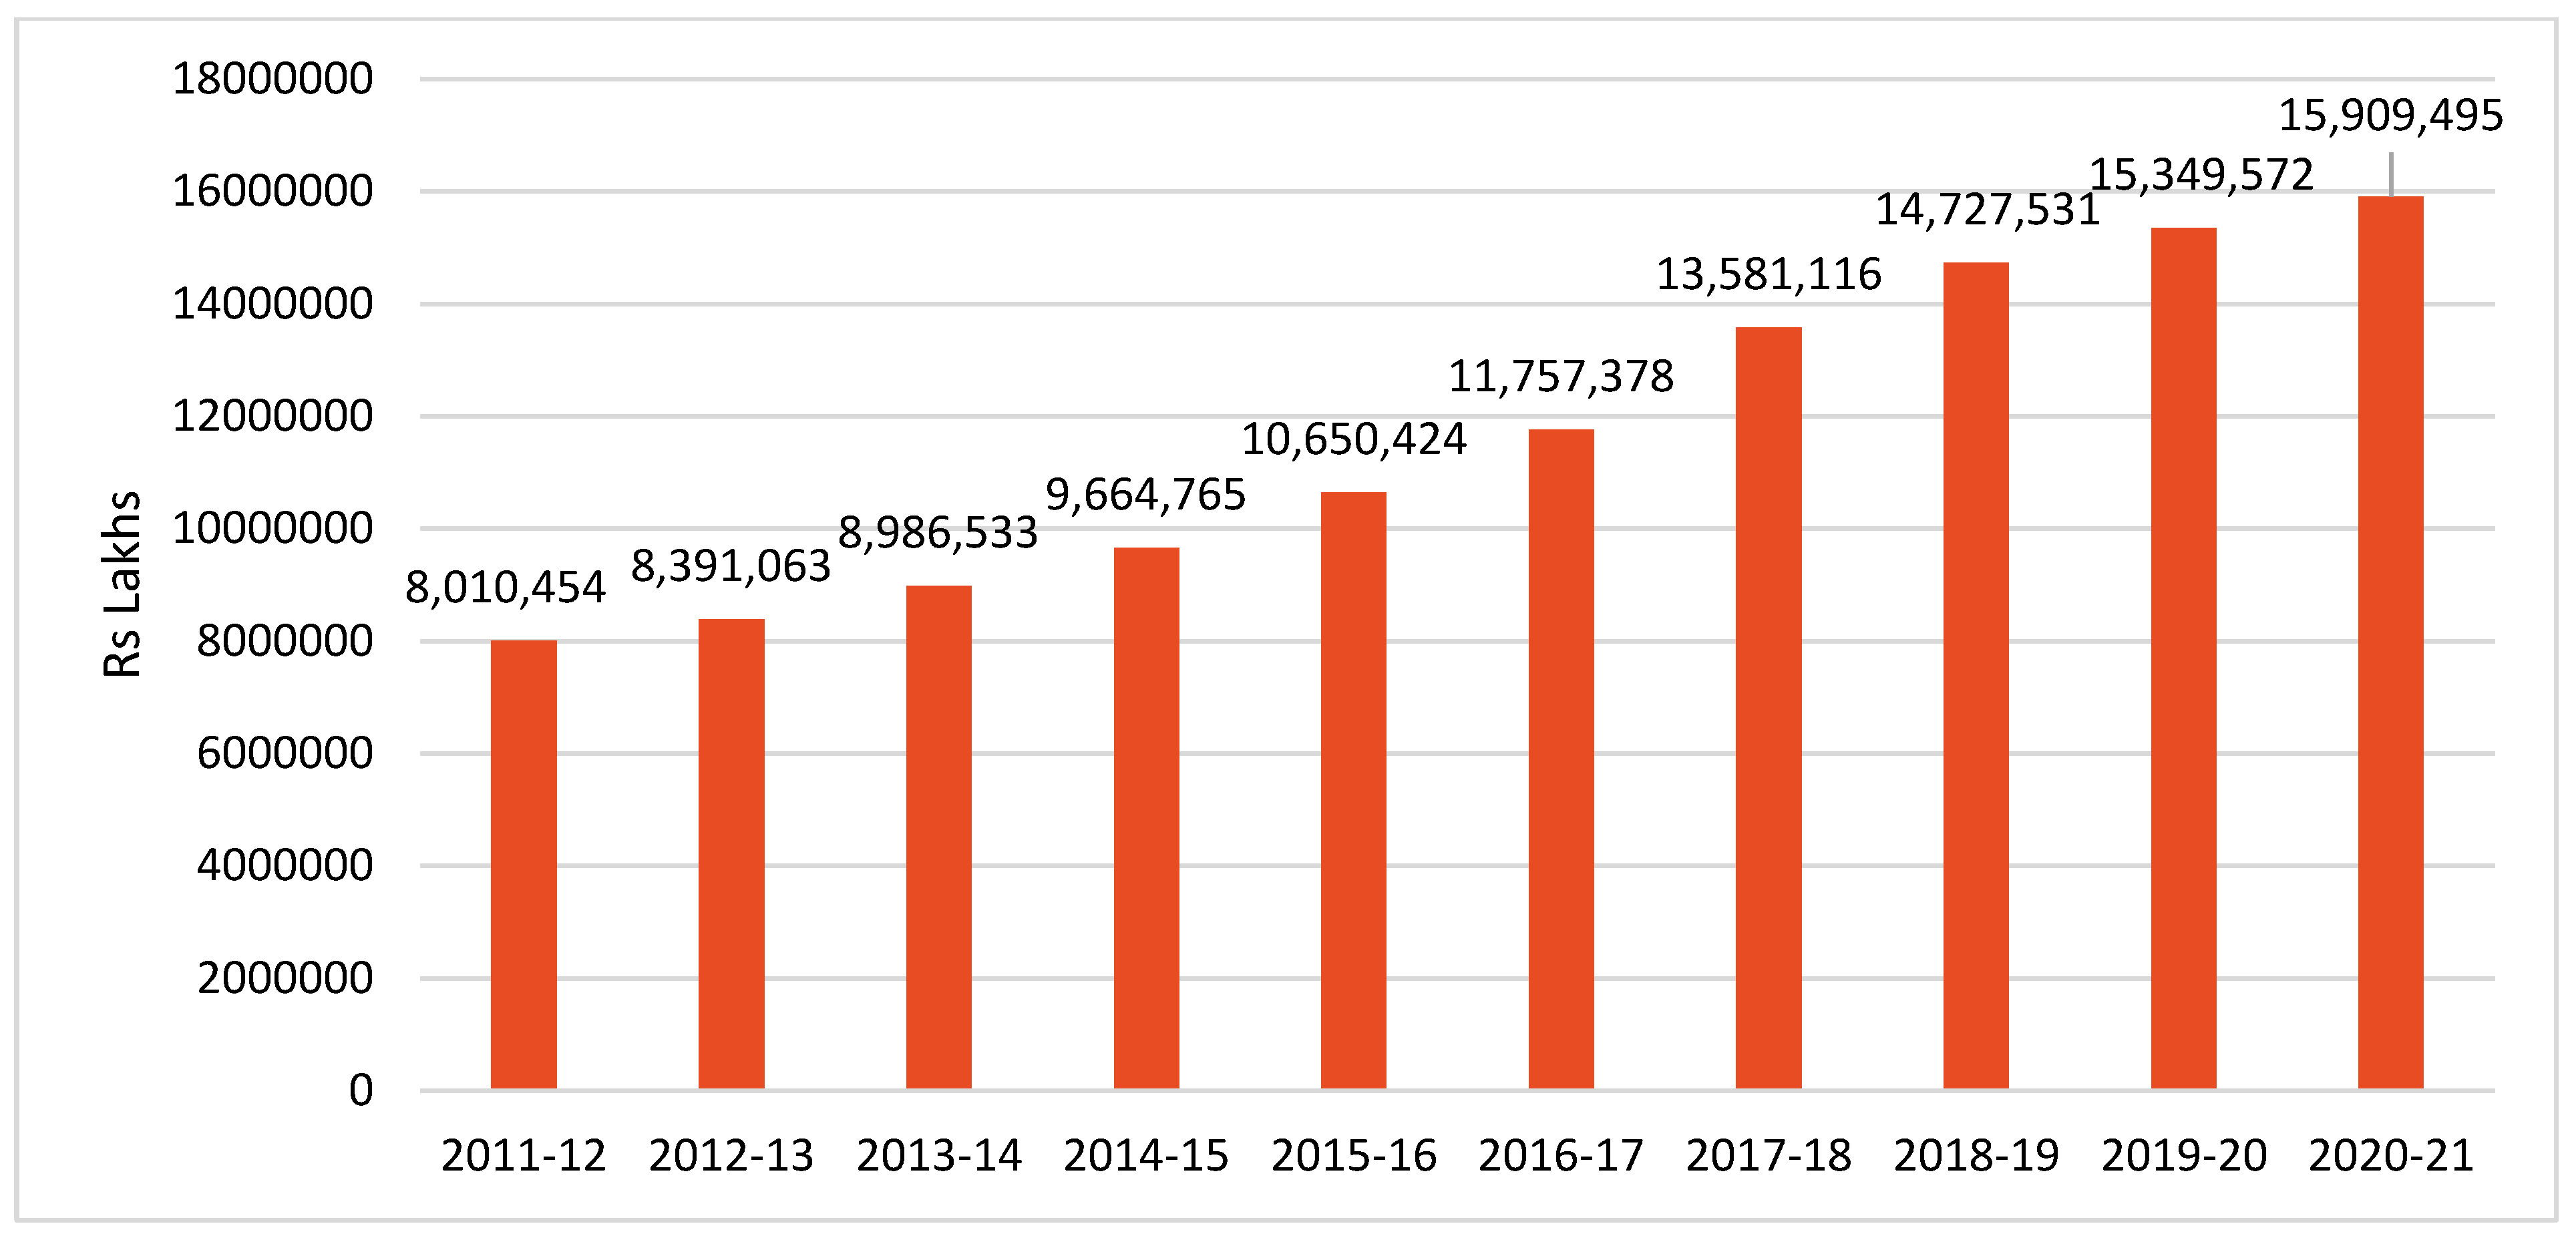
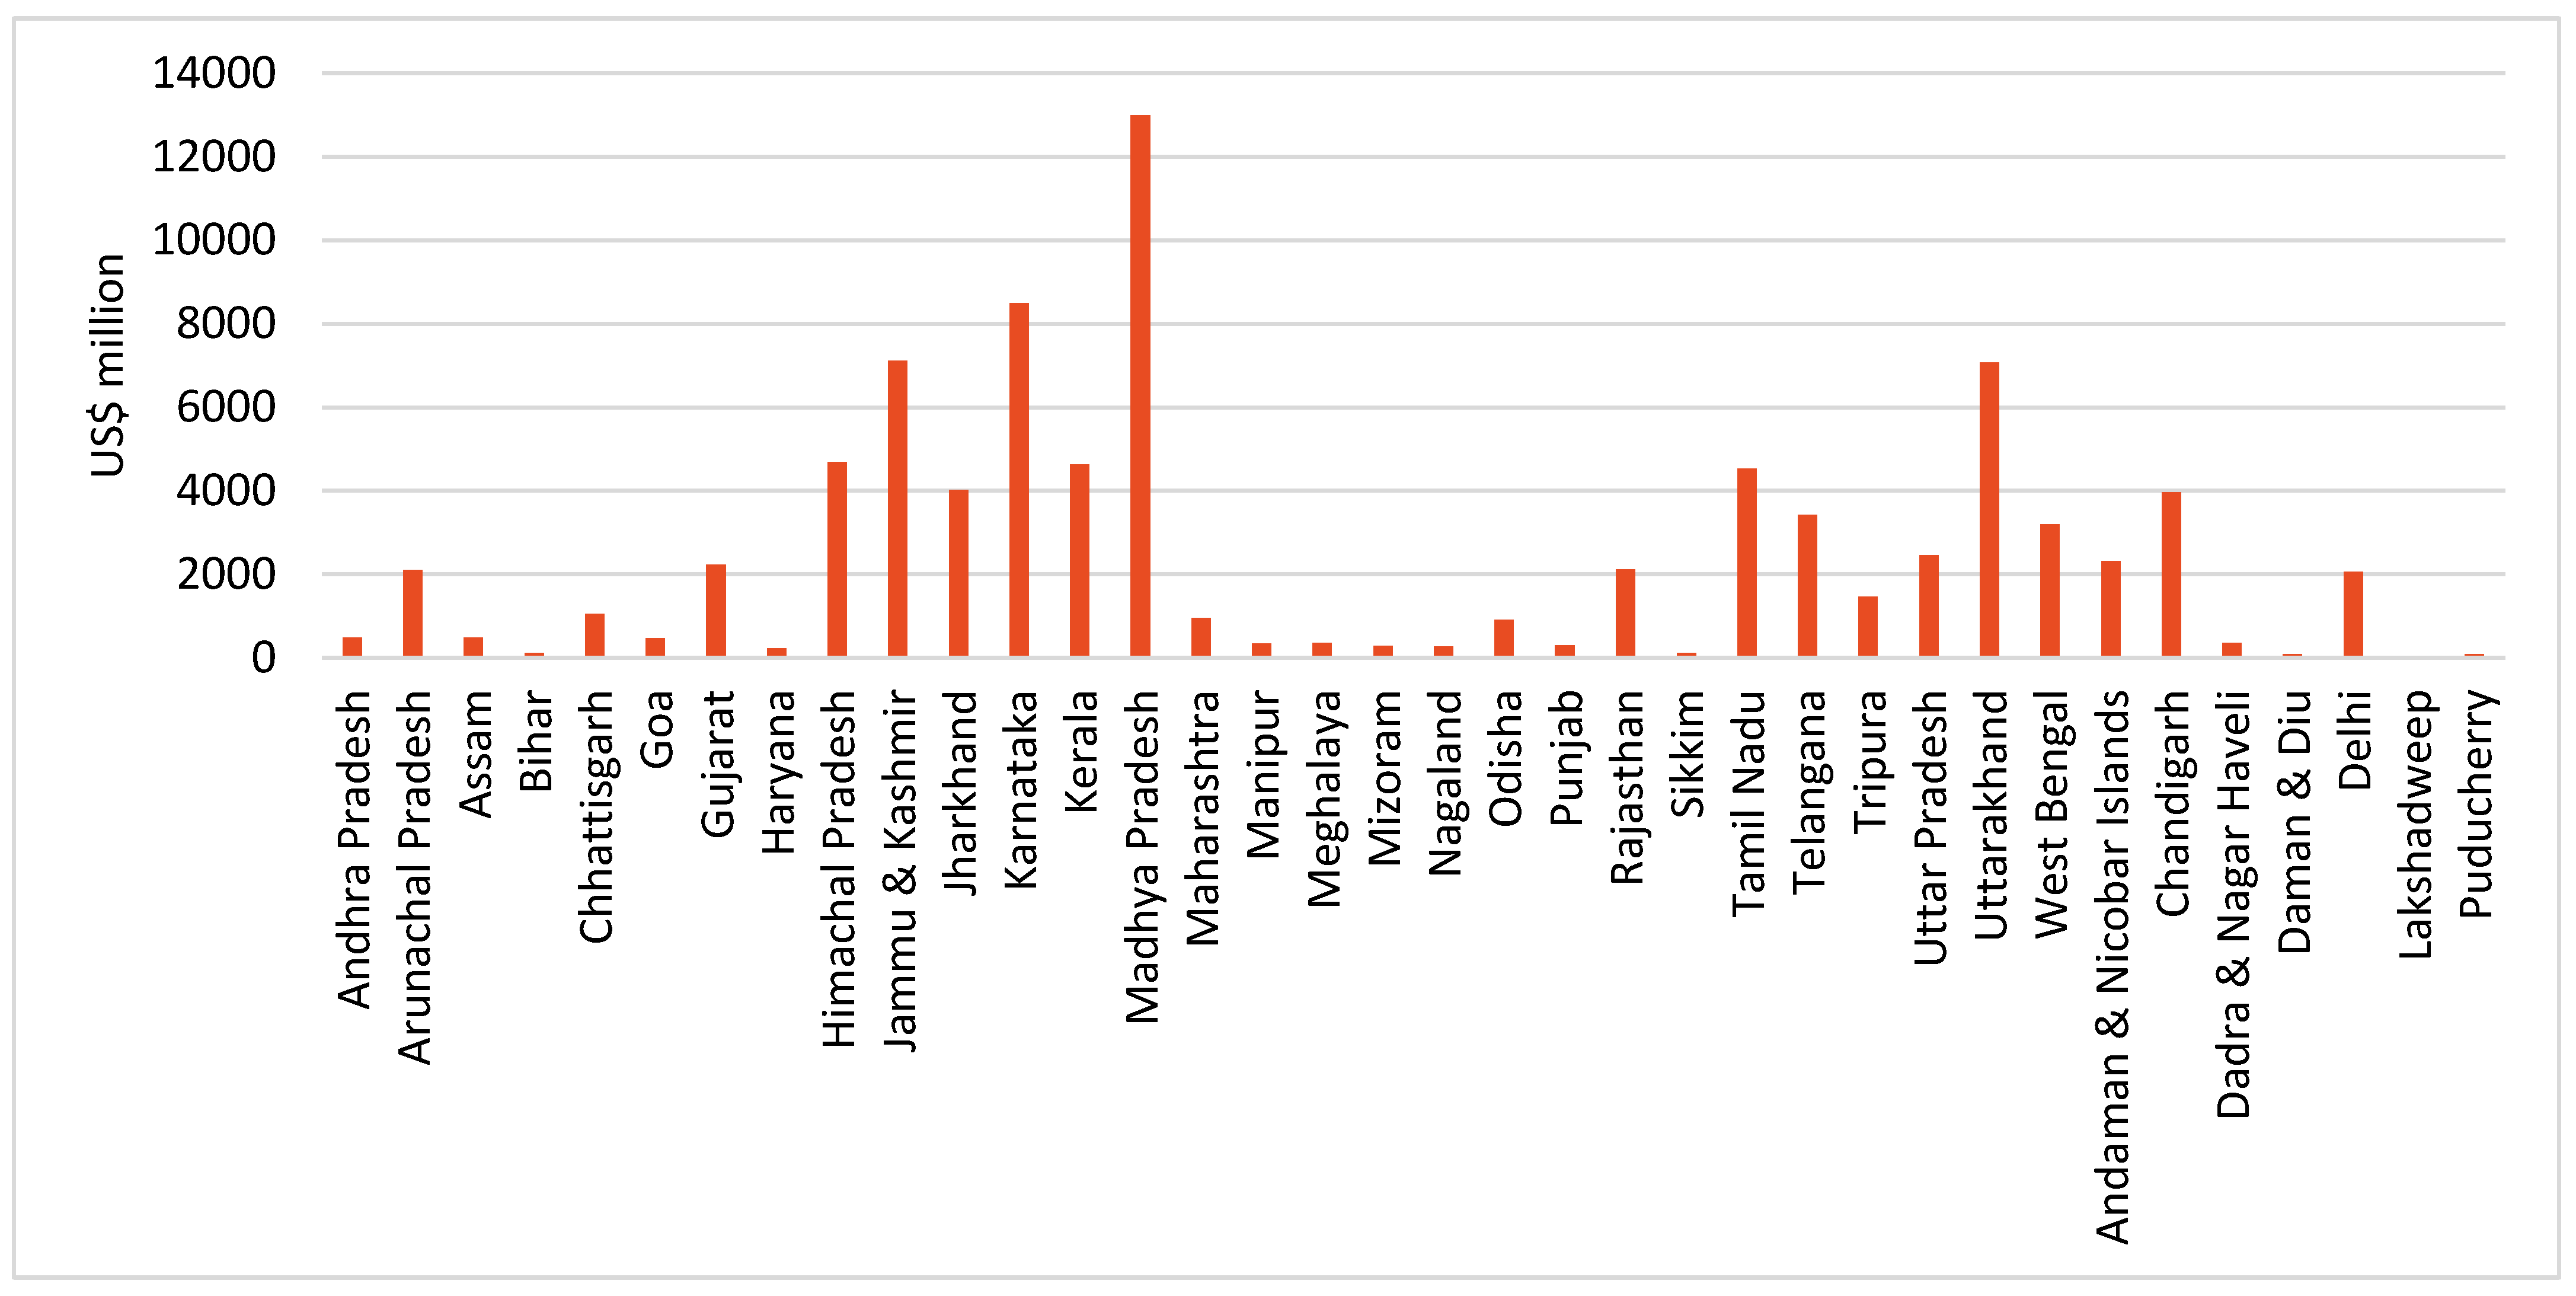
Figure 6 describes the economic value of carbon retention as one of the major services in the forest ecosystem landscape of India. Madhya Pradesh accounts for the highest carbon retention value, estimated at (US$ 12994 million), followed by Karnataka (US$ 8493), Jammu and Kashmir (US$ 7109 million), Uttarakhand (US$ 7073 million), and northeastern states, such as Himachal Pradesh (US$ 4691 million) and Arunachal Pradesh (US$ 2106), and the western Ghats states, such as Gujarat, (US$ 2234 million), Kerala, (US$ 4638 million), and Tamil Nadu, (US$ 4536 million). The total value of carbon retention for India was estimated at US$ 166.73 billion for the reference period from 2011–12 to 2020–21. There is a positive association between forest cover and carbon retention in India (see Figure 7). For the study period, the total value of carbon retention services showed a significant increase.

3.3. Value of Nature-Based Tourism

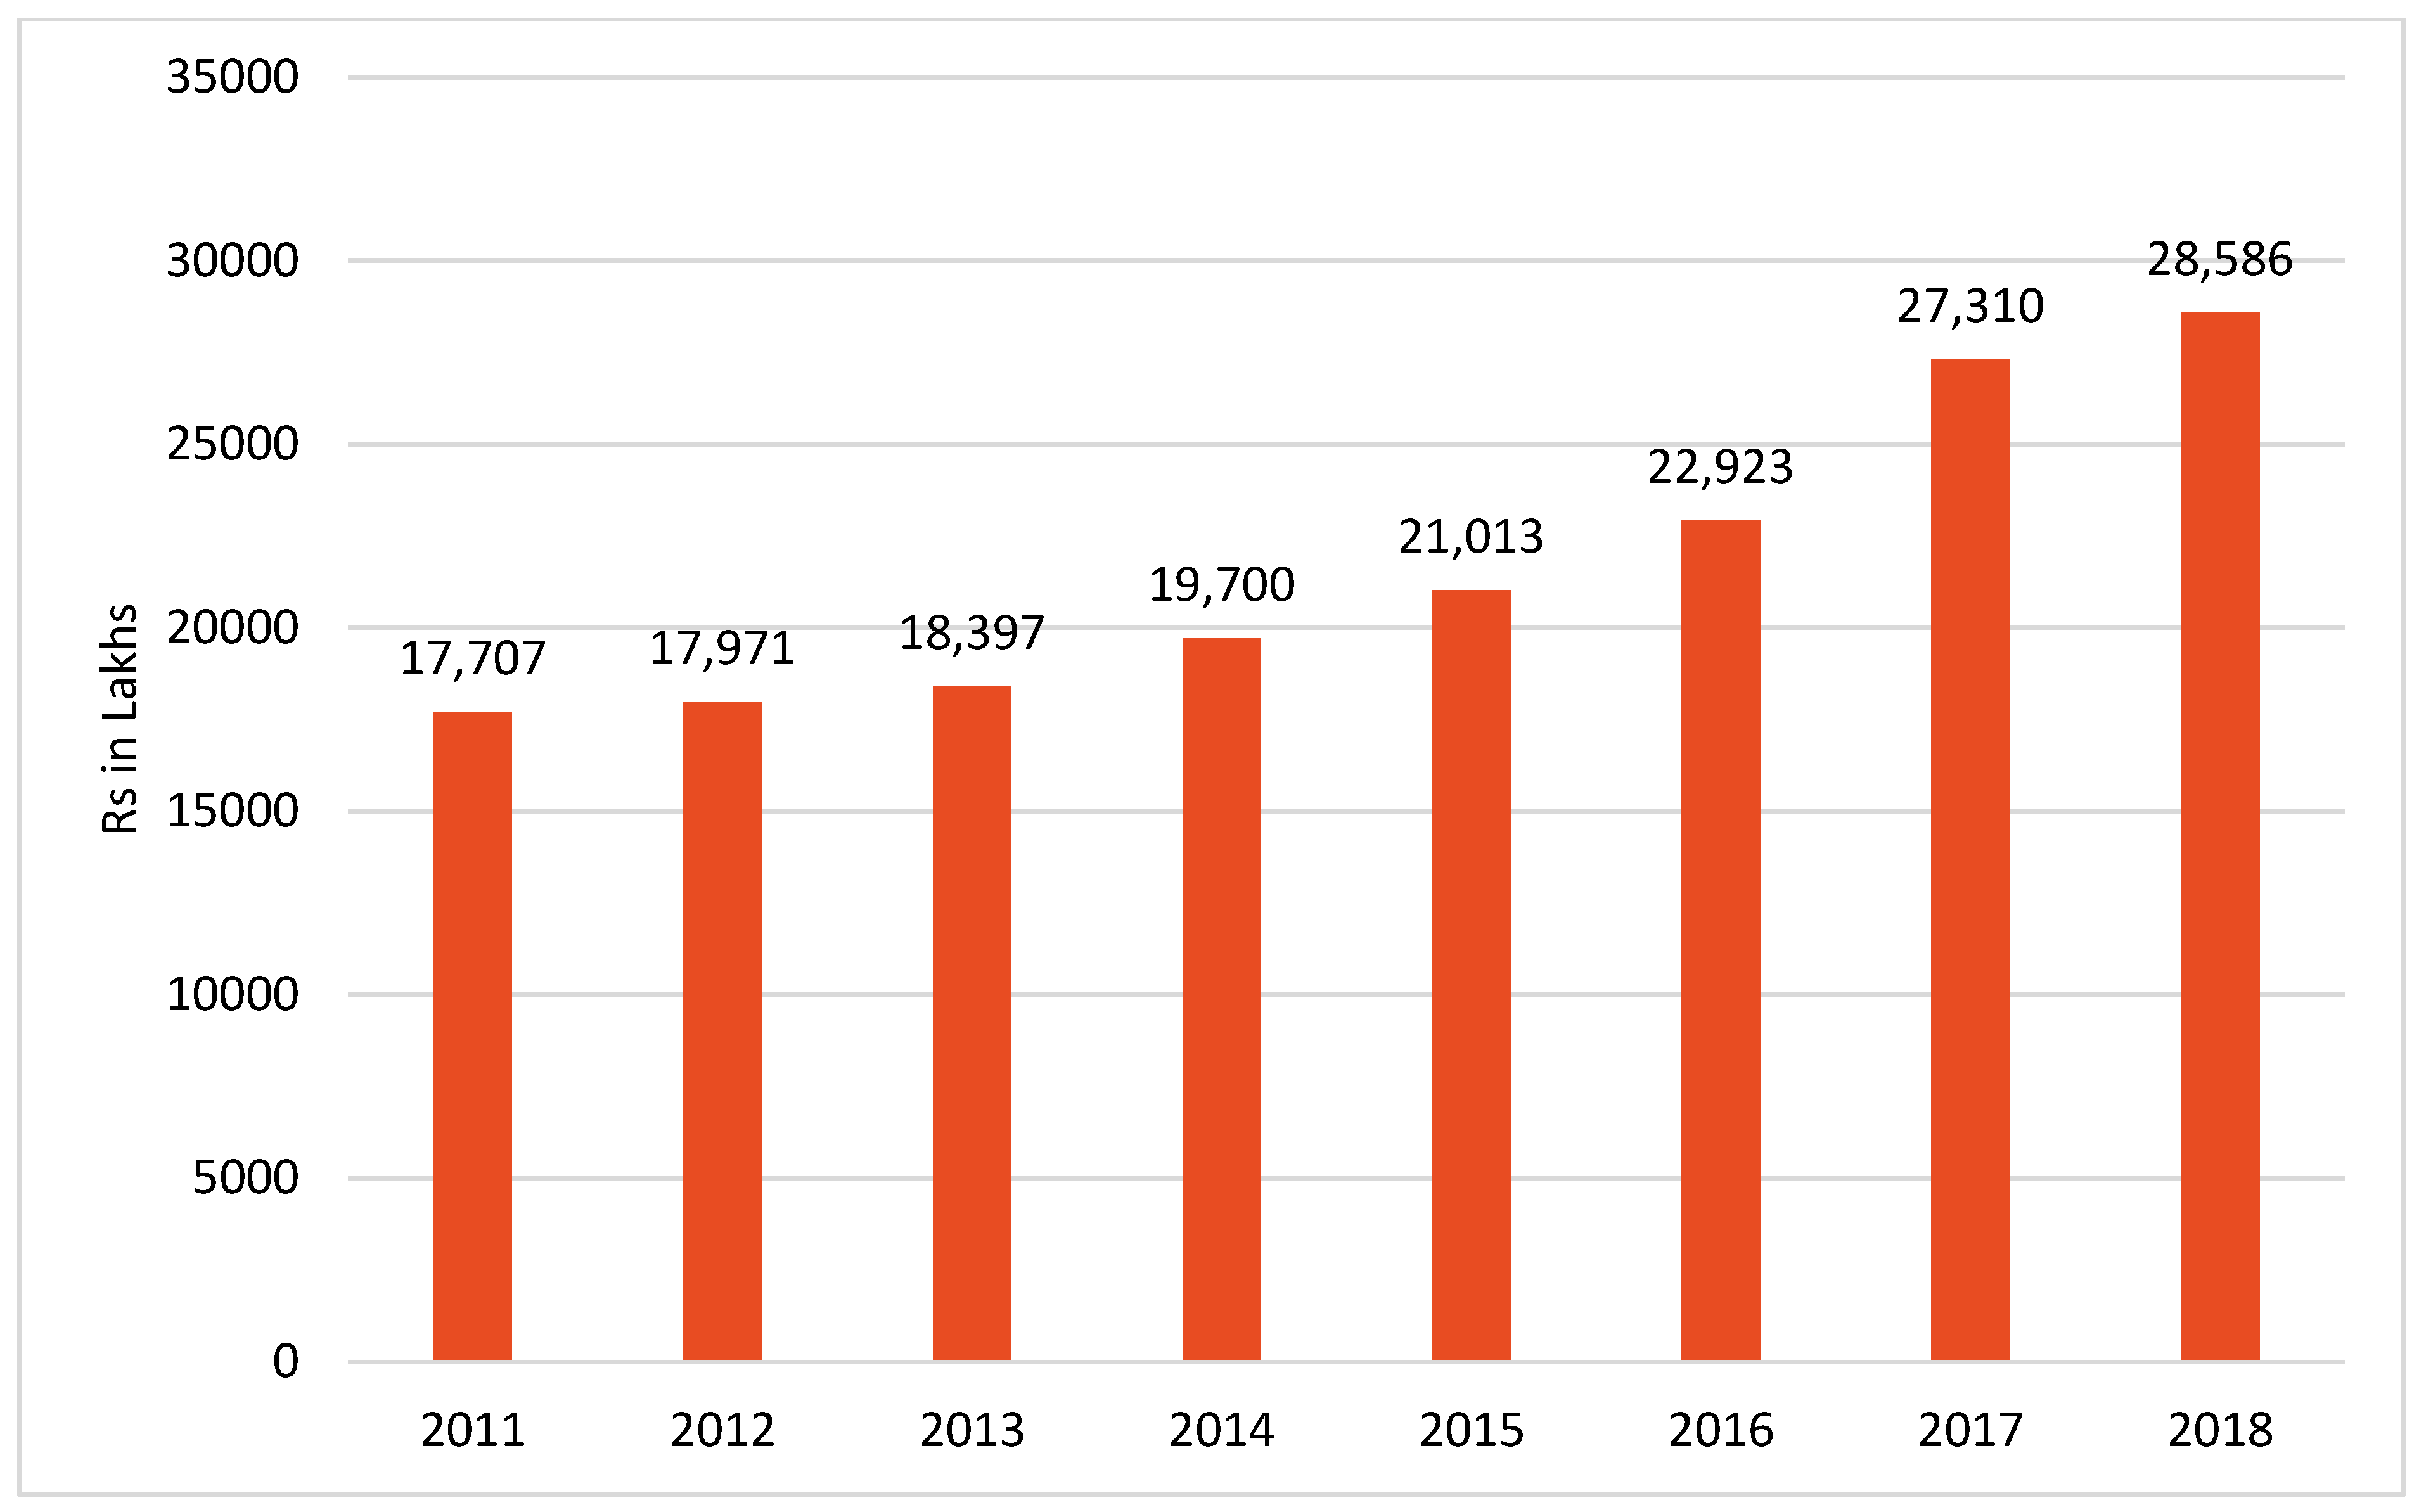
Figure 8 depicts the economic value of nature-based tourism for the period from 2011 to 2018, based on Ministry of Tourism data published by the Ministry of Statistics and Program Implementation. The value of nature-based tourism, which was at Rs 1.48 billion, showed a significant increase to Rs 2.4 billion for 2011 and a significant increase to Rs 2.4 billion for 2018 due to a considerable increase in the number of national and international travelers visiting various nature-based tourism spots in India.
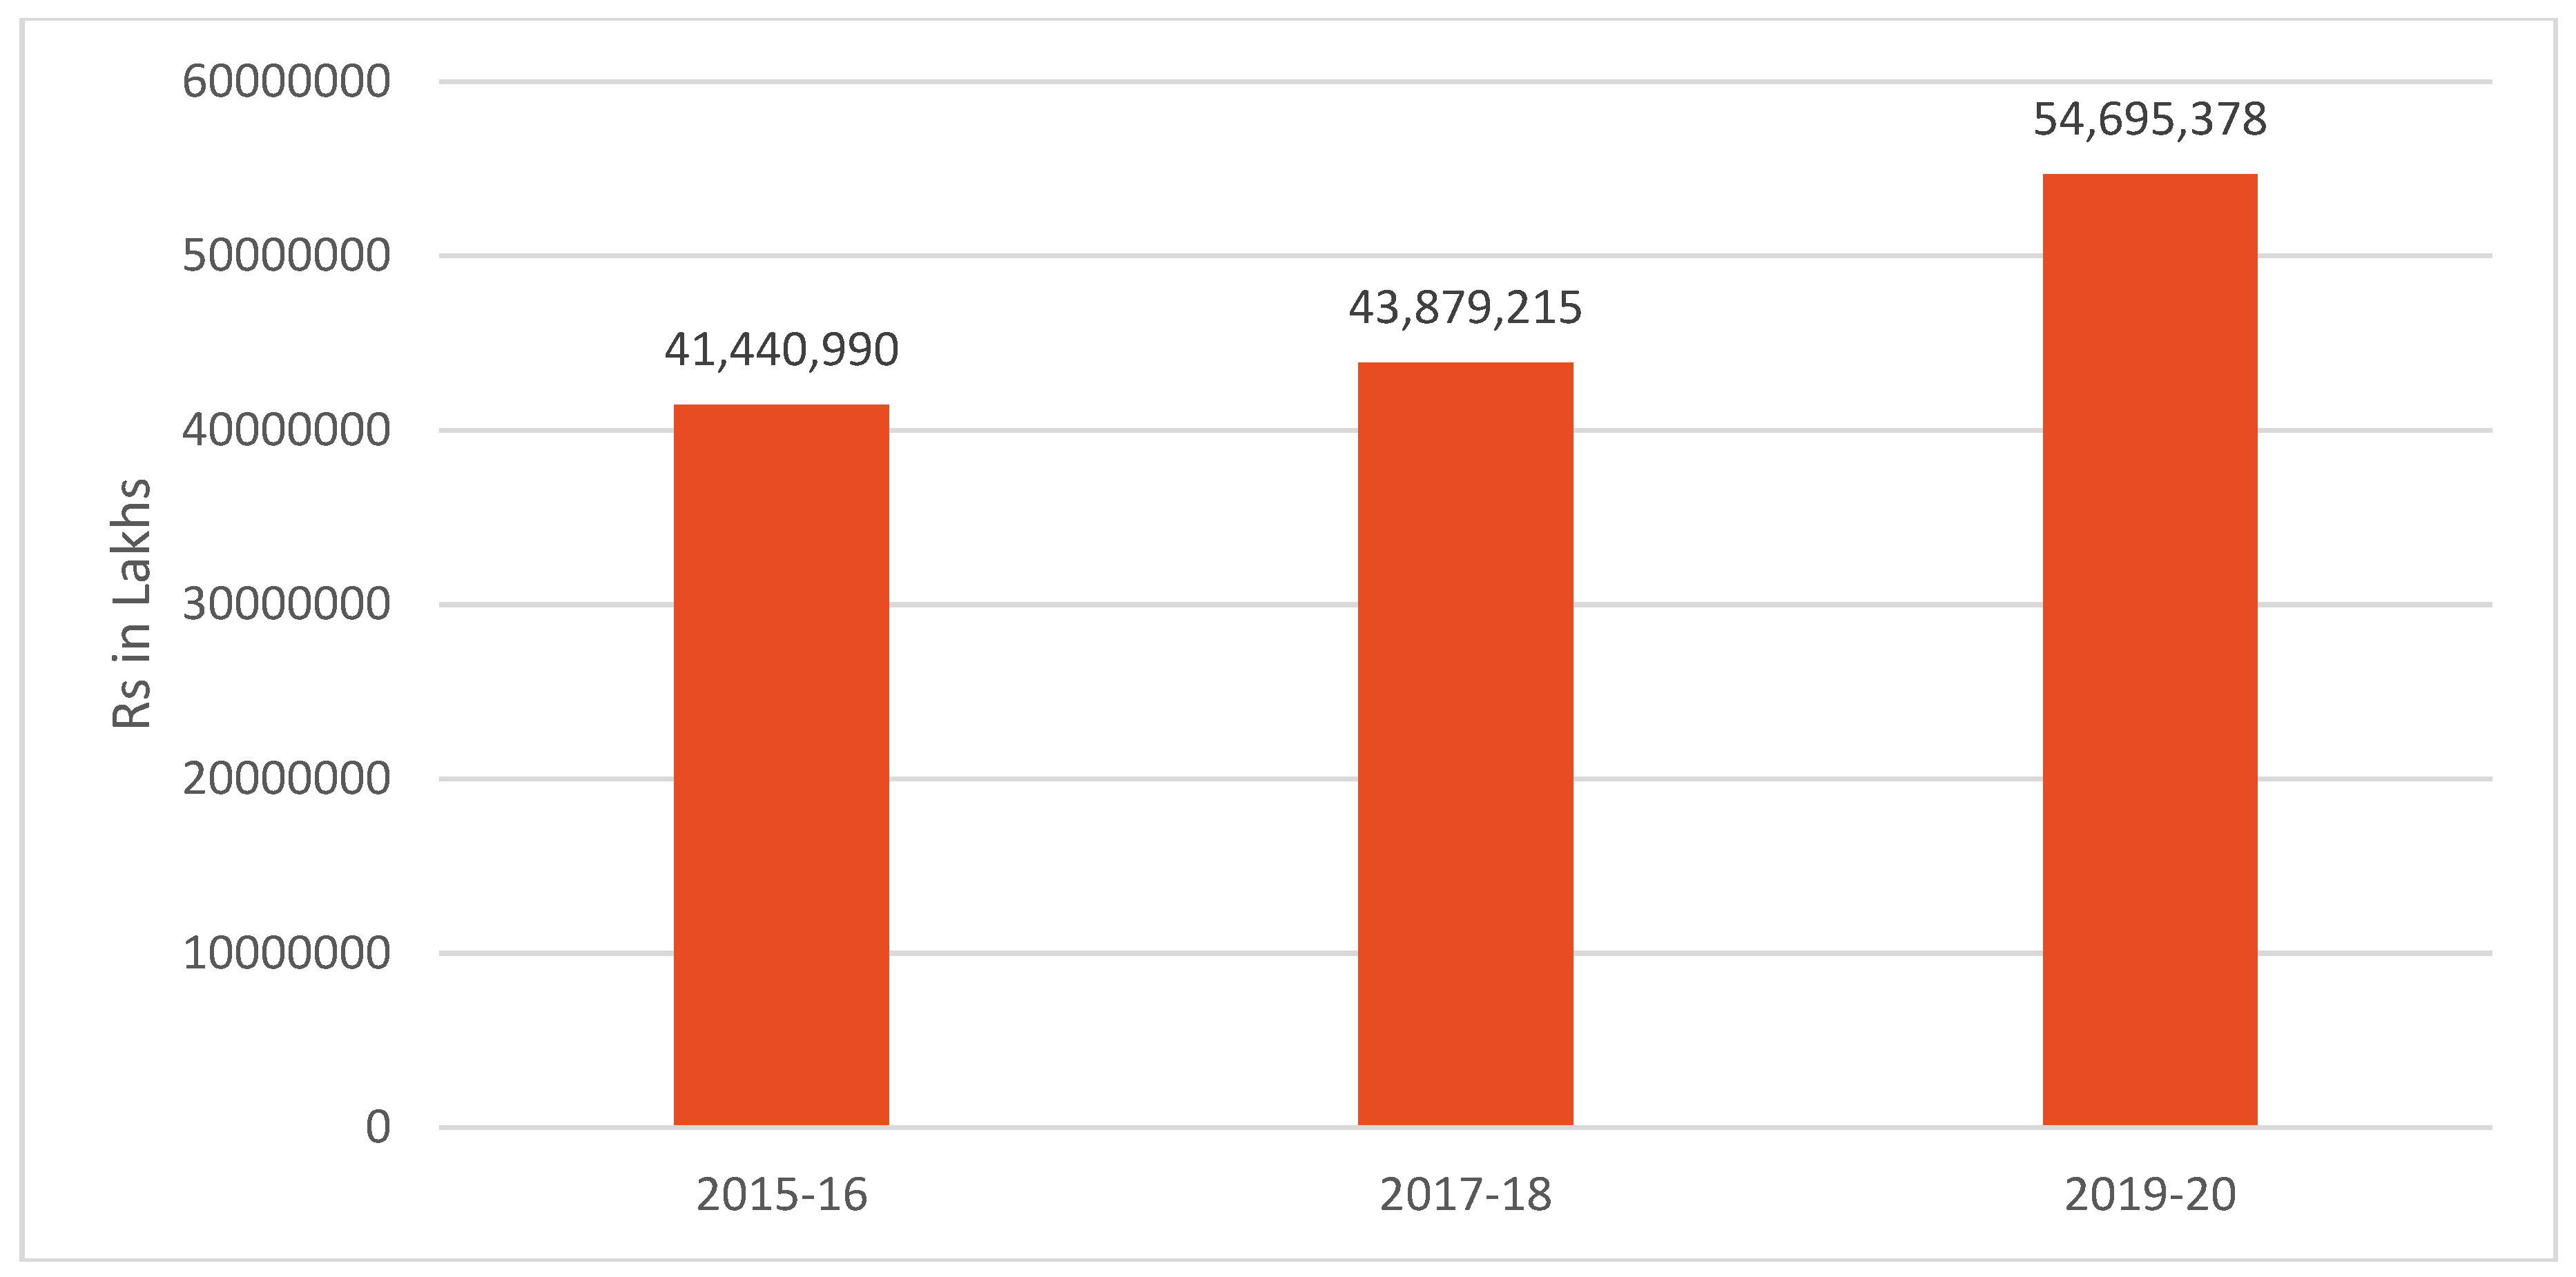
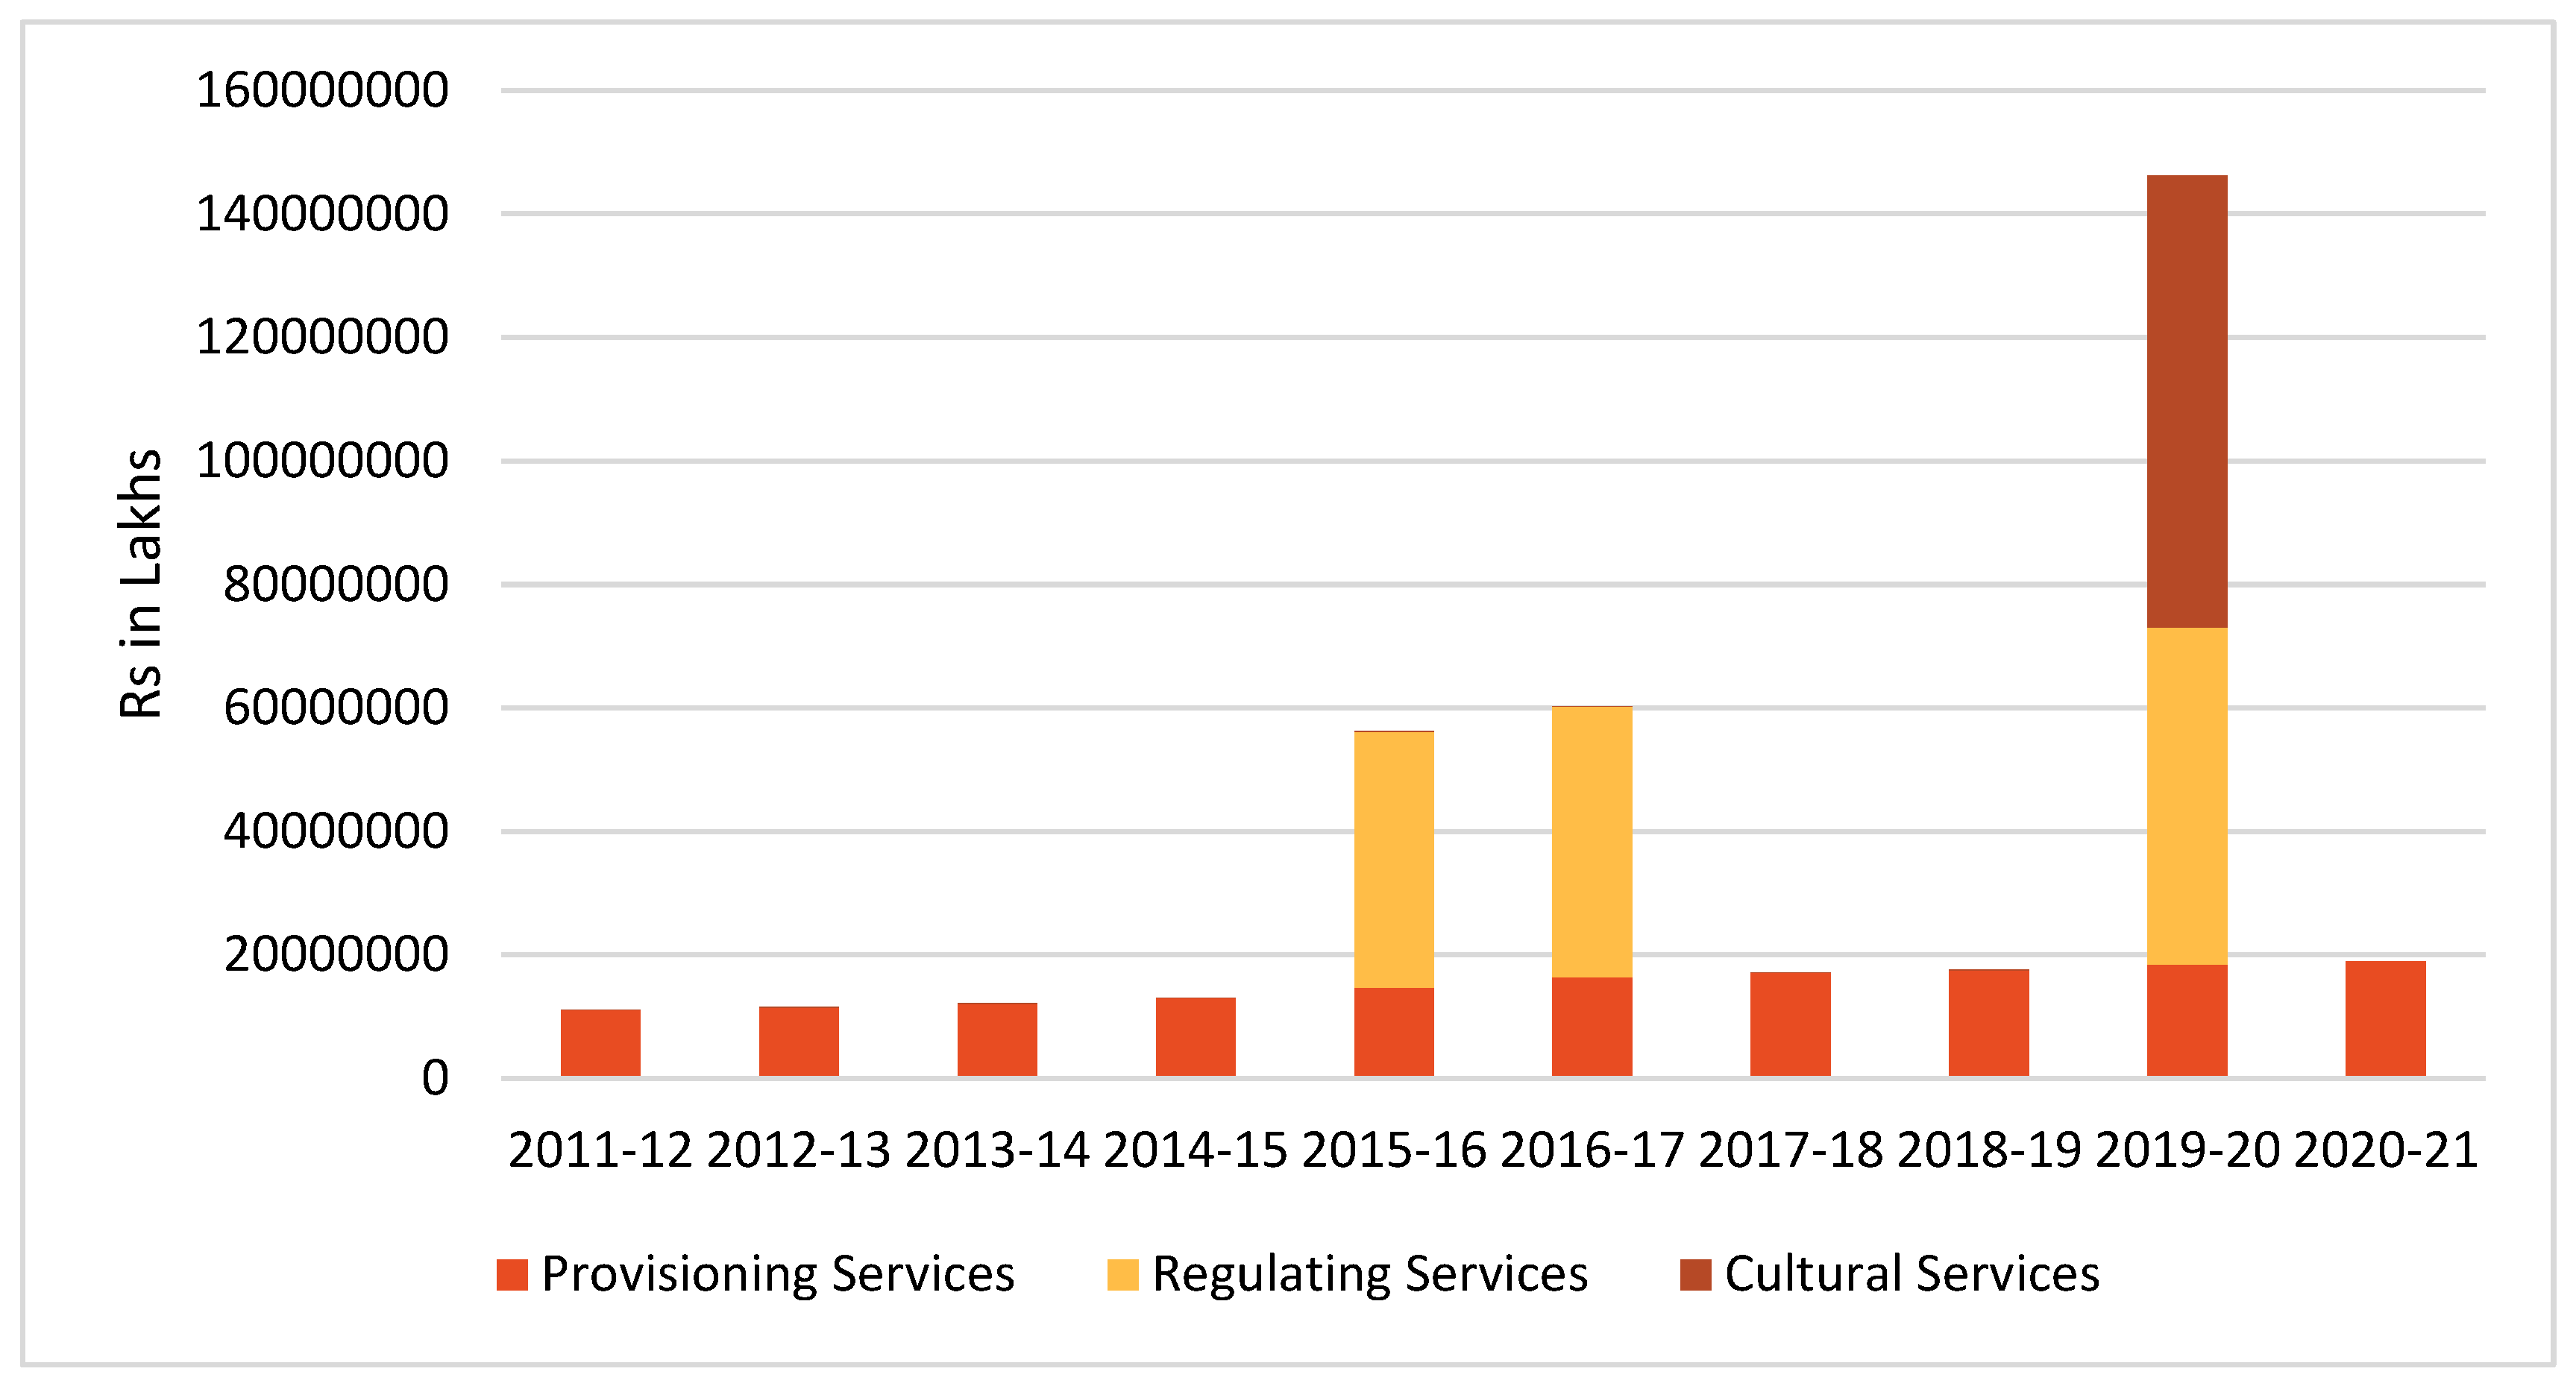
For the period from 2011–12 to 2020–21, the estimated total gross ecosystem product was calculated at Rs 17387.76 billion (US$ 207.05 billion) for five ecosystem services in India (see Table 2 and Figure 9). Carbon retention services exhibit the highest value among all the ecosystem services, which are very important services for human well-being as well as the maintenance of a stable climate. This study estimated the value of ecosystem services as well as the gross ecosystem product calculated for the forest landscape in respect of which data is available. The economic value of forest ecosystem services has been widely studied in the Indian context. A study by the Ministry of Statistics and Program Implementation (MoSPI), through the Natural Capital Accounting Project, found that Madhya Pradesh state had a higher gross ecosystem product, especially related to provisioning, at US$ 2827 million, and regulating services, at US$ 12994 million. In addition, Madhya Pradesh accounts for highest forest cover share (30.72 percent), followed by Maharashtra state, accounting for 20.01 percent of the forest cover in the total geographical area.
The gross ecosystem product value amounts to US$ 7128.3 for both the provisioning and carbon retention services. Maharashtra is located in the western Ghats of global biological diversity in India. For Gujarat, the GEP value amounts to US$ 3582 million; for Goa, US$ 623.2 million; for Karnataka, US$ 1528.1 million; for Kerala, US$ 5436.5 million; and for Tamil Nadu, US$ 5657 million. Most of the northeastern states have a high share of forest cover in the total geographical area; for example, Arunachal Pradesh has a forest cover of 79.33 percent and a GEP of US$1381.3 million; Tripura has a forest cover of 73.64 percent and GEP of US$1872.6 million; for Himachal Pradesh, GEP amounts to US$5798.6 million; and for Nagaland and Manipur, GEP is US$1154.2 million and US$1459.7 million, respectively. The study revealed a positive association between forest cover, carbon retention, and Gross Ecosystem Product (GEP) across the states of Madya Pradesh, Maharashtra, Manipur, Uttarakhand, Karnataka, and Tamil Nadu. In addition, the value of timber and non-timber forest products is also dependent on the forest area in every state. For example, Madhya Pradesh, Maharashtra, Manipur, Karnataka, and Gujarat exhibit the highest provisioning service value based on major and minor forest products according to the Ministry of Statistics and Program Implementation. In India, there is one study available on gross ecosystem product at the regional level. The total value of ecosystem services was RS 2894 billion/year for 2005 and Rs 1835 billion/year for 2019, according to the Forest Ecosystem Services. Provisioning services cost Rs 1268 billion/year, regulating services cost Rs 1271 billion/year, and cultural services cost Rs 303 billion/year, based on various economic valuation methods and both the primary and secondary data from local and national published reports and books [48]. The total GEP value amounts to Rs 5617.51 billion for 2015–16, Rs 6024.52 billion for 2016–17, and Rs 7312 billion for 2019–20, which could be attributed to the availability of data on provisioning services and regulating services, especially carbon retention and nature-based tourism, at all levels in India. However, a lack of data related to carbon retention and nature-based tourism was observed for the study period.

4. Discussion

GEP can link higher values in ecologically rich and forest-dominated regions to factors such as greater forest cover, biodiversity richness, ecosystem diversity, carbon sequestration potential, and higher availability of provisioning services. This analysis incorporates socio-economic and land-use dimensions, including differences in agricultural intensity, urbanization pressures, and resource extraction patterns. Institutional and governance-related factors, such as forest governance systems, conservation policies, and the implementation of ecosystem-based programs, are also discussed as important determinants of spatial variation. Accordingly, the revised manuscript emphasizes that variations in GEP are not solely determined by ecological endowments, but also reflect differences in governance structures, land-use practices, and policy priorities across states. Furthermore, this temporal analysis was significantly strengthened by linking changes in GEP during 2011–12 to 2020–21 with broader ecological and policy processes, including afforestation initiatives, conservation interventions, climate mitigation programs, changing patterns of resource use in forestry and fisheries, climate variability, tourism dynamics, and market price fluctuations.

4.1. Bottom of Form

Valuation of Ecosystem Services and Human Well-Being

How do ecosystem services contribute to human well-being through material and non-material benefits? There are several ecosystem service, such as provisioning services (material benefits through direct consumption goods such as food, water and raw materials), regulating services (non-material benefits such as carbon sequestration, water regulation, and soil regulation services), and cultural ecosystem services, such as recreational, esthetic, spiritual and religious services [1]. The valuation of ecosystem services, particularly provisioning services, is directly linked to human well-being through the income generated from forest ecosystem services, such as non-timber forest products. As estimated by [61], 20 to 40 percent of household income is derived from non-timber forest products, such as edible oil products, ethnomedicine, herbal dyes, household building materials, and the spices and condiments of the Karbi tribe in northeast India. Ref. [62] observe that non-timber forest products have a vital role in household income generation. Various products, including wild fruits, bamboo, mushrooms, wild vegetables, wild honey, wild fish, wild meat, traditional sticks, grazing and other materials, contribute 10 to 20 percent of the rural household income in India. Ref. [63] assessed the role of non-timber forest products in household income generation in Patharia Hills Reserve Forest in Northern India. This study found that 6 to 18 percent of the income of selected households from the study region came from non-timber forest products. Material ecosystem services such as food and water supply and forest ecosystem services provide major food materials to local communities [64,65,66].
Forest ecosystem also provides a clean and safe environment for millions of traditional and forest-dependent communities. For example, Soliga tribal communities have been living in the forested areas of the western Ghats of Karnataka for a long time [67]. Regulating ecosystem services play a crucial role in supporting human well-being by mitigating environmental pollution, including air pollution, which has significant adverse effects on human health and quality of life. In this case, mitigating air pollution through improving green cover or forest areas can help reduce or absorb emissions through carbon sequestration. Regulating ecosystem services not only provides indirect benefits to human beings but also helps to maintain ecological quality as well as socio-economic well-being. Ref. [68] analyzed the relationship between ecosystem services and human well-being in China. This study found that social relations, especially family and neighborhood relations, exhibited the highest score on a five-point scale as compared to all other ecosystem services at the village level.
Balasubramanian and Sangha [67] highlighted the important role of nature in the well-being of indigenous people through Sen’s capability approach, looking at two Indian tribal/indigenous communities. This study found that 32 percent of the Soliga tribal community had access to forest resources, which helped with income generation as well as maintaining good health and well-being. In addition, 67 percent of the respondents agreed they could apply their traditional knowledge of forest resource utilization. Further, in the Kattunayakka tribal community, nearly 54 percent of the respondents felt they could live with clean and safe shelter in the forest and 75 percent of the respondents agreed that non-timber forest products provided income and livelihoods for the local communities. This study shows that human well-being is associated with various ecosystem services, such as cultural ecosystem services, for example, cultural activities and spiritual and social relations. Seventy percent of the respondents from the Kattunayakka community and 33 percent of the Soliga community agreed that this association existed. Ref. [69] examined the link between ecosystem service management and the well-being of tribal communities in Northern Australia. This study found that managing ecosystem services through their traditional knowledge improved economic opportunities, provided safe shelter, established supportive communities, and helped to maintain healthy lifestyles.
In addition, the traditional management of Savanna burning methods showed estimated benefits of US$ 5361 million/year for tribal communities. This present work links the valuation of ecosystem services to human well-being at the national level. For example, the value of provisioning services, especially non-timber forest products, plays an important role in the lives of poor and vulnerable groups. This study estimated the value of non-timber forest products at Rs 1446.78 billion (US$ 17.23 billion). Ref. [70] found that non-timber forest products provided a direct means of livelihood and income to nearly 50 million people and indirect benefits to the population of 200 million in India. Ref. [71] discussed how climate change negatively affected agricultural production, especially for small and marginal farmers. Non-timber forest products therefore serve as a major source of support for the livelihood and income security of low-income and vulnerable communities. Regulating ecosystem services such as carbon sequestration, water and soil regulation, and others plays a vital role in ensuring human well-being [15,72]. For example, the present study estimated the value of carbon retention at Rs 14001.54 billion (US$ 166.73 billion) for India for the period 2011–12 to 2020–21. Regulating ecosystem services, especially carbon sequestration, provide clean and good-quality air, water, gas, and other services to ensure human well-being through reducing air- and water-related disease [73]. Finally, cultural ecosystem services play a vital role in quality of life, such as physical and mental well-being [74].
The findings of this study demonstrate that Gross Ecosystem Product (GEP) is more than an economic accounting framework; it provides an important mechanism for operationalizing the principles of planetary health by explicitly recognizing the dependence of human well-being on healthy ecosystems. Planetary health emphasizes that ecological integrity, biodiversity conservation, climate stability, and human health are mutually reinforcing, and should be considered together in development planning. By assigning economic value to provisioning, regulating, and cultural ecosystem services, GEP makes visible the often-overlooked contributions of natural capital to sustaining food security, water availability, clean air, climate regulation, disaster risk reduction, and recreational opportunities. These ecosystem functions directly influence physical and mental health, economic productivity, and the resilience of communities to environmental change.
The dominance of regulating ecosystem services, particularly carbon sequestration, in India’s GEP highlights the critical role of ecosystems in climate change mitigation and adaptation. Conserving forests, wetlands, grasslands, and other natural ecosystems therefore generates multiple co-benefits, including biodiversity conservation, reduced climate risks, improved public health, enhanced livelihood security, and greater resilience of rural and indigenous communities that depend directly on ecosystem resources. These multiple benefits illustrate why ecosystem investments should be regarded as investments in both environmental sustainability and human development.
Integrating GEP into national and sub-national planning can support more holistic and evidence-based decision-making by complementing conventional economic indicators such as Gross Domestic Product (GDP). Ecosystem accounting enables governments to evaluate development policies by considering their impacts on natural capital, ecosystem resilience, public health, and social well-being, alongside economic growth. Such an integrated approach promotes social equity by recognizing the value of ecosystem services that disproportionately benefit vulnerable populations and encouraging more equitable allocation of conservation investments. Incorporating GEP into environmental planning, climate policy, biodiversity strategies, and public investment decisions can therefore help align economic development with ecological sustainability, climate resilience, sustainable livelihoods, and intergenerational equity. In this way, GDP serves as a practical policy instrument for advancing planetary health by ensuring that the conservation and restoration of natural capital remain central to long-term human flourishing.

4.2. Valuing Nature: Transformative Change Aspects

Transformative change is defined as “fundamental, system-wide shifts across views, structures [75], and practices,” and as a comprehensive reorganization of technological, economic, and social systems, including paradigms, goals, and values [76]. There is a relationship between transformative change and the current Gross Domestic Product (GDP) and Gross Ecosystem Product (GEP) frameworks.
The term view refers to shifts in paradigms and values. The prevailing GDP-centric view treats nature largely as an externality, focusing on market-driven economic output and consumption. Environmental degradation is often seen as an acceptable trade-off for growth, with little consideration given to the long-term ecological costs associated with development or extractive economic models. In contrast, GEP reframes nature as a productive and asset [7], rather than a free good to be overexploited. It promotes inclusive, nature-based well-being [2], moves beyond growth-centric development, and recognizes ecosystem services as essential to human and economic survival [60,77], while emphasizing intergenerational equity and planetary boundaries [78].
Healthy ecosystems provide sustainable well-being for both people and nature. Gross Ecosystem Product provides a strong linkage between the ecosystem, economy, and society through a new metric, the planetary health framework, which is important to human well-being. In addition, GDP provides an important pathway for reorganizing development trajectories within the planetary boundaries, such as strengthening climate adaptation and the sustainable livelihood of vulnerable populations through various provisioning ecosystem services. GDP provides better policy decisions that are essential for establishing a holistic, sustainable, and equitable vision of planetary health.
Structure refers to institutions and systems. The current GDP system often neglects environmental concerns and rarely incorporates ecosystem services into national income accounts. In contrast, GEP encourages the adoption of green budgeting, natural capital accounting, and policy reforms such as ecology-based fiscal transfers [79].
Practice involves day-to-day activities and implementation. The existing GDP system promotes industrial productivity, emphasizing consumption, capital accumulation, and investment, with limited incentives for restorative or nature-positive actions. GEP, on the other hand, promotes the valuation of ecosystem services through community-based stewardship and local action, and encourages the use of nature-positive indicators in development metrics.

4.3. Conclusion and Policy Implications

Recognizing nature’s contribution to humanity can help ensure the sustainable utilization and conservation of ecosystem goods and services towards intergenerational human well-being [80,81]. GEP calculations can also help to design ecological compensation mechanisms for better natural resource management [82]. The present study estimates the GEP for a few ecosystem services, such as provisioning (timber, non-timber forest, and fish provisioning services), regulating services regarding carbon retention, and recreational ecosystem services based on secondary data obtained from the Ministry of Statistics and Program Implementation (MoSPI) for the period for 2011–12 to 2020–21. This study points out that there is a positive association between forest area and GEP estimation in the western Ghats states (Maharashtra, Goa, Karnataka, Tamil Nadu, Kerala, and Gujarat), including some northeastern states (Manipur, Meghalaya) and Madhya Pradesh. GEP calculation can help ensure various aspects of sustainable socio-economic and ecological well-being, including the following: (i) nature’s role in socio-economic development [83]; (ii) a better understanding of nature’s value in overcoming climate change effects through nature-based solutions [45]; (iii) recognizing the value of indigenous and local communities (IPLCs) in various ecosystem management methods for nature conservation [39,69]; (iv) assessing the aggregate value of ecosystem services to help in financial allocations from local, national and international governments towards forest and biodiversity conservation [66,84]; (v) understanding the demand and supply gaps in various ecosystem services for better decision-making related to the provision of significant solutions to ecological degradation [28]. This study also has a few limitations, such as limitations to the data, types of ecosystem services and the literature in the local context. First, data were available only for timber and non-timber forest products, including firewood production and fish provisioning services, while, for example, regulating ecosystem services data was available only for carbon retention and cultural ecosystem services, especially nature-based tourism at all levels in India. Second, this study estimates the GEP for only five ecosystem services due to the lack of data for other ecosystem services vital to human well-being, such as water and soil regulation, pollination, air purification, and cultural services, particularly those related to the esthetic, religious, and spiritual aspects. Third, this study covers very few local, regional, and national studies on gross ecosystem product in India.
Beyond its role as a sustainability and natural capital accounting framework, this study demonstrates that Gross Ecosystem Product (GEP) is also a valuable tool for advancing planetary health. By making visible the economic value of ecosystem services that underpin climate regulation, biodiversity conservation, food and water security, and healthy environments, GDP highlights the ecological foundations of human health, well-being, and sustainable development. Integrating GDP into national and sub-national planning can support more informal and equitable decision-making by recognizing the interdependence between ecological integrity, human health, resilient livelihoods, and economic prosperity. As countries strive to address the interconnected challenges of climate change, biodiversity loss, and natural capital depletion, ecosystem accounting provides a practical mechanism for aligning development pathways with ecological sustainability, social equity, and intergenerational well-being. In this way, GDP serves not only as an economic accounting metric but also as a strategies policy instrument for operationalizing planetary health and fostering long-term human and environmental flourishing.
Importantly, a planetary health application of GDP should move beyond valuation towards prevention and policy action. Declining ecosystem functions can increase risks to human health, livelihoods, food and water security, and community resilience, particularly where populations are highly dependent on natural systems [4,37]. GEP-based evidence can therefore help governments prioritize investments in ecosystem conservation, restoration, climate adaptation, and nature-based solutions that generate simultaneous benefits for ecosystems and human health [37]. By making changes in ecosystem contributions more visible within economic decision-making, GEP can also support a shift from reactive environmental management towards preventive approaches that recognize nature as critical asset for long-term human well-being and economic resilience [7]. Integrating GEP with planetary health indicators could therefore contribute to a more preventative, equitable, and forward-looking approach to development that safeguards ecological assets for present and future generations.

Funding

This research received no external funding.

Data Availability Statement

Provisioning services include timber and non-timber forest, firewood services; regulating services include only carbon retention from 2011–12 to 2021, with data obtained from the Ministry of Statistics and Program Implementation https://www.mospi.gov.in/ (accessed on 18 November 2025), and nature-based tourism data obtained from the Ministry of Statistics and Program Implementation https://www.mospi.gov.in/ (accessed on 18 November 2025).

Conflicts of Interest

The author declares no conflicts of interest.

References

  1. Millennium Ecosystem Assessment (MA). Ecosystems and Human Well-Being: Synthesis; Island Press: Washington, DC, USA, 2005. [Google Scholar]
  2. Díaz, S.; Settele, J.; Brondízio, E.S.; Ngo, H.T.; Agard, J.; Arneth, A.; Balvanera, P.; Brauman, K.A.; Butchart, S.H.; Chan, K.M.; et al. Pervasive human-driven decline of life on Earth points to the need for transformative change. Science 2019, 366, eaax3100. [Google Scholar] [CrossRef] [Scilit] [PubMed]
  3. Turner, R.K.; Morse-Jones, S.; Fisher, B. Ecosystem valuation: A sequential decision support system and quality assessment issues. Ann. N. Y. Acad. Sci. 2010, 1185, 79–101. [Google Scholar] [PubMed]
  4. Johnson, J.A.; Baldos, U.; Cervigni, R.; Chonabayashi, S.; Corong, E.; Gavryliuk, O.; Hertel, T.; Nootenboom, C.; Gerber, J.; Ruta, G.; et al. The Economic Case for Nature: A Global Earth-Economy Model to Assess Development Policy Pathways; World Bank: Washington, DC, USA, 2021. [Google Scholar]
  5. Whitmee, S.; Haines, A.; Beyrer, C.; Boltz, F.; Capon, A.G.; de Souza Dias, B.F.; Ezeh, A.; Frumkin, H.; Gong, P.; Head, P.; et al. Safeguarding human health in the Anthropocene epoch: Report of the Rockefeller Foundation–Lancet Commission on planetary health. Lancet 2015, 386, 1973–2028. [Google Scholar] [CrossRef] [Scilit] [PubMed]
  6. Ouyang, Z.; Song, C.; Zheng, H.; Polasky, S.; Xiao, Y.; Bateman, I.J.; Liu, J.; Ruckelshaus, M.; Shi, F.; Xiao, Y.; et al. Using gross ecosystem product (GEP) to value nature in decision making. Proc. Natl. Acad. Sci. USA 2020, 117, 14593–14601. [Google Scholar] [CrossRef] [Scilit] [PubMed]
  7. Dasgupta, P. The Economics of Biodiversity: The Dasgupta Review; HM Treasury: London, UK, 2021. [Google Scholar]
  8. Costanza, R.; d’Arge, R.; De Groot, R.; Farber, S.; Grasso, M.; Hannon, B.; Limburg, K.; Naeem, S.; O’neill, R.V.; Paruelo, J.; et al. The value of the world’s ecosystem services and natural capital. Nature 1997, 387, 253–260. [Google Scholar] [CrossRef] [Scilit]
  9. Costanza, R.; De Groot, R.; Sutton, P.; Van der Ploeg, S.; Anderson, S.J.; Kubiszewski, I.; Farber, S.; Turner, R.K. Changes in the global value of ecosystem services. Glob. Environ. Change 2014, 26, 152–158. [Google Scholar] [CrossRef] [Scilit]
  10. Johnston, R.J.; Rosenberger, R.S. Methods, trends and controversies in contemporary benefit transfer. J. Econ. Surv. 2010, 24, 479–510. [Google Scholar] [CrossRef] [Scilit]
  11. Grammatikopoulou, I.; Vačkářová, D. The value of forest ecosystem services: A meta-analysis at the European scale and application to national ecosystem accounting. Ecosyst. Serv. 2021, 48, 101262. [Google Scholar] [CrossRef] [Scilit]
  12. Ninan, K.N.; Inoue, M. Valuing forest ecosystem services: Case study of a forest reserve in Japan. Ecosyst. Serv. 2013, 5, 78–87. [Google Scholar] [CrossRef] [Scilit]
  13. Cao, S.; Zhong, B.; Yue, H.; Zeng, H.; Zeng, J. Development and testing of a sustainable environmental restoration policy on eradicating the poverty trap in China’s Changting County. Proc. Natl. Acad. Sci. USA 2009, 106, 10712–10716. [Google Scholar] [CrossRef] [Scilit] [PubMed]
  14. Ninan, K.N.; Kontoleon, A. Valuing Forest ecosystem services and disservices—Case study from India. Ecosyst. Serv. 2016, 20, 1–14. [Google Scholar] [CrossRef] [Scilit]
  15. Balasubramanian, M. Economic value of regulating ecosystem services: A comprehensive at the global level review. Environ. Monit. Assess. 2019, 191, 616. [Google Scholar] [CrossRef] [Scilit] [PubMed]
  16. Proctor, W.; Cork, S.; Langridge, J.; Langston, A.; Abel, N.; Howden, M.; Anderies, M.; Parry, R.; Shelton, D. Assessing ecosystem services in Australia. In Proceedings of the 7th Biennial Conference of the International Society for Ecological Economics, Sousse, Tunisia, 6–9 March 2002. [Google Scholar]
  17. Matthew, R.; Othman, J.; Tew, J. Economic valuation of ecosystem services in Malaysia: A review of current literature. J. Sustain. Sci. Manag. 2019, 14, 92–108. [Google Scholar]
  18. Brouwer, R.; Pinto, R.; Dugstad, A.; Navrud, S. The economic value of the Brazilian Amazon rainforest ecosystem services: A meta-analysis of the Brazilian literature. PLoS ONE 2022, 17, e0268425. [Google Scholar] [CrossRef] [Scilit] [PubMed]
  19. Azadi, H.; Yazdanpanah, M.; Helmschrot, J. Valuing ecosystem services in Africa: A systematic review. Ecosyst. Serv. 2021, 50, 101338. [Google Scholar] [CrossRef] [Scilit]
  20. Campbell, E.T.; Brown, M.T. Environmental accounting of natural capital and ecosystem services for the US National Forest System. Environ. Dev. Sustain. 2012, 14, 691–724. [Google Scholar] [CrossRef] [Scilit]
  21. Matero, J.; Saastamoinen, O. In search of marginal environmental valuations—Ecosystem services in Finnish forest accounting. Ecol. Econ. 2007, 64, 647–661. [Google Scholar] [CrossRef] [Scilit]
  22. Remme, R.P.; Schröter, M.; Hein, L. Developing spatial biophysical accounting for multiple ecosystem services. Ecosyst. Serv. 2015, 13, 16–27. [Google Scholar] [CrossRef] [Scilit]
  23. Campos, P.; Caparrós, A.; Oviedo, J.L.; Ovando, P.; Álvarez-Farizo, B.; Díaz-Balteiro, L.; Carranza, J.; Beguería, S.; Díaz, M.; Herruzo, A.C.; et al. Bridging the gap between national and ecosystem accounting application in Andalusian forests, Spain. Ecol. Econ. 2019, 157, 218–236. [Google Scholar] [CrossRef] [Scilit]
  24. Liu, K.; Jin, M.; Cheng, L. County green transformation: How does gross ecosystem product assessment promote common prosperity? Humanit. Soc. Sci. Commun. 2025, 12, 20. [Google Scholar] [CrossRef] [Scilit]
  25. Lin, J.-C.; Chiou, C.-R.; Chan, W.-H.; Wu, M.-S. Valuation of Forest Ecosystem Services in Taiwan. Forests 2021, 12, 1694. [Google Scholar] [CrossRef] [Scilit]
  26. Esen, S.E.; Hein, L.; Cuceloglu, G. Accounting for the water related ecosystem services of forests in the Southern Aegean region of Turkey. Ecol. Indic. 2023, 154, 110553. [Google Scholar] [CrossRef] [Scilit]
  27. Hein, L.; Obst, C.; Edens, B.; Remme, R.P. Progress and challenges in the development of ecosystem accounting as a tool to measure the sustainability of the economy. Curr. Opin. Environ. Sustain. 2020, 44, 26–32. [Google Scholar] [CrossRef] [Scilit]
  28. Zhang, Y.; Yang, H.; Yang, X.; Xu, W. Advances and challenges in measuring gross ecosystem product (GEP): A synthesis. Sustain. Sci. 2023, 18, 875–889. [Google Scholar]
  29. Lin, Z.; Wu, T.; Rao, E.; Xiao, Y.; Ouyang, Z. Using gross ecosystem product to harmonize biodiversity conservation and economic development in Southwestern China. People Nat. 2024, 6, 1838–1848. [Google Scholar] [CrossRef] [Scilit]
  30. Ouyang, Z.; Jin, Y. Ecological compensation: Theory and practice in China. Ecol. Econ. 2017, 132, 85–93. [Google Scholar] [CrossRef] [Scilit] [PubMed]
  31. Wang, Y.; Wang, H.; Zhang, J.; Liu, G.; Fang, Z.; Wang, D. Exploring interactions in water-related ecosystem services nexus in Loess Plateau. J. Environ. Manag. 2023, 336, 117550. [Google Scholar] [CrossRef] [Scilit] [PubMed]
  32. Daily, G.C.; Zhiyun, O.; Hua, Z.; Shuzhuo, L.; Yukuan, W.; Feldman, M.; Kareiva, P.; Polasky, S.; Ruckelshaus, M. Securing natural capital and human well-being: Innovation and impact in China. Shengtai Xuebao Acta Ecol. Sin. 2013, 33, 677–685. [Google Scholar] [CrossRef] [Scilit]
  33. Ouyang, Z.; Zheng, H.; Xiao, Y.; Polasky, S.; Liu, J.; Xu, W.; Wang, Q.; Zhang, L.; Xiao, Y.; Rao, E.; et al. Improvements in ecosystem services from investments in natural capital. Science 2016, 352, 1455–1459. [Google Scholar] [CrossRef] [Scilit] [PubMed]
  34. United Nations (UN). System of Environmental-Economic Accounting—Ecosystem Accounting (SEEA EA); United Nations Statistics Division: New York, NY, USA, 2021. [Google Scholar]
  35. Zheng, H.; Ouyang, Z.; Wang, Y.; Jia, Y.; Wang, Q. From Gross Domestic Product (GDP) to Gross Ecosystem Product (GEP): A transformation to account for nature. Nat. Sustain. 2023, 6, 122–130. [Google Scholar]
  36. Zou, W.; Peng, D.; Zhao, Y. Gross ecosystem product and its application in ecological civilization. Resour. Environ. Yangtze Basin 2020, 29, 2137–2146. [Google Scholar]
  37. Wu, G.; Cheng, J.; Yang, F. Can green finance policy promote ecosystem product value realization? Evidence from a quasi-natural experiment in China. Humanit Soc. Sci. Commun. 2024, 11, 377. [Google Scholar] [CrossRef] [Scilit]
  38. Joshi, G.; Negi, G.C. Quantification and valuation of forest ecosystem services in the western Himalayan region of India. Int. J. Biodivers. Sci. Ecosyst. Serv. Manag. 2011, 7, 2–11. [Google Scholar] [CrossRef] [Scilit]
  39. Balasubramanian, M.; Sangha, K.K. Valuing ecosystem services applying indigenous perspectives from a global biodiversity hotspot, the Western Ghats, India. Front. Ecol. Evol. 2023, 11, 1026793. [Google Scholar] [CrossRef] [Scilit]
  40. Nayak, P.K.; Ojha, H.R.; Kumar, C. Agroecosystem services in eastern India: A case study from the tribal-dominated areas. Agroecol. Sustain. Food Syst. 2019, 43, 415–436. [Google Scholar]
  41. Verma, M.; Negandhi, D.; Sinha, R. Economic valuation of tiger reserves in India: A value+ approach. In Centre for Ecological Services Management; Indian Institute of Forest Management: Bhopal, India, 2017. [Google Scholar]
  42. Badola, R.; Hussain, S.A.; Mishra, B.K.; Konthoujam, B.; Thapliyal, S.; Dhakate, P.M. Valuation of ecosystem services of Corbett Tiger Reserve, India. Environmentalist 2010, 30, 320–329. [Google Scholar] [CrossRef] [Scilit]
  43. Kumar, V.; Sridhar, R.; Joshi, G. Economic valuation of marine ecosystem services in India: Policy implications for sustainable management. Mar. Policy 2022, 135, 104892. [Google Scholar] [CrossRef] [Scilit]
  44. Pusupalati, K.; Rama Mohan Rao, M.S. Economic valuation of ecosystem services of urban wetlands: A case study of Kapra Lake, Hyderabad. J. Environ. Res. Dev. 2017, 11, 1189–1198. [Google Scholar]
  45. Sharma, P.; Chauhan, M.; Ravindranath, N.H. Economic valuation of wetland ecosystem services in urban India: A case study of East Kolkata Wetlands. Urban Ecosyst. 2015, 18, 1191–1210. [Google Scholar]
  46. Sinclair, M.; Sagar, M.V.; Knudsen, C.; Sabu, J.; Ghermandi, A. Economic appraisal of ecosystem services and restoration scenarios in a tropical coastal Ramsar wetland in India. Ecosyst. Serv. 2021, 47, 101236. [Google Scholar] [CrossRef] [Scilit]
  47. Pandey, D.N.; Gupta, A.K.; Anderson, D.M. Rainwater harvesting as an adaptation to climate change. Curr. Sci. 2004, 85, 46–59. [Google Scholar]
  48. Ministry of Statistics and Programme Implementation (MoSPI). Annual Survey of Industries. In Summary Results for Factory Sector 2021–2022; Government of India: New Delhi, India, 2024. [Google Scholar]
  49. Joshi, M.K.; Singh, S.K.; Mehra, R. Estimating gross environmental product for air, water, soil, and forest resources in Uttarakhand using Monte Carlo simulation. Ecol. Indic. 2023, 150, 110229. [Google Scholar] [CrossRef] [Scilit]
  50. Ministry of Statistics and Programme Implementation (MoSPI). Pilot Study Report on Gross Ecosystem Product Estimation in Karnataka; Government of India: New Delhi, India, 2023. [Google Scholar]
  51. Balasubramanian, M. Inclusive wealth accounting for South Asia: Measuring towards sustainability. Int. J. Environ. Sustain. Dev. 2018, 17, 36–55. [Google Scholar] [CrossRef] [Scilit]
  52. Picciariello, A.; MacDonald, A.; Aung, M.; Saldanha, A. Leave No One Behind in a Warming World: Climate Change and Inequality in the Indian Context; Oxfam India and Climate Action Network South Asia: New Delhi, India, 2021. [Google Scholar]
  53. Hallegatte, S.; Bangalore, M.; Bonzanigo, L.; Fay, M.; Kane, T.; Narloch, U.; Rozenberg, J.; Treguer, D.; Vogt-Schilb, A. Shock Waves: Managing the Impacts of Climate Change on Poverty; World Bank Publications: Washington, DC, USA, 2016. [Google Scholar]
  54. India Meteorological Department (IMD). Climate Summary of India 2022; Government of India: New Delhi, India, 2022. [Google Scholar]
  55. Kubiszewski, I.; Costanza, R.; Anderson, S.; Sutton, P. The future value of ecosystem services: Global scenarios and national implications. Ecosyst. Serv. 2016, 21, 160–171. [Google Scholar] [CrossRef] [Scilit]
  56. Government of India. Ministry of Statistics and Programme Implementation (MoSPI): Annual Report; Government of India: New Delhi, India, 2019.
  57. Ricke, K.; Drouet, L.; Caldeira, K.; Tavoni, M. Country-level social cost of carbon. Nat. Clim. Change 2018, 8, 895–900. [Google Scholar] [CrossRef] [Scilit]
  58. Zhou, W.; Jin, Y.; Wu, F.; Chen, S. Evaluation and spatial mapping of Gross Ecosystem Product in mountain ecosystems of China. Sustainability 2022, 14, 3457. [Google Scholar] [CrossRef] [Scilit]
  59. Shen, Y.Q.; Yi, X.; Chen, M.; Ouyang, Z.Y. Gross ecosystem product accounting in Miyun County: The supply and use of ecosystem services. Front. Ecol. Evol. 2024, 12, 1367768. [Google Scholar] [CrossRef] [Scilit]
  60. Yang, R.; Zhang, W.; Li, J.; Zhao, Y. Gross Ecosystem Product accounting and ecological compensation in national parks: A case study from Sanjiangyuan, China. Land Use Policy 2023, 129, 106659. [Google Scholar] [CrossRef] [Scilit]
  61. Mipun, P.; Bhat, N.A.; Borah, D.; Kumar, Y. Non-timber forest products and their contribution to healthcare and livelihood security among the Karbi tribe in Northeast India. Ecol. Process 2019, 8, 41. [Google Scholar] [CrossRef] [Scilit]
  62. Derebe, B.; Alemu, A. Non-timber forest product types and its income contribution to rural households in the Horn of Africa: A systematic review. For. Sci. Technol. 2023, 19, 210–220. [Google Scholar] [CrossRef] [Scilit]
  63. Talukdar, N.R.; Choudhury, P.; Barbhuiya, R.A.; Singh, B. Importance of Non-Timber Forest Products (NTFPs) in rural livelihood: A study in Patharia Hills Reserve Forest, northeast India. Trees For. People 2021, 3, 100042. [Google Scholar] [CrossRef] [Scilit]
  64. Richardson, R.B. Ecosystem Services and Food Security: Economic Perspectives on Environmental Sustainability. Sustainability 2010, 11, 3520–3548. [Google Scholar] [CrossRef] [Scilit]
  65. Poppy, G.M.; Chiotha, S.; Eigenbrod, E.; Harvey, C.A.; Honzák, M.; Jarvis, A.; Madise, N.J.; Schreckenberg, K.; Shackleton, C.M.; Villa, F.; et al. Food security in a perfect storm: Using the ecosystem services framework to increase understanding. Philos. Trans. R. Soc. B Biol. Sci. 2014, 1639, 20120288. [Google Scholar] [CrossRef] [Scilit] [PubMed]
  66. Balasubramanian, M. Forest ecosystem services contribution to food security of vulnerable group: A case study from India. Environ. Monit. Assess. 2021, 193, 792. [Google Scholar] [CrossRef] [Scilit] [PubMed]
  67. Balasubramanian, M.; Sangha, K.K. Integrating Capabilities and Ecosystem Services Approaches to evaluate Indigenous connections with nature in a global biodiversity hotspot of Western Ghats, India. Glob. Ecol. Conserv. 2021, 27, e01546. [Google Scholar] [CrossRef] [Scilit]
  68. Gao, Y.; Zhang, N.; Ma, Q.; Li, J. How is human well-being related to ecosystem services at town and village scales? A case study from the Yangtze River Delta, China. Landsc. Ecol. 2024, 39, 126. [Google Scholar] [CrossRef] [Scilit]
  69. Sangha, K.K.; Butler, J.R.A.; Delisle, A.; Stanley, O. Identifying links between ecosystem services and Aboriginal well-being and livelihoods in north Australia: Applying the Millennium Ecosystem Assessment framework. J. Environ. Sci. Eng. 2011, 5, 931–946. [Google Scholar]
  70. Adepoju, A.A.; Salam, A.S. Economic Valuation of Non-Timber Forest Products (NTFPs); Ladoke Akintola University of Technology and University of Ibadan: Ogbomoso, Nigeria, 2007. [Google Scholar]
  71. Olsson, A.; Campana, P.E.; Lind, M.; Yan, J. Potential for carbon sequestration and mitigation of climate change by irrigation of grasslands. Appl. Energy 2014, 136, 1145–1154. [Google Scholar] [CrossRef] [Scilit]
  72. Mengist, W.; Soromessa, T.; Feyisa, G.L. A global view of regulatory ecosystem services: Existed knowledge, trends, and research gaps. Ecol. Process. 2020, 9, 40. [Google Scholar] [CrossRef] [Scilit]
  73. Jose, S. Agroforestry for ecosystem services and environmental benefits: An overview. Agrofor. Syst. 2009, 76, 1–10. [Google Scholar] [CrossRef] [Scilit]
  74. Bratman, G.N.; Anderson, C.B.; Berman, M.G.; Cochran, B.; De Vries, S.; Flanders, J.; Folke, C.; Frumkin, H.; Gross, J.J.; Hartig, T.; et al. Nature and mental health: An ecosystem service perspective. Sci. Adv. 2019, 5, eaax0903. [Google Scholar] [CrossRef] [Scilit] [PubMed]
  75. IPBES. Transformative Change Assessment: Summary for Policymakers of the Methodological Assessment Report on the Underlying Causes of Biodiversity Loss, and the Determinants of Transformative Change and Options for Achieving the 2050 Vision for Biodiversity; IPBES Secretariat: Bonn, Germany, 2024. [Google Scholar] [CrossRef]
  76. IPBES. Global Assessment Report on Biodiversity and Ecosystem Services of the Intergovernmental Science-Policy Platform on Biodiversity and Ecosystem Services; Díaz, S., Settele, J., Brondízio, E.S., Ngo, H.T., Eds.; IPBES Secretariat: Bonn, Germany, 2019. [Google Scholar] [CrossRef]
  77. Sangha, K.K.; Dinku, Y.; Costanza, R.; Poelina, A. A comprehensive analysis of well-being frameworks applied in Australia and their suitability for Indigenous peoples. Int. J. Qual. Stud. Health Well-Being 2024, 19, 2321646. [Google Scholar] [CrossRef] [Scilit] [PubMed]
  78. Li, M.; Wiedmann, T.; Fang, K.; Hadjikakou, M. The role of planetary boundaries in assessing absolute environmental sustainability across scales. Environ. Int. 2021, 152, 106475. [Google Scholar] [CrossRef] [Scilit] [PubMed]
  79. Busch, J.; Ring, I.; Akullo, M.; Amarjargal, O.; Borie, M.; Cassola, R.S.; Cruz-Trinidad, A.; Droste, N.; Haryanto, J.T.; Kasymov, U.; et al. A global review of ecological fiscal transfers. Nat. Sustain. 2021, 4, 756–765. [Google Scholar] [CrossRef] [Scilit]
  80. Díaz, S.; Pascual, U.; Stenseke, M.; Martín-López, B.; Watson, R.T.; Molnár, Z.; Hill, R.; Chan, K.M.A.; Baste, I.A.; Brauman, K.A.; et al. Assessing nature’s contributions to people. Science 2018, 359, 270–272. [Google Scholar] [CrossRef] [Scilit] [PubMed]
  81. Daily, G.C. The Next Steps for Valuing Nature in Decision Making. Environ. Sci. Polic. Sustain. Dev. 2021, 63, 17–20. [Google Scholar] [CrossRef] [Scilit]
  82. Zheng, H.; Wu, T.; Ouyang, Z.; Polasky, S.; Ruckelshaus, M.; Wang, L.; Xiao, Y.; Gao, X.; Li, C.; Daily, G.C. Gross ecosystem product (GEP): Quantifying nature for environmental and economic policy innovation. Ambio 2023, 52, 1952–1967. [Google Scholar] [CrossRef] [Scilit] [PubMed]
  83. Dasgupta, P. The place of nature in economic development. In Handbook of Development Economics; Elsevier: Amsterdam, The Netherlands, 2010; Volume 5, pp. 4977–5046. [Google Scholar]
  84. Bush, G.; Taye, F.A.; Fleming, C.; Samndong, R.A. Evaluating the costs of primary forest conservation in the Democratic Republic of Congo, implications for policy and practice. J. Environ. Manag. Manag. 2024, 352, 119975. [Google Scholar] [CrossRef] [Scilit] [PubMed]
Figure 1. Value of timber provisioning services (Rs in lakhs). Source: Authors’ estimate based on MoSPI data.
Challenges 17 00030 g001
Figure 2. Timber provisioning services in Indian Rupees (Rs lakhs). Source: Authors’ estimate based on MoSPI data.
Challenges 17 00030 g002
Figure 3. Value of non-timber forest products (US$ million) Source: Authors’ estimate based on MoSPI data.
Challenges 17 00030 g003
Figure 4. Value of non-timber forest products (Rs in lakhs) Source: Authors’ estimate based on MoSPI data.
Challenges 17 00030 g004
Figure 5. Value of fish provisioning services (Rs lakhs) Source: Authors’ estimate based on MoSPI data.
Challenges 17 00030 g005
Figure 6. Value of carbon retention services at US$ million.
Challenges 17 00030 g006
Figure 7. Value of carbon retention in Rs lakh Source: Authors’ estimate based on MoSPI data.
Challenges 17 00030 g007
Figure 8. Value of nature-based tourism Source: Authors’ estimate based on MoSPI data.
Challenges 17 00030 g008
Figure 9. Total gross ecosystem product in Rs lakhs.
Challenges 17 00030 g009
Table 1. Selected ecosystem services, indicators and data sources.
Ecosystem TypesAccounting IndicatorsData Sources
Provisioning services
  • Timber products
  • Non-timber forest products
  • Fish production
  • Firewood
  • Forest Survey of India (2019)
  • Ministry of Statistics and Program Implementation (2020)
  • Environmental Statistics (2023), MoSPI
Regulating services
  • Carbon retention
  • Forest Survey of India
Cultural services
  • Nature-based tourism
  • Ministry of Statistics and Program Implementation (2020)
Table 2. 2011 to 2020–21 (Rs billion).
Ecosystem ServicesValue in Rs Billion (US$ Billion)
Provisioning Services
Timber provisioning services1913.24 (US$ 22.71)
Non-timber forest + firewood services1446.78 (US$17.23)
Fish provisioning services11.65 (US$ 0.14)
Regulating Services
Carbon retention14001.54 (US$ 166.73)
Cultural Services
Nature-based tourism14.55 (US$ 0.17)
Total17387.76 (US$ 207.05)
Source: Authors’ estimate.
Disclaimer/Publisher’s Note: The statements, opinions and data contained in all publications are solely those of the individual author(s) and contributor(s) and not of MDPI and/or the editor(s). MDPI and/or the editor(s) disclaim responsibility for any injury to people or property resulting from any ideas, methods, instructions or products referred to in the content.