1. Introduction
Augmented reality (AR) is an emerging technology that superimposes information on top of a person’s view anywhere in the environment. AR technologies can support navigation and operation on a ship’s bridge by combining the real world outside the vessel with data from bridge systems [
1]. However, the possibilities and premises for designing AR applications in the maritime sector are demanding to explore [
2]. The spatial, physical, and temporal possibilities of this technology challenge the current practice within the field of interaction design, which up until now has been mostly screen-based [
3]. In this early phase of building knowledge of how to design for AR, our aim is to develop design examples of AR applications in order to build useful design frameworks for AR which can potentially support practicing interaction designers [
4]. The background motivation for designing a software application for icebreaker assistance and convoy mode derives from our design-driven field research at sea [
5], where our interviews and observations with navigators demonstrated that the premises for icebreaker assistance had considerable potential for the improvement of safety for both the icebreaking vessel and the assisted vessels during these critical operations. Based on these findings, we have continued our human-centered approach with the aim of supporting the navigator to achieve enhanced control and overview during icebreaker assistance operations [
6].
The AR technology is becoming increasingly viable for maritime use, particularly when information needs to be integrated during complex operations, for example, in the Arctic [
7]. Maritime traffic in the Arctic is increasing, as previously unavailable shipping routes are becoming more accessible. The naturally harsh operating environment in the high north offers challenges for many shipping sectors and can have a remarkable effect on voyages. The lack of important data, such as weather reports, ice conditions, latitude errors, and varying global navigation satellite system positioning errors, makes navigational activities highly demanding, especially for navigators with little experience sailing in Arctic regions [
8]. However, accurate sensor data are not enough—available data need to be presented in a way that supports mariners efficiently during demanding conditions and stressful operations. Mistakes can have major consequences, and help is often out of reach in the high north [
9]. Therefore, ship bridges sailing in Arctic waters should be equipped with systems that support navigation and operations in ice.
Increased interest in and usage of passages in the high north requires an extended focus on facilitating and supporting safe operations. Icebreaker assistance in various forms is an important part of this situation, given that navigation in Arctic waters is regularly dependent on such support [
10].
Icebreaker assistance is commonly divided into five specific operation types [
11]: (1) vessel escorting operations involve an icebreaker breaking a channel of ice through which another vessel can follow at a particular distance, (2) breaking loose operations involve an icebreaker sailing near a vessel stuck in ice in order to release ice pressure, (3) convoy operations involve an escorting operation containing more than one vessel following, (4) double convoy operations involve two icebreakers sailing offset aligned in order to break a wider path for a broad vessel, and (5) towing operations involve towing the assisted vessel while breaking the path due to heavy ice pressure or a large amount of slush ice.
In ice-filled waters, such as the Baltic Sea, ship collisions are one of the most frequent accidents occurring during winter [
12]. Convoys are one of the most dangerous and unpredictable operations during the wintertime [
13]. The most crucial risk is represented by collisions between assisted vessels or between an assisted vessel and an icebreaker [
12]. Relatively high speed and proper distance must be maintained during the entire operation [
13]. Although crews on the icebreaker vessel recommend a certain speed and distance between assisted vessels, crews on the assisted vessels are responsible for maintaining this advice. This work can be challenging to both the icebreaker and the assisting vessel because it requires constant attention. A minor misunderstanding in communication or an operational variation can cause the vessel to deviate from the set speed and distance. Too little distance between two ships increases the risk of collision, whereas too much distance involves an increased risk of being obstructed by slush or stuck in ice [
13].
According to navigators on icebreakers, experience-based rules of thumb for leading operations in a safe way are important [
11]. They also emphasize the importance of systematic knowledge about operational characteristics and ship domains, including safe speed and distance according to the specific area. However, unpublished reports from field studies on icebreaker vessels conducted in the Safe Maritime Operations Under Extreme Conditions: The Arctic Case (SEDNA) project indicate that these requirements are not met optimally in the current bridge systems; navigators experience a lack of overview at several levels during icebreaker assistance operations. First, an overview of the assisted vessels is insufficient in digital bridge systems, which lack detailed key information. Second, in the physical overview outside the vessel, monitoring can be limited for other vessels during operations due to obstacles on the vessels and/or weather conditions, such as fog or darkness. Third, communication with the other vessels on very high frequency (VHF) radio may be unclear due to poor connection or language skills. A high situation awareness (SA) should be maintained for navigators leading icebreaker assisting operations by designing user interfaces (UIs) for bridge systems that take these specific user requirements into account.
The need for icebreaker assistance can arise from different situations, for instance, as a planned escort of a vessel with a lower ice class than recommended for the waters or rescuing a vessel stuck in the ice [
13]. During an assisted convoy operation of several vessels, the icebreaker secures a safe passage by breaking ice at the front and leading the other vessels through the path at an appropriate distance and speed to their requested targets. The icebreaker’s leading role requires careful monitoring of the other vessel’s key information, as well as clear communication to safeguard the progress.
Today, external communication between vessels during convoys is transmitted through VHF radios, where ships’ bridge crews exchange orders and answers. Due to potentially unstable connections and poor language skills, such forms of communication can easily lead to misunderstandings [
13,
14]. During a convoy operation, a misunderstanding, such as missing an order to “lower the speed to X knots,” can be fatal. The internal communication on the bridge, which is an important part of Bridge resource management (a tool for safety and error management, see [
15]), is particularly exposed to noise and poor system overview with data sharing during icebreaking operations. The monitoring can be supported by data from other systems, such as an Electronic Chart Display and Information System (ECDIS) or an Automatic Identification System, as well as by visual monitoring. However, accuracy and the degree of relative details of current systems are inadequate for icebreaker assistance operations; furthermore, research on the problematics of positioning in the Arctic region concludes that complementary positioning methods are required to achieve an accuracy of fewer than three meters [
16]. Examples of such positioning methods are laser-based position reference systems, such as SpotTrack [
17] and Differential absolute and relative position sensors, which are a dynamic positioning reference system [
18]. The accuracy of the positioning affects the input data and the possibilities for developing supportive UI representations for icebreaker navigators. By UI representation, we refer to the space where interaction between the user and the systems occurs, which is either physical, such as a keyboard; or digital, such as a screen; virtual, such as an AR UI. The UI representation should be fitted to the user’s situation in order to provide a sufficient overview.
Good SA is important, and in this case refers to the navigator’s capability to perceive and comprehend what is going on at the bridge, in the oceanscape, and on other vessels, and the ability to project future status [
19]. To maintain good SA throughout the operation, navigators need options for monitoring other vessels’ speed, distance, and relative value [
20]. In addition, a navigator must be able to have a full overview ahead to operate their own vessel. In the current situation, navigators need to perform a considerable amount of integration work between systems to sort and interpret key information [
21]. To meet this challenge, we suggest that a convoy UI should ideally be integrated to appear from the navigator’s point of view, such as by using AR technologies.
In recent years, the development of AR technologies has been rapid and market-driven, especially after the launch of head-mounted AR technologies, such as Microsoft Hololens [
22]. The potential for AR in the maritime domain shows a promising outlook [
23], and previous research has uncovered a range of suitable scenarios for its use on ship’s bridges [
3,
4]. Navigator’s SA and performance can be enhanced through the use of AR by functioning as an information support for navigating, regulating information overload, reducing integration work, and connecting digital and analogue information [
3,
23,
24,
25,
26]. Nevertheless, research on how to involve users’ needs in the design process of AR technology for the maritime domain remains limited [
4]. Therefore, we argue the need to develop tools with relevant and specific data and flexible UIs that support navigators with precise information on icebreaker assistance operations, such as during convoy operations.
We approach this problem by asking the following research question: How can AR support navigators during convoy operations on ice? We answer the question by, firstly, demonstrating an example of how AR can be designed as a bridge application with the potential to support the navigator’s SA during icebreaker operations. We describe and illustrate the UI concept with its functions and content. Secondly, we present a usability study of how end users have tested the application concept. The overarching approach for both the first and the second parts of this study is the application of contextual processing in a virtual reality (VR) simulator instead of on a real ship bridge [
27]. This methodological approach for concept development and user testing is described in detail in the Materials and Methods section. We evaluate the concept and test, indicate limitations in the current UI concepts, and discuss further developments.
In the SEDNA project, we have investigated how we can develop safe and efficient design concepts for AR-enhanced ship bridges through a user-centered approach. This approach involves mapping and analyzing current user needs. These methods affect how the usability of new design proposals can be evaluated and how the design frameworks we continuously iterate can be generalized for the design of new AR systems. This SEDNA research builds on and extends research from previous and ongoing research projects, such as the Onsite and Ulstein Bridge Concept and OpenBridge (OB). It connects to the OB [
28], where an extensive open design system is developed to make the UI design consistent on a ship’s bridges across vendors and equipment. This consistency implies preset rules for fonts, sizes, placement, appearance, colors, and, to some degree, logics for functions. Currently, the OB design system includes guidelines for screens and monitors of various sizes and qualities. However, expanding the OB design system to include AR-specific design guidelines is a relevant direction to examine further. We have used the foundation of the OB design system and further developed it to function for AR in this case study, designing better system UIs for icebreaker assistance operations.
The research is part of the EU project Safe Maritime Operations Under Extreme Conditions: The Arctic Case (SEDNA) and is one of several cases developed with the aim of improving efficiency and security for vessels operating in ice-filled waters.
In the following section, we describe the method for developing and evaluating our UI concept, the results, and the challenges and advantages of augmenting an existing design system through this case study.
2. Materials and Methods
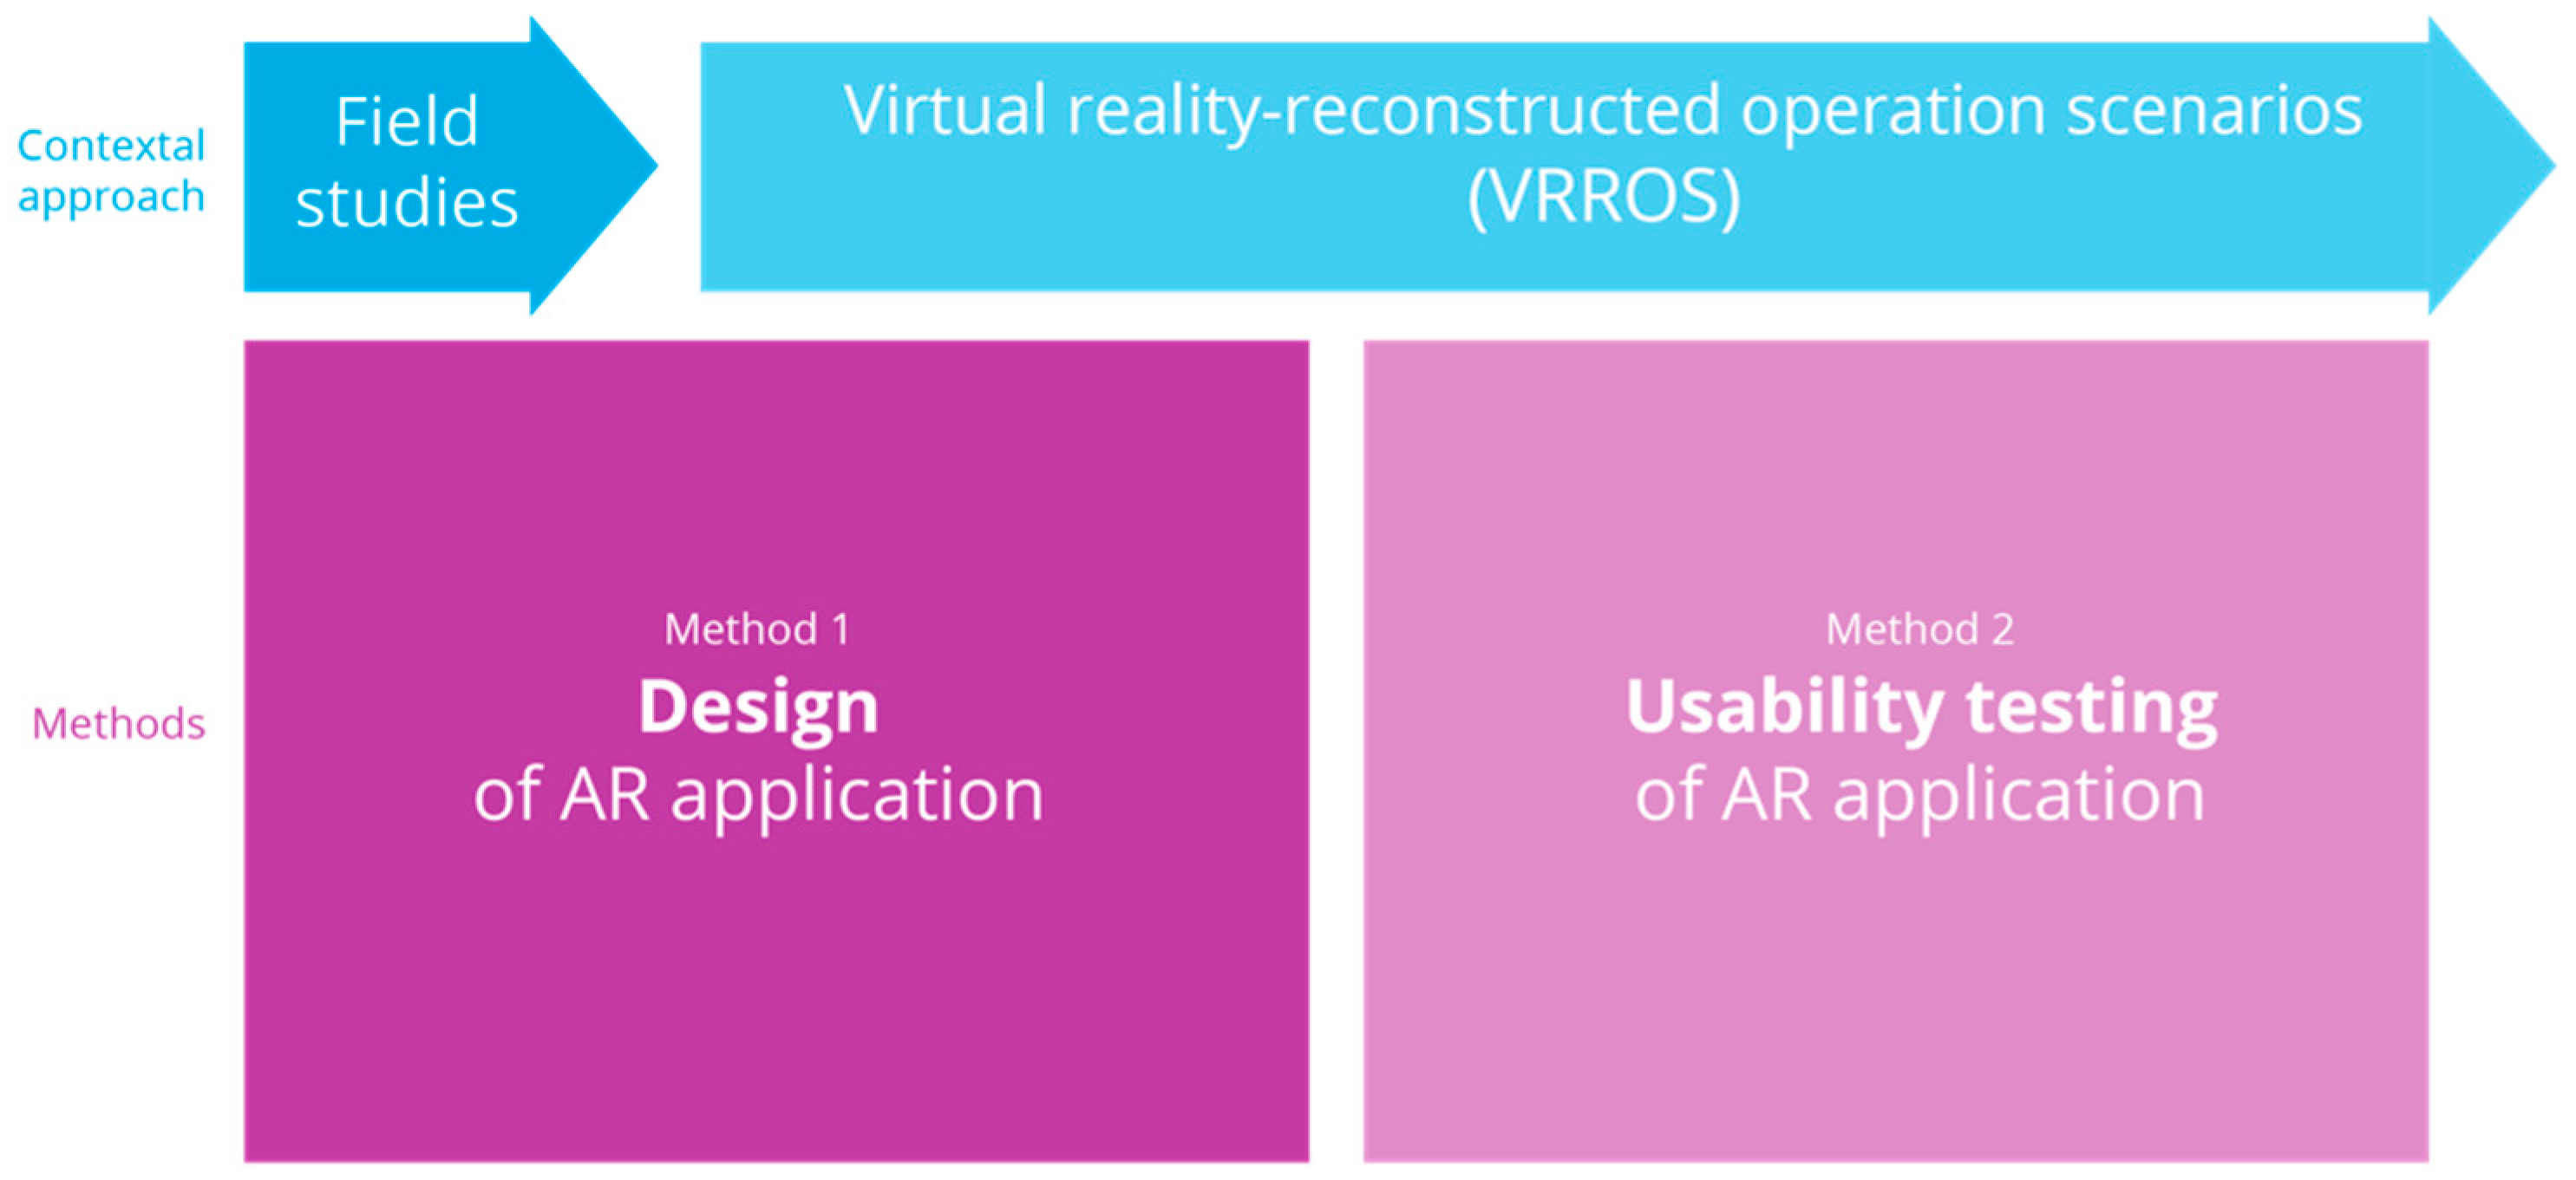
To investigate the potential of AR, we needed to both explore possible solutions by designing examples of application UIs and evaluate the usefulness of those solutions by conducting usability testing. Therefore, our method was twofold: the first part of the approach involved design of the AR application while the second part contained the usability testing (
Figure 1). We used two different contextual approaches for our methods during the study, field studies in real context during the first phase of Method 1, then what we define as virtual reality-reconstructed operation scenarios (VRROS) (described in the following paragraphs) during the last part of Method 1 and during the whole of method 2 (
Figure 1). In the following, we will describe in detail these two methods and the two different contextual approaches and how they are interlinked.
In Method 1, we used a human-centered design approach involving users in a way that emphasizes the human perspective throughout the research and design process [
6]. For interaction design processes, creating products and services that enable users to achieve their goals in the best way possible is the main purpose [
29]. In our case, supporting good SA is one of the goals. Therefore, many of the techniques and methods used for designing digital concepts, such as a bridge application, requires distinct understanding of both the use situation and the design situation [
30]. By implementing two different contextual approaches throughout the study phase called Method 1 (
Figure 1), we have maintained the important awareness of and distinction between the use situation and the design situation. In the following section we will describe the techniques and sub methods for design (Method 1) in this study.
The first part of our design phase was carried out in the contextual approach of field research expeditions on board several icebreakers operating and safeguarding different areas of Arctic and Baltic waters; our design process was undertaken in several stages of the project [
2,
3]. We used well-known field research methods, such as participatory observation [
31] and co-design [
32], and explored how methods and techniques for collecting quantitative data, such as eye-tracking data [
33], can be used qualitatively as a digital underlay for sketching in AR and forms of rapid AR testing and prototyping [
2,
3]. The data captured in the field research context resulted not only in familiarization and deeper insights into the users and user situations, but also in testable ideas and concepts that were further developed in the lab.
The second part of the design phase and the usability study needed to be completed in our labs, mainly due to strict travel restriction and limited access during COVID-19 in 2020. However, UIs for ships’ bridges should be designed with an emphasis on the situation in which they will be used [
4]. For most designers and researchers, the Arctic maritime context is an unfamiliar setting with hard-to-reach users [
34] and a demanding context to access and work in overtime [
9]. In order to continuously engage with this context after the initial field studies, our process contained a continuation of the previous fieldwork onboard icebreakers within a lab setting by using what we call VRROS (
Figure 2) [
27]. The VRROS represent the contextual approach for our second phase of design (Method 1) and for the whole process of usability testing (method 2). The VRROS have been developed in our lab by recreating icebreaker operations in a VR-enabled simulator. The operational scenarios were designed in collaboration with and verified by usability experts and expert end users. The VRROS proved to be ideal for design development of UI concepts in the form of visual prototypes embedded in and immersed with the VR environment in the VRROS. This allowed us to rapidly test and evaluate design ideas and concepts according to a simulation of existing premises on a vessel [
27,
35]. In addition, the VRROS approach allowed us to maintain involvement with users, designers, and human factor (HF) specialists throughout the design and testing process.
In this study, the chosen VRROS consist of a vessel stuck in ice, requiring assistance from an icebreaker and a resulting convoy operation (
Figure 2). The scenario contains a course of action from a defined start and an end with given premises, such as operations, targets, equipment, and weather conditions. A precise scenario timeline was described to achieve a high degree of realism. The detailed maritime context found in this scenario was then recreated in VR. The VR simulator is built with the Unity game engine, which can produce a realistic experience of contextual factors, such as light, weather, and icebergs, in parallel with the scenario timeline. This allows designers and researchers in the lab to test how ideas and concepts for AR technology can be applied at an early stage. The VR simulator functions as a tool for concept development and as a setting for future experimental testing of the concept.
The VRROS (
Figure 2) included three vessels: two cargo vessels and one icebreaker. The VR user was situated on the icebreaker ship’s bridge and had an overview of the existing console screens and the AR UIs. The vessel moved according to previously recorded bridge simulator data. Thus, the user could not control the vessel but could move freely around the bridge. The bridge systems were of modern standard, with consoles and large screens displaying ECDIS and radar interfaces designed according to OB design guidelines [
28] in a dusk palette. The VR scene lasted for 67 min, where the facilitator interface allowed the researcher to shift among five different chapters of the scenario timeline: (1) transit in ice, (2) break free, (3) convoy, (4) stop, and (5) loop back.
Designing for hard-to-reach environments by implementing and testing VRROS is a novel design approach. Through our studies, we were therefore simultaneously researching methodological potential. Some of the advantages were that the VRROS enabled us to isolate and concretize these separate parts of the scenario, which, from a technical perspective, could be defined as situations. Various premises, such as daylight, movement, and level of stress, could be set to occur during different phases of the operation within the scenarios. This allowed us to test adjustments of the AR information panes according to the current situation. Our aim is to develop designs for situational adaptation, which we define as UIs with which the user experiences meaningful interactions according to the situation. By developing VRROS, we can generalize a set of situations in which we can test several UI concepts, including a variety of situational adaptations, to explore how the interaction can be experienced as situated as possible. In this study, we investigated this potential by developing more operation-dedicated and situated UIs for monitoring and communicating with other vessels’ icebreaker assistance operations.
The current AR hardware has optical challenges when transmitting graphics in bright environments. We demonstrated that some of these challenges can be reduced by sunscreen [
35]. As technology progresses, we expect that the optical challenges will be remarkably reduced, and therefore we left the optical performance of AR technology outside the scope of this article. As a result, the figures in this article, which illustrate the AR concepts, are not optically correct but are rendered to illustrate the UI structure and functionality, given acceptable AR performance for a given context.
In this paper, we specifically describe the design proposal we developed for our own icebreaker assistance software application, containing key detailed information in strategically placed locations, filling the existing gaps in design. We focused on developing a specified mode for the application to be used during convoy operations. We developed several UI variations of the application with situational adaptations according to strategic placement in line with users’ points of view, contents, functions required, and daylight modes. In the following section, we describe how we evaluated the usability of the application.
As part of Method 2, representing the usability study of the design concept is described as follows (
Figure 1). Recruitment, which consists of purposive sampling, also known as judgment sampling, is a non-random technique used when a researcher needs participants to have certain qualities, skills, knowledge, or experience [
36]. Purposive sampling was used to recruit participants, primarily through word of mouth, who had achieved Master Mariner certification at some point in their career and had recent experience with navigational equipment either through simulations or real life. The participants were not required to have any experience in ice navigation as this was not deemed necessary by the research team. The original plan for user testing was to recruit both fourth-year Master Mariner students and experienced navigators from Chalmers University of Technology and local shipping companies. However, the COVID-19 pandemic affected the ability to recruit and test the desired sample. The participants were therefore primarily recruited internally at Chalmers University of Technology.
The ethical considerations in this study are described in the following procedure. When the participants arrived at the test lab, they were provided with information about the SEDNA project and a brief description of the test protocol. The participants were also briefed about the potential risks related to VR use, including dizziness, nausea, and eye fatigue, and were told they could stop the test at any point. Each participant was given a unique ID number, which was used throughout the test to ensure confidentiality.
Based on the demographic data, the seven users who evaluated the scenario were professional mariners. All the participants were Swedish males. One participant was 25–34 years old, one was 35–44 years old, and the remaining five were 44–54 years old. Six participants were employed by Chalmers University of Technology, three of which were Chalmers simulator instructors. One participant was currently serving onboard and was not associated with Chalmers. All participants were considered subject matter experts in maritime navigation. In addition to demographic information, the participants were asked about their previous experiences using VR. They reported that they either had no experience at all with VR systems (four responses) or little experience using VR systems (three responses).
The equipment was set up in a VR/AR test lab located at Chalmers University. The VR hardware used in the testing was a powerful PC equipped with a GeForce 2080Ti graphic card. The VR headset used in the test was the HTC Vive Cosmos. Additional equipment required to run the usability test included a video camera, an iPad, and a large TV screen. The tools used to communicate and share information between AHO and Chalmers included Box, a VR scenario developer, Zoom, TeamViewer, and Skype.
The procedures are described as follows. A pilot study was completed prior to the official data collection to ensure that the scenario was appropriate for subject matter expert evaluation. The pilot study consisted of a walkthrough of an example scenario to identify any potential issues with both the equipment and the test procedure. This provided the opportunity to obtain preliminary feedback on the AR features and helped to develop the final test questions for the participants.
Data collection was completed at Chalmers University of Technology in Gothenburg, Sweden, in October 2020, by two HF specialists. Both HF researchers were present throughout the data collection to observe, record participants’ answers, and assist with the VR controls and maneuvering through the scenario. Participants were asked about simulator sickness (dizziness, feeling unwell, nausea) multiple times throughout the testing period. No participants reported any symptoms of sickness at any point. Once consent and familiarization were completed, the participant completed a tablet-based demographic pre-test questionnaire. When finished, the researcher provided the following instructions to the user:
The overall aim of this usability test is to evaluate specific AR solutions for enhancing situation awareness for navigators on the bridge. For this test, we recreated an icebreaker and convoy scenario in VR. The vessel follows a predefined path; in other words, you are not able to control the ship. We used vessel movement data from a simulator walkthrough with the accompanying RADAR and ECDIS screens. We want you to focus on how the different AR solutions may or may not enhance your awareness of what is going on, and specifically if/how the AR solutions could lower the risk of this specific operation. The scenario is divided into five “scenes”. You will get to experience each scene for as long as you want before moving on to the next scene. You can also go back to a previous scene or replay a scene. The scenario in total will take approximately 60 min. The quality and resolution of the VR headset are limited, and it might be hard to see some of the details. We assume that the AR quality will get much better, so try to imagine that the visual quality of the AR graphics is better than what you see in this test.
We want you to talk aloud during the exercise—describe what you see and how you experience/interpret what you see. We will also ask you specific questions about the different AR solutions; however, say whatever comes to mind as you experience the scenario. There is no right or wrong answer; we just want your honest opinion about the different solutions. We will ask you several times throughout the scenario if you feel sick, nauseous, or uncomfortable. We will stop the scenario if you feel unwell at any point.
The scenario began when a participant was seated and relaxed (
Figure 2). The researchers allowed the participants to become comfortable on the virtual bridge. Most of the time, as they explored the bridge, a discussion about the UI concept emerged naturally. If the participants did not initiate a discussion themselves, they were prompted by the researcher. The UI concepts tested in the usability study are listed below (
Table 1) and further described in the results.
A mixed-methods approach was adopted to collect and analyze the data. The focus was primarily on qualitative data obtained through a think-aloud protocol. Think-aloud methods allow participants to talk out loud or verbalize their thoughts while completing a specific task [
37]. Both concurrent and retrospective verbal reports were completed throughout the data collection. The concurrent report involved the participants speaking out loud throughout the scenario as they encountered a specific AR solution. They spoke about what they saw and were probed with pre-determined specific questions about each AR feature if needed. The retrospective verbal report was completed post-scenario and required the participants to reflect on their experiences. They were asked to recall any additional comments or feedback about either the AR features or the VRROS experience.
In addition to the think-aloud protocol, HF specialists observed the participants throughout the entire scenario. The test setup allowed the researchers to have the same view as the participants through the TV screen while also observing their body language and movements (
Figure 3). Any interesting observations were noted and added to the participants’ testing sheets.
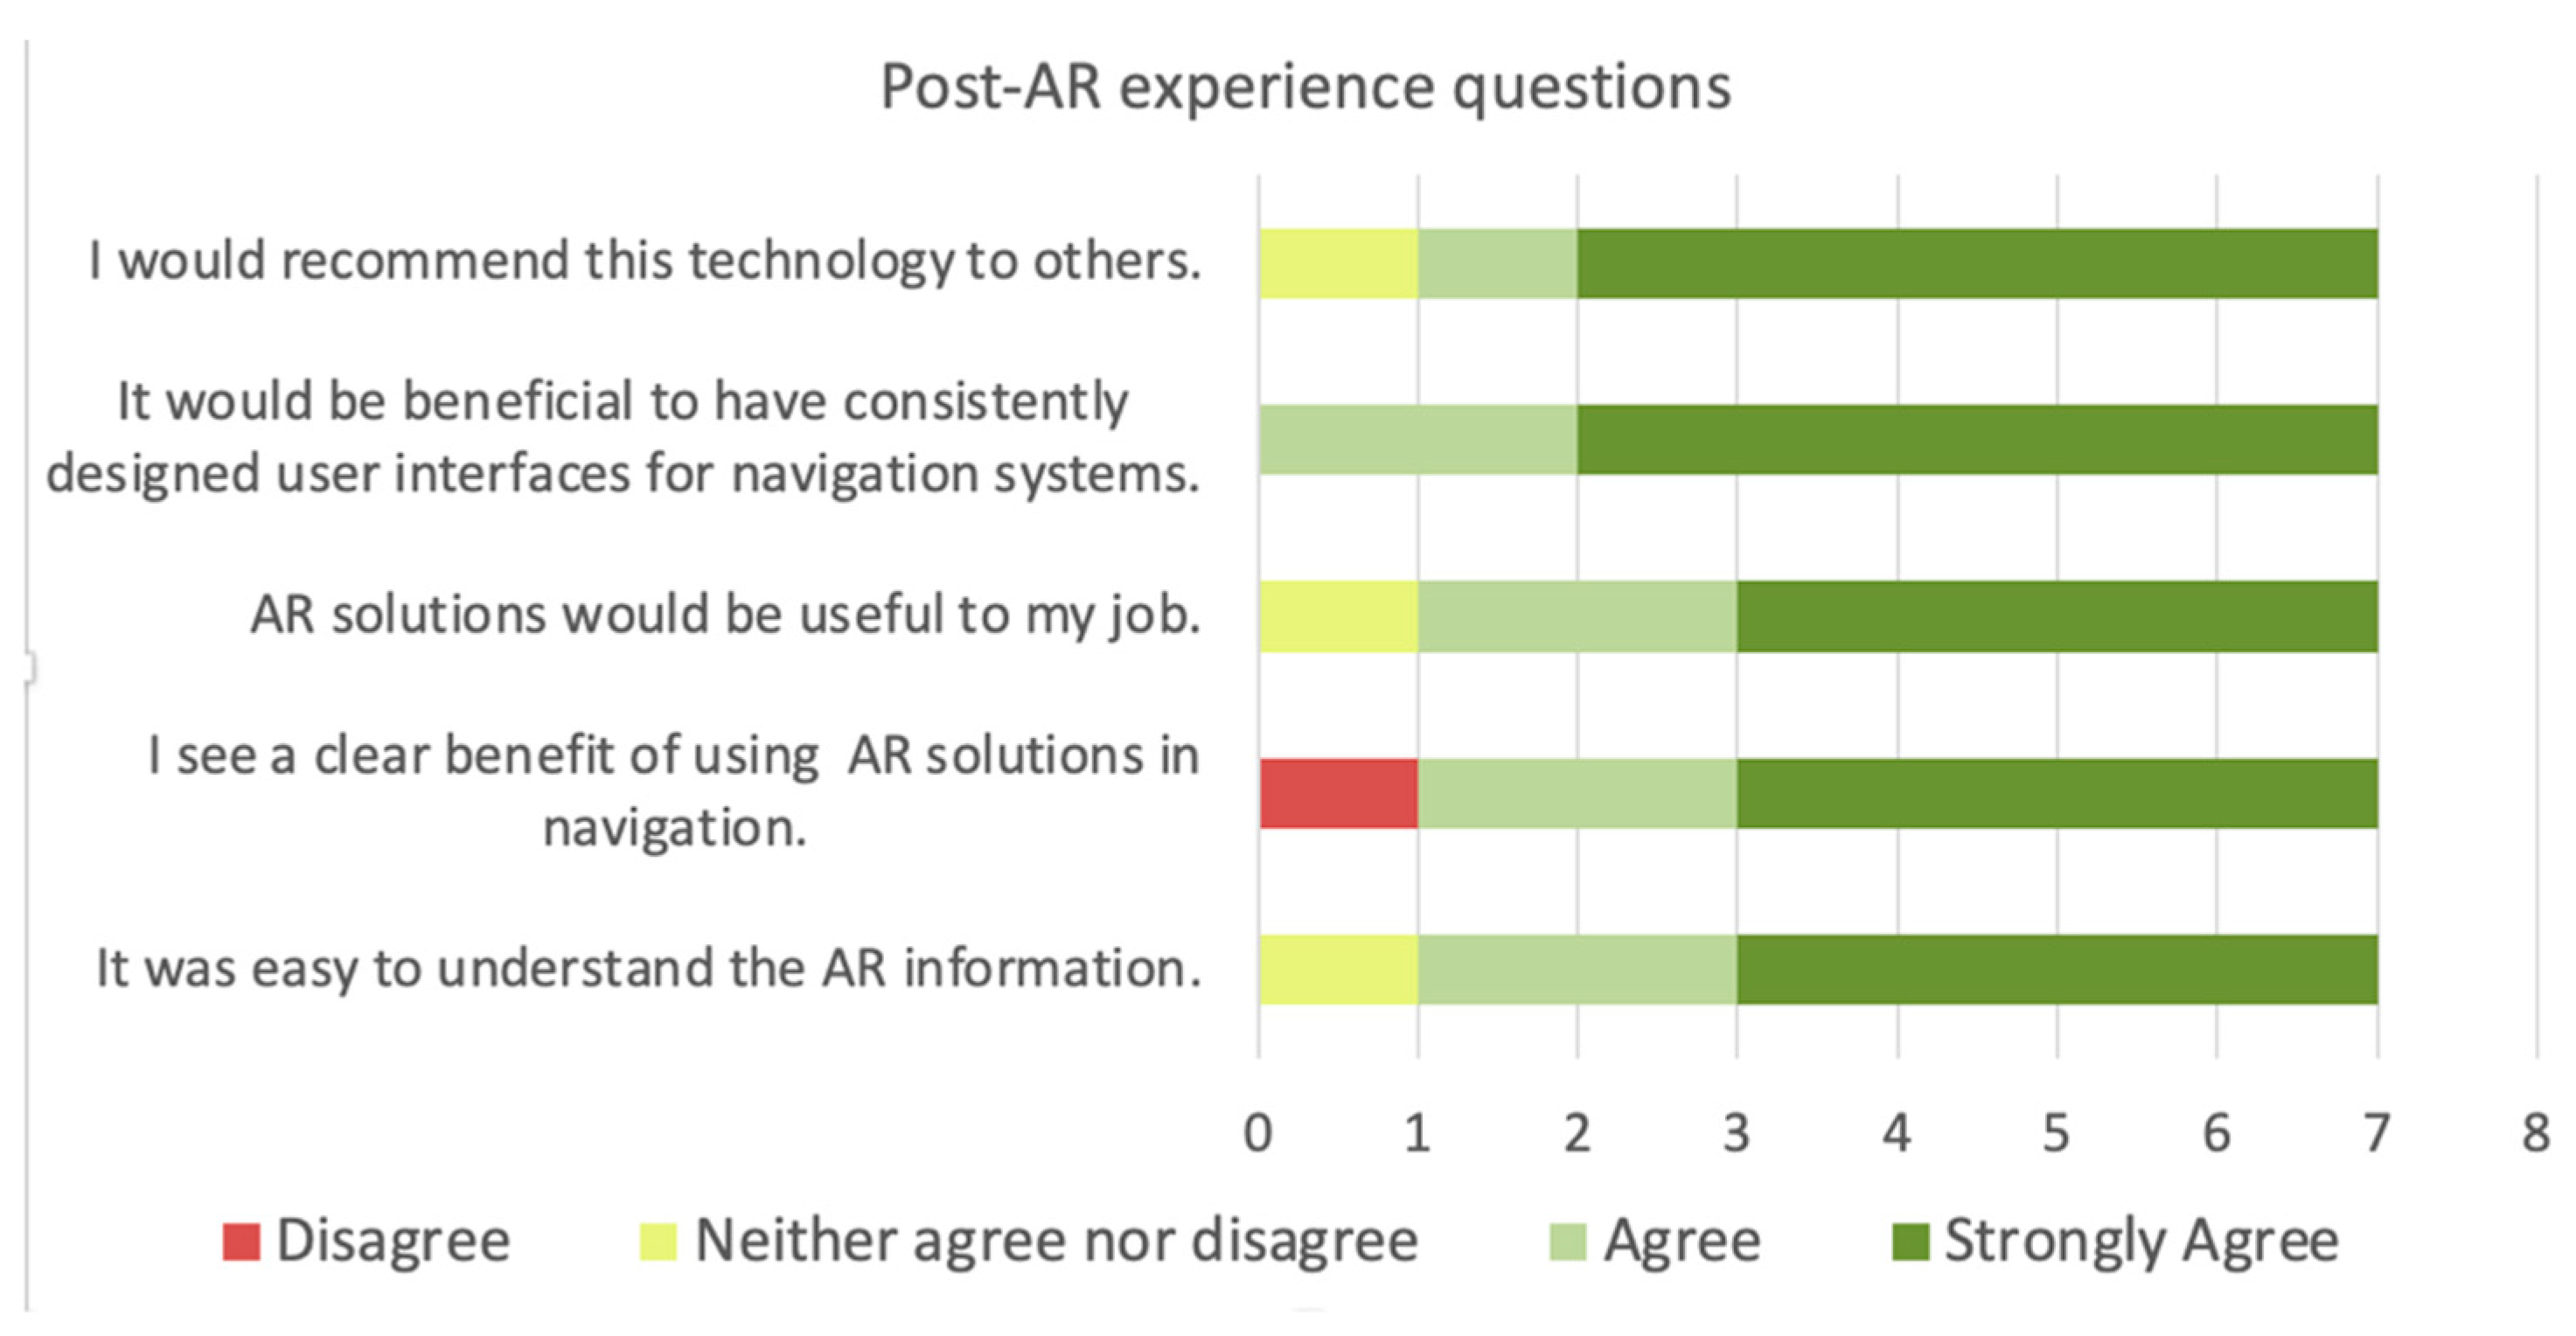
In terms of quantitative data, two questionnaires were developed using the software SurveyMonkey [
38]. A basic demographic questionnaire was administered at the beginning of the test day, which captured the user’s demographics, previous VR experience, and AR expectations. A post-test questionnaire was administered at the end of the test day, which asked specific questions about the usefulness of the AR technology and attempted to obtain a quantitative assessment of the user’s overall experience using the technology.
The qualitative data were analyzed by two HF specialists who were present during the data collection. This process was followed to provide a cross-check system to ensure that the data were correctly interpreted. The data were first transcribed individually by each HF specialist, and then the transcripts were compared for consistencies or discrepancies. Once the researchers were satisfied that the transcripts reflected reality, both the individual participant transcripts and a summary of the comments about each AR widget were delivered to the design team. The questionnaire data were analyzed using basic Excel functions to summarize the demographics and the post-test questionnaire results.
4. Discussion
In this paper, we present a concept showing how an AR UI can be designed to support icebreaker and convoy operations in ice. Although the usability study shows promising results, the application concept is premature from a design for new technology perspective, and further research is needed to determine if the app concept can actually support icebreaker operations by improving usability, efficiency, and safety. However, the rationale behind this study is to develop an evaluable example. In the following sections, we discuss some quality factors that we believe are important to highlight in regard to the research question.
Coordinated vessel data are an important usability issue. Relevant data from several vessels in a uniform UI setup make it easier to monitor all ships at the same time. The navigator will be spared from having to do demanding integration work between systems to compare key data, such as speed, heading, and propulsion. An icon representation of the vessels in the correct order makes the UI comparable to a real-world situation. The relative values between each vessel are a new parameter that the application offers, which navigators must manually calculate today. Furthermore, a coordinated application, such as icebreaker assistance, can reduce the need for verbal communication between the icebreaker navigator and the supported vessels. Today, the primary mode of communication is via VHF radios, even though they are associated with a high risk of miscommunication and misunderstanding [
40]. The proposed application can transmit key data, information, and commands, thereby reducing the risk of misunderstandings and improving communication between team members to help obtain shared situation awareness. A shared SA can be defined as a shared understanding of a situation among team members at one point in time [
41].
A convoy scenario is a specific type of operation that could directly benefit from coordinated vessel data and improved shared SA. As an example, during user testing, one of the participants who had extensive real-world experience in ice navigation spent most of the time looking out the bridge wing windows away from the main control station. He indicated that experienced ice navigators focus on the visuals, feel of the vessel, feedback from the engines, and ice movements according to ship movements. Normally, this navigator would rely on their colleagues to report the numerical information necessary to fully understand the situation while also clearly reporting their personal understanding of the situation. This information loop is at risk of miscommunication and misunderstanding. The application would allow the navigator to stand on the bridge wing to look out the window while also being able to see the status and distance to nearby vessels in all situations when multiple vessels are close to each other, along with others present on the bridge. In addition, we propose that all the vessels in the convoy should have access to the application and the coordinated vessel data, which would further promote a shared SA between all vessels and increase the transparency of decision making.
Situation-based UIs have the potential to improve usability. The concept demonstrates a situation-based adaptation of the application by dividing it into two different modes, representing the stages of the operation. We suggest that the modes are manually set by the user. The number of modes could potentially be increased if user needs in the different stages of the operation proved to be remarkably different. We also suggest that modes for critical stages in an icebreaker operation, such as breaking another vessel free from ice, might need an individual mode with a UI setup adapted to high levels of stress. This implies removing unnecessary information and perhaps enabling multiple output modes, such as voiceover for critical data. We suggest that designing applications with several situational modes for complex and sequence-based operations, such as icebreaker assistance, can be a way to support the operation and increase safety. The application also adapts to the user situation by offering different UI representations adapted to different user zones in the bridge. User zones, also referred to as AR zones, refer to a sectioning of the bridge (or workspace) based on physical, spatial, and conditional characteristics, such as poor or good view of a certain element, and user needs, such as the need to monitor another system or handling devices [
4].
What impact on safety can applications, such as Icebreaker Assistance, have? The maritime industry is technology driven [
42], and ensuring that new technology will support the operator rather than introduce unwanted risk is important. When asked about safety, the participants agreed that highlighting various types of critical operational information at the right time could improve safety. Furthermore, the participants believed that the UI concept could improve their SA through the ability to maintain a consistent lookout while having access to critical information. When asked if these UI concepts could reduce the risk of a convoy-related accident, six out of seven participants agreed that the risk of an accident would be reduced, and one participant was torn between the benefits and risks of the technology.
Identifying the risks is important, given that integrating AR technology in maritime operations has potential safety concerns. This matter was one of the post-test questions that was discussed with the participants. In general, the participants raised concerns about the possibility of information overload, especially in high-traffic areas. They indicated that the only way that this technology could be used safely is for the user to have the ability to turn it on and off, and the ability to remove the headset whenever needed.
Furthermore, some of the UI representations caused confusion for the participants. One example was the POI arrow symbol indicating another ship (
Figure 6). All participants had varying ideas of what this represented and determined that it was not easy to understand, which could lead to a risk of distraction. This reiterates the importance of user testing and user involvement in the early stages of the design process for the application to be able to quickly adapt solutions to user needs [
23]. Finally, in some parts of the scenario, the information overlapped, which the participants noted as something that should be avoided as much as possible. Displaying one information layer at a time should be possible to reduce confusion. Overall, these safety concerns are minor and can easily be adapted in the design phase through the feedback process adopted in this study. New technology always poses risks; however, the potential safety benefits of this technology seem to outweigh its potential risks.
Several limitations have affected the method. User testing was completed during the COVID-19 pandemic. This caused adaptations to the test protocol, including safe distancing and increased sanitation practices. Furthermore, COVID-19 restrictions caused a reduction in participant availability, resulting in a relatively small and homogeneous sample size. However, for usability studies, five test persons have been cited as enough to find most of the usability issues with a product, with any more leading to an observation of repeated results [
43,
44]. Data saturation was experienced during the final stages of the scenario testing, which led the researchers to finalize the data collection. Although it is a widely used method, the think-aloud protocol has some limitations. This method has been criticized for its ability to capture participants’ genuine thoughts about the activity, given individual personality traits, and the ability to verbalize thoughts in a research setting [
37]. An additional challenge with this method is ensuring that participants feel comfortable being honest and potentially critical about their reflections. Although challenging, the test setup and participant group in this study decreased the influence of these limitations. The participants in this study were seafarers who were trained in talking through their thought process for decision making in critical situations, meaning the think-aloud protocol was somewhat natural for them. Furthermore, the distribution of the research team between Oslo and Gothenburg allowed the HF specialists conducting the test and the AR architects and designers to operate independently, which was clearly communicated to the participants. We believe that this setup helped the participants feel comfortable in criticizing the scenario, as the researchers who were present at the data collection were not responsible for developing the solutions.
Another important issue we would like to bring into the discussion is the effect that a consistent UI architecture has on usability. The UI concept presented is designed to be a part of a consistent UI design for all ship bridge workplaces. Design consistency is an important quality for UIs because it improves a user’s ability to switch and transfer competence, logic, and skills between different UI units and across various systems [
45]. Given that AR equipment will be used with existing workplaces, we believe that it should share characteristics with other interfaces on the ship’s bridge. To achieve such consistency, we built the AR UI on the OB design system, an open-source platform that enables various vendors to develop cost-effective, safe, and efficient UIs for the maritime domain. One of the core goals of OB is to achieve improved design consistency across a workplace assembled by systems from multiple vendors [
39]. The design system is in continuous incremental development through several industry-driven research projects. This form of the standardization of navigational equipment seems to show obvious advantages for both vendors and users, as the registration rate for using the OB system is continuously increasing.
The AR interface development has adapted components for OB to AR and produced results that will be used to extend OB guidelines to cover AR applications. This is an important contribution, given that limited precedence exists in research and practice on how to design AR interfaces for ships. The proposed design cases will help build better knowledge of AR solution space for maritime applications.
Furthermore, the use of VRROS for concept development and testing is a novel approach for design development. In this study, AR UIs were realized in VR to develop and test AR concepts. Interpreting and adapting the OB design system to work for AR is challenging, both in terms of development and testing, for several reasons. Accessibility to the user context is limited. It is highly necessary to conduct field work to develop and test AR prototypes, given that they closely connect to the physical context. The use context has rapidly changing conditions, which alter the premises for design. Finally, conducting design processes within the user context is very demanding.
The VRROS provide the opportunity to overcome several of these challenges with its easy access and manipulatable conditions, and a far less demanding environment to design within. In addition, access to perform usability testing had a far lower threshold than testing in real conditions. The methodological approach of performing virtual fieldwork through the use of VRROS was also tested on master’s students at AHO due to COVID-19 measures in Autumn 2020 and tends to have high efficiency for quick prototyping and evaluation of UI ideas. Despite the efficiency of virtual fieldwork and testing, we would like to emphasize that we believe that development and usability testing in a real-world context would most likely have revealed several other relevant requirements and problems with the design that needed to be tackled. As such, we see the VRROS approach as a complementary addition to real-world design development and usability testing.
Throughout the testing, the participants were asked about their experience of testing AR UIs in VR. Most of the participants were skeptical at first, given their limited knowledge of and exposure to VR technology. However, once acclimated to the VR environment, all the participants recounted a positive experience, with no feelings of malaise at any point throughout the study. This resulted in a high level of user acceptance of VR to evaluate the UI concepts. In addition, every participant commented on the high-quality visuals and overall realistic feeling of being on the bridge. Immersive technologies, including virtual reality, AR, and mixed reality, are becoming more viable options for maritime education and training [
46]. This study provided a positive experience, and as the technology improves, immersive technologies will likely become even more affordable and available for maritime research.
Regarding further development of the concept, the Icebreaker Assistance app concept is incomplete, and several aspects need to be explored, defined, and further developed. Some examples that are planned to be further developed include the activation of convoy mode; a convoy planning tool; distributed representation of data, alerts, and notifications; the use of the application in other situations.


