Article

Bulk Chemical and Optical Spectroscopy Characterisations of Dissolved Organic Matter Extracted from the Tropical Coastal Sediment

by
Noor Fazreen Dzulkafli
1,2,
Akbariah Mahdzir
2,* and
Hirofumi Hara
3
1
Faculty of Engineering and Life Sciences, Universiti Selangor, Bestari Jaya 45600, Selangor, Malaysia
2
Malaysia-Japan International Institute of Technology (MJIIT), Universiti Teknologi Malaysia, Jalan Semarak, Kuala Lumpur 54100, Malaysia
3
Department of Biotechnology, Graduate School of Agricultural and Life Sciences, The University of Tokyo, 1-1-1, Yayoi, Bunkyo-Ku, Tokyo 113-8657, Japan
*
Author to whom correspondence should be addressed.
J. Mar. Sci. Eng. 2021, 9(9), 997; https://doi.org/10.3390/jmse9090997
Submission received: 30 July 2021 / Revised: 8 September 2021 / Accepted: 10 September 2021 / Published: 13 September 2021

Abstract

:
The study of organic matter characterisation in coastal sediment is useful for understanding how dissolved organic matter (DOM) reactivity influences the fate of pollutants in the aquatic environment. However, there is little information available on the structural properties of DOM in coastal sediment. Chemical analysis, UV-Visible (UV-Vis) absorbance, fluorescence, and Fourier-transform infrared (FTIR) spectroscopy were used in this work to characterise and compare the components of water-extractable organic matter (WEOM) fractions from sediment from an estuary, a coastal area, and a port in Peninsular Malaysia, Malaysia. The elemental analysis (H/C and C/N ratios) of the three samples differed, which coincided with the findings of optical indices estimated from UV-Visible and fluorescent spectroscopy analyses. WEOM had an average output of 7.05 to 8.47 mg/L and was very dominating with heavy fraction organic carbon (HFOC). In DOM-KS and DOM-K sediments, the allochthonous component with a high degree of condensation and the aromatic compound was the dominating composition. Meanwhile, the DOM-KT possessed a high autochthonous composition as well as carboxylic and phenolic content. Correlation analysis indicates that the aromaticity index SUVA254 and humification index (HIX) have positive correlations. The combined results of the chemical and spectroscopic analyses indicate that different coastal ecosystems, with the integration of various human and land activities, produce variations in DOM in the coastal area.

1. Introduction

Coastal areas, which serve as the dynamic interface between land and marine ecosystems, play critical roles in global carbon cycling. It was estimated that 80% of the total organic carbon preserved in marine sediments is found within the deltaic and shelf regions. Coastal surface sediments serve as a major carbon burial interface, receiving huge amounts of organic carbon generated in upper waters, degrading (mainly by microorganisms), and eventually burying it [1]. Sediments, on the other hand, collect natural and anthropogenic products from the overlying water, functioning as both a sink and a source of contaminants. Coastal sediments may function as a non-point source of contaminants, especially damaging to species and human health via trophic transfer. Coastal sediment has a lower organic carbon concentration and a greater salt content than soil, making organic matter characterisation more challenging in sediment [2].
DOM has piqued the interest of academics in recent years due to its critical functions in the complexation, distribution, bioavailability, mobilisation, and immobilisation of contaminants in the marine ecosystem [3,4]. DOM represents the active organic matter reservoir in soil, sediment and aquatic environments [5] that are composed of a mixture of different macromolecules with diverse chemical compositions, functional groups and structures [6] resulting from the degradation of natural and anthropogenic input [6]. Evidence has shown that the chemical composition of sediment DOM may vary with climate, proximity to the shore and the relative contributions of marine and continental organic matter residues [7].
Previous studies were carried out across the globe to characterise DOM, in soil, lakes, rivers and seawater [5,8,9,10]. Nonetheless, the data on DOM extraction from the coastal sediment, especially in the tropical region are scarce [11]. The nature and structure of aquatic organic matter are still poorly understood due to its ambiguity and heterogeneity. DOM is one of the largest pools of reduced carbon in the marine environment that is poorly characterised [12,13]. The characteristic of DOM is frequently analysed using a molecular approach via an elemental analyser and spectroscopic techniques such as UV-Vis and fluorescence spectroscopy [3,8,14].
Tropical coastal ecosystems have long been recognised for their high productivity, diverse biodiversity, and range of ecosystem services. These ecosystems, however, have undergone significant deterioration as a result of human and natural effects such as pollution, eutrophication, sedimentation, overexploitation, habitat destruction, and climate change. Peninsular Malaysia, located in the tropical area, is bordered by major waterways, including the Malacca Strait and the South China Sea. However, there has been no study pertaining to the systematic DOM evaluation for coastal sediments of Peninsular Malaysia. Because of their effects on a range of environmental processes, knowledge on the compositions of DOM is essential for understanding their reactivity with contaminants and biogeochemical processes.
The focus of this study was to describe and compare the chemical and spectroscopic features of DOM extracted from tropical coastal sediment. The findings have the potential to serve as the baseline for the establishment of the links between the physical and chemical properties and bioavailability of DOM and its possible transformation reaction.

2. Materials and Methods

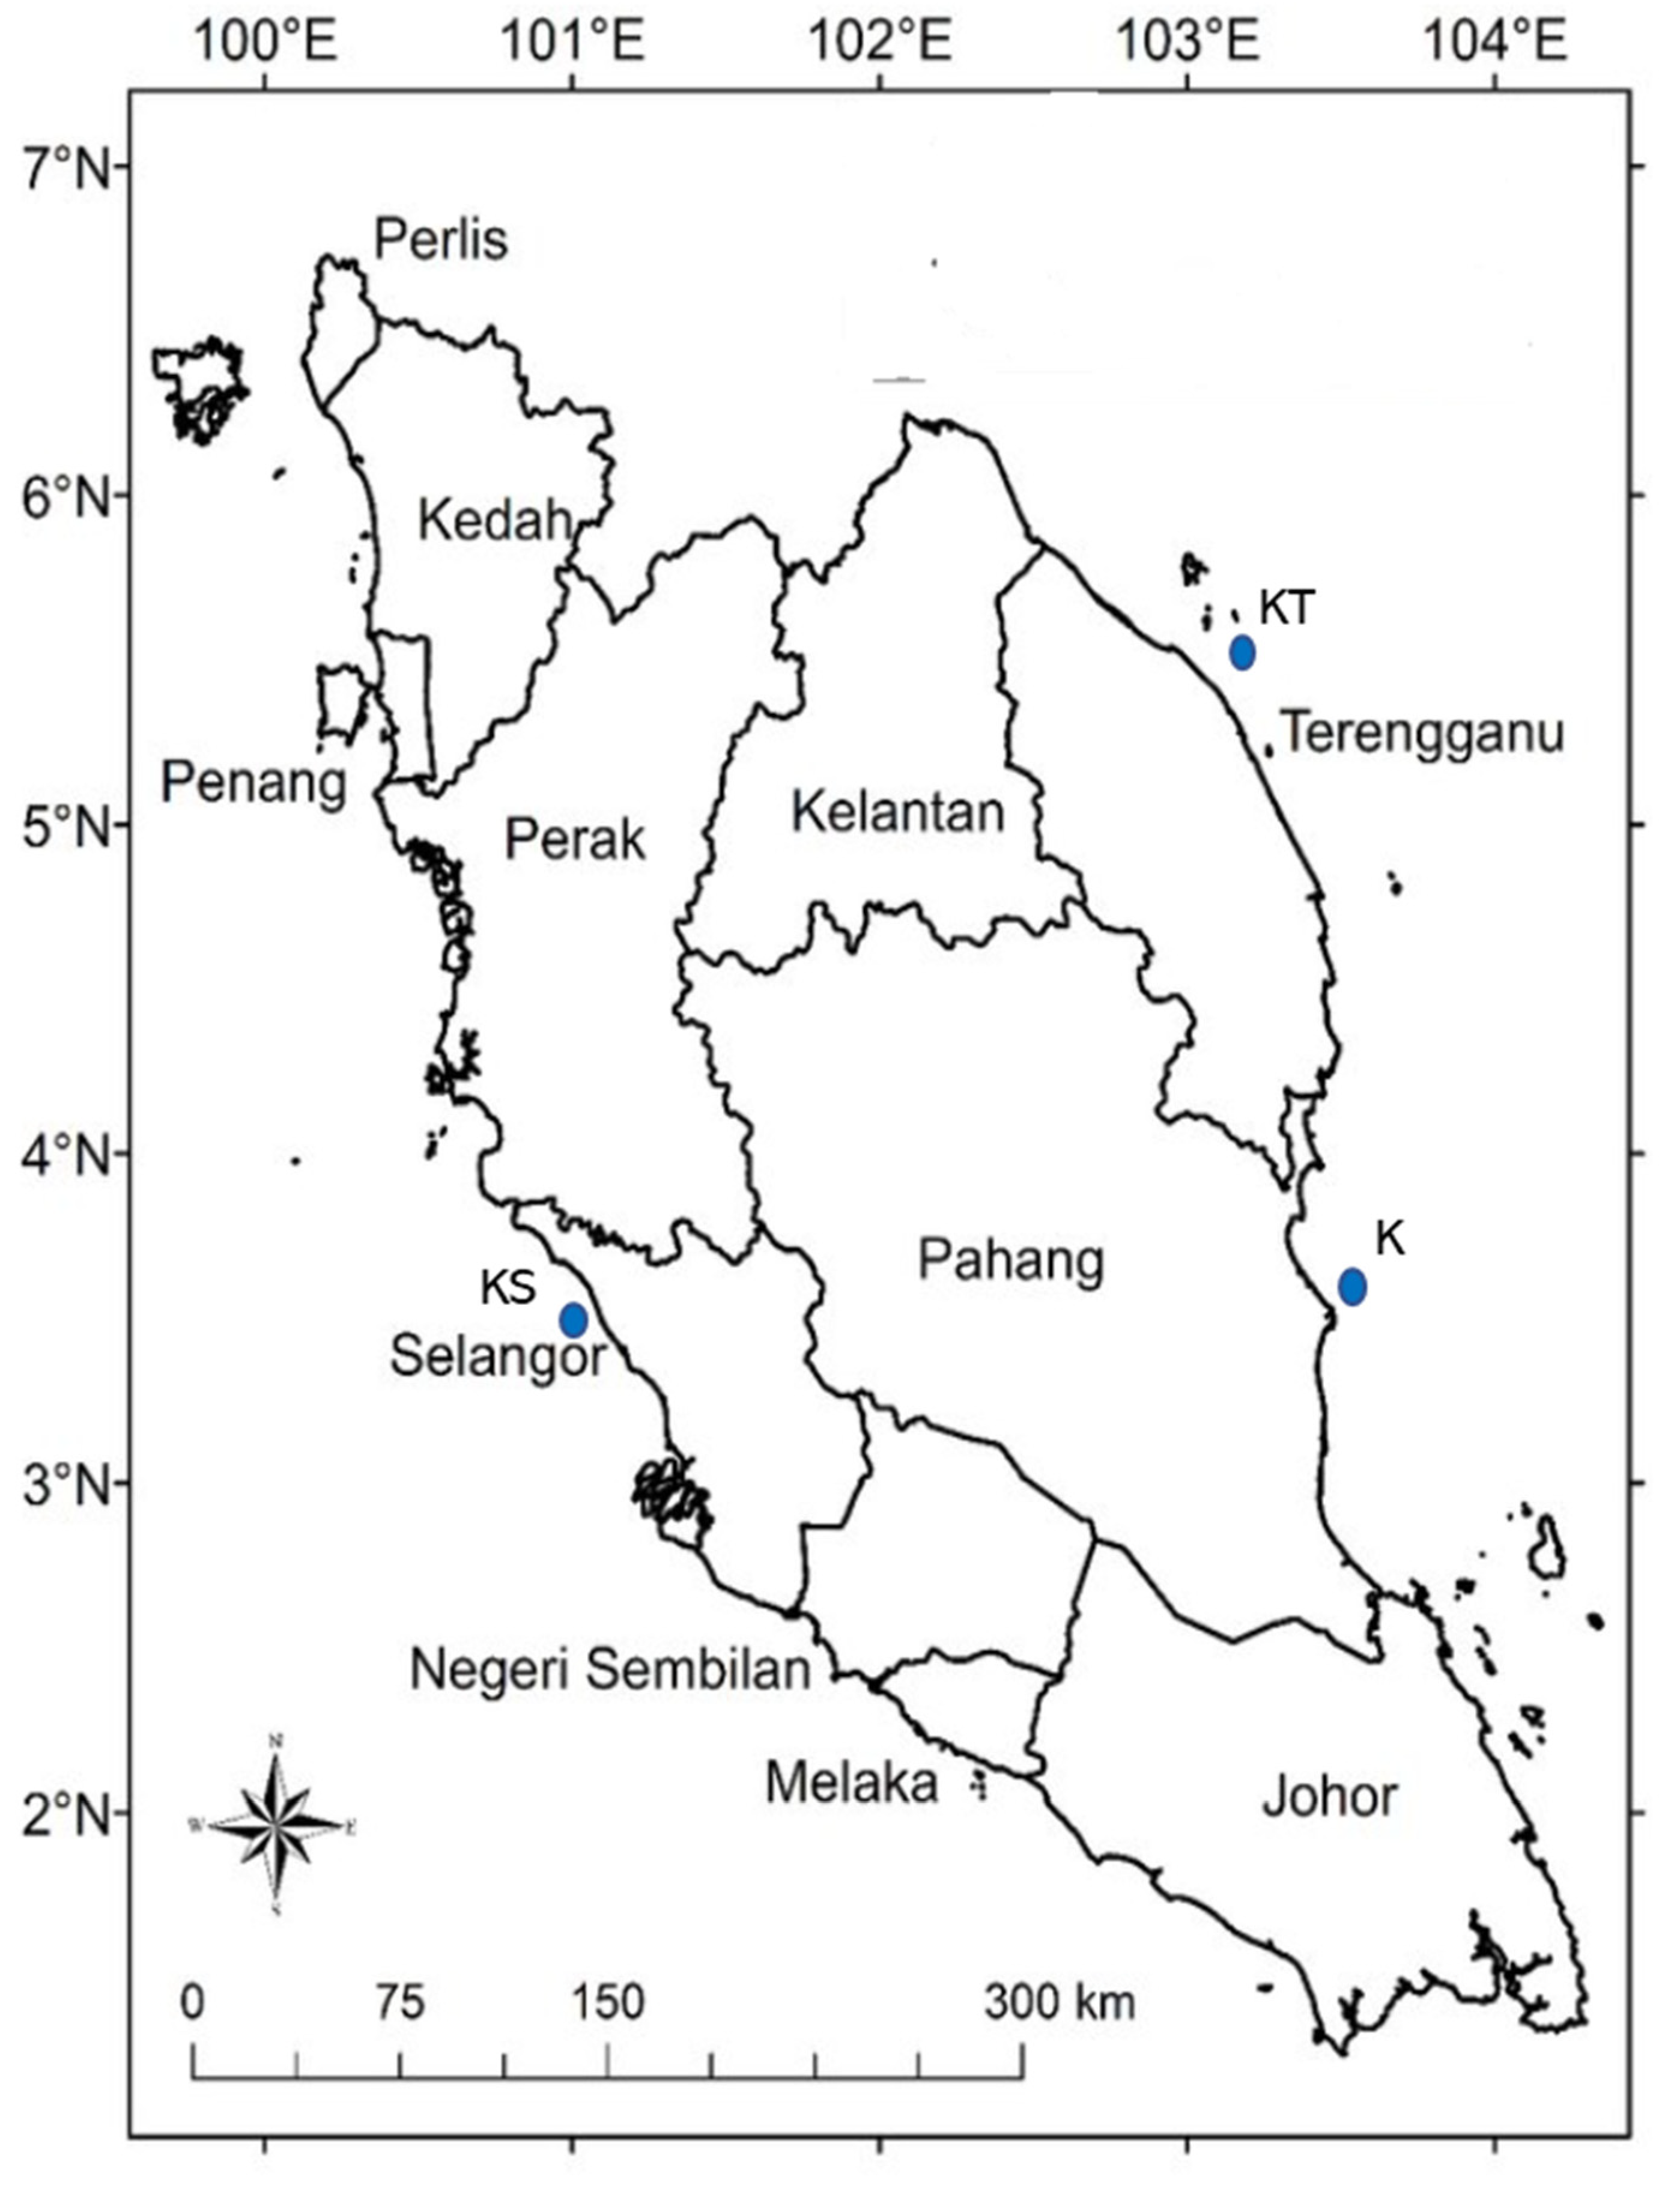
2.1. Study Area, Sample Collection and Sample Pre-Treatment

The study was conducted in the coastal water of Peninsular Malaysia. Peninsular Malaysia is surrounded by the Straits of Malacca in the west and the South China Sea in the east, with a coastline size of 2068 km. The west coast of Peninsular Malaysia faces the Strait of Malacca which is the shortest shipping route for transportation of oil tankers from the Middle East to Asian countries such as Japan and China. As a result of heavy oil tanker traffic, it is highly susceptible to marine-based oil pollution. At the same time, increasing urbanisation and industrialisation on the west coast has resulted in high loads of land-based anthropogenic pollutants carried to the coastal areas by the rivers. The east coast of Peninsular Malaysia is situated along the coast of the South China Sea and are experiencing rapid industrial development due to petrochemical industries, agriculture and aquaculture activities and urban development. In addition, major ports (i.e., Kuantan Port) a multi-cargo port has served as an important seaway to major ports in Asia-Pacific regions [14].
In this study, three surface coastal sediment samples were collected from three coastal environments namely: Kuala Selangor (KS), Kuala Terengganu (KT) and Kuantan (K) (Figure 1). Sampling activity was conducted between March 2016 and June 2016. The sediment samples were collected by using Smith McIntyre grab sampler, transferred into plastic containers, and stored at 4 °C and then transported to the laboratory. For every sampling station, three sub-samples were collected. Details of the sampling stations were described in Table 1.

2.2. Bulk Marine Sediment Analysis

In the laboratory, the wet sediment samples were air-dried at room temperature and later sieved through 100 mesh screens to eliminate coarse impurities such as rocks, plant matter, and mollusk shells. The marine sediments were air-dried in a 60 °C in an oven until they reached a constant weight and then homogenized in an agate mortar. Sediments pH was measured at a 1:2.5 (w/v) ratio by using Hanna 211 pH meter. The sediment texture and specific surface area were analyzed using a Laser Diffraction Particle Size Analyzer (SALD-2300, Shimadzu, Japan)
The carbonate content was removed according to the method described by [15]. Briefly, 3.0 g of each sample were air-dried and mixed with 10 mL of 1 M HCl and left for 24 h. Then, the samples were centrifuged for 1 min (3000 rpm) and the supernatant discarded. The procedure was repeated until no further effervescence in the sample. The samples were rinsed and centrifuged three times with ultrapure water, dried below 50 °C, and weighed. Total organic content (TOC) analysis was performed by modified Walkley–Black wet combustion method as described by [16]. This method consists of titration of dichromate with ferrous ammonium sulfate, which is obtained after wet oxidation of the samples with potassium dichromate using ferroin as an indicator.
Light fraction organic carbon (LFOC) was extracted according to the method describes by [17]. Briefly, 5.0 g of the samples were shaken in NaI for 16 h, and the suspensions were allowed to settle for 72 h. Subsequently, the supernatant in the top 1 cm of the NaI solution was transferred by suction to a Millipore filtration unit and was thoroughly washed with distilled water to remove NaI. After oven drying at 100 °C, LFOC was weighed, and the heavy fraction organic carbon (HFOC) was calculated by the difference between TOC and LFOC. Determination of active organic carbon (AOC) was based on the method as described by [18]. Generally, KMnO4 solution was added to 0.5 g of dried sediment and undergoes agitation at 200 rpm for 2 h, and followed by centrifugation at 2000× g for 5 min. Then, the solution was diluted and measured spectrophotometrically at 565 nm. The concentration of AOC was calculated according to the difference in the KMnO4 concentration before and after oxidation. Meanwhile, total acidic group, carboxyl and phenolic content were determined according to the procedures described by [19]. Total acidic and carboxylic group contents were determined by the Ba(OH)2 titration and Ca(AC)2 titration methods, respectively. The total phenolic group amounts were then calculated by subtracting the carboxyl group contents from the total acidic group contents.

2.3. Extraction of DOM from Marine Sediment

DOM was extracted from sediment samples by the water extraction method according to the procedure recommended by [20] with slight modification. Briefly, a total of 10.0 g of the air-dried sample was added in 100 mL of ultrapure water for and the sediment suspension was agitated for 24 h, 28 °C, at 150 rpm and purged with N2 gas to minimise the oxidation process. The sediment-water mixture was then centrifuged for 20 min at 5000 rpm, and the supernatants were filtered through 0.45 µm pre-combusted GF/F filters and stored at 4 °C in an amber vial. DOM concentration was quantified by using a total organic carbon analyser (Shimadzu, L-CPN). The pH of the DOM was adjusted to ≈3 prior to UV-Vis and fluorescence spectroscopy analysis. DOM samples were stored at 4 °C until further analyses. The elemental analysis of the DOMs was determined in triplicate by using a Vario EL 3 Elemental Analyzer (Elementary, Germany).

2.4. UV-Vis Spectroscopy Characterization

Prior to UV-Vis spectroscopy analysis, the dissolved organic carbon (DOC) concentration of all DOM samples was diluted to 10 mg/L with ultrapure water to minimize the inner filtering effects [21]. The UV-Vis absorbance of each extracted DOM was measured by using a UV-Vis spectrometer (Orion Aquamate 8000 UV-Vis spectrophotometer, Thermo Scientific) within a spectrum of 250–600 nm, at 1 nm increments, using a 1 cm quartz cuvette. Several spectral indices were used for this study including the SUVA254, spectral slope ratio (SR) the relative slope over 275–295 nm to 350–400 nm), the ratio of the absorptions at 250 and 365 nm (E2/E3), the ratio of absorptions at 465 and 665 nm (E4/E6) and the index for CDOM abundance (A355).

2.5. Fluorescent Spectroscopy

Synchronous fluorescence spectra were measured with a luminescence spectrometer (Perkin Elmer LS55). The wavelength range of excitation and emission were set from 220 to 550 nm and from 280 to 550 nm, respectively, at 0.5 nm increments. Humification index (HIX), fluorescent index (FI), and biological index (BIX) were included for the fluorescence indicators [22,23]. HIX is a ratio of the areas under the emission spectra over 435–480 nm to 300–345 nm with an excitation wavelength of 255 nm. FI is a ratio of the fluorescence intensities at the emission wavelength DOM of 450 and 500 nm with an excitation wavelength of 370 nm [4]. BIX is a ratio of the fluorescence intensity at the emission wavelength DOM of 380 nm and 430 nm with the excitation wavelength of 310 nm [24].

2.6. Attenuated Total Reflectance Infrared ATR-FTIR Analysis

DOM samples were freeze-dried to obtain powder samples for further ATR-FTIR analysis. ATR-FTIR spectra were obtained using an FTIR spectrometer (Shimadzu, IRTracer, 100). Five hundred and twelve scans were co-added to obtain each spectrum with a resolution of 4 cm−1 in the 400–4000 cm−1 wavenumber range.

2.7. Statistical Analysis

The data are presented as mean with standard deviation. Statistical test was carried out using SPSS Version 18.0 (SPSS Inc., Chicago, IL, USA). Descriptive statistical analysis was carried out to describe the main characteristic of marine sediment collected from the three locations. In addition, analysis of variance (ANOVA) was used to compare the means with respect to the three categorized sampling locations. The spectral slopes were fit by using Sigmaplot Version 14 statistical software.

3. Results

3.1. Properties of Bulk Marine Sediment

In this study, three surface marine sediment samples were characterised, and the properties of the sediment are shown in Table 2. The pH values did not vary greatly (between pH 7.45 and 7.81) among the samples and the lowest pH value (KS) may be attributed to the oxidation of iron sulfides. The pH values are in the range of values as reported by [14].
TOC is an important index to study organic matter content and has been widely applied to modern sediments [25]. In this study, TOC was varied in between 0.83–1.25% with an average value of 1.05 ± 0.1% which is in good accordance with the concentration ranges reported in other coastal areas in Malaysia [26]. A higher level of TOC was observed in KS and K, and these sediments were dominated by fine-grained sediments. On the other hand, sand sediment was found in KT, give the lowest value of TOC. TOC measurements revealed positive linear correlations between fine-grained percentage and sedimentary TOC [27] due to the large specific surface area of fine-grained sediment [28], which provides more binding sites for the adsorption of organic matter. Furthermore, the sandy sediment has greater penetration of oxygen, compared to fine-grained and muddy sediment; this may help to explain the relatively lower value of TOC KT compared to KS and K. Furthermore, the KS received water input from Selangor River, therefore considering the backwater effects of the Selangor River, organic matter was easily deposited, resulting in high organic carbon content in the sediments.
The sediment from KS was highest in the total acidity group, with the value of 7.34 mmol/g, whereas the values for KT and K were 6.52 and 6.23 mmol/g respectively. The aforementioned differences in acidity properties may affect their ability to bind pollutants as the acidic functional group content is an important factor controlling complexation by organic matter ligands [29]. According to [30] DOM derived from the aquatic system contained a higher acidic functional group than the soil.

3.2. Elemental Analysis of DOM

Element analysis is one of the most common methods to record DOM structures. Evidence has shown that atomic ratios of carbon/nitrogen (C/N), hydrogen/carbon (H/C), oxygen/carbon (O/C), and are frequently used to identify DOM from different sources and to elucidate structural formulas for DOM [31]. Ranges of the elemental composition of the isolated DOMs as well as the calculated ratios of the H/C, O/C and C/N, are shown in Table 3.
As can be seen in Table 3, variation of elemental composition was assessed in the DOM samples. The ratio values of H/C increased in the order of DOM-KT < DOM-KS < DOM-K, which correspond to 0.49, 1.06 and 1.08 (mean average 0.88 ± 0.04), respectively, which indicates the increasing ratio of aliphatic carbon [32]. The H/C values were found greater than 1 in KS-DOM and K-DOM, indicates these samples probably originate from vascular plant material instead of algal or bacterial [8]. Differently, the H/C value of DOM-KT was 0.49, this value is characteristic of organic matter with autochthonous origin.
Further confirmation was made by calculating the C/N ratio. Allochthonous vascular plant materials contain cellulose, lignin, and tannin [6] and have C/N ratios of more than 12, while the non-vascular C/N ratio is between 2 to 10 [7] and those intermediate values (10–12) suggest a mixture of allochthonous and marine organic matter. Thus, considering that the C/N ratio values obtained for DOM-KS and DOM-K ranged from 15.10–18.40 (mean 17.88) and 10.20 to 11.4 (mean 11.04) and the values found for the DOM-KT varied from 7.66 to 9.20 (mean 8.69), we can suggest that DOM-KS is allochthonous and DOM-K is a mixture of allochthonous and autochthonous, and DOM-KT is autochthonous. In a study conducted by [33] in the Batan Bay Estuary, Philippines, it was stated that the high C/N values also imply a persistent input of fresh organic matter from the residual mangrove stands and low SOM decomposition and organic matter preservation. The O/C ratio was relatively high for DOM-KT as compared to those DOM-KS and DOM-K. This indicates a high composition of carboxylic and O-alkyl groups [31] and implies a greater presence of oxygen-containing functional groups, [5] in DOM-KT.

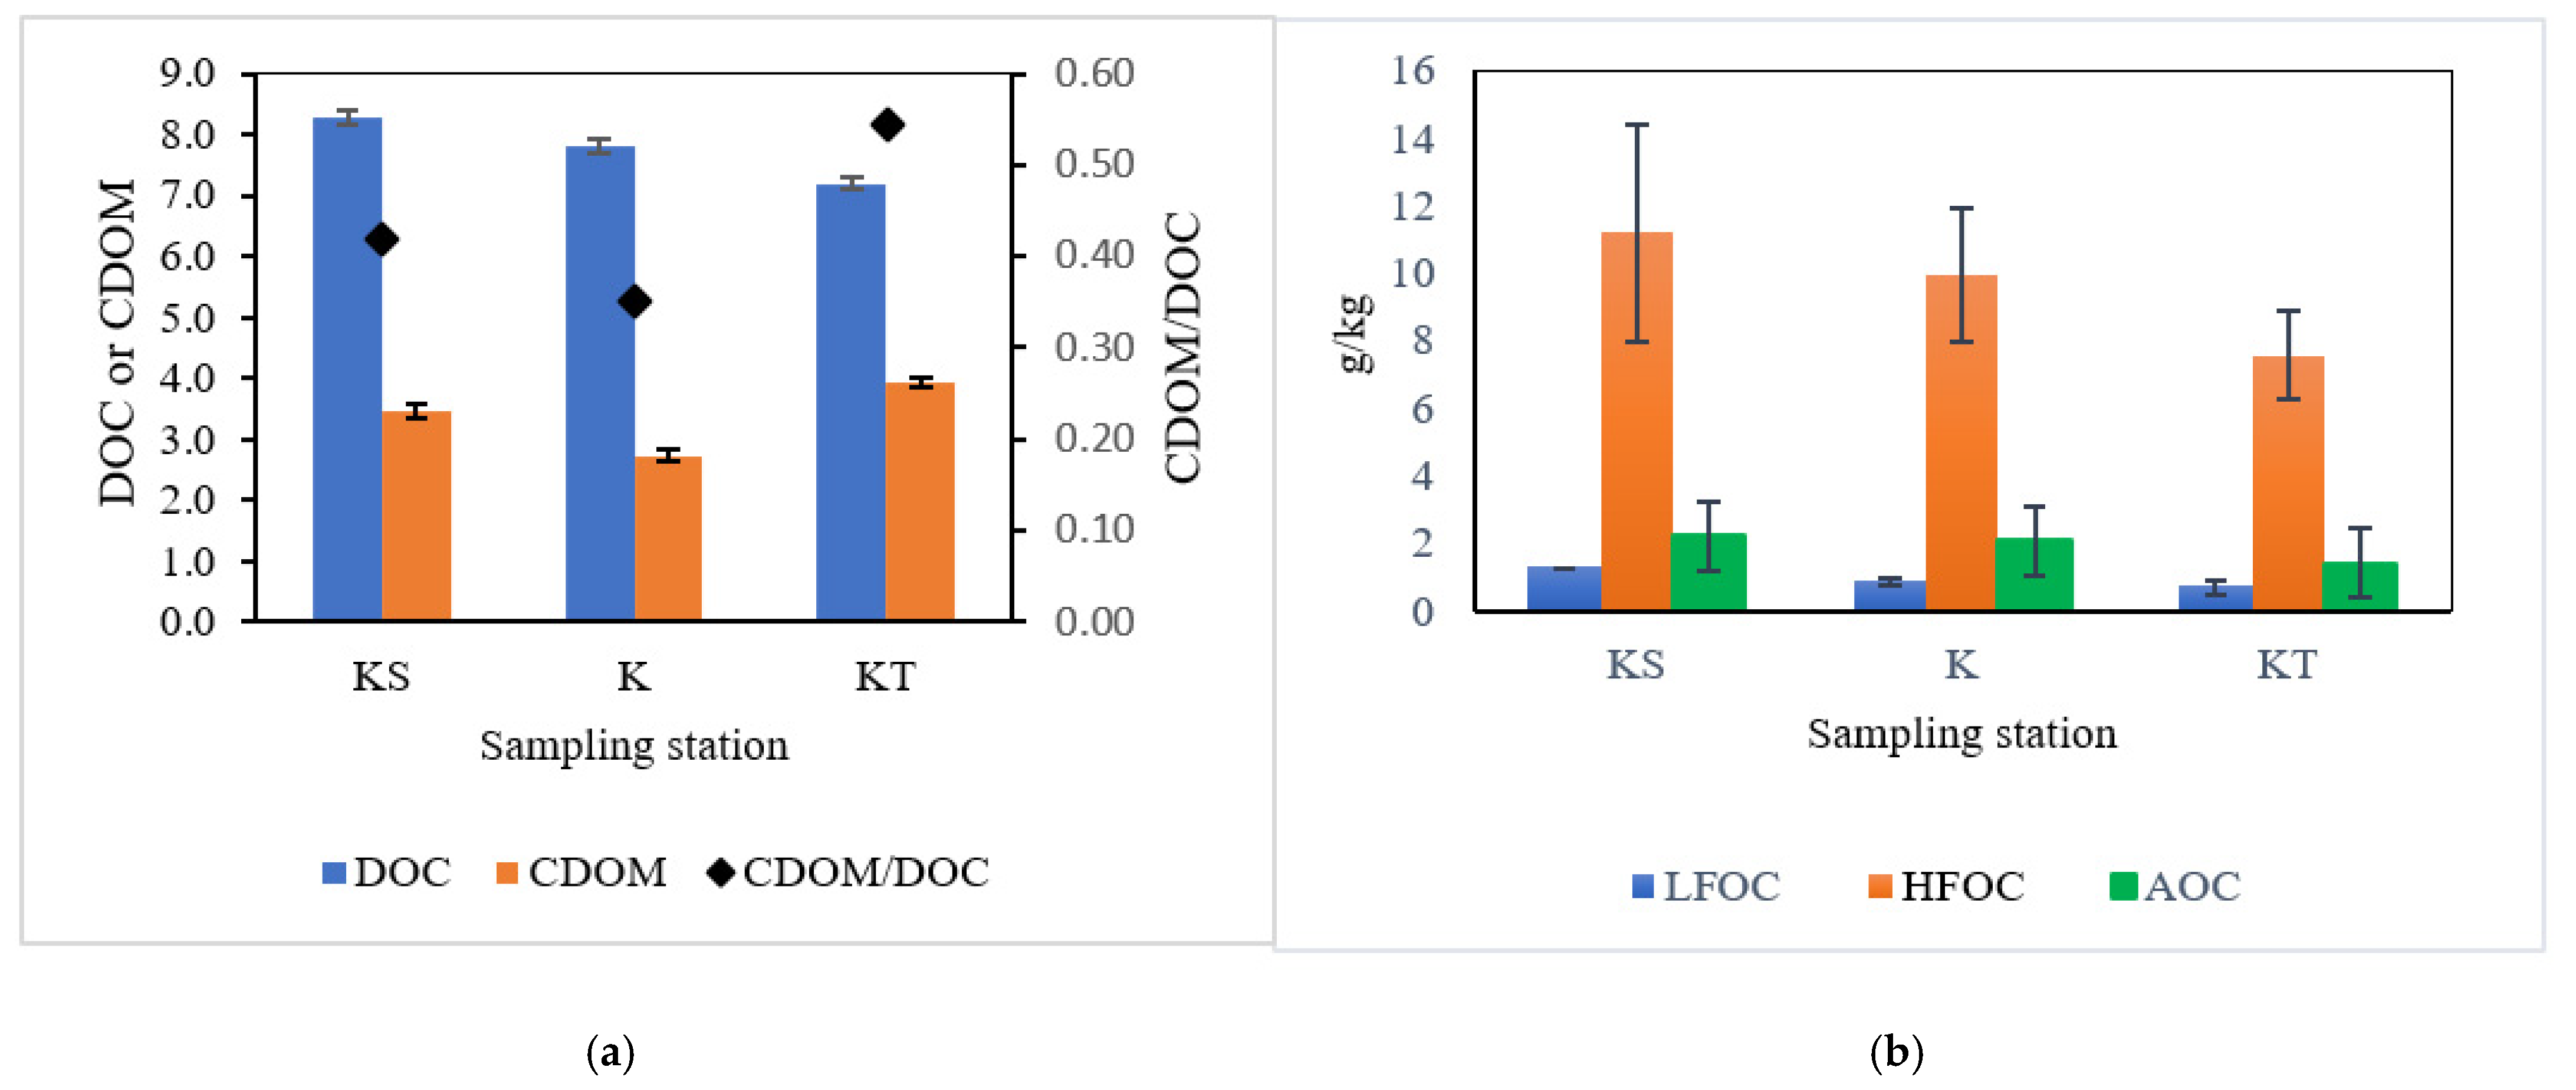
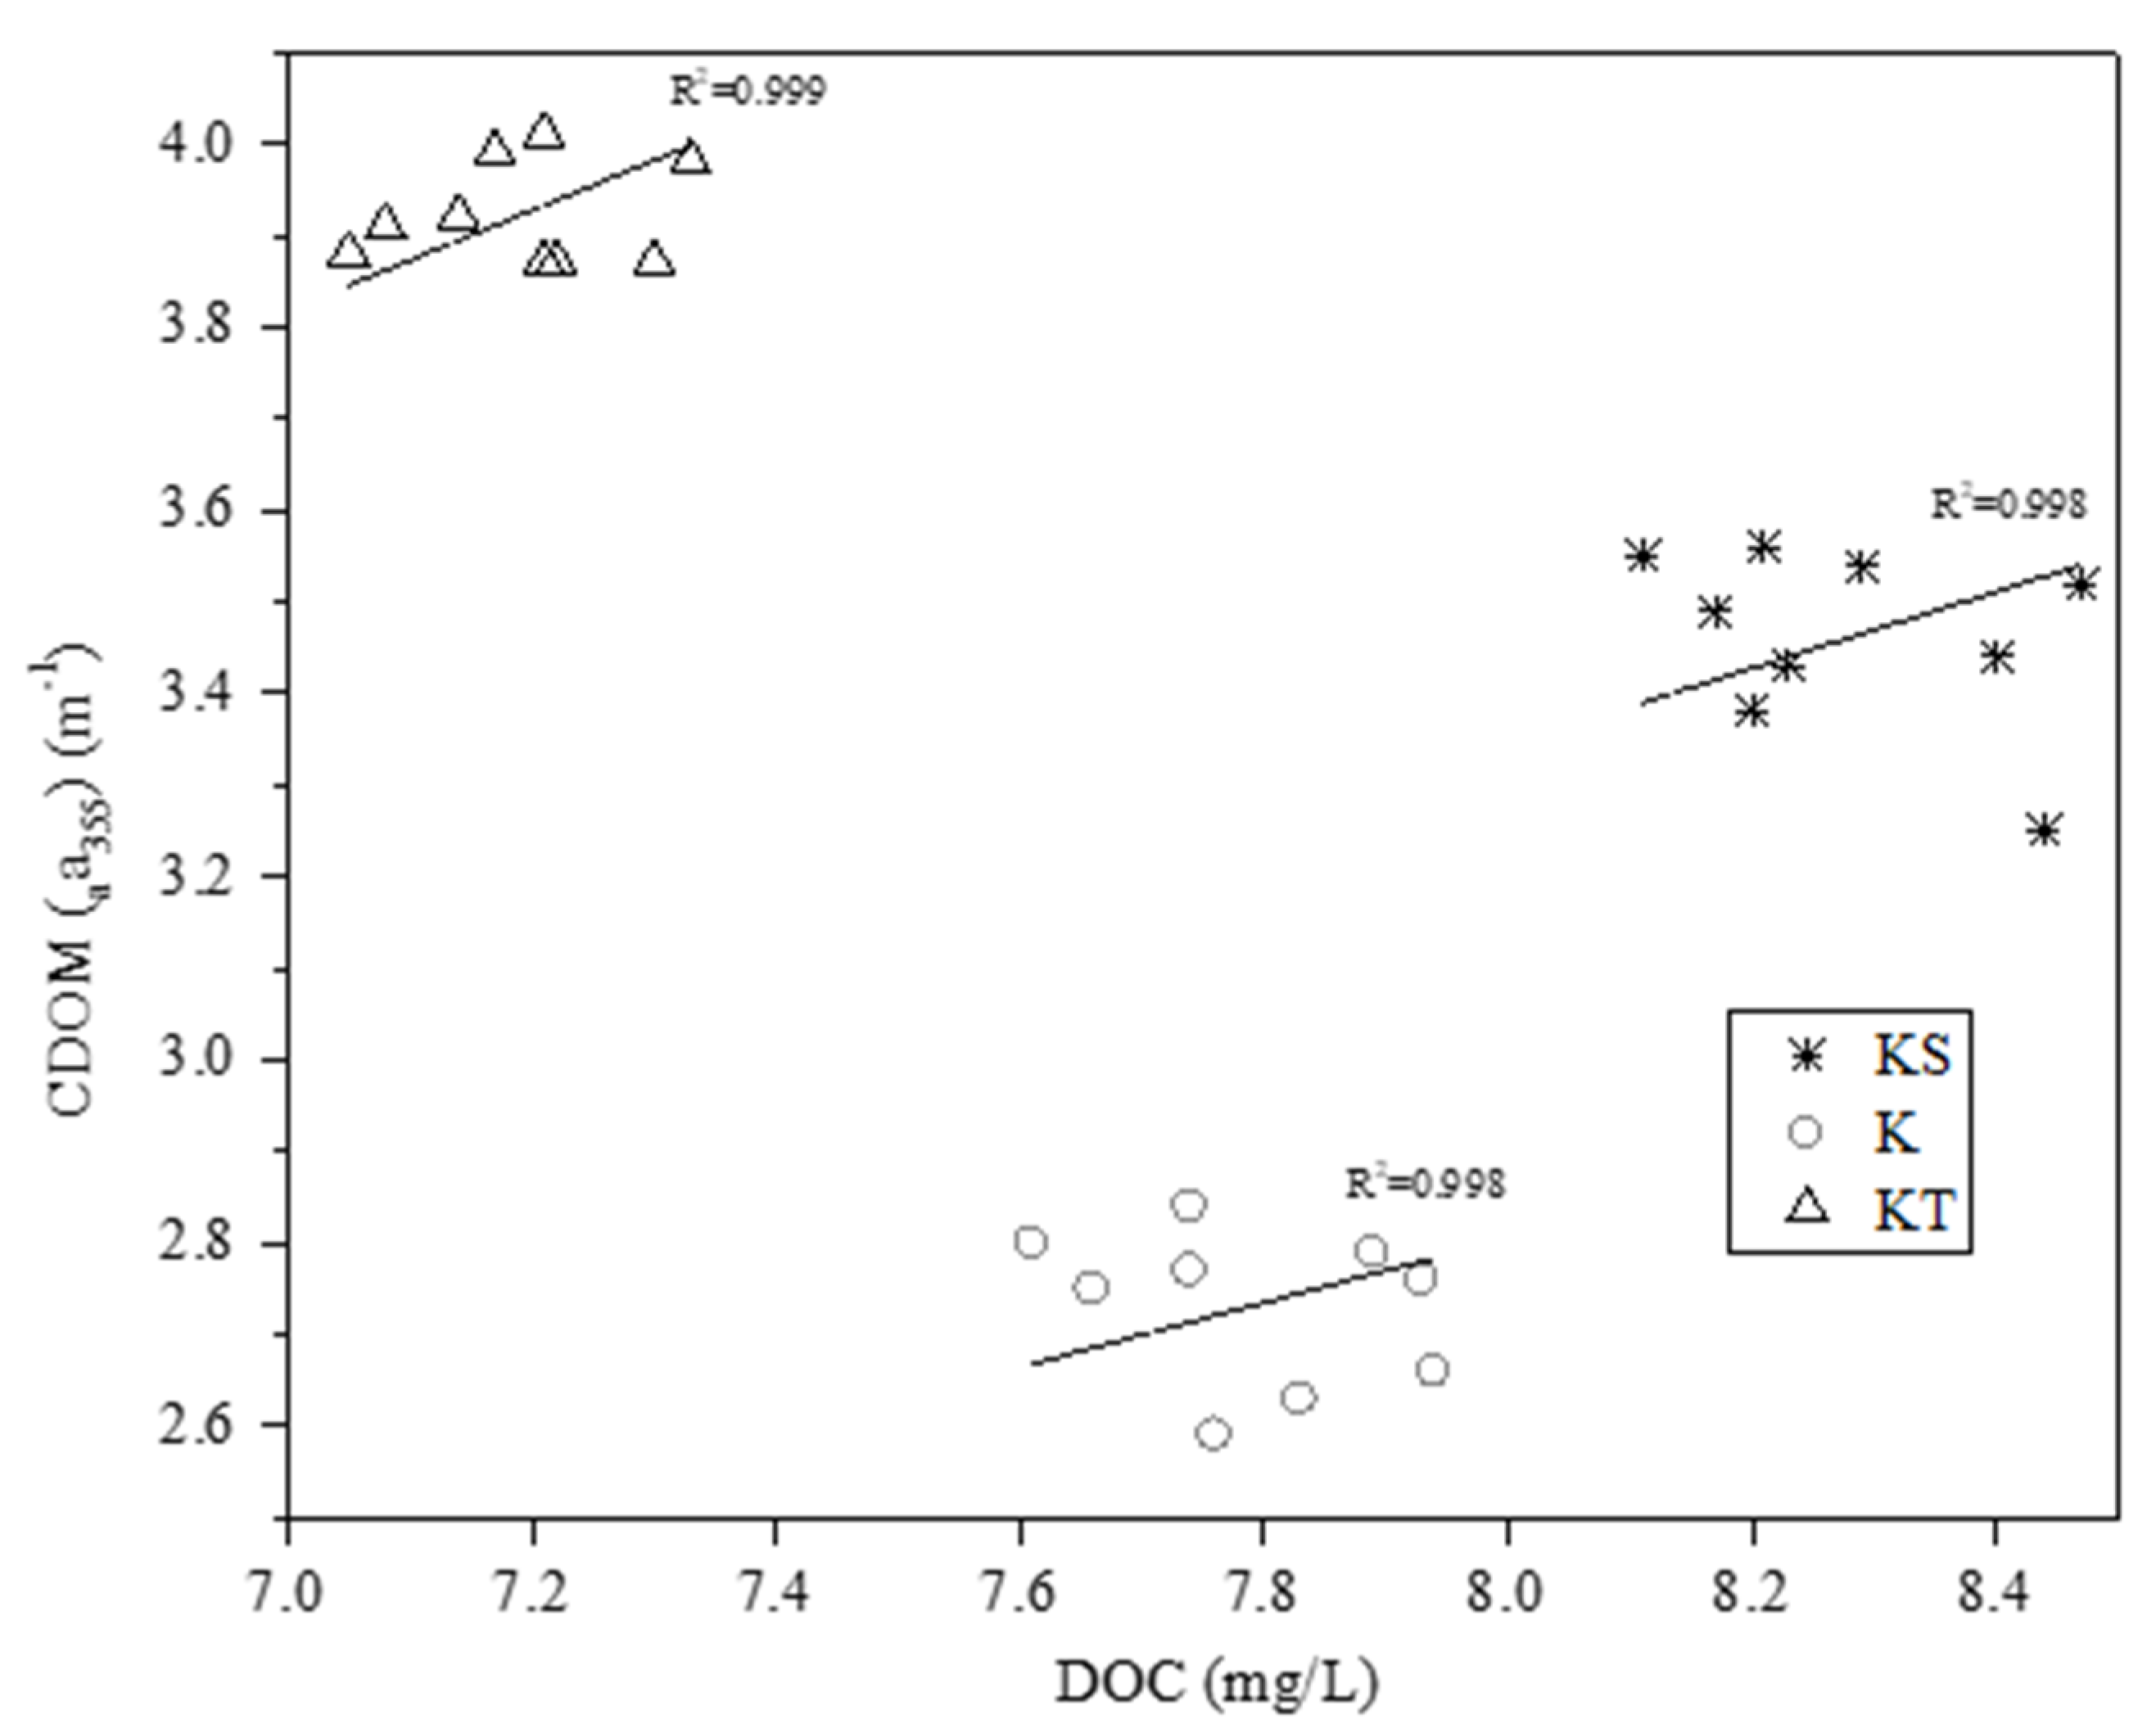
3.3. DOC in Extracted DOM

To quantify the DOM in marine sediment, DOC concentration is generally used to represent the content of DOM [34]. The value of DOC and variations of organic carbon (OC) content in the studied sediment can be found in Supplementary Materials (Table S1) and Figure 2a,b. DOC values were found to be in the range of 7.05–8.47 mg/L. By the one-way ANOVA, the difference in DOC concentration was significant between the three samples (p < 0.05). The highest DOC concentration was observed in DOM-KS and the lowest DOC concentration was observed in DOM-KT.
Further characterisation of the organic carbon was determined through the LFOC, HFOC and AOC content (Figure 2b). Generally, the LFOC ranged from 0.76 to 1.30 g/kg and HFOC value from 7.56 to 11.2 g/kg. LFOC material consists of incomplete decomposed organic residues and serves as an indicator of the effects of cropping practices [35]. HFOC contents were 89.6 to 91.7% of the TOC, indicating the dominant fraction in all three samples. These findings were in agreement with a previous study by [18]. The AOC represents the component of the organic carbon that can be readily decomposed by microbes and can supply direct nutrients ranged from 1.43 to 2.21 g/kg. The LFOC, HFOC and AOC were significantly higher in KS than in K and KT (p < 0.05).

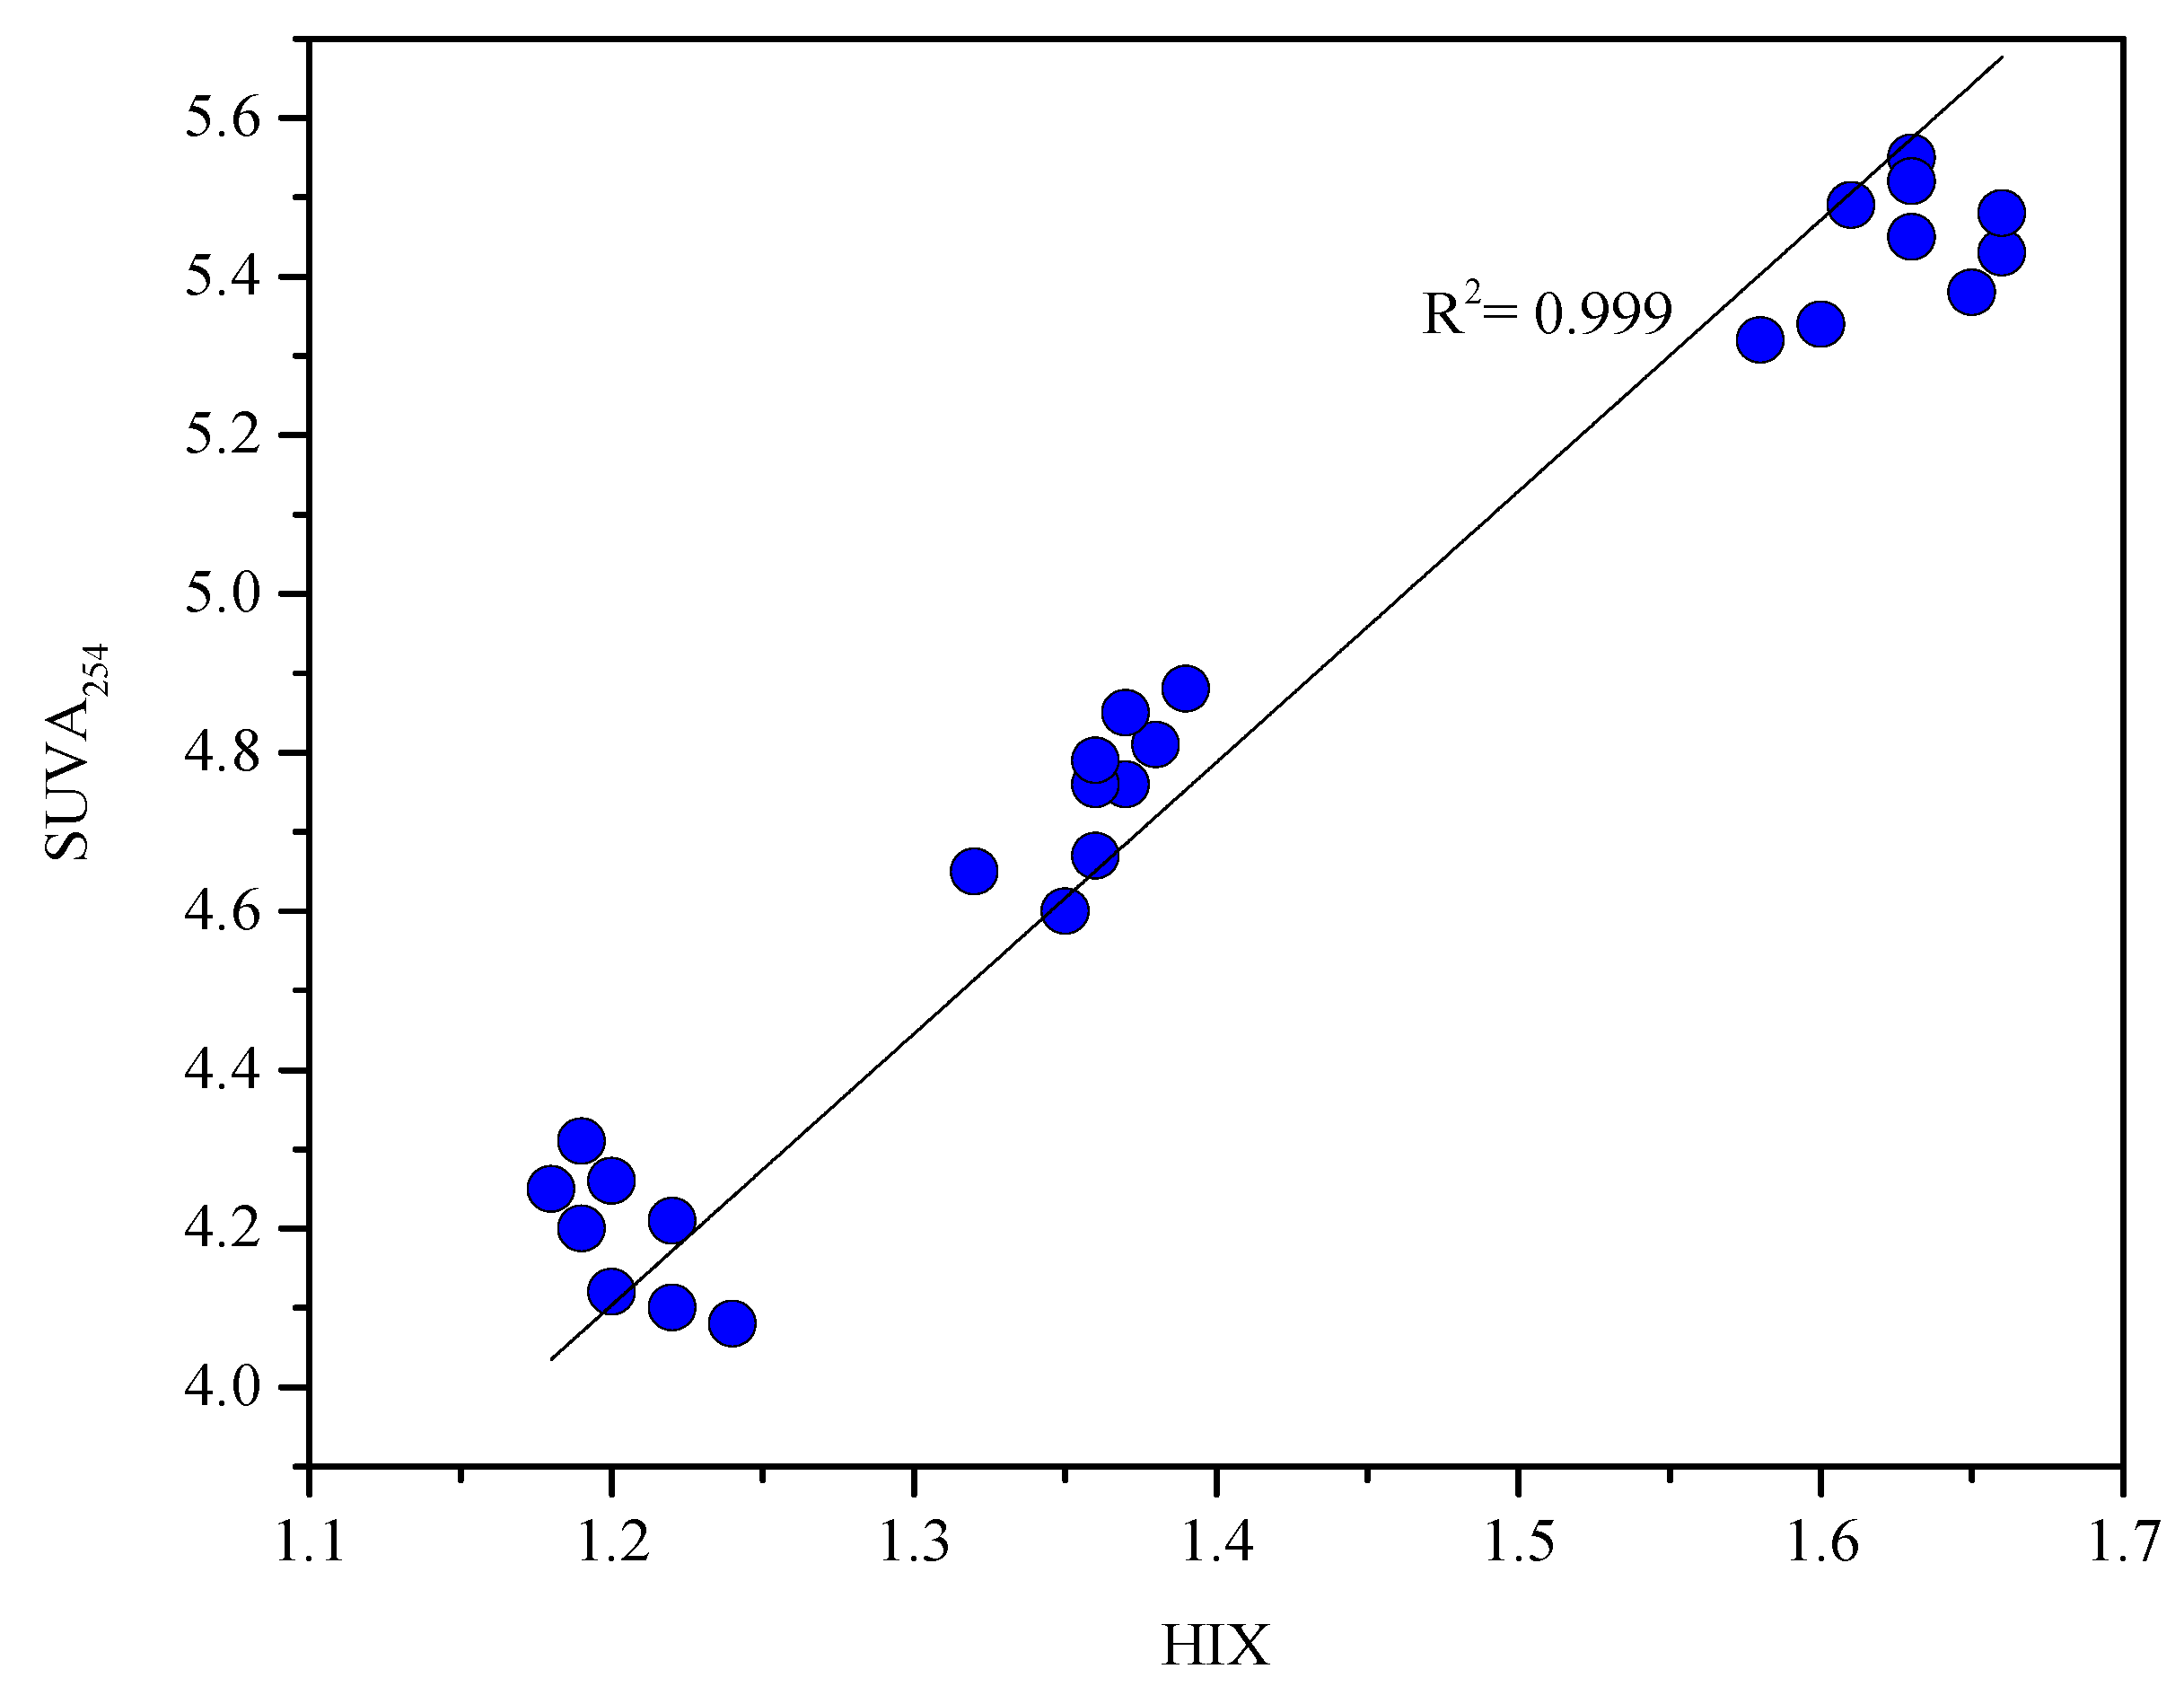
3.4. UV-Visspectroscopy Analysis

The DOM′s UV-Vis absorption was attributed to its unsaturated bond and aromatic composition. The absorption or ratio of UV-Vis at specific wavelengths has therefore been widely used to investigate the structural characteristics of DOM, such as the content of aromatic compounds, the degree of polymerisation and the molecular weight [36]. The DOM UV-Vis absorption spectrum (Figure 3) shows an exponential decrease with increasing wavelengths, following a pattern similar to that already described for the sample of natural organic matter [37]. In addition, the spectrums exhibited a shoulder at around 250 nm to 280 nm and were mainly attributed to aniline derivatives, phenolics, aromatic carboxylic, and polycyclic aromatic compounds (π–π* transition) [38].
The additional analyses of SUVA254, E2/E3 ratio, E4/E6 ratio, A355 and SR indices were used to further study the chemical characteristics of DOM extracted from different marine sediment. The calculated UV-Visiindices of the DOM were represented in Table 4. The average SUVA254 values in DOM-KS was significantly higher compared to other two DOM sample. The SUVA254 ranged from 4.19 to 5.44 (mean value 4.79 ± 0.53) indicates that the DOM sources are derived from vascular plants enriched with aromatic components [39]. The SUVA254 are known as aromatic and molecular weight tracers and are positively correlated with the contents of aromatic carbon [40] and the presence of unsaturated double bonds in the conjugate [41]. The results are consistent with the findings of others [42,43] related to hydrophobicity and hydrophilicity of the DOM sample.
Hydrophilic fractions were associated with low SUVA254 (<3) and hydrophobic fractions of supposedly higher aromaticity were associated with low SUVA254 (>4) [43]. This suggests that samples from DOM-KS had the highest DOM aromaticity and hydrophobic fraction in comparison with other samples. This could be caused by the decay of allochthonous organic substances material that contains various classes of aromatic compounds [6].
The mean molecular size of DOM derived from the E2/E3 ratio were 8.32, 10.71 and 18.43 for DOM-KS, DOM-K and DOM-KT, respectively. The aforementioned decreasing ratios are because of increasing molecular size [44]. As the molecular size increased, E2/E3 decreased because of stronger light absorption by high-molecular-weight (HMW) DOM at longer wavelength DOM [45]. Meanwhile, the E4/E6 ratio, the indicator of the degree of condensation, was highest in KT, consistent with the earlier findings of H/C ratio and SUVA254, confirming the presence of a higher aliphatic compound in DOM-KT than in DOM-KS and DOM-K.
The adsorption coefficient at 355 nm (A355) was selected as the index for measuring chromophoric organic matter (CDOM) abundance [24,46] due to the complexity of DOM. The highest value of A355 was observed in DOM-K, indicates that the highest abundance of CDOM. In addition, the CDOM/DOC ratio was calculated to estimate the relative contribution of CDOM to the bulk DOC (Figure 2a). The average CDOM/DOC (L mg-C−1 m−1) was 0.42 (DOM-KS), 0.35 (DOM-K) and 0.55 (DOM-KT) (Figure 2a), respectively, showing the relative contribution of CDOM was greater in KT. A strong linear relationship between CDOM and DOC (Figure 4) in all DOM (R2 = 0.99) suggests that more than 90% of DOC variability among the DOM can be explained by variations of the quantity of CDOM [46]. The strong linear relationship of CDOM and DOC was consistent with a previous study [47,48].
According to [40], SR of S275–295-350–400 nm in the ultraviolet absorption spectrum was an indicator to measure the molecular weight and source of DOM. The larger the SR, the smaller the molecular weight. It can be seen from Table 4 that the SR values of all DOM samples were less than 1.0, ranged from 0.13 to 0.59 with a mean value of 0.54 ± 0.51 indicating again that high molecular weight molecules are dominant [23] which is consistent with the result obtained from SUVA245 and E2/E3 ratio.

3.5. Fluorescent Properties of DOM

Fluorescence spectroscopy provides a specific evaluation of DOM in which only fluorophores are analysed, unlike UV-Vis spectroscopy that detects any compound that absorbs light (chromophore) [3]. The HIX is commonly used as an indicator of the DOM age and recalcitrance [5]. The higher the HIX value, the more difficult the DOM can be degraded and used by the microorganisms, and the lower the molecular activity is [49].
Similar to SUVA254, DOM-KS showed a significant highest HIX value (p < 0.01), which implied that the presence of more complex organic and aromatic material than DOM-K and DOM-KT. As depicted in Figure 5 and Table 4, the HIX values of all the three samples ranged from 1.21 to 1.63 (mean value 1.39 ± 0.18) and which are in the range of the previously published study [5,14,50]. However, HIX values were less than 4.0 and this result indicated that the humification degrees of DOM in DOM-KS, DOM-K and DOM-KT were weak. Our data show that there is a strong significant correlation between HIX and SUVA254 (Figure 6) as described by other studies in coastal areas.
Notably, FI can be used to differentiate between allochthonous and autochthonous DOM sources as well as data on the source of DOM. FI is an indicator of DOM source with higher (~1.4) and lower (~1.2) values indicating the microbial and terrestrial sources, respectively [4]. It was found that FI values for all three samples were in a range of 0.95 to 1.58, in which the lowest value was in DOM-KS, corresponding to the terrestrial input (allochthonous). By contrast, the FI value for DOM-KT is 1.58 and this indicates the microbial sources. This finding indicates that the productivity and self-purification ability of KT sediments are strong, which is inconsistent with the good water quality at present [50].
There was a significant difference between the BIX value for KS with KT and K (p < 0.05). This demonstrates the possibilities of a different magnitude of an autochthonous component among the sediment samples. Furthermore, the values of BIX obtained from this study range from 0.67 to 1.27, indicating high terrigenous component in DOM-KS and DOM-K and autochthonous component in DOM-KT.
The results are similar to those reported for sediment estuarine [3,51]. A BIX value greater than 1, explains the increase in autochthonous components, whereas a low BIX value between 0.6 and 0.7 showed terrigenous input or human impacts are large [36]. Since there are significant differences of BIX value between the DOM (p < 0.05), it explained the possibilities of a different magnitude of an autochthonous and allochthonous component among the DOM samples. Moreover, evidence has shown that BIX is used to determine the presence of β fluorophore, which is characteristic of autochthonous biological activity [3].

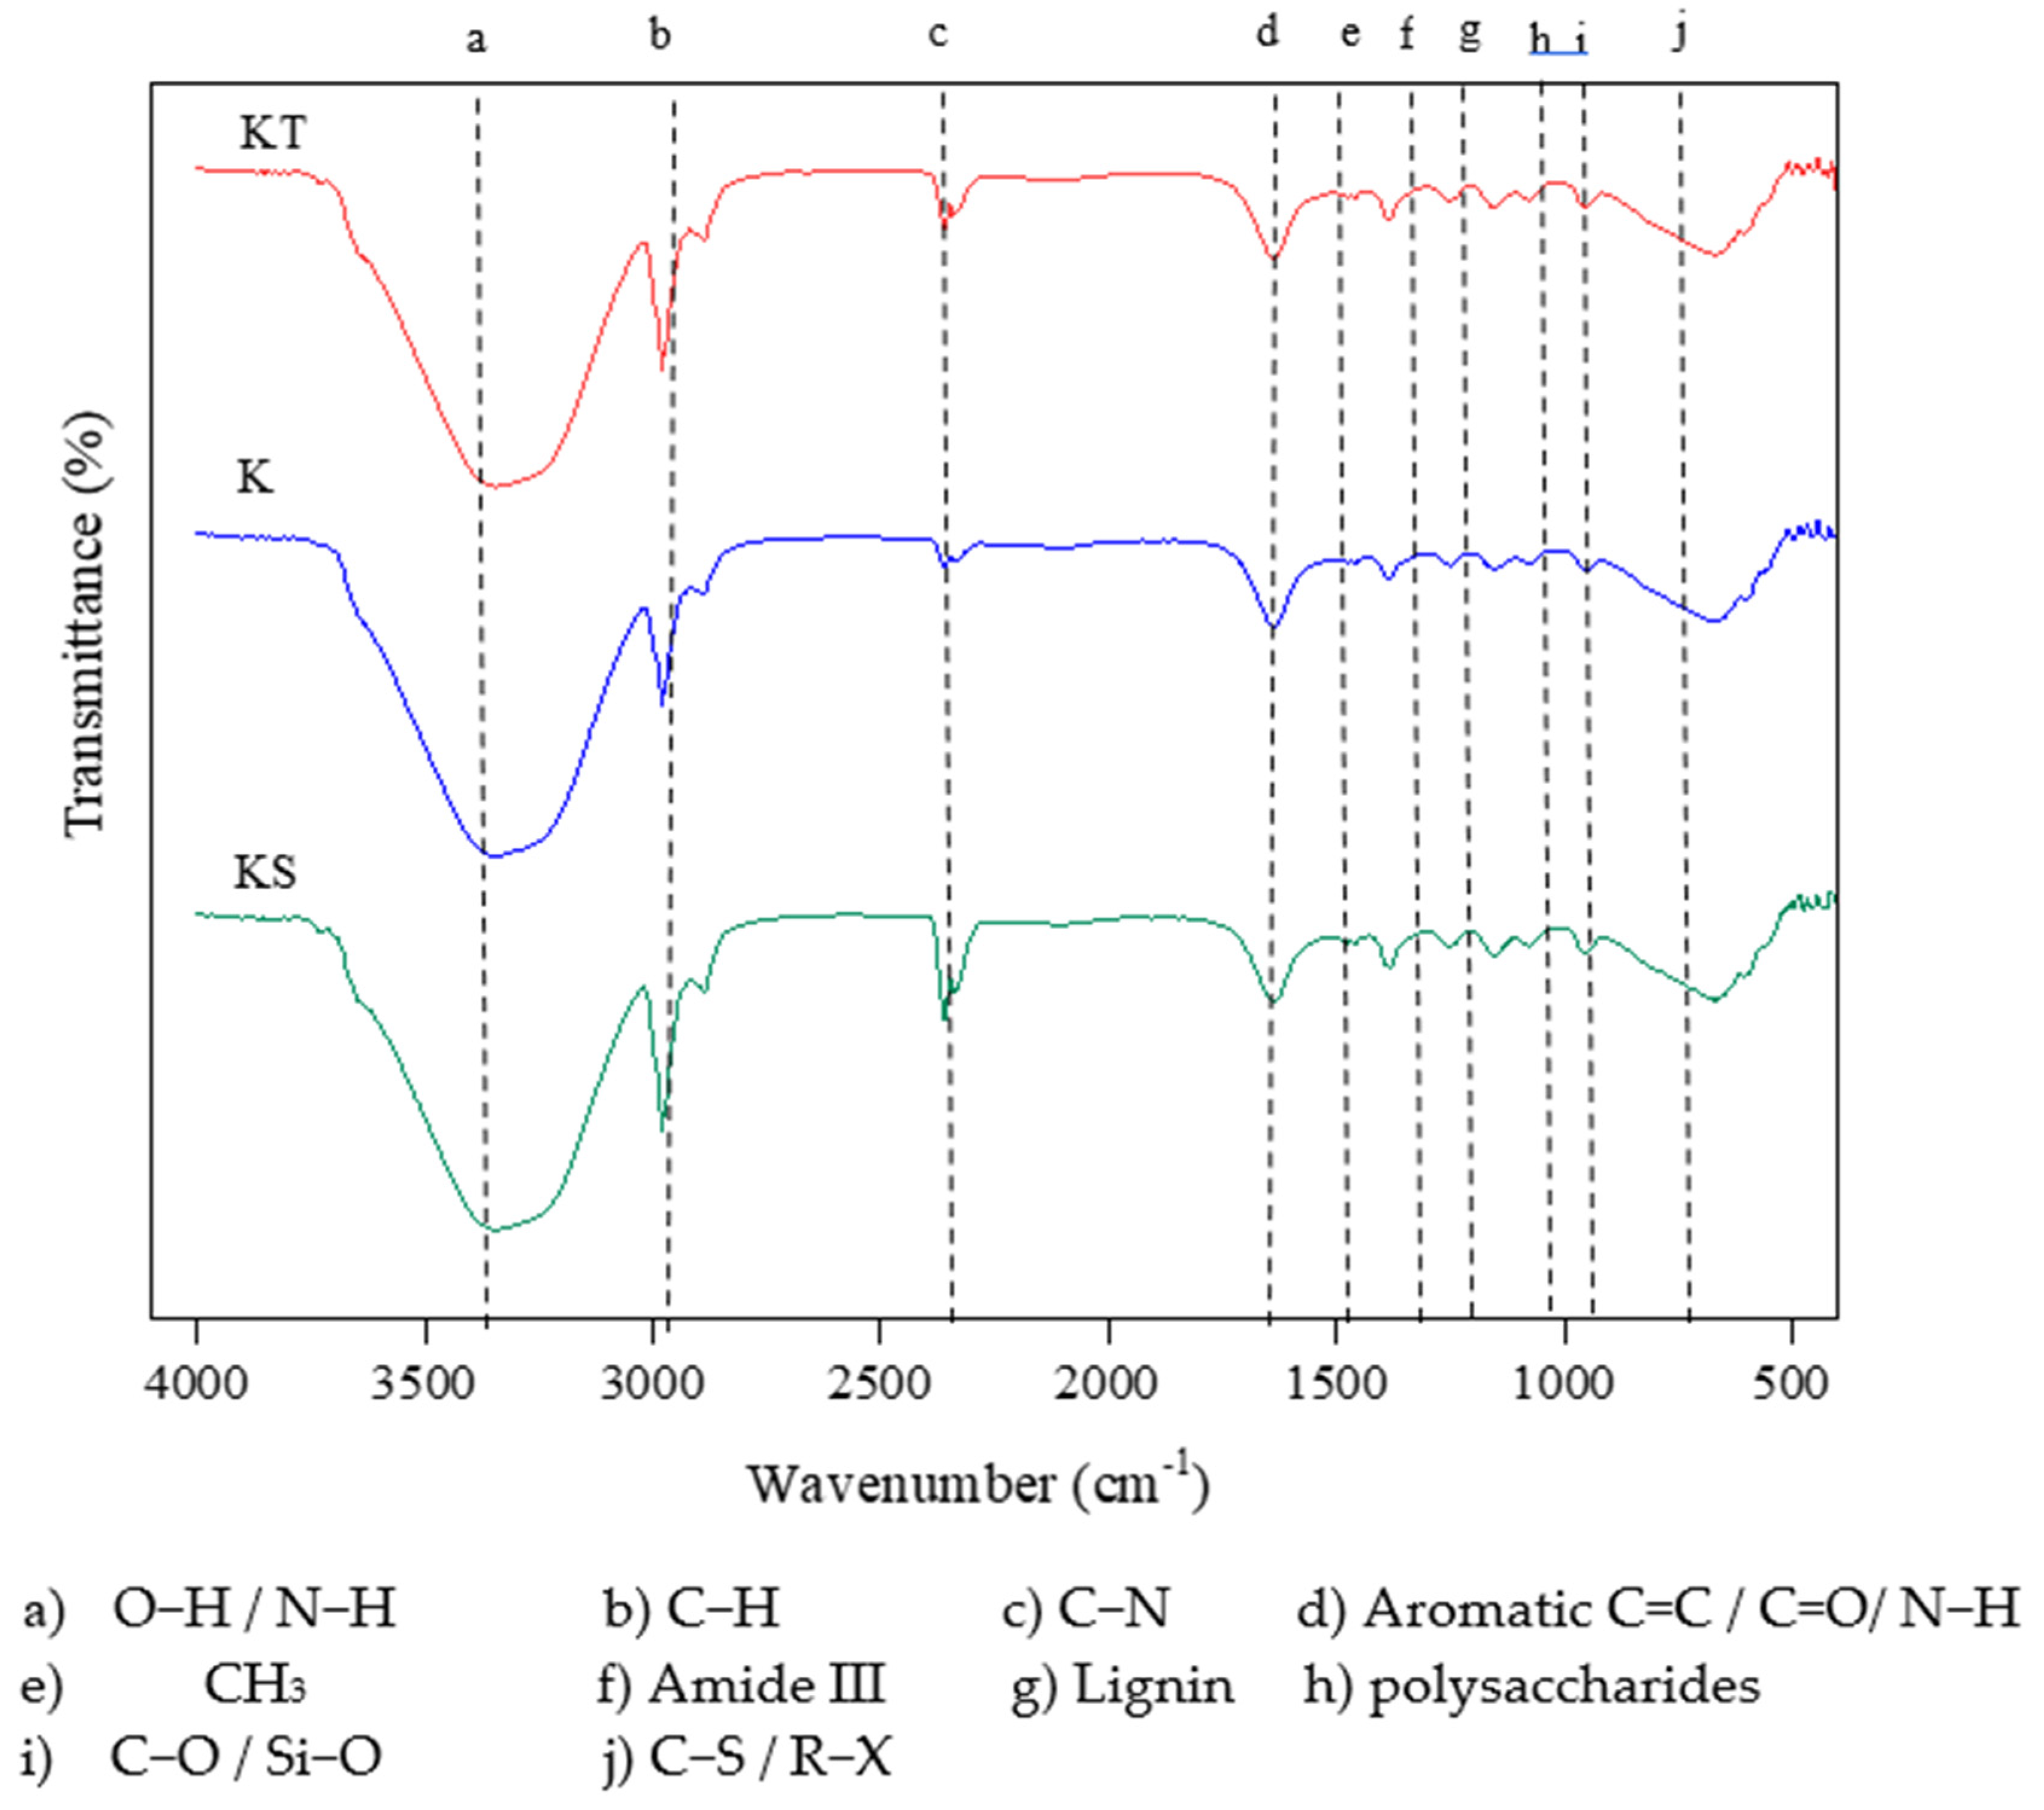
3.6. DOM ATR-FTIR Spectra

Figure 7 shows the ATR-FTIR spectra of the three DOM studied in this study. In general, the spectra of all three locations displayed a similar peak pattern with ten distinctive adsorption bands but with different absorbance intensities. The major bands observed in the spectra are in agreement with results reported by other researchers [52,53].
The typical broad bands with peaks around 3400 cm−1 to 3000 cm−1 which is the broadest band were attributed to O–H stretching of alcohols and/or phenols and N–H stretching of amines and/or amides [8]. The band regions around 2920 cm−1 and 2850–2856 cm−1 are represented aliphatic C–H vibrations of aliphatic methyl and methylene groups [54]. The intensities of those peaks (2920 and 2850) were higher for KT and K than KS, thus illustrating that the KT and K contained more aliphatic compounds than the KS. The strong adsorption bands occurring at 1650–1630 cm−1 are attributed to aromatic C=C skeletal vibrations, C=O stretching and N-H bending. A peak at 1550–1520 cm−1 belongs to the aromatic C=C stretching of lignin residues and a peak at about 1460 cm−1 is attributed to aliphatic C–H. A peak between 1235–1220 cm−1 is assigned to lignin composition [55]. A band that appears around 1075 cm−1 is attributed to C–O stretching of polysaccharides and polysaccharide-like substances, and/or Si–O of silicate impurities [56]. Finally, some bands appeared below at 700 cm−1 and these bands are assigned for multiple functional groups/compounds such as sulfate, carbohydrate, alkyl-halide, halosilanes, nitro group and C–S bonds [53].
FTIR spectroscopy provides information on the relative distributions of functional groups in the DOM. The results obtained suggest that all DOM consists of alcohol of carboxyl and compounds, and some amines and nitrates. Conversely, two sharp and strong peaks at 2920 cm−1 to 2850 cm−1 indicate that all DOM sample comprises a large amount of aliphatic. The intensity of the absorption bands depends on the amount of absorbing functional groups. This means that larger contents of functional groups result in greater intensity of the corresponding absorption bands, whereas smaller contents result in less intensity. It can be seen from Figure 7 that DOM-KT have highest adsorption intensity at 1650 to 1630 cm−1 compared to other DOM, reflects than this sample contains more C=O compound.

4. Discussion

Characterisation of organic matter in coastal ecosystems enables us to understand the biogeochemical transformation of organic matter and its influence on ecosystem productivity in response to various changing environmental conditions [57]. It is generally accepted that the variation of organic matter in coastal sediment is due to the external input and internal decomposition process. This is mainly because of the strong diffusion of DOC in the oxidising environment and the decomposition of a large number of vegetation litter on the surface, which results in higher organic carbon content in the surface of sediments, and then gradually decreases with the increase in depth [58]. Different fractions of organic matter are known to regulate the behaviour of contaminants such as trace elements in the water ecosystem [59].
In this study, the KS sediment sample generally shows the highest content of acidic functional groups compared to KT and K samples (Table 2), thus suggesting that the KS had the highest chemical reactivity and more binding sites than KT and K samples. High phenolic content in sample KS may be due to the presence of lignin phenolic sources [56]. The DOM was extracted by the water extraction method and the concentration was then recorded as DOC. Our results show that the DOC concentrations were relatively higher compared to the DOC in the water column than or similar to those recorded for the estuary water column [60]. This might be explained due to the dilution factor of a large volume of water in the water column. Furthermore, in natural conditions, the inflow of coastal water into the coastal ecosystem and the influence of coastal winds may cause sediment resuspension and later further increase DOM and nutrient concentration in the water column [61].
Studies of sediment in several coastal ecosystems revealed that the organic matter consisted of a mixture of multiple sources from terrestrial sources and marine sources such as microalgae [13,62]. The sources were usually divided into autochthonous and allochthonous. The autochthonous source was derived from the decomposition of microorganisms, plants, phytoplankton or algae residue and the extracellular enzymes secreted by microorganisms. Meanwhile, allochthonous organic matter including terrestrial materials transported via rivers and marine materials delivered through tidal actions. Some researchers used biomarkers such as lipid biomarkers [1], fatty acid and biopolymers biomarkers [63] in studies of organic matter. Our findings have shown that there are variations in the sources of marine sediment DOM from different backgrounds, depending on land activities, which could be associated with land-derived input and human activity.
DOM-KS site is located nearby Kuala Selangor estuary which receives large amounts of land-based pollutants from its developed surroundings in the form of runoffs and also via atmospheric deposition [64]. As mentioned before, the H/C and C/N ratio values are relatively high, confirming the hypothesis that vascular plants are the dominant contributors in DOM-KS. Studies in the literature showed that the high organic matter in the estuary was contributed by the decomposition of root material and decomposition of leaves of the mangroves forest [65]. The contribution of mangrove-derived organic matter to the sediment was also influenced by a variety of factors including mangrove density, hydrodynamic condition, geomorphological setting and the distance from the mangrove [66]. Therefore, we speculate that major input from the mangrove-derived organic matter contributed the highest influence for high TOC and DOC values in KS. High organic matter content in KS might also be explained by the aquaculture farming activity available in the area. A recent study in Monastir Bay, Tunisia indicates the high levels of sediment organic matter are due to excretions of fish and faecal materials from fish farming activity [67].
In a context of intensive anthropogenic action, the K sampling site which is situated nearby Kuantan port is exposed to heavy industrial, port and urban pressure. The port has served as an important seaway to major ports in Asia-Pacific regions [68]. Furthermore, ports are low-energy areas with high rates of accumulation of organic contaminants in the sediment [60]. Moreover, it was previously reported that the use of paints and grease repellents for ship and dock protection could contribute to organic matter deposition on the sediment. The accumulation of diverse sources derived from organic carbon and nitrogen (natural and anthropogenic origin) in the sediment is also influenced by the hydrodynamic condition of the system. In [63], it was emphasised that sampling sites subjected to low hydrodynamic conditions favour the deposition of organic matter-rich fine particles in contrast to sites subjected to strong hydrodynamism. This statement is applicable to the port and harbour ecosystem.
In contrast to KS and K, it is interesting to observe that TOC values of DOM-KT were the lowest among the three sampling stations. Previously [69] reported the source of organic carbon in the coastal sediment of Kuala Terengganu is due to aromatic hydrocarbon with evidence of the presence of gasoline, diesel, and mineral oil that can be linked to oil spills from fishing vessels and high-speed boats. The area is also facing the South China Sea and is vulnerable to oil pollution because of intense petroleum production activities in the area. The O/C ratio from the elemental analysis was relatively high for DOM-KT, suggesting the organic matter is rich with carboxylic and phenol content.
In comparison with UV-Vis absorption spectra, FTIR analysis is used to reveal the presence of specific functional groups. Information on the active functional group in DOM is important to understand the pollutant’s behaviour in the ecosystem. The active functional groups such as carboxyl, carbonyl, and hydroxyl, can interact with several metal ions, organic matter, and toxic reactive pollutants in the overlying water and sediments through adsorption, complexation, oxidation, and reduction. Thus, they affect the chemical forms, migration and transformation, bioavailability, and destination of toxic reactive pollutants. These interactions and the structure and function of whole aquatic ecosystems may have a key role in the decomposition or elimination of toxic or harmful substances and the balance of nutrient elements in the water environment [50]. The ATR-FTIR spectroscopy data suggest that the DOM′s contained organic polyelectrolytes with high contents of carboxyl, carbonyl, and hydroxyl group (Figure 7). The differences of DOM-KT and the other two DOM can be observed specifically at O-H stretching region (3400–300 cm−1) and C=O stretching region (1650–1630 cm−1). The DOM-KT spectra show the highest intensity in these two regions compared to the other DOM. Carboxylic and phenolic substituents are associated with terrestrial contributions [70]. The FI and BIX values of DOM-KT from the fluorescent spectroscopy analysis indicate a predominantly autochthonous origin freshly produced from biological or microbial origin. This is supported by the absence of lignin peak (1220–1235 cm−1) in ATR-FTIR in the DOM-KT sample. Lignin which is a vascular phenolic polymer had been used as a biomarker for terrigenous DOM in other studies [71,72].
To better understand the characteristics of each DOM, we analysed the relationship between spectroscopy indices through Pearson correlation analysis (Table 5). A significant positive relationship was observed between the SUVA254 and HIX. However, there was a significant negative correlation with other spectroscopy indices excluding the A355. As described by [43], SUVA254 is positively correlated with humic acid fraction and inversely correlated with average molecular weight (E2/E3). There was no significant correlation between the A355 and HIX and A355 and E4/E6.

5. Conclusions

The findings of this study revealed that the chemical and spectroscopy characterisation of DOM isolated from the tropical coastal marine sediment was influenced by the physical environment and land activity.
The TOC of sediment samples was varied between 0.83–1.25% (w/w) and was dominated with HFOC. The DOM concentration (measured as DOC) was found to be in the range of 7.05–8.47 mg/L. Further analysis of elemental ratio shows the H/C ratio in KS-DOM and K-DOM were more than 1, which indicates the terrestrial derived sources mainly from mangroves-derived organic matter and anthropogenic activities. Meanwhile, the lower value of H/C in DOM-KT (less than 1.0) revealed it is rich in autochthonous marine-derived organic matter. This was confirmed with the C/N ratio value and several UV-Vis and fluorescent spectroscopy indices.
The UV-Vis spectra analysis via the SUVA254, E2/E3 ratio and SR revealed that high molecular weight molecules are dominant in all DOM samples. Furthermore, the ATR-FTIR spectrum confirmed the presence of functional groups such as organic polyelectrolytes with high contents of carboxyl, carbonyl, and a hydroxyl group.
Future studies should be extended to examine the molecular composition of the organic matter from the coastal sediments. A 3D-EEM fluorescence-PARAFAC characterisation would provide additional information on the DOM diversity and biochemical constituents in the marine sediment. The method provided for DOM characterisation of the KS, KT, and K might be extended to other tropical coastal ecosystems that have received less attention, such as wetland, coral reef, and peat coastal regions. This assessment will be valuable for future comparative organic matter profiles in tropical ecosystem sediments, as well as for updating the current emerging pollution profile in this anthropogenically damaged area.

Supplementary Materials

The following are available online at https://www.mdpi.com/article/10.3390/jmse9090997/s1, Table S1: Variation of organic carbon (OC) content in the three sediments.

Author Contributions

Conceptualization, A.M. and H.H.; methodology, N.F.D.; investigation, N.F.D.; resources. N.F.D.; writing—original draft preparation, N.F.D.; writing—review and editing, A.M. and H.H.; supervision, A.M. and H.H. All authors have read and agreed to the published version of the manuscript.

Funding

The financial support for this research was provided by the Universiti Teknologi Malaysia Research University Grant QJ130000.2424.00G62.

Institutional Review Board Statement

Not applicable.

Informed Consent Statement

Not applicable.

Data Availability Statement

Not applicable.

Acknowledgments

The authors are grateful to the Malaysia Japan International Institute of Technology (MJIIT) (Universiti Teknologi Malaysia) for providing the laboratory facilities and the AMTEC (Universiti Teknologi Malaysia) research group, for assisting with the TOC analysis.

Conflicts of Interest

The authors declare no conflict of interest.

References

  1. Carreira, R.S.; Cordeiro, L.G.M.S.; Bernardes, M.C.; Hatje, V. Distribution and characterization of organic matter using lipid biomarkers: A case study in a pristine tropical bay in NE Brazil. Estuar. Coast. Shelf Sci. 2016, 168, 1–9. [Google Scholar] [CrossRef]
  2. Huguet, A.; Vacher, L.; Saubusse, S.; Etcheber, H.; Abril, G.; Relexans, S.; Ibalot, F.; Parlanti, E. New insights into the size distribution of fluorescent dissolved organic matter in estuarine waters. Org. Geochem. 2010, 41, 595–610. [Google Scholar] [CrossRef]
  3. Kolic, P.E.; Roy, E.D.; White, J.R.; Cook, R.L. Spectroscopic measurements of estuarine dissolved organic matter dynamics during a large-scale Mississippi River flood diversion. Sci. Total Environ. 2014, 485–486, 518–527. [Google Scholar] [CrossRef] [PubMed]
  4. McKnight, D.M.; Boyer, E.W.; Westerhoff, P.K.; Doran, P.T.; Kulbe, T.; Andersen, D.T. Spectrofluorometric characterization of dissolved organic matter for indication of precursor organic material and aromaticity. Limnol. Oceanogr. 2001, 46, 38–48. [Google Scholar] [CrossRef]
  5. Traversa, A.; D’Orazio, V.; Mezzapesa, G.N.; Bonifacio, E.; Farrag, K.; Senesi, N.; Brunetti, G. Chemical and spectroscopic characteristics of humic acids and dissolved organic matter along two Alfisol profiles. Chemosphere 2014, 111, 184–194. [Google Scholar] [CrossRef]
  6. Hur, J.; Kim, G. Comparison of the heterogeneity within bulk sediment humic substances from a stream and reservoir via selected operational descriptors. Chemosphere 2009, 75, 483–490. [Google Scholar] [CrossRef] [PubMed]
  7. Costa, A.B.; Novotny, E.H.; Bloise, A.C.; de Azevedo, E.R.; Bonagamba, T.J.; Zucchi, M.R.; Santos, V.L.C.S.; Azevedo, A.E.G. Characterization of organic matter in sediment cores of the Todos os Santos Bay, Bahia, Brazil, by elemental analysis and 13C NMR. Mar. Pollut. Bull. 2011, 62, 1883–1890. [Google Scholar] [CrossRef] [Green Version]
  8. Giovanela, M.; Crespo, J.S.; Antunes, M.; Adamatti, D.S.; Fernandes, A.N.; Barison, A.; Da Silva, C.W.P.; Guégan, R.; Motelica-Heino, M.; Sierra, M.M.D. Chemical and spectroscopic characterization of humic acids extracted from the bottom sediments of a Brazilian subtropical microbasin. J. Mol. Struct. 2010, 981, 111–119. [Google Scholar] [CrossRef] [Green Version]
  9. Xu, H.; Guo, L. Molecular size-dependent abundance and composition of dissolved organic matter in river, lake and sea waters. Water Res. 2017, 117, 115–126. [Google Scholar] [CrossRef]
  10. Bongiorno, G.; Bünemann, E.K.; Oguejiofor, C.U.; Meier, J.; Gort, G.; Comans, R.; Mäder, P.; Brussaard, L.; de Goede, R. Sensitivity of labile carbon fractions to tillage and organic matter management and their potential as comprehensive soil quality indicators across pedoclimatic conditions in Europe. Ecol. Indic. 2019, 99, 38–50. [Google Scholar] [CrossRef]
  11. Sarkar, A.; Chakraborty, P.; Nagender Nath, B. Distribution and nature of sedimentary organic matter in a tropical estuary: An indicator of human intervention on environment. Mar. Pollut. Bull. 2016, 102, 176–186. [Google Scholar] [CrossRef]
  12. Lin, H.; Cai, Y.; Sun, X.; Chen, G.; Huang, B.; Cheng, H.; Chen, M. Sources and mixing behavior of chromophoric dissolved organic matter in the Taiwan Strait. Mar. Chem. 2016, 187, 43–56. [Google Scholar] [CrossRef]
  13. Chen, Y.; Yang, G.P.; Liu, L.; Zhang, P.Y.; Leng, W.S. Sources, behaviors and degradation of dissolved organic matter in the East China Sea. J. Mar. Syst. 2016, 155, 84–97. [Google Scholar] [CrossRef]
  14. Liow, G.R.; Lau, W.L.S.; Law, I.K.; Hii, K.S.; Mohammad Noor, N.; Leaw, C.P.; Lim, P.T. Phytoplankton community changes in Kuantan Port (Malaysia), with emphasis on the paralytic-shellfish toxin-producing dinoflagellate Alexandrium tamiyavanichii. Reg. Stud. Mar. Sci. 2019, 26, 100504. [Google Scholar] [CrossRef]
  15. Santos, E.C.; Celino, J.J.; Santos, V.L.C.S.; Bispo De Souza, J.R. Source and distribution of organic matter in surface sediments from mangroves on the island of Itaparica, Bahia/Brazil. Environ. Monit. Assess. 2013, 185, 9857–9869. [Google Scholar] [CrossRef]
  16. Yin, Y.; Impellitteri, C.A.; You, S.-J.; Allen, H.E. The importance of organic matter distribution and extract soil:solution ratio on the desorption of heavy metals from soils. Sci. Total Environ. 2002, 287, 107–119. [Google Scholar] [CrossRef]
  17. Wang, W.; Lai, D.Y.F.; Wang, C.; Pan, T.; Zeng, C. Effects of rice straw incorporation on active soil organic carbon pools in a subtropical paddy field. Soil Tillage Res. 2015, 152, 8–16. [Google Scholar] [CrossRef]
  18. Wang, S.; Jiao, L.; Yang, S.; Jin, X.; Liang, H.; Wu, F. Organic matter compositions and DOM release from the sediments of the shallow lakes in the middle and lower reaches of Yangtze River region, China. Appl. Geochemistry 2011, 26, 1458–1463. [Google Scholar] [CrossRef]
  19. Yang, K.; Miao, G.; Wu, W.; Lin, D.; Pan, B.; Wu, F.; Xing, B. Sorption of Cu2+ on humic acids sequentially extracted from a sediment. Chemosphere 2015, 138, 657–663. [Google Scholar] [CrossRef]
  20. Guigue, J.; Mathieu, O.; Leveque, J.; Mounier, S.; Laffont, R.; Maron, P.A.; Navarro, N.; Chateua, C.; Amiotte-Suchet, P.; Lucas, Y. A comparison of extraction procedures for water-extractable organic matter in soils. Eur. J. Soil Sci. 2014, 65, 520–530. [Google Scholar] [CrossRef]
  21. Liu, C.; Li, Z.; Asefaw, A.; Xiao, H.; Liu, L.; Wang, D.; Peng, H.; Zeng, G. Characterizing dissolved organic matter in eroded sediments from a loess hilly catchment using fl uorescence EEM-PARAFAC and UV – Visible absorption: Insights from source identi fi cation and carbon cycling. Geoderma 2019, 334, 37–48. [Google Scholar] [CrossRef]
  22. Kalbitz, K.; Geyer, S.; Geyer, W. A comparative characterization of dissolved organic matter by means of original aqueous samples and isolated humic substances. Chemosphere 2000, 40, 1305–1312. [Google Scholar] [CrossRef]
  23. He, W.; Lee, J.-H.; Hur, J. Anthropogenic signature of sediment organic matter probed by UV–Visible and fluorescence spectroscopy and the association with heavy metal enrichment. Chemosphere 2016, 150, 184–193. [Google Scholar] [CrossRef] [PubMed]
  24. Wang, Y.; Zhang, D.; Shen, Z.; Chen, J.; Feng, C. Characterization and spacial distribution variability of chromophoric dissolved organic matter (CDOM) in the Yangtze Estuary. Chemosphere 2014, 95, 353–362. [Google Scholar] [CrossRef] [PubMed]
  25. Zhang, S.; Li, S.; Dong, H.; Zhao, Q.; Lu, X.; Shi, J. An analysis of organic matter sources for surface sediments in the central South Yellow Sea, China: Evidence based on macroelements and n-alkanes. Mar. Pollut. Bull. 2014, 88, 389–397. [Google Scholar] [CrossRef] [PubMed]
  26. Pang, S.Y.; Tay, J.H.; Suratman, S.; Simoneit, B.R.T.; Mohd Tahir, N. Input of organic matter in Brunei Bay, East Malaysia, as indicated by sedimentary steroids and multivariate statistics. Mar. Pollut. Bull. 2020, 156, 111269. [Google Scholar] [CrossRef] [PubMed]
  27. Xing, L.; Zhang, H.; Yuan, Z.; Sun, Y.; Zhao, M. Terrestrial and marine biomarker estimates of organic matter sources and distributions in surface sediments from the East China Sea shelf. Cont. Shelf Res. 2011, 31, 1106–1115. [Google Scholar] [CrossRef]
  28. Yuan, H.; Song, J.; Li, X.; Li, N.; Duan, L. Distribution and contamination of heavy metals in surface sediments of the South Yellow Sea. Mar. Pollut. Bull. 2012, 64, 2151–2159. [Google Scholar] [CrossRef]
  29. Wang, Y.; Zhang, D.; Shen, Z.; Feng, C.; Zhang, X. Investigation of the interaction between As and Sb species and dissolved organic matter in the Yangtze Estuary, China, using excitation–emission matrices with parallel factor analysis. Environ. Sci. Pollut. Res. 2014, 22, 1819–1830. [Google Scholar] [CrossRef]
  30. Fong, S.S.; Mohamed, M. Chemical characterization of humic substances occurring in the peats of Sarawak, Malaysia. Org. Geochem. 2007, 38, 967–976. [Google Scholar] [CrossRef]
  31. He, M.; Shi, Y.; Lin, C. Characterization of humic acids extracted from the sediments of the various rivers and lakes in China. J. Environ. Sci. 2008, 20, 1294–1299. [Google Scholar] [CrossRef]
  32. Timofeevna Shirshova, L.; Ghabbour, E.A.; Davies, G. Spectroscopic characterization of humic acid fractions isolated from soil using different extraction procedures. Geoderma 2006, 133, 204–216. [Google Scholar] [CrossRef]
  33. Ogawa, Y.; Okamoto, Y.; Sadaba, R.B.; Kanzaki, M. Sediment organic matter source estimation and ecological classification in the semi-enclosed Batan Bay Estuary, Philippines. Int. J. Sediment Res. 2021, 36, 110–119. [Google Scholar] [CrossRef]
  34. Li, Z.; Huang, M.; Luo, N.; Wen, J.; Deng, C. Spectroscopic study of the effects of dissolved organic matter compositional changes on availability of cadmium in paddy soil under different water management practices. Chemosphere 2019, 225, 414–423. [Google Scholar] [CrossRef] [PubMed]
  35. Janzen, H.H.; Campbell, C.A.; Brandt, S.A.; Lafond, G.P.; Townley-Smith, L. Light-Fraction Organic Matter in Soils from Long-term Crop Rotations. Soil Sci. Soc. Am. J. 1992, 56, 1799–1806. [Google Scholar] [CrossRef] [Green Version]
  36. Xi, M.; Zi, Y.; Wang, Q.; Wang, S.; Cui, G.; Kong, F. Assessment of the content, structure, and source of soil dissolved organic matter in the coastal wetlands of Jiaozhou Bay, China. Phys. Chem. Earth 2018, 103, 35–44. [Google Scholar] [CrossRef]
  37. Chen, J.; Gu, B.; LeBoeuf, E.J.; Pan, H.; Dai, S. Spectroscopic characterization of the structural and functional properties of natural organic matter fractions. Chemosphere 2002, 48, 59–68. [Google Scholar] [CrossRef]
  38. Li, Y.; Zhang, L.; Wang, S.; Zhao, H.; Zhang, R. Composition, structural characteristics and indication of water quality of dissolved organic matter in Dongting Lake sediments. Ecol. Eng. 2016, 97, 370–380. [Google Scholar] [CrossRef]
  39. Liu, S.; Zhao, T.; Zhu, Y.; Qu, X.; He, Z.; Giesy, J.P.; Meng, W. Molecular characterization of macrophyte-derived dissolved organic matters and their implications for lakes. Sci. Total Environ. 2018, 616–617, 602–613. [Google Scholar] [CrossRef]
  40. Rodríguez, F.J.; Schlenger, P.; García-Valverde, M. Monitoring changes in the structure and properties of humic substances following ozonation using UV-Vis, FTIR and1H NMR techniques. Sci. Total Environ. 2016, 541, 623–637. [Google Scholar] [CrossRef]
  41. Wu, D.; Ren, C.; Jiang, L.; Li, Q.; Zhang, W.; Wu, C. Characteristic of dissolved organic matter polar fractions with variable sources by spectrum technologies: Chemical properties and interaction with phenoxy herbicide. Sci. Total Environ. 2020, 724, 138262. [Google Scholar] [CrossRef]
  42. Li, Y.; Harir, M.; Lucio, M.; Gonsior, M.; Koch, B.P.; Schmitt-Kopplin, P.; Hertkorn, N. Comprehensive structure-selective characterization of dissolved organic matter by reducing molecular complexity and increasing analytical dimensions. Water Res. 2016, 106, 477–487. [Google Scholar] [CrossRef]
  43. Weishaar, J.L.; Fram, M.S.; Fujii, R.; Mopper, K. Evaluation of Specific Ultraviolet Absorbance as an Indicator of the Chemical Composition and Reactivity of Dissolved Organic Carbon. Environ. Sci. Technol. 2003, 37, 4702–4708. [Google Scholar] [CrossRef] [PubMed]
  44. Zhang, Y.; Liu, X.; Wang, M.; Qin, B. Compositional differences of chromophoric dissolved organic matter derived from phytoplankton and macrophytes. Org. Geochem. 2013, 55, 26–37. [Google Scholar] [CrossRef]
  45. Helms, J.R.; Stubbins, A.; Ritchie, J.D.; Minor, E.C.; Kieber, D.J.; Mopper, K. Absorption spectral slopes and slope ratios as indicators of molecular weight, source, and photobleaching of chromophoric dissolved organic matter. Limnol. Oceanogr. 2008, 53, 955–969. [Google Scholar] [CrossRef] [Green Version]
  46. Jiang, T.; Skyllberg, U.; Björn, E.; Green, N.W.; Tang, J.; Wang, D.; Gao, J.; Li, C. Characteristics of dissolved organic matter (DOM) and relationship with dissolved mercury in Xiaoqing River-Laizhou Bay estuary, Bohai Sea, China. Environ. Pollut. 2017, 223, 19–30. [Google Scholar] [CrossRef] [PubMed] [Green Version]
  47. Osburn, C.L.; Stedmon, C.A. Linking the chemical and optical properties of dissolved organic matter in the Baltic–North Sea transition zone to differentiate three allochthonous inputs. Mar. Chem. 2011, 126, 281–294. [Google Scholar] [CrossRef]
  48. Harvey, E.T.; Kratzer, S.; Andersson, A. Relationships between colored dissolved organic matter and dissolved organic carbon in different coastal gradients of the Baltic Sea. Ambio 2015, 44, 392–401. [Google Scholar] [CrossRef] [PubMed] [Green Version]
  49. Li, Y.; Wang, S.; Zhang, L. Composition, source characteristic and indication of eutrophication of dissolved organic matter in the sediments of Erhai Lake. Environ. Earth Sci. 2015, 74, 3739–3751. [Google Scholar] [CrossRef]
  50. Li, Y.; Wang, S.; Zhang, L.; Zhao, H.; Jiao, L.; Zhao, Y.; He, X. Composition and spectroscopic characteristics of dissolved organic matter extracted from the sediment of Erhai Lake in China. J. Soils Sediments 2014, 14, 1599–1611. [Google Scholar] [CrossRef]
  51. Couturier, M.; Nozais, C.; Chaillou, G. Microtidal subterranean estuaries as a source of fresh terrestrial dissolved organic matter to the coastal ocean. Mar. Chem. 2016, 186, 46–57. [Google Scholar] [CrossRef]
  52. Klučáková, M.; Kalina, M. Composition, particle size, charge, and colloidal stability of pH-fractionated humic acids. J. Soils Sediments 2015, 15, 1900–1908. [Google Scholar] [CrossRef]
  53. Yang, L.; Han, D.H.; Lee, B.-M.; Hur, J. Characterizing treated wastewaters of different industries using clustered fluorescence EEM–PARAFAC and FT-IR spectroscopy: Implications for downstream impact and source identification. Chemosphere 2015, 127, 222–228. [Google Scholar] [CrossRef]
  54. Haberhauer, G.; Rafferty, B.; Strebl, F.; Gerzabek, M.H. Comparison of the composition of forest soil litter derived from three different sites at various decompositional stages using FTIR spectroscopy. Geoderma 1998, 83, 331–342. [Google Scholar] [CrossRef]
  55. Praetzel, L.S.E.; Plenter, N.; Schilling, S.; Schmiedeskamp, M.; Broll, G.; Knorr, K.H. Organic matter and sediment properties determine in-lake variability of sediment CO2 and CH4 production and emissions of a small and shallow lake. Biogeosciences 2020, 17, 5057–5078. [Google Scholar] [CrossRef]
  56. Zhang, Y.; Du, J.; Zhang, F.; Yu, Y.; Zhang, J. Chemical characterization of humic substances isolated from mangrove swamp sediments: The Qinglan area of Hainan Island, China. Estuar. Coast. Shelf Sci. 2011, 93, 220–227. [Google Scholar] [CrossRef]
  57. Prasad, M.B.K.; Kumar, A.; Ramanathan, A.L.; Datta, D.K. Sources and dynamics of sedimentary organic matter in Sundarban mangrove estuary from Indo-Gangetic delta. Ecol. Process. 2017, 6. [Google Scholar] [CrossRef] [Green Version]
  58. Dong, Y.; Li, Y.; Kong, F.; Zhang, J.; Xi, M. Source, structural characteristics and ecological indication of dissolved organic matter extracted from sediments in the primary tributaries of the Dagu River. Ecol. Indic. 2020, 109, 105776. [Google Scholar] [CrossRef]
  59. Baran, A.; Mierzwa-Hersztek, M.; Gondek, K.; Tarnawski, M.; Szara, M.; Gorczyca, O.; Koniarz, T. The influence of the quantity and quality of sediment organic matter on the potential mobility and toxicity of trace elements in bottom sediment. Environ. Geochem. Health 2019, 7. [Google Scholar] [CrossRef] [PubMed] [Green Version]
  60. Osburn, C.L.; Boyd, T.J.; Montgomery, M.T.; Bianchi, T.S.; Coffin, R.B.; Paerl, H.W. Optical Proxies for Terrestrial Dissolved Organic Matter in Estuaries and Coastal Waters. Front. Mar. Sci. 2016, 2, 127. [Google Scholar] [CrossRef] [Green Version]
  61. Bergamino, L.; Rodríguez-Gallego, L.; Pérez-Parada, A.; Chialanza, M.R.; Amaral, V.; Perez, L.; Scarabino, F.; Lescano, C.; García-Sposito, C.; Costa, S.; et al. Autochthonous organic carbon contributions to the sedimentary pool: A multi-analytical approach in Laguna Garzón. Org. Geochem. 2018, 125, 55–65. [Google Scholar] [CrossRef]
  62. Bueno, C.; Brugnoli, E.; Bergamino, L.; Muniz, P.; García-Rodríguez, F.; Figueira, R. Anthropogenic and natural variability in the composition of sedimentary organic matter of the urbanised coastal zone of Montevideo (Río de la Plata). Mar. Pollut. Bull. 2018, 126, 197–203. [Google Scholar] [CrossRef] [PubMed]
  63. Gardade, L.; Khandeparker, L. Sedimentary organic matter composition from tropical ports with distinct geographic and morpho-hydrodynamic characteristics: Evaluation through multiple biochemical markers. Mar. Pollut. Bull. 2020, 160, 111679. [Google Scholar] [CrossRef] [PubMed]
  64. Masood, N.; Halimoon, N.; Aris, A.Z.; Zakaria, M.P.; Vaezzadeh, V.; Magam, S.M.; Mustafa, S.; Ali, M.M.; Keshavarzifard, M.; Alkhadher, S.A.A.; et al. Seasonal variability of anthropogenic indices of PAHs in sediment from the Kuala Selangor River, west coast Peninsular Malaysia. Environ. Geochem. Health 2018, 40, 2551–2572. [Google Scholar] [CrossRef]
  65. Zhou, Y.-W.; Zhao, B.; Peng, Y.-S.; Chen, G.-Z. Influence of mangrove reforestation on heavy metal accumulation and speciation in intertidal sediments. Mar. Pollut. Bull. 2010, 60, 1319–1324. [Google Scholar] [CrossRef]
  66. Zhao, C.; Jiang, Z.; Wu, Y.; Liu, S.; Cui, L.; Zhang, J.; Bay, D. Origins of sediment organic matter and their contributions at three contrasting wetlands in a coastal semi-enclosed ecosystem. Mar. Pollut. Bull. 2019, 139, 32–39. [Google Scholar] [CrossRef] [PubMed]
  67. Damak, M.; Fourati, R.; Ellech, B.; Kallel, M. Assessment of organic and metallic contamination in the surface sediment of Monastir Bay (Eastern Tunisia): Spatial distribution, potential sources, and ecological risk assessment. Mar. Pollut. Bull. 2019, 149, 110500. [Google Scholar] [CrossRef] [PubMed]
  68. Habibullah-Al-Mamun, M.; Ahmed, M.K.; Raknuzzaman, M.; Islam, M.S.; Negishi, J.; Nakamichi, S.; Sekine, M.; Tokumura, M.; Masunaga, S. Occurrence and distribution of perfluoroalkyl acids (PFAAs) in surface water and sediment of a tropical coastal area (Bay of Bengal coast, Bangladesh). Sci. Total Environ. 2016, 571, 1089–1104. [Google Scholar] [CrossRef]
  69. Marziah, Z.; Mahdzir, A.; Musa, M.N.; Jaafar, A.B.; Azhim, A.; Hara, H. Abundance of sulfur-degrading bacteria in a benthic bacterial community of shallow sea sediment in the off-Terengganu coast of the South China Sea. Microbiologyopen 2016, 1–12. [Google Scholar] [CrossRef] [Green Version]
  70. Mathew, J.; Gopinath, A.; Vareed, R.A. Spectroscopic characterization of humic substances isolated from tropical mangrove sediments. Arab. J. Geosci. 2021, 14. [Google Scholar] [CrossRef]
  71. Lu, C.J.; Benner, R.; Fichot, C.G.; Fukuda, H.; Yamashita, Y.; Ogawa, H. Sources and transformations of dissolved lignin phenols and chromophoric dissolved organic matter in Otsuchi Bay, Japan. Front. Mar. Sci. 2016, 3, 1–13. [Google Scholar] [CrossRef] [Green Version]
  72. Pempkowiak, J. Limitation of lignin derivatives as biomarkers of land derived organic matter in the coastal marine sediments. Oceanologia 2020, 62, 374–386. [Google Scholar] [CrossRef]
Figure 1. Location of sampling stations in this study.
Jmse 09 00997 g001
Figure 2. Variation of OC in bulk marine sediment, (n = 9). (a) Concentration of DOC and CDOM, and the CDOM/DOC ratio. (b) Percentage of LFOC, HFOC and AOC in bulk marine sediment. Error bars indicate the standard deviation.
Jmse 09 00997 g002
Figure 3. UV-Visible absorbance spectra of DOM of KT, K and KS in this study.
Jmse 09 00997 g003
Figure 4. Relationship between DOC and CDOM in KS, K and KT, n = 9.
Jmse 09 00997 g004
Figure 5. Fluorescent spectral indices of DOM in this study. (a) HIX (b) FI (c) BIX.
Jmse 09 00997 g005
Figure 6. Pearson Correlation of HIX and SUVA254, n = 27.
Jmse 09 00997 g006
Figure 7. ATR-FTIR spectra of DOM samples.
Jmse 09 00997 g007
Table 1. Description of sampling stations.
Station LongitudeLatitudeDepth of Water Column (m)Description
Kuala Selangor (KS)101°18′05.5″ E3°13′48.5″ N15 m3 km from estuary with mangrove forest Fishing village,
aquaculture pond
Kuala Terengganu (KT)103°09′23.2″ E5°20′36.9″ N15 m5 km off Kuala Terengganu
river mouth
Kuantan (K)103°22′39.2″ E3°48′28.3″ N15 m2 km of Kuantan port
Table 2. Properties of the marine sediment.
StationTOC(g/kg) Mean (±SD)Grain Distribution %Sediment
Classification USDA
Total Acidic Group
(mmol/g)
COOH Group (mmol/g)Phenolic Group
(mmol/g)
pH
ClaySiltSand
KS1.25 ± 0.73462034Clay7.344.123.227.45
KT0.83 ± 0.30102466Sandy loam6.523.602.557.56
K1.08 ± 1.04373132Clay loam6.233.502.737.81
Table 3. Elemental composition and atomic of DOM extracted from three marine sediments.
StationC (%)H (%)N (%)O (%)H/C aO/C bC/N c
KS28.6030.201.6039.611.061.3817.88
KT30.4015.013.5248.640.491.588.69
K33.1035.832.7227.531.080.9011.04
a, b, c Calculated as described by [8].
Table 4. UV-visible and fluorescent spectroscopy indices of the DOM extracted from three sediments.
StationUV-Visible IndicesFluorescent Indices
SUVA254E2/E3E4/E6A355SRHIXFIBIX
KS5.44 ± 0.088.324.323.430.131.63 ± 0.030.95 ± 0.080.67 ± 0.02
K4.75 ± 0.0910.716.502.770.071.36 ± 0.021.10 ± 0.070.62 ± 0.01
KT4.19 ± 0.0818.438.643.980.591.20 ± 0.021.58 ± 0.091.27 ± 0.12
The values shown as mean with (n = 9), followed by ±(standard deviation).
Table 5. Correlation among spectroscopy indices.
SUVA254E2/E3E4/E6A355HIXBIXFI
SUVA2541
E2/E3−0.926 *1
E4/E6−0.984 *0.946 *1
A355−0.3160.606 *0.3391
HIX0.979 *−0.905 *−0.982 *−0.2351
BIX−0.878 *0.946 *0.895 *0.627 *−0.825 *1
FI−0.904 *0.957 *0.906 *0.597 *−0.866 *0.898 *1
* Indicates significant correlation at the 0.01 level. Correlation is significant at the 0.01 level (2-tailed).
Publisher’s Note: MDPI stays neutral with regard to jurisdictional claims in published maps and institutional affiliations.

