Article

Fin Whale (Balaenoptera physalus) in the Ligurian Sea: Preliminary Study on Acoustics Demonstrates Their Regular Occurrence in Autumn

1
Life Sciences and Systems Biology Department, University of Torino, Via Accademia Albertina 13, 10123 Torino, Italy
2
WWF Italy, Marine Office, Via Po 25/c., 00198 Roma, Italy
3
eConscience-Art of Soundscape, Via Provinciale 610, 90046 Monreale (Palermo), Italy
4
Istituto Nazionale di Fisica Nucleare-Laboratori Nazionali del Sud (INFN-LNS), Via S. Sofia 62, 95123 Catania, Italy
5
Institute for the Study of Anthropic Impacts and Sustainability in the Marine Environment of the National Research Council of Italy (CNR-IAS), Detached Unit of Capo Granitola, Via del Mare 3, 91021 Torretta Granitola, Italy
6
National Institute of Water and Atmospheric Research (NIWA), 301 Evans Bay Parade, Wellington 6021, New Zealand
*
Author to whom correspondence should be addressed.
These authors contributed equally to this work.
J. Mar. Sci. Eng. 2021, 9(9), 966; https://doi.org/10.3390/jmse9090966
Submission received: 13 August 2021 / Revised: 26 August 2021 / Accepted: 30 August 2021 / Published: 6 September 2021
(This article belongs to the Special Issue Passive Acoustics to Study Marine and Freshwater Ecosystems)

Abstract

:
The patterns of movement of the fin whale (Balaenoptera physalus (Linnaeus, 1758)) in the Mediterranean Sea are still a matter of debate. Feeding aggregations are well known in the Corso-Liguro-Provençal Basin from July to September, but little is known for the autumn and winter seasons. Passive acoustic monitoring (PAM) was implemented in the Ligurian Sea to overcome this gap and to investigate the temporal and spatial variation of fin whale acoustic presence. From July to December 2011, five autonomous recorders were deployed at between 700 and 900 m depths. Fin whale calls were automatically detected almost every day, with higher vocalization rates in October, November, and December. Furthermore, daily vocalization rates were higher during light hours, and closer to the coast. These outcomes suggest that not all the individuals migrate, staying in the area also during autumn for feeding or breeding purposes. The dial cycle of vocalization might be related to feeding activities and zooplankton vertical migration, whereas the proximity to the coast can be explained by the morphology of the area that promotes the upwelling system. Although this work only represents a six-month period, certainly it suggests the need for a larger spatial and temporal PAM effort, crucial for species management and for mitigating possible impact of anthropogenic activities at the basin level.

1. Introduction

The Mediterranean fin whale (Balaenoptera physalus (Linnaeus, 1758)) constitutes a separate population from the North Atlantic specimens, with a very limited male-mediated gene flow among the two populations [1]. In the Mediterranean basin, the species occurs prevalently along the continental slope and in deep waters (400 to 2500 m) [2,3,4,5,6], where upwelling and frontal zones favor the presence of dense zooplankton aggregations (mostly Meganyctiphanes norvegica (M. Sars, 1857)), which constitute fin whales’ main prey [2]. Feeding aggregations are well known in the Corso-Liguro-Provençal Basin and the Gulf of Lion from July to September [4,7,8,9,10,11]. This area presents a narrow continental shelf with a permanent water frontal system generated by a dominant cyclonic circulation and strong Mistral winds (from the northwest) [12,13]. Upwelling currents push deep organic substances and nutrients into the euphotic zone, the water layer closest to the surface that receives enough light for photosynthesis to occur, increasing primary productivity (Chl concentration >10 mg m−3) [14,15,16] and enhancing phyto- and zooplankton presence [17,18]. An opportunistic summer (June–September) feeding ground with high concentration of chlorophyll has also been detected in the Tyrrhenian Sea, where fin whale occurrence has been increasingly recorded in the last few years [11].
Recent studies suggest that the resident Mediterranean population moves north–south among the summer feeding ground in the northwestern basin and the winter feeding grounds in the Algerian–Balearic basin or the Ionian Sea [19,20,21]. Acoustic and satellite tag data demonstrated that some specimens undertake movements from the Corso-Liguro-Provençal Basin toward the waters surrounding the Balearic Islands [21], and from Lampedusa Island to the northern basin, probably as an effective response to resource fluctuations. During the late winter–early spring (February–March), indeed, feeding aggregations are documented around the Island of Lampedusa, in the Strait of Sicily, where Nyctiphanes couchii (Bell, 1853) concentrations were recorded [19,21,22]. Furthermore, the presence of the species was acoustically and visually detected from February to October in the Strait of Messina and in the contiguous Ionian Sea, with the peaks during both spring and late summer/early autumn (March–April, late August–October) [19,20,21,22,23].
However, the movement patterns of the resident Mediterranean fin whales are still a matter of debate [24]. Although fin whale density decreases in the Corso-Liguro-Provençal Basin from late summer [19], sightings have been recorded also during autumn and winter periods along the coast and the adjacent pelagic waters [3,6,21,25,26,27]. Hence, whereas some individuals move to the southern basin of the Mediterranean, others might persist during autumn and winter in the northwestern Mediterranean.
The collection of data on fin whale occurrence in winter in the northwestern Mediterranean is scarce. The generally bad weather conditions in winter hampers the possibilities of conducting dedicated surveys. To overcome the gap about the seasonal and long-term occurrence of the species in this area, a passive acoustic monitoring study was implemented in 2011. Since the species is highly vocal, acoustic long-term data can be a valuable cost-effective technique to monitor the presence of the species [20,23,28,29,30,31,32,33,34,35,36]. Fin whale vocalizations (Figure 1) prevalently consist of calls with peak frequency around 20 Hz (in the range of 15–45 Hz) with a duration of 0.5–1 s [31,32,34,37,38,39,40]. Single calls are used for social interactions [41,42,43,44]. Calls can also be arranged in long, stereotyped sequences (songs) with regular inter-pulse intervals (IPIs) [45,46,47]. Fin whale song classification is based on the occurrence of different IPIs: singlets (one distinct IPI), doublets (two alternating different IPIs), and triplets (two different IPIs, where one of them can be repeated two or more times) [37,45,46,48]. Songs can last for hours, and it has been hypothesized that they might have a reproductive function [41,49,50]. Mediterranean fin whales emit two types of calls: the pulsed signals that downsweep from 23 to 17 Hz, lasting approximately one second, and the back-beat signals at 18–20 Hz, lasting about 0.8–1 s [4,20,23,30,51,52].
The main scope of this work was to assess the acoustic occurrence of fin whales in the Corso-Liguro-Provençal basin after the summer feeding aggregations, in particular from July to December. Furthermore, the temporal patterns of acoustic detections and the spatial variations among the monitored sites were evaluated.

2. Materials and Methods

2.1. Data Collection
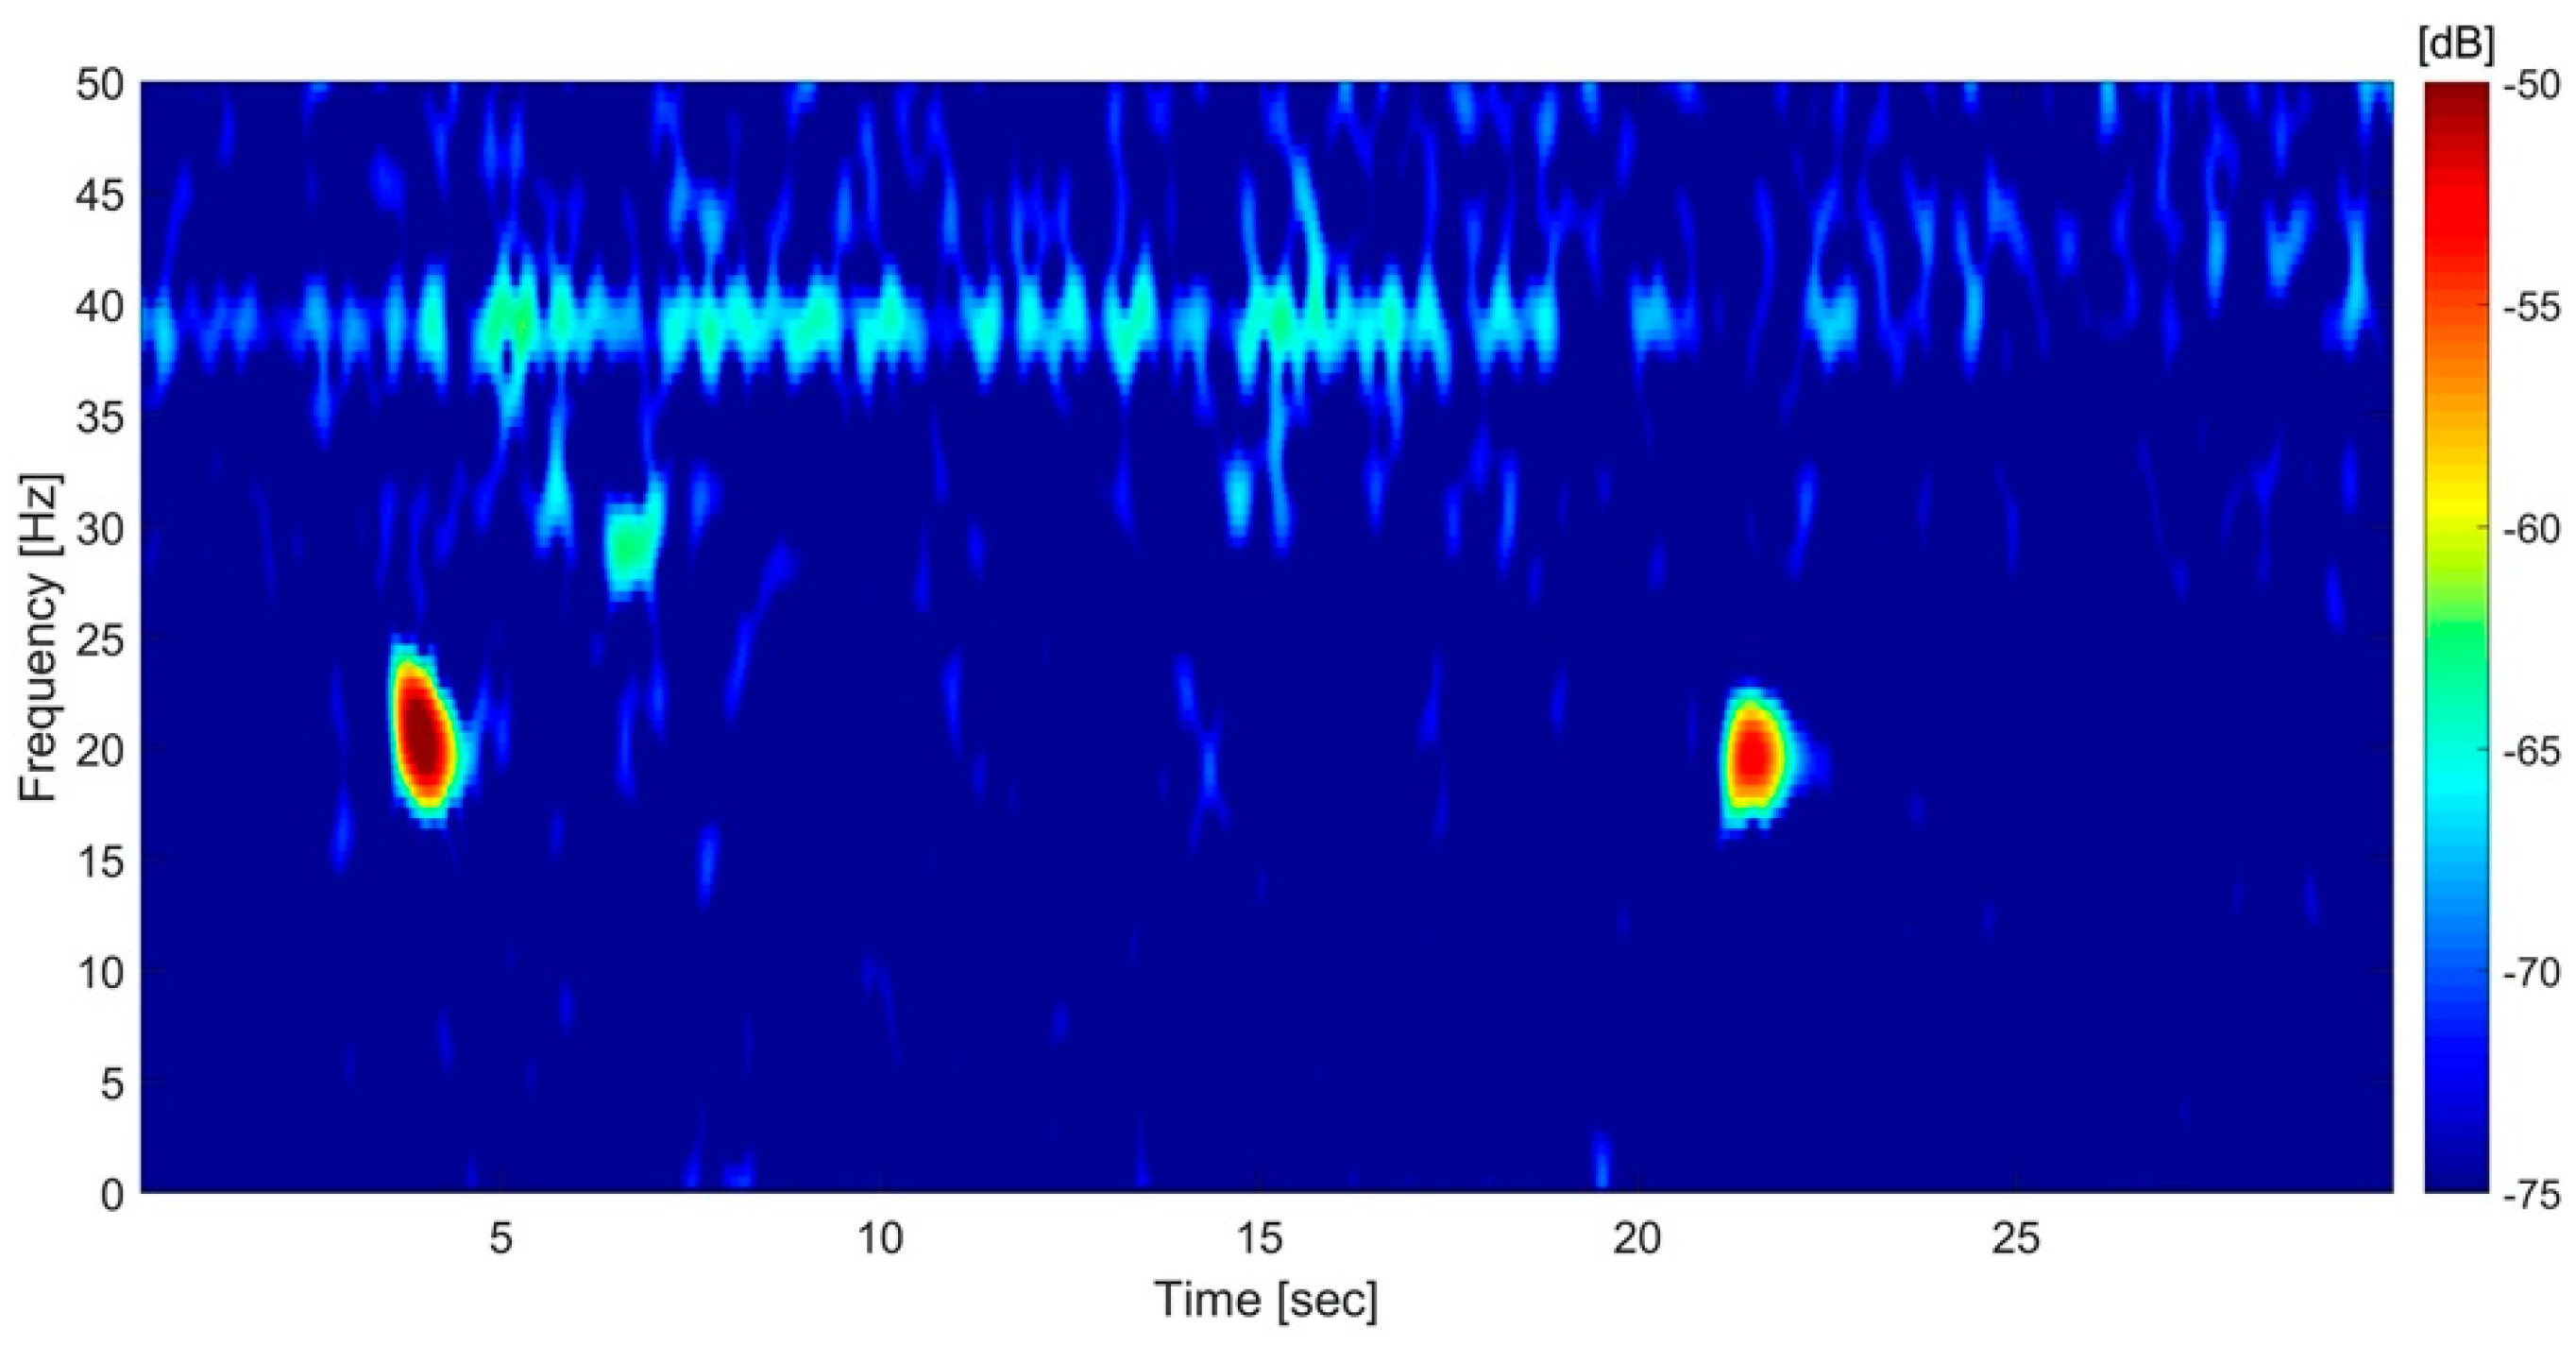
Five ecological acoustic recorders (EAR; Hawaii Institute of Marine Biology, Kaneohe, HI, USA) [53] were deployed during the North Atlantic Treaty Organization Centre for Maritime Research and Experimentation (NATO-CMRE) SIRENA11 research cruise [54,55]. The EARs were located at depths between 700 and 900 m in the Ligurian Sea (Figure 2).
Data were collected from 22 July to 9 December, 2011, at a sample rate of 80 kHz and a duty cycle of 120 or 240 s. Each EAR included a SQ26-01 hydrophone (Sensor Technology LTD, Collingwood, ONT, Canada) with a relatively flat frequency response from 1 kHz to 40 kHz and a sensitivity of −193.5 dB re 1 µPa/V. Detailed information on data collection by each instrument is summarized in Table 1. The number of hours recorded per EAR varied due to hard drive (EAR2 and 5) or CF2 Persistor (EAR 4) failure.

2.2. Data Analysis

In order to detect fin whale calls in the long-term acoustic data, a modified version of the automatic detection algorithm developed in MATLAB by Sciacca et al. [23,56] was used. The SAW (Spectrogram-based Approach to the automatic detection of fin Whale 20-Hz calls) algorithm worked in two steps, in the time and frequency domains, searching for isolated acoustic energy peaks in the typical frequency range and duration of fin whale 20 Hz pulses. All files were preliminary downsampled to a frequency of 2000 Hz. Before resampling, a low-pass filter was applied at 1000 Hz to prevent aliasing. Initially, the algorithm computed the spectrogram of each recording by using the most appropriate parameters for the search of the 20 Hz pulses. Taking into account the sampling frequency and the average duration of acquired recordings, spectrograms were produced at 2048 points FFT (fast Fourier transform), 1024 point Hann window, and 1000 overlap points, in order to obtain a time resolution of about 0.01 s and a frequency resolution of 0.97 Hz. At the first step, the algorithm looked for isolated energy peaks with a length equal to the target signal duration D (e.g., 1 s). It worked in the time domain using time steps defined by the spectrogram time resolution. For each time step, the algorithm analyzed a time interval of 3 s, corresponding to 3 times the target signal duration (D) and centered at the time step. For each time step t, the algorithm calculated the sum of the squared acoustic intensity I(t) in three time windows of 1 s duration (same duration of D), according to the following definitions:
A c e n t e r e d ( t ) = t D / 2 t + D / 2 I 2 ( t )
A b a c k w a r d ( t ) = t 3 D / 2 t D / 2 I 2 ( t )
A f o r w a r d ( t ) = t + D / 2 t + 3 D / 2 I 2 ( t )
Thus, Acentered(t), Abackward(t), and Aforward(t) were used to associate with each time step a numerical intensity peak estimator E (t), defined as:
E ( t ) = A c e n t e r e d 2 ( t ) A b a c k w a r d ( t ) A f o r w a r d ( t )
The moving median of the E was then calculated over a sliding window of 10 s. When the value of E exceeded the corresponding median value of an established threshold T1, it was noted as a potential detection. Once the first function detected peaks higher than T1 within the sample duration, the second step was implemented. At this step, the algorithm matched energy peaks in the frequency domain. Similar to the former, the algorithm used frequency steps defined by the frequency resolution and measured the SNR between the acoustic energy in the detection window (e.g., 1 Hz to 3 Hz) and an upper and lower frequency range of 10 Hz. A second empirical threshold (T2) discriminated whether identified peaks were high enough to be definitively acquired as a detection.
The detector performance was evaluated using a training dataset consisting of 100 files containing calls and 100 files with no calls randomly chosen in the total dataset. The receiver operating characteristic (ROC) curve method was used to assess the accuracy of the detection algorithm with different time and frequency thresholds (Figure 3). The threshold values that guaranteed the best performance of the detector were T1 = 40 dB and T2 = 10 dB for the time and frequency domain, respectively. Once these values were selected, the detector was applied to the entire SIRENA 11 dataset.
In order to account for the different recording efforts per hour of the day or per month, the detection results were calculated as detection rates (i.e., as the ratio between the number of recording files with fin whale detections and the total number of recording files per hour).
In order to account for the differences in the diel cycle, the time of sunrise and sunset of each sampling day were obtained from the website (https://www.dossier.net/utilities/calendario-solare-alba-tramonto/savona.htm, accessed on 13 August 2021) for the municipality of Savona (44°18′28.71″N 8°28′51.66″E) in the northern Italian region of Liguria (Figure 2, inset), along the coast of the study area.
Distance from the coast, mean slope, and depth at each site were obtained from the European Marine Observation and Data Network (EMODnet) Digital Bathymetry [57]. The slope values (mean and standard deviation) were computed for every EAR inside buffer rings with a radius of 5000 m from the EMODnet Digital Terrain Model (DTM) (Table 2). QGIS 3.12 GIS software was used to plot, extract, and analyze those spatial data (Europe metric LAEA projection—EPSG 3035) [58].

2.3. Statistical Analysis

In order to test the distribution and homoscedasticity (which is the assumption of samples of equal variance) of the detection rate, the Kolmogorov–Smirnov test and the Levene test were used. The detection rate did not follow a normal distribution (KS test: N = 11,227, D = 0.405, p < 0.001), and it did not show a homogeneous variance (Levene test: N = 11,227, M = 50.200, p < 0.001).
The Kruskal–Wallis non-parametric test was used to evaluate differences in the detection rates between the months, between the hours of the day, and between locations. In order to estimate differences, the Tamhane post-hoc test was performed. Furthermore, the Mann–Whitney non-parametric test was used to assess variations between daytime and nighttime, considering the time variations between sunrise and sunset from the website (https://www.dossier.net/utilities/calendario-solare-alba-tramonto/savona.htm, accessed on 13 August 2021) for the municipality of Savona.
All statistical analyses were carried out with the SPSS program (IBM SPSS, Armonk, NY, USA).

3. Results

3.1. Overall

The five EARs recorded a total of 10,306.27 effective hours of acoustic data (corresponding to 209,729 30 s files in 11,227 h). EAR1 and EAR3 recorded the highest number of files. The data analysis revealed that fin whale vocalizations were detected during 1747.74 h of recordings (Table 3), almost every day of data acquisition (Figure 4).

3.2. Temporal Pattern

3.2.1. Monthly Detection Rate

The fin whale monthly detection rate, whose values were calculated by dividing the number of detections in each month by the number of hours of recordings in the corresponding month, was higher during October, November, and December compared to the other months (Kruskall–Wallis test: N = 11,227, X2 = 254.74, p < 0.001; Tamhane test: July/August/September–October/November/December p < 0.001). For the Tamhane test, Table 4 shows the statistically significant pairs (Figure 5, Table 4).

3.2.2. Diel Cycle

Generally, the detection rate at daytime (the number of detections at daytime/number of hours recorded at daytime) was significantly higher than the detection rate at nighttime (the number of detections at nighttime/number of hours recorded at nighttime) (Mann–Whitney test: N = 11,227, Z = −2.41, p = 0.014) (Figure 6). Specifically, the highest significance occurred comparing the detection rates between 00:00 and 11:00 (Kruskall–Wallis test: N = 11,227, X2 = 57.00, p < 0.001; Tamhane test 00:00 vs. 11:00: p = 0.035). However, when considering each instrument separately, the detection rate was significantly higher during the daytime period only for EAR1 (Mann–Whitney test: N = 2817, Z = −2.88, p < 0.05).

3.3. Spatial Pattern

The hourly fin whale detection rate was higher at EAR1, EAR2, and EAR3 compared to the other EARs (Kruskall–Wallis test: N = 11,227, X2 = 135.671, p < 0.001, Tamhane test: EAR1–EAR2 p = 0.001; EAR1–EAR4, p < 0.001; EAR1–EAR5, p < 0.001; EAR2–EAR3 p < 0.001; EAR3–EAR4, p < 0.001; EAR3–EAR5, p < 0.001) (Figure 7). These instruments were the closest to the coast (from 11,340 to 14,400 m) at an intermediate slope compared to the other instruments. This slope was consistent with the halfway decline of the continental shelf.

4. Discussion

Fin whale distribution in the Mediterranean Sea is very dynamic [4,5,24] in both space and time. The present study showed the presence of the fin whale in the Corso-Liguro-Provençal Basin from July to December and confirmed that not all the individuals migrate to the southern Mediterranean Sea during autumn and the beginning of the winter. These results agree with previously published sparse winter sightings [26,27,59], suggesting that some individuals remain in the Ligurian sea year-round. Fin whales have also been previously detected up till mid-October using passive acoustics [51].
It might be possible that specimens remain in the Ligurian Sea after the summer to exploit the autumn spike in krill productivity in the region [60]. Although a primary phytoplankton bloom occurs in spring, a secondary and less intense event [60,61] takes place in autumn because of the deep convection movements that transfer the surface water mass into the depths, increases the nutrient concentration in shallow waters, and drives the seasonal cycle of phytoplankton [62]. However, as suggested by Geijer et al. [24], fin whales show strong dispersed behavior during winter over a wide geographical range within an enclosed basin, such as the Mediterranean, prompting the animals to maintain acoustic contact through their low-frequency sounds.
Furthermore, contrary to previous studies, our results show that fin whale acoustic presence was higher during October, November, and December compared to the summer months, even if two of the five EARs did not record during the last part of the studied period. This outcome was unexpected since the largest-known aggregations in the area were recorded during the summer even with high inter-annual variability [63]. The increase in vocalization detection might be due to a shift in habitat use and behavior, related to life stage, group structure, and reproduction. Fin whale vocalizations are indeed known to increase during the mating season over the autumn and winter months [45,64,65]. Therefore, the calls recorded during October–December might be part of songs emitted by few breeding individuals and last for hours to find potential mates.
Despite the acoustic data available for the present study, they were not sufficient to fully assess both the feeding and breeding hypotheses. Thus, the results may raise doubts about the common migration theory. As suggested by Geijer et al. [24], the peculiar environment of this semi-enclosed basin with favorable conditions likely does not force the individuals to implement a strict north–south migration for feeding and/or mating.
The present study also showed a diel cycle in fin whale acoustic behavior, which can be related to feeding activities. Detected fin whales were more acoustically active during the daylight period than at nighttime. Meganictiphanes norvegica (M. Sars, 1857), one of the main prey species of fin whales in the Mediterranean, migrates daily in the water column, surfacing during dark hours [66,67,68]. It is thus likely that fin whales predate on this zooplankton species mainly during nighttime, decreasing their vocal activities while increasing communication activity during daylight [49,69].
In addition, the spatial occurrence of the detected vocalizations is probably related to the feeding activity. The three EARs with the highest acoustic presence were the ones closest to shore and had both intermediate slope and standard deviation values. Most distribution models consider depth, slope, and distance from the coast as being among the most important factors for species spatial presence [5]. Depth, on the other hand, appeared to be irrelevant in the present study, unlike what was found by Wiggins and Hildebrand in Alaska [70]. However, scarce literature exists to date regarding the correlation between the depth and fin whale acoustic activity in the Mediterranean Sea. In this case, coast proximity was closely correlated with the slope and the morphology of the location. These areas are not jagged by canyons or characterized by plateaus but include slopes where upwelling occurs [5,19,71,72]. Therefore, as other previous studies have also shown, fin whales may prefer this upwelling area for feeding purposes.

5. Conclusions

The present study should be referred to as a snapshot that exclusively reflects what happens over six months in a single year. As suggested by Tepsich et al. [63], the urgent need for an integrated approach for large-scale and yearly monitoring is emerging, especially in relation to the strong anthropogenic impacts that this species faces in the Pelagos Sanctuary (in the Corso-Liguro-Provençal Basin), such as ship strikes, and noise pollution caused by naval traffic [6]. A long-term monitoring effort using dedicated PAM (passive acoustic monitoring) systems can be crucial for conservation measures, including management and implementation of protection solutions to mitigate the impacts of noise pollution (shipping, oil and gas exploration, energy offshore plants, military, and civilian sonar), and climate change.

Author Contributions

Conceptualization, L.P., C.G. and E.P.; formal analysis, L.P.; investigation, L.P., E.P. and G.G.; resources, G.G., V.S. and S.V.; writing—original draft preparation, L.P. and E.P.; writing—review and editing, all authors; supervision, C.G., E.P. and G.G. All authors have read and agreed to the published version of the manuscript.

Funding

This research was funded by WWF (World Wildlife Fund) Italy.

Institutional Review Board Statement

Not applicable.

Informed Consent Statement

Not applicable.

Data Availability Statement

All data presented are included in the work, other details are available on request from the authors.

Acknowledgments

A special thanks to the WWF (World Wildlife Fund) Italy, especially the Conservation Office, for funding and supporting L.P. Furthermore, the authors would like to acknowledge NATO-CMRE for their technical and financial support in the data collection and deployment of the EAR recorders.

Conflicts of Interest

The authors declare no conflict of interest.

References

  1. Bérubé, M.; Aguilar, A.; Dendanto, D.; Larsen, F.; Sciara, G.N.; Sears, R.; Sigurjonsson, J.; Palsbøll, P.J. Population genetic structure of North Atlantic, Mediterranean Sea and Sea of Cortez fin whales, Balaenoptera physalus (Linnaeus 1758): Analysis of mitochondrial and nuclear loci. Mol. Ecol. 1998, 7, 585–599. [Google Scholar] [CrossRef] [PubMed] [Green Version]
  2. Gannier, A. Summer distribution of fin whales (Balaenoptera physalus) in the northwestern Mediterranean marine mammals sanctuary. Rev. d’Ecol. 2002, 57, 135–150. [Google Scholar]
  3. Laran, S.; Gannier, A. Spatial and temporal prediction of fin whale distribution in the northwestern Mediterranean Sea. ICES J. Mar. Sci. 2008, 65, 1260–1269. [Google Scholar] [CrossRef]
  4. Di Sciara, G.N.; Zanardelli, M.; Jahoda, M.; Panigada, S.; Airoldi, S. The fin whale Balaenoptera physalus (L. 1758) in the Mediterranean Sea. Mammal Rev. 2003, 33, 105–150. [Google Scholar] [CrossRef]
  5. Panigada, S.; Zanardelli, M.; MacKenzie, M.; Donovan, C.; Mélin, F.; Hammond, P.S. Modelling habitat preferences for fin whales and striped dolphins in the Pelagos Sanctuary (Western Mediterranean Sea) with physiographic and remote sensing variables. Remote Sens. Environ. 2008, 112, 3400–3412. [Google Scholar] [CrossRef]
  6. Panigada, S.; Pesante, G.; Zanardelli, M.; Capoulade, F.; Gannier, A.; Weinrich, M.T. Mediterranean fin whales at risk from fatal ship strikes. Mar. Pollut. Bull. 2006, 52, 1287–1298. [Google Scholar] [CrossRef]
  7. Forcada, J.; di Sciara, G.N.; Fabbri, F. Abundance of fin whales and striped dolphins summering in the Corso-Ligurian Basin. Mammalia 1995, 59, 127–140. [Google Scholar] [CrossRef]
  8. Druon, J.N.; Panigada, S.; David, L.; Gannier, A.; Mayol, P.; Arcangeli, A.; Cañadas, A.; Laran, S.; Méglio, N.; Di Gauffier, P. Potential feeding habitat of fin whales in the western Mediterranean Sea: An environmental niche model. Mar. Ecol. Prog. Ser. 2012, 464, 289–306. [Google Scholar] [CrossRef] [Green Version]
  9. Cominelli, S.; Moulins, A.; Rosso, M.; Tepsich, P. Fin whale seasonal trends in the Pelagos Sanctuary, Mediterranean Sea. J. Wildl. Manag. 2016, 80, 490–499. [Google Scholar] [CrossRef] [Green Version]
  10. Di Sciara, G.N. La cetofauna del bacino corso-ligure-provenzale: Rassegna delle attuali conoscenze. Biol. Mar. Mediterr. 1994, 1, 95–98. [Google Scholar]
  11. Arcangeli, A.; Orasi, A.; Carcassi, S.P.; Crosti, R. Exploring thermal and trophic preference of Balaenoptera physalus in the central Tyrrhenian Sea: A new summer feeding ground? Mar. Biol. 2014, 161, 427–436. [Google Scholar] [CrossRef]
  12. Goffart, A.; Prieur, L.; Hecq, J.H. Contrôle du phytoplancton du bassin Ligure par le front liguro-provençal (secteur Corse). Biometrics 1995, 51, 888–898. [Google Scholar]
  13. Esposito, A.; Manzella, G. Current circulation in the ligurian sea. Elsevier Oceanogr. Ser. 1982, 34, 187–203. [Google Scholar]
  14. Astraldi, M.; Gasparini, G.P.; Sparnocchia, S. The seasonal and interannual variability in the Ligurian-Provençal Basi. J. Geophys. Res. 2011, 46, 93–113. [Google Scholar]
  15. Astraldi, M.; Bianchi, C.N.; Gasparini, G.P.; Morri, C. Climatic fluctuations, current variability and marine species distribution: A case study in the Ligurian Sea (north-west Mediterranean). Oceanol. Acta 1995, 18, 139–149. [Google Scholar]
  16. Jacques, G. L’oligotrophie du milieu pélagique de Méditerranée Occidentale: Un paradigme qui s’estompe? Bull. Soc. Zool. Fr. 1989, 114, 17–30. [Google Scholar]
  17. Arnau, P.; Liquete, C.; Canals, M. River mouth plume events and their dispersal in the northwestern Mediterranean Sea. Oceanography 2004, 17, 22–31. [Google Scholar] [CrossRef] [Green Version]
  18. Gonella, J.; Lamy, A.; Kartavtseff, A. Rapport II-5. Hydrodynamique côtière en régime d’été. J. L’hydraul. 1977, 14, 1–4. [Google Scholar]
  19. Aïssi, M.; Celona, A.; Comparetto, G.; Mangano, R.; Würtz, M.; Moulins, A. Large-scale seasonal distribution of fin whales (Balaenoptera physalus) in the central Mediterranean Sea. J. Mar. Biol. Assoc. UK 2008, 88, 1253–1261. [Google Scholar] [CrossRef]
  20. Castellote, M.; Clark, C.W.; Lammers, M.O. Population Identity and Migration Movements of Fin Whales (Balaenoptera physalus) in the Mediterranean Sea and Strait of Gibraltar; IWC Scientific Committee: Agadir, Morocco, 2010. [Google Scholar]
  21. Panigada, S.; Donovan, G.P.; Druon, J.N.; Lauriano, G.; Pierantonio, N.; Pirotta, E.; Zanardelli, M.; Zerbini, A.N.; Di Sciara, G.N. Satellite tagging of Mediterranean fin whales: Working towards the identification of critical habitats and the focussing of mitigation measures. Sci. Rep. 2017, 7, 1–12. [Google Scholar] [CrossRef] [Green Version]
  22. Canese, S.; Cardinali, A.; Fortuna, C.M.; Giusti, M.; Lauriano, G.; Salvati, E.; Greco, S. The first identified winter feeding ground of fin whales (Balaenoptera physalus) in the Mediterranean Sea. J. Mar. Biol. Assoc. UK 2006, 86, 903–907. [Google Scholar] [CrossRef]
  23. Sciacca, V.; Caruso, F.; Beranzoli, L.; Chierici, F.; De Domenico, E.; Embriaco, D.; Favali, P.; Giovanetti, G.; Larosa, G.; Marinaro, G.; et al. Annual acoustic presence of fin whale (Balaenoptera physalus) offshore Eastern Sicily, central Mediterranean Sea. PLoS ONE 2015, 10, e01411838. [Google Scholar] [CrossRef] [Green Version]
  24. Geijer, C.K.A.; di Sciara, G.N.; Panigada, S. Mysticete migration revisited: Are Mediterranean fin whales an anomaly? Mammal Rev. 2016, 46, 284–296. [Google Scholar] [CrossRef]
  25. Marini, L.; Consiglio, C.; Angradi, A.M.; Catalano, B.; Sanna, A.; Valentini, T.; Finoia, M.G.; Villetti, G. Distribution, abundance and seasonality of cetaceans sighted during scheduled ferry crossings in the central tyrrhenian sea: 1989–1992. Ital. J. Zool. 1996, 63, 381–388. [Google Scholar] [CrossRef]
  26. Laran, S.; Drouot-Dulau, V. Seasonal variation of striped dolphins, fin- and sperm whales’ abundance in the Ligurian Sea (Mediterranean Sea). J. Mar. Biol. Assoc. UK 2007, 87, 345–352. [Google Scholar] [CrossRef] [Green Version]
  27. Simone, P.; Lauriano, G.; Burt, L.; Pierantonio, N.; Donovan, G. Monitoring winter and summer abundance of cetaceans in the Pelagos Sanctuary (Northwestern Mediterranean sea) through aerial surveys. PLoS ONE 2011, 6, e22878. [Google Scholar]
  28. Martin, S.W.; Marques, T.A.; Thomas, L.; Morrissey, R.P.; Jarvis, S.; Dimarzio, N.; Moretti, D.; Mellinger, D.K. Estimating minke whale (Balaenoptera acutorostrata) boing sound density using passive acoustic sensors. Mar. Mammal Sci. 2013, 29, 142–158. [Google Scholar] [CrossRef] [Green Version]
  29. Watkins, W.A.; Daher, M.A.; Reppucci, G.M.; George, J.E.; Martin, D.L.; DiMarzio, N.A.; Gannon, D.P. Seasonahty and distribution of whale calls in the North Pacific. Oceanography 2000, 13, 62–67. [Google Scholar] [CrossRef]
  30. Castellote, M.; Clark, C.W.; Lammers, M.O. Fin whale (Balaenoptera physalus) population identity in the western Mediterranean Sea. Mar. Mammal Sci. 2012, 28, 325–344. [Google Scholar] [CrossRef] [Green Version]
  31. Širović, A.; Hildebrand, J.A.; Wiggins, S.M. Blue and fin whale call source levels and propagation range in the Southern Ocean. J. Acoust. Soc. Am. 2007, 122, 1208–1215. [Google Scholar] [CrossRef] [Green Version]
  32. Clark, C.W.; Fristrup, K.M. Whales ’95: A Combined Visual and Acoustic Survey of Blue and Fin Whales off Southern California. Rep. Int. Whal. Comm. 1997, 47, 583–600. [Google Scholar]
  33. Cerchio, S.; Jacobsen, J.K.; Norris, T.F. Temporal and geographical variation in songs of humpback whales, Megaptera novaeangliae: Synchronous change in Hawaiian and Mexican breeding assemblages. Anim. Behav. 2001, 62, 313–329. [Google Scholar] [CrossRef] [Green Version]
  34. Charif, R.A.; Mellinger, D.K.; Dunsmore, K.J.; Fristrup, K.M.; Clark, C.W. Estimated source levels of fin whale (Balaenoptera physalus) vocalizations: Adjustments for surface interference. Mar. Mammal Sci. 2002, 18, 81–98. [Google Scholar] [CrossRef]
  35. Clark, C.W.; Gagnon, G.J. Low-frequency vocal behaviors of baleen whales in the north atlantic: Insights from integrated undersea surveillance system detections, locations, and tracking from 1992 to 1996. J. Underw. Acoust. 2002, 52, 48. [Google Scholar]
  36. Gedamke, J.; Robinson, S.M. Acoustic survey for marine mammal occurrence and distribution off East Antarctica (30–80° E) in January–February 2006. Deep Res. Part II Top. Stud. Oceanogr. 2010, 57, 968–981. [Google Scholar] [CrossRef]
  37. Thompson, P.O.; Findley, L.T.; Vidal, O. 20-Hz pulses and other vocalizations of fin whales, Balaenoptera physalus, in the Gulf of California, Mexico. J. Acoust. Soc. Am. 1992, 92, 3051–3057. [Google Scholar] [CrossRef]
  38. Pereira, A.; Harris, D.; Tyack, P.; Matias, L. Fin whale acoustic presence and song characteristics in seas to the southwest of Portugal. J. Acoust. Soc. Am. 2020, 147, 2235–2249. [Google Scholar] [CrossRef] [PubMed]
  39. Richardson, W.J.; Greene, C.R.; Malme, C.I.; Thomson, D.H.; Moore, S.E.; Wiirsig, B. Marine Mammals and Noise, 1st ed.; Academic Press: Cambridge, MA, USA, 1998. [Google Scholar]
  40. Charif, R.A.; Clark, C.W. Acoustic monitoring of large whales in deep waters north and west of the British Isles: 1996–2005. Cornell Lab Ornithol. 2009, 08, 40. [Google Scholar]
  41. Watkins, W.A.; Tyack, P.; Moore, K.E.; &Bird, J.E. The 20-Hz signals of finback whales (Balaenoptera physalus). J. Acoust. Soc. Am. 1987, 82, 1901–1912. [Google Scholar] [CrossRef] [PubMed]
  42. Watkins, W.A. Activities and underwater sounds of fin whales (Balaenoptera physalus). Sci. Rep. Whales Res. Inst. 1981, 33, 83–117. [Google Scholar]
  43. McDonald, M.A.; Fox, C.G. Passive acoustic methods applied to fin whale population density estimation. J. Acoust. Soc. Am. 1999, 105, 2643–2651. [Google Scholar] [CrossRef]
  44. Tyack, P.L.; Clark, C.W. Communication and acoustic behavior of dolphins and whales. In Hearing by Whales and Dolphins; Au, W.W.L., Popper, A.N., Fay, R.R., Eds.; Springer: New York, NY, USA, 2000; pp. 156–224. [Google Scholar]
  45. Oleson, E.M.; Širović, A.; Bayless, A.R.; Hildebr, J.A. Synchronous seasonal change in fin whale song in the North Pacific. PLoS ONE 2014, 9, e115678. [Google Scholar] [CrossRef] [Green Version]
  46. Hatch, L.T.; Clark, C.W. Acoustic Differentiation between Fin Whales in Both the North Atlantic and North Pacific Oceans, and Integration with Genetic Estimates of Divergence; IWC Scientific Committee: Agadir, Morocco, 2004; 37p. [Google Scholar]
  47. Delarue, J.; Todd, S.K.; Van Parijs, S.M.; Di Iorio, L. Geographic variation in Northwest Atlantic fin whale (Balaenoptera physalus) song: Implications for stock structure assessment. J. Acoust. Soc. Am. 2009, 125, 1774–1782. [Google Scholar] [CrossRef] [PubMed]
  48. Širović, A.; Oleson, E.M.; Buccowich, J.; Rice, A.; Bayless, A.R. Fin whale song variability in southern California and the Gulf of California. Sci. Rep. 2017, 7, 1–11. [Google Scholar]
  49. Simon, M.; Stafford, K.M.; Beedholm, K.; Lee, C.M.; Madsen, P.T. Singing behavior of fin whales in the Davis Strait with implications for mating, migration and foraging. J. Acoust. Soc. Am. 2010, 128, 3200–3210. [Google Scholar] [CrossRef] [PubMed] [Green Version]
  50. Van Opzeeland, I.; Van Parijs, S.; Kindermann, L.; Burkhardt, E.; Boebel, O. Calling in the cold: Pervasive acoustic presence of humpback whales (Megaptera novaeangliae) in antarctic coastal waters. PLoS ONE 2013, 8, e73007. [Google Scholar]
  51. Clark, C.W.; Borsani, J.F.; Di Sciara, G.N. Vocal activity of fin whales, Balaenoptera physalus, in the Ligurian Sea. Mar. Mammal Sci. 2002, 18, 286–295. [Google Scholar] [CrossRef]
  52. Borsani, J.F.; Clark, C.W.; Nani, B.; Scarpiniti, M. Fin whales avoid loud rhythmic low- frequency sounds in the ligurian sea. Bioacoustics 2008, 17, 161–163. [Google Scholar] [CrossRef]
  53. Lammers, M.O.; Brainard, R.E.; Au, W.W.L.; Mooney, T.A.; Wong, K.B. An ecological acoustic recorder (EAR) for long-term monitoring of biological and anthropogenic sounds on coral reefs and other marine habitats. J. Acoust. Soc. Am. 2008, 123, 1720–1728. [Google Scholar] [CrossRef] [Green Version]
  54. Giorli, G.; Au, W.W.L.; Ou, H.; Jarvis, S.; Morrissey, R.; Moretti, D. Acoustic detection of biosonar activity of deep diving odontocetes at Josephine Seamount High Seas Marine Protected Area. J. Acoust. Soc. Am. 2015, 137, 2495–2501. [Google Scholar] [CrossRef]
  55. Giorli, G.; Au, W.W.L.; Neuheimer, A. Differences in foraging activity of deep sea diving odontocetes in the Ligurian Sea as determined by passive acoustic recorders. Deep Res. Part I Oceanogr. Res. Pap. 2016, 107, 1–8. [Google Scholar] [CrossRef] [Green Version]
  56. Sciacca, V.; Viola, S.; Pulvirenti, S.; Riccobene, G.; Caruso, F.; De Domenico, E.; Pavan, G. Shipping noise and seismic airgun surveys in the Ionian Sea: Potential impact on Mediterranean fin whale. Proc. Meet. Acoust. 2016, 27, 1. [Google Scholar]
  57. EMODnet Bathymetry Consortium: EMODnet Digital Bathymetry (DTM 2018). Eur. Mar. Obs. Data Netw. 2018. [CrossRef]
  58. QGIS.org. QGIS Geographic Information System. Open SourceGeospatial Foundation Project. 2020. Available online: http://qgis.org (accessed on 24 August 2021).
  59. Simone, P.; Zanardelli, M.; Canese, S.; Jahoda, M. How deep can baleen whales dive? Mar. Ecol. Prog. Ser. 1999, 187, 309–311. [Google Scholar]
  60. Goffart, A.; Hecq, J.H.; Legendre, L. Drivers of the winter-spring phytoplankton bloom in a pristine NW Mediterranean site, the Bay of Calvi (Corsica): A long-term study (1979–2011). Prog. Oceanogr. 2015, 137, 121–139. [Google Scholar] [CrossRef]
  61. Goffart, A.; Hecq, J.H.; Legendre, L. Changes in the development of the winter-spring phytoplankton bloom in the Bay of Calvi (NW Mediterranean) over the last two decades: A response to changing climate? Mar. Ecol. Prog. Ser. 2002, 236, 45–60. [Google Scholar] [CrossRef] [Green Version]
  62. Macias, D.; Garcia-Gorriz, E.; Stips, A. Deep winter convection and phytoplankton dynamics in the NW Mediterranean Sea under present climate and future (horizon 2030) scenarios. Sci. Rep. 2018, 8, 6626. [Google Scholar] [CrossRef] [PubMed]
  63. Tepsich, P.; Schettino, I.; Atzori, F.; Azzolin, M.; Campana, I.; Carosso, L.; Cominelli, S.; Crosti, R.; David, L.; Di-Méglio, N.; et al. Trends in summer presence of fin whales in the western mediterranean sea Region: New insights from a long-term monitoring program. PeerJ 2020, 8, e10544. [Google Scholar] [CrossRef]
  64. Croll, D.A.; Clark, C.W.; Acevedo, A.; Tershy, B.; Flores, S.; Gedamke, J.; Urban, J. Only male fin whales sing loud songs. Nature 2002, 417, 809. [Google Scholar] [CrossRef] [PubMed]
  65. Weirathmueller, M.J.; Stafford, M.; Wilcock, W.S.D.; Hilmo, R.S.; Dziak, R.P.; Tréhu, A.M. Spatial and temporal trends in fin whale vocalizations recorded in the NE Pacific Ocean between 2003–2013. PLoS ONE 2017, 12, e0186127. [Google Scholar] [CrossRef] [Green Version]
  66. Onsrud, M.S.R.; Kaartvedt, S. Diel vertical migration of the krill MEganyctiphanes norvegica in relation to physical environment, food and predators. Mar. Ecol. Prog. Ser. 1998, 171, 209–219. [Google Scholar] [CrossRef] [Green Version]
  67. Kaartvedt, S. Diel Vertical Migration Behaviour of the Northern Krill (Meganyctiphanes norvegica Sars). Adv. Mar. Biol. 2010, 57, 255–275. [Google Scholar] [PubMed]
  68. Endo, Y.; Yamano, F. Diel vertical migration of Euphausia pacifica (crustacea, euphausiacea) in relation to molt and reproductive processes, and feeding activity. J. Oceanogr. 2006, 62, 693–703. [Google Scholar] [CrossRef]
  69. Keen, E.M.; Falcone, E.A.; Andrews, R.D.; Schorr, G.S. Diel dive behavior of fin whales (Balaenoptera physalus) in the Southern California Bight. Aquat. Mammal 2019, 45, 233–243. [Google Scholar] [CrossRef]
  70. Wiggins, S.M.; Hildebrand, J.A. Fin whale 40-Hz calling behavior studied with an acoustic tracking array. Mar. Mammal Sci. 2020, 36, 964–971. [Google Scholar] [CrossRef]
  71. Azzellino, A.; Gaspari, S.; Airoldi, S.; Nani, B. Habitat use and preferences of cetaceans along the continental slope and the adjacent pelagic waters in the western Ligurian Sea. Deep Res. Part I Oceanogr. Res. Pap. 2008, 55, 296–323. [Google Scholar] [CrossRef]
  72. Cotté, C.; Guinet, C.; Taupier-Letage, I.; Mate, B.; Petiau, E. Scale-dependent habitat use by a large free-ranging predator, the Mediterranean fin whale. Deep Res. Part I Oceanogr. Res. Pap. 2009, 56, 801–811. [Google Scholar] [CrossRef]
Figure 1. Spectrogram created in MATLAB showing two fin whale vocalizations recorded by EAR3 on 22 October, 2011. The spectrogram was produced at 2048 points FFT (fast Fourier transform), 4096-point Hann window, and 1000 overlap points.
Jmse 09 00966 g001
Figure 2. (a) The study sites in the western Mediterranean and (b) and the locations of the five EAR buoys in the Ligurian Sea (inset).
Jmse 09 00966 g002
Figure 3. ROC (receiver operating characteristic) curve. True positive rate vs. false positive rate on 100 files containing calls and 100 files with no calls randomly chosen in the total dataset. The diagonal red line shows the performance of a random classifier: Points above the diagonal represent good classification results. The red circle highlights the threshold values that guaranteed the best performance of the detector.
Jmse 09 00966 g003
Figure 4. Mean hourly detection rate values (blue bars) at the five EARs during the recording periods. Gray boxes represent the periods with no recordings or when the hard drive (EAR2 and 5) or CF2 persistor (EAR 4) failed.
Jmse 09 00966 g004
Figure 5. Boxplot of the monthly detection rate. The upper and lower sides of the box represent the first and third quartiles of the sample distribution and shows the width of the middle half of the distribution. The line inside the box instead represents the median. The whisker, the segment that starts from the box and extends upward, indicates the dispersion of values below the first quartile and above the third quartile that are not classified as outliers. Outliers are identified as small circles for “out” values and as stars for “extreme” values. Black bars represent significant differences between pairs of months.
Jmse 09 00966 g005
Figure 6. Boxplot of the detection rate at daytime and nighttime. The upper and lower sides of the box represent the first and third quartiles of the sample distribution and shows the width of the middle half of the distribution. The line inside the box instead represents the median. The whisker, the segment that starts from the box and extends upward, indicates the dispersion of values below the first quartile and above the third quartile that are not classified as outliers. Outliers are identified as small circles for “out” values and as stars for “extreme” values. Black bars represent the statistical difference between daytime (generally from 07:00 to 20:00) and nighttime (generally from 20:00 to 07:00).
Jmse 09 00966 g006
Figure 7. Boxplot of the hourly detection rate in the different EARs. The upper and lower sides of the box represent the first and third quartiles of the sample distribution and shows the width of the middle half of the distribution. The line inside the box instead represents the median. The whisker, the segment that starts from the box and extends upward, indicates the dispersion of values below the first quartile and above the third quartile that are not classified as outliers. Outliers are identified as small circles for “out” values and as stars for “extreme” values. Black bars represent significant differences between pairs of EARs.
Jmse 09 00966 g007
Table 1. EAR settings and recording periods of the SIRENA11.
Sample Rate (Hz)Duty Cycle (s)Depth (m)Latitude (Decimal Deg)Longitude (Decimal Deg)Recording Periods
EAR180,00012090044.08588.460107/22 to 12/8 2011
EAR280,00012087044.15138.579507/22 to 11/3 2011
EAR380,00024070044.19648.615707/22 to 12/9 2011
EAR480,00024089044.1788.685707/22 to 09/22 2011
EAR580,00024088044.06398.924407/22 to 11/13 2011
Table 2. Number of files with detection (NFD), geographic coordinates (latitude and longitude), and geomorphological variables (distance from the coast, depth, and slope) computed for every EAR inside buffer rings of 5000 m.
NFDLatitude (Decimal Deg)Longitude (Decimal Deg)Coast Distance (m)EAR Depth (m)Seabed Depth (m)Slope Mean (Deg)Slope StDv (Deg)
EAR1142844.08588.460111,34090010585.684.47
EAR241644.15138.579513,32087010955.463.83
EAR3176944.19648.615714,4007008155.303.79
EAR435544.1788.658718,36089010994.282.96
EAR572744.06398.924433,3908809856.494.65
Table 3. Summary of the data collection: number of files and hours of recording in the five EARs.
EAR1EAR2EAR3EAR4EAR5TOT
Number of Files59,58823,87761,01422,25542,995209,729
Number of Files with Detections142841617693557274695
Hourly Detection Rate
(Detections/Hours)
0.06730.05190.05910.12330.03880.341
Number of Recording Hours 2817127731161483253411,227
Table 4. Statistically significant results of the Kruskall-Wallis and Tamhane tests carried out to analyze the monthly detection rate for each EAR. For the Tamhane test, the table shows only the statistically significant pairs.
Kruskall–WallisTamhane Test
InstrumentNX2p ValueComparisonp Value
EAR1281743.191<0.001July–November 0.017
July–December0.009
August–November0.018
August–December0.013
September–November0.045
September–December0.020
EAR212779.0480.060//
EAR33116117.797<0.001July/August/September–October/November/December<0.001
EAR4148312.2650.007August–September 0.032
EAR5253441.505<0.001July/August/Speptember–October0.001
July–November0.030
August–November 0.038
September–November 0.035
Publisher’s Note: MDPI stays neutral with regard to jurisdictional claims in published maps and institutional affiliations.

