1. Introduction
The phenomenon of modulation of short-period waves on long waves is currently widely used in the field of non-contact methods for sea surface monitoring. These processes are mainly investigated during space monitoring by means of analyzing optical [
1,
2] and radar images [
3,
4] received from the satellites to restore the structure of the rough sea surface. A two-scale model of the sea surface was used in analysis of radar images. The effect of short waves was taken into account in the framework of the Bragg scattering mechanism, and the effect of the large-scale component is taken into account by changing the slope of the surface. As a result, the small-scale wave component turned out to be responsible for the backscattering of radar signals, and the large-scale component was responsible for spatial modulation of the scattered signals [
5,
6].
Of particular interest during remote probing of seas and oceans in these types of research is the study of internal waves (IW) [
7], current fields [
8,
9], and anthropogenic impacts on the aquatic environment [
10]. Internal waves propagating in the ocean appear on the sea surface due to horizontal components of orbital velocities near the surface, which lead to variations in the characteristics of short wind waves. Thus, on the sea surface, IWs appear in the form of stripes and spots with increased (tidal rip) and decreased (slick) intensity of short gravity waves [
11,
12,
13]. Modulation effects can occur in a wide range of wind waves. The modulation of wind waves can be described and explained within the kinematic mechanism framework [
14], but there are also other theories [
15,
16]. For example, the authors of [
17] propose a model where an increment modulation effect caused by the variation of the wind speed field over the water surface on which there is a field of currents generated by internal waves (IW) acts as the mechanism of this model. The modulation effect of wind increments is being actively discussed nowadays [
18].
There are many works and studies devoted to modulation of infragravity (IG) waves. For example, [
19] presents the results of studying short IG length changes, while longer waves move on the surface. In [
20], the changes in wavelengths and amplitudes of a short-period wave process are carefully calculated with regard to the nonlinear interactions between two wave processes. The change in the energy of short waves, in this case, corresponds to the effect of longer waves against the radiation stress of short waves, which was previously neglected. The radiation wave stress should be understood as an overflow of the impulse caused by wind waves, or, more exactly, by their nonlinearity. In [
21], on the basis of field data and numerical models of sea surface gravity waves, it is shown that in the coastal zone during nonlinear wave-wave interaction, energy is transferred from low-frequency long waves back to higher-frequency motions. This explains the tidal modulation of the energy of IG waves, observed in the records of near-bottom pressure on the southern shelf of Sakhalin Island. Similar results were obtained in [
22], where the strong tidal modulation of infragravity (200 to 20 s period) waves observed on the southern California shelf is shown to be the result of nonlinear transfers of energy from these low-frequency long waves to higher-frequency motions.
What is interesting is question of the evolution of the wind wave spectrum, which has many mechanisms. For example, [
23,
24] describes the mechanism of change in the wave spectrum, while waves are going out to a shallow; in this case, due to nonlinear interactions with the bottom, the frequency of the wave process decreases. In [
25], numerical and experimental studies of the process of nonlinear energy transfer between two main spectral maxima conditioned by the mechanism of dispersive focusing indicate that nonlinear energy transfer plays a greater role than linear superposition. There is also a large number of works devoted to the evolution of the wave spectrum associated with the modulation effect caused by the interaction of wind waves and swell waves [
26,
27]. In this paper, we will try to show how the effects of the modulation of wind waves at long waves, such as tides and seiches, can affect changes in the wave spectrum.
We should also note the participation of modulation effects in the emergence of rogue waves. For example, in [
28], it is stated that rogue waves (extreme waves) naturally originate as a result of evolution of spectrally narrow packets of gravity waves. We can say that rogue waves are a nonlinear stage of modulation instability. In [
29], the Euler equation was solved for liquid with a free surface in deep water. Periodic and boundary conditions were created in the form of a Stokes wave, which was slightly modulated by a low frequency (10
−5). At the same time, such a wave is unstable and modulation should increase with time, thereby generating an extremely high wave.
This paper presents a method for studying the effects of modulation of wind and swell waves on tidal and seiche oscillations. This method was developed and tested on hydrophysical data obtained from high-precision, modern instruments based on laser interference methods [
30]. The paper also presents the results of using this method for processing and analyzing experimental data, the results of which several main types of modulation of wind waves on seiche oscillations were identified and described. The possibility of introducing this method for processing hydrophysical data received in real time mode is being considered.
All of the experimental data presented in this work were obtained using laser meters of hydrosphere pressure variations [
31]. These devices were installed on the bottom for a period from several days to several months, transmitting data in real time to laboratory rooms located at Shultz Cape, the Sea of Japan, in the Primorsky Territory of the Russian Federation. There are also mobile versions of these devices, with which we conduct measurements of tidal and seiche oscillations in various harbors of the Posiet Bay and the Peter the Great Gulf of the Sea of Japan. Although most of the data presented were obtained in Vityaz Bay, the Sea of Japan, we also analyzed and compared the results obtained in other bays. Thus, the presented results will be valid for other closed water areas of the World Ocean.
2. Wave Modulation Research Method
As we know, the main change in the period of swell waves during propagation from the point of generation occurs due to dispersion during propagation; this change in the period is linear and has a decreasing character. However, if we consider large time-scale phenomena, such as typhoons, which originate hundreds of kilometers from the place of registration, the process of swell wave propagation can take several days. Additionally, in addition to dispersion, waves can be influenced by both large-scale phenomena, such as tides, and local phenomena, such as seiche oscillations that occur in closed sea areas and, as a result of these phenomena, the process of changing the period becomes nonlinear. At the same time, in order to study the emerging nonlinear processes, it is first necessary to separate the process of changing the period associated with dispersion from other processes that affect the variations in the period of wind waves and swell waves.
Earlier, from the fragments of the record, which contained swell waves created by passing typhoons, we derived the general function of period change [
32,
33]. With high accuracy, this function describes the dispersion of waves as they propagate from the source to the receiving point; the general view of the function is presented below.
where
,
is the total change in the period in the investigated section,
is the total duration of the section, and
is the initial period of wave for
.
Thus, as applied to the above problem, we only need to identify the nonlinear part of the period change process. To do this, we will use regression analysis.
Based on the selected values of the spectral maxima, the surface wave signal, the coefficients of the polynomial regression are calculated followed by its construction. The coefficients are calculated from the system of equations presented below.
where
T—values of spectral maxima at time
t,
—regression coefficients.
This system can be represented in matrix form as
AB = C, where
We can write the general regression equation as follows:
To estimate the polynomial regression and the general function of the period change, we will use two criteria for evaluating the regression analysis: the coefficient of determination R2 (equal to 1 in the ideal case) and the standard deviation S (equal to 0 in the ideal case). However, as practice and the theory of regression analysis show, to describe processes with the n number of extrema, it is sufficient to use a polynomial of degree n + 1. Thus, to describe the effects of modulation of wind waves on tidal oscillations, which can have 4–5 extrema in a few days, polynomials of 5–6 degrees will be sufficient for the description. As the practice of the conducted research shows, this approach to the choice of the degree of polynomial regression is also the best for parameters of the coefficient of determination and standard deviation. Thus, the use of polynomial degrees greater than n + 1 is not practical.
Subtracting the period change function from the obtained expression, we eliminate the constant component of the graph, which is the dispersion that occurs during propagation of wind and swell waves. Thus, we obtain the absolute values of nonlinearities arising during propagation. The general expression for the function describing the absolute values of nonlinearities can be written as:
3. Modulation of Swell Waves on Tides
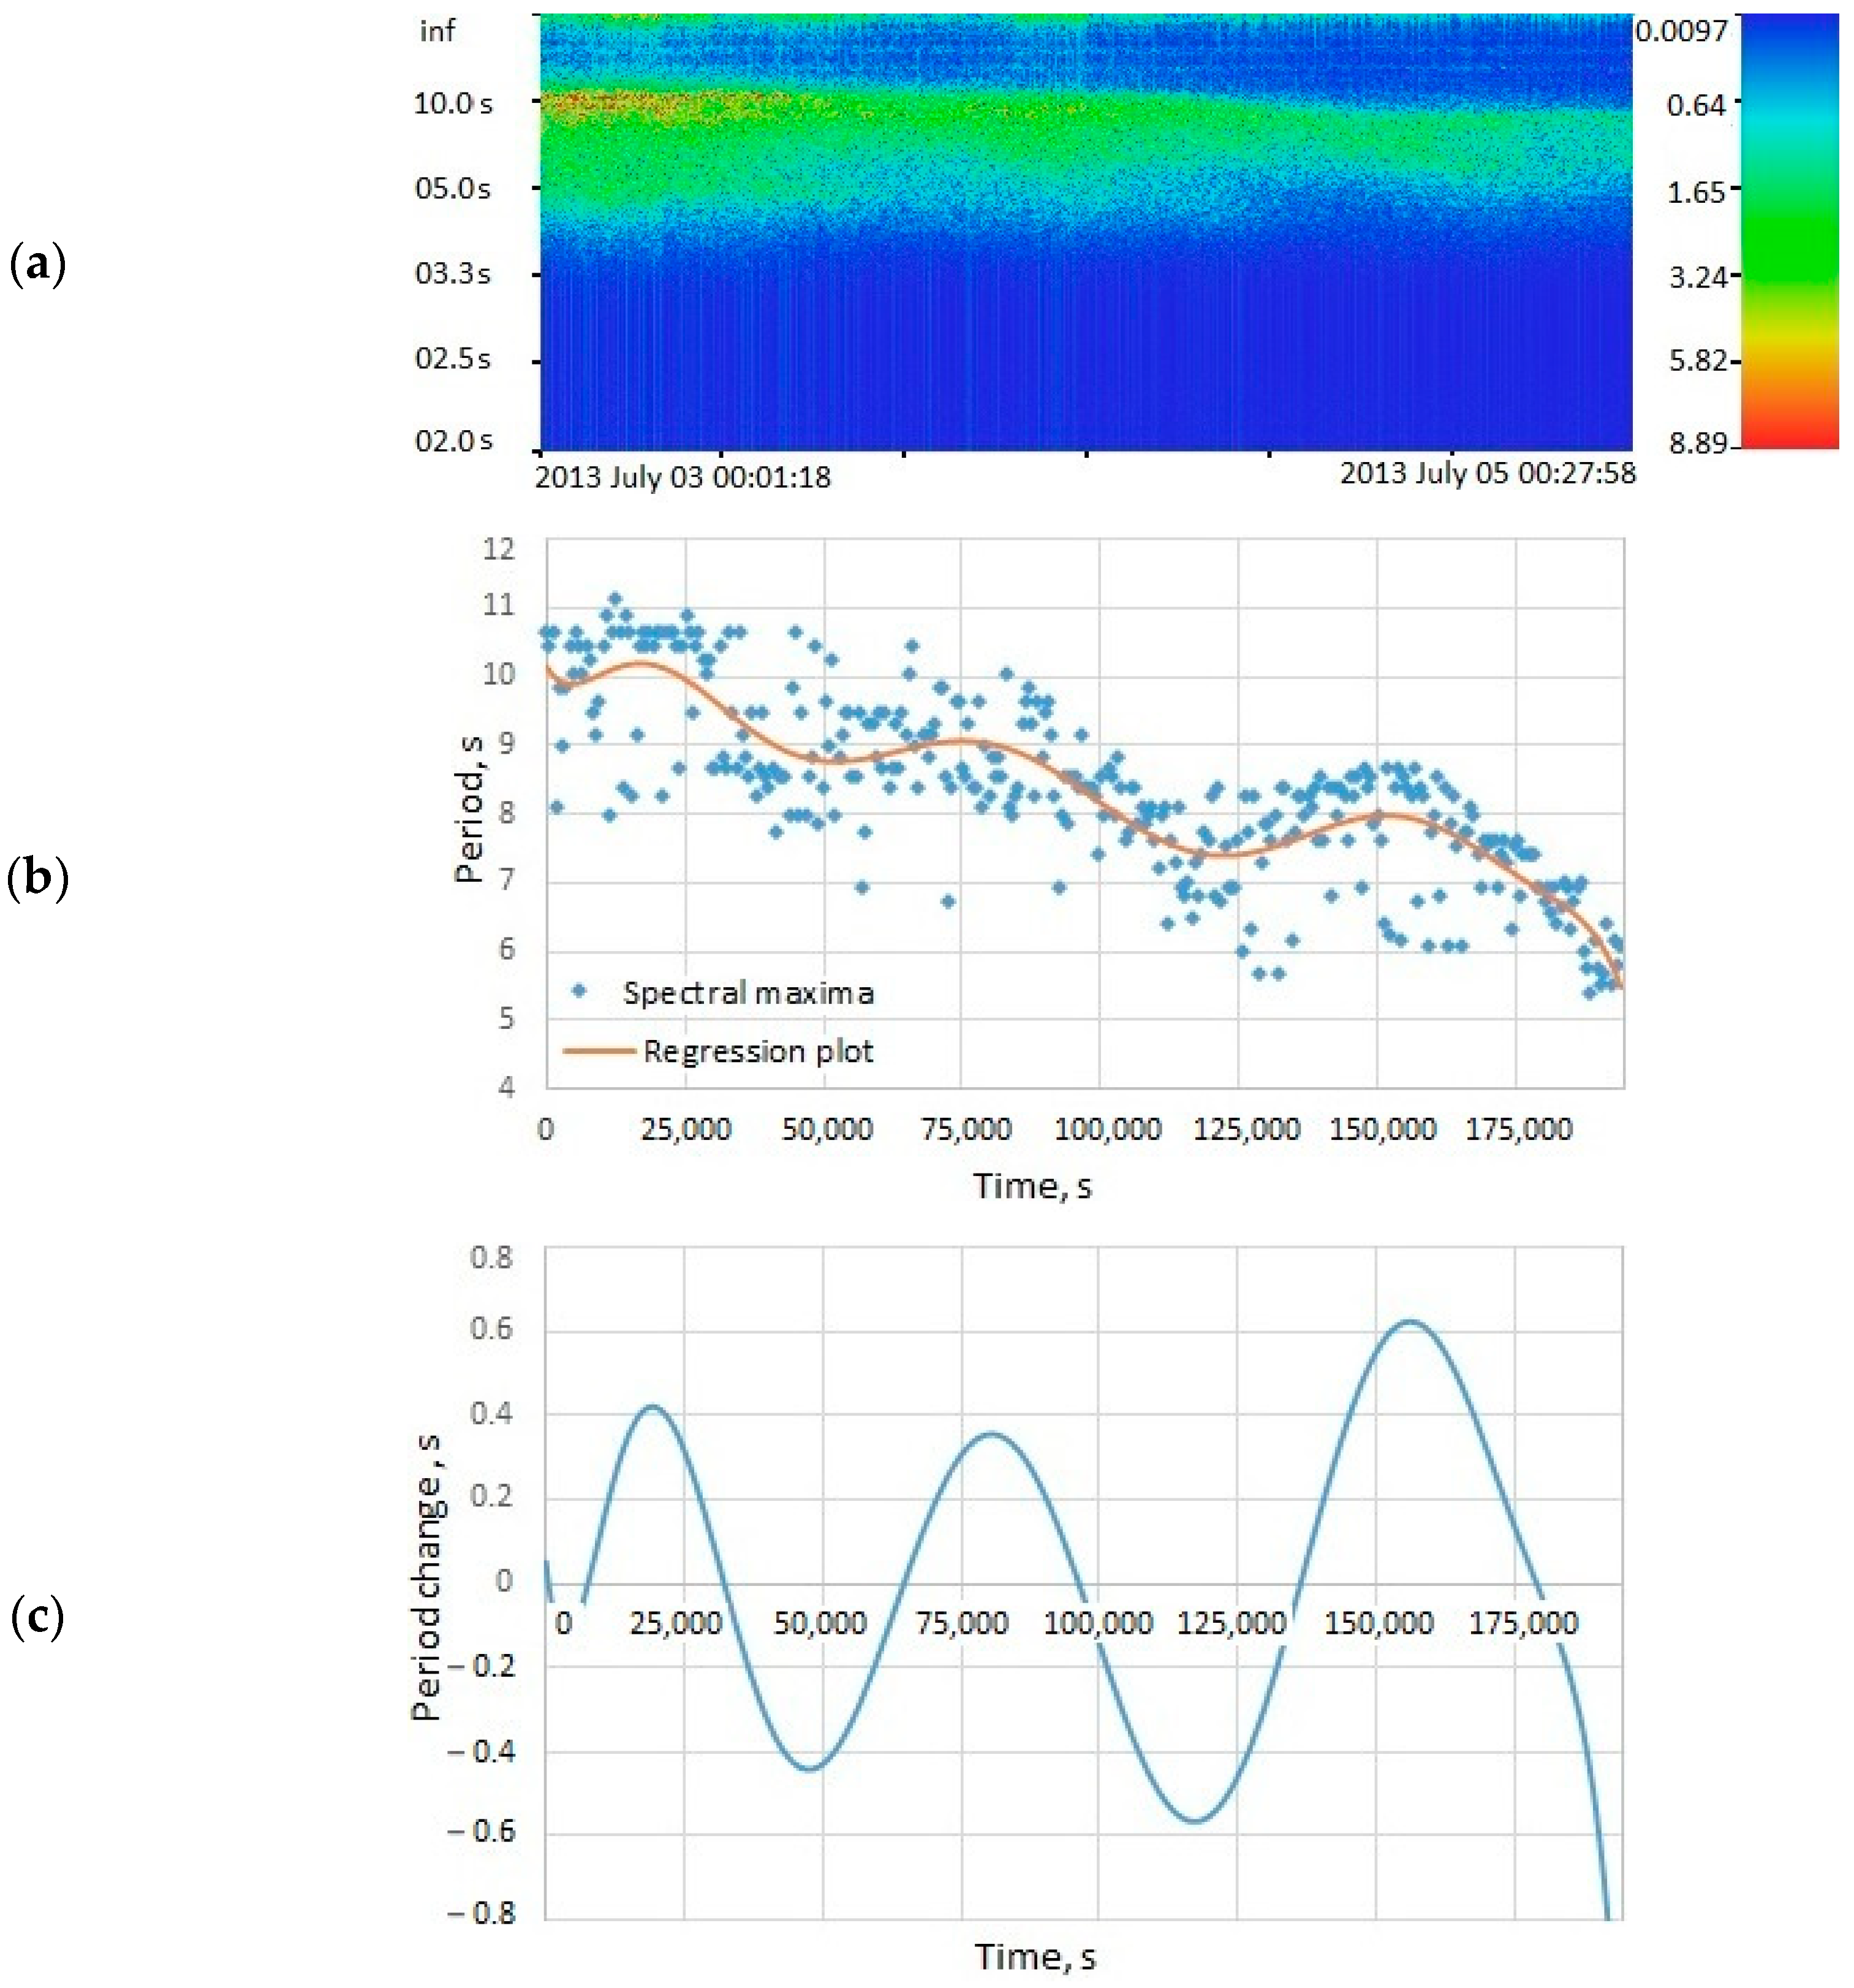
Figure 1 shows an example of processing experimental data using this processing method, highlighting the nonlinearity of the period change.
As we can see from
Figure 1c, the graph contains three pronounced maxima: the time interval between them is 12 h, which may indicate the modulation of swell waves by tidal fluctuations, which is also proved by other analyzed fragments. Thus, we can conclude that the nonlinearity of the period change is associated with the effect of the modulation of swell waves by low-frequency wave processes, in this case, tidal oscillations. Let us consider one more case of the modulation of wind waves by tidal oscillations of 24 h, shown in
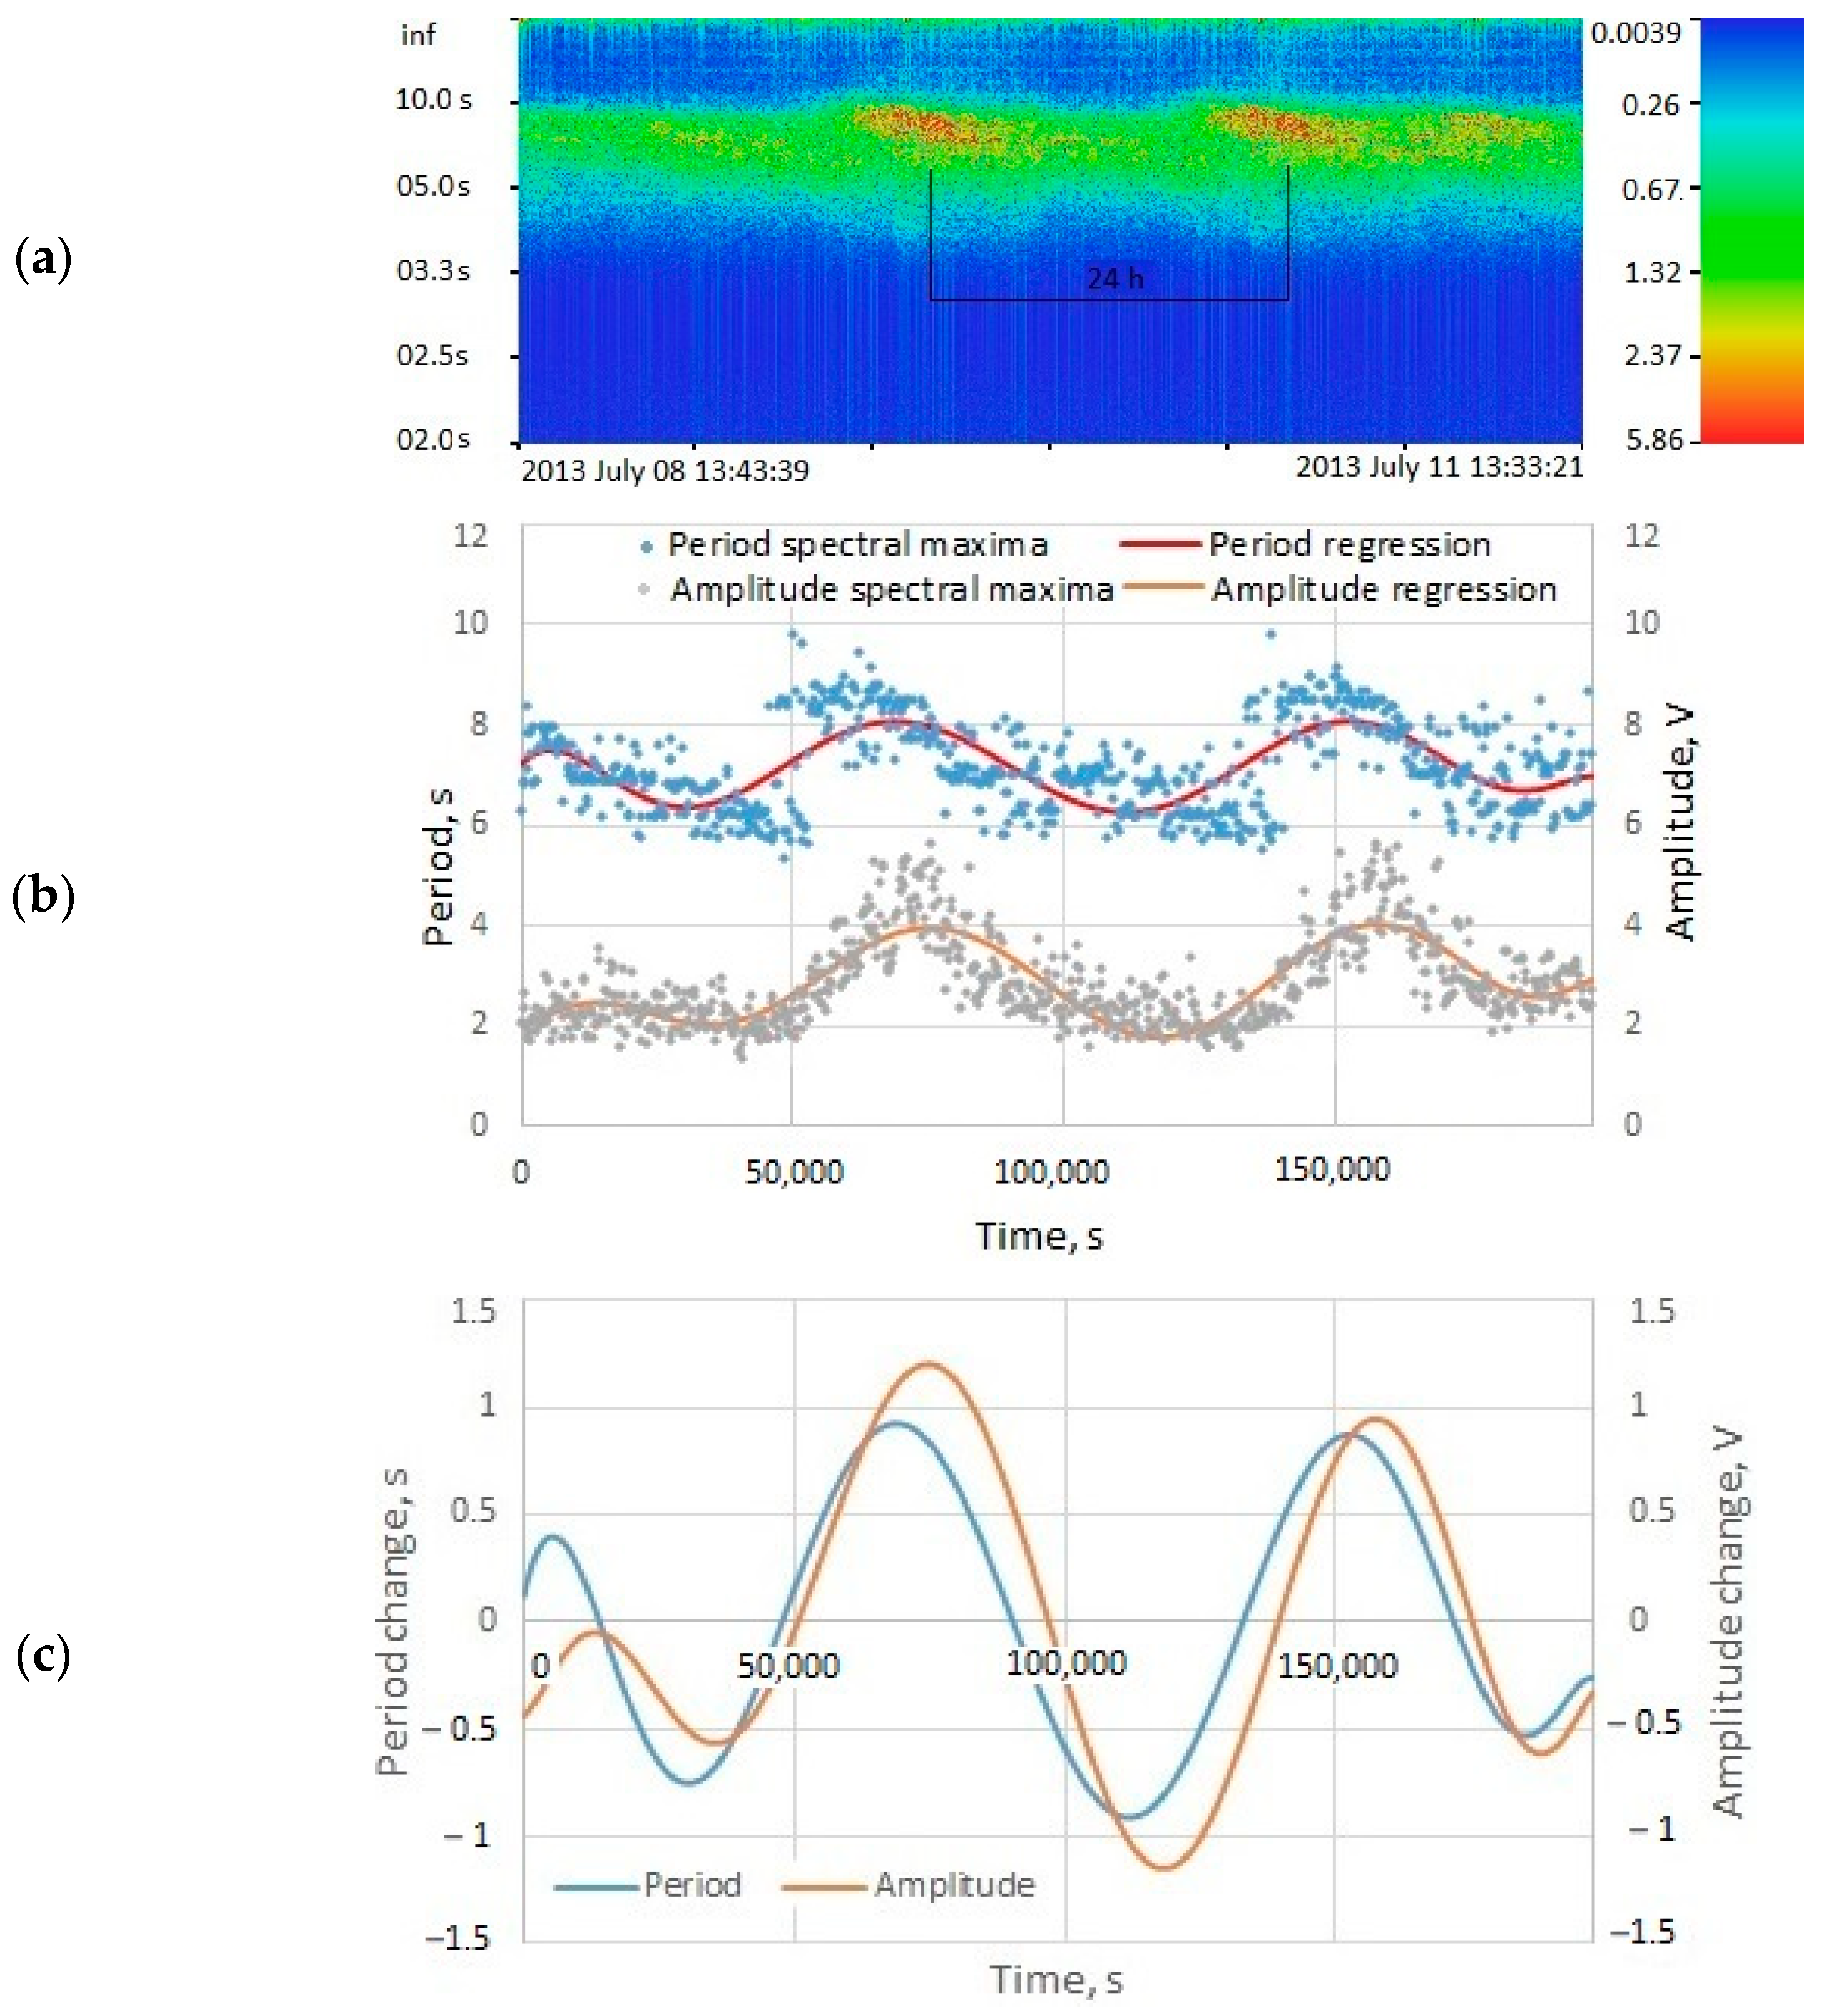
Figure 2.
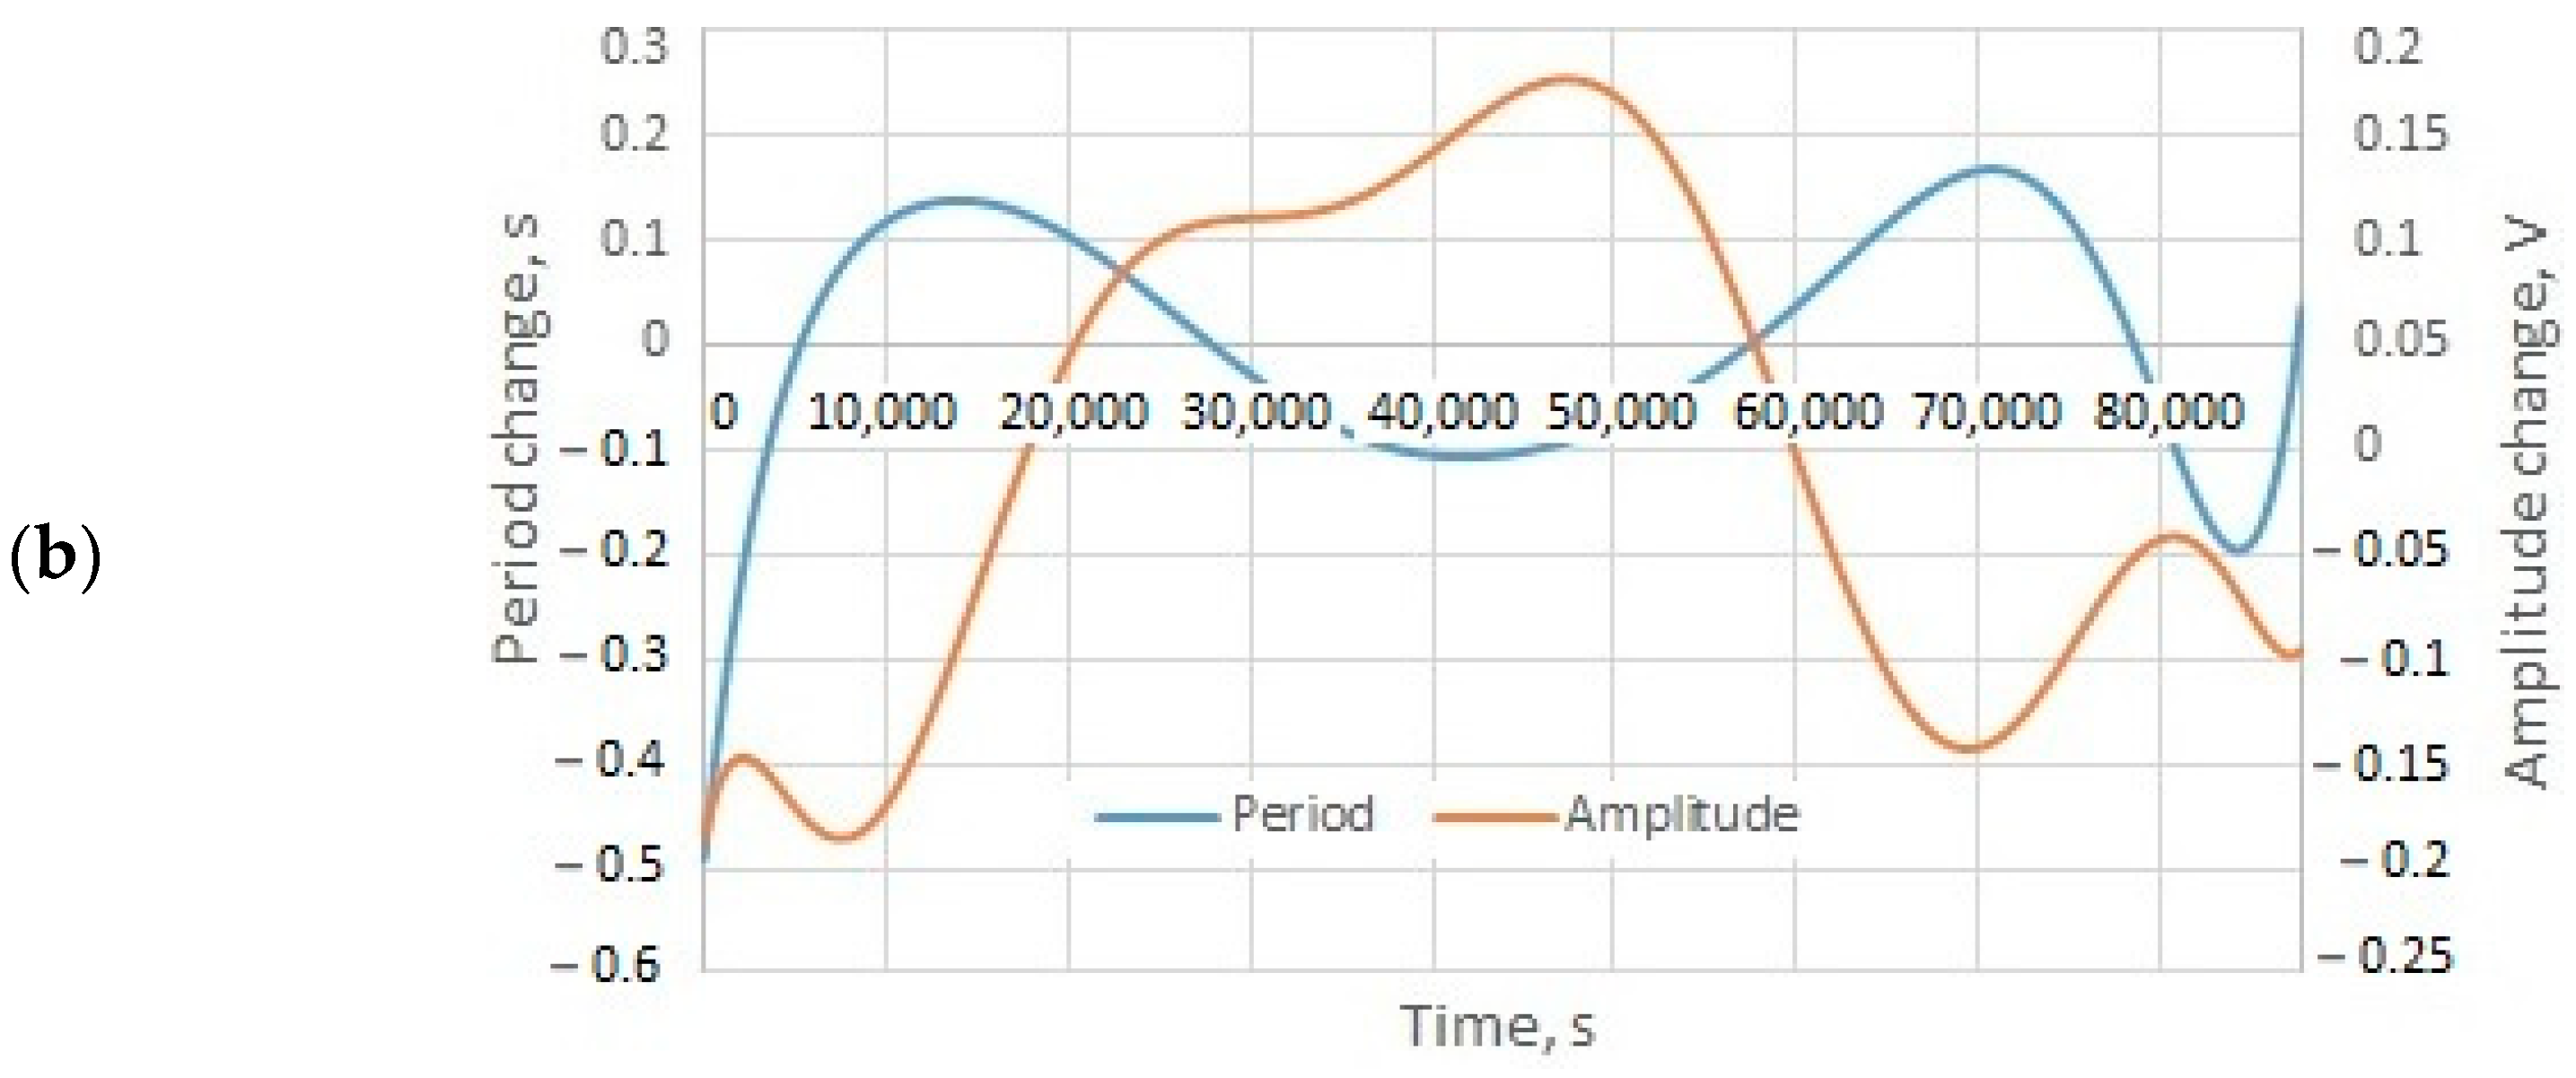
In
Figure 2c, there is an explicit modulation of both the wind wave period and the amplitude. As a result of modulation at the points of maximum tide values, waves with a large period and amplitude are concentrated, which corresponds to the general idea of this process. However, not everything is as clear at first glance as it seems. When processing the data, we found a number of fragments that do not correspond to generally accepted concepts. One of these fragments is shown in
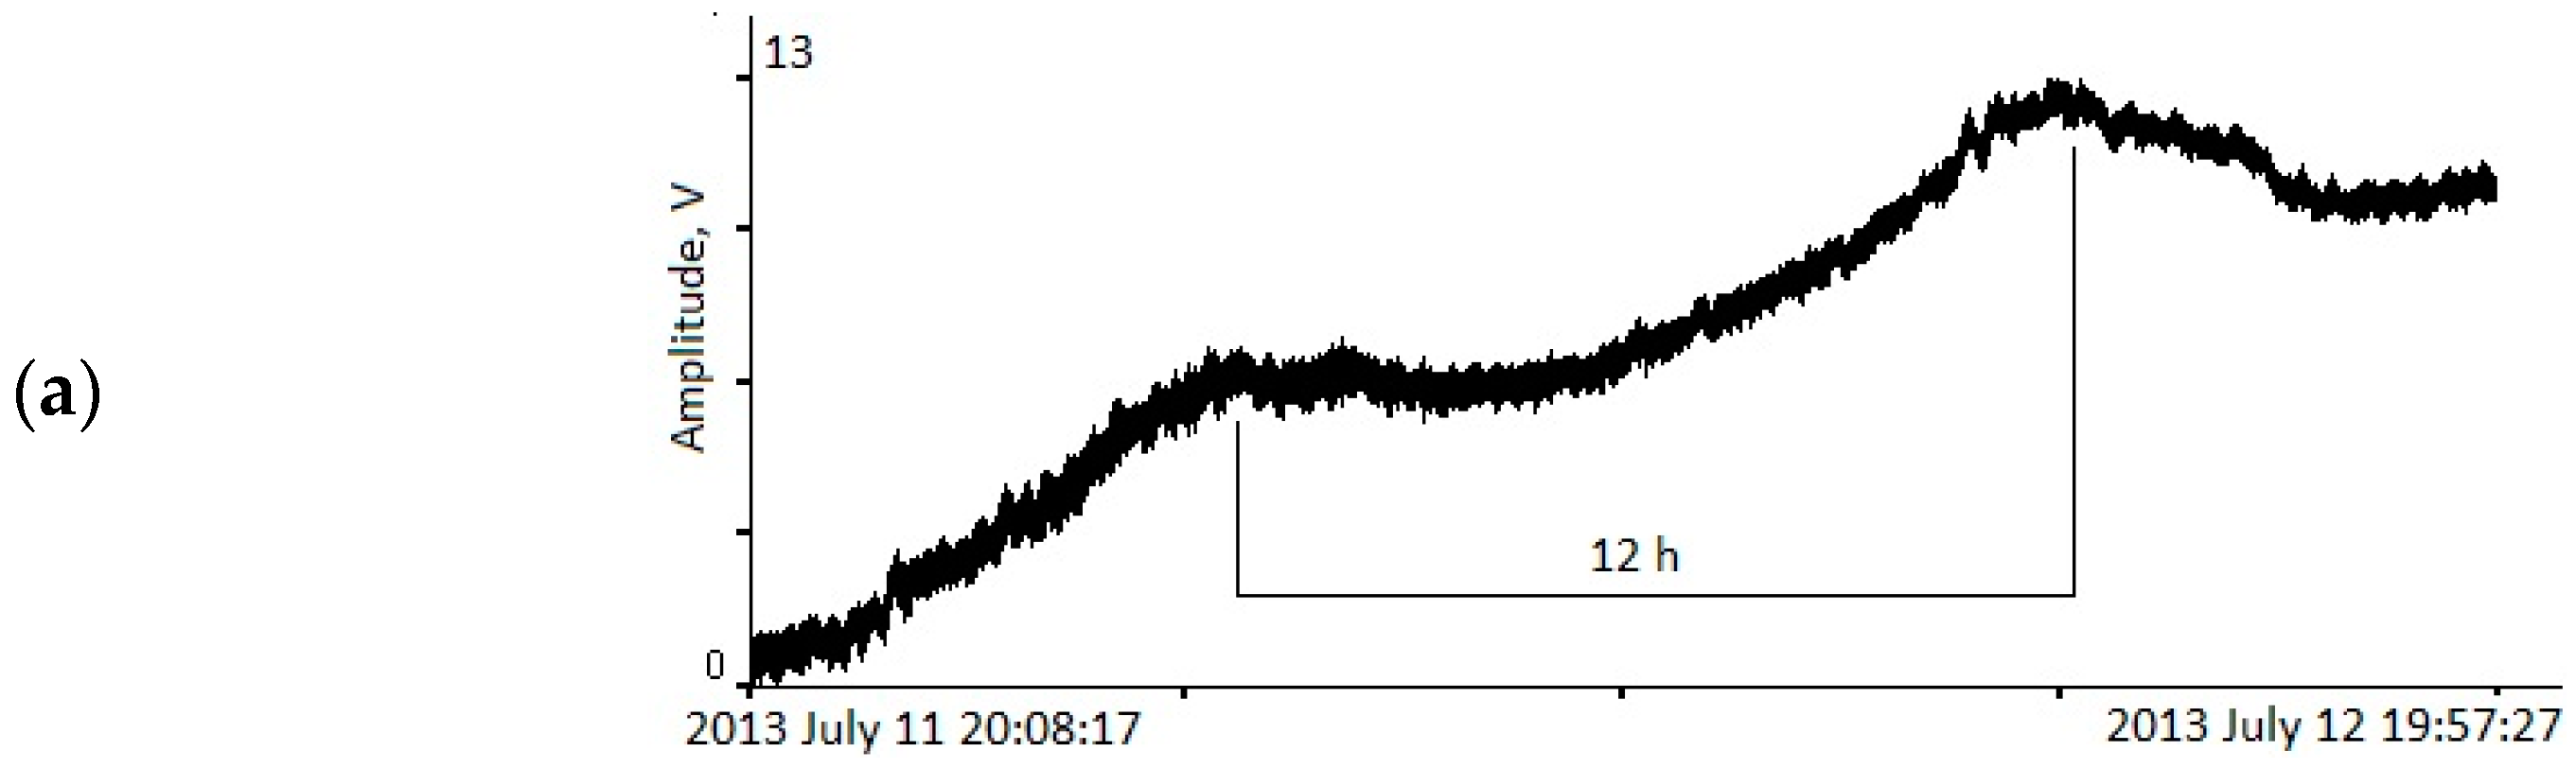
Figure 3.
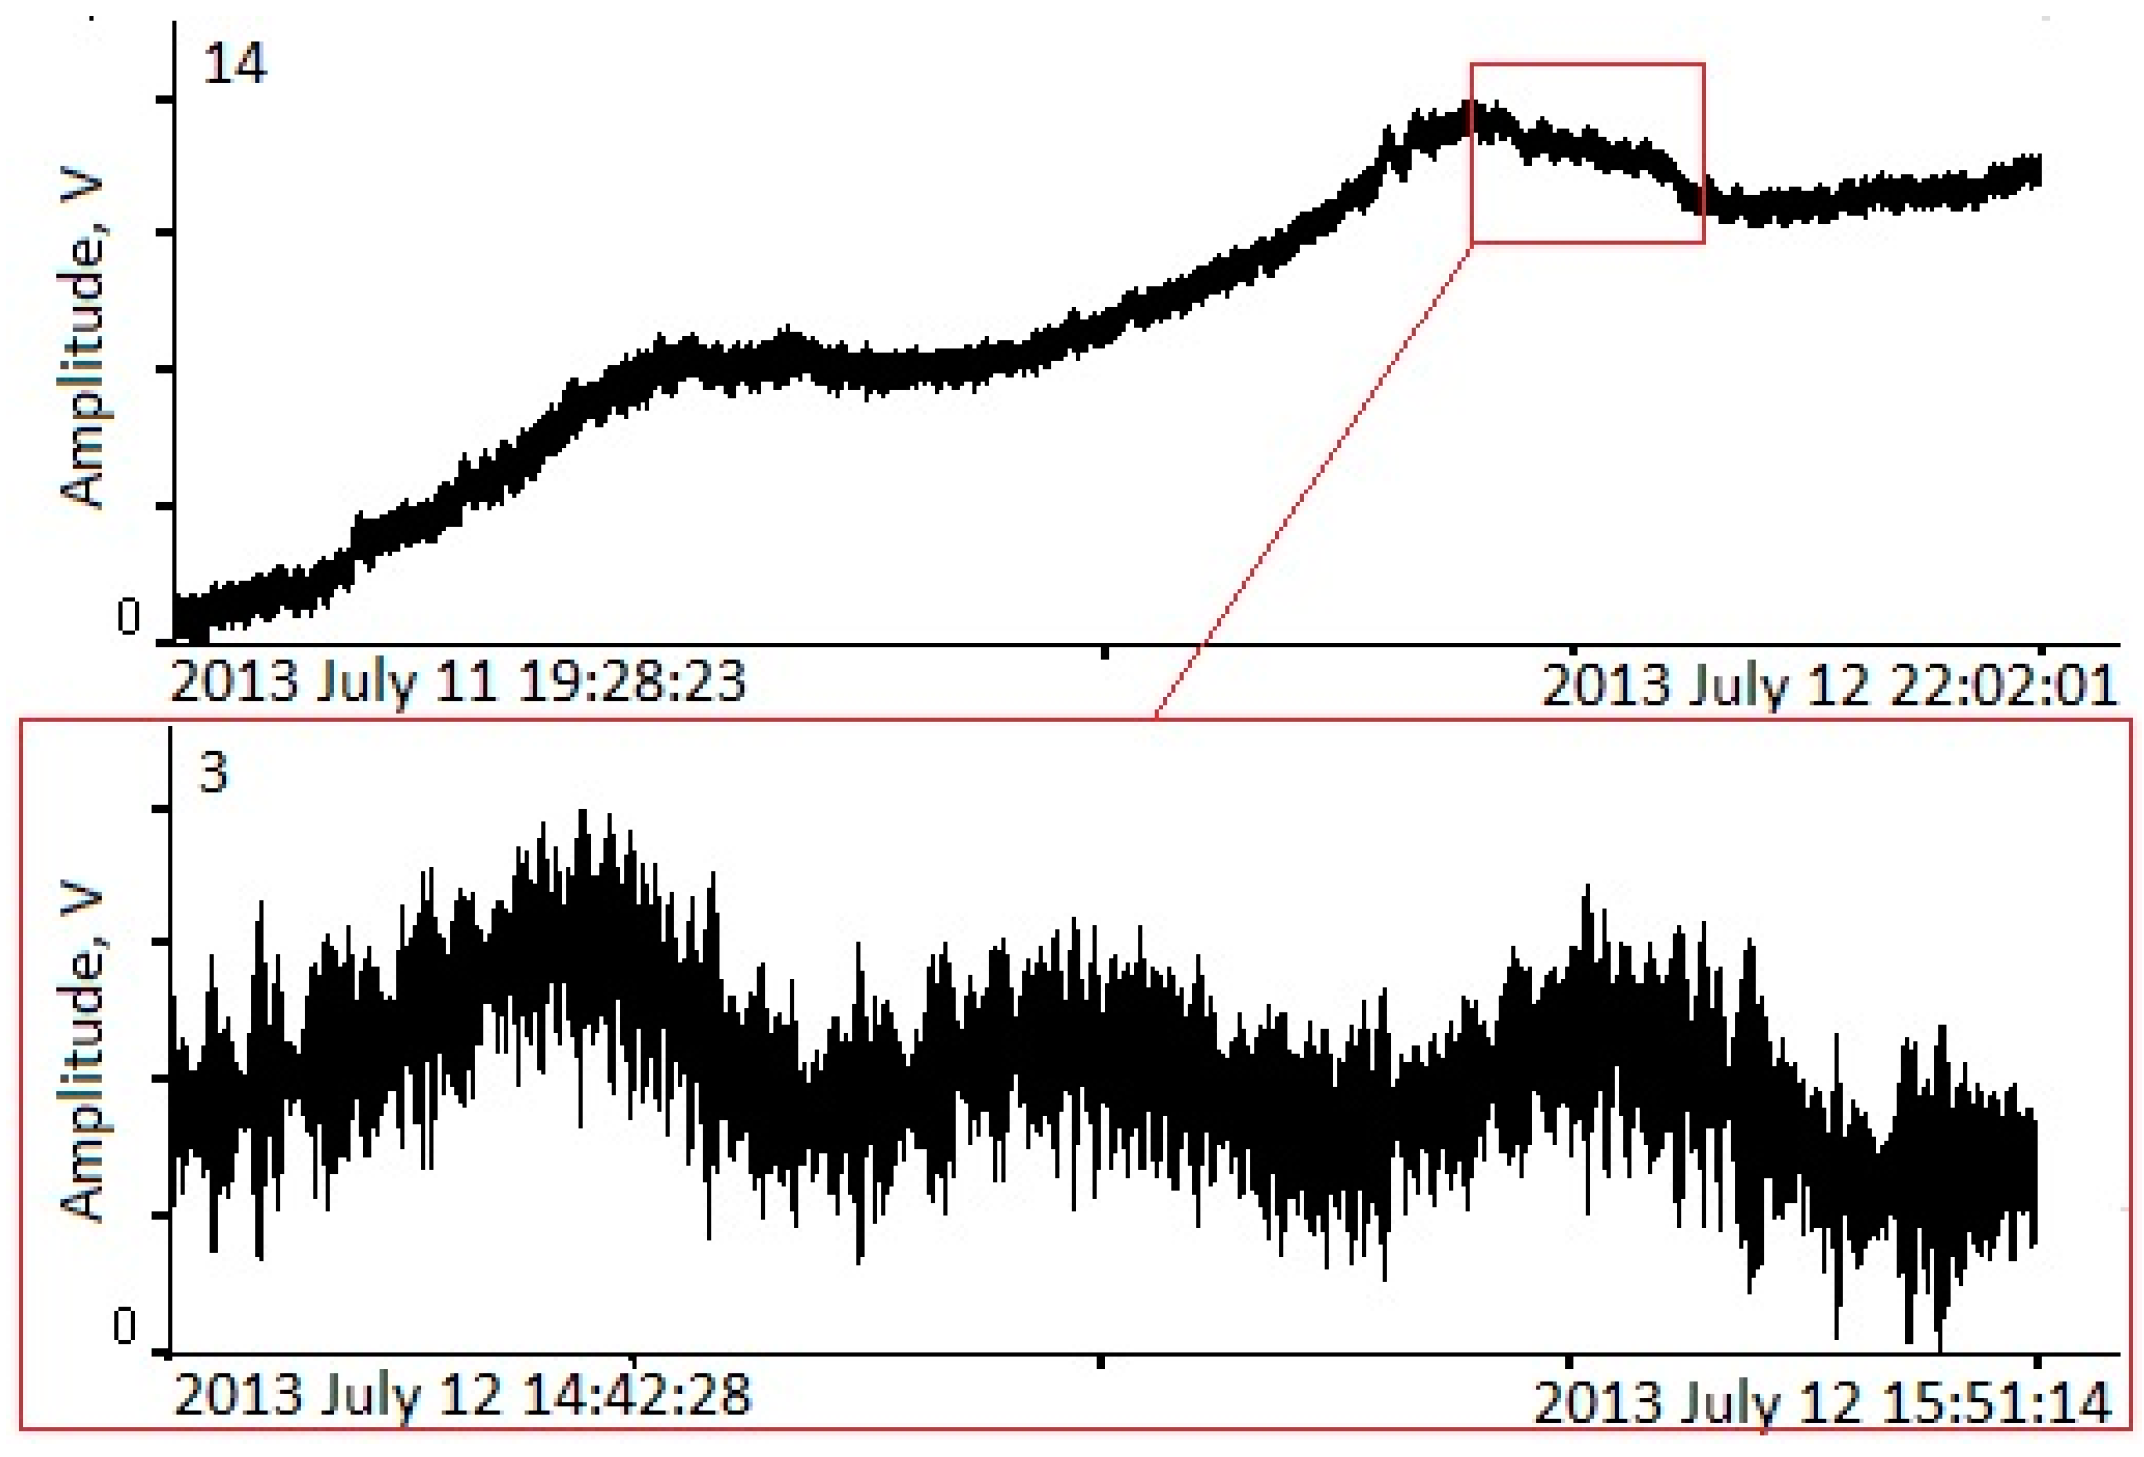
As we can see in
Figure 3a, the record contains two pronounced tides within a period of 12 h, but in
Figure 3b, the modulations of the period and the amplitude of the waves are in antiphase, i.e., despite the fact that the waves within aa large period are at the maximum tide point, waves within a smaller period have a greater amplitude. At the same time, all similar cases have one common feature: in all of the fragments, there are seiche oscillations; in this case, these are oscillations are within period of 18 min, which is characteristic of the place where the measurements were completed (
Figure 4).
In connection with the above, we can assume that these ambiguous cases may arise due to complex modulation processes associated with the “submodulation” of several wave phenomena.
4. Influence of Atmosphere on Modulation of Wind Waves by Tidal Oscillations
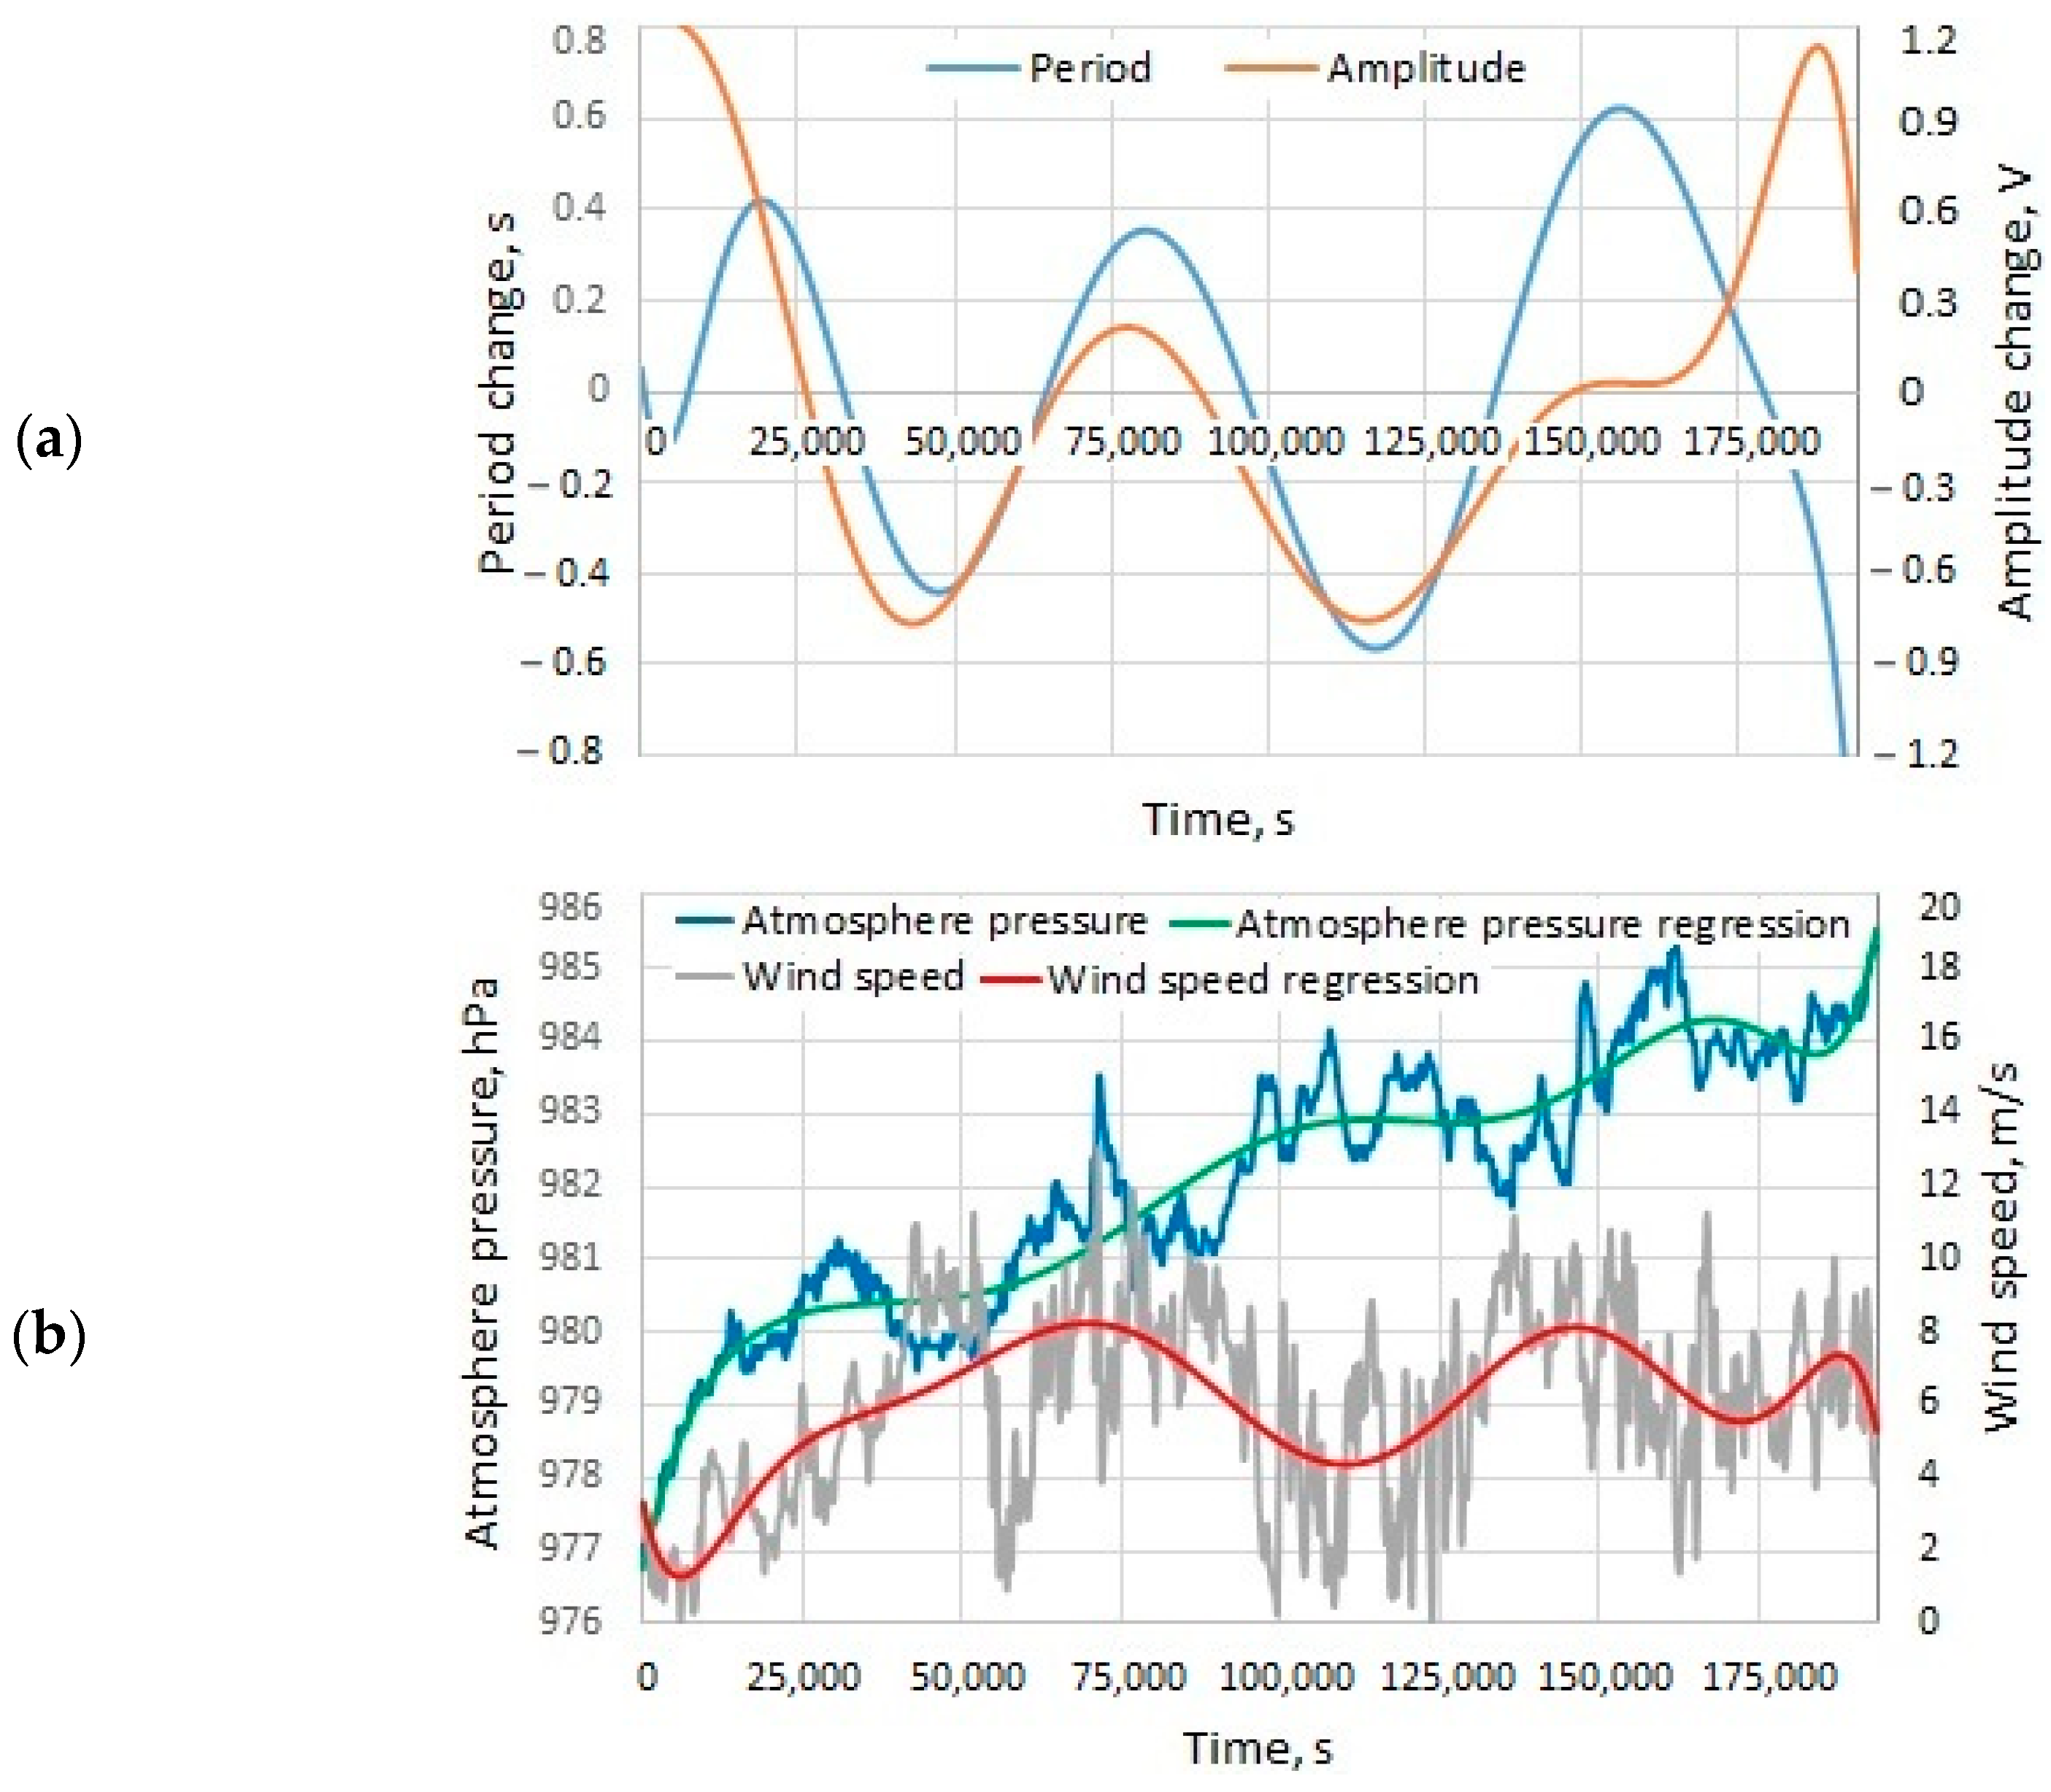
An additionally important issue in this topic is the influence of variations in atmospheric pressure and wind regime on the process of the modulation of wind waves by tidal oscillations. Let us consider this issue on the example of a processed recording fragment with tidal oscillations with a period of 12 h and provide meteorological data received from the meteorological station for the same period of time (
Figure 5).
We can see from the graphs of the modulation of the amplitude and the period of the waves (
Figure 5a) that they practically coincide in phase. This means that, as in the previously considered cases, at the maximum tidal points, there will be waves with a longer period and greater amplitude. The atmospheric pressure graph (
Figure 5b) shows three peaks corresponding to atmospheric tides; the maxima of these tides are shifted several hours to the right of the maximum values of the swell modulation, which indicates that these oscillations occur after the sea tide. On the same graph, you can see that the graph of the wind speed variations is practically in antiphase with pressure variations and has a minor delay of several hours. Thus, we can conclude that diurnal pressure variations occur after sea tide. Variations in wind speed occur due to fluctuations in atmospheric pressure since air masses begin to move from the area of increasing pressure to areas with lower pressure, which results in a change in wind direction. An abrupt decrease in the wave amplitude at the second maximum (
Figure 2a) at the max wind speed may be due to the fact that the wind direction was opposite to the direction of the swell wave propagation. At the same time, at the third maximum of the period change graph, we see an increase in the modulation effect, which may indicate that waves with periods of 4 s and below are more susceptible to the modulation effect than waves with higher periods. When processing and analyzing more than five more data fragments with modulations of wind waves and swell waves on tidal oscillations present on them and the meteorological data received over the same period of time, there were no impacts on the modulation effect on the part of the variations in the atmospheric pressure and wind speed.
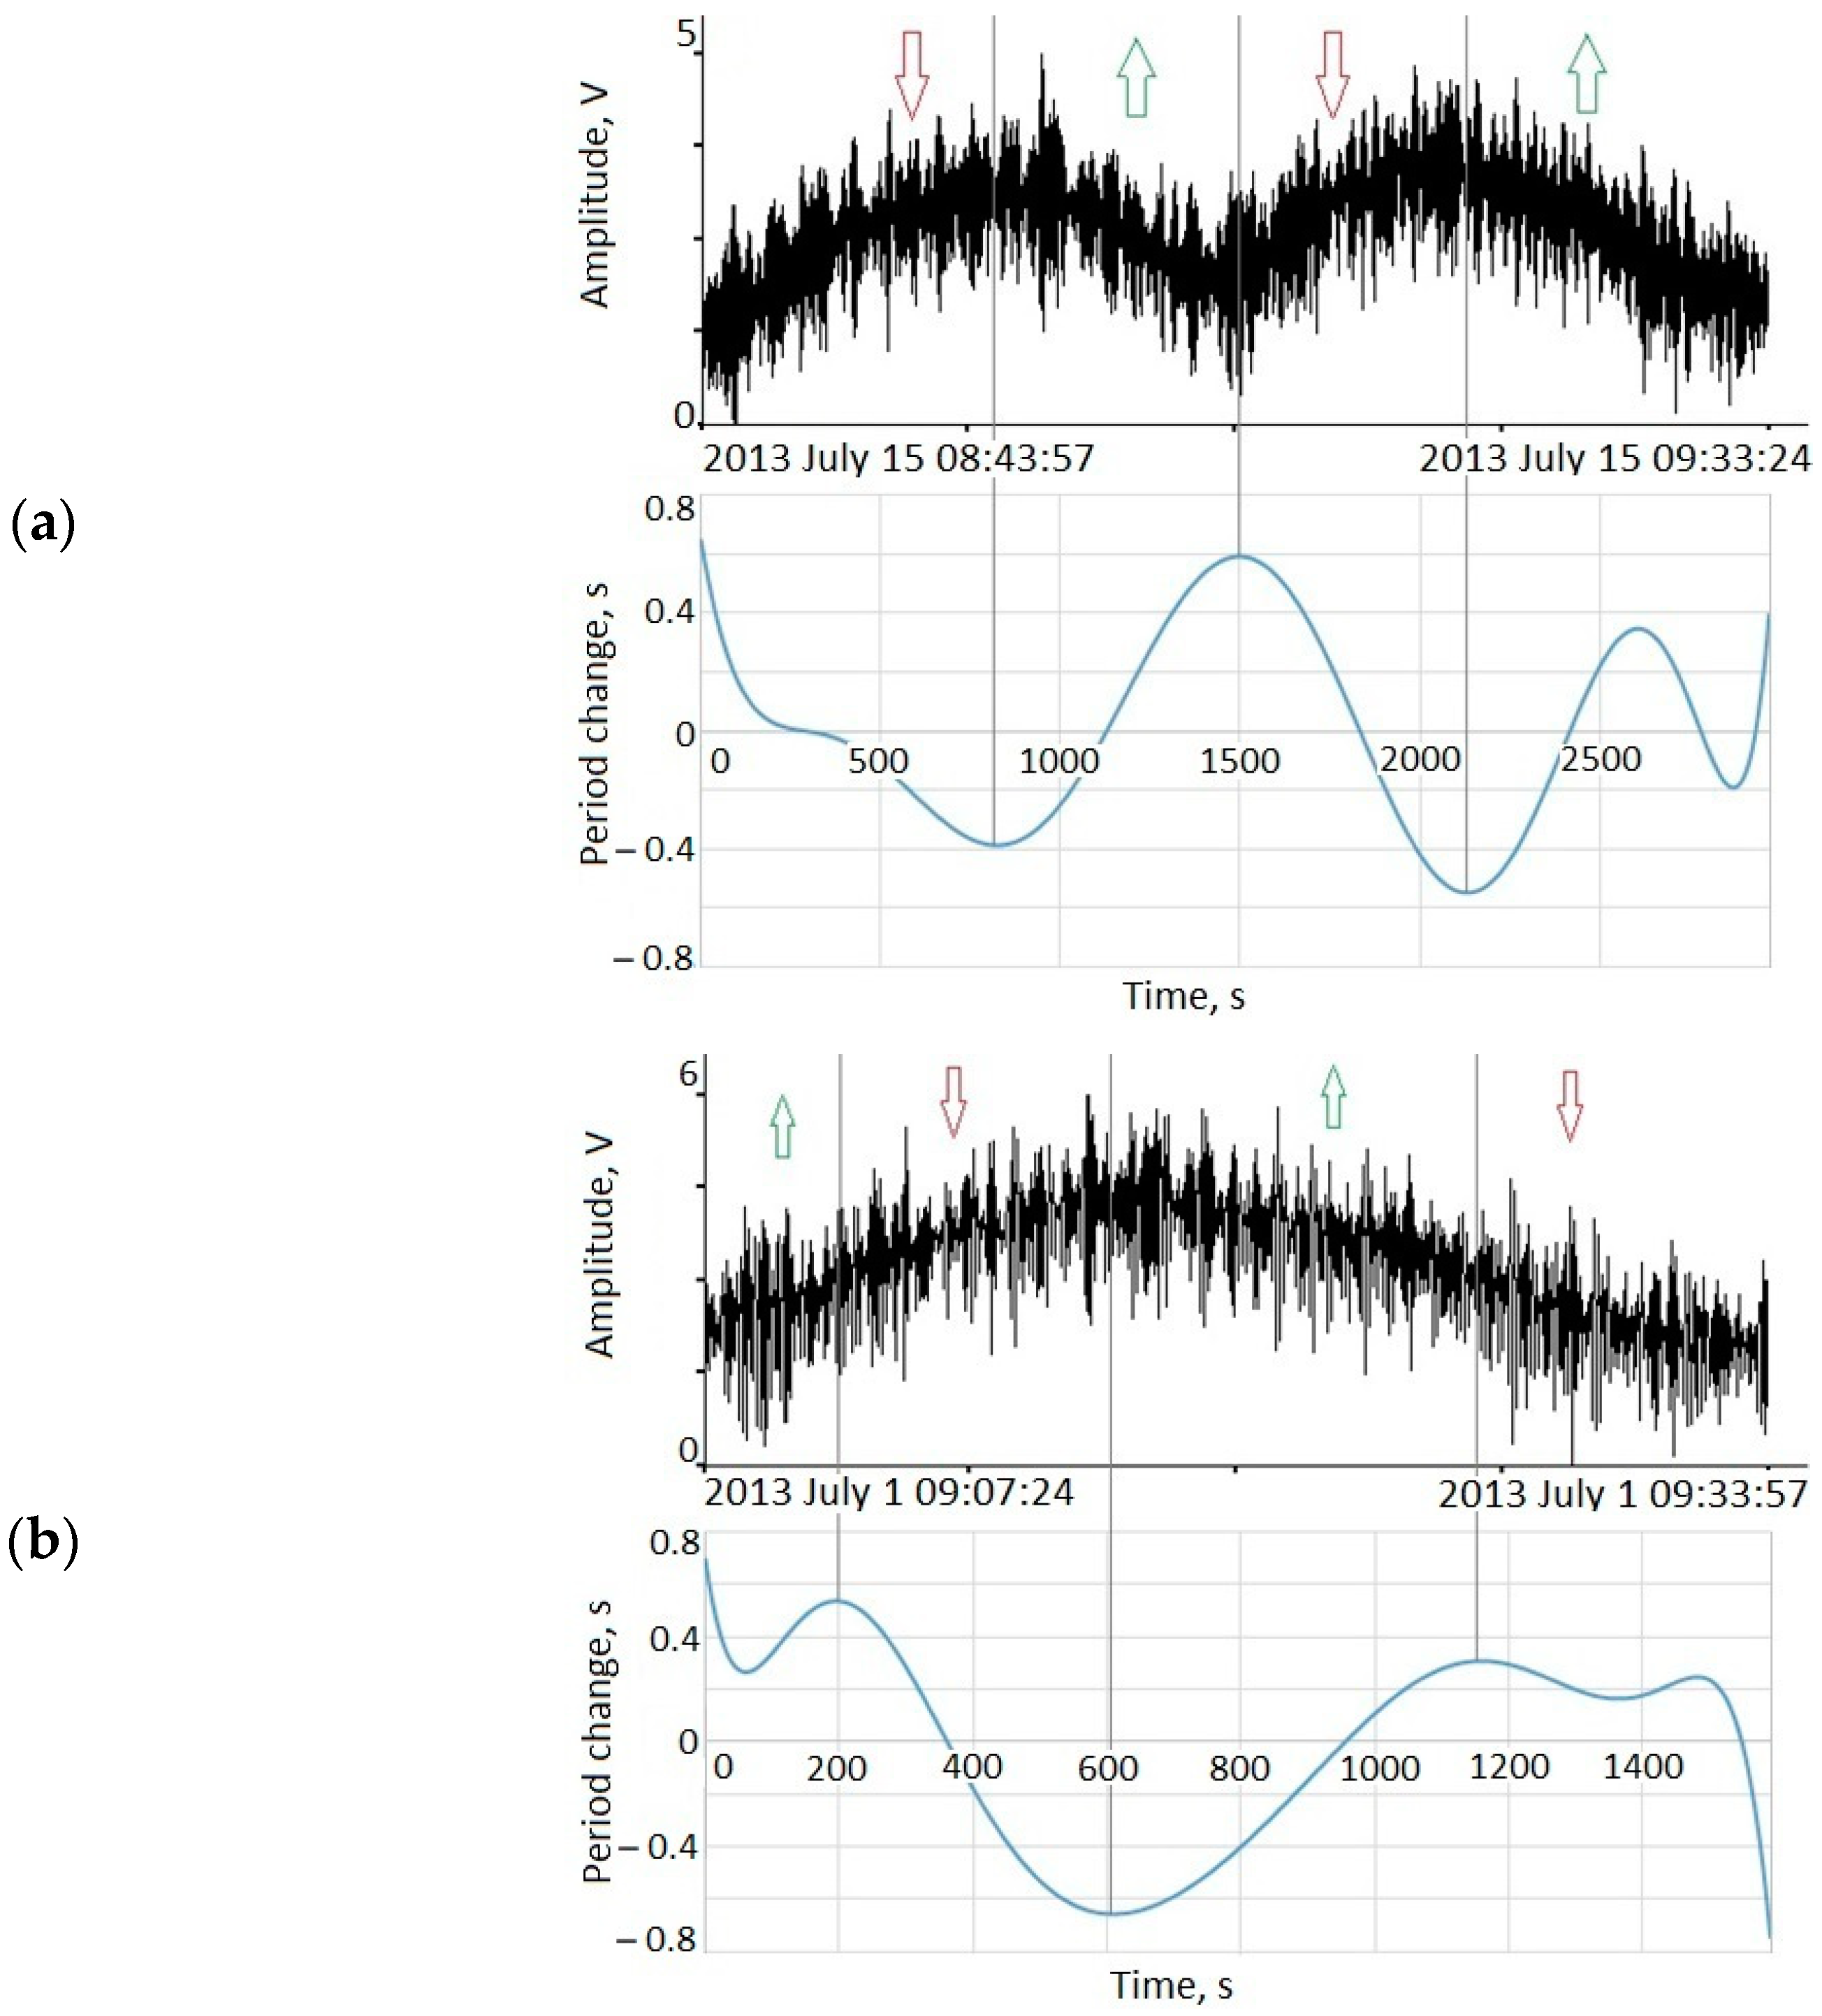
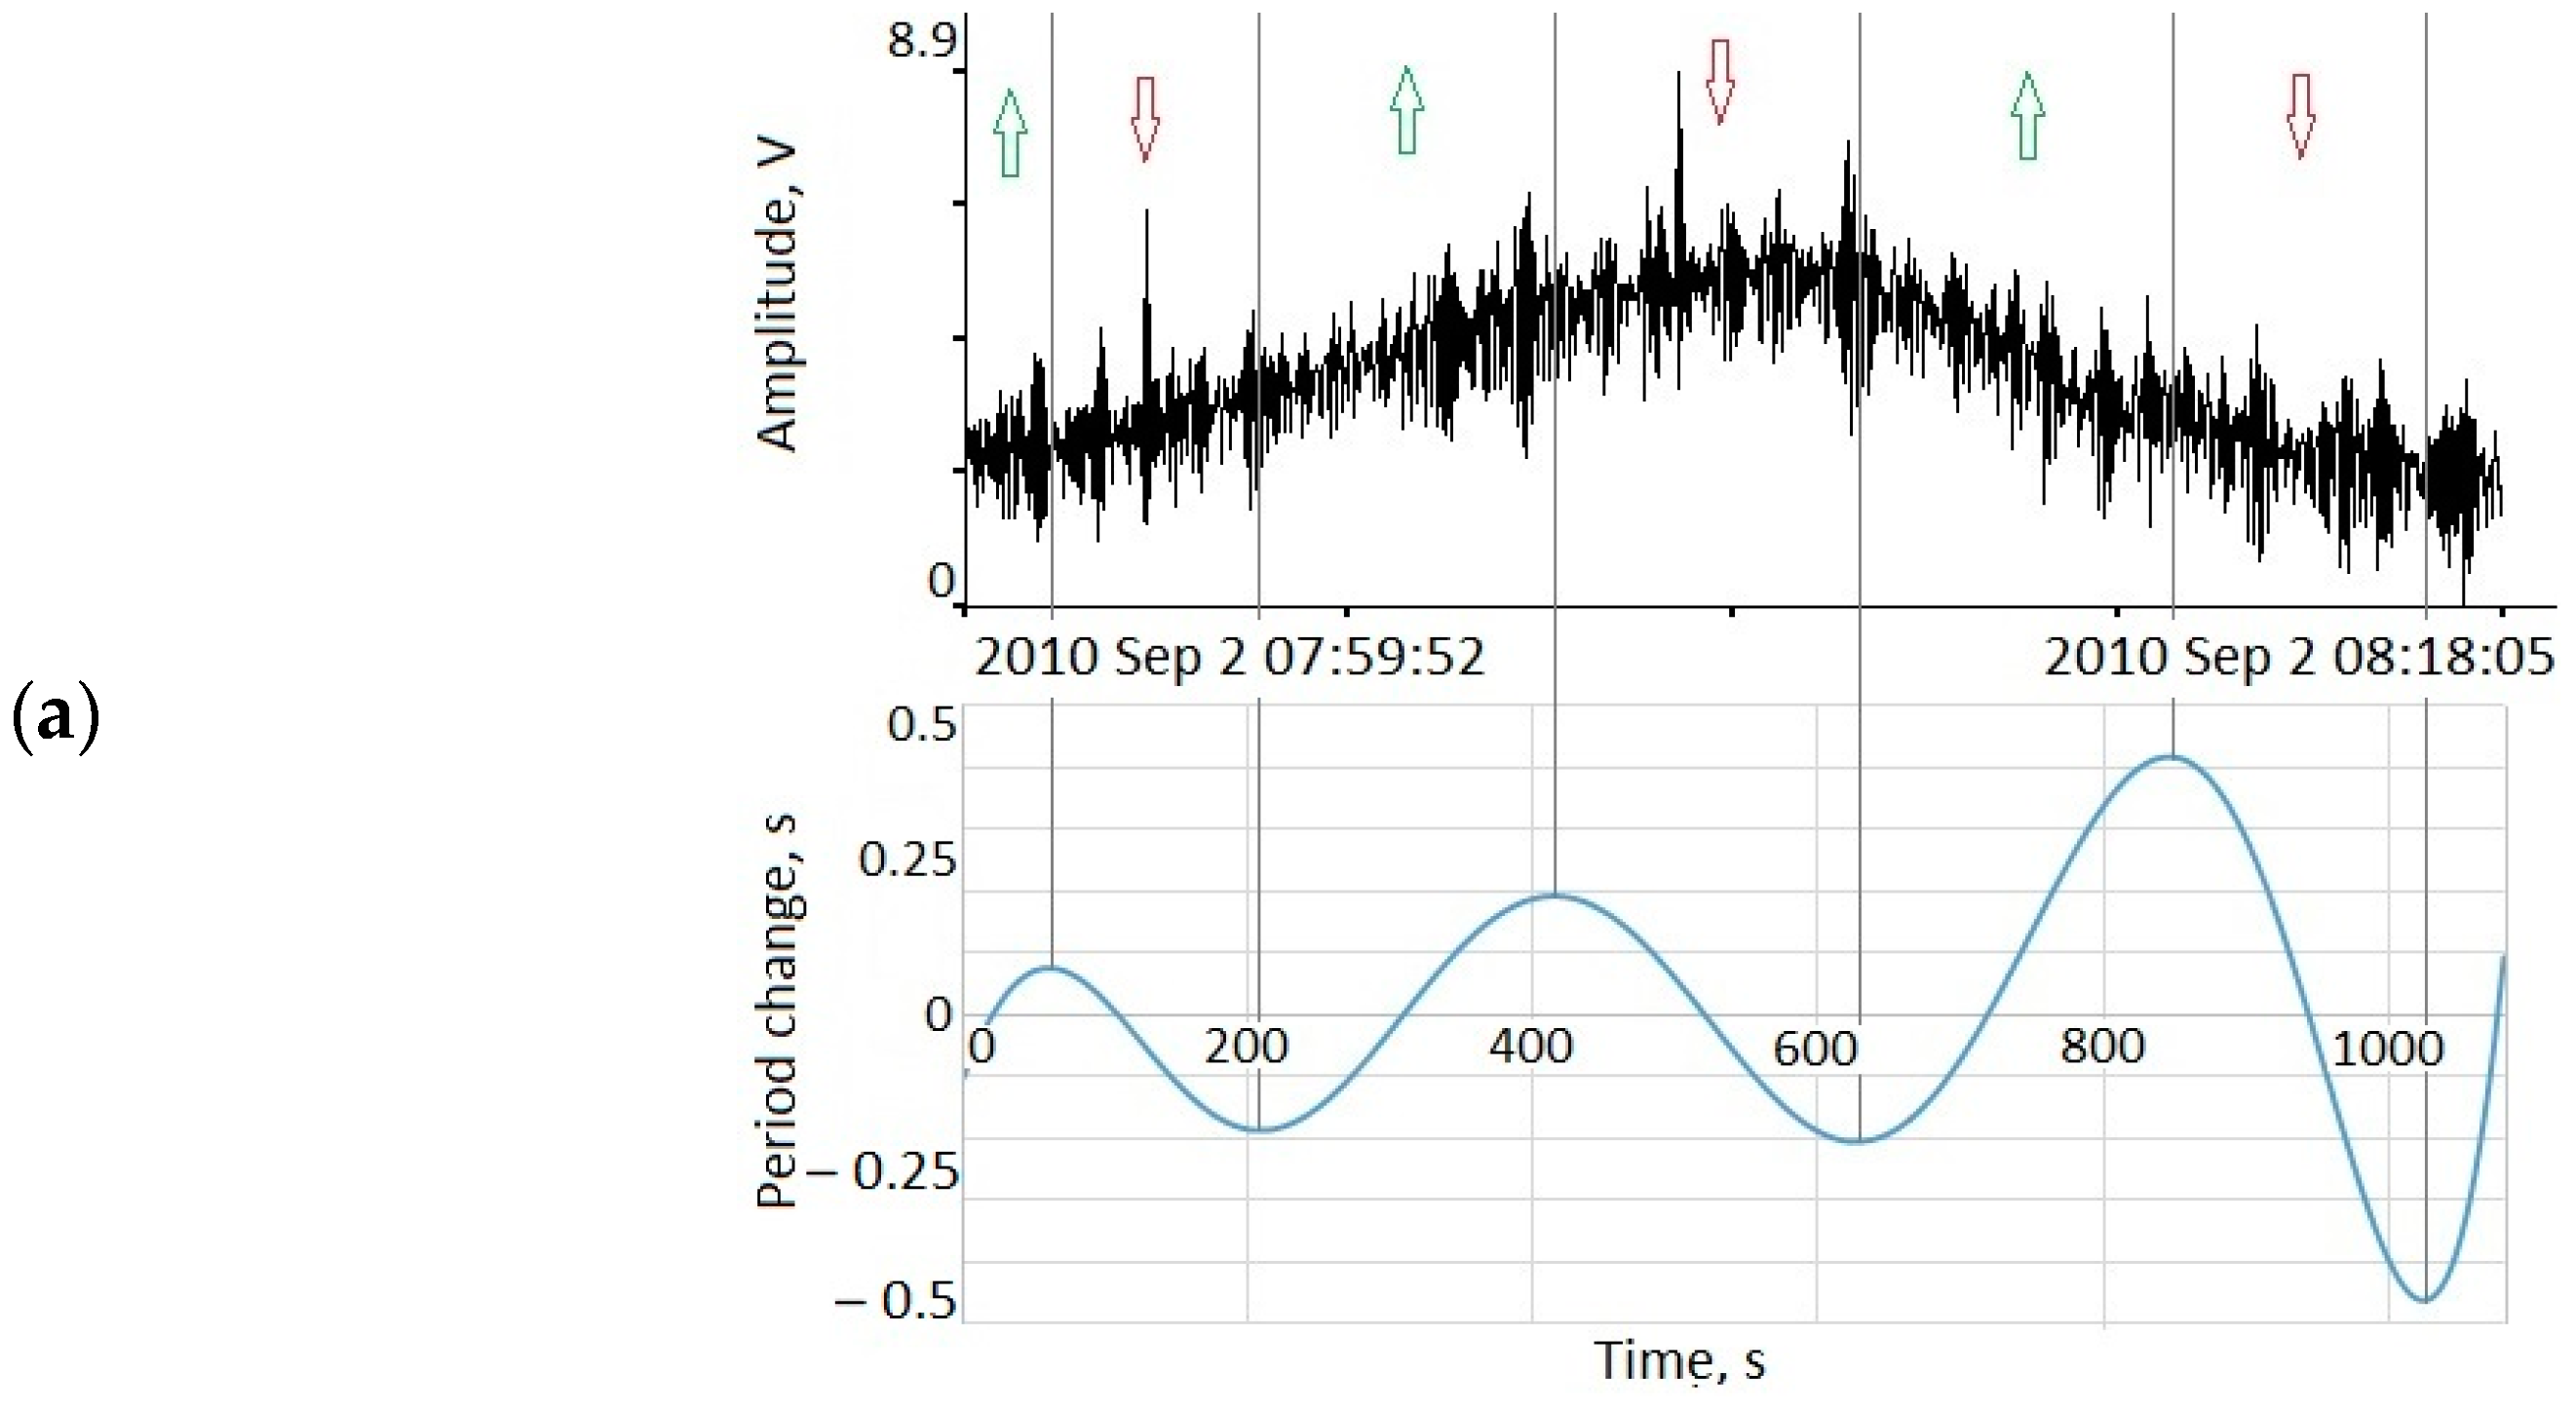
5. Modulation of Wind Waves on Seiche Oscillations
Analyzing more than 30 fragments of the records on which seiche oscillations were explicitly presented simultaneously with strong wind waves, several characteristic types of modulations, “two-tone” and “four-tone”, were identified. These types of modulations are shown in
Figure 6.
As we can see in
Figure 6a, in one seiche oscillation with period of 18 min, the wind wave period changes two times, which means that on opposite seiche fronts, the processes of compression (red arrows) and extension (green arrows) occur, while in
Figure 6b, in one oscillation with period of 20 min, the wind waves at the front have one compression–extension cycle, which, in turn, generates modulation.
We can describe this type of modulation using a simple equation.
where
is the period of the wind waves,
is the period of modulating oscillation,
m is the modulation index.
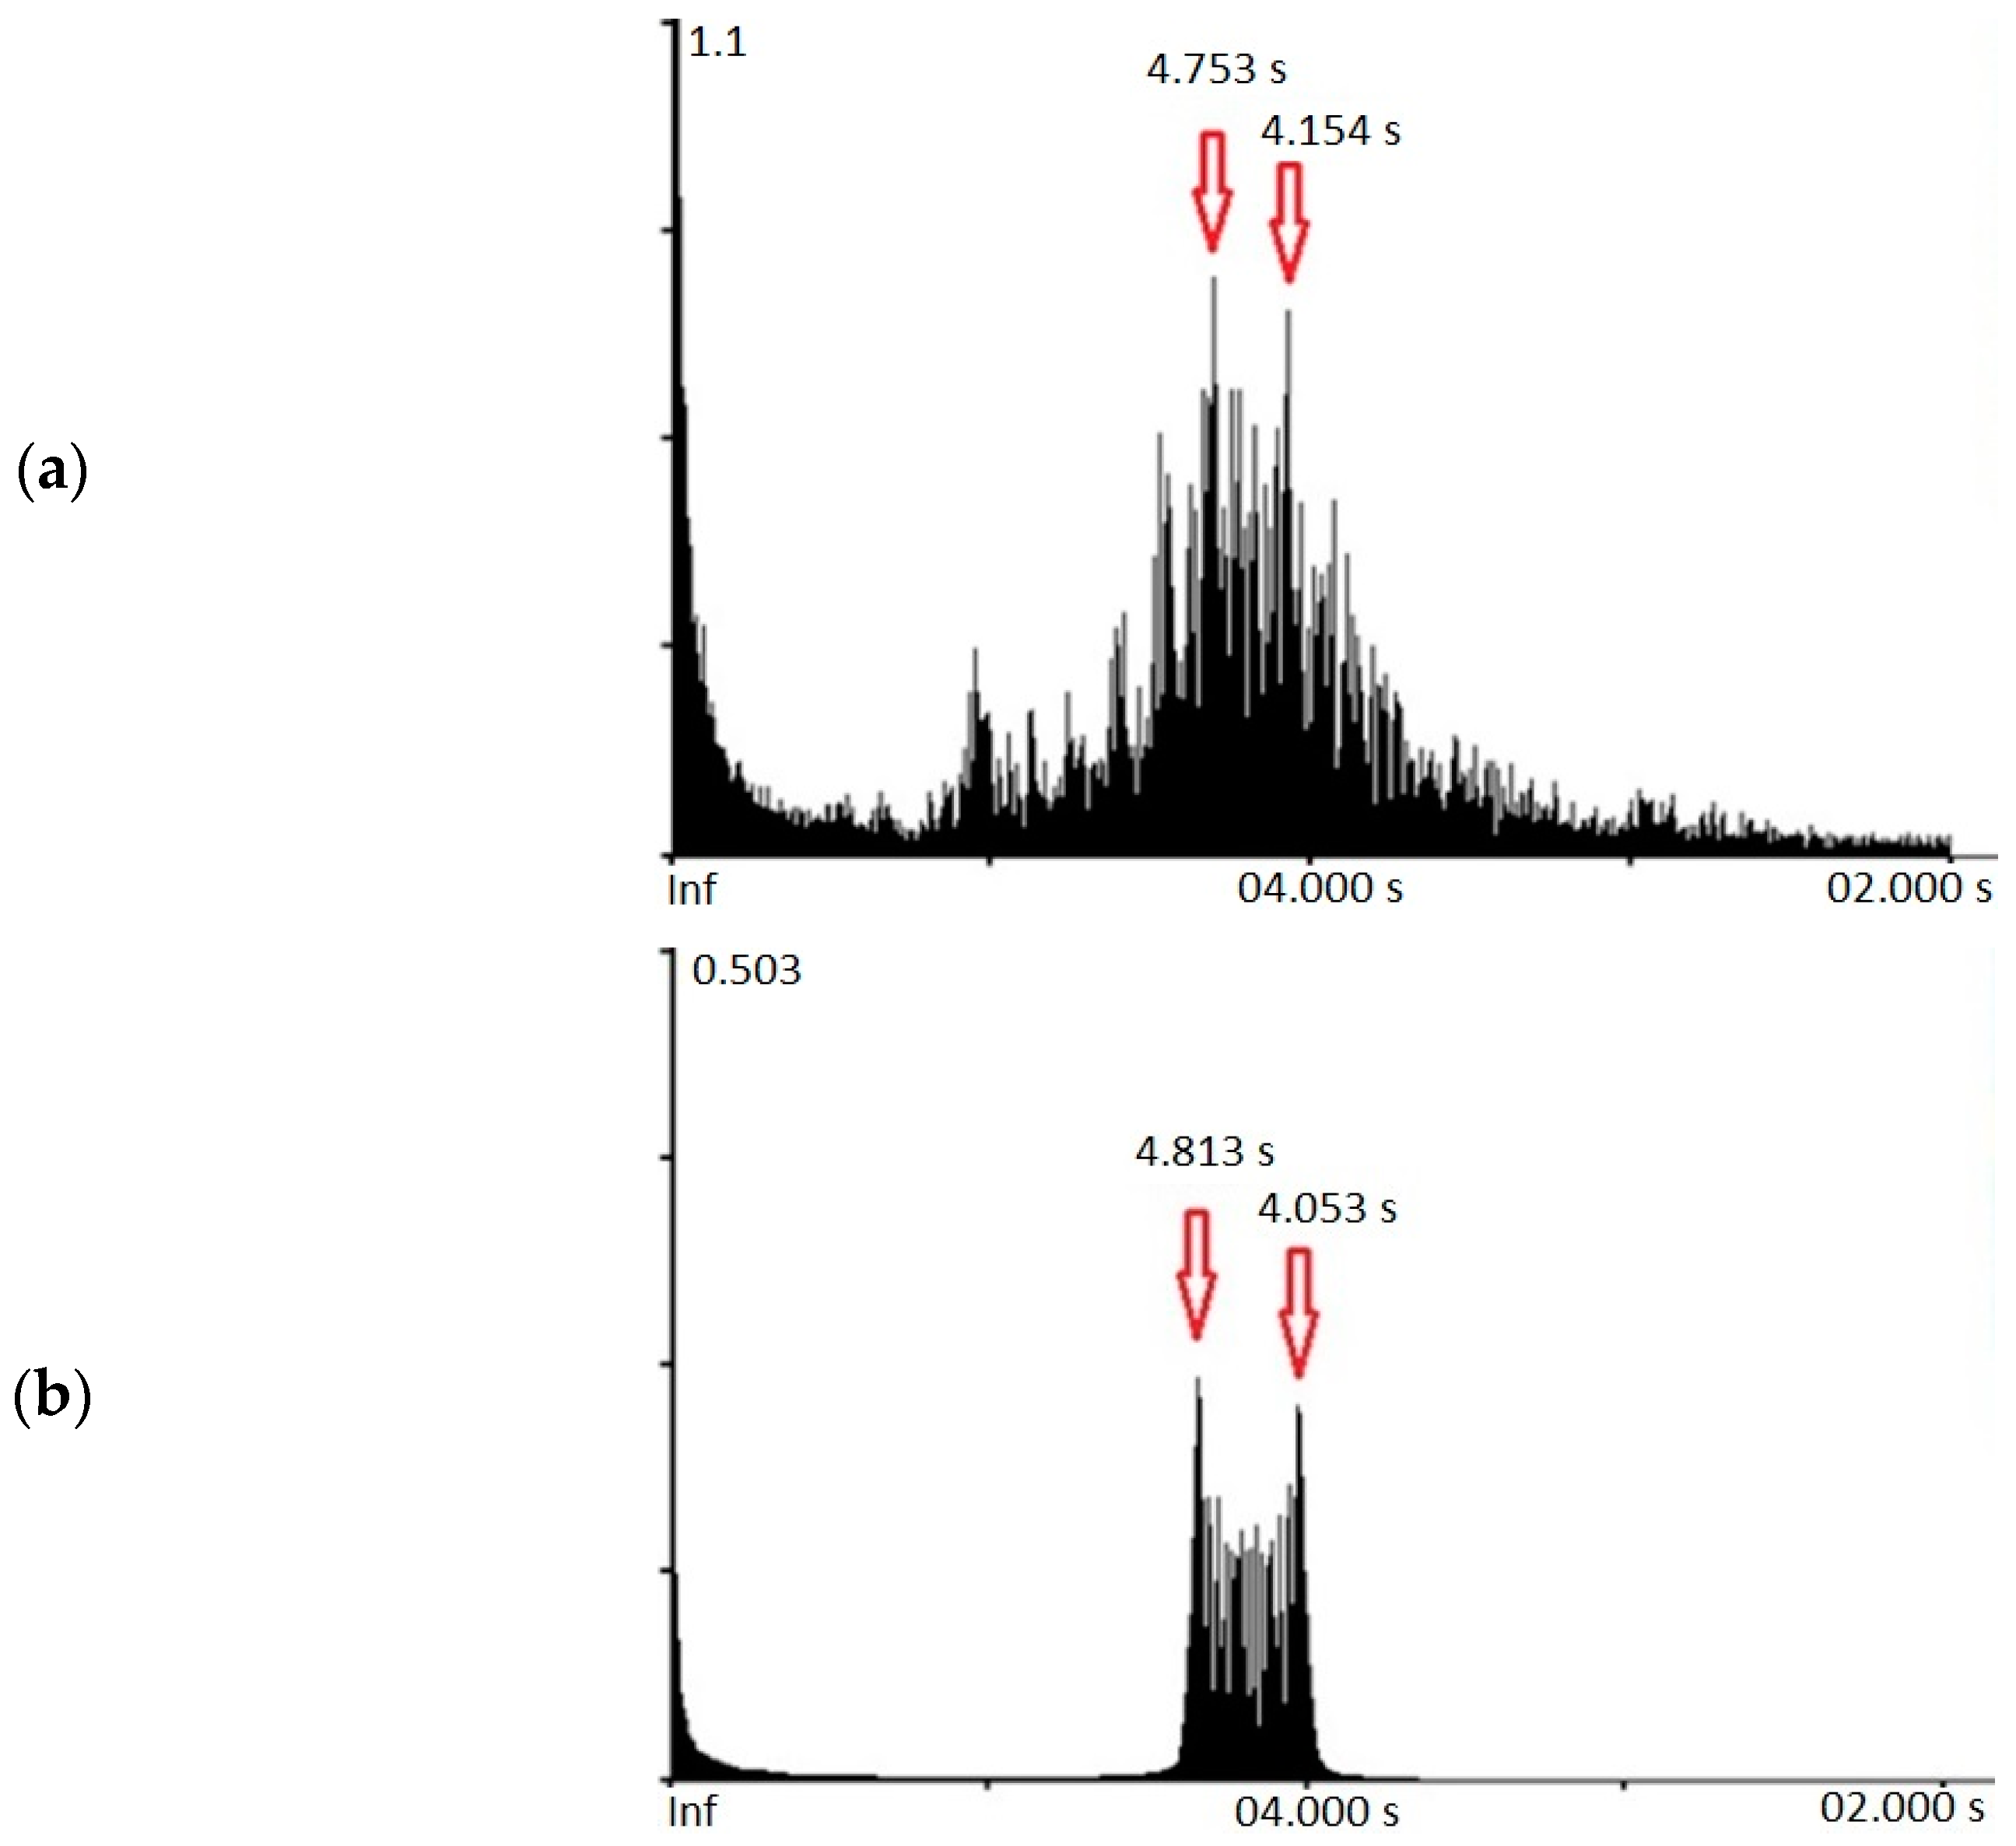
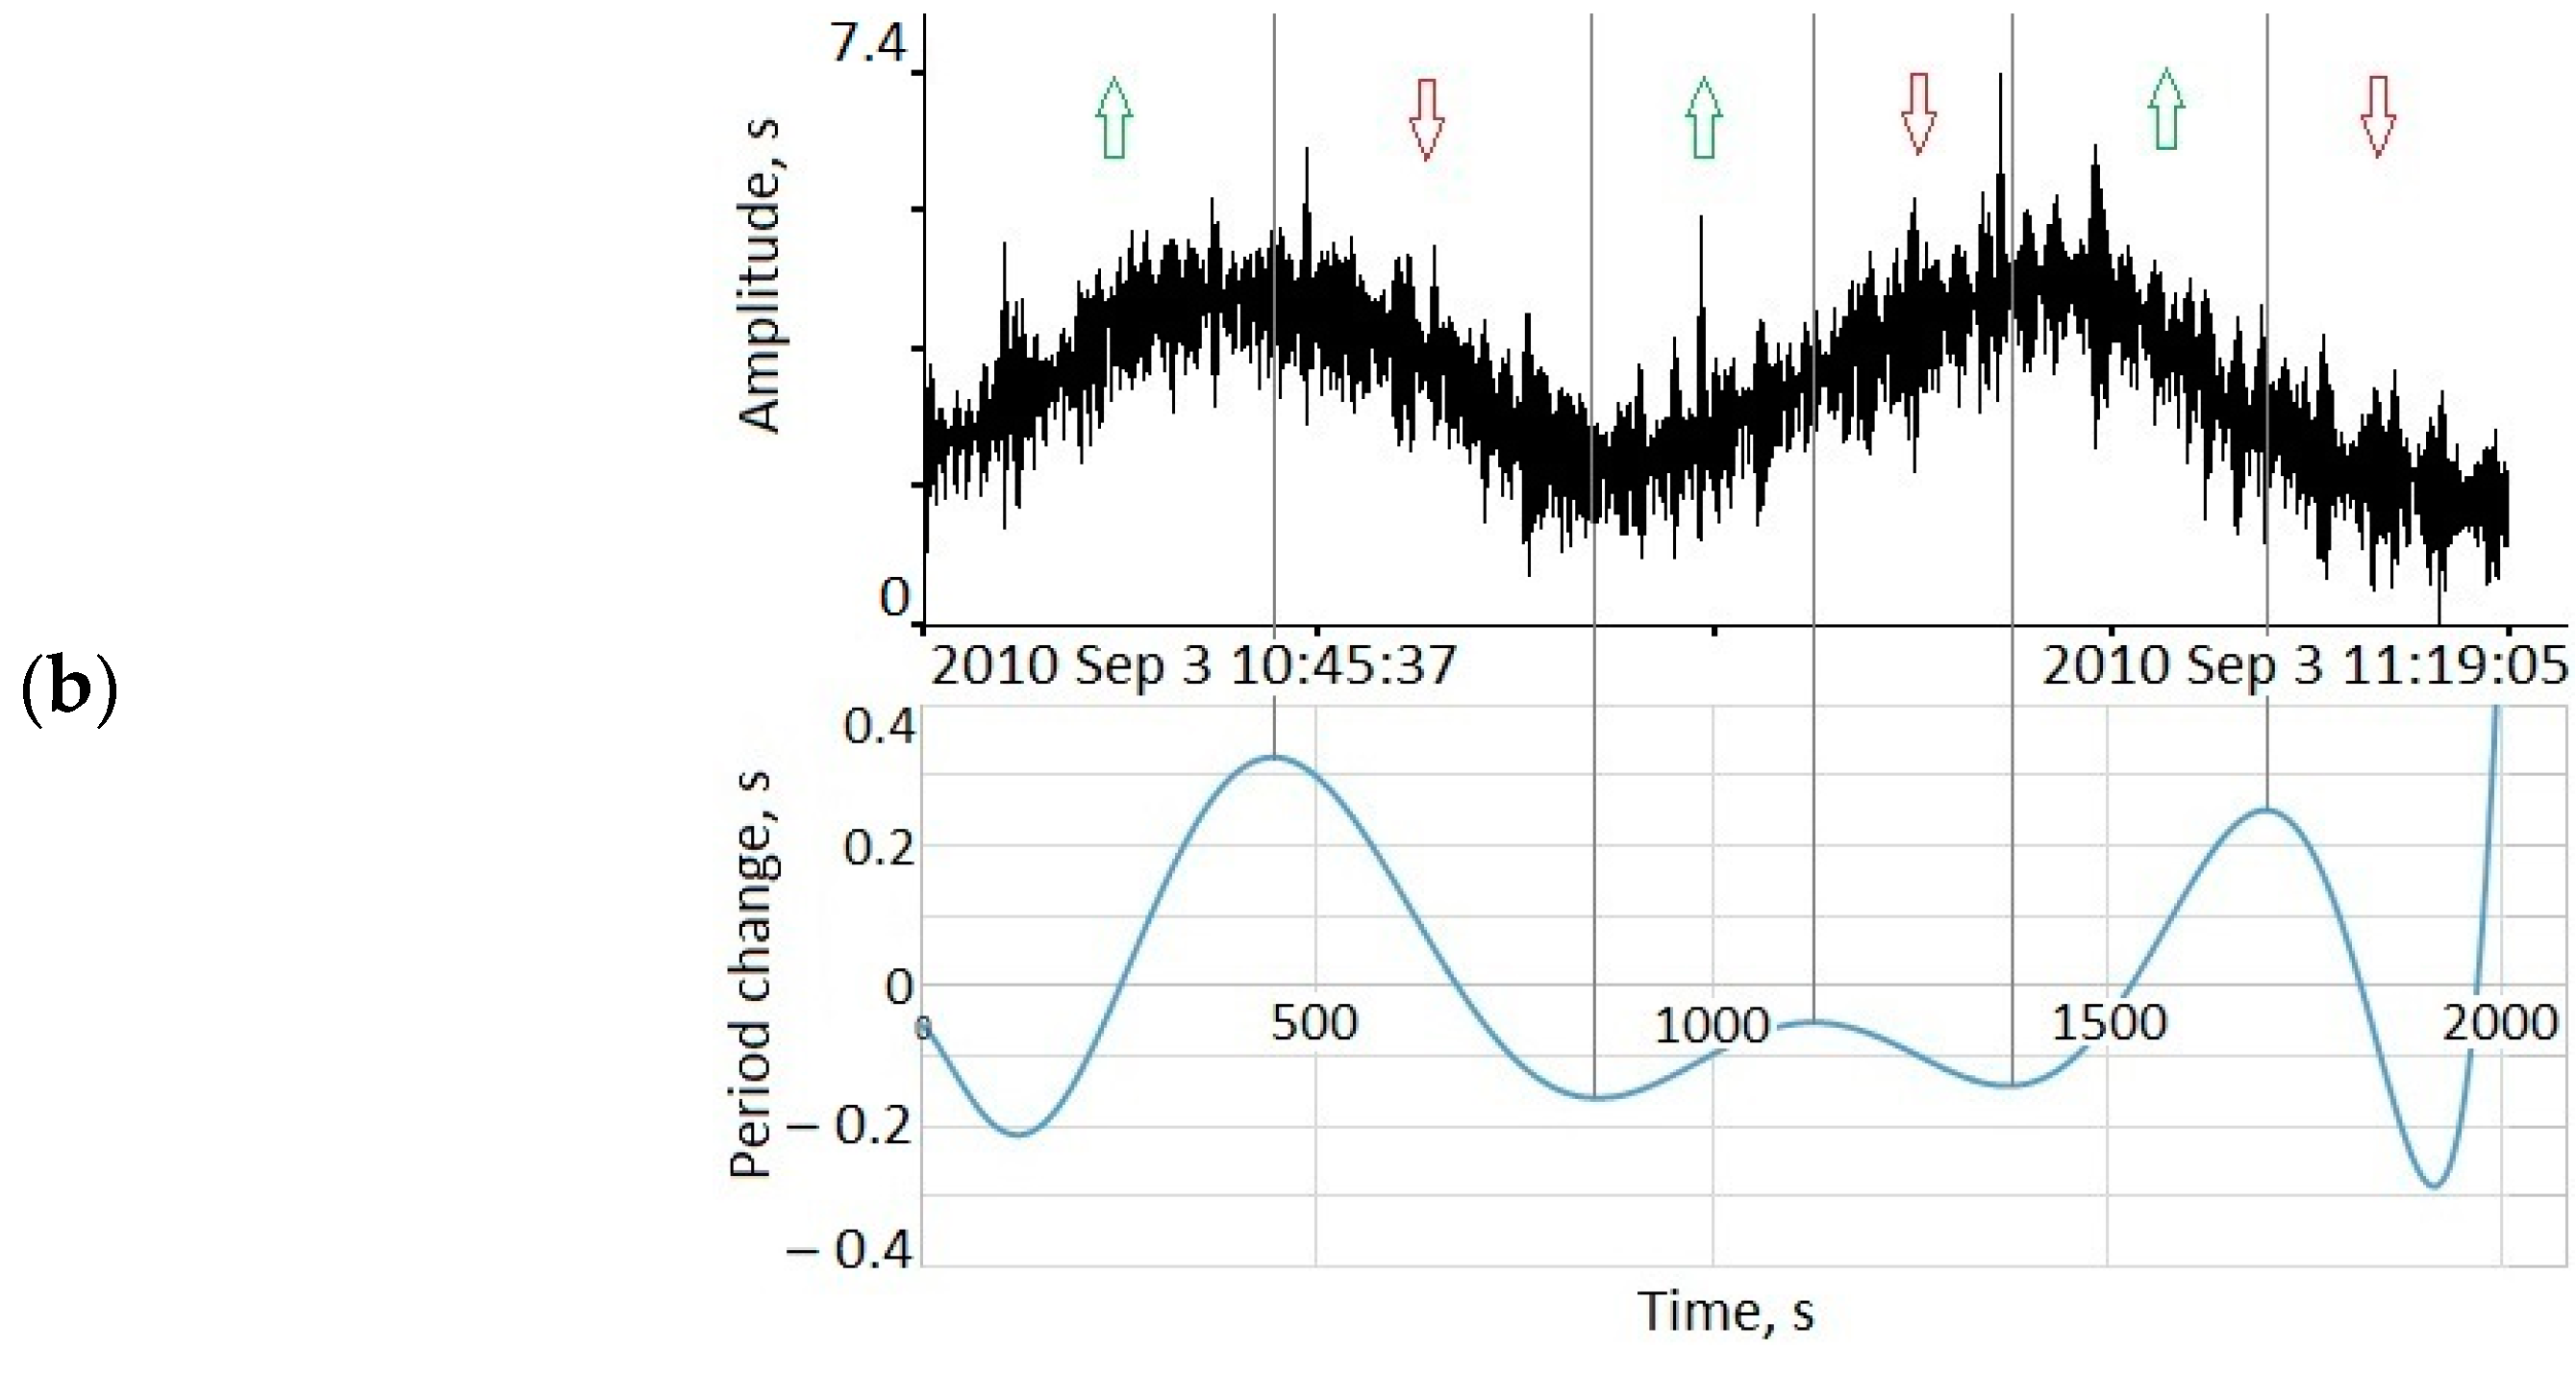
Figure 7 shows the spectrum of wind waves within a period of 4.8 s modulated by seiche oscillations within a period of 18 min constructed on experimental data.
Figure 6 also shows the spectrum calculated using Expression (5), with the same wave parameters and modulation index
m = 4.
In the spectra shown in
Figure 7, as in other similar cases, there are two characteristic maxima. The first is the main period of wind waves, while the second is responsible for the modulation process of wind waves on seiche oscillations. In this case, the main spectral maximum always remains in its place, and the position of the second (modulation) maximum can vary depending on the modulation index. Thus, when analyzing the spectra of experimental data based on two characteristic maxima, we can confidently speak about the presence of seiche oscillations and their modulation of wind waves.
We have now looked at the most common modulation ideal cases. However, we understand that in nature, not everything is so unambiguous and, of course, there are cases of combined modulations. As such, for example, on one (
Figure 8a) and on two seiche oscillations, both “two-tone” and “four-tone” modulation can occur (
Figure 8b). Such combined modulations, as we can assume, arise in cases of different steepness of the front of the modulating oscillation, which is caused by the seiche asymmetry. As a result, on the flatter part, wind waves and swell waves can be modulated several times.
These types of modulations can also be described using Expression (6); however, the modulation index, in this case, will be equal to the number of extrema per the number of studied modulating oscillations. To show this, let us calculate the spectrum of the signal using Expression (6) in
Figure 8a and compare it with the spectrum constructed based on the experimental data. The initial data are as follows:
Tww = 8.8 s;
Tmo = 24 s;
m = 6. The calculation results are shown in
Figure 9.
As we mentioned above, the width of the modulated oscillations spectrum depends directly on the value of the modulation index, which is well demonstrated in
Figure 9. The form of the spectra is almost identical although it has minor deviations in the numerical values of the maxima.
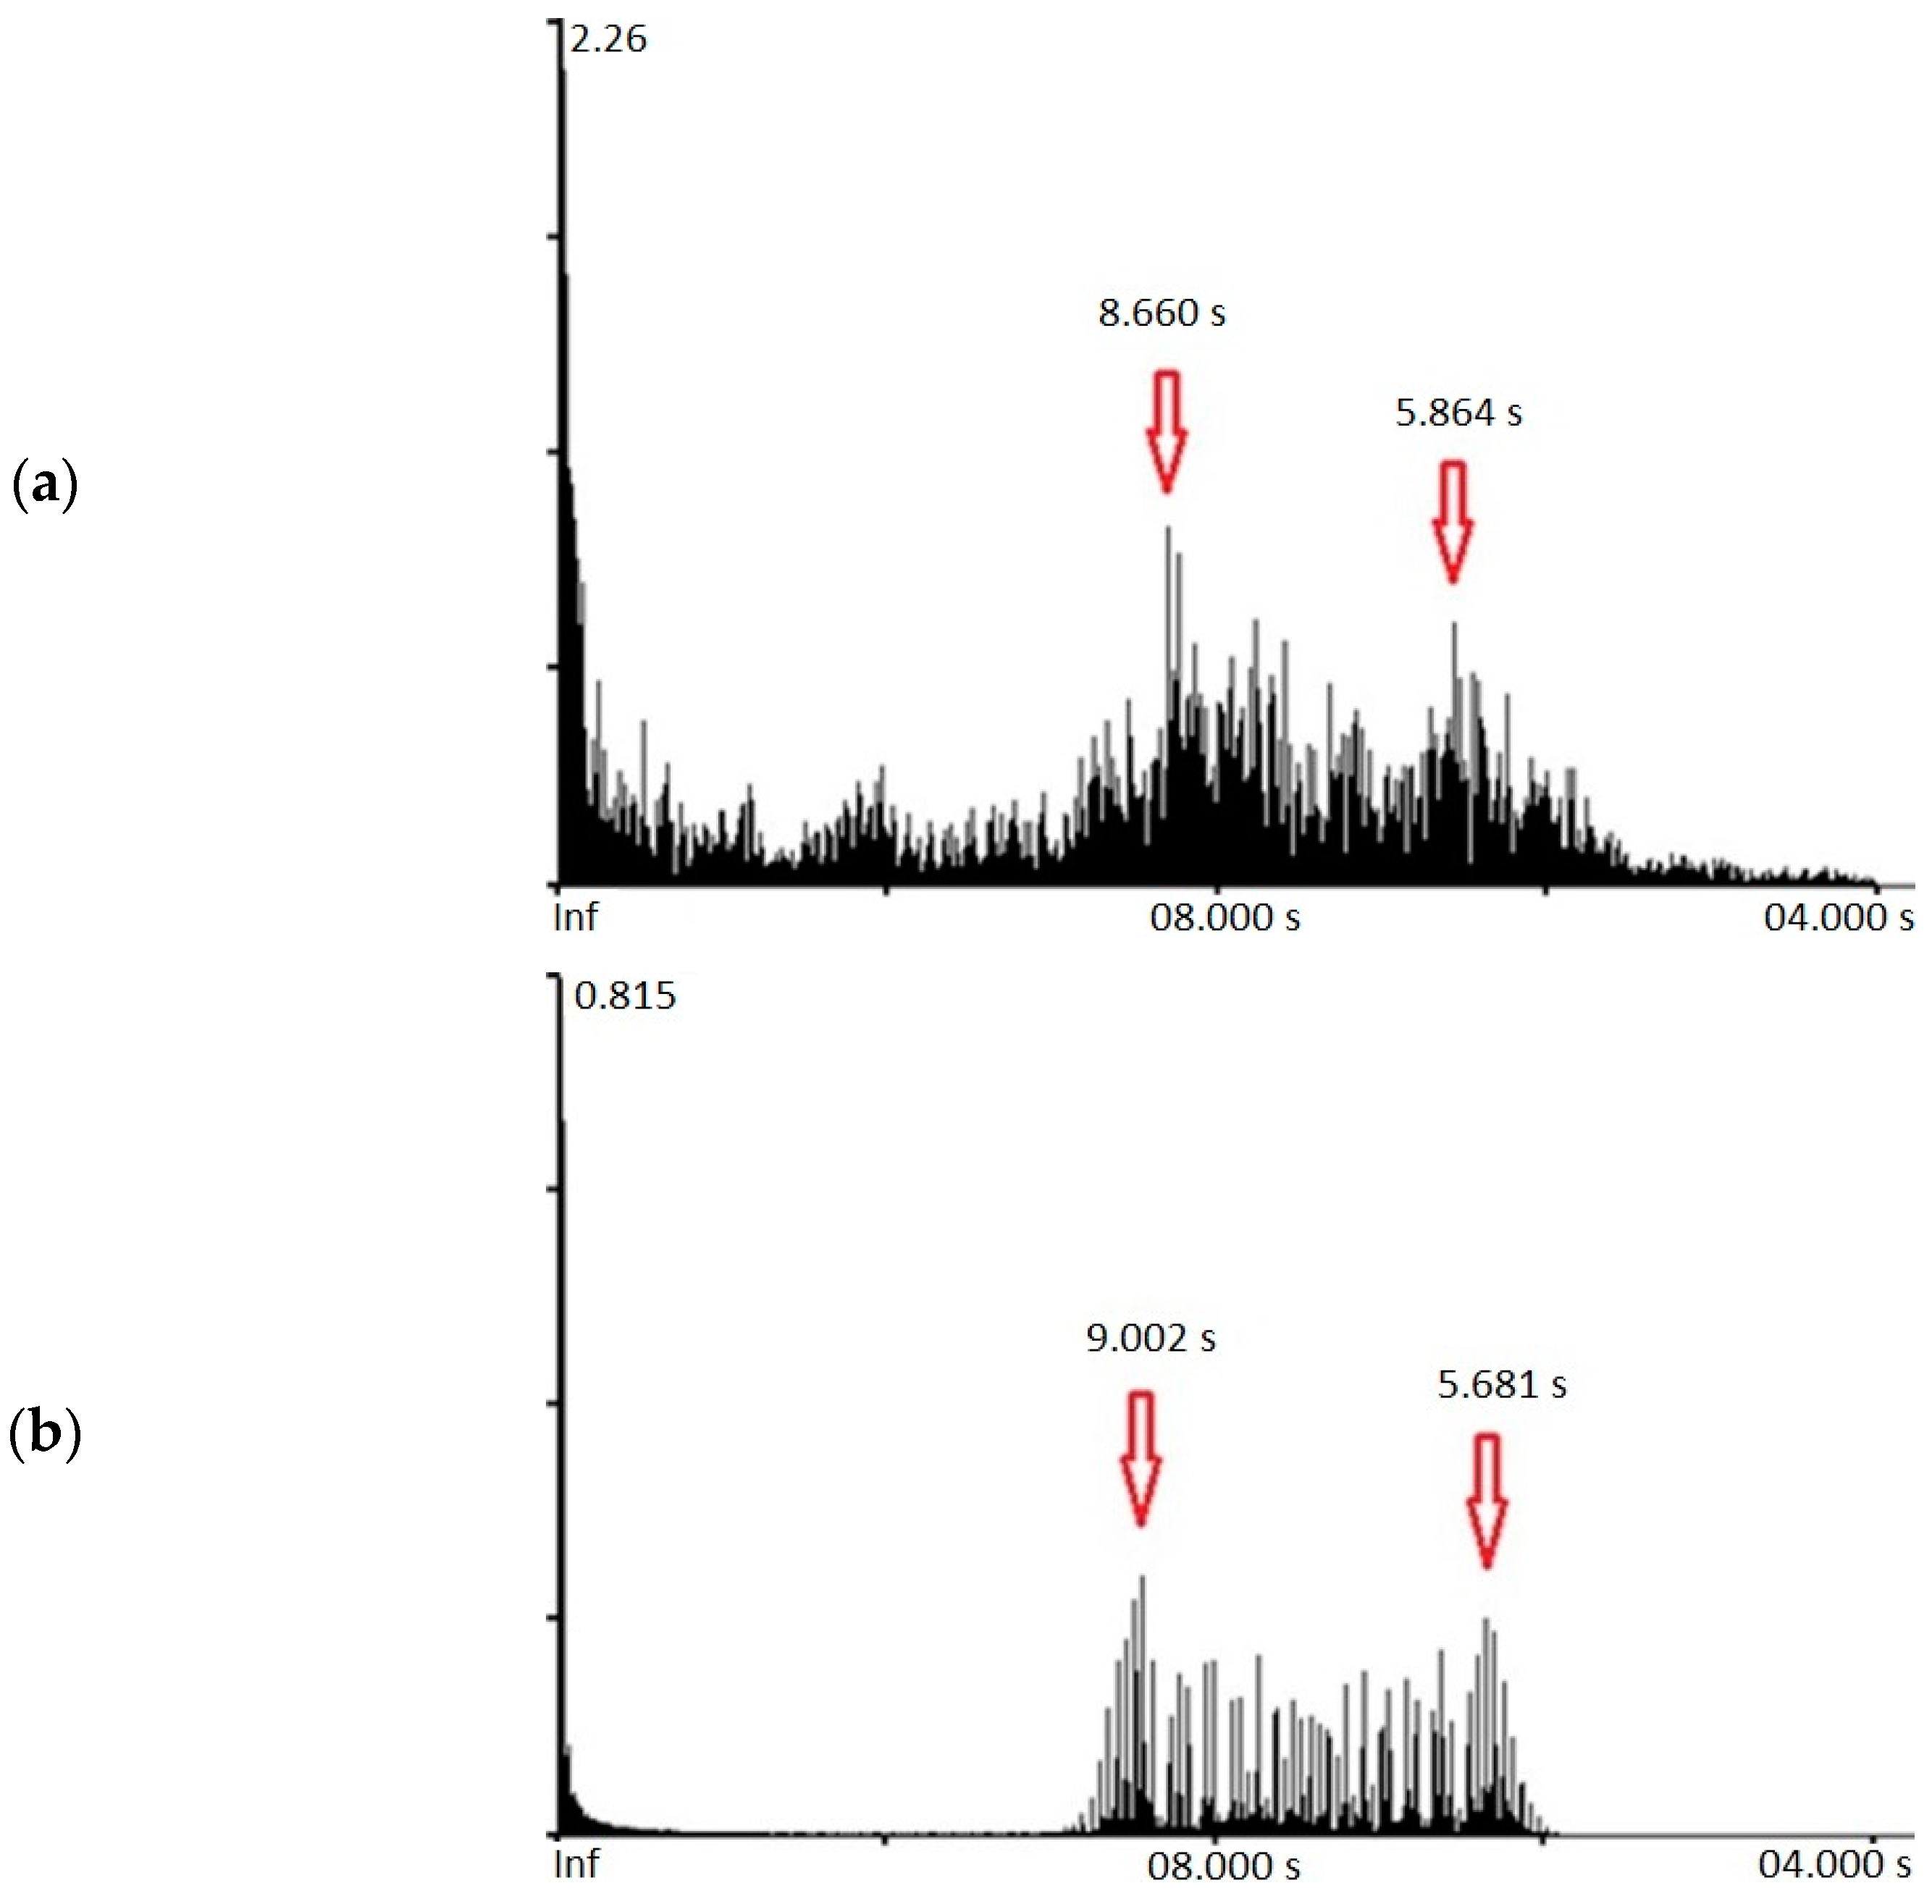
However, as we all perfectly understand, the change in the period is not only associated with the processes of modulation of wind waves but are also associated with dispersion during wave propagation. In order to account for this variance, we substitute period change Function (1) into the expression describing Modulation (6). As a result, we obtain an equation describing both the modulation process and the dispersion of wind waves during propagation.
Figure 10 shows the spectrum of wind waves within a period of 5.2 s obtained based on experimental data; in the studied fragment, there is a pronounced dispersion of waves ∆
T = 0.4 s, and seiches within a period of 18 min are present. The figure also shows the spectrum calculated based on Expression (7), according to the initial data indicated above.
As you can see in
Figure 10, there are now four characteristic maxima in the spectra. The first two are responsible for the modulation of wind waves on seiches, and the other two are responsible for wave dispersion. In this case, the spectrum width does not depend on the modulation index. The modulation index is responsible for the amplitude of spectrum maxima, and the change in the wave period due to dispersion during propagation is responsible for the spectrum width.
6. Conclusions
The method of studying modulation effects presented in this work, which is based on regression analysis and the general functions of the period change, has shown good results when applied to studies of the modulation of wind and swell waves on tidal oscillations. Using this method, it was shown that, in general, when wind waves are modulated by tides, waves with large a period and amplitude are concentrated in the upper points of the tide. However, when extraneous wave processes, such as seiches, occur, the modulation of wave amplitude can have an extremum in the lower tide point, i.e., the modulation of wave period and its amplitude will be in antiphase.
Studying the modulation of wind waves on seiches by the above method, we identified several main types of modulation: “two-tone” and “four-tone”. These types of modulation are well described using the common frequency modulation, Equation (6). When comparing the spectra of the experimental data and the spectrum calculated using the frequency modulation formula, we identified two spectral maxima, the first of which is responsible for the main wave period, and the second of which is responsible for the modulation process. From these two characteristic maxima, we can speak with good confidence about the presence of seiche oscillations and their modulation of wind waves, while the width of the spectrum depends on the modulation index, i.e., the number of wave modulations per one period of the seiche oscillation.
The obtained expression for frequency modulation accounting for Dispersion (7) well describes these phenomena. When comparing the spectra of the experimental data and the spectra calculated using this expression, four characteristic spectral maxima were identified. The first two are responsible for modulation on seiches; the rest are responsible for dispersion during propagation. In this case, the modulation index affects the amplitude of the maxima, and the change in period is responsible for the width of the spectra. In the presence of these maxima in the spectrum, we can speak not only about the presence of seiche oscillations, but also about the fact that the wave process modulated by them is not local in nature but most likely came from another point of the water area since its period varies linearly due to dispersion during propagation.
The efficiency of the considered method for studying the interaction of wind waves with wave processes of lower frequency—twelve-hour and round-the-clock tides and seiches—can be increased by combining it with space monitoring methods based on the analysis of optical and radar images, especially in closed water areas and in the shelf zone of the World Ocean.


