Article

Experimental Study of Large-Temperature-Range and Long-Period Monitoring for LNG Marine Auxiliary Based on Fiber Bragg Grating Temperature Measurement

1
Marine Engineering College, Dalian Maritime University, Dalian 116026, China
2
National Center for International Research of Subsea Engineering Technology and Equipment, Dalian Maritime University, Dalian 116026, China
3
School of Electrical and Electronic Engineering, Nanyang Technological University, 50 Nanyang Avenue, Singapore 639798, Singapore
*
Author to whom correspondence should be addressed.
J. Mar. Sci. Eng. 2021, 9(9), 917; https://doi.org/10.3390/jmse9090917
Submission received: 7 August 2021 / Revised: 19 August 2021 / Accepted: 20 August 2021 / Published: 24 August 2021
(This article belongs to the Section Ocean Engineering)

Abstract

:
Temperature is a key variable to evaluate the energy consumption and thermodynamic performance of traditional marine auxiliary machinery, chillers and piping systems. In particular, for the cryogenic storage tanks and fuel gas supply systems of LNG ships, explosion-proof and low-temperature-resistance properties bring new challenges to the onboard temperature measurement and monitoring. In order to promote the development of high-performance and safer monitoring systems for LNG ships, this paper adopted fiber Bragg grating (FBG) technology to ensure the measurement safety and accuracy of temperature sensors, and performs a series of experiments in a large temperature range on the chiller, pipeline, and cryogenic storage tank of an LNG ship and their long-term reliabilities. Firstly, the principle and composition of the designed FBG temperature sensors are introduced in detail, and the measurement accuracy and range of different metal-coated optical fibers were tested in a large temperature range and compared against the traditional thermistors. Then, the effects of different operating conditions of the LNG marine chiller system and cryogenic storage tank on the temperature measurements were investigated. In addition, the drift degrees of the optical fibers and industrial thermistors were analyzed to figure out their reliabilities for long-term temperature measurements. The results showed that for the long-period (16 months) monitoring of LNG ships in a large temperature range (105–315 K) under different shipping conditions, the optical temperature measurement based on FBG technology has sufficient accuracy and dynamic sensitivity with a higher safety than the traditional thermoelectric measurement. Besides, the ship vibration, ambient humidity, and great temperature changes have little impact on its measurement reliability and drifts. This research can provide references and technical supports to the performance testing systems of LNG ships and other relevant vessels with stricter safety standards.

1. Introduction

According to the statistics, 80% of the world’s freight is performed by ships. Convenient transportation has not only promoted the rapid development of shipping logistics, but also brought the continuous increase in energy consumption during transportation [1,2]. With the increasingly stringent emission standards for ships, the use of low-carbon and carbon-neutral fuels is critical to the International Maritime Organization’s greenhouse gas reduction targets [3]. It is predicted that by 2030, under different CO2 reduction paths, liquefied natural gas (LNG) will provide 40–80% of the fuel mix assistance [4]. It can be seen that LNG power is undoubtedly the most effective alternative technology for petroleum ships in the field of ocean shipping or short-distance rivers [5,6]. LNG fueled ships mainly includes two types: LNG single-fuel and dual-fuel engines. LNG carriers generally use LNG as the only energy source, while most other commercial ships adopt dual-fuel engines [7,8]. In order to achieve the aforementioned emission reduction level, it is also essential to use more environmentally friendly technologies to retrofit all ships in operation. At present, the major reasons for the large amount of ship energy consumption are listed as follows [9,10]: (1) the areas of ship cabins and cargo warehouses have increased dramatically; (2) the variety of marine equipment is growing rapidly, needing more space (one fifth of the volume is used to arrange equipment); (3) the requirements of crew and cargo for cabin thermal comfort are increased. The demand and consumption of conditioning and refrigeration are gradually increasing. Energy saving in ship cabins and auxiliary equipment is the most promising, direct, and effective way to save carbon emissions during the life cycle of ships. For ships navigating in the tropics, the annual average ambient temperature and relative humidity at sea are 308 K and 85%, respectively. According to classification societies and ship construction standards, new ships need to maintain the cabin temperature between 295 and 303 K to provide a favorable environment for ship navigation radar and other electronic equipment, crew thermal comfort, and cargo storage [11]. However, the power consumption of marine auxiliary equipment, especially the chillers and blowers, is very high, accounting for about 60% of the total energy consumption of large cruise ships [12]. It brings about a series of energy-saving and emission-reduction issues, which many scholars are currently conducting energy-saving research on. These studies include auxiliary refrigeration cycles [13], dehumidification systems [14], ship cabin energy balance [15], external material insulation [16], and design optimization of relevant equipment, including the research on heat exchangers to balance the convective heat transfer and fan ventilation.
In addition to energy-saving studies of these systems and equipment, the accuracy of relevant measurement methods and the stability of long-term monitoring are also the key factors that affect the working conditions of the systems and equipment as well as their emission reduction and energy conservation. Especially in LNG ships, cryogenic fuel is usually stored in cryogenic tanks of 111 K and 0.1 MPa, which will be gasified into natural gas at ambient temperature through the gas supply system and then supplied to the engine for combustion [17,18]. The temperature difference in the above process is as high as 180 K. How to select an appropriate low- and medium-temperature measurement system to monitor the fuel storage and supply status of LNG ships in real time is a key issue to ensure the navigation safety of LNG ships. Since LNG is flammable, it may explode due to the spark of the sensor circuit, and the real-time temperature monitoring of LNG is risky, which brings great challenges to the traditional electrical measurement system [19]. At present, there is no universal system that can provide a long-term, reliable, and accurate measurement for the performance of LNG system, marine chillers, and their corresponding ventilation pipes. In general, the measurement system must be customized according to the measurement accuracy and the required accuracy [20,21]. Different suppliers provide different temperature measurement solutions with different degrees of accuracy, long-term stability and reliability, and a qualified third party is required to evaluate the quality of the delivered measurement system. The various components of the measurement system will affect the measurement accuracy, e.g., the sensor selection, installation method testing, electrical connection and wiring, transmitters, data loggers, etc.
The traditional LNG temperature monitoring method usually uses an infrared thermal imaging camera [22,23] or multi-point embedded thermal resistance [24] to establish a temperature monitoring system to obtain the temperature map of the external tank, communicate the thermal imager and the computer, and process the thermal image of the storage tank. However, these methods are often affected by the sway, vibration, humid working conditions, and other aging factors on ships. Based on the above characteristics, a fiber Bragg grating measurement technology with the advantages of insulation, non-inductive electrical property, water resistance, extreme temperature resistance, and corrosion resistance has emerged in recent years, and been widely studied and applied in many similar fields. Chen et al. [25] realized hybrid temperature and stress monitoring based on the changes of FBG wavelength and reflectivity. The probe consisted of a pre-annealed grating and steel capillary to overcome the high forming temperature of 600 K and the forming pressure of 2 MPa for the complex braided structure. Ranjana et al. [26] proved the applicability of FBG temperature sensors for field temperature measurements when the flexible planar supercapacitors were bent. It achieved a good accuracy and high sensitivity, which showed possibilities for the flexible planar supercapacitor temperature management system. Bakaic et al. [27] tested Bragg gratings carved on inorganic fibers in proton and neutron fields, and indicated that the radiation would not affect the performances of temperature and pressure sensors. This technique was subsequently applied to the measurements of nuclear medicine liquid isotopes. Pang et al. [28] proposed a method to simultaneously measure the temperature and surrounding refractive index with a coated long-period FBG based on a modal barrier zone. The linearity of the measured temperatures was as high as 0.999, and its sensitivity was four times higher than the previous research. Dutz et al. [29] set up a fiber-optic sensor system in the chemical reactor, and conducted a two-year test at a temperature of 150–500 °C. It was found that the optical fiber temperature data and the three-point thermocouple array data values were in good agreements, and the high-accuracy and low-drift properties proved the great potential of optical fiber sensors in industrial applications. Yu et al. [30] proposed a laser ultrasound visualization system with a heat-resistant FBG for high-temperature in situ damage diagnosis, which could perform stable measurements at 1000 °C. Zhang et al. [31] studied the temperature, strain, and humidity sensitivities of FBG using near-infrared low-loss multimode perfluorinated polymer fibers, and measured the corresponding linear displacements of Bragg wavelength. All these studies are the applications at high or normal temperatures. In fact, FBG also has a great effect at the cryogenic temperatures. Thekkethil et al. [32] carried out mathematical simulation modeling of cryogenic flowmeter based on the principle of FBG, and proposed a mathematical model to predict its low temperature operating characteristics. Li et al. [33] designed a dynamic temperature experiment using oxygen-free copper in the range of 30 to 273 K, and concluded that the relationship between the temperature and the gauge coefficient of silicon-based FBG could be characterized with a third-order polynomial. Cristian et al. [34] improved the FBG sensitivity under low temperature conditions by depositing a metal coating with a high expansion coefficient, which largely alleviated the problem that the sensitivity of fused silica FBG sensors decreased significantly with the decrease of temperature. Li et al. [35] applied a conductive nickel layer on the FBG through two electroless plating, electroplated the copper, zinc or tin to form a high thermal expansion metal shell, and systematically studied the dynamic cooling of bare and metal-coated FBG sensing characteristics in this process.
Summarizing the above-mentioned documents, the current industrial low- and normal-temperature monitoring systems are mostly based on an array of thermocouples or thermal resistors, and few of them are specifically used for the temperature monitoring of marine equipment under severe working conditions. Although the new optical fiber sensor has some basic applications in high temperature and low temperature, it is limited to the research and experimental development based on mechanism and numerical model, lacking of a long-term temperature measurement and drift stability test for the actual system. As for the long-term monitoring of the shipborne low-temperature LNG storage tank and the room-temperature chiller system, there is no public literature reports. Therefore, this paper conducts the long-term reliability temperature monitoring experiments for the LNG storage tank and chiller-piping system of LNG-powered ships based on FBG technology. Under the premise of the safety and accuracy of FBG temperature sensors, the measurement accuracy and range of different metal-coated optical fibers were tested, and the influence of different working conditions on temperature measurement was studied. This research can provide relevant experience and technical support for the safety testing of LNG ship system performance.

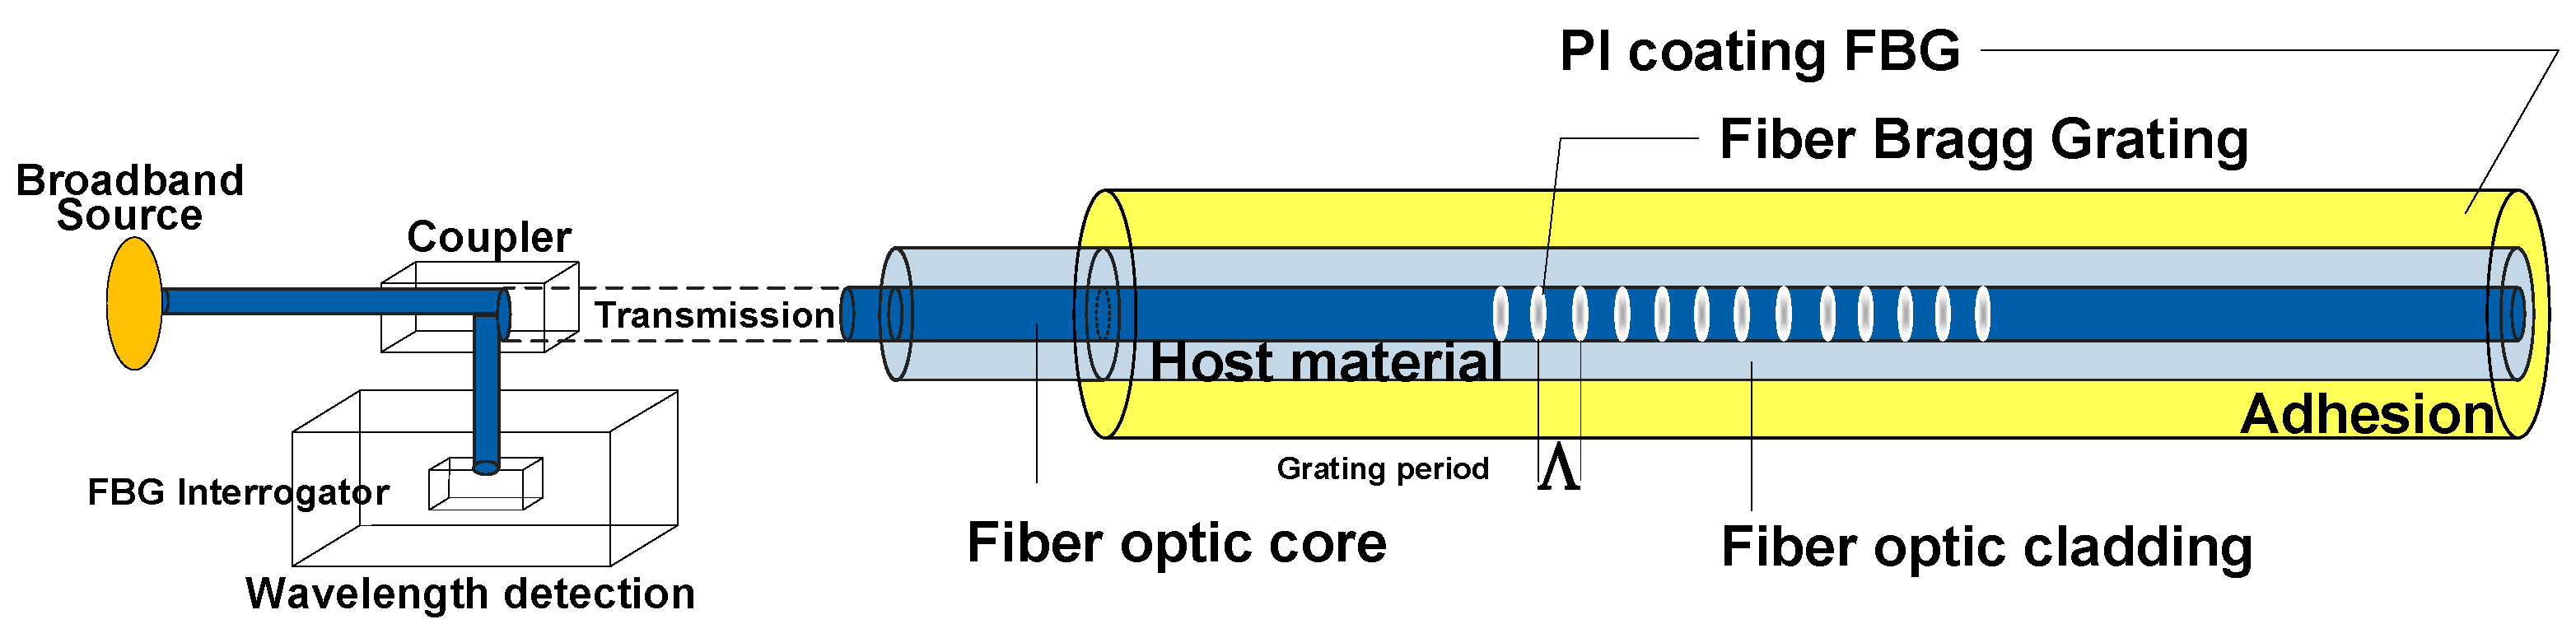
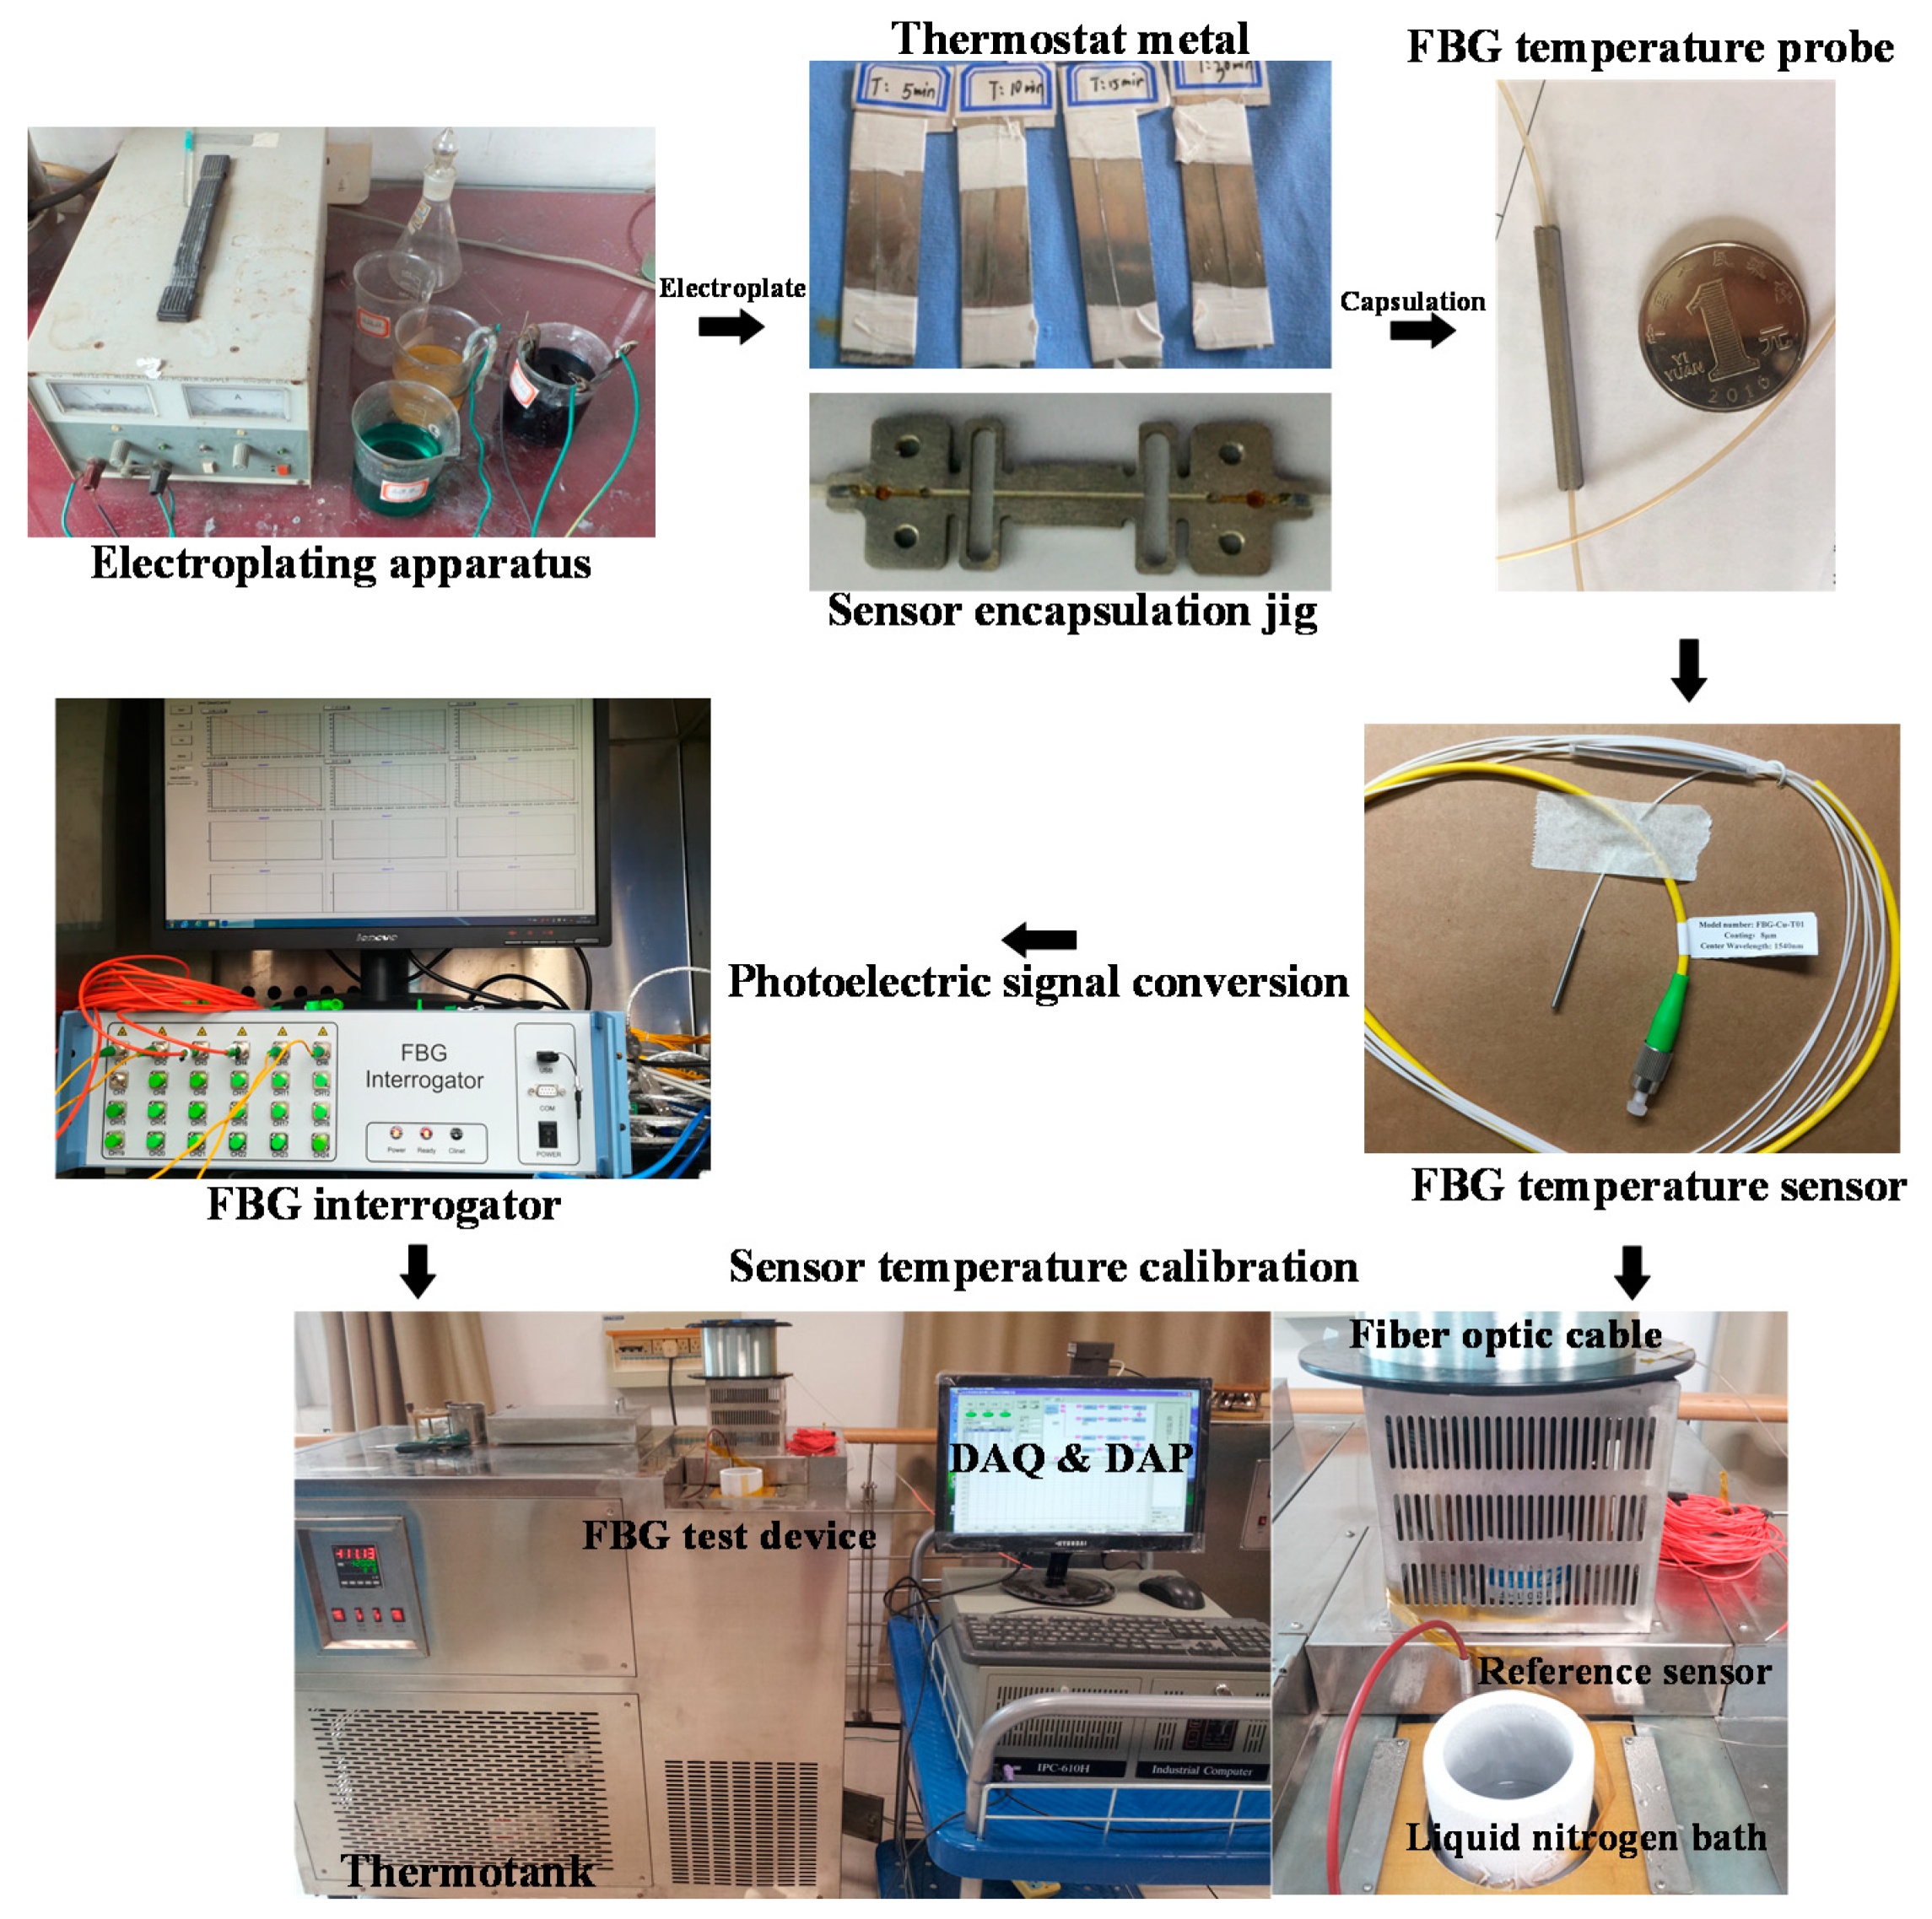
2. Principle and Trial-Production of FBG Temperature Sensor

To meet the low- and medium-temperature measurement requirements of LNG ships, the FBG temperature sensor with a large temperature range is developed. Since the temperature of LNG storage tank is generally above 113 K and the temperature of ship chiller is about 308 K, the measured temperature range for LNG ships is 113 to 308 K. The sensing process of FBG is to obtain the relative change of the measured signal by modulating the Bragg central wavelength with external parameters. The mathematical expression of this process is as follows:
λ b = 2 n Λ
where λb, n, and Λ are the wavelength of the fiber, the effective refractive index, and the grating period, respectively. Since there is a one-to-one correspondence between the grating pitch and the center wavelength of the reflection spectrum, the external factors will lead to the changes of the grating period and effective refractive index. By measuring the wavelength of the reflection spectrum, the interval between the gratings can be obtained. Therefore, the change of reflection wavelength with the strain and temperature is approximated by the following equation:
Δ λ λ 0 = ( 1 p e ) ε + ( α Λ + α n ) Δ T
where Δλ and λ0 are the change in the reflection wavelength and the initial wavelength, respectively. The first term on the right reflects the influence of the strain changes on the wavelength, where pe is the strain optical sensitivity coefficient, and ε is the influence of the strain on the grating. The second term in the equation is the effect of temperature changes on the wavelength, where αΛ is the thermal expansion coefficient, and αn is temperature optical sensitivity coefficient. When performing temperature measurement, the FBG must be kept completely unaffected by the strain. Therefore, it is necessary to use a packaged FBG temperature sensor, which can ensure the properties of the FBG inside the package not influenced by any external bending, stretching, squeezing, or twisting strain.
In this case, the thermal expansion coefficient of the optical fiber is usually negligible in practice. The change of the reflected wavelength caused by the temperature change can be mainly determined by the temperature optical sensitivity coefficient of the optical fiber. The detailed principle and structure are shown in Figure 1. The FBG temperature sensor is an optical fiber bonded to the host material in advance, and the outer coating is wrapped with coated metal and packaged. When the temperature changes, the outer temperature-sensitive coating metal and the inner host material produce a tensile stress and affect the grating period of the optical fiber. Thus, the corresponding relationship between the external temperature and FBG is established. During the measurement, the pre-passed broadband light source and the reflected wave passing through the FBG temperature sensor are integrated in the coupler and enter the interrogator for the wavelength detection and analysis.
Figure 2 shows the electroplating, package, and testing processes of a specific FBG temperature sensor, including the thermal metal plating of fiber optic cladding, actual trial-produced sensor, FBG interrogator, and temperature linearity test. Firstly, different FBG plating methods are used to uniformly electroplate the metals with different temperature sensitivities on the inner surface of the packaging layer, and finally form the FBG sensor. As shown in the figure, the probe of the encapsulated FBG sensor is almost the same with the thermocouple or thermal resistance sensors in size. This kind of sensor only needs light signals, and no current passes during the measurement process. Therefore, it does not generate heat, reflecting a superior safety. The FBG interrogator is used to collect the spectrum change caused by the temperature change of the front-end FBG temperature sensor and decode it into an electrical signal. In a thermotank, the liquid nitrogen fluid is used to create a measurement environment with a temperature between 113 and 308 K. The trial-produced FBG temperature sensor is tested for the photoelectric response through the fiber optic cable and interrogator. Finally, the data collected and analyzed by computer and the high-precision temperature reference are used to calibrate the FBG temperature sensor.

3. Experimental Measurements of Marine Auxiliaries

3.1. Temperature Measurement of LNG Tank

To simulate the temperature environment inside the shipborne LNG storage tank, a low-temperature storage tank was designed with liquid nitrogen as the cooling medium to facilitate the test of the FBG sensor, as shown in Figure 3. Three temperature measuring devices were inserted into a 300-L cryogenic liquid nitrogen Dewar bottle at different axial positions. Each device was bound with two copper core test terminals at the upper and lower positions, which contained an FBG temperature sensor and a high-precision thermocouple reference temperature probe. The experiments were carried out on the feedback temperature of the FBG sensor in the cryogenic storage tank under different location conditions, and the results were compared with the thermocouple temperature sensor at the same location. By controlling the heating power of the heating coil at the bottom of the low-temperature Dewar, the ambient temperature in the low-temperature Dewar can be changed. It is used to simulate the precise monitoring scene of the internal temperature changes of different LNG storage tanks caused by external heat leakage in the LNG ship fuel storage tank.
The testing process and principle can be divided into the following steps: (1) FBG temperature measurement technology was used to arrange sensors in the upper, middle, and lower positions of the low-temperature liquid nitrogen storage tank to collect three groups of temperature in the storage tank, and the same position was measured by accurate resistance temperature detector (RTD) as the temperature reference; (2) opening the bottom or surrounding heating module to simulate the internal temperature change of the tank caused by heat leakage in the external environment, that is, the bottom or surrounding heating device released heat to the tank, promoted the evaporation of liquid nitrogen in the tank, or controlled the heat generation to cause the liquid nitrogen fluid in the tank to roll; (3) continuous optical and electrical signal acquisition and transmission were carried out, in which the optical signal of FBG was imported into the interrogator and converted into specific temperature data, and the electrical signal of RTD was imported into the acquisition device and converted into temperature data; (4) the interpolation between the two measured values in the corresponding state was imported into the software to judge the accuracy of FBG temperature measurement method. It is worth noting that the precision RTD is an industrial-grade high-precision sensor certified by the manufacturer, and its accuracy is listed in the following sections. Compared with the traditional RTD electrical signal temperature measurement and transmission process, the FBG sensor adopts optical signal in the measurement and transmission section, which has no risk of flammability and explosion. It is very suitable for the temperature monitoring of flammable and explosive goods, various chemicals, LNG, LPG fuel, and other cargo ships.

3.2. Temperature Measurement of Chiller and Pipeline System

The principle of ship ventilation and air conditioning chiller system (Figure 4a) is explained as follows. Firstly, the fresh air at a certain temperature outside the cabin enters the fan coil system through the filter element and the blower, and transfers the cooling and ventilation load from the room to the chiller and auxiliary boiler. Secondly, the chiller starts to work and pumps the chilled water of the specified temperature to the refrigeration coil. Through the feedback of the temperature sensor, the heat is transferred from the air processing unit to the cooler evaporator. The air at a certain required temperature is transported by the fan from the duct to the cabin, and after circulating in the cabin, it returns to the front end of the fan coil to mix with the fresh air and circulate again. Then, the temperature feedback is also required in the refrigerant circuit of the chiller. The heat is absorbed by the refrigerant and transferred to the condenser. The condensed water is pumped to the cooling tower. Finally, the indoor heat is transferred from the cooling tower to the outdoor environment.
Figure 4b is the test process diagram of the influence of humidity and condensation temperature on FBG sensor under maritime conditions. Firstly, a controlled air tight chamber is set up, which is composed of a humidity sensor, a controller, and a humidifier. The relative humidity (RH) of the chamber can vary from 65% to 95% to simulate the humidity condition of maritime ships. At least 3 sets of temperature sensor sleeves (composed of 3 calibrated RTD and 3 FBGs) are installed in the independent bypass of water chiller, with the accuracy of ±0.03 K or higher, flow, and humidity test at the same time. Secondly, the first group of temperature sensor 01 is set as waterproof (by composite pouring or other waterproof methods) and installed in the cabin pipe, while the second group 02 is installed in the same position and not waterproof. Group 01 and group 02 are installed in pairs with both ends closed as much as possible. A third group 03 with waterproof protection is installed outside the air-tight chamber to provide accurate temperature readings without interference from humidity. Finally, the humidity inside the laboratory is measured twice a week by hand-held humidity recorder to provide the humidity distribution curve of the water chiller room and estimate the extreme working condition range of the water chiller room.
Figure 4c shows the specific form of the temperature test for the bypass pipeline of the chiller unit, in which the chiller unit performed the mixed recovery and reuse of the chilled water through the bypass branch. The main test points were the inlet and outlet of the mixed water end of the dispersion system, the fan coil, the pipe reducing side, and the corresponding end. The FBG sensor insertion depth, pipe humidity, pipe vibration, and cold-water mixing distance are tested, respectively.
Figure 4d is the test chart of the influence of the mixing end of the chiller cold-water supply on the FBG temperature reading accuracy. In the experiment, at least four sets of temperature measuring sleeves were installed in the mixing end header of the auxiliary cooling system, each of which contained an FBG sensor and an RTD sensor with a calibration accuracy of ±0.03 K or higher to study the influence of cooling water mixing of different chillers on the main pipe temperature reading. Four temperature sleeves were placed at 4D, 6D, 8D, and 10D, respectively, from the cooling water mixing point. A thermowell with calibrated RTD was installed outside 10D, where the heat distribution was supposed to be stable. The rest of the thermocouple installation and measurement was compared with the 01 end in the form of temperature to determine the best measurement location of thermistor. Finally, the best location of the FBG sensor is given after summary and analysis.

4. Results and Discussions

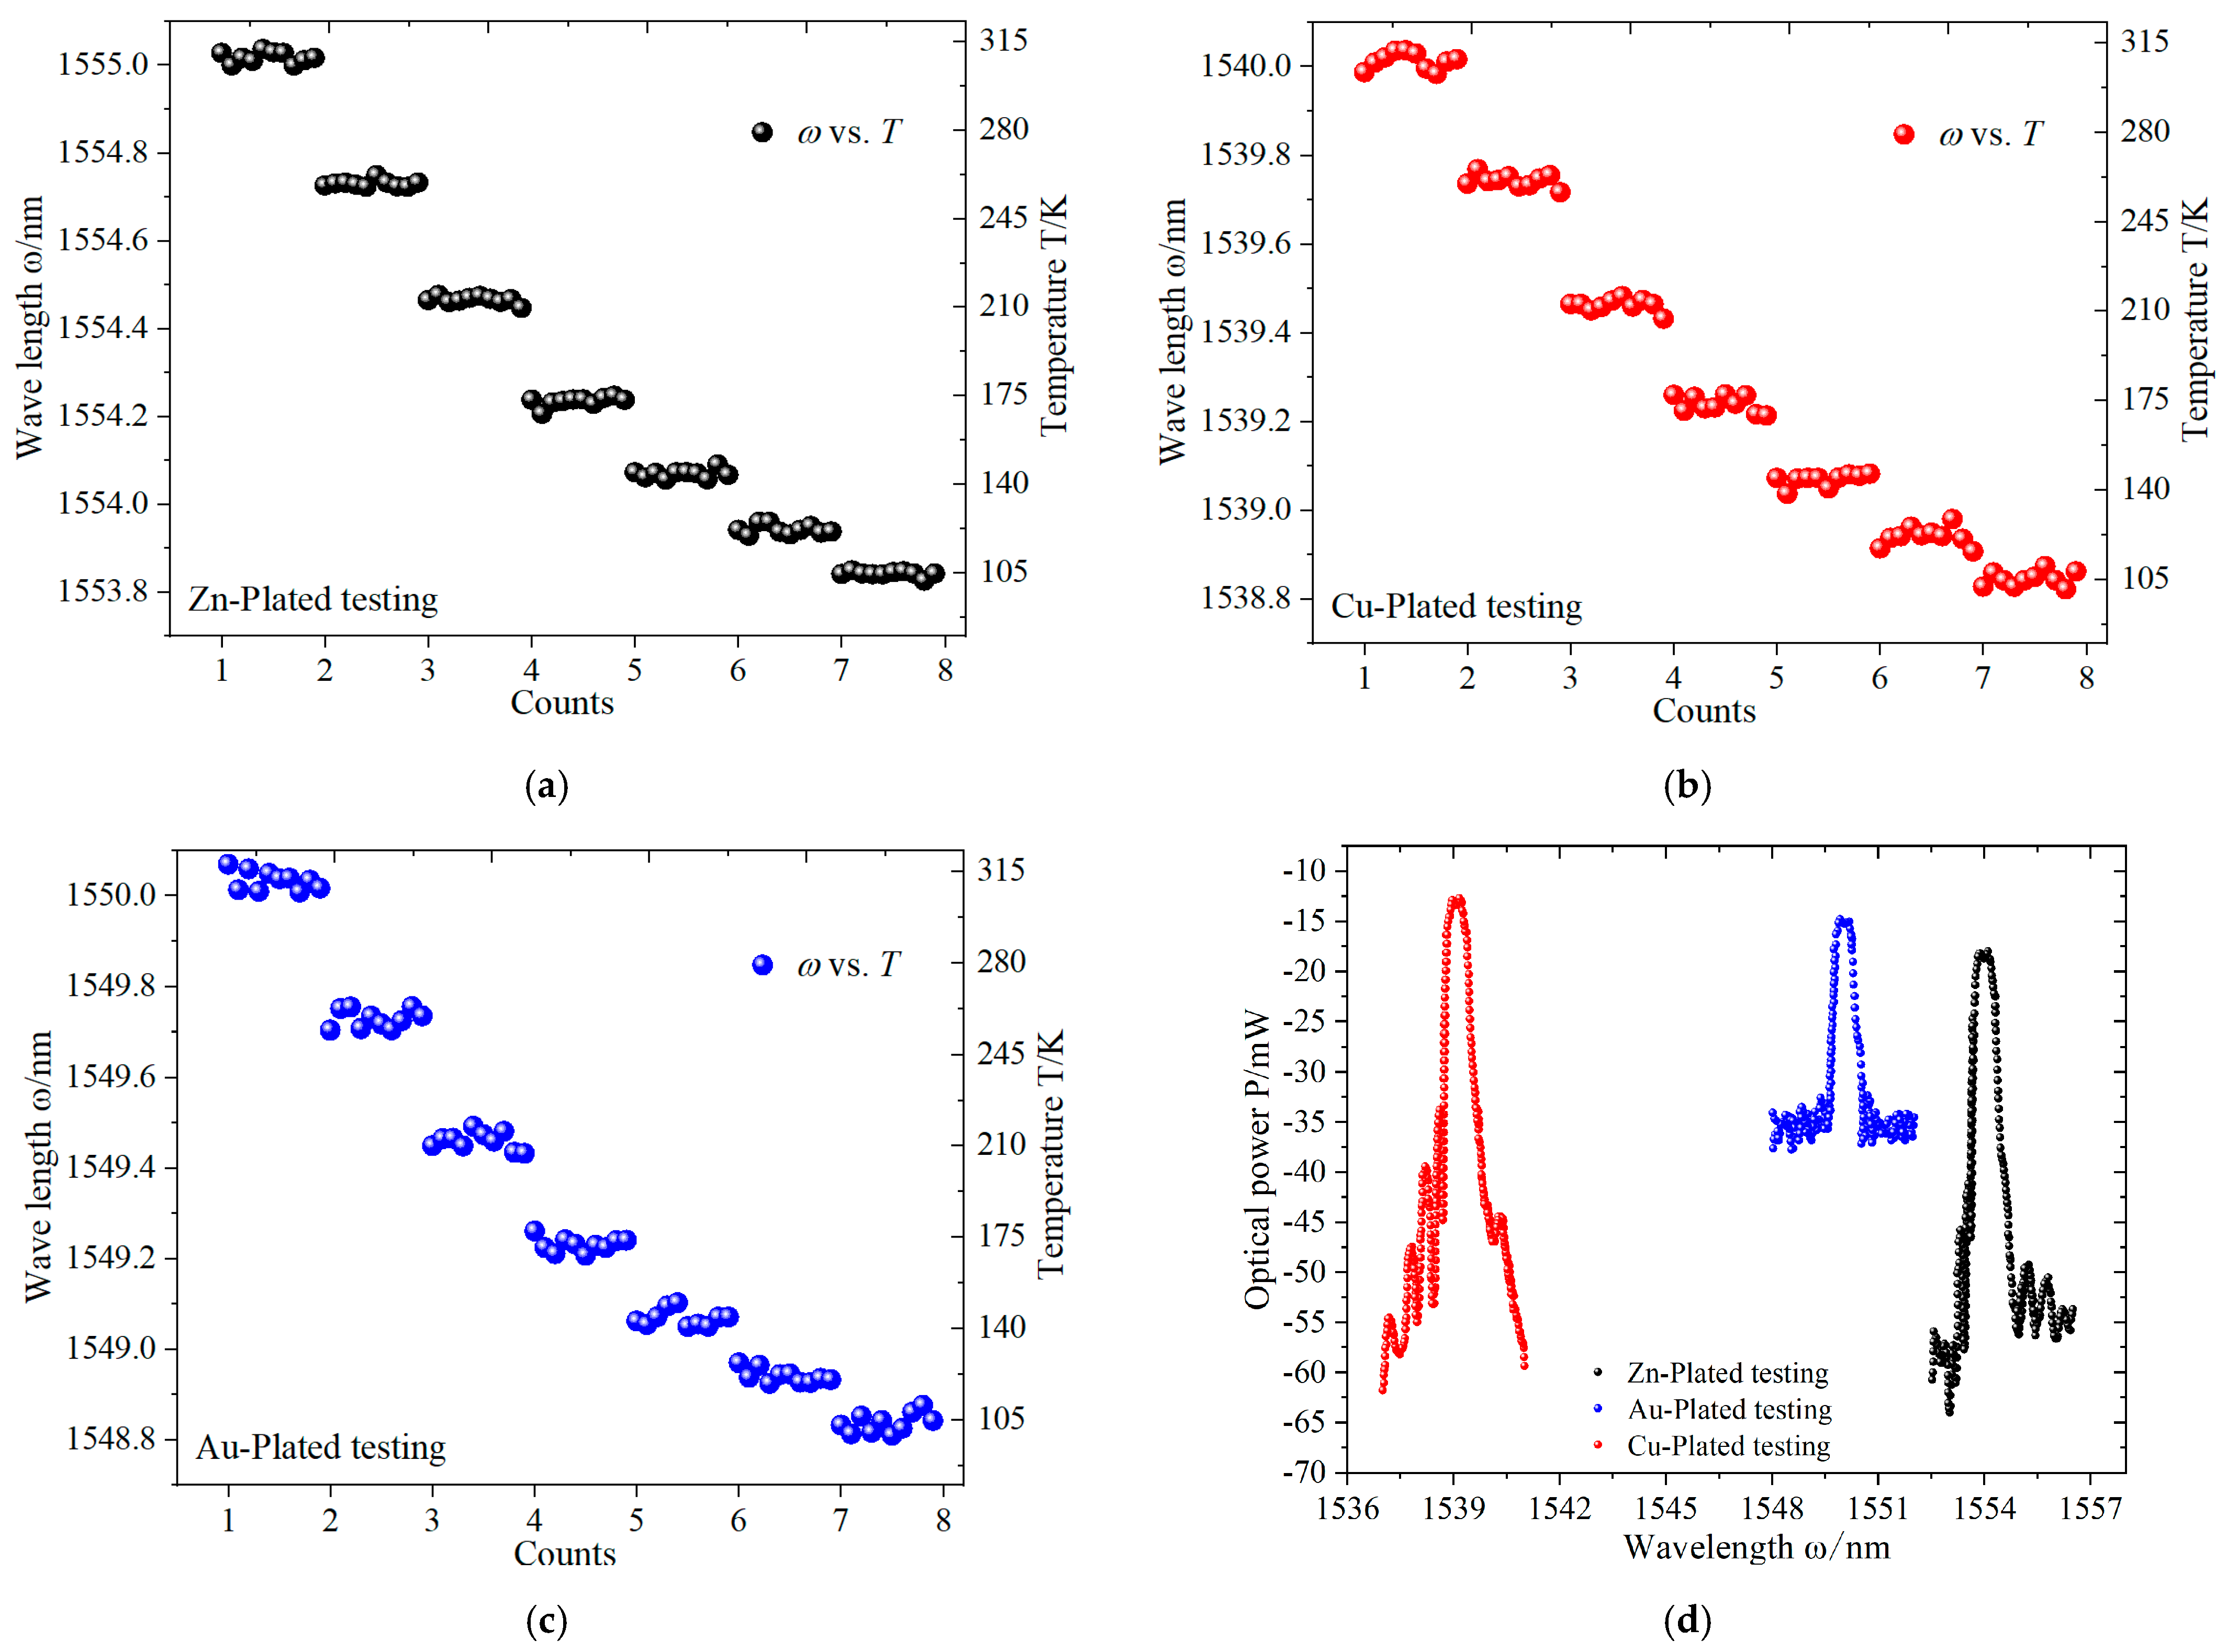
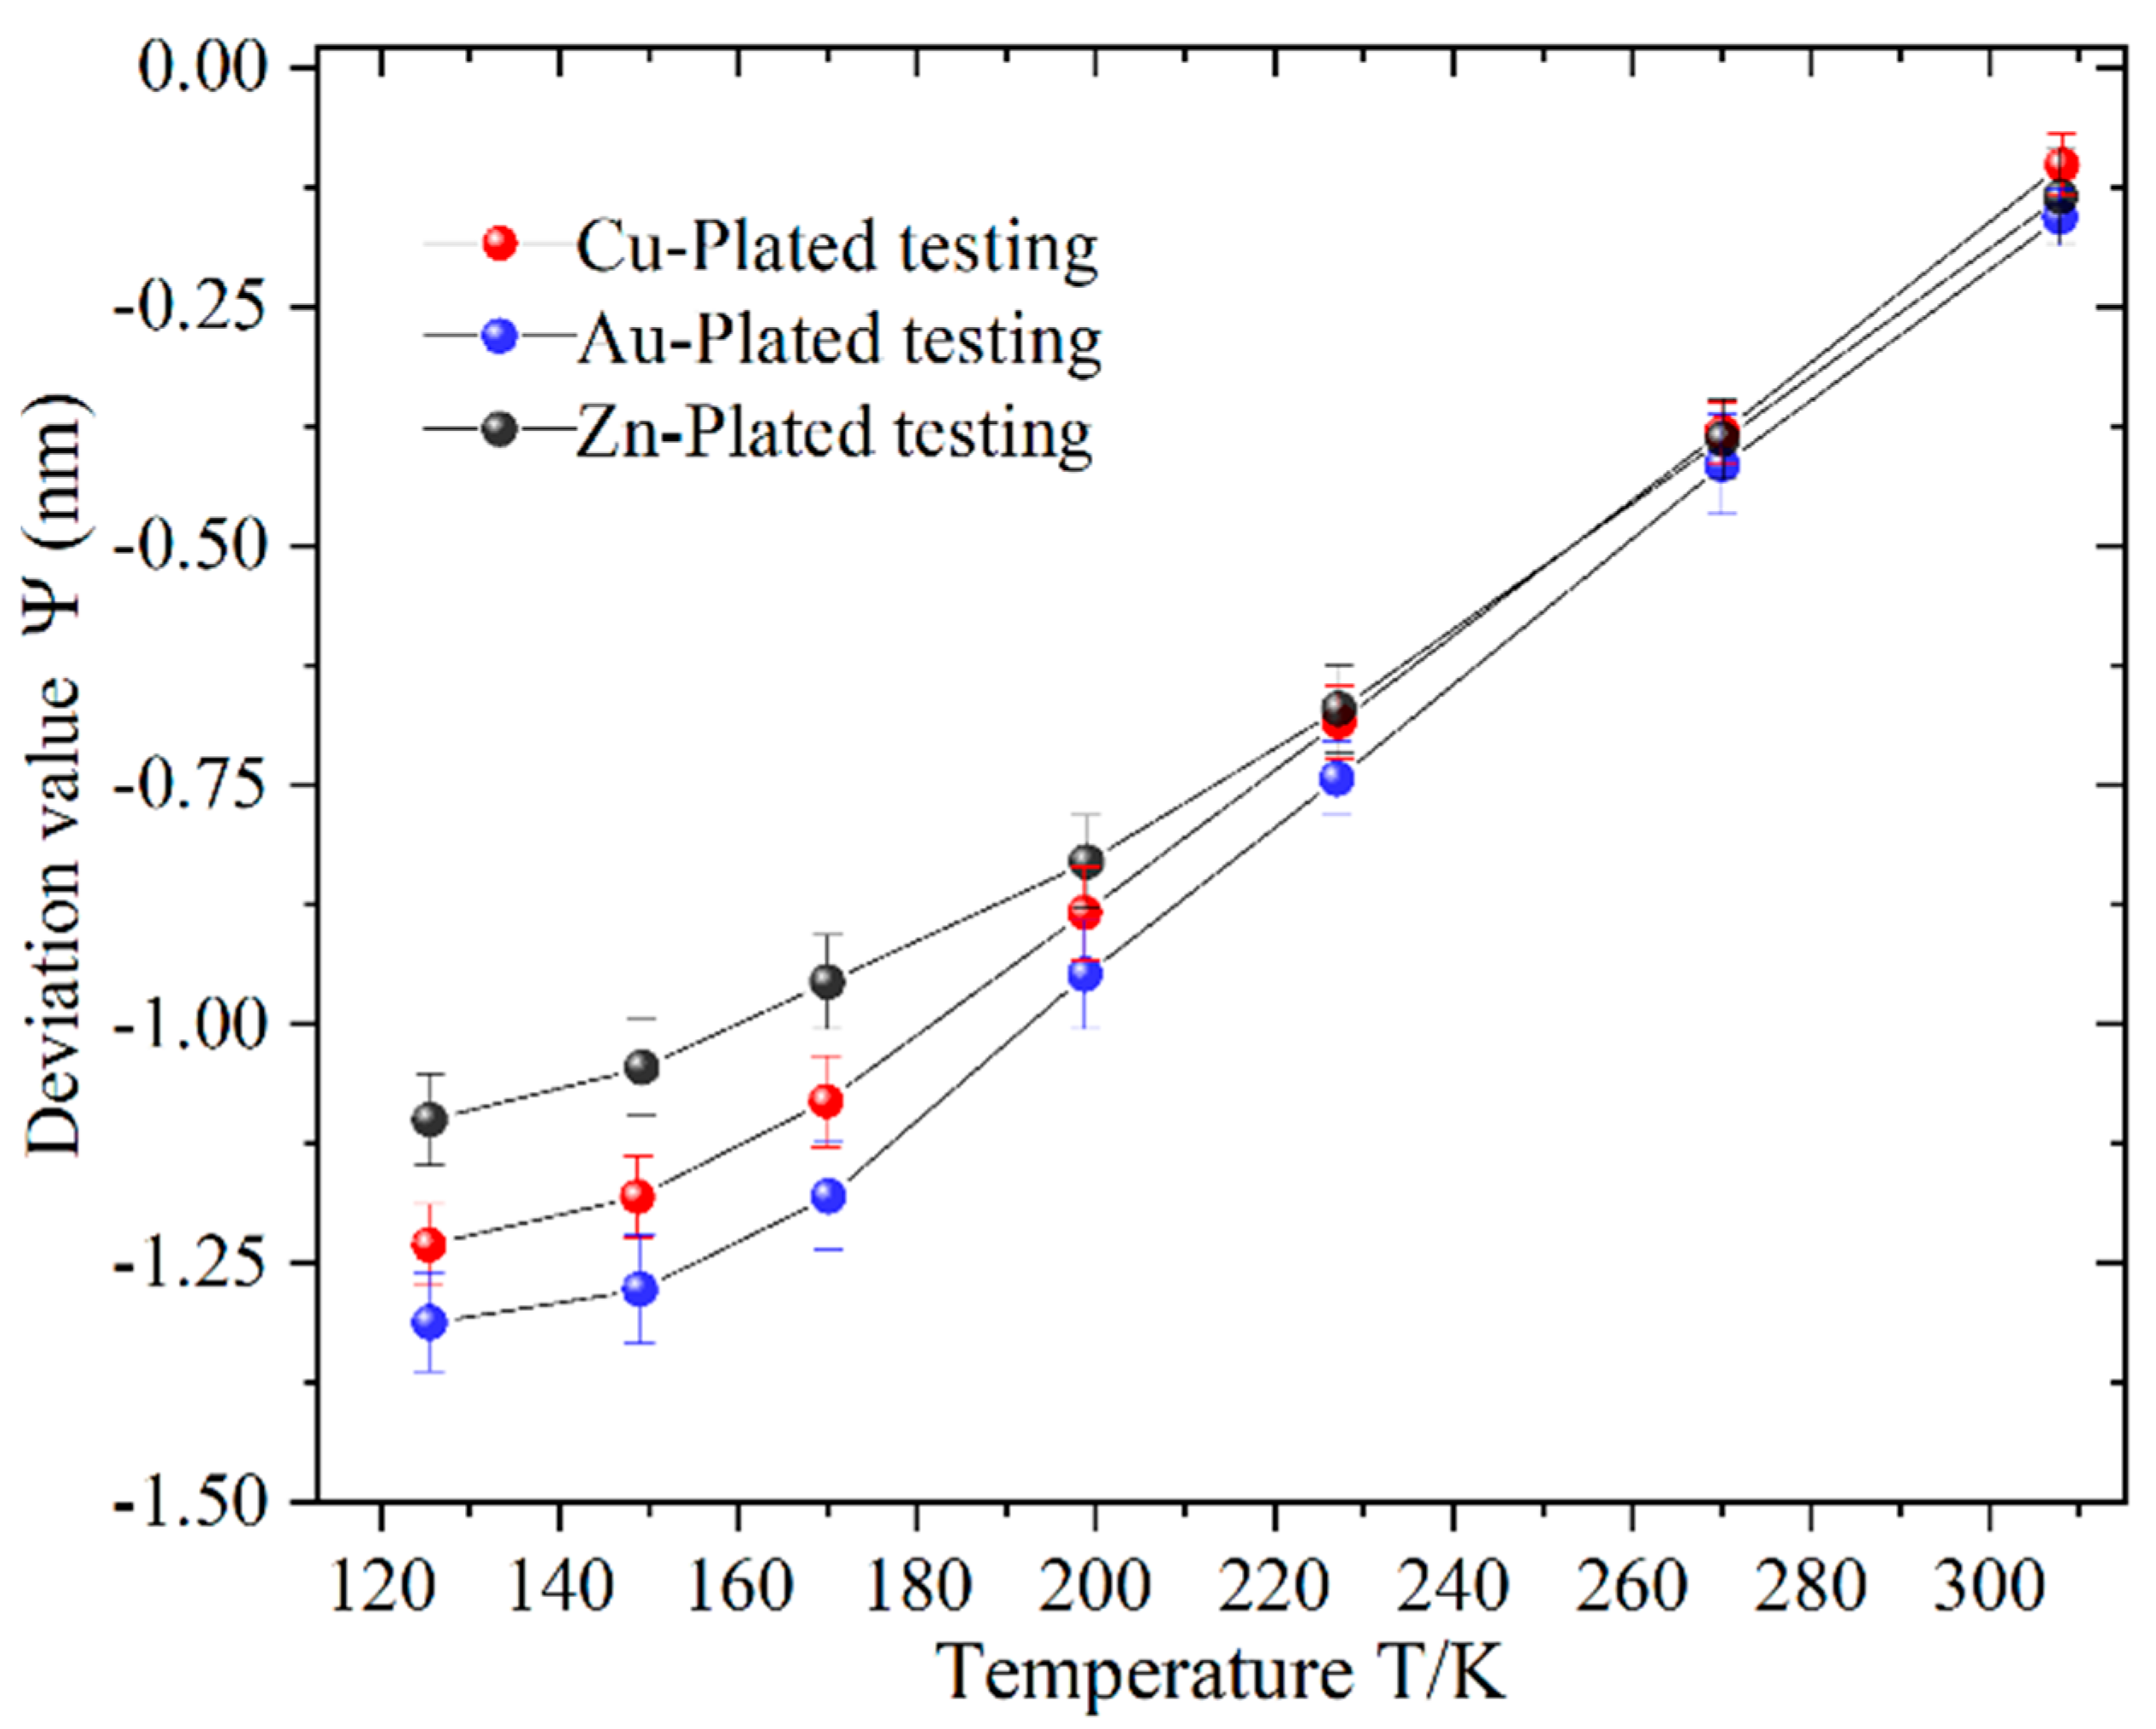
4.1. Influence of Sensor Packaging Materials

The good thermal expansion and contraction characteristics of metals can sense temperature changes, but the strain that reacts in the metal to the slight temperature change is very small. The Bragg grating is an effective method for small strain measurements, so the temperature can be measured according to the strain of the metal body. Therefore, the different metal coatings of the encapsulated optical fiber needed to be tested in order to select excellent sensor specimens. The DC magnetron sputtering coating process was used to coat different metals, and three commonly used coating metals were tested, as shown in Figure 5 and Figure 6. Different metal coatings reflected different strains with the temperature changes, and different strains caused the grating pitch to change. A grating with a specific pitch can reflect a spectrum of a specific wavelength, and the wavelength of the reflection spectrum also changed with the pitch variations. Therefore, Figure 5 shows the corresponding relationship between the temperature and Bragg grating wavelength under different metal coatings. According to the results of different metal coatings in the temperature range of 105 to 315 K, the corresponding grating barrier wavelengths of copper, gold, and zinc coatings were 1540–1538, 1550–1548, 1555–1553 nm, respectively. In the temperature range above 210 K, the copper, gold, and zinc coatings had a similar wavelength trend, but in the temperature region below 210 K, the wavelength of the Bragg grating of the zinc coating was more stable.
Figure 5d shows the feedback optical powers of different metals, which is also a parameter to measure the applicability of the sensor. The feedback optical power brought by different metal coatings was also different. Generally, for the Bragg grating sensor, the greater the optical power, the more accurate the measurement can be sensed. The stronger the optical power, the easier it is to receive the measured feedback information. Figure 6 shows the corresponding relationship between the wavelength shift value and the temperature under different material coatings. The wavelength deviation values corresponding to the gold, copper, and zinc metal coatings increase with the decrease of the temperature, and the maximum absolute value of the offset was 1.31 nm. In the test results, the maximum deviation of the Bragg grating with gold coating was the largest, the copper coating would produce more serious wavelength deviation in the low temperature region, and the deviation value of zinc coating in the low temperature region was the smallest.

4.2. Measurement Accuracy, Stability and Response in Cryogenic Conditions

The low-temperature fuel tank is the core equipment of LNG ship, and its stability, temperature monitoring in the storage tank, and safety protection are the key factors that the ship needs to consider. In the face of flammable and explosive LNG low-temperature fuel, the traditional thermocouple or thermal resistance temperature sensors cannot effectively and stably perform measurements under low temperature conditions of about 110 K, and the sensor may produce sparks when it is electrically driven, which is not conducive to safety. Therefore, it is very necessary to develop an accurate and efficient FBG temperature sensor for the signal transmission without electricity.
Figure 7 shows the measurement error comparison between the representative temperature sensor RTD of the wire power feedback signal and the FBG temperature sensor of the optical fiber transmission under the same measuring conditions. The measurement errors of the two methods were not much different under the same condition, and the maximum deviation was between −0.04 and 0.08 K, which is basically within the acceptable measurement deviation of marine chiller, air conditioning unit, cryogenics bunker, etc. The stability test of the FBG temperature sensor was also carried out in this article. First, the two sensors were tested under the same working condition, and the ambient temperature to be measured was increased, i.e., the power of the electric heating wire continued to increase, and the heating power was kept constant after 16 min until the end of the measurement. The measurement counted 10 per minute, and the data were collected continuously for 30 min. The specific results of the measurement are shown in Figure 7b. The measurement error of the temperature was shown to be divided into two parts: one was the heating process, and the other was the holding process. In the heating process, the measurement deviation of the traditional RTD sensor was relatively large, and the data jumped sharply with the deviation about −0.07 to 0.09 K, while the deviation of the FBG sensor was only between −0.01 and 0.03 K. In the temperature keeping stage, the measurement errors of the two temperature sensors were relatively small.
The response time is also a representative parameter, especially for the measurements in the low-temperature zone of LNG fuel storage tank. It helps to achieve the real-time temperature monitoring of the LNG cryogenic storage tank to avoid further violent rollover of the cryogenic fuel. The measurement result is shown in Figure 8. The green line represents the heating power, the yellow line represents the set target temperature, the red line is the temperature measured by the RTD sensor, and the blue line shows the temperature obtained by the FBG sensor. In about 13.5 min, the heating power was stable at 60 W, and the set target temperature is maintained at 172 K. Because the pressure of LNG in the upper layer of the storage tank was relatively small, the nucleate boiling took place at 13 to 15 min after the start of the test, and the temperature increased rapidly. Due to the temperature control of the heater, the upper RTD and FBG sensors stabilized at the target temperature of 172 K after 15 min. The test results show that FBG can effectively measure the temperature stratification, and its dynamic performance is similar to RTD sensor, implying that the performance of this sensor can meet the condition monitoring of LNG.

4.3. Temperature Monitoring of Marine Chiller System

In the above process, the temperature was a key variable for evaluating cooling energy consumption and efficiency. Temperature changes at different locations in the system were usually the important conditions that determine the compressor operating, fan opening and cooling water circulation. A temperature sensor with a tolerance of 1% was more accurate than a temperature sensor with a tolerance of 5%. The uncertain factors of these measurements may lead to higher energy consumption of ship auxiliary systems. In addition, the stability of the measuring sensors for the auxiliary equipment of the ship is also one of the reliable indicators of a mature system when the ship is running on a long voyage.
The experimental study aimed to investigate the factors that may affect the temperature measurement accuracy of the ship chiller system. The calibration reports of all reference sensors were obtained and verified to ensure the accuracy of the experimental benchmark. Figure 9a and Table 1 show the accuracy and long-term reliability of RTD and FBG temperature sensors. The experiment used a Fluke ultra-precision thermal 10-k thermistor in advance with an accuracy of ±0.015 K for the comparative sampling and monitoring of the operation data in the chiller room, and the average error of the monthly sampling was stored in the data acquisition system. The insertion depth of the reference sensor was 80 mm, and 16 months of data analysis were summarized for comparative analysis. The volatility of RTD was larger than that of FBG, its reading was less stable than FBG, and the accuracies of these two sensors were within an acceptable range. In addition, for the temperature measurement of the pipeline, as the insertion depth of the sensor increased, the standard deviation of the error also decreased. From experimental observations, it can be concluded that at least 50% of the insertion depth can keep the sensor readings within the quasi-acceptable range. Figure 9b shows the influence of the cabin humidity on the measurement sensitivity of the FBG temperature sensor. As the measurement object, two FBG sensors were placed in the humidity control room, and the set point of the humidity controller was set to 80% RH. The wire connection of one sensor was coated with sealant for waterproofing, while the other was not waterproofed. The ultra-sensitive thermal 10-k thermistor used for the experimental temperature reference was exposed to the normal room environment with waterproof. From the long-term measurement results, it can be concluded that the measurement error of the readings of the two sensors against the reference sensor was within 0.05 K, and after 16 months of uninterrupted measurement, there was no obvious increase or reduction. According to the long-period observation, the humidity had almost no effect on the measurement of the FBG temperature sensor in the static fanless room, proving that the temperature sensor without waterproof coating can be used under high humidity conditions.
Figure 10a shows the influence of the neutron pipe elbow and the main straight pipe of the chiller system on the accuracy and drift of the two temperature sensors (2 FBG and 2 RTD). The 4 sensors were installed in two straight pipes and elbow pipes at the same position, and the measured data of the sensors in 16 months were recorded and transmitted to the data storage server for subsequent analysis. The results show that during the entire experiment, the readings of all sensors were within an error range of 0.1 K, but the errors of RTD and FBG installed in the elbows fluctuated greatly. It is because the sub-pipes were mixed to the main straight pipe through the elbow, causing great turbulent flow and vibrations, which affected the measurement effect of the sensor. Figure 10b shows the effect of water mixing in the sub-pipes of each compartment sub-system on the return water of the common header of the chiller system. According to the requirements of the experimental setup, the FBG installation, measurement and data collection were completed at four positions (4D, 6D, 8D, and 10D), where D was the main pipe diameter. Comparing the long-term measurement results, it can be found that for the sensors installed at the positions of 4D, 6D, 8D, and 10D from the mixing point of the main pipeline, only the average measurement error at a distance of 8D was within 0.1 K. Therefore, it is recommended to install the FBG temperature sensor at a distance of at least 8D from the mixing point to maintain its measurement accuracy.

5. Conclusions

In this paper, three main kinds of temperature sensing metal coating materials were tested using the FBG temperature measurement technology, based on which an FBG temperature sensor was developed. This sensor had a light and compact structure with the advantages of high measuring precision and non-electric signal transmission, which was suitable for the system monitoring in flammable and explosive scenes. In addition, the FBG sensor designed in this paper was used to study the influence of different operating conditions on the temperature measurements of LNG low-temperature fuel storage tank, marine chiller, and corresponding pipelines. The major conclusions were summarized as follows:
(1)
The Bragg grating wavelengths of the three metal coatings were obtained in a large temperature range. The corresponding values of copper, gold, and zinc coatings are 1540–1538, 1550–1548, and 1555–1553 nm, respectively. The gold-plated Bragg grating had the largest wavelength deviation in the overall testing range, the deviation of copper coating layer would greatly increase in the low temperature area, and the zinc coating layer had the smallest deviation in the low temperature area;
(2)
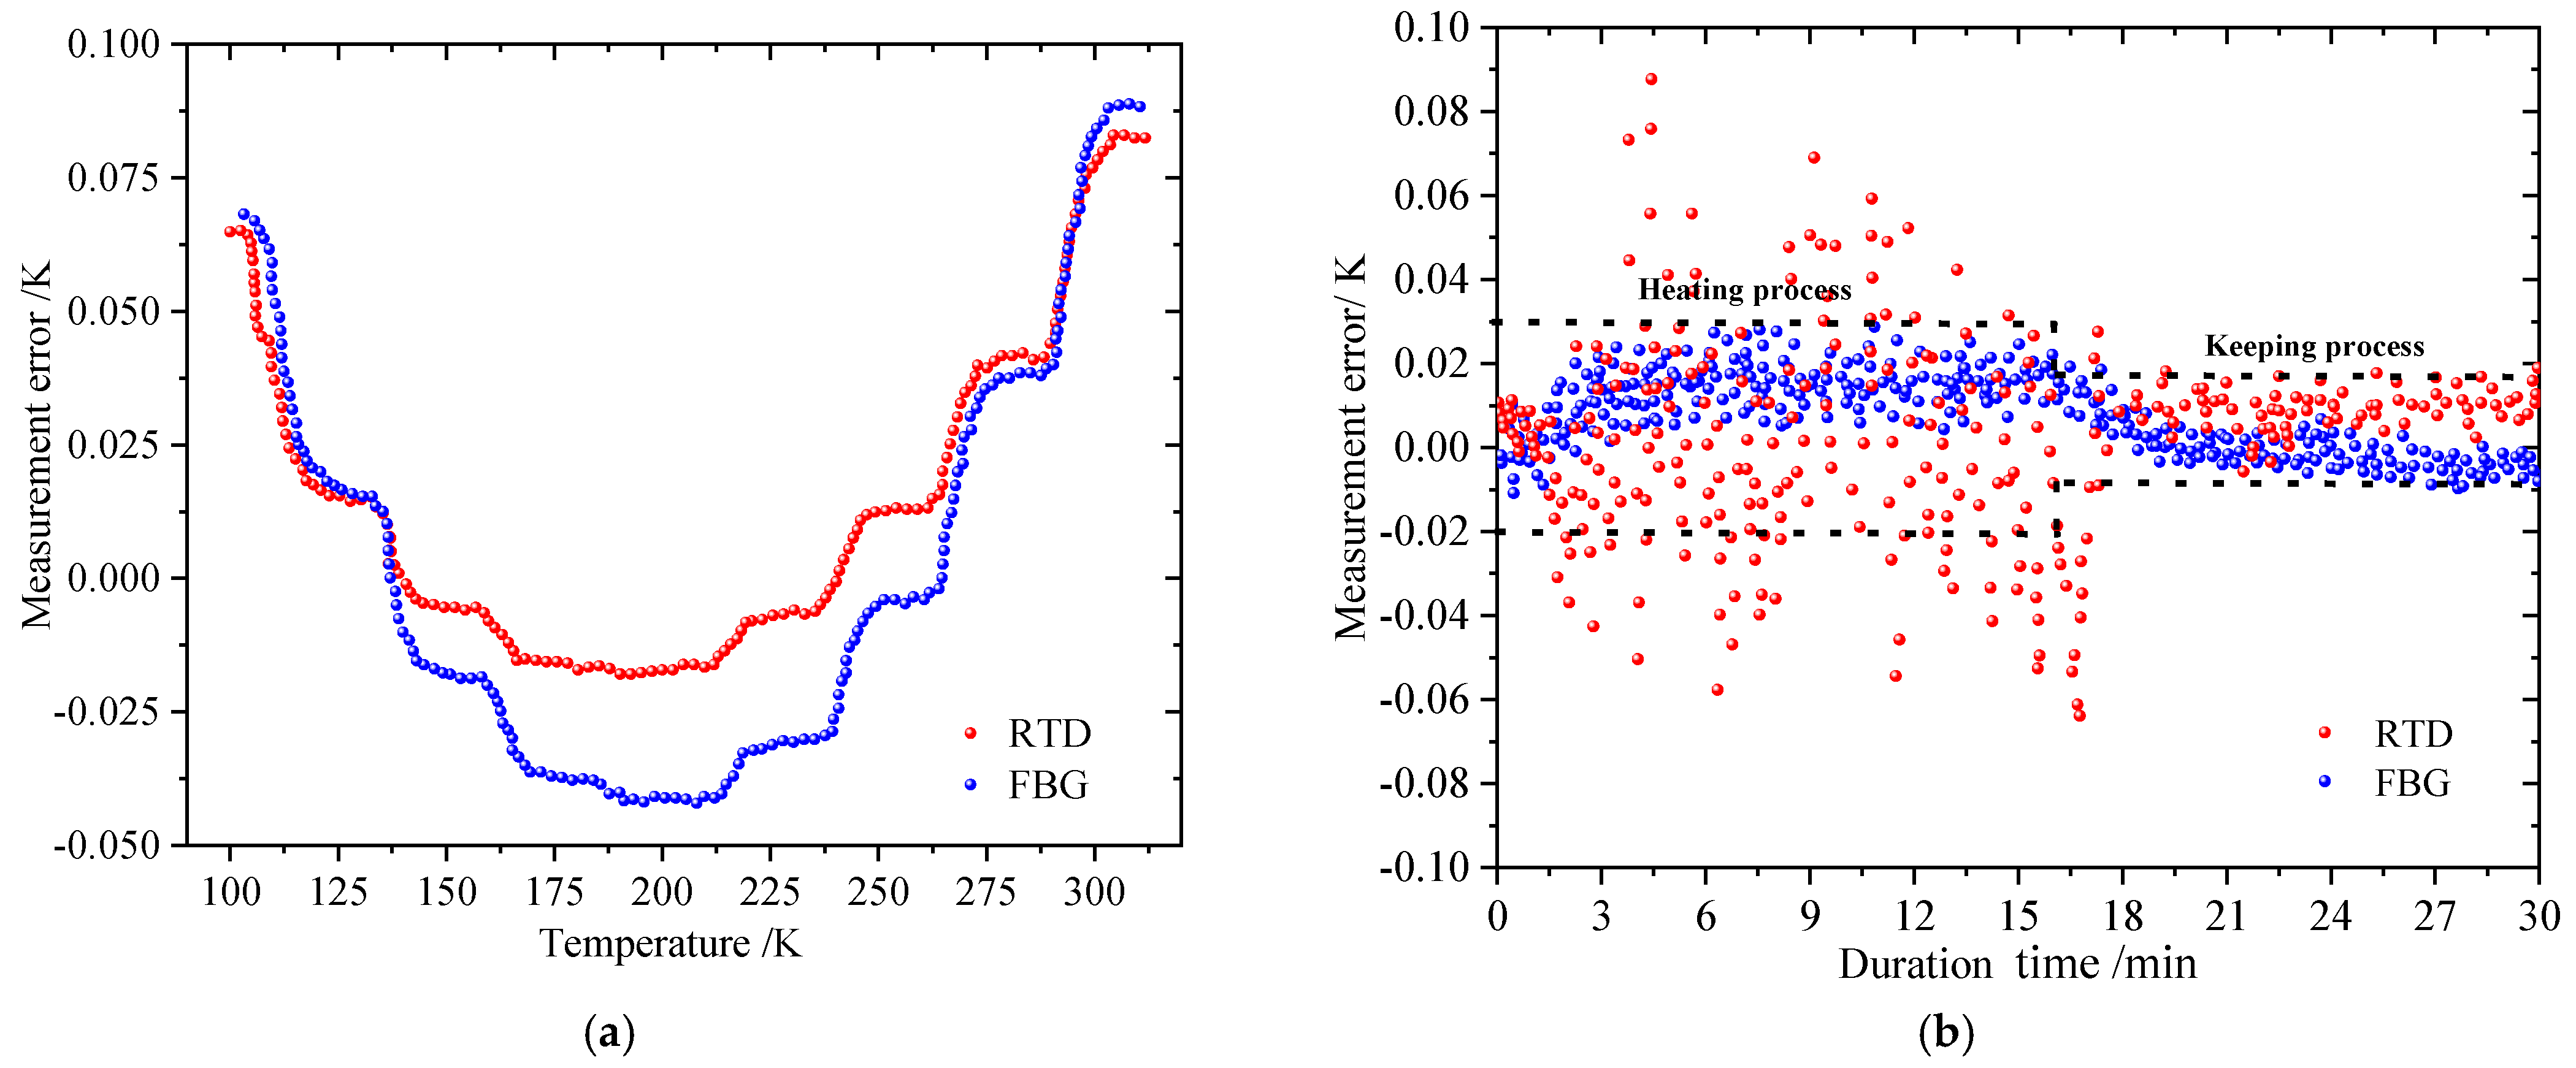
In the low-temperature measurements of LNG storage tank, the FBG sensor with the explosion-proof, non-electric-spark, and pure optical fiber transmission performed an excellent accuracy and stability. The measurement error was only −0.01 to 0.03 K, and the dynamic response is faster than the traditional RTD sensors. It proves that the proposed FBG sensor can effectively measure the temperature stratification to meet the status monitoring of the LNG storage tank;
(3)
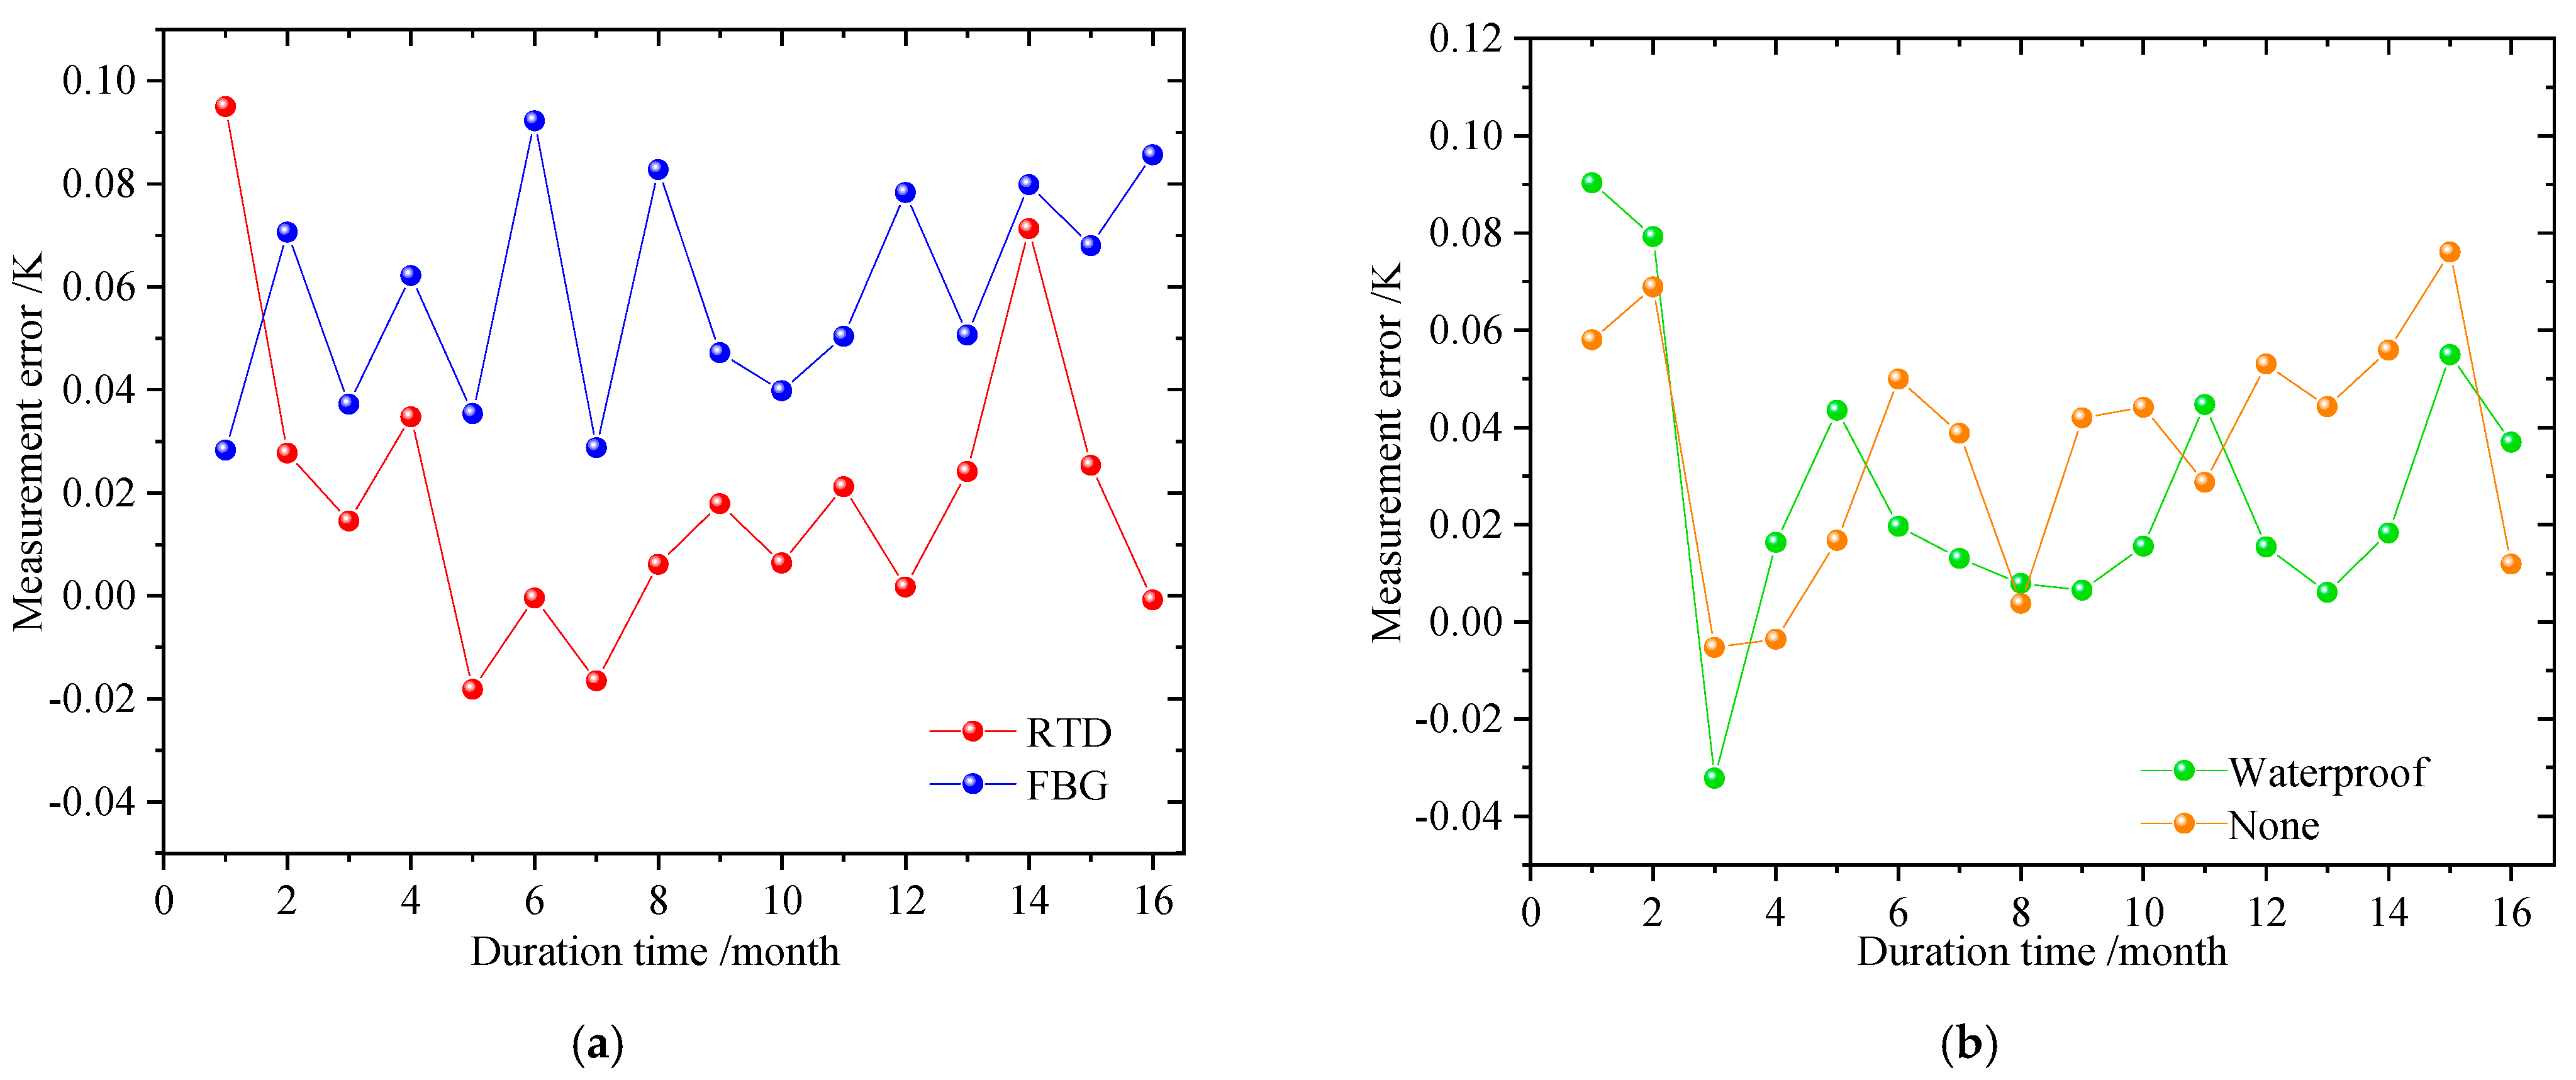
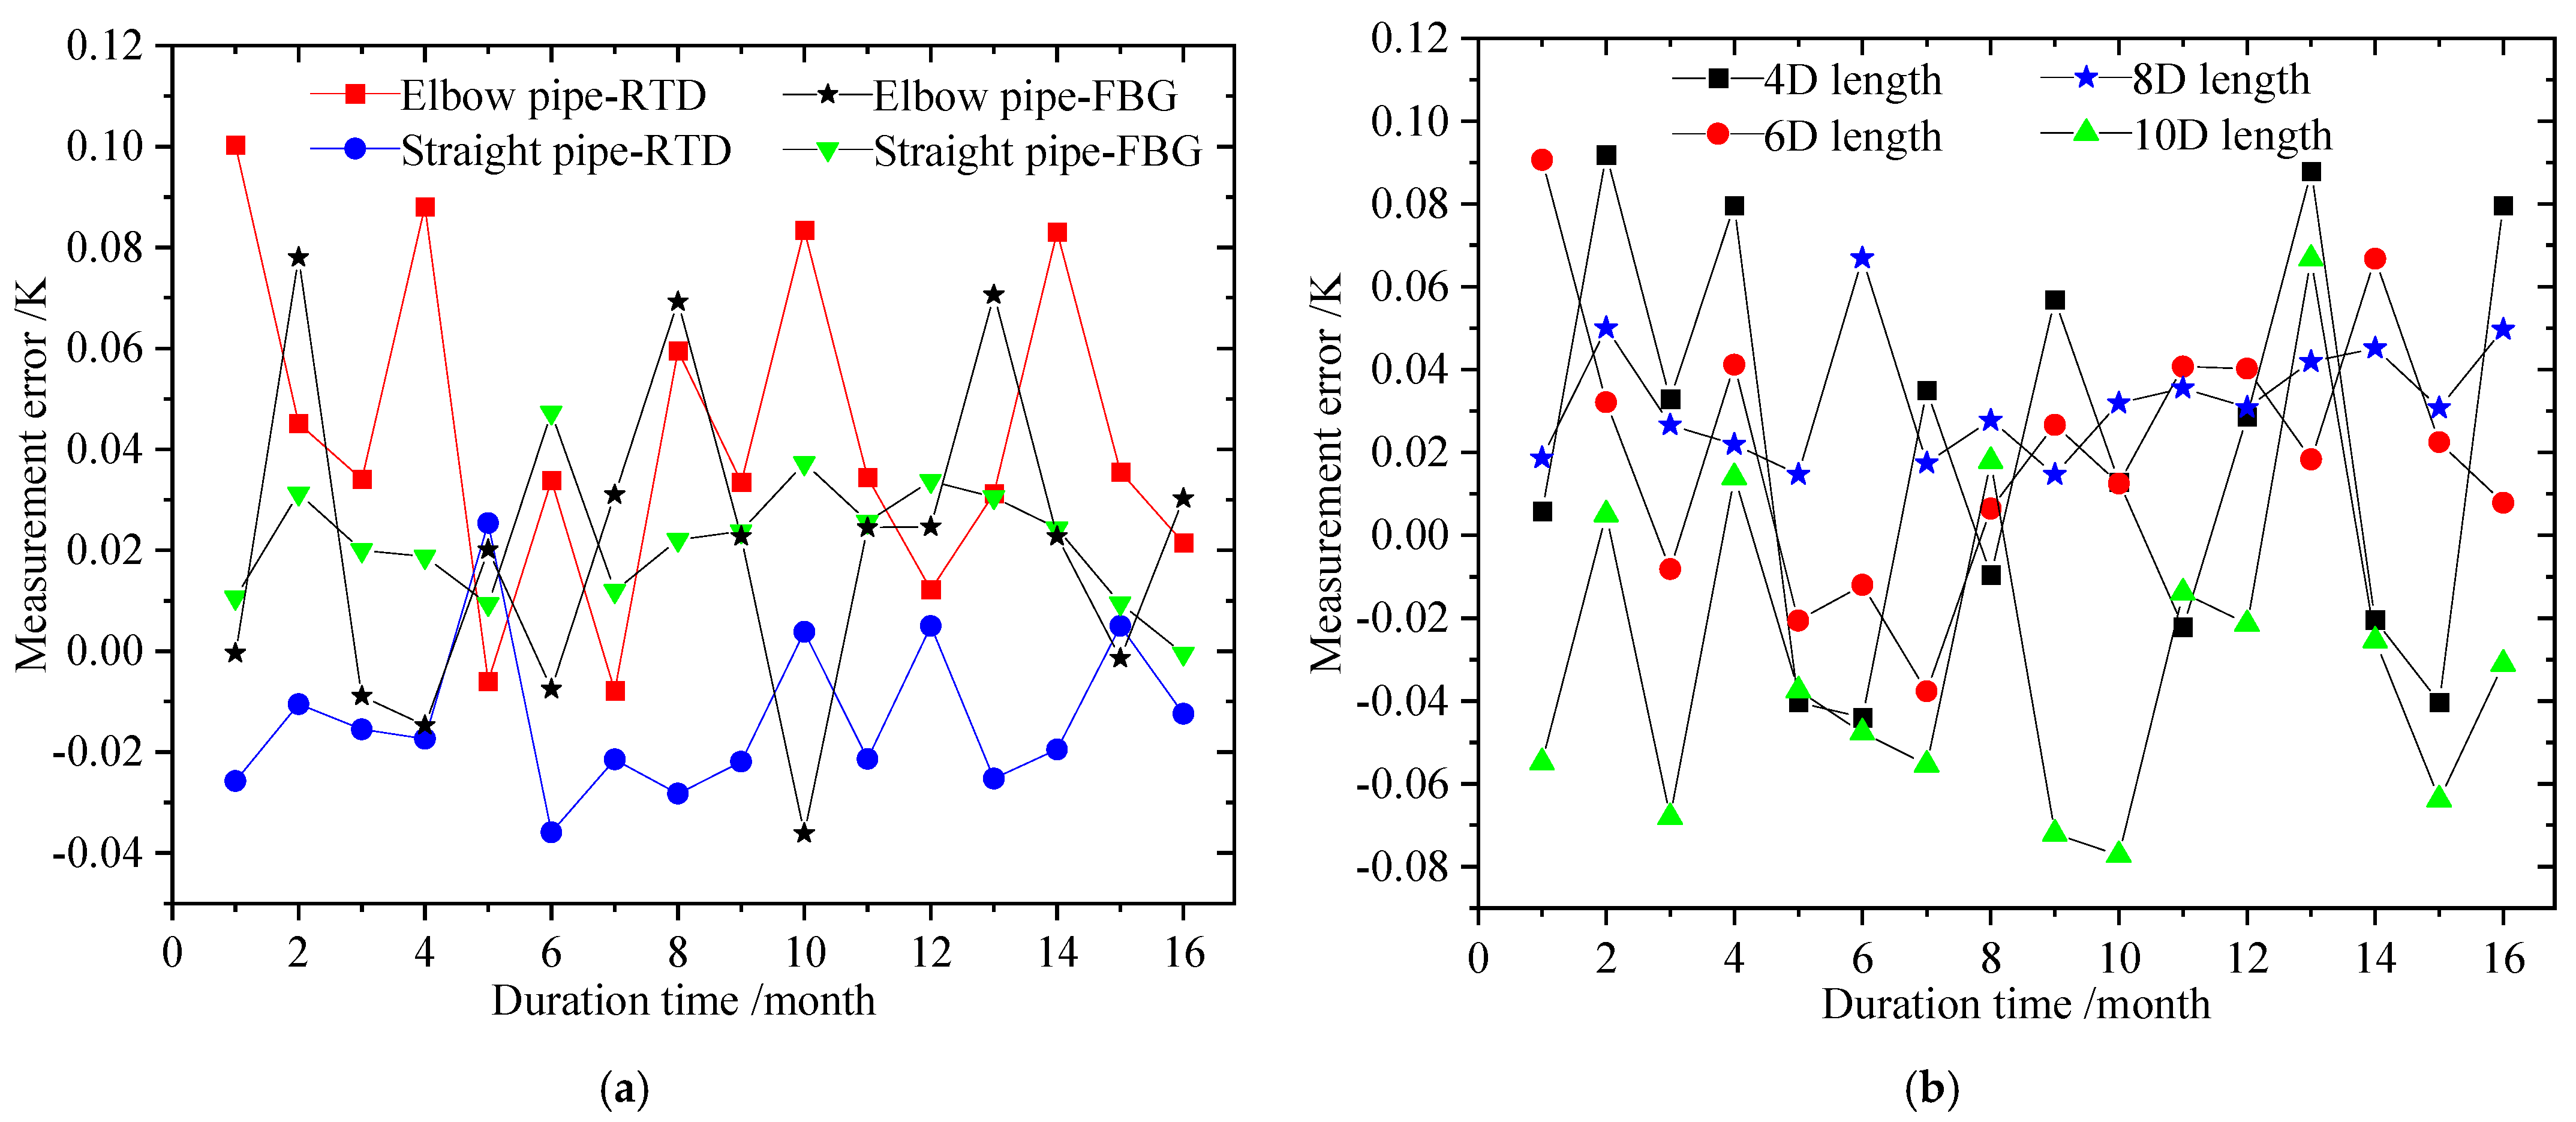
For the temperature monitoring of marine chiller system, the drift degrees of the two types of temperature sensors (RTD and FBG) were compared and analyzed in the long-term reliability experiment. It indicated that the non-waterproof FBG installed on the open thermowell can provide the best temperature accuracy and stability when the temperature sensor is inserted at the distance of 8D from the water mixing point of the pipe. Since the sub-pipes were mixed to the main straight pipe by elbows, the errors of both RTD and FBG installed on the elbow would greatly fluctuate due to the vibrations after the turbulent flow.
The new findings and suggestions of this experimental study can provide references and technical supports to the development of standardized measurement and verification systems for the testing and monitoring of LNG ships and relevant vessels with stricter safety standards. The subsequent measurement and calibration system will further contribute to the navigation energy conservation and power cost reduction of marine vessels.

Author Contributions

Conceptualization, F.H. and Z.W.; methodology, H.Z.; validation, F.H., H.Z., and D.W.; formal analysis, F.H.; investigation, H.Z.; resources, F.H.; data curation, Z.W.; writing—original draft preparation, F.H.; writing—review and editing, W.C.; visualization, D.W.; supervision, Z.W.; project administration, W.L. All authors have read and agreed to the published version of the manuscript.

Funding

This research was funded by the National Natural Science Foundation of China (52006022), the China Postdoctoral Science Foundation (2020M680928, 2020M670726), Natural Science Foundation of Liaoning Province (2020-BS-067), the Fundamental Research Funds for the Central Universities (3132021211, 3132019368) and 111 Project (B18009). Their support is gratefully acknowledged.

Institutional Review Board Statement

Not applicable.

Informed Consent Statement

Not applicable.

Acknowledgments

Thanks to W. Cai for providing the materials of this paper and related experimental guidance and help.

Conflicts of Interest

The authors declare no conflict of interest.

References

  1. Sui, C.; de Vos, P.; Stapersma, D.; Visser, K.; Ding, Y. Fuel Consumption and Emissions of Ocean-Going Cargo Ship with Hybrid Propulsion and Different Fuels over Voyage. J. Mar. Sci. Eng. 2020, 8, 588. [Google Scholar] [CrossRef]
  2. Nuchturee, C.; Li, T.; Xia, H. Energy efficiency of integrated electric propulsion for ships—A review. Renew. Sustain. Energy Rev. 2020, 134, 110145. [Google Scholar] [CrossRef]
  3. Poljak, I.; Bielić, T.; Mrzljak, V.; Orović, J. Analysis and Optimization of Atmospheric Drain Tank of Lng Carrier Steam Power Plant. J. Mar. Sci. Eng. 2020, 8, 568. [Google Scholar] [CrossRef]
  4. Han, F.; Wang, Z.; Jiang, Y.; Ji, Y.; Li, W. Energy assessment and external circulation design for LNG cold energy air separation process under four different pressure matching schemes. Case Stud. Therm. Eng. 2021, 27, 101251. [Google Scholar] [CrossRef]
  5. Altosole, M.; Campora, U.; Donnarumma, S.; Zaccone, R. Simulation Techniques for Design and Control of a Waste Heat Recovery System in Marine Natural Gas Propulsion Applications. J. Mar. Sci. Eng. 2019, 7, 397. [Google Scholar] [CrossRef] [Green Version]
  6. Wang, Z.; Han, F.; Ji, Y.; Li, W. Analysis on feasibility of a novel cryogenic heat exchange network with liquid nitrogen regeneration process for onboard liquefied natural gas reliquefaction. Case Stud. Therm. Eng. 2020, 22, 100760. [Google Scholar] [CrossRef]
  7. Hwang, S.; Jeong, B.; Jung, K.; Kim, M.; Zhou, P. Life Cycle Assessment of LNG Fueled Vessel in Domestic Services. J. Mar. Sci. Eng. 2019, 7, 359. [Google Scholar] [CrossRef] [Green Version]
  8. Wang, Z.; Han, F.; Liu, Y.; Li, W. Evolution Process of Liquefied Natural Gas from Stratification to Rollover in Tanks of Coastal Engineering with the Influence of Baffle Structure. J. Mar. Sci. Eng. 2021, 9, 95. [Google Scholar] [CrossRef]
  9. Wang, Z.; Han, F.; Ji, Y.; Li, W. Redundant energy combination and recovery scheme for dual fuel carriers based on thermo-electric harvesting with a large temperature range. Int. J. Energy Res. 2021, 45, 7404–7420. [Google Scholar] [CrossRef]
  10. Han, F.; Ong, M.C.; Xing, Y.; Li, W. Three-dimensional numerical investigation of laminar flow in blind-tee pipes. Ocean Eng. 2020, 217, 107962. [Google Scholar] [CrossRef]
  11. Pinault, J.-L. Modulated Response of Subtropical Gyres: Positive Feedback Loop, Subharmonic Modes, Resonant Solar and Orbital Forcing. J. Mar. Sci. Eng. 2018, 6, 107. [Google Scholar] [CrossRef] [Green Version]
  12. Sekhar, C.; Zheng, L. Study of an integrated personalized ventilation and local fan-induced active chilled beam air conditioning system in hot and humid climate. In Building Simulation; Tsinghua University Press: Beijing, China, 2018; Volume 11, pp. 787–801. [Google Scholar]
  13. Venkataraman, V.; El-Kharouf, A.; Pandya, B.; Amakiri, E.; Steinberger-Wilckens, R. Coupling of engine exhaust and fuel cell exhaust with vapour absorption refrigeration/air conditioning systems for transport applications: A review. Thermal. Sci. Eng. Prog. 2020, 18, 100550. [Google Scholar] [CrossRef]
  14. Zhani, K.; Ali Abuhasel, K. Modeling, Simulation, and Optimization of a Solar-Based System of Desalination Using Humidification and Dehumidification. Appl. Sci. 2020, 10, 3361. [Google Scholar] [CrossRef]
  15. Barone, G.; Buonomano, A.; Forzano, C.; Palombo, A.; Vicidomini, M. Sustainable energy design of cruise ships through dynamic simulations: Multi-objective optimization for waste heat recovery. Energy Convers. Manag. 2020, 221, 113166. [Google Scholar] [CrossRef]
  16. Sapronov, O.; Maruschak, P.; Sotsenko, V.; Buketova, N.; De Deus, A.B.D.G.; Sapronova, A.; Prentkovskis, O. Development and Use of New Polymer Adhesives for the Restoration of Marine Equipment Units. J. Mar. Sci. Eng. 2020, 8, 527. [Google Scholar] [CrossRef]
  17. Wang, Z.; Cai, W.; Han, F.; Ji, Y.; Li, W.; Sundén, B. Feasibility study on a novel heat exchanger network for cryogenic liquid regasification with cooling capacity recovery: Theoretical and experimental assessments. Energy 2019, 181, 771–781. [Google Scholar] [CrossRef]
  18. Han, F.; Wang, Z.; Ji, Y.; Li, W.; Sundén, B. Energy analysis and multi-objective optimization of waste heat and cold energy recovery process in LNG-fueled vessels based on a triple organic Rankine cycle. Energy Convers. Manag. 2019, 195, 561–572. [Google Scholar] [CrossRef]
  19. Wood, D.A. Predicting saturated vapor pressure of LNG from density and temperature data with a view to improving tank pressure management. Petroleum 2021, 7, 91–101. [Google Scholar] [CrossRef]
  20. Wang, H.; Xiang, P.; Jiang, L. Strain transfer theory of industrialized optical fiber-based sensors in civil engineering: A review on measurement accuracy, design and calibration. Sens. Actuators A Phys. 2019, 285, 414–426. [Google Scholar] [CrossRef]
  21. Deng, J. Real-time navigation monitoring system research for LNG-fuelled ship in inland water. J. Marit. Res. 2015, 12, 95–102. [Google Scholar]
  22. Zhao, L.; Zhang, G.W.; Zhang, Q.; Zhang, Y.K. Multi-Point Temperature Monitoring System for the LNG Storage Tank. Appl. Mech. Mater. 2014, 511–512, 282–285. [Google Scholar] [CrossRef]
  23. Aneziris, O.; Koromila, I.; Nivolianitou, Z. A systematic literature review on LNG safety at ports. Saf. Sci. 2020, 124, 104595. [Google Scholar] [CrossRef]
  24. Oh, D.J.; Kim, N.K.; Song, S.W.; Kim, Y.D.; Kim, M.H. Investigation of fatigue performance for new membrane-type LNG CCS at cryo-genic temperature. Mar. Struct. 2018, 62, 90–105. [Google Scholar] [CrossRef]
  25. Chen, C.; Wu, Q.; Xiong, K.; Zhai, H.; Yoshikawa, N.; Wang, R. Hybrid Temperature and Stress Monitoring of Woven Fabric Thermoplastic Composite Using Fiber Bragg Grating Based Sensing Technique. Sensors 2020, 20, 3081. [Google Scholar] [CrossRef] [PubMed]
  26. Seema, R.; Mandal, S.; Singh, P.; Paul, S.; Chanda, N. Fiber Bragg grating sensors for in-situ temperature measurement on bending a flexible planar supercapacitor. Sens. Actuators A Phys. 2020, 314, 112266. [Google Scholar] [CrossRef]
  27. Bakaic, M.; Hanna, M.; Hnatovsky, C.; Grobnic, D.; Mihailov, S.; Zeisler, S.S.; Hoehr, C. Fiber-Optic Bragg Gratings for Temperature and Pressure Measurements in Isotope Production Targets for Nuclear Medicine. Appl. Sci. 2020, 10, 4610. [Google Scholar] [CrossRef]
  28. Pang, B.; Gu, Z.; Ling, Q.; Wu, W.; Zhou, Y. Simultaneous measurement of temperature and surrounding refractive index by superimposed coated long period fiber grating and fiber Bragg grating sensor based on mode barrier region. Optik 2020, 220, 165136. [Google Scholar] [CrossRef]
  29. Dutz, F.J.; Heinrich, A.; Bank, R.; Koch, A.W.; Roths, J. Fiber-Optic Multipoint Sensor System with Low Drift for the Long-Term Monitoring of High-Temperature Distributions in Chemical Reactors. Sensors 2019, 19, 5476. [Google Scholar] [CrossRef] [PubMed] [Green Version]
  30. Yu, F.; Saito, O.; Okabe, Y. An ultrasonic visualization system using a fiber-optic Bragg grating sensor and its application to damage detection at a temperature of 1000 °C. Mech. Syst. Signal Process. 2021, 147, 107140. [Google Scholar] [CrossRef]
  31. Zheng, Y.; Bremer, K.; Roth, B. Investigating the Strain, Temperature and Humidity Sensitivity of a Multimode Graded-Index Perfluorinated Polymer Optical Fiber with Bragg Grating. Sensors 2018, 18, 1436. [Google Scholar] [CrossRef] [Green Version]
  32. Thekkethil, S.; Roy, K.R.; Thomas, R.; Neumann, H.; Ramalingam, R. Mathematical Model for a Novel Cryogenic Flow Sensor Using Fibre Bragg Gratings. Procedia Technol. 2016, 24, 477–484. [Google Scholar] [CrossRef] [Green Version]
  33. Li, L.; Lv, D.; Yang, M.; Xiong, L.; Luo, J.; Tan, L. Strain characteristics of the silica-based fiber Bragg gratings for 30–273 K. Cryogenics 2018, 92, 93–97. [Google Scholar] [CrossRef]
  34. Vendittozzi, C.; Felli, F.; Lupi, C. Modeling FBG sensors sensitivity from cryogenic temperatures to room temperature as a function of metal coating thickness. Opt. Fiber Technol. 2018, 42, 84–91. [Google Scholar] [CrossRef]
  35. Li, Y.; Yang, K.; Li, X. Temperature sensing characteristics of metal coated FBG during dynamic cooling process. Opt. Fiber Technol. 2018, 45, 368–375. [Google Scholar] [CrossRef]
Figure 1. Measuring principle of FBG temperature sensor.
Jmse 09 00917 g001
Figure 2. FBG plating, encapsulation, and temperature linearity test.
Jmse 09 00917 g002
Figure 3. Experiment setup of FBG temperature sensors in testing Dewar.
Jmse 09 00917 g003
Figure 4. Experimental setup of FBG temperature sensors in marine chiller and pipeline system: (a) principle of ship ventilation and air conditioning chiller system; (b) influence of humidity and condensation temperature on FBG sensor under maritime conditions; (c) specific form of the temperature test for the bypass pipeline of chiller unit; (d) influence of the mixing end of the chiller cold-water supply on the FBG temperature reading accuracy.
Jmse 09 00917 g004
Figure 5. The relationship between wavelength, temperature, and optical power under different packaging materials: (a) zinc packaging material fiber testing; (b) copper packaging material fiber testing; (c) gold packaging material fiber testing; (d) wavelength vs. optical power in different packaging materials.
Jmse 09 00917 g005
Figure 6. Sensitivity of wavelength to temperature in different packaging materials.
Jmse 09 00917 g006
Figure 7. Measurement results of RTD and FBG: (a) comparison of measurement accuracy; (b) comparison of measurement stability.
Jmse 09 00917 g007
Figure 8. Temperature response time test of cryogenic tank: FBG vs. RTD.
Jmse 09 00917 g008
Figure 9. Measurement results: (a) long period monitoring for marine chiller system; (b) influence of humidity on temperature reading accuracy of FBG.
Jmse 09 00917 g009
Figure 10. Experimental results: (a) influence of upstream vibration/turbulence; (b) influence of measuring position of chiller pipeline.
Jmse 09 00917 g010
Table 1. Influence of insertion depth on temperature sensor measurement.
Insertion Length (mm)Standard Deviation of the Error (K)Insertion Depth/Pipe Diameter
200.5890069370.425
500.216512050.475
800.0184689190.525
1100.0553566040.575
1400.0796227580.625
Publisher’s Note: MDPI stays neutral with regard to jurisdictional claims in published maps and institutional affiliations.

