Article

Laboratory Quantification of the Relative Contribution of Staghorn Coral Skeletons to the Total Wave-Energy Dissipation Provided by an Artificial Coral Reef

1
Department of Civil and Architectural Engineering, College of Engineering, University of Miami, Coral Gables, FL 33146, USA
2
Department of Marine Biology and Ecology, Rosenstiel School of Marine and Atmospheric Science, University of Miami, 4600 Rickenbacker Cswy., Miami, FL 33149, USA
3
Department of Ocean Sciences, Rosenstiel School of Marine and Atmospheric Science, University of Miami, 4600 Rickenbacker Cswy., Miami, FL 33149, USA
*
Author to whom correspondence should be addressed.
J. Mar. Sci. Eng. 2021, 9(9), 1007; https://doi.org/10.3390/jmse9091007
Submission received: 16 August 2021 / Revised: 3 September 2021 / Accepted: 9 September 2021 / Published: 15 September 2021
(This article belongs to the Section Ocean Engineering)

Abstract

:
Coral reefs function as submerged breakwaters providing wave mitigation and flood-reduction benefits for coastal communities. Although the wave-reducing capacity of reefs has been associated with wave breaking and friction, studies quantifying the relative contribution by corals are lacking. To fill this gap, a series of experiments was conducted on a trapezoidal artificial reef model with and without fragments of staghorn coral skeletons attached. The experiments were performed at the University of Miami’s Surge-Structure-Atmosphere-Interaction (SUSTAIN) Facility, a large-scale wind/wave tank, where the influence of coral skeletons on wave reduction under different wave and depth conditions was quantified through water level and wave measurements before and after the reef model. Coral skeletons reduce wave transmission and increase wave-energy dissipation, with the amount depending on the hydrodynamic conditions and relative geometrical characteristics of the reef. The trapezoidal artificial coral reef model was found to reduce up to 98% of the wave energy with the coral contribution estimated to be up to 56% of the total wave-energy dissipation. Depending on the conditions, coral skeletons can thus enhance significantly, through friction, the wave-reducing capability of a reef.

1. Introduction

Coastal communities critical for the global economy [1] are also often susceptible areas to natural disasters, such as tropical cyclones and flooding, which have been occurring with an increasing frequency due to sea-level rise and climate change. Considering that approximately 40% of the world population lives within 100 km (60 miles) of the coast [2], identifying sustainable protection solutions against coastal hazards, such as flooding and wave impacts, is critical [3]. Waves can impact the integrity of a structure and/or cause scouring. They can also lead to overtopping and thus increase flooding. Nature-based infrastructure such as mangroves and coral reefs can mitigate the impacts of waves in an efficient and cost-effective manner [4,5,6]. Conservation and restoration efforts can thus be used to design or enhance coastal interventions with multiple benefits including wave protection.
Coral reefs are diverse and productive ecosystems that provide a wide variety of services including habitat, food, tourism, recreation, and shoreline protection [7,8,9,10]. Coral reefs can also dissipate up to 97% of incident wave energy [11]. They act as low crested submerged breakwater structures reducing wave height and dissipating wave energy through wave breaking and bottom friction [12,13,14]. Wave breaking occurs in response to the shoaling effects as waves propagate over the reef and toward shallower depths [15]. Laboratory experiments revealed that wave breaking contributes the most to wave-energy dissipation (50–99% total wave energy) with its exact contribution depending on reef morphology, water depth, and offshore wave conditions [16,17]. On the other hand, bottom friction takes place over the reef slopes and the reef flat caused by the interaction between water particles and the reef surface [18]. Studies have shown that friction can constitute 20–47% of total wave-energy attenuation which depends on parameters such as the distance over which the wave is interacting with the reef, the relative roughness of the bed and the water regime [17,19]. The most critical factors for wave dissipation by coral reefs are thus water depth and bottom friction [20]. These parameters represent key inputs for numerical models, such SWAN, XBeach and SWASH [21] that have been used to study the spatial distribution of hydrodynamic conditions over reefs and along the shoreline with bottom friction from corals typically modeled by an enhanced friction coefficient [22,23].
Although significant research has been conducted on wave dissipation by coral reefs [7] and the evaluation of their protective benefits for coastal communities [24], few studies have focused on quantifying the contribution of corals in the aforementioned energy-dissipation mechanisms [22,25,26,27]. However, this information is critical for the consideration and promotion of artificial coral reefs as shoreline-protection structures [7]. This study assesses the wave-reducing capacity of an artificial coral reef model with a trapezoidal morphology and quantifies the contribution of staghorn coral skeletons in it through physical testing at the University of Miami, Surge Structure Atmosphere Interaction (SUSTAIN) Facility. This study expanded on prior initial research by Ghiasian et al. [27] by incorporating a wider set of hydrodynamic conditions, as well as the calculation of wave transmission for the reef model and a bottom friction coefficient for coral skeletons.
The paper is organized as follows; Section 2 describes the experimental setup of the study, the water/wave conditions considered and a summary of the wave-data analysis (the detailed description is given in the Appendix A and Appendix B). Section 3 presents the results in terms of wave transmission (a parameter commonly explored to describe engineering design performance) and wave energy along with the computation of an experimentally defined friction coefficient for staghorn corals. Section 4 discusses the influence of key parameters with conclusions presented in Section 5.

2. Materials and Methods

The experiments for the evaluation of the wave-reducing capacity of artificial coral reefs and the quantification of the impact of corals were conducted at the SUSTAIN facility. SUSTAIN is a wind-wave tank that can generate directionally varying waves with 12 paddles ranging from simple periodic waves to any specified spectrum. It can also include the direct effect of winds from tropical storms up to hurricane category 5 on the Saffir–Simpson scale. Moreover, with a 21 m-long, 6 m-wide and 2 m-deep tank, SUSTAIN (Figure 1) offers the ability to carry out physical testing at relatively large scales providing a unique platform for the quantification of the effects contributing to the wave-energy dissipation occurring from artificial coral reefs.
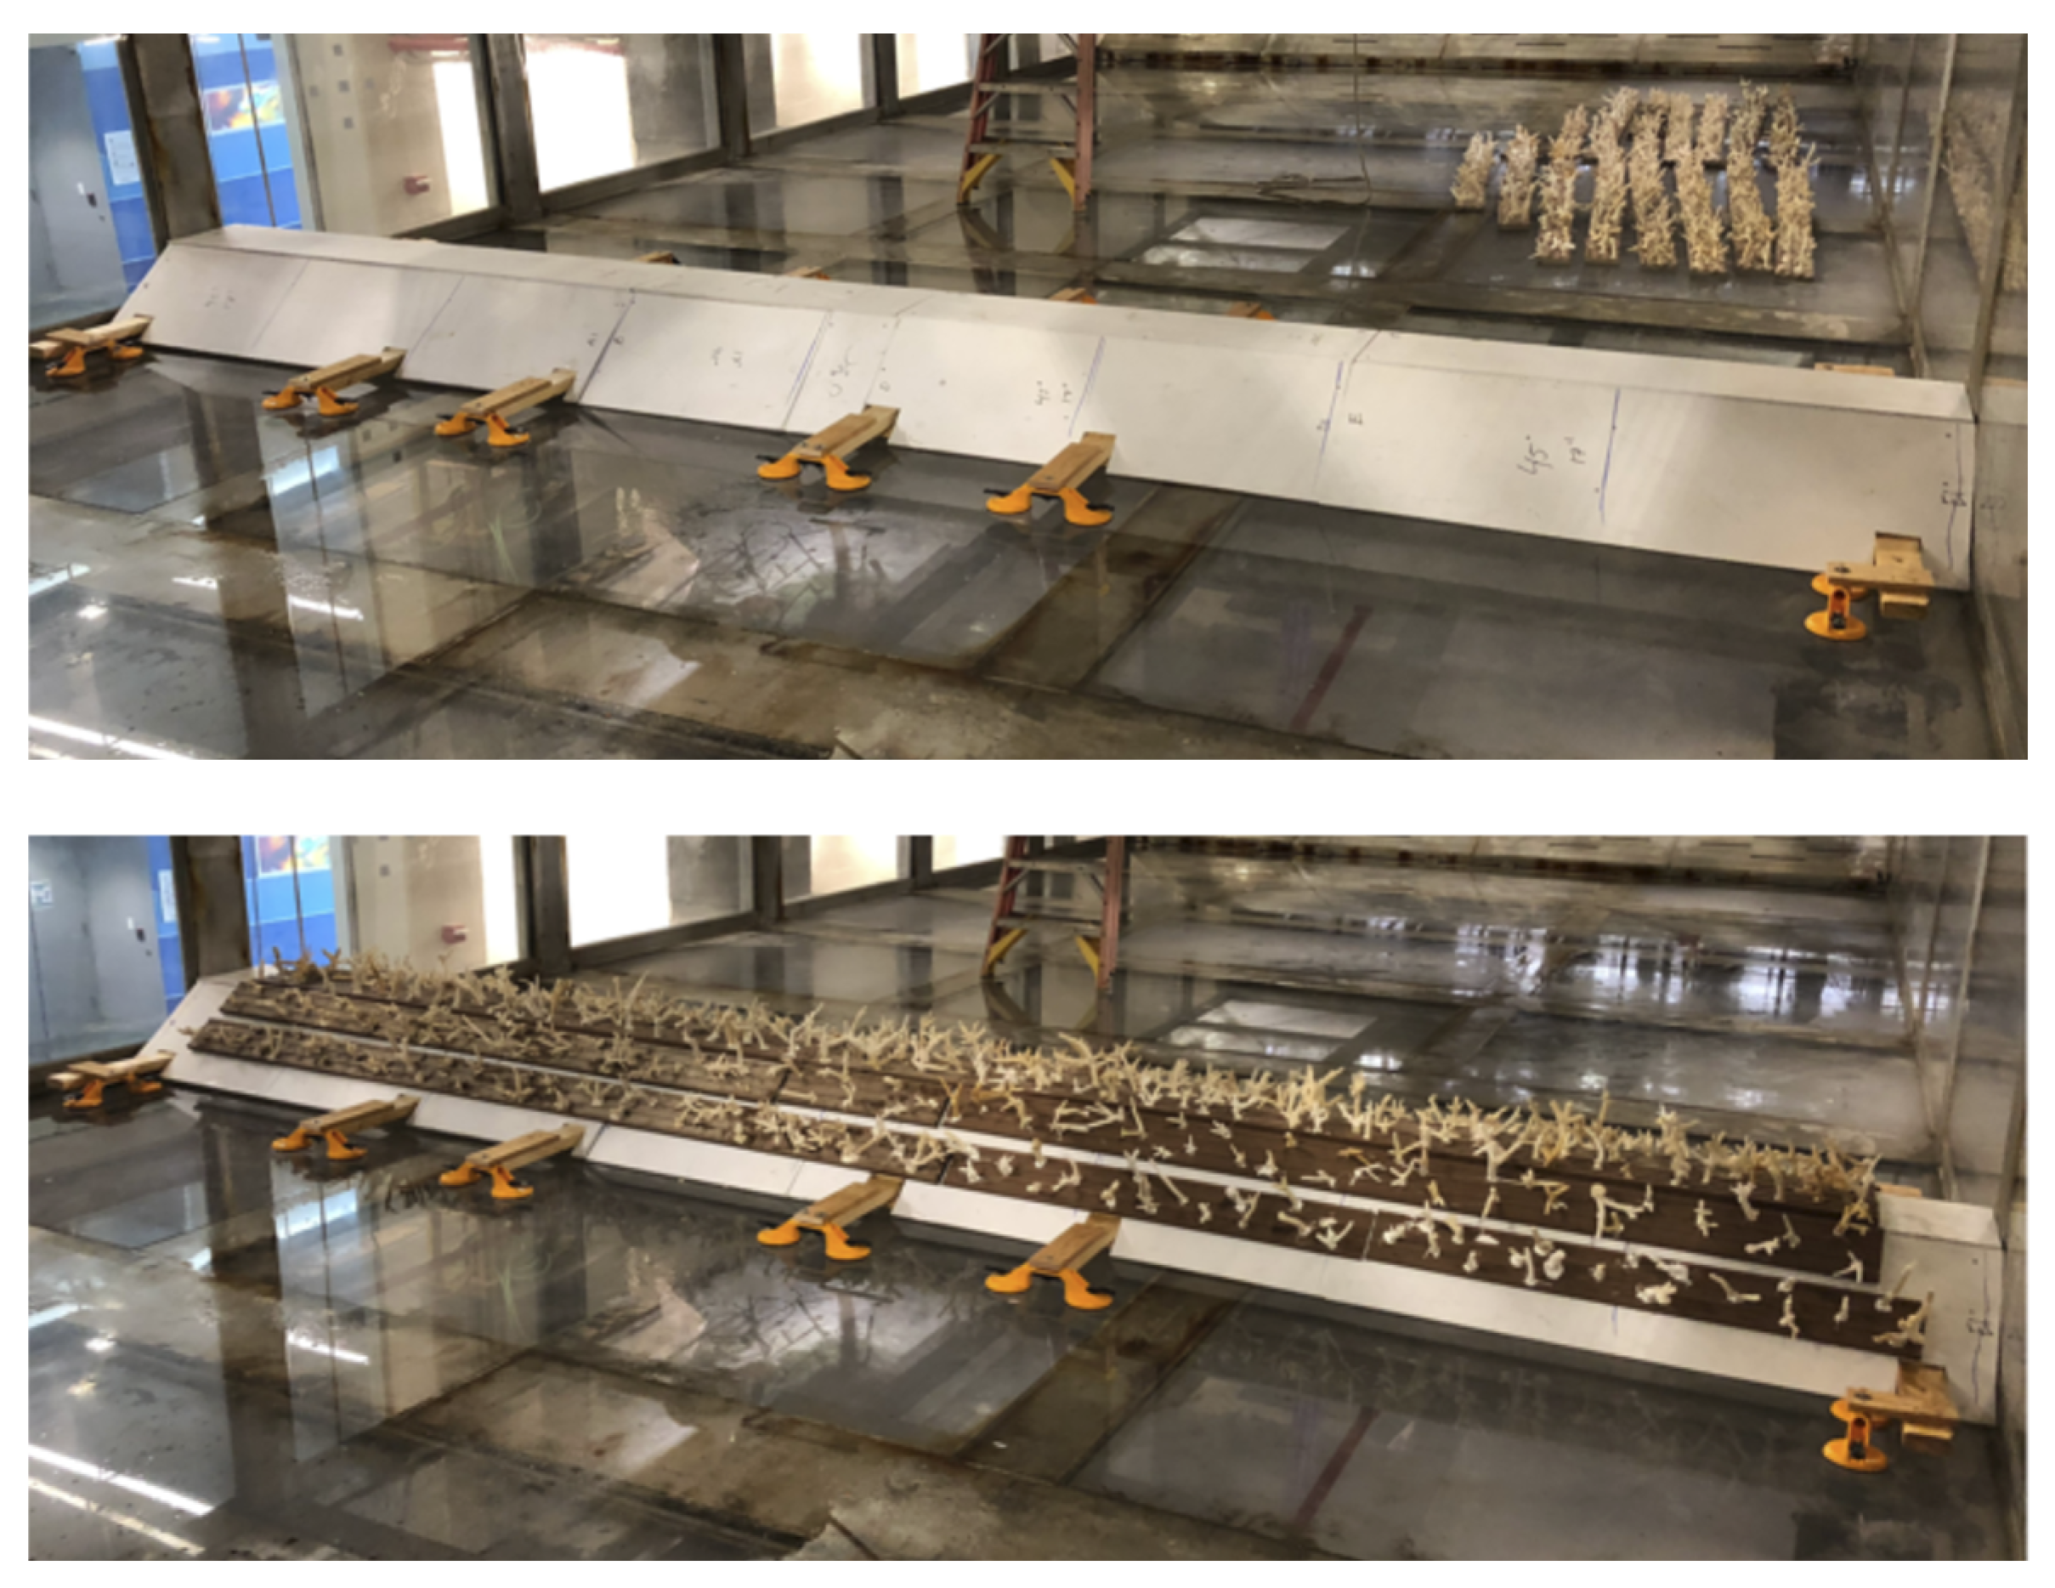
To assess the wave-reducing capacity of coral reefs and quantify the impact of corals on the wave-energy dissipation, a rigid model of an artificial coral reef was tested with and without fragments of coral skeletons on top of it. The model was made out of wood with the breakwater substructure having a trapezoidal cross section with a 1:1 forereef slope, a height (bottom of the flume to the reef flat) of 0.30 m, a horizontal reef flat of 0.30 m length, and a 1:1.7 backreef slope. Moreover, the model spanned across the 6 m width of the SUSTAIN tank to avoid flow changes at ends impacting water level measurements and wave-height and energy calculations (Figure 2). For the configuration with the corals, fragments of staghorn coral skeletons (Acropora cervicornis) with an average height of 0.10–0.15 m containing multiple branches were attached on the model with an average distance of 0.05–0.10 m between skeletons. While in nature differences in coral colony size and morphology can be found which relate also to differing hydrodynamic regimes [28,29,30], in this study, a relatively uniform layout and density of coral fragment spacing along the reef model were considered using seven rows of corals with an average of 80 skeletons each.
The wave-energy dissipation induced by the artificial coral-reef model was evaluated from the local wave-height and wave-energy reduction calculated on the basis of high-frequency water-level measurements before and after the reef model. Water-level measurements were taken using wave wires (WW) and ultrasonic distance meters (UDM) placed vertically along the flume. WW1 and UDM1 as well as WW2 and UDM2 were paired before and after the reef model to ensure the quality of the signals recorded as UDMs may present errors when wave breaking occurs due to the splash of water in the air. Moreover, having two distinct measurements allows also separating incident and reflected waves [31,32,33]. Figure 3 illustrates the experimental setup for this study with the location of the wave gauges. WW1 and UDM1 were located approximately 5 m from the wave generator and 2 m away from the model to measure water levels including incident waves, while WW2 and UDM2 were placed at a distance of approximately 2 m after the reef model to record its impact on the waves. WWs and UDMs measure water-level fluctuations with submillimeter precision. For this study, water-level measurements were conducted with a sampling frequency of 20 Hz. Tests were also video recorded for visual inspection.
Wave conditions for the experiment were defined based on Froude similarity between prototype site characteristics and the reef model as the dominant forces are wind-generated gravity waves. Table 1 shows the hydrodynamic parameters considered for a prototype site in South Florida. Wave characteristics were determined from data taken from the Satan Shoal Buoy [34]. The data were averaged monthly for the period of 2019 to 2020 in order to determine the significant wave height and dominant wave period ranges.
Water conditions for the prototype structure were determined following the small amplitude wave theory [35] in which wavelengths (λ) were calculated using the dispersion relationship considering the hydrodynamic characteristics of the site (Table 1):
λ = g T 2 2 π tanh ( 2 π λ h )
where g is the gravity constant, T is the dominant wave period, and h is the water depth. Given the site hydrodynamic characteristics, the Froude and Reynolds numbers for the prototype conditions were calculated following [19,36], respectively:
F r = u g h r
R e = ρ u a μ
where h r is the water depth over the reef flat and u is the amplitude of the near-bed wave orbital velocity:
u = π H T 1 sin h ( 2 π h λ )
In Equation (3), ρ is the density of the fluid. μ is the dynamic viscosity of the fluid, and α is the amplitude of water particle movement at the bed:
a = H 2 1 sin h ( 2 π h λ )
Table 2 reports the Froude and Reynolds numbers for the site water/wave conditions defined with the parameters of Table 1. The conditions have ratios of water depth to wavelength that reflect intermediate depths and wave steepnesses that reach the stability limit with Froude and Reynolds numbers that vary from 0.041 to 0.383 and 12,000 to 7,049,000, accordingly, representing turbulent flow. Froude and Reynolds numbers are explored to ensure a similarity between water/wave and flow conditions in the laboratory and for candidate prototype sites in South Florida, respectively.
The desired Froude similarity and the capabilities of the SUSTAIN Facility were considered in the selection of the values of the hydrodynamic parameters employed to define the testing conditions for the physical model which include three wave periods, wave heights and water depths (Table 3). It should be noted that the five-second period waves considered were selected to simulate shallow water conditions (a ratio of water depth to wavelength less than 0.05) expanding also Froude number coverage. Waves in SUSTAIN are mechanically generated through the active control of 12 paddles base on linear small amplitude wave theory. It should also be noted that the numbers reported in this section are target values defined as input for the wavemaker with the actual (measured) wave heights and periods reported in Section 3 presenting a slight variation. However, with a sampling frequency of 20 Hz, a test duration of five minutes and wave periods varying from 0.83 to 5.00 s, the experimental setup allows to collect enough water-level data points to obtain a complete profile for a series of waves. Furthermore, any measurement errors are compensated for by averaging the wave heights over multiple waves.
The wave-reducing capacity of the physical model with and without coral skeletons was evaluated through its testing under eight wave conditions with respect to different wave periods and heights, and three water depths. Table 4 provides a full description of the wave/water experimental conditions considered with Conditions 1 and 2 having a wavelength (λ) of 1.08 m, while Conditions 3–5 and 6–8 have wavelengths of 2.71 and 11.43 m, respectively. It should be noted that Condition 2 is close to the stability limit. However, no wave breaking was observed. Waves with a period of 0.83 s and heights larger than 0.16 m broke before reaching the model and, therefore, only two heights were considered for this period. Comparing Table 2 and Table 4 reveals that the Froude number for the physical model in SUSTAIN ranges from 0.083 to 0.448, while for the prototype structure the Froude number varies between 0.041 to 0.383. The prescribed testing represents thus a good compromise between site hydrodynamic conditions and laboratory conditions. The Reynolds number for the physical model in SUSTAIN varies from 280 to 396,420 with most conditions reflecting turbulent flow with the exception of Conditions 1 and 2 under the water depth of 0.75 m which represent laminar flow. It should also be noted that the wave periods examined in this study are representative of short, intermediate, and long waves. Moreover, based on the Froude similarity between prototype and model conditions, the results of this study are valid for prototype reefs and corals with their geometrical scales ranging from 4.83 to 6.36.
As wave steepness (H/λ) increases both bound capillary waves and free harmonics can be generated. For the one-second wave shown in figure one in water depth of 0.55 to 0.75 the wave is in the intermediate depth range, so it is not strongly interacting with the bottom (although there is some effect). Wave steepness values range from 0.009 to 0.148 at different water depths (Table 4). Although at the larger end of this range (C2) it is expected that non-linear wave generation would occur, given the small amplitude of the bound capillary and free harmonic waves, they will not have a significant impact on the results of this study that is focused on total wave-energy dissipation.
Each condition was run for five minutes for the two artificial coral-reef model configurations (i.e., with and without coral skeletons attached on it) resulting in 6000 water-level data points. Water-level measurements were filtered to remove outliers and noise, as well as frequencies out of the range of the testing condition. Filtered data were then processed and examined using short-term wave analysis to calculate wave heights [37] with wave reflection numerically removed using the two-point measurement method proposed in [31]. A detailed description of the wave-data filtering and analysis are included in Appendix A with the reflection removal addressed in Appendix B.

3. Results

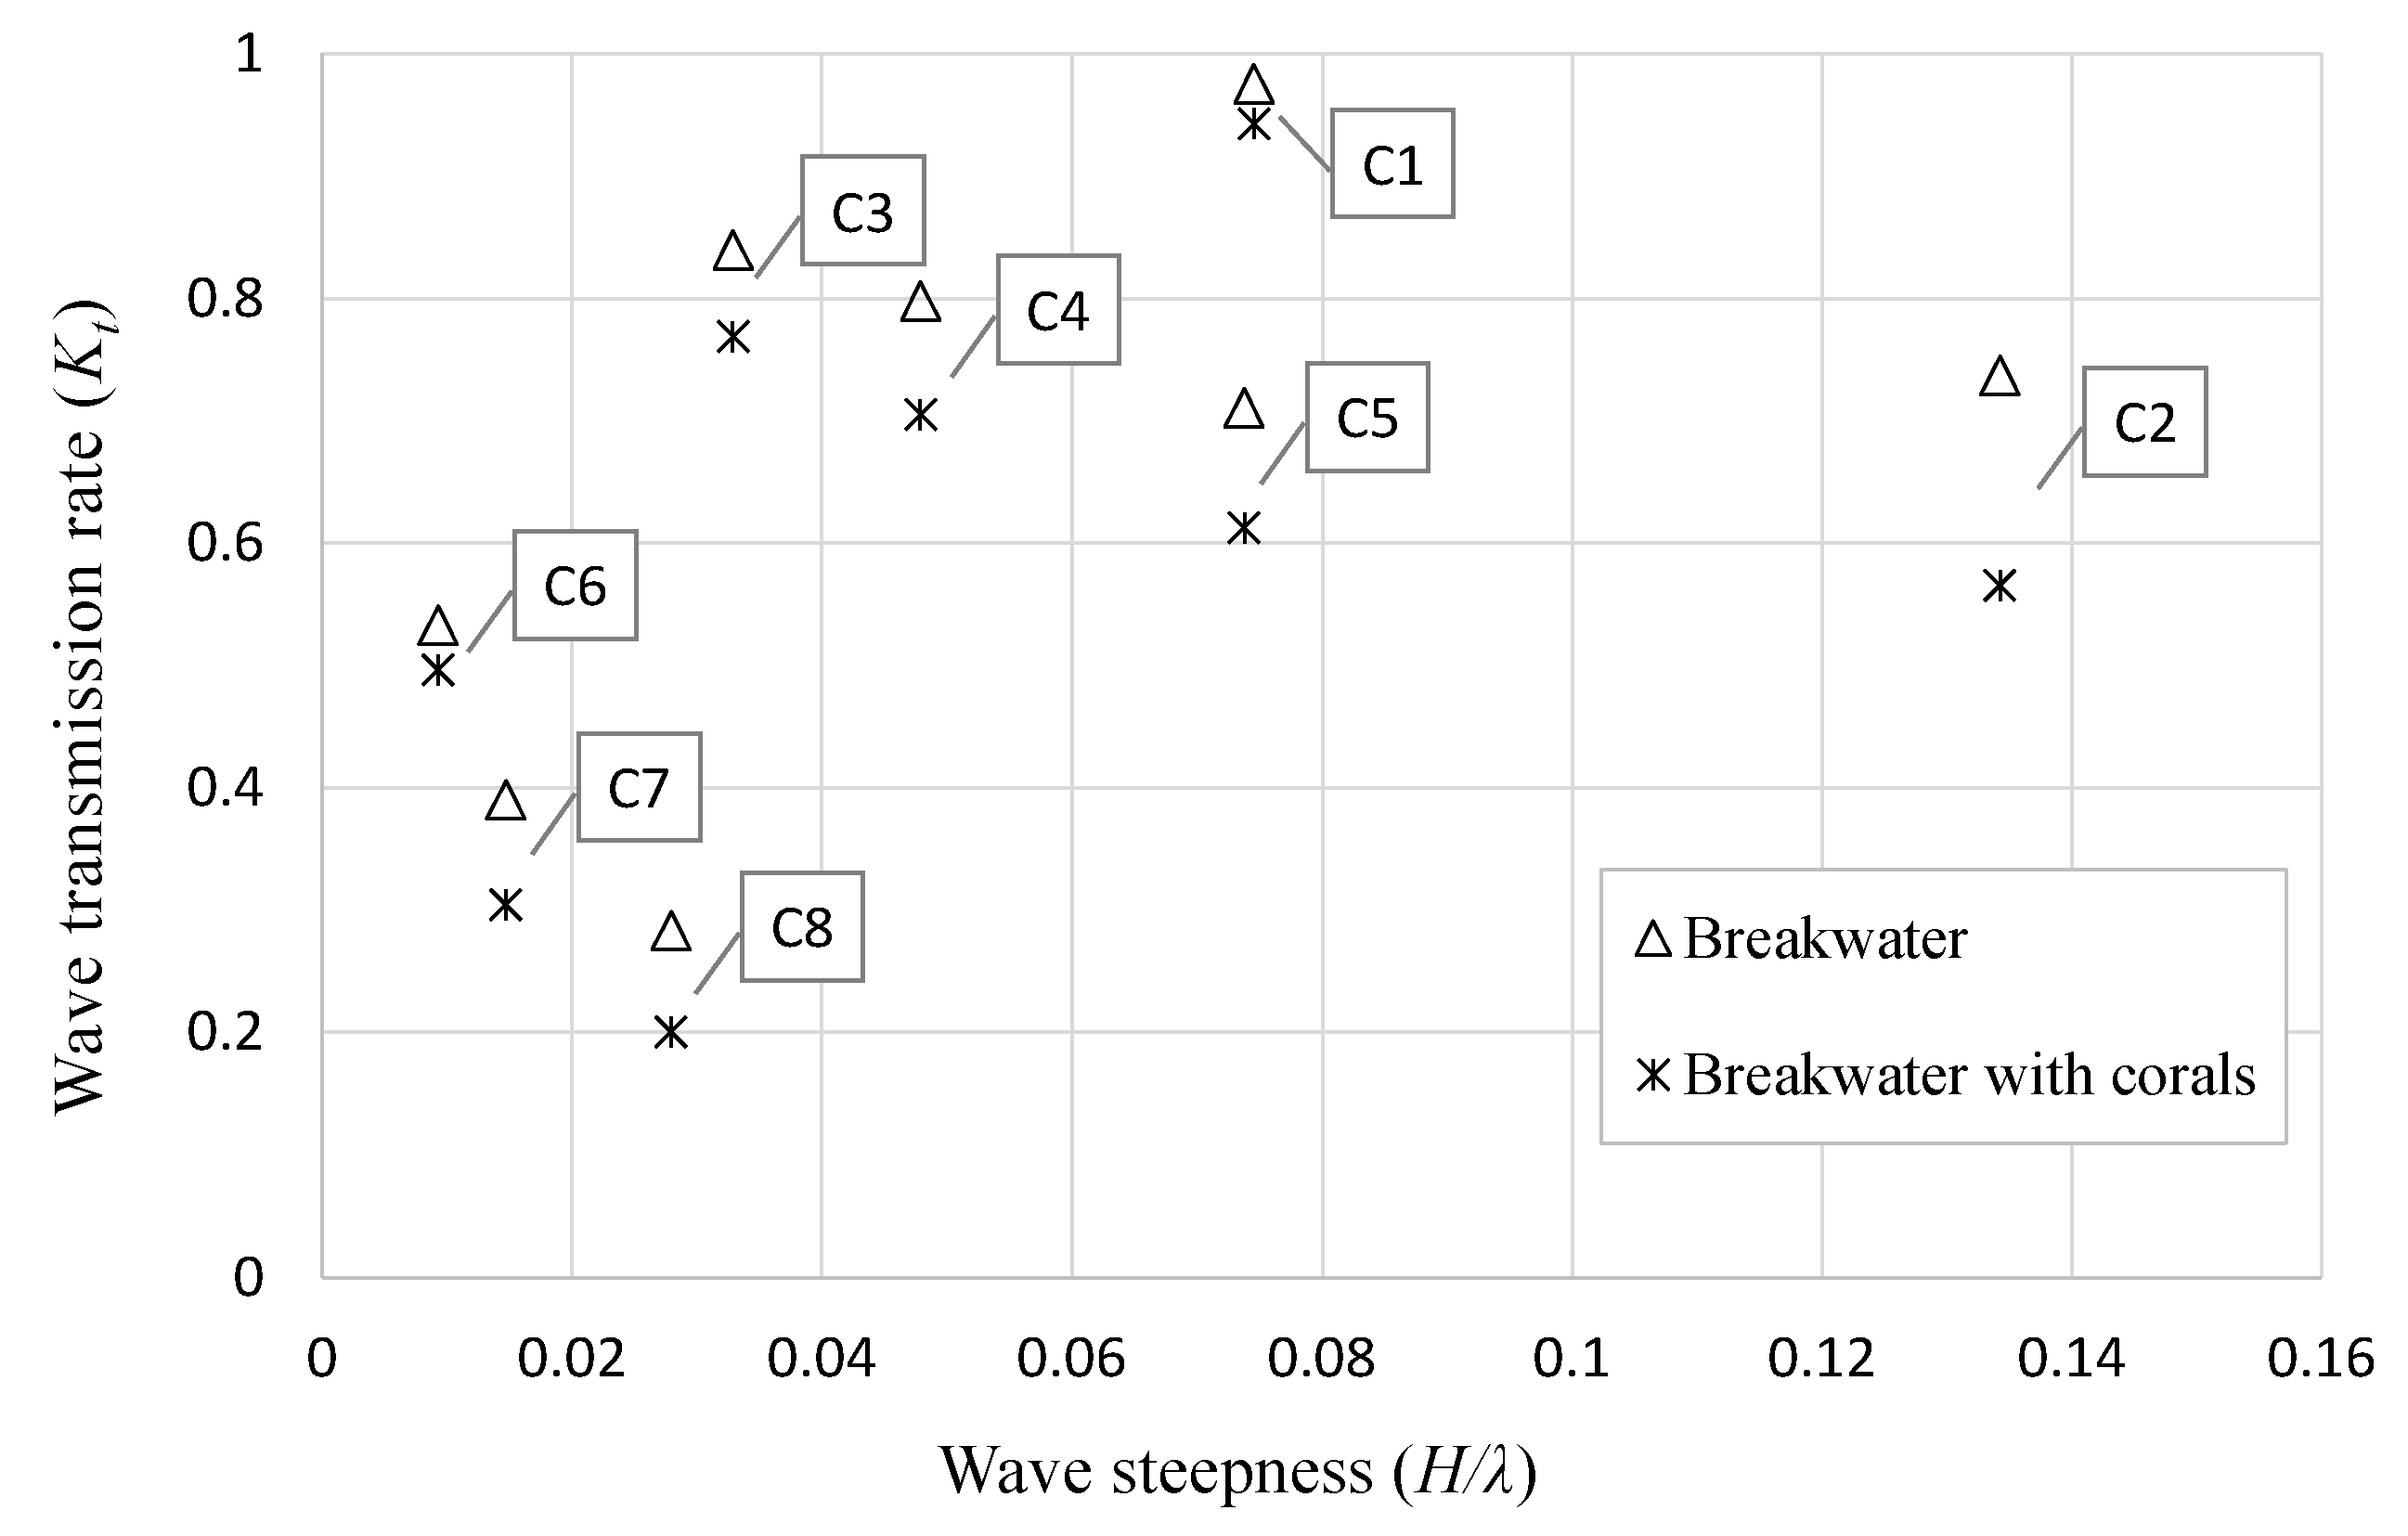
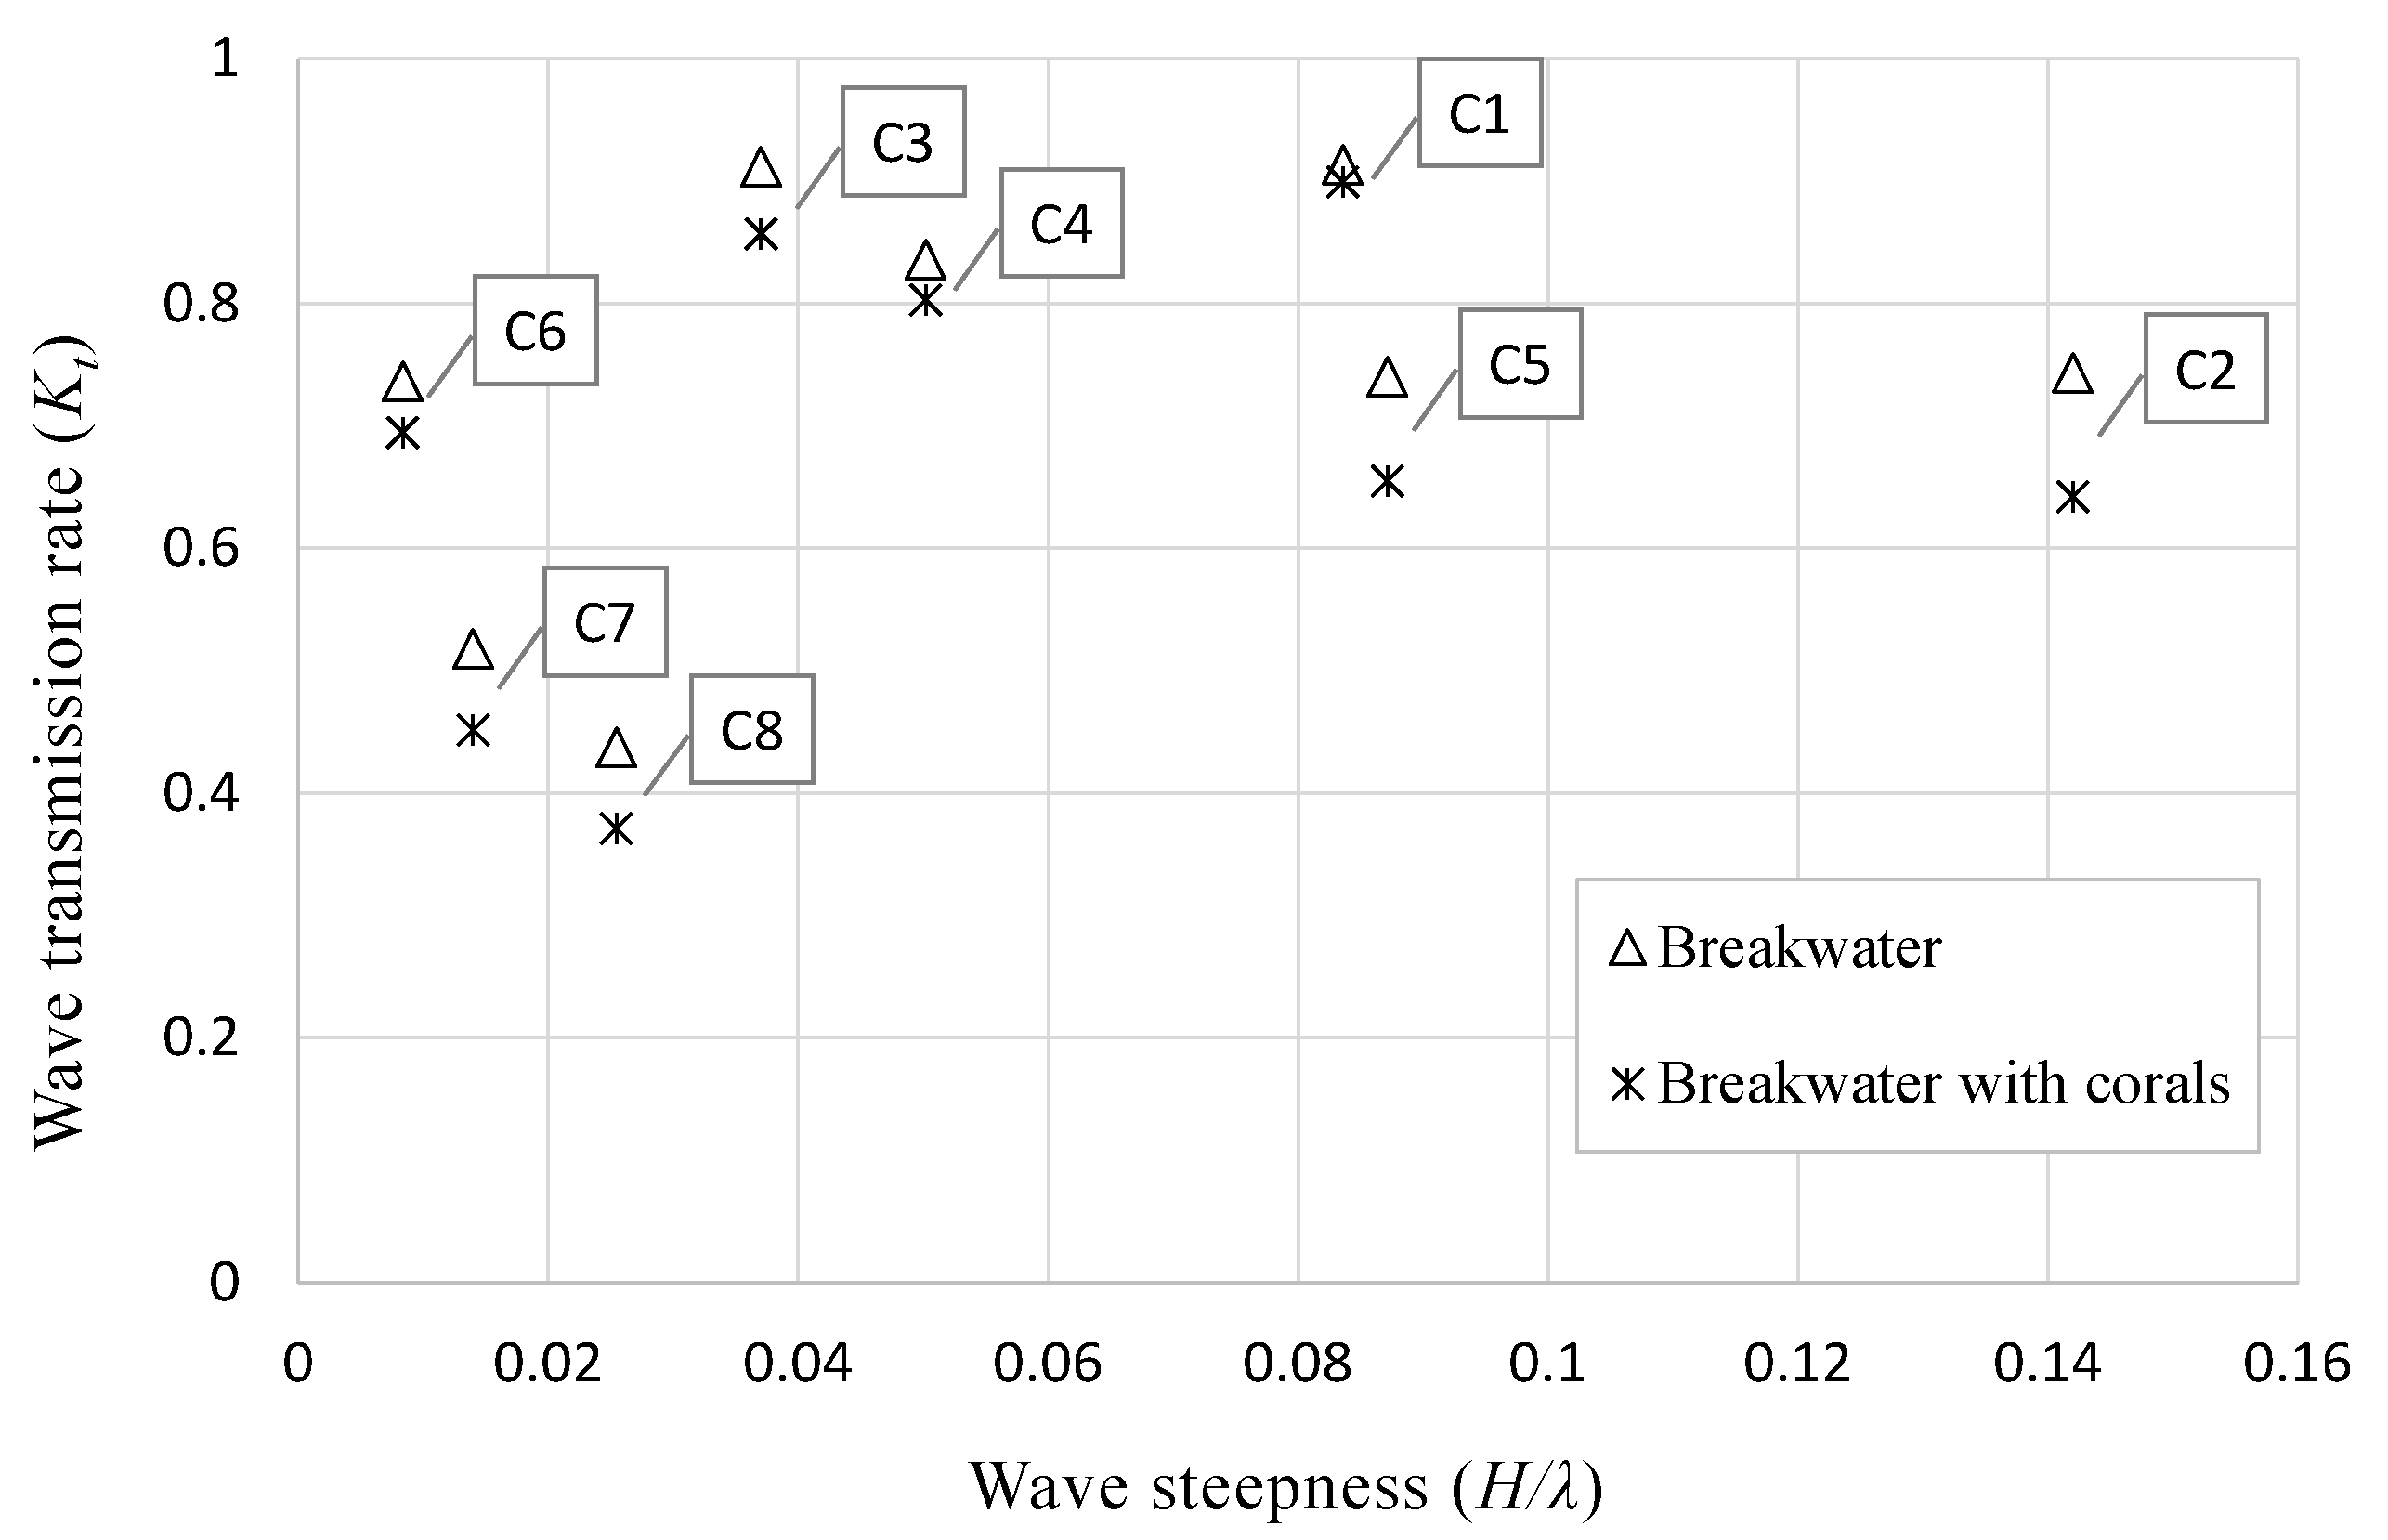
Wave-transmission rates, defined by the ratio of the wave height after the model over the wave height before the model (incident wave height), vary with the configuration of the model, the water level and wave steepness (Figure 4, Figure 5 and Figure 6). In most cases, the breakwater with the fragments of coral skeletons on it shows less transmission (i.e., more wave dissipation) compared with the breakwater only configuration. Transmission rates vary from 0.28 to 0.97 for the breakwater only configuration and from 0.20 to 0.94 for the breakwater with the coral skeletons on it. Figure 4, Figure 5 and Figure 6 show that wave transmission rates increase as water levels increase. Exploring the figures in conjunction with Table 4 reveals that for a given water depth, transmission rates are found to decrease as wave period increases while for a given wave period, transmission rates increase with wave steepness. It is thus clear that the presence of the coral skeletons enhances the wave-reducing capacity of the reef model reducing the wave transmission rate with their contribution depending on the wave and water conditions.
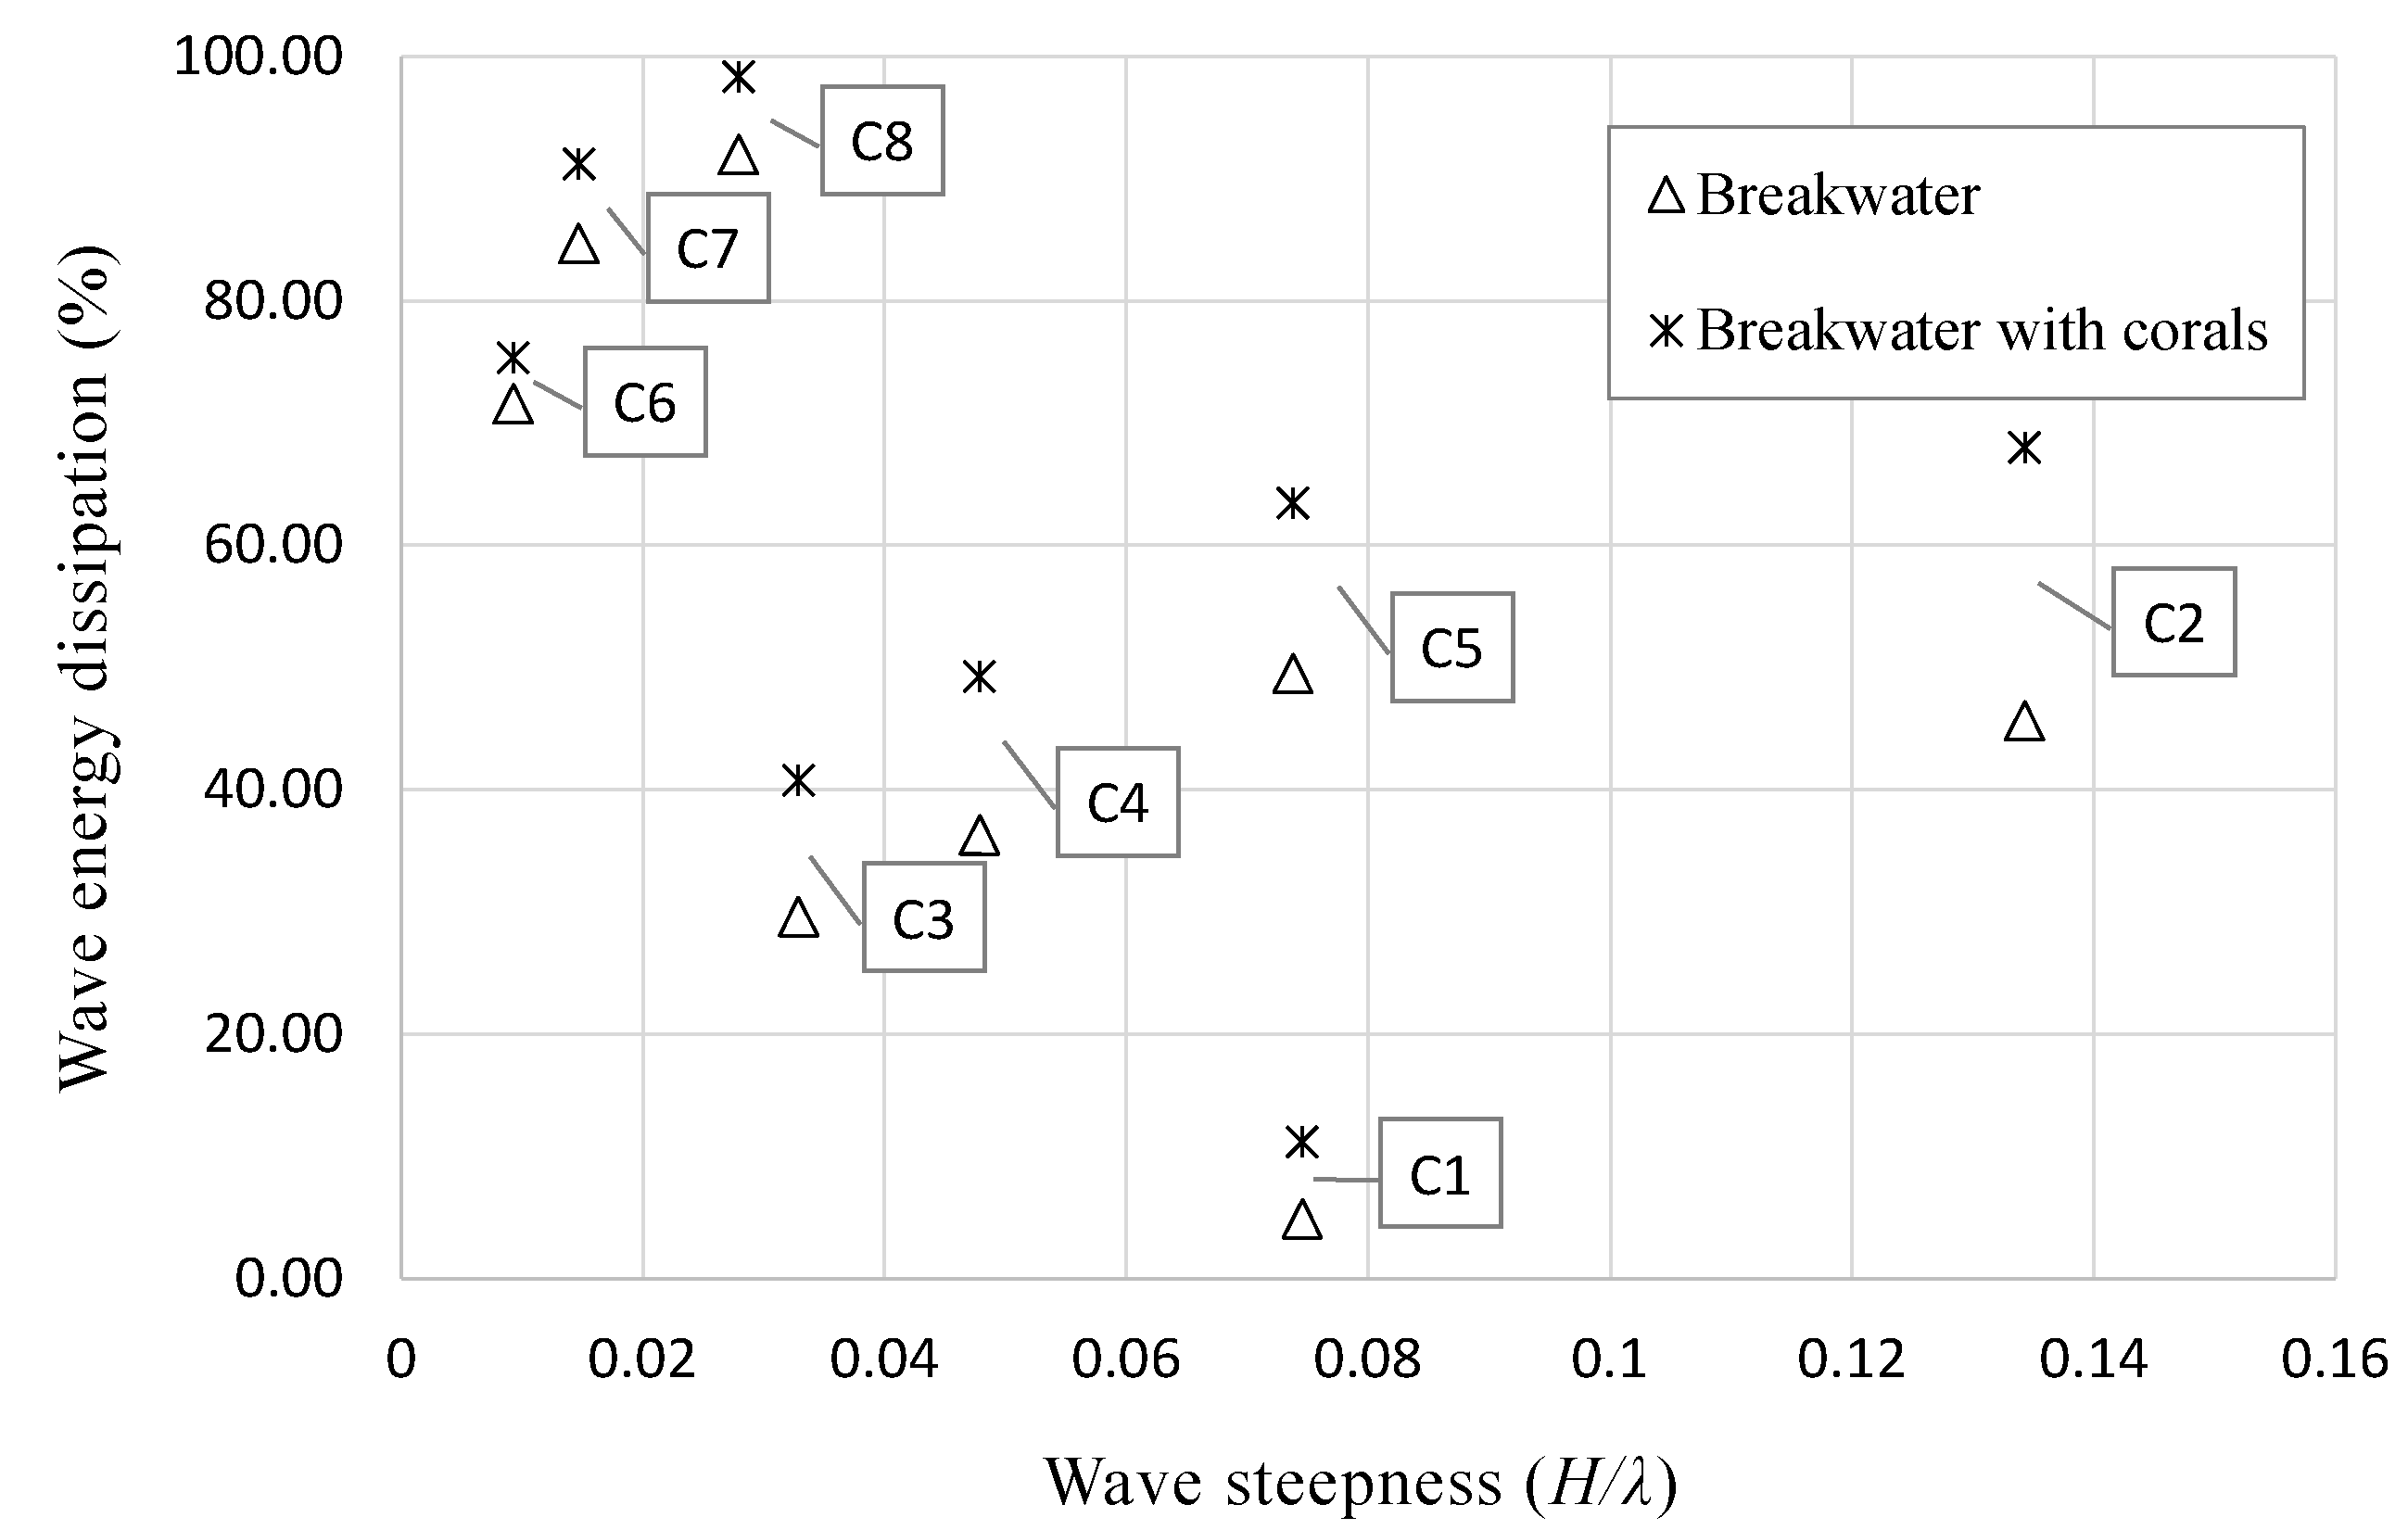
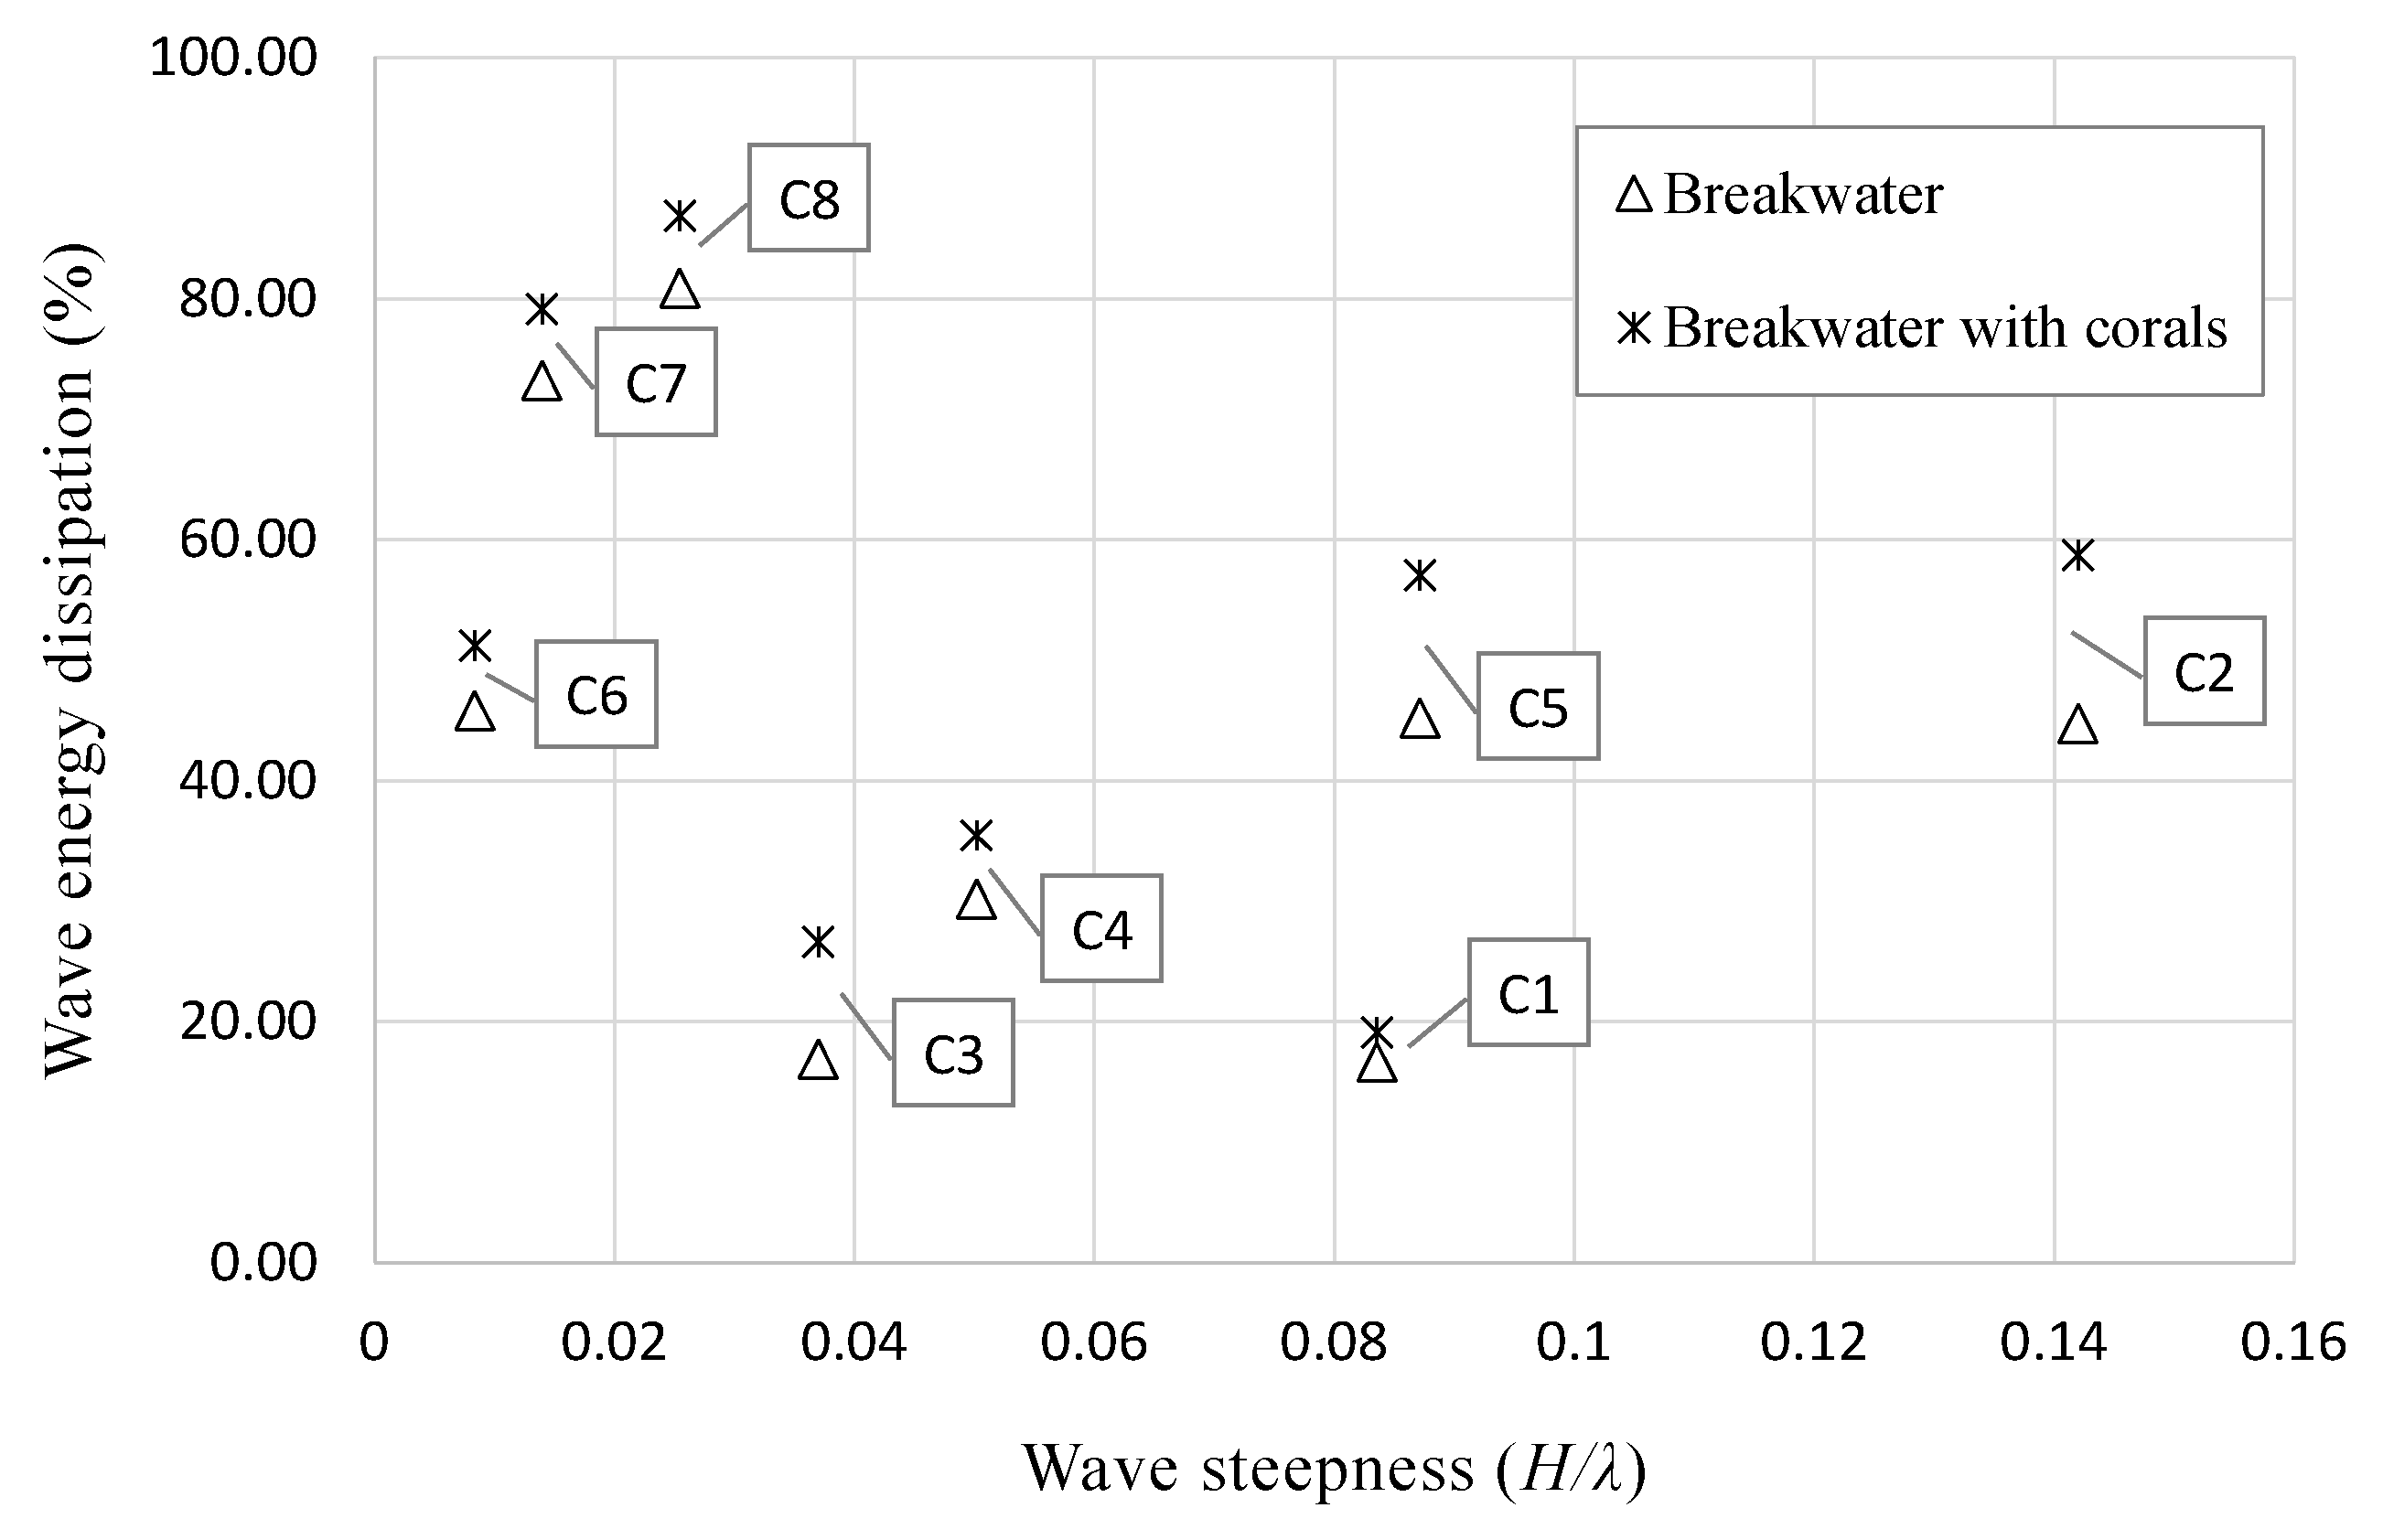
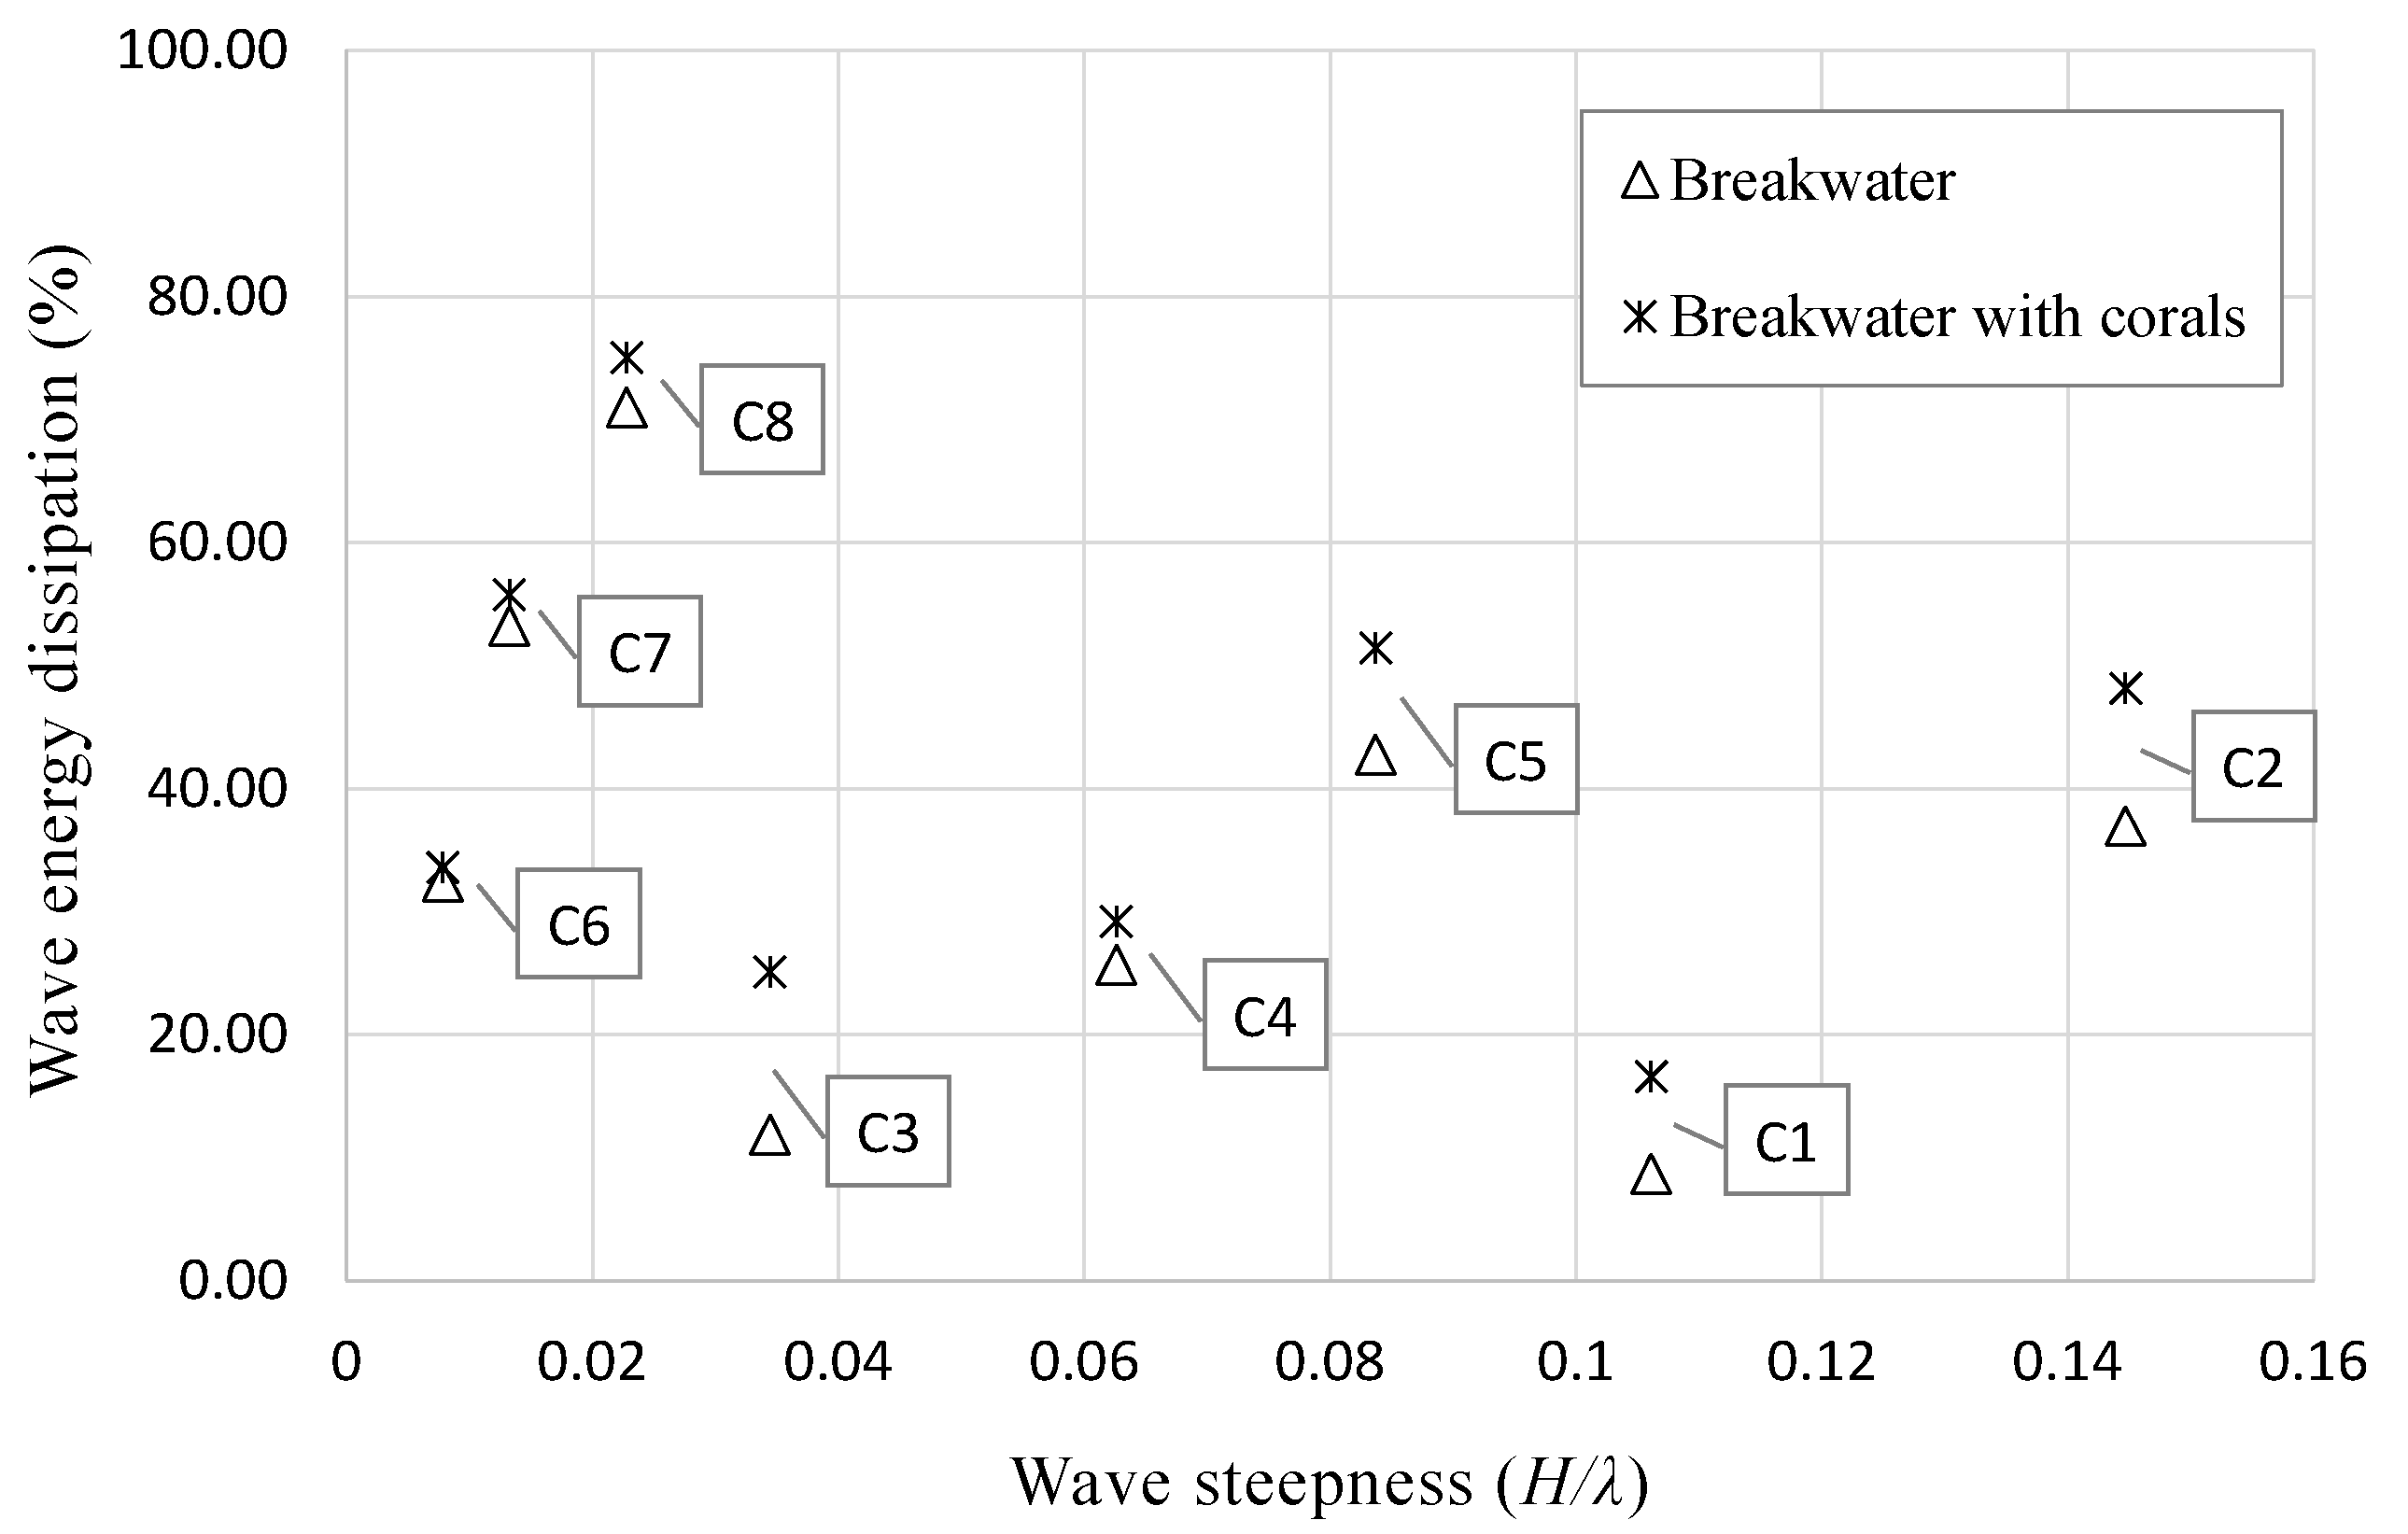
Using the wave-heights obtained through the analysis of water-level measurements before and after the model for each test, the wave-energy dissipated by the reef model was calculated. Similar to the wave-transmission rate analysis, the contribution of the corals on the dissipated energy was computed by subtracting the dissipated energy estimated for the breakwater substructure obtained by testing the model without coral skeletons from the dissipated energy obtained through the testing of the artificial coral reef model (breakwater substructure model with staghorn coral skeletons on top of it). It should be noted that since only regular waves were considered in this study, the peak frequency of the waves is assumed to be constant. As a result, any changes in the wave spectrum can be directly correlated to wave density energy based on small amplitude wave theory. Figure 7, Figure 8 and Figure 9 show that corals increase wave-energy dissipation with their contribution depending on the water level and wave steepness. The maximum relative wave-energy dissipation observed for the artificial coral reef model is approximately 98% of the incident wave energy and is recorded for Condition 8 (wave period of 5 s and amplitude of 0.30 m) with a water depth of 0.55 m. The relative wave-energy dissipated by the breakwater and the corals at this condition are approximately 92% and 6%, respectively. Overall, the wave-energy dissipation attributed to the corals varies from approximately 1% (Condition 6 with a water depth of 0.75 m) to 22% (Condition 2 with a water depth of 0.55 m) of the incident wave energy.
Table 5 summarizes the above results reporting the relative contribution of the corals in the total wave-energy dissipation provided by the coral-reef model for the different wave conditions and water levels. The coral contribution varies from approximately 56% (Condition 1 with water depth of 0.55 m) to 3% (Condition 6 with water depth of 0.75 m). Their contribution is found to be higher in shallow water conditions and under high frequency waves. Given that the wave-energy dissipation mechanism remains the same between the two configurations of the reef model (no wave breaking was induced by the presence of the fragments of coral skeletons on top of the breakwater model), the contribution of coral skeletons is attributed to friction. These results are in agreement with the relative wave-energy dissipation reported in literature [11,17,38].
Water-level measurements were further explored to evaluate bottom friction induced by the presence of coral skeletons on the reef model under the different wave/water conditions. Frictional dissipation has been extensively studied using analytical and numerical models, as well as laboratory and field measurements [19,36,39,40]. However, to the best of the authors’ knowledge, no study has focused on isolating the frictional effect provided by coral skeletons. Dean and Dalrymple [41] showed that wave frictional dissipation can be determined as:
ε = 0.6 f w ρ U r m s 3
where ε is the average rate of wave-energy dissipation, ρ is seawater density, f w is the wave friction factor, and U r m s is the root-mean-square of wave-induced velocity at the bed. Kamphuis [42] observed that the wave friction factor depends on the relative roughness of the reef (the ratio of the typical wave orbital excursion to a roughness length of the bottom surface). Previous field studies of waves over John Brewer reef in Australia [43], the reef flat in Kaneohe Bay [25], and the forereef of Moorea [26] have found the wave friction factor, f w , can take values from 0.1 to 0.3. However, more recent field measurements on the forereef of Palmyra Atoll [44] revealed higher wave friction factors associated with the structural complexity of the reef.
In this study, the bottom friction coefficient is computed from the wave-energy flux values calculated on the basis of water-level measurements. The loss rate of wave energy through coral friction is taken as the product of the relative contribution of coral skeletons in total wave-energy dissipation (Table 5) over the projected model width of 1.1 m as [45]:
D f = ρ f w 16 π ( σ sinh ( k h ) ) 3 H 3
where h is the water depth on the reef flat, f w is the bottom friction coefficient, σ is the angular wave frequency and k is the wave number, and H is the significant wave height (see Appendix A for details). Figure 10 shows the calculated coral friction coefficients in relation with the Reynolds number for conditions with fully developed turbulent flow (Re > 4000) reflecting thus typical prototype conditions [19,46,47]. The friction coefficient varies between 0.01 and 0.23 which lies within the range observed in previous field measurements [25,26,43]. Less turbulent and laminar conditions were excluded from this part of the study as frictional forces in such conditions depend on the boundary layer thickness and the viscosity of the fluid.

4. Discussion

In this study, it is hypothesized that the artificial coral reef model acts as a submerged breakwater structure dissipating wave energy through wave breaking and friction with the coral skeletons enhancing frictional wave dissipation. The relative contribution of coral skeletons on the frictional wave dissipation is assessed through water-level data analysis and the calculation of wave-transmission and wave-energy dissipation, two dimensionless parameters that can be used also to project the performance of a scaled coral reef with similar characteristics at the prototype site. Wave theory is thus explored to explain the difference in the wave-energy dissipation induced by the model under the different conditions. The interaction between waves with the artificial coral reef model depends on a number of parameters such as water depth, wave height and the wavelength. Water depth and wave heights are two other important parameters in wave-transformation processes that affect the wave motion. In general, the magnitude of water particle velocity decreases as water depth increases, and vice versa. Therefore, the increasing wave-energy dissipation for higher wave amplitudes and shallower depths can be explained by the water particle motion as waves with higher heights have water particles in orbital motions of higher amplitude and thus more interaction with the model [41]. Moreover, the study was carried at intermediate depths with wave periods of 0.83, 1.42, and 5.00 s that correspond to long, intermediate, and short wavelengths. The high values of energy dissipation found for waves with long wavelengths can thus be attributed to an increased interaction of the waves with the reef model.
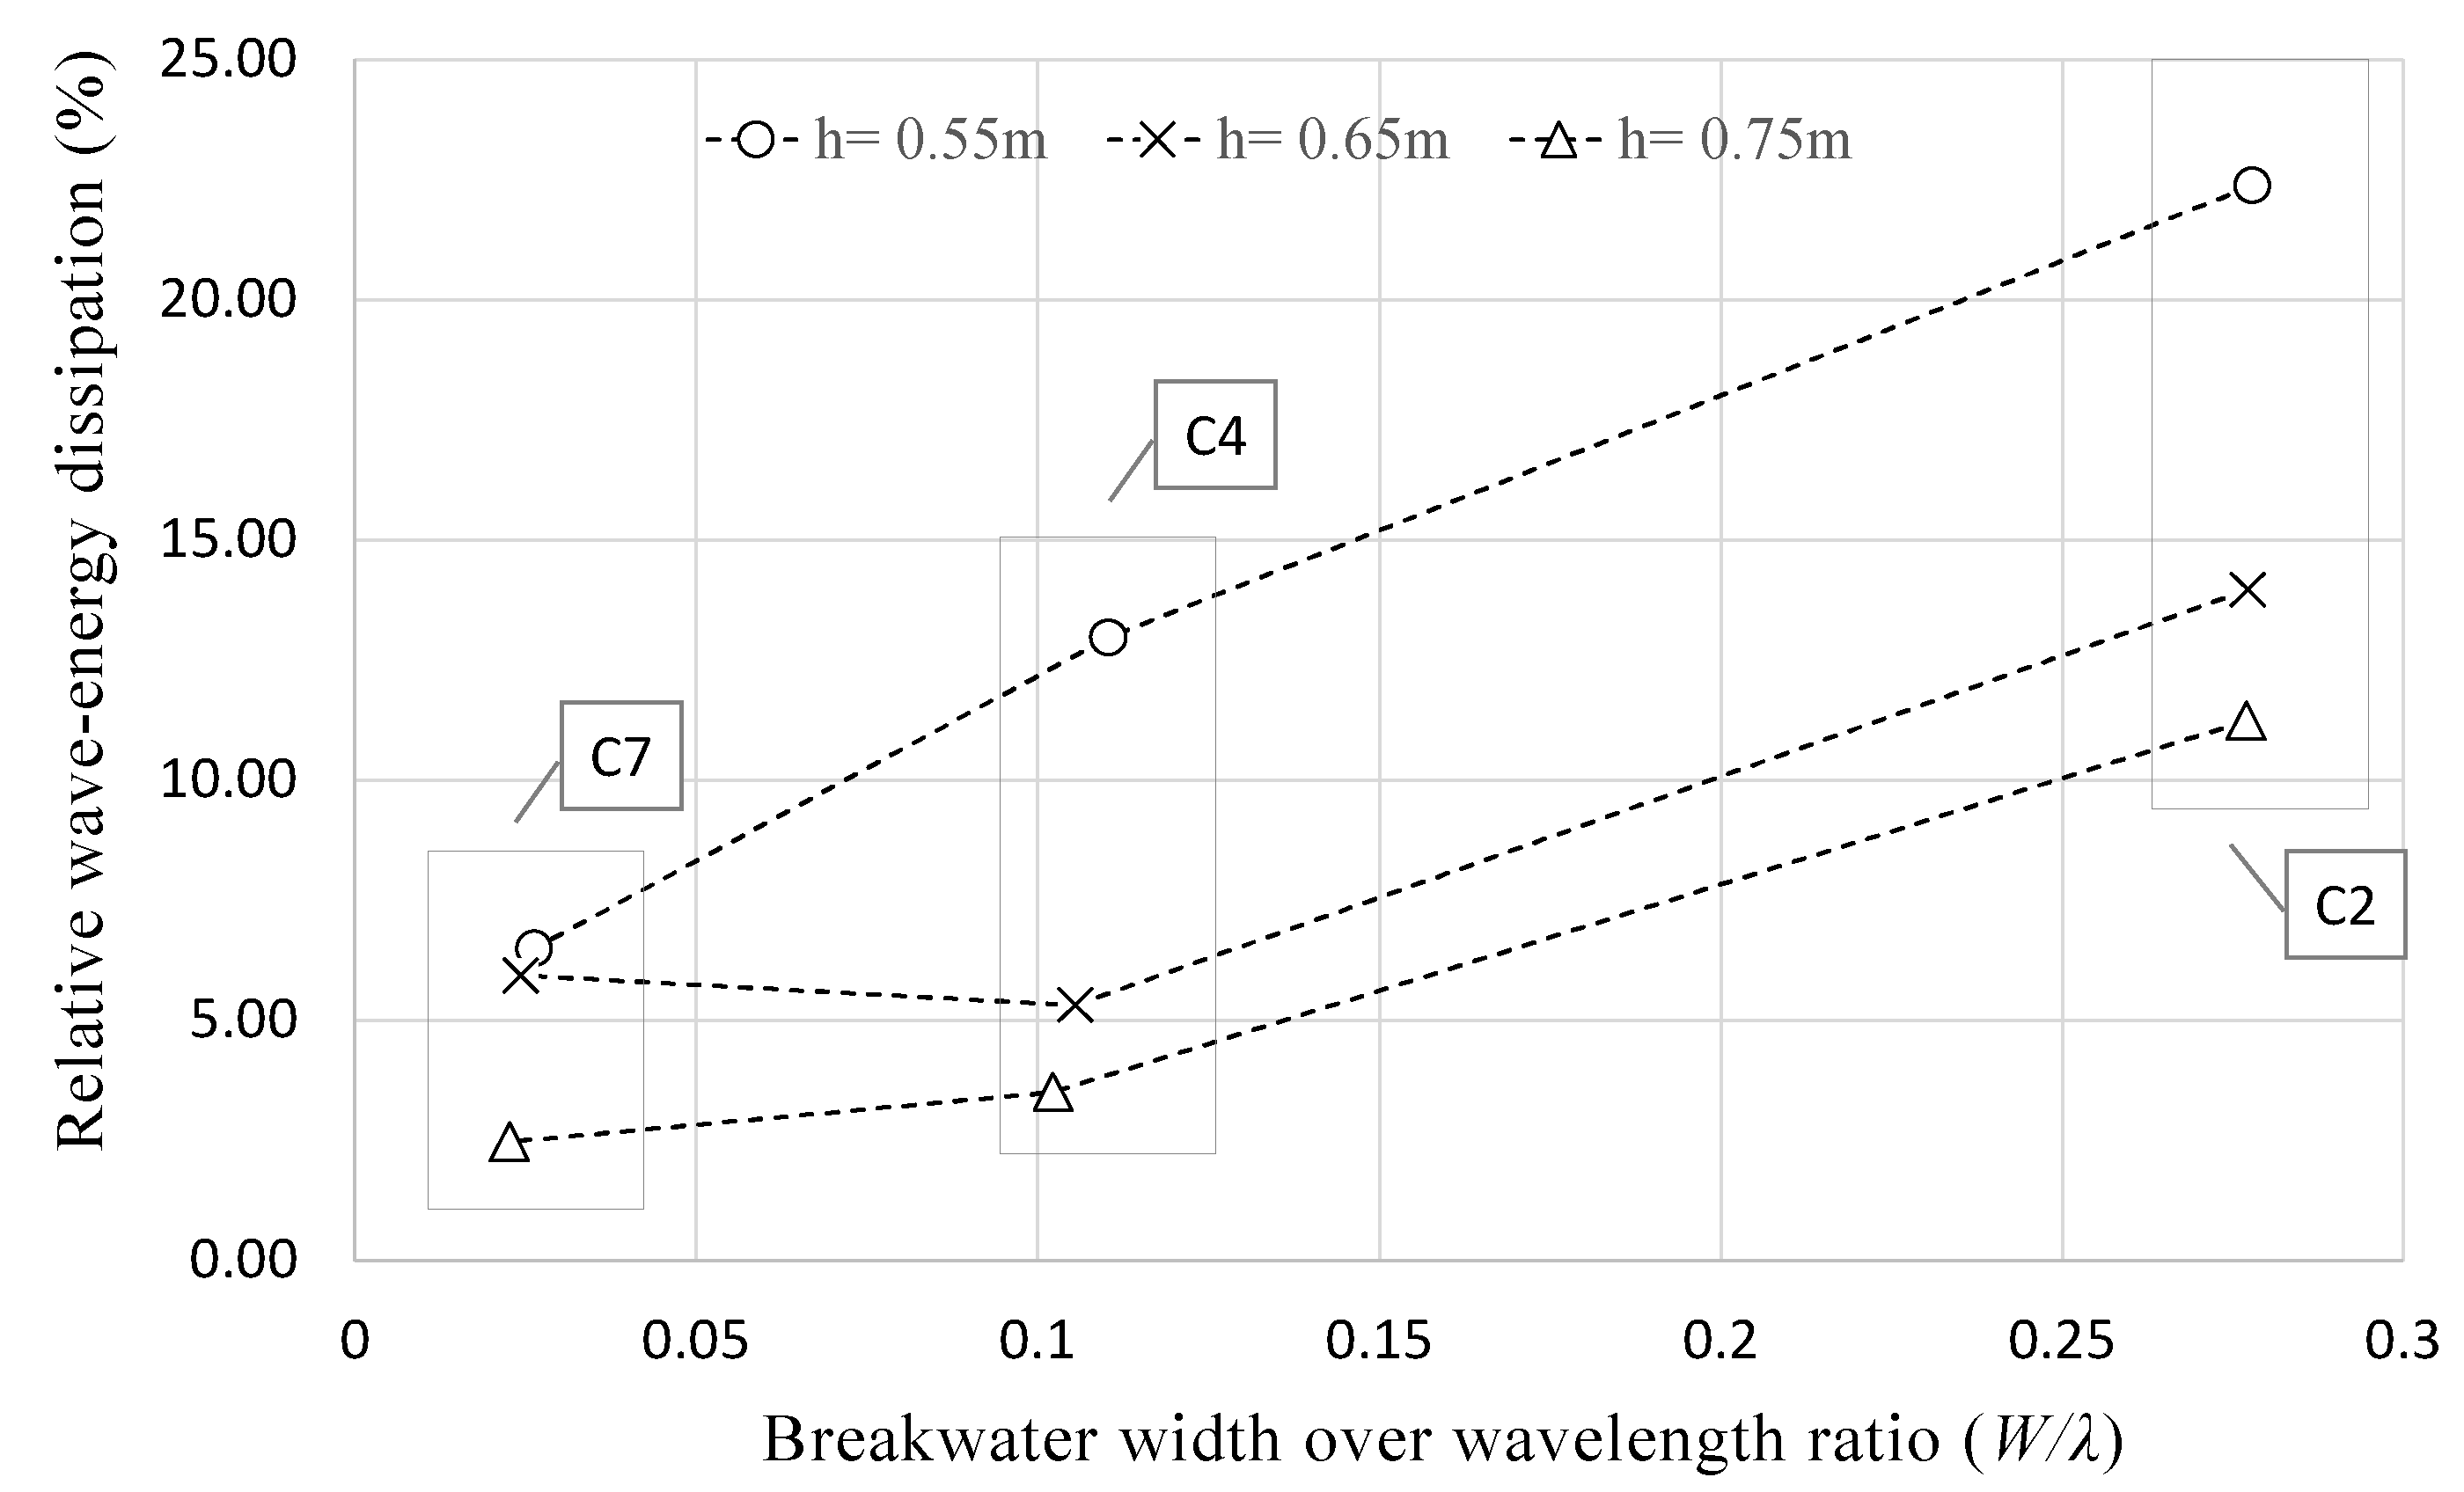
Another important parameter controlling the wave energy dissipated by the artificial coral reef model and the effect of friction is the distance that waves travel over the reef flat i.e., the reef width (Equation (A3)). Quataert et al. [16] showed that the total wave runup and the average wave height may be significantly reduced across reefs with wider lengths as reef width increases the frictional dissipation rates. In this study, since the reef model dimensions were constant, the effect of the reef width is investigated through the ratio of the reef flat width (W = 0.3 m) over the wavelength (λ). Hence, the wave-energy dissipated by the coral skeletons in conditions 2, 4, and 7 under the three prescribed water depths was considered as these conditions have the same wave height (0.16 m) and varying periods covering thus the total wavelength range considered in this study. Figure 11 shows the relative wave-energy dissipation attributed to coral friction in relation to the ratio of breakwater width over wavelength (W/λ) for conditions 2, 4, and 7. The relative wave-energy dissipation attributed to coral friction increases as the ratio of breakwater width over the wavelength increases. This confirms that wider reefs would show higher wave-reducing capacities as wave-energy dissipation is proportional to the distance. Finally, it should also be noted that although the reef top roughness (r) remains constant in this study, friction coefficients vary due to a change in the relative roughness (r/a) of the flow [19].
Finally, although not examined in this study, the results of this study are also in agreement with similar studies that take into account coral cover. Coral cover is another important parameter that affects the dissipative capacity of coral reefs with the coral friction factor increasing with coral cover and ranging from 12% to 20% [7]. Coral density and height change the hydraulic roughness of the submerged reef and consequently the wave-energy dissipation due to bed friction [19]. Future work includes, therefore, the consideration of different coral types, densities, roughness, and heights.

5. Conclusions

This study focused on the physical testing of a trapezoidal artificial reef model with and without fragments of staghorn coral skeletons on it in order to evaluate the wave dissipation provided from the reef and assessed the contribution of the corals. The tests were conducted considering three water depths and eight wave conditions using South Florida as a reference site. The analysis of the experimental water-level measurements reveals that wave transmission rates reduced with the addition of the staghorn coral skeletons on the reef model with rates varying from 0.28 to 0.97 for the breakwater only configuration and from 0.20 to 0.94 for the breakwater with the coral skeletons on it. The analysis also shows that an artificial coral reef under the prescribed water and wave conditions can decrease wave-energy from approximately 11% to 98% with the coral contribution ranging from approximately 3% to 56%. Consequently, corals can really enhance the dissipative performance of a reef. The actual values for both wave transmission and wave-energy dissipation, however, depend on the water depth, wave frequency and amplitude as these parameters define the interaction between the reef and the waves. The analysis also confirms that increasing the artificial coral reef width will reduce more wave energy with bottom friction coefficient values for staghorn corals ranging typically between 0.01 and 0.20. These experimental results provide another argument in support of exploring coral restoration for shoreline protection and combined with theoretical and numerical studies can guide their implementation.

Author Contributions

Conceptualization, M.G., J.C., B.K.H., A.C.B., D.L. and L.R.-B.; methodology, M.G., B.K.H. and L.R.-B.; formal analysis, M.G., B.K.H. and L.R.-B.; investigation, M.G., B.K.H. and L.R.-B.; writing—original draft preparation, M.G., J.C. and L.R.-B.; writing—review and editing, M.G., J.C., C.B., B.K.H., A.C.B., D.L. and L.R.-B.; visualization, M.G., J.C. and L.R.-B.; supervision, B.K.H., A.C.B., D.L. and L.R.-B.; project administration, D.L.; funding acquisition, B.K.H., A.C.B., D.L. and L.R.-B. All authors have read and agreed to the published version of the manuscript.

Funding

This project was funded by the University of Miami’s U-LINK Program, the City of Miami Beach, and the National Fish and Wildlife Foundation. The views and conclusions contained in this document are those of the authors and should not be interpreted as representing the opinions or policies of the U.S. Government or the National Fish and Wildlife Foundation and its funding sources. Mention of trade names or commercial products does not constitute their endorsement by the U.S. Government, or the National Fish and Wildlife Foundation or its funding sources.

Institutional Review Board Statement

Not applicable.

Informed Consent Statement

Not applicable.

Data Availability Statement

Data available on request.

Acknowledgments

The authors would like to thank M. Rebozo, C. Guigand, J. Amendolara, D. Rich, M. Beck, B. Reguero, S. Chao, and J. Ramaprasad for their contributions to this project.

Conflicts of Interest

The authors declare no conflict of interest.

Appendix A

Wave hydrodynamics describe the motion of water particles in waves, which depends on the water depth (h) and the wavelength (λ). Using the ratio of water depth over wavelength (h/λ), waves can be distinguished between deep-water waves (h > 0.5λ) and shallow water waves (h < 0.05λ). Ratios of water depth to wavelength ranging between 0.05 and 0.5 (0.05 < h/λ < 0.5) are considered as intermediate depths. Given that wavelength decreases as waves approach shallow waters, wave steepness defined as the ratio of wave height to the wavelength (H/λ) increases in shallow waters with waves often reaching their stability limits [42]. At this point, the crest of a wave overturns resulting in wave breaking and a reduction in wave height with wave energy as potential energy transforming into turbulent kinetic energy. The combination of potential and kinetic energy in a progressive wave can be described by its wave-energy density [48]:
E = 1 8 ρ g H 2
where ρ is the water density, g is the gravity constant, and H is the wave height. When a wave reaches a coral reef, wave steepness increases due to the change in the water depth and a series of wave-energy transformations can occur [49]: the wave may break on the reef, dissipate through its interaction with the reef or overtop it and generate wave(s) after the reef. Part of the wave might also be reflected from the reef. The energy E i ) of an incident wave can thus be expressed as the sum of the energy dissipated ( E D ), the energy transmitted ( E T ), and the energy reflected ( E R ) by the reef [50]:
E i = E D + E T + E R
Wave reflection induced by low crested coral reefs is highly depended on the ratio of structure freeboard to the wave height with reflection decreasing to zero when the submergence is twice as large as the wave height [50]. Assuming that the energy reflected ( E R ) by the reef is negligible and no wave refraction with incident waves propagating normally to the shore, the wave-energy dissipation can be expressed through the wave-energy flux (rate of energy transfer through a surface) due to wave breaking and bottom friction as [51]:
E c g x = ( D b + D f )
with E being the wave-energy density, c g being the group velocity, while D b and D f are the wave-energy flux due to wave breaking and bottom friction, respectively, given by:
D b = 3 π 16 ρ g B 3 f γ 4 h 5 H 7
D f = ρ f w 16 π ( σ sinh ( k h ) ) 3 H 3
B is the breaking coefficient (B = 1.0), f is the dominant wave frequency, γ is the breaker index (γ = 0.78), h is the water depth on the reef flat, f w is the bottom friction coefficient, σ is the angular wave frequency and k is the wave number. The coefficient B depends on the intensity of wave breaking and is considered as a function of the proportion of the foam regions on the face of the breaker [51]. Therefore, wave-energy attenuation induced by coral reefs is typically associated to wave breaking and friction [52]. Dissipating wave energy through wave breaking is very efficient as it transforms a large amount of wave energy into turbulent kinetic energy, as well as lower frequency waves [53] and wave setup [54]. Friction originating from the interaction between water particles and the corals also reduces wave energy. The amount of additional friction that occurs due to the presence of corals as compared to a smooth topography is typically represented by an enhanced bottom friction coefficient, the appropriate value of which has not been well quantified but typically assumed to be much larger, by a factor of up to or over 10 times, than a smooth bed [22]. Despite the large local friction, the impact on wave energy dissipation occurs at a much lower rate compared to wave breaking [51] and, therefore, requires a longer distance over which the friction operates to reduce the wave energy significantly. In this study, laboratory measurements of the water level before and after an artificial coral reef model were thus explored to estimate wave-energy flux due to wave breaking and bottom friction induced by staghorn coral skeletons.

Appendix B

The wave-energy dissipation induced by the artificial coral-reef model in SUSTAIN was calculated through the comparison of water-level measurements before and after the model (incident wave heights vs. transmitted wave heights). Before proceeding in the statistical analysis for the calculation of the wave heights and wave energy, water-level data were filtered to remove outliers and noise due to water splash in the air and/or voltage oscillation in the gauges as well as due to ripples on the water surface. First, outliers originating from splash and/or voltage oscillation in the gauges were removed through a simple interpolation process based on adjacent values. Water-level data were further treated to remove noise generated by ripples on the water surface caused by the wave reflection of the sidewalls in the wave tank. This was performed using a rational transfer function that rejected data with frequencies out of the range for each test condition. For instance, for a wave generated with a dominant frequency of 0.7 Hz, the filtering function will only allow waves with a frequency between 0.6 and 0.8 Hz. This process resulted in smooth water-level signals without with negligible impact on the period and amplitude of the waves. Figure A1 illustrates the data filtering before the wave analysis.
Figure A1. Original signal, signal after removal of outliers using interpolation based on adjacent values, and signal after filtering based on cutoff frequency ranges.
Jmse 09 01007 g0a1
Filtered water-level data were analyzed according to short-term wave theory to calculate wave heights [37,55]. In short-term wave analysis, wave heights are described as the vertical distance between the maximum (wave crest) and minimum (wave trough) water levels between two successive zero-up or down crossings. Moreover, calculating wave heights with the aforementioned method compensates for any water-level errors that may arise from transmitted waves to the rear SUSTAIN flume. For each condition, wave heights were calculated as the root mean square wave height also known as mean energy wave height ( H r m s ) before and after the reef model:
H r m s = H 1 2 + H 2 2 + + H N 2 N
where H1, H2, …, HN represent wave heights from the signal.
Wave heights calculated following the aforementioned process are, however, biased by wave reflection from the artificial parabolic perforated steel beach present at the end of the SUSTAIN flume. Therefore, in this study, incident and reflected waves are separated numerically from their combined signal following [31,32] as the artificial beach in SUSTAIN cannot be approximated by typical surfaces and slopes found in literature. The separation process explores the water-level measurements of the combined wave signal from two wave gauges positioned at a distance Δx from each other with water elevations modeled as two harmonic signals:
η 1 = ( η I + η R ) x = x 1 = A 1 cos ω t + B 1 sin ω t
η 2 = ( η I + η R ) x = x 2 = A 2 cos ω t + B 2 sin ω t
where η I and η R are the water elevations of incident and reflected waves, and ω is the angular frequency of the waves. Constants A 1 , B 1 , A 2 , and B 2 are calculated for the fundamental wave frequency, as well as for higher harmonics through Fourier analysis. The amplitudes of incident and reflected waves are then calculated as:
a I = 1 2 | sin ( k Δ x ) | ( A 2 A 1 cos ( k Δ x ) B 1 sin ( k Δ x ) ) 2 + ( B 2 + A 1 sin ( k Δ x ) B 1 cos ( k Δ x ) ) 2
a R = 1 2 | sin ( k Δ x ) | ( A 2 A 1 cos ( k Δ x ) + B 1 sin ( k Δ x ) ) 2 + ( B 2 A 1 sin ( k Δ x ) B 1 cos ( k Δ x ) ) 2
where k = 2 π L is the wave number and Δx is the horizontal distance between the two wave gauges. Wave amplitudes are then explored to define the reflection coefficient C r given by [56]:
C r = a R a I
In this study, the reflection coefficient varies from 0.2 for short waves up to 0.7 for long waves. After determining the wave reflection coefficients for each condition, the incident and reflected wave heights, H I and H R , are estimated as:
H I = 1 1 + C r 2 H s
H R = C r 1 + C r 2 H s
where H s is the significant wave height of the composite wave signal recorded by the wave gauges.

References

  1. Rappaport, J.; Jeffrey, D.S. The United States as a Coastal Nation. J. Econ. Growth 2003, 8, 5–46. [Google Scholar] [CrossRef]
  2. United Nations. Factsheet: People and Oceans (2017). Available online: https://www.un.org/sustainabledevelopment/wp-content/uploads/2017/05/Ocean-fact-sheet-package.pdf (accessed on 1 August 2021).
  3. Ghadimi, P.; Lamouki, M.B.P. Finite difference simulation of regular wave propagation over natural beach and composite barriers by Nwogu’s extended Boussinesq equations. Prog. Comput. Fluid Dyn. Int. J. 2017, 17, 212–220. [Google Scholar] [CrossRef]
  4. Spalding, M.D.; McIvor, A.L.; Beck, M.W.; Koch, E.W.; Möller, I.; Reed, D.J.; Rubinoff, P.; Spencer, T.; Tolhurst, T.J.; Wamsley, T.V.; et al. Coastal Ecosystems: A Critical Element of Risk Reduction. Conserv Lett. 2014, 7, 293–301. [Google Scholar] [CrossRef]
  5. Guannel, G.; Arkema, K.; Ruggiero, P.; Verutes, G. The Power of Three: Coral Reefs, Seagrasses and Mangroves Protect Coastal Regions and Increase Their Resilience. PLoS ONE 2016, 11, e0158094. [Google Scholar] [CrossRef] [PubMed] [Green Version]
  6. Reguero, B.G.; Beck, M.W.; Schmid, D.; Stadtmüller, D.; Raepple, J.; Schüssele, S.; Pfliegnerg, K. Financing coastal resilience by combining nature-based risk reduction with insurance. Ecol. Econ. 2020, 169, 106487. [Google Scholar] [CrossRef]
  7. Van Zanten, B.T.; Van Beukering, P.J.H.; Wagtendonk, A.J. Coastal protection by coral reefs: A framework for spatial assessment and economic valuation. Ocean Coast. Manag. 2014, 96, 94–103. [Google Scholar] [CrossRef]
  8. Elliff, C.I.; Silva, I.R. Coral reefs as the first line of defense: Shoreline protection in face of climate change. Mar. Environ. Res. 2017, 127, 148–154. [Google Scholar] [CrossRef]
  9. Chou, L.M.; Huang, D. Towards Coral Reef Resilience. J. Mar. Sci. Eng. 2020, 8, 563. [Google Scholar] [CrossRef]
  10. Rinkevich, B. Climate change and active reef restoration—Ways of constructing the “reefs of tomorrow”. J. Mar. Sci. Eng. 2015, 3, 111–127. [Google Scholar] [CrossRef]
  11. Ferrario, F.; Beck, M.W.; Storlazzi, C.D.; Micheli, F.; Shepard, C.C.; Airoldi, L. The effectiveness of coral reefs for coastal hazard risk reduction and adaptation. Nat. Commun. 2014, 5, 3794. [Google Scholar] [CrossRef]
  12. Gourlay, M.R. Wave set-up on coral reefs. 1. Set-up and wave-generated flow on an idealised two dimensional horizontal reef. Coast. Eng. 1996, 27, 161–193. [Google Scholar] [CrossRef]
  13. Gourlay, M.R. Wave set-up on coral reefs. 2. Set-up on reefs with various profiles. Coast. Eng. 1996, 28, 17–55. [Google Scholar] [CrossRef]
  14. Lugo-Fernández, A.; Roberts, H.H.; Suhayda, J.N. Wave transformations across a caribbean fringing-barrier Coral Reef. Cont. Shelf Res. 1998, 18, 1099–1124. [Google Scholar] [CrossRef]
  15. Vetter, O.; Becker, J.M.; Merrifield, M.A.; Pequignet, A.C.; Aucan, J.; Boc, S.J.; Pollock, C.E. Wave setup over a Pacific Island fringing reef. J. Geophys. Res. Oceans 2010, 115. [Google Scholar] [CrossRef] [Green Version]
  16. Quataert, E.; Storlazzi, C.; van Rooijen, A.; Cheriton, O.; van Dongeren, A. The influence of coral reefs and climate change on wave-driven flooding of tropical coastlines. Geophys. Res. Lett. 2015, 42, 6407–6415. [Google Scholar] [CrossRef]
  17. Costa, M.B.S.F.; Araújo, M.; Araújo, T.C.M.; Siegle, E. Influence of reef geometry on wave attenuation on a Brazilian coral reef. Geomorphology 2016, 253, 318–327. [Google Scholar] [CrossRef]
  18. Symonds, G.; Black, K.P.; Young, I.R. Wave-driven flow over shallow reefs. J. Geophys. Res. Oceans 1995, 100, 2639–2648. [Google Scholar] [CrossRef]
  19. Nelson, R.C. Hydraulic roughness of coral reef platforms. Appl. Ocean Res. 1996, 18, 265–274. [Google Scholar] [CrossRef]
  20. De Lalouvière, C.H.; Gracia, V.; Sierra, J.P.; Lin-Ye, J.; García-León, M. Impact of Climate Change on Nearshore Waves at a Beach Protected by a Barrier Reef. Water 2020, 12, 1681. [Google Scholar] [CrossRef]
  21. Buckley, M.L.; Lowe, R.; Hansen, J.E. Evaluation of nearshore wave models in steep reef environments. Ocean. Dyn. 2014, 64, 847–862. [Google Scholar] [CrossRef]
  22. Monismith, S.G. Hydrodynamics of Coral Reefs. Annu. Rev. Fluid Mech. 2007, 39, 37–55. [Google Scholar] [CrossRef]
  23. Risandi, J.; Rijnsdorp, D.P.; Hansen, J.E.; Lowe, R.J. Hydrodynamic modeling of a reef-fringed pocket beach using a phase-resolved non-hydrostatic model. J. Marine Sci. Eng. 2020, 8, 877. [Google Scholar] [CrossRef]
  24. Storlazzi, C.D.; Reguero, B.G.; Cole, A.D.; Lowe, E.; Shope, J.B.; Gibbs, A.E.; Nickel, B.A.; McCall, R.T.; van Dongeren, A.R.; Beck, M.W. Rigorously Valuing the Role of U.S. Coral Reefs in Coastal Hazard Risk Reduction; Open-File Report 2019–1027; U.S. Geological Survey: Reston, VA, USA, 2019; p. 42. [Google Scholar] [CrossRef] [Green Version]
  25. Lowe, R.J.; Koseff, J.R.; Monismith, S.G.; Falter, J.L. Oscillatory flow through submerged canopies: 2. Canopy mass transfer. J. Geophys. Res. Oceans 2005, 110. [Google Scholar] [CrossRef] [Green Version]
  26. Monismith, S.G.; Herdman, L.M.; Ahmerkamp, S.; Hench, J.L. Wave transformation and wave-driven flow across a steep coral reef. J. Phys. Oceanogr. 2013, 43, 1356–1379. [Google Scholar] [CrossRef] [Green Version]
  27. Ghiasian, M.; Carrick, J.; Rhode-Barbarigos, L.; Haus, B.; Baker, A.C.; Lirman, D. Dissipation of wave energy by a hybrid artificial reef in a wave simulator: Implications for coastal resilience and shoreline protection. Limnol. Oceanogr. Methods 2020. [Google Scholar] [CrossRef]
  28. Veron, J.E.N. Scleractinia of eastern Australia, Part I, Family Thamnasteriidae, Astrocoeniidae, Pocilloporidae. Aust. Inst. Mar. Sci. Monogr. Ser. 1976, 1, 86. [Google Scholar]
  29. Bottjer, D.J. Branching morphology of the reef coral Acropora cervicornis in different hydraulic regimes. J. Paleontol. 1980, 1102–1107. [Google Scholar]
  30. Vargas-Ángel, B.; Thomas, J.D.; Hoke, S.M. High-latitude Acropora cervicornis thickets off Fort Lauderdale, Florida, USA. Coral Reefs 2003, 22, 465–473. [Google Scholar] [CrossRef]
  31. Goda, Y.; Suzuki, Y. Estimation of Incident and Reflected Waves in Random Wave Experiments. In Coastal Engineering 1976; American Society of Civil Engineers: New York, NY, USA, 1977; pp. 828–845. [Google Scholar] [CrossRef] [Green Version]
  32. Bogucki, D.J.; Haus, B.K.; Barzegar, M.; Shao, M.; Domaradzki, J.A. On the Nature of the Turbulent Energy Dissipation Beneath Nonbreaking Waves. Geophys. Res. Lett. 2020, 47, e2020GL090138. [Google Scholar] [CrossRef]
  33. Bogucki, D.; Haus, B.K.; Shao, M. The dissipation of energy beneath non-breaking waves. In Proceedings of the Ocean Sciences Meeting, San Diego, CA, USA, 16–21 February 2020. [Google Scholar]
  34. NOAA National Data Buoy Center-Station 42095. Available online: https://www.ndbc.noaa.gov/ (accessed on 1 August 2021).
  35. Airy, G.B. Tides and waves. In Encyclopedia Metropolitana; Biddington: London, UK, 1845. [Google Scholar]
  36. Gourlay, M.R.; Colleter, G. Wave-generated flow on coral reefs—An analysis for two-dimensional horizontal reef-tops with steep faces. Coast. Eng. 2005, 52, 353–387. [Google Scholar] [CrossRef]
  37. Kamphuis, J.W. Introduction to Coastal Engineering and Management; World Scientific: Singapore, 2000. [Google Scholar]
  38. Sheppard, C.; Dixon, D.J.; Gourlay, M.; Sheppard, A.; Payet, R. Coral mortality increases wave energy reaching shores protected by reef flats: Examples from the Seychelles. Estuar. Coast. Shelf Sci. 2005, 64, 223–234. [Google Scholar] [CrossRef]
  39. Gerritsen, F. Wave Attenuation and Wave Set-Up on a Coastal Reef. In Coastal Engineering 1980; American Society of Civil Engineers: New York, NY, USA, 1980; pp. 444–461. [Google Scholar] [CrossRef] [Green Version]
  40. Nelson, R.C. A simplified function for wave energy dissipation factor over mobile beds. Coast. Eng. 1989, 13, 149–159. [Google Scholar] [CrossRef]
  41. Dean, R.G.; Dalrymple, R.A. Water Wave Mechanics for Engineers and Scientists, Hilos Tensados; World Scientific: Singapore, 1991. [Google Scholar] [CrossRef]
  42. Kamphuis, J.W. Friction factor under oscillatory waves. J. Waterw. Harb. Coast. Eng. Div. 1975, 101, 135–144. [Google Scholar] [CrossRef]
  43. Nelson, R. Height limits in top down and bottom up wave environments. Coast. Eng. 1997, 32, 247–254. [Google Scholar] [CrossRef]
  44. Monismith, S.G.; Rogers, J.S.; Koweek, D.; Dunbar, R.B. Frictional wave dissipation on a remarkably rough reef. Geophys. Res. Lett. 2015, 42, 4063–4071. [Google Scholar] [CrossRef]
  45. Beck, M.W.; Losada, I.J.; Menéndez, P.; Reguero, B.G.; Díaz-Simal, P.; Fernández, F. The global flood protection savings provided by coral reefs. Nat. Commun. 2018, 9. [Google Scholar] [CrossRef] [Green Version]
  46. Jonsson, I.G. Wave boundary layers and friction factors. Coast. Eng. 1967, 127–148. [Google Scholar] [CrossRef]
  47. Swart, D.H. Offshore Sediment Transport and Equilibrium Beach Profiles; Publ. No. 131; Delft Hydraul. Lab.: Delft, The Netherlands, 1974; p. 244. [Google Scholar]
  48. Sorensen, R.M. Basic Coastal Engineering, 3rd ed.; Springer: New York, NY, USA, 2006. [Google Scholar]
  49. Van der Meer, J.W.; Briganti, R.; Zanuttigh, B.; Wang, B. Wave transmission and reflection at low-crested structures: Design formulae, oblique wave attack and spectral change. Coast. Eng. 2005, 52, 915–929. [Google Scholar] [CrossRef]
  50. Kim, Y.C. Handbook of Coastal and Ocean Engineering; World Scientific: Singapore, 2010. [Google Scholar]
  51. Thornton, E.B.; Guza, R.T. Transformation of wave height distribution. J. Geophys. Res. Ocean. 1983, 88, 150. [Google Scholar] [CrossRef] [Green Version]
  52. Brander, R.W.; Kench, P.S.; Hart, D. Spatial and temporal variations in wave characteristics across a reef platform, Warraber Island, Torres Strait, Australia. Mar. Geol. 2004, 207, 169–184. [Google Scholar] [CrossRef]
  53. Longuet-Higgins, M.S.; Stewart, R. Radiation stresses in water waves; a physical discussion, with applications. Deep. Res. Oceanogr. Abstr. 1964, 11, 529–562. [Google Scholar] [CrossRef]
  54. Cheriton, O.; Storlazzi, C.D.; Rosenberger, K.J. Observations and estimates of wave-driven water level extremes at the Marshall. J. Geophys. Res. Ocean. 2016, 121, 3121–3140. [Google Scholar] [CrossRef] [Green Version]
  55. Ketabdari, M.J.; Moghaddasi, A. Effects of discontinuous submerged breakwater on water surface elevation. Ocean Syst. Eng. 2015, 5, 319–329. [Google Scholar] [CrossRef] [Green Version]
  56. Barzegar, M.; Palaniappan, D. Numerical study on the performance of semicircular and rectangular submerged breakwaters. Ocean Syst. Eng. 2020, 10, 201–226. [Google Scholar]
Figure 1. The Surge Structure Atmosphere Interaction (SUSTAIN) facility at the University of Miami.
Jmse 09 01007 g001
Figure 2. (Top) the reef model in its breakwater-only configuration in SUSTAIN. (Bottom) the reef model with staghorn coral skeletons in SUSTAIN.
Jmse 09 01007 g002
Figure 3. Illustration of the experimental setup (WW: wave wire, UDM: ultrasonic distance meter). Illustration not in scale.
Jmse 09 01007 g003
Figure 4. Wave-transmission rate for the two configurations of the reef model under a water depth h = 0.55 m.
Jmse 09 01007 g004
Figure 5. Wave-transmission rate for the two configurations of the reef model under a water depth h = 0.65 m.
Jmse 09 01007 g005
Figure 6. Wave-transmission rate for the two configurations of the reef model under a water depth h = 0.75 m.
Jmse 09 01007 g006
Figure 7. Wave-energy dissipation for the two configurations of the reef model under a water depth h = 0.55 m.
Jmse 09 01007 g007
Figure 8. Wave-energy dissipation for the two configurations of the reef model under a water depth h = 0.65 m.
Jmse 09 01007 g008
Figure 9. Wave-energy dissipation for the two configurations of the reef model under a water depth h = 0.75 m.
Jmse 09 01007 g009
Figure 10. Computed coral friction coefficients for each wave/water condition versus Reynolds number.
Jmse 09 01007 g010
Figure 11. Relative wave-energy dissipation for Conditions 2, 4 and 7 under the three water depths (0.55, 0.65 and 0.75 m) as a function of breakwater width over wavelength ratio (W/λ).
Jmse 09 01007 g011
Table 1. Hydrodynamic characteristics of a prototype in South Florida.
ParameterValue
MinMax
Water depth, h (m)2.008.00
Dominant wave period, T (sec)3.906.40
Significant wave height, H s   (m)0.722.40
Table 2. Hydrodynamic parameters for the prototype-reef structure.
Co. #h (m)T (s)H (m)λ (m)h/λ (-)H/λ (-)Fr (-)Re (-)
A2.003.900.7215.740.1270.0460.172299,000
B2.003.901.5615.740.1270.0990.3743,321,000
C2.006.400.7227.410.0730.0260.177634,000
D2.006.401.5627.410.0730.0570.3837,049,000
E8.003.900.7223.140.3460.0310.04112,000
F8.003.902.4023.140.3460.1040.137139,000
G8.006.400.7249.250.1620.0150.04298,000
H8.006.402.4049.250.1620.0490.1411,089,000
Table 3. Hydrodynamic characteristics for the SUSTAIN reef model.
ParameterValues
Wave period T (s)[0.83; 1.42; 5.00]
Regular wave height H (m)[0.10; 0.20; 0.30]
Water depth h (m)[0.55; 0.65; 0.75]
Table 4. Testing conditions for the model in SUSTAIN.
Co. #T (s)H (m)H/λ (-) Fr (-)Re (-)
h = 0.55 mh = 0.65 mh = 0.75 mh = 0.55 mh = 0.65 mh = 0.75 m
C10.830.100.0930.1460.1150.0971390550280
C20.830.160.1480.2340.1840.15645101580510
C31.420.100.0370.1390.1040.083662059903690
C41.420.160.0590.2230.1660.13314,04011,00012,180
C51.420.240.0880.3350.2490.20033,37033,19021,770
C65.000.100.0090.1490.1120.09043,67034,93029,900
C75.000.160.0140.2390.1790.144110,09097,57085,970
C85.000.300.0260.4480.3360.271396,420322,360253,080
Table 5. Contribution of coral skeletons in the total wave-energy dissipation provided by the reef model.
Co. #Relative Contribution of the Corals in the Total Wave-Energy Dissipation [%]
h = 0.55 mh = 0.65 mh = 0.75 m
C156.313.047.7
C232.923.823.3
C327.636.652.8
C426.315.012.0
C522.020.716.8
C65.010.53.2
C77.17.54.4
C86.56.95.3
Publisher’s Note: MDPI stays neutral with regard to jurisdictional claims in published maps and institutional affiliations.