Article

Assessment of and Adaptation to Beach Erosion in Islands: An Integrated Approach

by
Olympos Andreadis
,
Antonis Chatzipavlis
,
Thomas Hasiotis
*,
Isavela Monioudi
,
Evangelia Manoutsoglou
and
Adonis Velegrakis
Department of Marine Sciences, University of the Aegean, 81100 Mytilene, Lesvos, Greece
*
Author to whom correspondence should be addressed.
J. Mar. Sci. Eng. 2021, 9(8), 859; https://doi.org/10.3390/jmse9080859
Submission received: 23 July 2021 / Revised: 7 August 2021 / Accepted: 8 August 2021 / Published: 10 August 2021
(This article belongs to the Section Coastal Engineering)

Abstract

:
Island beaches, which form significant natural and economic resources, are under increasing erosion risk due to sea level rise. The present contribution proposes an integrated methodological framework for the evaluation of the socio-economic significance of beaches and their vulnerability to sea level rise and the design of effective adaptation measures. The approach comprises four steps: (i) beach ranking on the basis of their socio-economic significance and vulnerability in order to prioritize adaptation responses; (ii) monitoring of the hydro- and morphodynamic regime of the most highly ranking beaches using field observations and modelling, (iii) assessment of the sediment volumes required for beach nourishment under different scenarios of sea level rise and nourishment designs; (iv) evaluation of the marine aggregate potential of the adjacent areas that can be used for beach nourishment. The framework was applied to the Greek island of Chios, which has many beaches that are already under erosion. The methodology was shown to provide a structured approach for the assessment and response to erosion of the most vulnerable beach.

1. Introduction

Beaches are critical coastal environments. They form a substantial fraction of the global coastline [1], are important habitats in their own right [2], have a high hedonic value and provide protection from coastal flooding to their backshore ecosystems, assets and infrastructure [3]. Tourism, an important economic activity, has been increasingly associated with vacationing wholly, or partially, at coastal locations and beach recreational activities according to the Sun–Sea–Sand (3S) model [4]. Therefore, beach aesthetics and adequate carrying capacity and infrastructure are crucial for the tourism sector and the economy as a whole [5,6].
At the same time, beaches face increasing erosion [1,7,8,9,10,11]. Beach erosion can be differentiated into: (a) irreversible shoreline retreat due to mean sea level rise and/or negative coastal sedimentary budgets that force beach landward migration and/or drowning [12] and (b) short-term erosion caused by storm surges and waves, which may or may not result in permanent shoreline retreats but can, nevertheless, be devastating [13].
Erosion is particularly alarming for island beaches due to: (i) their (generally) limited dimensions and diminishing sediment supply, e.g., [14]; (ii) the deterioration of the nearshore ecosystems that provide protection from marine erosion [15,16]; (iii) their increasing backshore development, which has increased asset exposure and their crucial role in the island economies [4,17,18]. The projected relative mean sea level rise, combined with potential increases in the intensity/frequency of energetic events [19], will certainly exacerbate beach erosion with severe impacts on coastal ecosystems, infrastructure/assets and the beach hedonic value and carrying capacity for recreation/tourism [20,21].
It appears that the assessment of the current and future beach erosion risk, and the availability and effectiveness of requisite adaptation options is fundamental for the resilience and sustainable development in island settings [22,23]. At the same time, there are limitations in the feasibility of the risk assessment with the required spatio-temporal resolution as well as in the design and implementation of effective adaptation options, despite their obvious socio-economic benefits [24], due to the limited availability of the necessary financial and human resources, e.g., [13,25]. Therefore, assessments at island (regional) scales are particularly important, e.g., [21,26], as they can inform the planning of integrated adaptation policies at the island level and efficient allocation of the limited resources.
Regarding adaptation options, the socio-economic importance of beaches and the low effectiveness of hard coastal defenses (groynes, offshore breakwaters, seawalls and revetments) to protect the beach carrying capacity for recreation under increasing sea levels, e.g., [27,28], suggest that beach nourishment (replenishment) should be considered as the first potential adaptation option, at least for beaches with high socio-economic significance. However, beach nourishment in island settings depends on the availability of suitable filling sediments, preferably from local sources. As marine aggregates (MA) form the most suitable, but often scarce, material for beach replenishment [29,30], the availability/sustainability of local MA deposits should also be considered.
Against this background, the aim of this contribution is to develop and implement, on an island scale, a methodological framework for the evaluation of and the adaptation to beach erosion. This framework incorporates four different steps: (a) ranking of island beaches in terms of their socio-economic significance, exposure and vulnerability to sea level rise in order to prioritize the adaptation response; (b) study of the hydro- and morphodynamics of the highest ranking beach (according to the previous assessment) to gain a better insight on the erosion processes at local level; (c) assessment of the needs for sedimentary material required for the beach nourishment under different scenarios; (d) evaluation of the marine aggregate potential in the adjacent region. Chios island in the North Aegean Sea, Greece (Figure 1a) was selected as the case study for the proposed framework due to its size (the fifth largest Greek island), its developing touristic activity and its increasing beach erosion problems, e.g., [31].

2. Materials and Methods

2.1. Prioritization Framework Using a Multi-Criteria Approach (Step 1)

An indicator-based framework was developed to rank beaches, at an island scale, according to their socio-economic significance and vulnerability to sea level rise. Information on the geo-spatial characteristics (length, max. width, area, sediment type), human development features (i.e., accessibility, density of backshore assets) and socio-economic parameters (e.g., beach carrying capacity, touristic activity) was collated for all Chios beaches, on the basis of the satellite images and related optical information/tools available in the Google Earth Pro application. The subaerial (‘dry’) beaches were digitized from the most recent images as polygons, bounded on their landward side by either natural boundaries (vegetated dunes and/or cliffs) or permanent artificial structures (i.e., coastal embankments, seawalls, roads, and buildings) and on their seaward side by the shoreline. To avoid inconsistency, digitization was carried out by a unique analyst who followed consistently the above beach delimitation rules. Following this procedure, the characteristics of the 153 Chios beaches were identified. From the historical imagery available on the Google Earth Pro application, the most recent clear satellite image was selected for the digitization of each beach. The available remote sensing images are not synoptic at the island scale, i.e., they have been collected in different years and seasons (within the period 2006–2017). There are inherent uncertainties, particularly with regard to the synoptic widths due to inter-annual and seasonal variability. Nevertheless, such uncertainty cannot be avoided when working at an island scale.
The first stage of the prioritization analysis was to select the most important beaches, in terms of their touristic development/ecosystem services, using the Technique for Order of Preference by Similarity to Ideal Solution (TOPSIS) multi-criteria method. TOPSIS was chosen because of the large number (153) of studied beaches, which makes the pairwise Analytical Hierarchy Process (AHP) method complicated and time-consuming; according to Zavadskas et al. [32], the TOPSIS ranking performance is much less affected by this number as well as by the number of criteria (indicators) used compared with other available methods. Τhe socio-economic and environmental indicators that were selected were: (1) the degree of touristic activities, based on the number of hotels and restaurants at and in the vicinity of the beach; (2) the number and frequency of the visitors at the beach (interviews from the locals and optical information available online); (3) beach accessibility, on the basis of the state of the road that leads to the beach and the distance from the main road network (none, in the case of only marine access); (4) beach development based on the presence of facilities and organized recreational/touristic activities (e.g., changing rooms, bins, umbrellas, sun beds, sea sports, lifeguards); (5) the beach carrying capacity, which is directly associated with the beach area (10 m2/per person); (6) Blue Flag awards (in 2021), which play an important role in attracting tourists as they are perceived as markers of beach quality by users [33]; (7) special environmental protection regime (e.g., NATURA 2000 and wetlands protected by Presidential Decree 229/AAP/2012). All indicators are qualitative, with the exception of the beach carrying capacity (beach area).
The second stage involved a detailed pairwise Analytical Hierarchy Process (AHP) multi-criteria approach for selected beaches, i.e., the 15 highest ranking beaches (from the first stage) in order to prioritize them in terms of not only their socio-economic/environmental significance but also in terms of their erosion risk under climate variability and change (CV&C). The selected beaches have been mostly classified as ‘developed’, and, also, a large number of them have been awarded with “Blue Flag” certifications (2021) and are easily accessible. So, the indicators 3, 4 and 6 were no longer useful for the second part of the analysis. Regarding beach vulnerability to sea level rise (a) the maximum beach width, (b) the sediment texture and (c) the beach “urbanization”, that is, the density (%) of backshore infrastructure/assets in relation to the shoreline length, were selected as indicators. Beach width is a crucial feature, as this not only controls the vulnerability to beach erosion but also the exposure of the backshore infrastructure/assets. The sediment texture not only influences the beach erosion potential but can also be used as an indicator of the beach recreational (hedonic) value since sandy beaches are more preferable to users than those consisting of gravel, pebbles or mixed sediments. Indicators (a) and (c) are quantitative and were estimated using the tools available in the Google Earth Pro application. For the sediment texture, quantitative data were not available and a value of 1–9 as weight value scale [34,35] was used. Sandy beaches were assigned a nine (9), beaches with mixed sediment texture (sand, gravel and pebbles) a five (5) and those with coarse sediments (gravels and pebbles) a three (3). The major potential impact of the CV&C on beaches is associated with the increasing erosion under sea level rise, with the exposure increasing with decreasing beach dimensions. Beach retreat due to relative sea level rise (RSLR) was estimated through morphodynamic model ensemble, based on the methodology described in Monioudi et al. [21]. Astronomical tide was also considered in the estimations. The RSLR under CV&C and tide projections along the Chios coastline were abstracted from the JRC (Joint Research Centre) database (https://data.jrc.ec.europa.eu/dataset/deff5a62-074c-4175-bce4-f8f13e0437a3, accessed on 7 June 2021) [36]. The multi-criteria approach was performed under the current conditions and under 2 future scenarios, the RCP4.5 and for the years 2050 and 2100. The analysis (see Section 3.1) found that Komi beach (Figure 1) not only ranks very high in terms of economic and environmental significance but it also appears to be the most vulnerable beach to erosion; thus, Komi beach was selected for further study.

2.2. Coastal Geomorphology and Hydrodynamics (Step 2)

Onshore and inshore morphological and sedimentological information was collected down to about 25 m water depth during repeated field surveys (24 February 2020, 4–5 July 2020, 3–6 January 2021 and 10–12 February 2021) (Table 1 and Figure 1b). The ‘dry’ beach was mapped using a dense grid of elevation measurements (cross-shore transects spaced at about 50 m) with an RTK-DGPS (Topcon HiPer) system. Bathymetry was recorded once, using a digital (Hi-Target HD 370) echosounder operating at 200 kHz and a TopCon DGPS, deployed from a 5.2 m rigid hull inflatable boat (RIB) along a grid of dense crossing transects (23 transects spaced approximately every 40–50 m, crossed by 9 lines almost parallel to the shoreline). The tidal range in the area was small, being less than 0.2 m [37]. In addition, a Starfish 450F high-resolution side scan sonar (SSS) and the SonarWiz 6.2 software for post-processing, analysis and mosaicking of the collected sonographs were also used to map the morphology, texture and habitats of the seabed. This information was ground-truthed with 18 surficial samples using a Van Veen grab and 13 drop camera (GoPro Hero 3+ silver edition with 720 p video resolution, mounded on a rigid frame) stations (Figure 1b). Shoreline sediment samples at 8 stations along the beach were also repeatedly (3 times—Table 1) collected with a small shovel. In the laboratory, the samples were split using the quartering method and they were washed with distilled water (for the removal of salt particles). No other sediment treatment was caried out (i.e., organic matter removal). Due to the coarse nature of the sediments, the samples were dry-sieved with a set of −4 to 4 Ø screens, at 1 Ø interval following Folk [38] and the grain size statistical parameters were calculated using the Gradistat software [39].
In order to monitor the nearshore wave conditions during the energetic winter period, a RBRvirtuosoD wave pressure sensor operating in high frequency (6 Hz) and a burst mode was deployed during a 5-month period (4 October 2020–5 March 2021) at about 8 m water depth (Figure 1b) to obtain a (medium term) record of the energetic winter wave conditions. This information was supplemented by additional nearshore, high frequency hydrodynamic information collected in a 2-day experiment during an energetic event (10–12 February 2021). In this experiment, an Acoustic Doppler Velocimeter (ADV—Nortek Vector) was deployed at a water depth of 1.7 m and operated at a sampling frequency of 8 Hz in a dense burst mode (burst duration of 256 s, burst interval of 15 min). The ADV sensor was installed at a distance of 0.2 m above the seabed so that its sampling volume was within the bed boundary layer, close to the seabed (4 cm above). It is noted that, due to the increased sediment mobility during the deployment, the ADV sensor was buried towards the end of the deployment; thus, records after 12 February 2021–11:05 (after the 178th burst of the time series) are not included in the analysis. In addition, a Davis Vantage Vue Pro2 meteorological station was deployed at the beach (at 4 m elevation) recording, among others, wind velocity and direction (1 min sampling period) for the period of the experiment.
In order to gain further insights into the nearshore hydrodynamics, an advanced hydro–morphodynamic model was employed. The model solves high order Boussinesq equations to describe nearshore hydrodynamics. The classical Boussinesq equations have been extended so as to include higher order nonlinear terms that can describe better the propagation of highly nonlinear waves in the shoaling zone. Detailed description of the model has been provided elsewhere [40,41,42,43,44]. The model was set up using the detailed beach elevation/water depth information collected in the present study and forced by representative wave conditions as recorded by the RBR sensor and estimated by previous studies through wind-wave hindcasting using wind information from the area [31]. More specifically, the model was run in a stationary mode for 2 wave forcing conditions: (1) a case of moderate wave action (Hs of 1.4 m, Tp—6.0 s, simulation duration of 12 h), and (2) a case of increased wave action (Hs—2.5 m, Tp—6.6 s, simulation duration of 9.5 h). Wave angle was set almost perpendicular to the beach in both cases (approaching from the southeast—157.5° N). Validation of the results on the nearshore hydrodynamics was provided through the short-term, high-frequency hydrodynamic observations obtained by the ADV deployment (Figure 1b).
ArcGIS 10.2 was used for comparison of shoreline positions and mapping purposes and Matlab R2016a scripts for the meteo-ocean time series analysis.

2.3. Estimation of Beach Nourishment Requirements (Step 3)

Due to the high economic significance and the high vulnerability of Komi (and the other beaches) to the present and the future climatic conditions, adaptation measures are considered as necessary. As mentioned above, there can be different adaptation options, including ‘hard’ (e.g., groynes, seawalls, offshore breakwaters) and ’soft’ (beach replenishment) measures. However, as it appears vital for the island economies to maintain the beach carrying capacity under sea level rise (and storm erosion), e.g., [5,6], beach nourishment should be considered as the ‘Plan A’ option. Therefore, the sediment volume (and costs) required to nourish sustainably the beach under sea level rise has been estimated according to the following procedure.
A beach morphodynamic parameter of crucial importance for the design of both beach nourishment and hard coastal protection schemes is the closure depth, i.e., the maximum offshore water depth that limits the offshore extent of the beach sediment ‘reservoir’ [45]. In the present study, the closure depth has been estimated according to Hallermeier [46], who proposed an expression based on the annual extreme wave heights and corresponding periods that occur for at least 12 h each year. This information was provided by the analysis of the available RBR winter records, assuming that the most energetic events occur during this period. As the Hallermeier [46] expression for the closure depth estimation utilizes the offshore (deep water) extreme wave heights and corresponding periods, the RBR records obtained at 8 m water depth were translated to deep water conditions using linear wave theory e.g., [47].
The widely used approach proposed by Dean [45] was then used to estimate the volume of the nourishing (filling) sediments, taking into account the type of beach profile (‘intersected’ or ‘non-intersected’) following the beach nourishment as well as the required sediment size. Eight (8) nourishment scenarios, divided into two main groups, were considered. The first group comprised four scenarios, according to which the beach width would be increased by 10 m (Δy0 = 10 m), whereas the second group also comprised four scenarios with a double beach width increase (Δy0 = 20 m). For both of these groups, two different scenarios of beach elevation increase (Β = 0.5 and 1.0 m) and two scenarios of filling sediment sizes (i.e., d50F of 1.5 mm (−0.6 Ø), similar size to the average original beach sediment, and d50F of 2.0 mm (−1 Ø), slightly coarser than the original beach material) were considered. For indicative purposes, nourishment costs for the entire beach (1100 m long) were estimated, assuming a gross mean market price of the filling sediment of EUR 10 per m3.

2.4. Marine Aggregate Survey (Step 4)

The methodological approach for the MA survey comprised evaluation of the available information on the local geology/geomorphology that provided some indications for potentially favorable locations of MA deposit occurrence [29,30]. In addition, environmental constraints and human activities were also considered. Three areas (Figure 2a) were finally identified for further study, which met the set criteria. However, the restrictions due to the COVID-19 pandemic in the previous year limited the available fieldwork time and, thus, only the closest site (offshore of the Komi beach) was finally surveyed (Figure 2).
Bathymetric data in the wider area (down to about 75 m water depth) were collected with the same systems used in the inshore survey (Figure 2b) along 28 transects spaced at about 200 m. A C-MAX CM2 side scan sonar (SSS) operated at 100 kHz was employed for the study of the seabed morphology, texture and habitats along 4 parallel survey lines. The SSS survey was constrained by the water depth (30–55 m isobaths) due to limitations stemming from the nearshore occurrence of Posidonia oceanica (priority habitat 1120, European Directive 92/43/EEC)) and the dredging capabilities. Twenty-four (24) Van Veen grab seabed samples were collected from areas deeper than 35 m (Figure 2b). A TopCon DGPS was used for navigation and positioning during all survey operations.
SSS data analysis/mapping and the sediment size analysis followed the same procedures as in the inshore survey. Yet, since the offshore samples consisted also of fine-grained material, the sediments were primarily wet-sieved through a 63 μm sieve and the finer grains were analyzed through the pipette method [38]. The coarse fraction was dried and passed through a set of sieves.

3. Results: Framework Implementation

3.1. Island Beach Prioritization for Adaptation Response

For the first stage of the analysis, in order to define the weights (or relative importance) of the indicators (1–7) adopted for the application of the TOPSIS method, AHP was initially used to perform pairwise comparisons based on expert judgments and using a 1–9 scale [34,35]. Adjustments were made to ensure the consistency of the derived pairwise matrix (Consistency Ratio, CR = 0). After identification of the possible pairs, suitable weights were assigned to each indicator/criterion using an eigenvector method. The selected indicators are not all measured in the same units; thus, vector normalization was used to ensure uniformity and comparability among the data. Then, the TOPSIS method was applied to estimate the preference scores (Figure 3a). The 15 selected beaches with the higher scores are depicted with the red color in Figure 3b.
For the second stage of the analysis, the indicators 1, 2, 5 and 7 (from the first stage) were used to describe the socio-economic and environmental significance, and the indicators (a), (b) and (c) to describe the exposure/vulnerability to sea level rise. Beach erosion risk under CV&C (RSLR + tide) was estimated using the morphodynamic model ensemble. Due to the different conditions used in the model set ups, the ensemble produced a range of beach erosion projections. The reduction in “dry” beach widths was estimated through the comparison between the projected ranges of beach retreat and the maximum recorded beach width. For the latter the “width reduction” expressed as a percentage of the current maximum width was used as an indicator instead of the “maximum width” to account for the sea level rise impacts. Sea level rise of 0.22–0.3 m, projected for the year 2050 under RCP4.5, could result in erosion/retreat of the selected beaches of between 2.5 m and 11.4 m and, consequently, to a substantial reduction in “dry” beach width (Table 2). For the year 2100 under the same RCP scenario, it appears that the selected beaches would be seriously affected due to the projected sea level rise (0.54–0.63 m); beach retreat is estimated between 5.7 m and 21.7 m and six (out of eight) beaches might be reduced by up to 100% (Table 2). Many of these beaches lack the accommodation space to retreat landwards and, as such, will suffer coastal squeeze without appropriate replenishment schemes.
The AHP multi-criteria approach was applied in order to rank the 15 selected beaches. The weights (or relative importance) of the indicators/criteria were defined using the same procedure as in the previous stage. AHP was also used to perform pairwise comparisons among the alternatives (beaches) (consistency of all the matrices was ensured) and then, using the eigenvector method, priority scales were defined for all alternatives and for each indicator/criterion. The final (global) preference score for each alternative (beach) was calculated using the Weighted Product Model (WPM). The whole procedure was totally repeated three times for the current status and for two future scenarios (Figure 3c and Table 2).
Komi, followed by Agia Fotini and Karfas consistently showed the highest scores, suggesting that these beaches are, at the same time, the most socio-economically important and vulnerable to beach erosion under CV&C and, thus, are highest in the list for adaptation measures. Scores were not substantially affected if minimum or maximum retreat projections were used. It should be mentioned that the above ranking, depends on the weights assigned to each indicator, which has been based on expert judgments; if increasing the number of the experts interviewed, then the scores might be adjusted.

3.2. Geomorphology and Hydrodynamics

Komi beach has a length of approximately 1100 m, a maximum recorded width of 35 m at the mouth of the ephemeral Katraris river and is bounded by a coastal rock formation and a small fishing harbor to the west and east, respectively. Katraris river, a major supplier of beach sediments was dammed (Kalamoti-Katraris Dam) in 2008 (Figure 1).

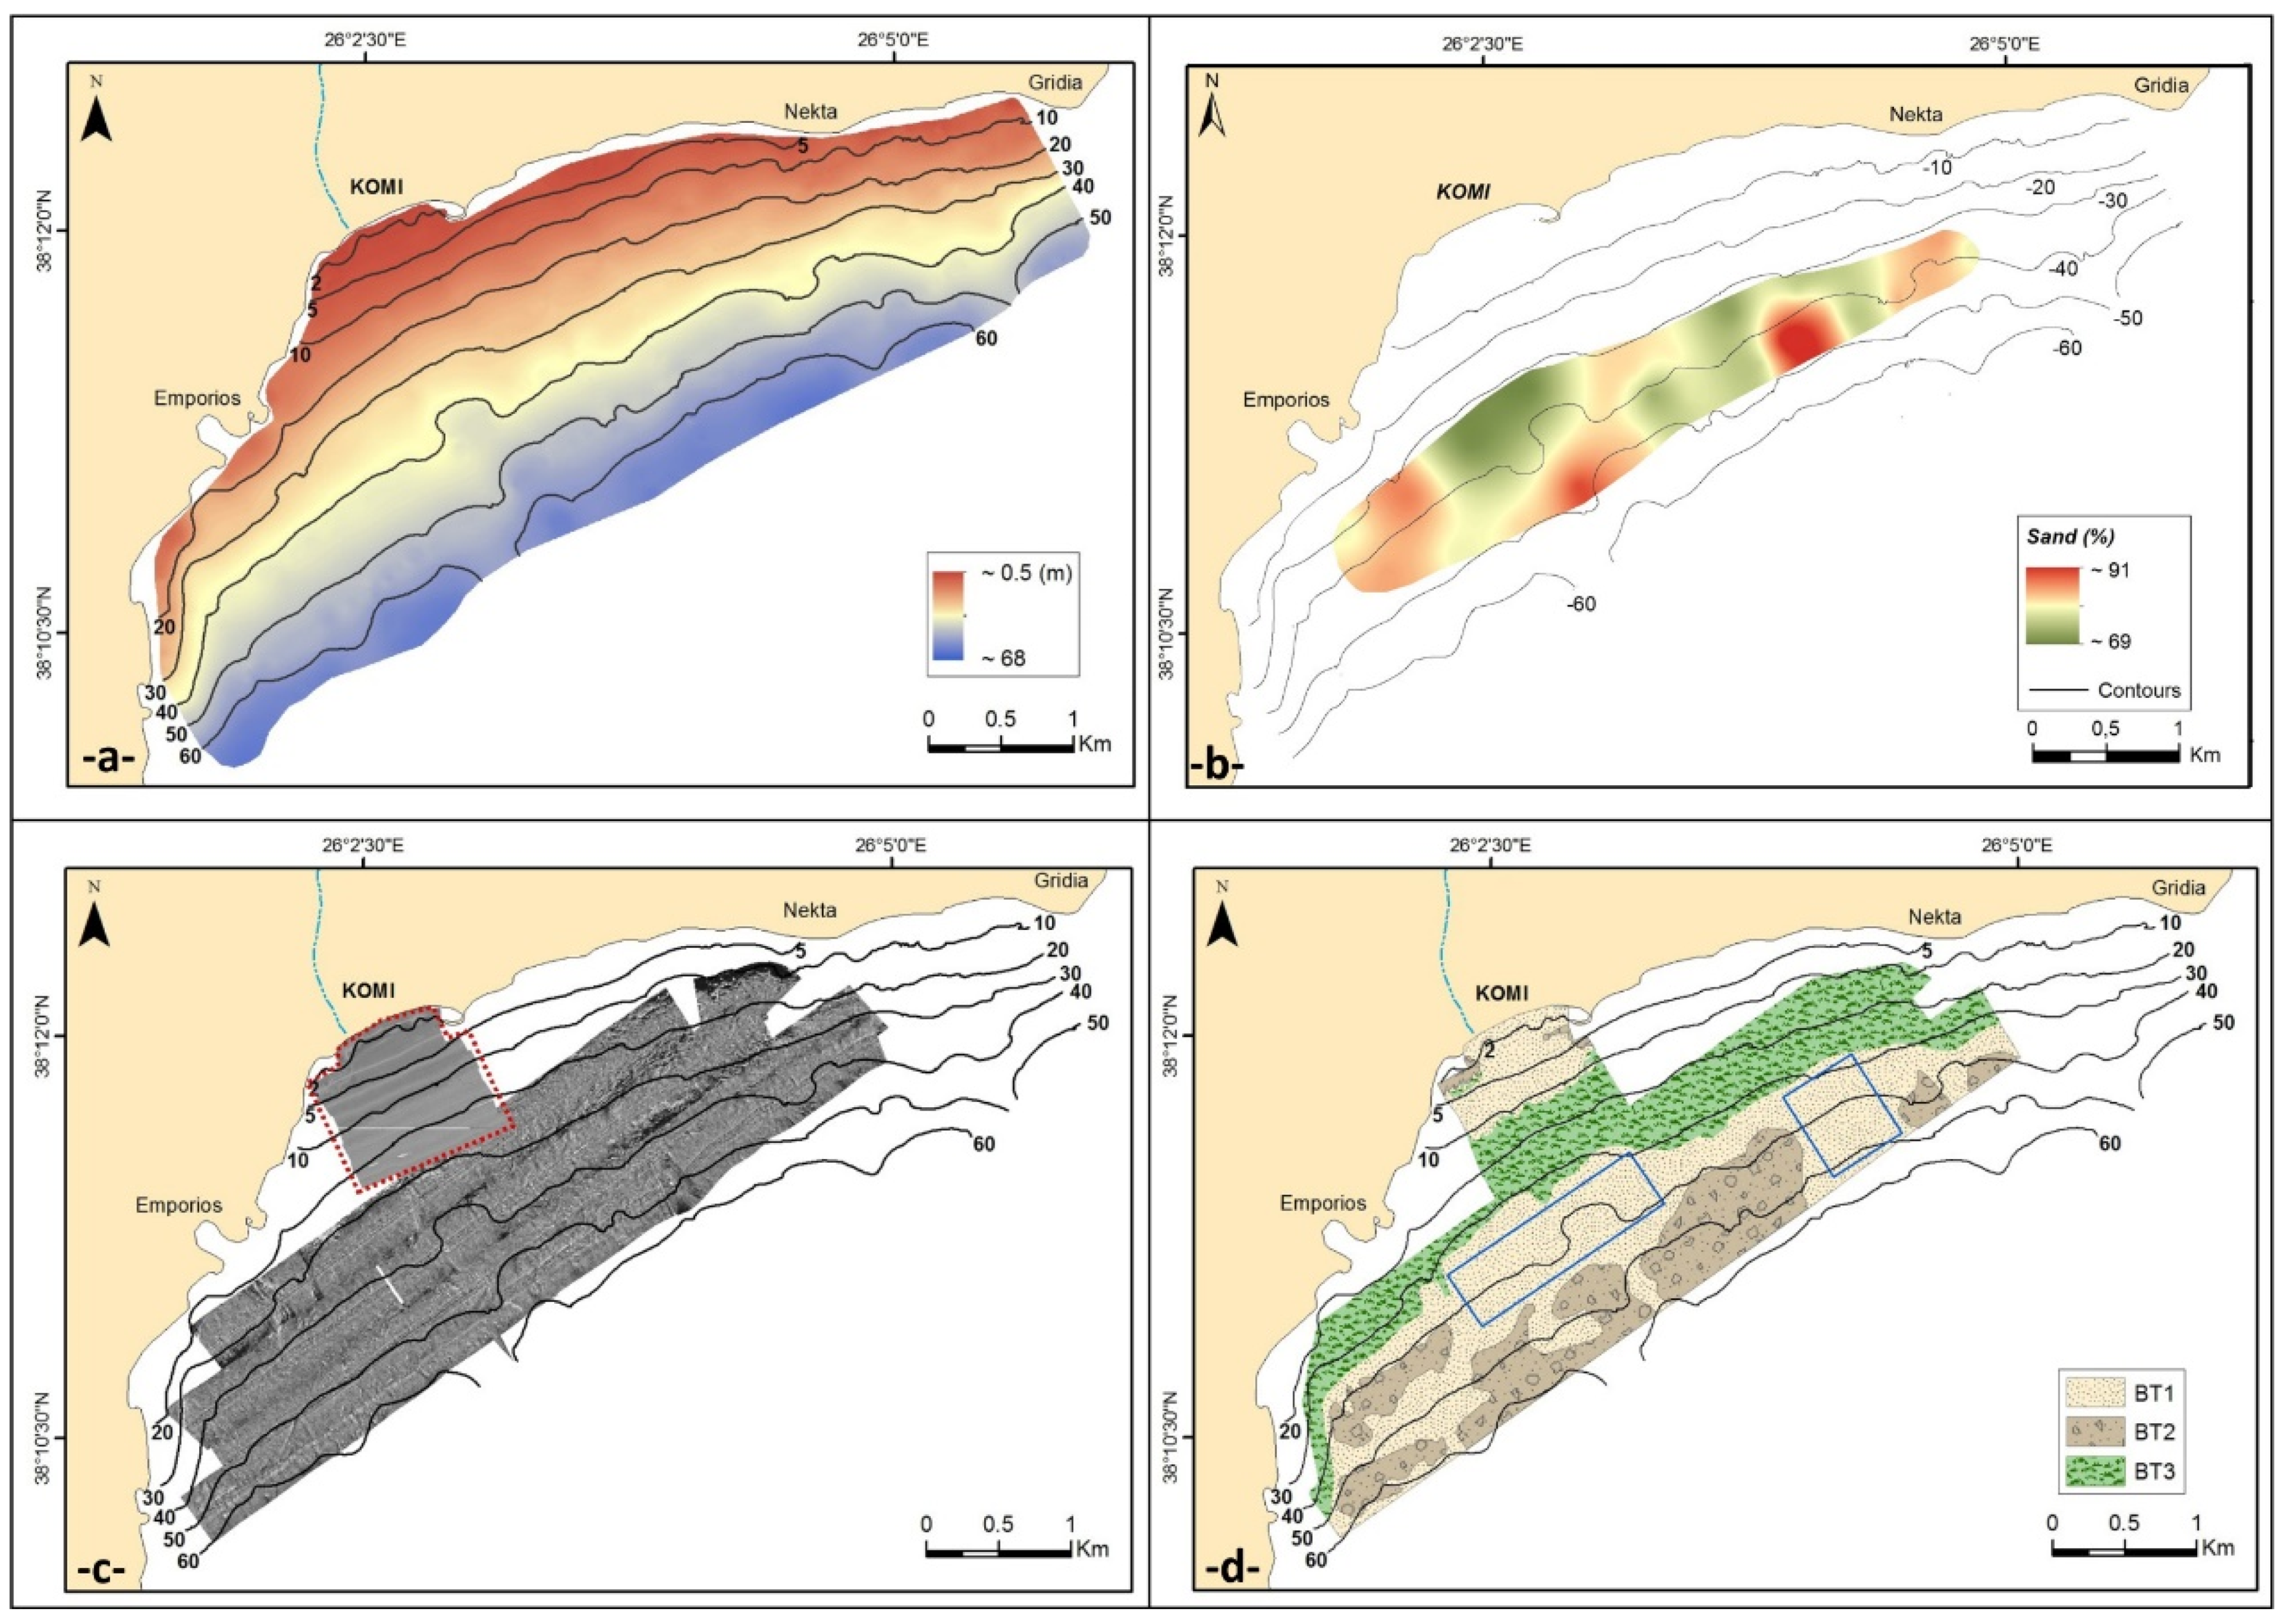
3.2.1. Geomorphology

The shallow bathymetric survey showed a generally smooth morphology down to the 20 m depth and small seabed irregularities shallower than the 4 m isobath due to the outcropping rock formations to the west and the presence of an intermittent small nearshore longshore bar (Figure 4a). Analysis of the SSS mosaic (Figure 4b) revealed three backscatter types (BT) (see Section 3.4 (Figure 8d)). BT1 has a medium reflectivity pattern suggesting the presence of medium grained sediments at water depths shallower than approximately 11–13 m. BT2 returns small high backscatter areas, with small acoustic shadow zones locally, suggesting an uneven relief; this occurs at water depths shallower than about 5 m. BT3 shows a high reflectance variability, with wavy stripes of alternating high and low backscatter that occurs at water depths deeper than 11–13 m. Drop camera (Figure 4c) and sediment sampling validated that BT1 corresponds to sandy sediments, locally showing symmetrical ripples due to the wave action, BT2 relates to hard substrate outcropping, locally neighbored by Posidonia patches, and BT3 correlates with a dense Posidonia oceanica meadow.
In terms of shoreline dynamics, comparison of the shoreline positions from the RTK-DGPS surveys found a large difference between February 2020 and February 2021, suggesting a dry beach loss (erosion) of 1800 m2 in a year, although locally some dry beach gain was also observed (Figure 4d). In general, the shoreline shows a retreat or accretion of up to 9.5 m. Even at the mouth of the (dammed) Katraris stream, erosion of up to 6 m was recorded, although the sediment volume appeared to increase onshore suggesting some sediment discharge at the same period.
Inshore sediment samples, collected shallower than 8 m, had a mean grain size of 2.2–2.8 Ø, corresponding to fine-grained sand (Figure 4e). Only in the two samples collected along the nearshore bars did the sediment mean size increase, reaching −1.1 Ø (small granules). The samples were moderately well sorted (0.51–0.70 Ø), except from the longshore bar sediments that were poorly to very poorly sorted (1.58–2.48 Ø) (Figure 4e). In general, towards shallower waters, sediments were found to be slightly coarser with better sorting.
Sediments collected repeatedly along the shoreline at specific locations proved that the grain size fluctuates through the year considerably with no apparent trends, seemingly due to the prevailing hydrodynamic regime (Figure 4f). Sediments are finer to the east, close to the fishing harbor, where also the shoreline shows minimum dynamics. In comparison, the mean grain size fluctuates considerably at the central section of the beach and towards the west, suggesting modifications also related to more intense shoreline changes. The mean grain size ranges between medium sand and small gravel, although locally, large gravels are encountered.

3.2.2. Hydrodynamic Observations
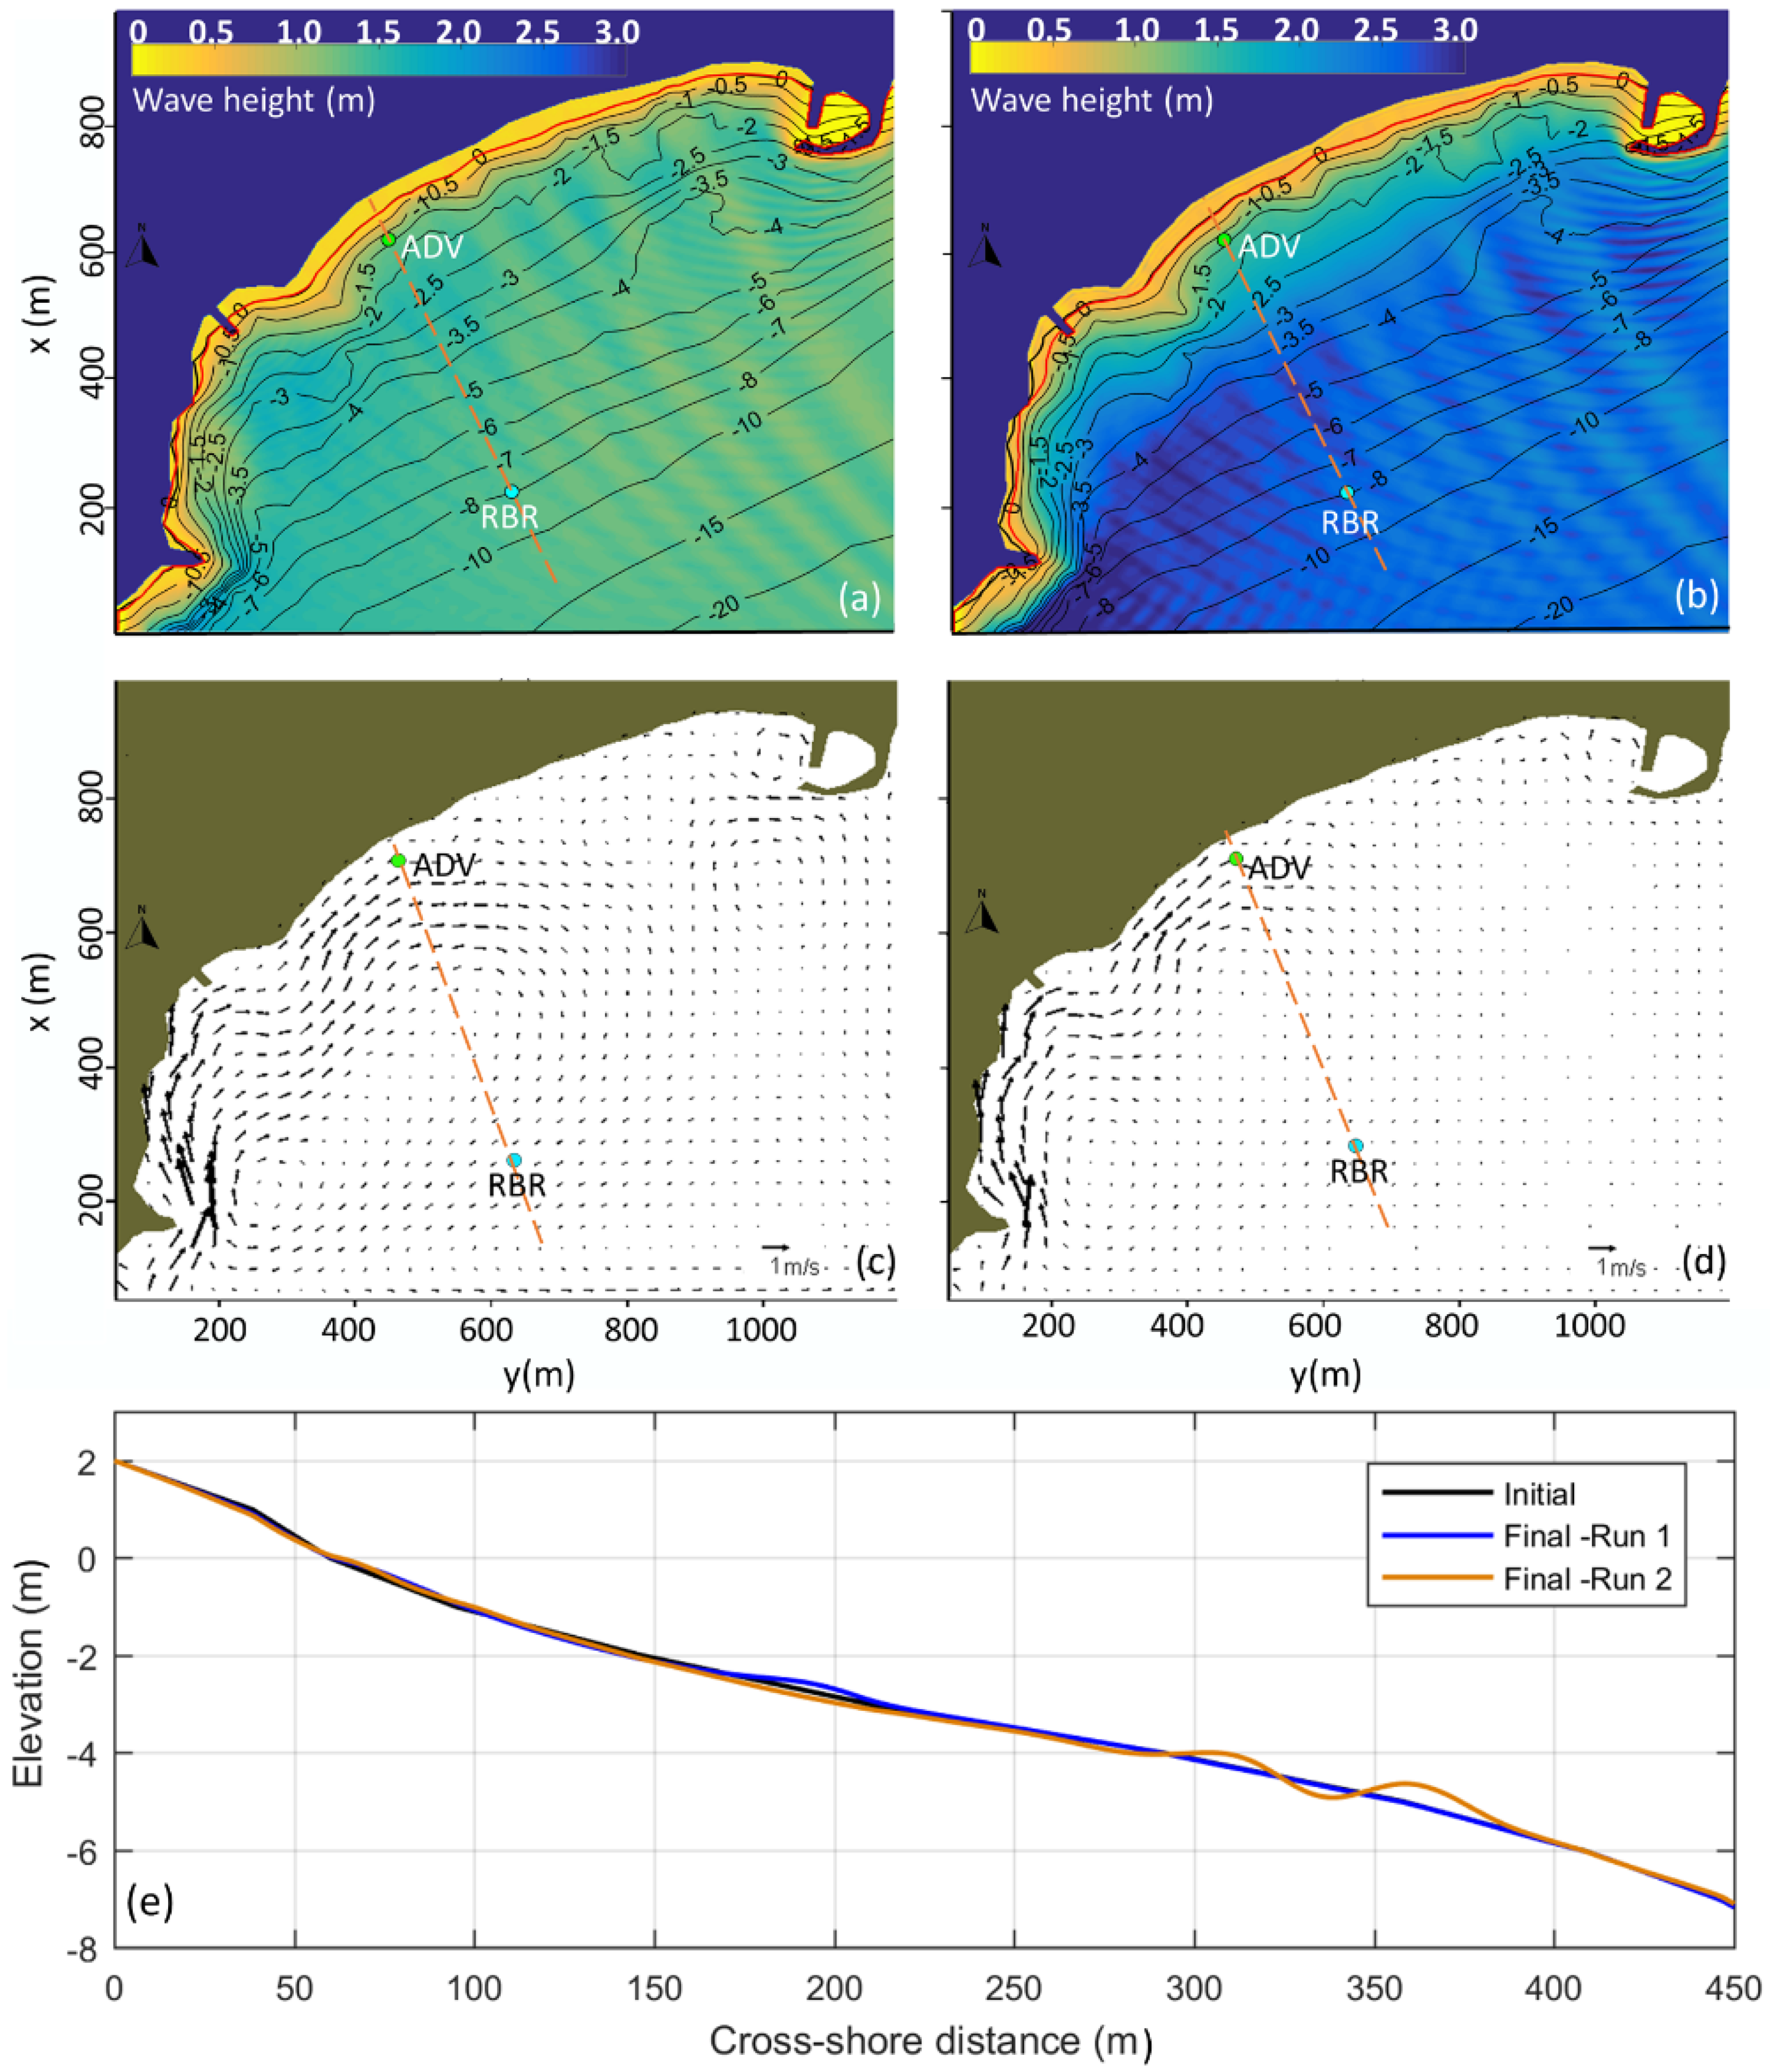
Analysis of the 5-month wave records showed that the most energetic wave events (>3000 Jm−2, zero-moment wave heights (Hm0) > 2 m) occurred between January–February 2021 (Figure 5). In total, 11 wave events were found to have wave heights of Hm0 > 1.5 m and maximum wave heights (Hmax) >3.0 m, with a duration of more than 12 h (a time criterion used for the isolation of storm events [48,49]), and most of these occurring after December (with the exception of the event recorded on 13 October 2020). The maximum recorded wave height at 8 m water depth was 5.1 m (8 February 2021), whereas the longer energetic event (Hm0 > 1.5 m) had a duration of about 5 days (7–12 January 2021). Interestingly, significant wave heights did not exceed 0.5 m during November. Regarding wave periods (both Tp and the period corresponding to Hmax (Tmax)) were found to range between 4 and 8 s in all cases.
Concurrent wave records (from the RBR and the ADV) from one of the aforementioned energetic wave events (44 h duration, 10–12 February 2021), showed that at the beginning and the end of the event, when significant wave heights were low (about 0.4 m), there were not large differences between the significant wave heights at 8 m water depth (RBR) and those recorded at 1.7 m water depth (ADV). However, as the event energy built up, the differential between the wave heights recorded at 8 m and 1.7 m water depths increased significantly (Figure 6a). During this period, the maximum Hm0 at 8 m water depth was about 2.2 m (with a peak wave period (Tp) of 6.2 s), whereas the corresponding wave conditions recorded at 1.7 m water depth were 1.5 m (Hm0) and 6.8 s (Tp). Wind data from the meteorological station deployed for the period of the simultaneous wave records showed that during the first day, wind was blowing from the southern sector (150−180°) with velocities progressively increasing, reaching ~12 m s−1 (corresponding to 5–6 Beaufort) in most cases. Towards the end of the deployment period the wind velocity gradually decreased, and the direction progressively shifted to the northern sector.
Hydrodynamic conditions were mild at the beginning of the deployment and up to the beginning of the next day (11 February 2021, 00:00), maximum zero-moment wave heights did not exceed 0.3 m, whilst the mean flow (Uxy) close to the seabed was less than 2 cm s−1 and the Reynolds shear stress (Tb) was very small (almost 0 N m−2) (Figure 6b). The energy increased significantly over the next hours and up to the night of the same day (11 February 2021, 22:00), with Hs, Uxy and Tb ranging between 0.3–1.6 m, 2–8 cm s−1 and up to 8 N m−2, respectively. The recorded peak wave period also increased from 4 to 7 s during this period. Following the peak of the energetic event, wave heights progressively decreased to Hm0 values of approximately 0.3 m, whereas the Tp stabilized at around 6 s. However, it appears that this wave height decrease did not significantly affect the flow velocity and bed shear stress (Figure 6b). It is noted that the low flow velocities recorded were due to the small distance (4 cm) of the measurement location from the seabed.

3.2.3. Simulations

With regard to the simulated waves approaching the beach, it was found that wave breaking is strongly related with the nearshore bathymetry (Figure 7). The mild slope of the nearshore bathymetry (contours of 0.5 and 2 m water depths are located at about 20 and 100 m from the shoreline respectively) seems to provide effective protection from the incoming wave action, at least for the wave conditions studied. This was more evident when checking the bathymetry of the shallow bar located at the western part of the beach (at x about 200 m, close to the groyne in Figure 7). In this area, the incoming waves break at different locations, depending on their height. In both simulations, waves did not exceed 0.2 m at the area nearshore of the 0.5 m depth contour.
The wave induced current circulation follows a similar pattern in both simulations. Current velocities of large magnitude with directions almost parallel to the coastline have been projected at and close to the rock headland at the western boundary of the beach; these progressively decrease towards the shallow bar identified to the northeast of the groyne (simulated velocities close to 0.5 ms−1 at x about 200 m) (Figure 7). Eastwards of this area (at x about 200–700 m), the nearshore circulation appears complex, affected by the seabed morphology and evidence of an offshore water transport. In the remaining eastern section of the beach (i.e., from x > 700 m) the projected current velocity is very low (<0.02 ms−1 in both simulations). It should be mentioned that validation of the model flow outputs is available only on the basis of nearshore ADV records from a single location (Figure 7); therefore, the extreme flows projected for the western section of the beach should be considered with caution.
Morphodynamic simulations were also carried out using as forcing the projected hydrodynamics, e.g., [40,42]. The greatest morphological changes under the conditions studied were projected for the western section of Komi beach. In this area, the nearshore bed level appears to decrease (erode), whereas the seabed in neighboring areas appears to accrete suggesting significant seabed sediment mobilization, particularly under the higher energetic conditions studied. A cross-shore profile that includes the locations of the field instrumentation (RBR and ADV) was extracted to investigate the projected cross-shore changes (Figure 7). It appears that in this area of mild beach slope (about 1/22) no significant seabed level changes have been projected for the nearshore areas (to a water depth of about 2 m). In deeper areas, however, bed level changes appear under the higher wave energy simulations.
It is noted, that the above hydrodynamic and morphodynamic projections cannot provide a complete picture of the energetic wave impacts on the study area due to the limited conditions studied and the lack of adequate validation of the projections. It appears that more simulations under different conditions and deployment of additional field instrumentation (particularly in the more dynamic western section of the beach) are required to provide a more complete picture of the Komi beach morphodynamics, e.g., [13]. Nevertheless, some important information emerged. First, it is evident that the western section of the beach is more dynamic than the middle and eastern section of the beach, at least under the conditions studied. This is in general agreement with the changes identified from the dry beach shoreline surveys (see also Figure 4d). Secondly, it appears that there could be sediment movement offshore under the high energetic conditions, involving mostly the finer fraction of the sediments; in this case, some of these sediments will be likely trapped in the offshore Posidonia fields (see also Section 3.4, Figure 8).

3.3. Beach Nourishment Requirements

The closure depth at Komi beach was calculated on the basis of the RBR wave information. Specifically, using the mean values of the maximum wave heights and the corresponding wave periods for 12 h (6 h before and after the time of the most extreme recorded wave event (8 February 2021, 16:00—Hmax = 5.0 m, Figure 5)), from which the offshore extreme wave height (and corresponding period) was estimated by linear wave theory e.g., [47]. Using the offshore values and the Hallermeier [46] approach, the closure depth (hc) at Komi beach was found to be at about 7.9 m. It is noted that the deployment period of the RBR was not annual, as the literature suggests when it comes to the estimation of Hsx and Tsx values. However, the 5-month deployment period covers the most energetic months of the year and, thus, it is considered to be representative of the annual extreme wave conditions (see also Figure 7).
Nourishment estimates are sensitive to the grain size of the filling material (d50F) (Table 3). The volume of material with similar grain size to that of the beach (d50F = 1.5 mm or −0.6 Ø) needed per m of beach, was found to be three to four times higher in all scenario cases (e.g., 120 and 30 m3/m for scenarios (5) and (6), respectively), also affecting the cost (EUR 1,320,000 and EUR 330,000, respectively, for the same scenarios—Table 3). In comparison, the beach elevation after nourishment (B) does not appear to significantly affect the cost of the replenishment (e.g., 42,900 and 48,400 m3 needed for the cases of scenarios (1) and (3), respectively), whereas the desired beach width after nourishment (Δy0) appears to control significantly both filling volumes and costs, being approximately 2.5–3 times higher in the case of Δy0 = 20 m (e.g., estimated nourishment volumes of 17,600 and 44,000 m3 for scenarios (4) and (8), respectively) (Table 3).
The results show that nourishment with material of larger grain size can significantly reduce nourishment costs. Sediments with greater grain size are also less prone to sediment mobilization and transport and, thus, could enhance beach resilience. It is noted that, although nourishment filling material with grain sizes similar to the native beach material might be preferrable with regard to the beach bio-geological composition and aesthetics, the granulometry of the filling material depends also on the availability of suitable sediment sources. If such sediments can be found offshore of the beach region, the nourishment logistics and costs could be significantly reduced.

3.4. Marine Aggregate (MA) Potential for Beach Nourishment

First, an assessment of the Chios onshore geology and the location of the land drainage systems, which may have potentially provided suitable land-sourced sediments to offshore deposits, e.g., [30], was carried out. Other limiting factors for MA extraction were considered, including (Figure 2): water depth limitations to dredging activities, the distribution of Posidonia meadows offshore of Chios, the extent of the Greek territorial waters (6 nautical miles), restrictions due to trawling activities, the presence of marine archaeological sites, the Natura 2000 network, the occurrence of submarine cables, aquaculture activities (mostly located along the northeastern Chios coast) and the location of suitable ports that could support MA activities. Taking into account these constraints, three sites were selected (Figure 2), all of them located relatively close to the Chios main port, which could facilitate MA operations. Reported wrecks of archaeological importance rest a safe distance from these sites [50]. Marine traffic, which according to www.marinetraffic.com/ (accessed on 18 June 2021) appears to be intense along the eastern coast of Chios, does not appear to considerably affect the two southernmost sites. Finally, the study focused, for logistical reasons (see Section 2.4), on the site offshore of the Komi beach.
The overall bathymetric survey involved water depths down to 75 m. The seabed shows a generally smooth relief with low slope gradients that increase slightly along both sides of the surveyed zone (Figure 8a). The SSS survey offshore Komi (Figure 8c,d) revealed the same backscatter types as in the inshore area with small deviations in the acoustic signatures. BT1 appears as a medium to low reflectivity pattern corresponding to the presence of slightly finer sediments. BT2 shows a much patchier acoustic backscatter suggesting the presence of a micro-relief, which, considering its particular shape and depth extent, could be associated to small coralligenous formations; no active sediment transport could be inferred in this area since there was no evidence of flow-induced bedforms in the sonographs. Finally, BT3 was found to correspond to Posidonia meadows.
The collected sediment samples showed that the surficial sediments range from slightly gravelly muddy sands to gravelly sands with a mean size ranging between 0.63 and 3.52 Ø. Sand is mainly terrigenous, whilst the gravel fraction is mostly biogenic (small intact or broken shells). The majority of the examined samples have a mud content between 10 and 20%. In general, the sand fraction ranges between 69 and 91% (Figure 8b), with the prevailing fraction being very fine sand. Their mixed origin (terrigenous and biogenic) and varying grain size produce a poor to very poor sorting (1.17 to 2.08 Ø) for the sediments.
The collected information suggests that the offshore BT1 area, which is ‘sandwiched’ between the Posidonia meadows (BT3) and the area with patchy seabed hardgrounds (BT2), represents an area comprising loose sandy sediments. Unfortunately, the thickness of this surficial deposit remains uncertain, as the planned sub-bottom (SBP) survey could not be carried out due to the aforementioned fieldwork difficulties (Section 2.4).
Considering the spatial distribution of the surficial sandy sediments and depth restrictions for dredging operations, assuming that the deposit thickness is sufficient and taking into account commonly applied environmental terms for MA extraction (e.g., extraction of a surficial sediment layer of about 0.5 m thick and, in any case, not more than 2 m thick [51]), 0.85 × 10⁶ to 3.4 × 10⁶ m3 of sediment could be potentially available for extraction. However, if a more rational (in terms of operation logistics and environmental considerations) extraction plan was to be adopted, i.e., constraining extraction to two orthogonal blocks (Figure 8d), then the MA volume available for extraction ranges between approximately 0.48 × 10⁶ and 1.9 × 10⁶ m3. This estimation suggests a significant MA potential in this area, sufficient for the Komi beach nourishment in terms of volume (Table 2) under all studied scenarios, as well as cost-effective; according to Bigongiari et al. [52] cost-effective MA deposits for beach nourishment should have a volume of at least 1 × 10⁶ m3. Still, in order to verify the thickness and suitability (in terms of texture and composition) of these deposits, an SBP survey ground-truthed by a (vibro) coring survey should be carried out.

4. Discussion and Conclusions

Beach erosion, which is projected to greatly increase under CV&C, can endanger island sustainable development, e.g., [22]. There could be important socio-economic implications including for tourism revenues, coastal asset values and insurance costs, with significant effects on the local and national economies, e.g., [53]. In addition, the scale of the problem and the potential costs of the requisite adaptation measures, e.g., [25], require an approach that can prioritize responses according to different criteria in order to allocate more efficiently the limited, in most cases, financial and human resources. Thus, structured methodological approaches are needed to evaluate/grade the beach erosion risk and inform feasible and effective adaptation plans. The present work attempts to answer this call by developing an integrated approach that combines diverse methodologies, which was then applied to the Greek island of Chios.
The proposed framework, to prioritize the needs for and the selection of potential responses to beach erosion, could provide an effective roadmap for coastal management planning under CV&C in island (and other coastal) settings. It comprises four different steps: ranking of island (regional) beaches in terms of their socio-economic significance, exposure and vulnerability to sea level rise in order to prioritize the adaptation responses; study of the hydro- and morphodynamics of the (highest) ranking beach(es) to gain an insight on the beach erosion processes at a local level; assessment of the needs for ‘borrow’ material for beach nourishment; evaluation of the marine aggregate potential of the adjacent offshore areas, which could be used for beach nourishment.
In the first step of the framework, the beach ranking, several indicators were selected as well as their relative ranking weights [5,54] that strike a balance between the major ecosystem services, development and resilience to beach erosion under CV&C. All 153 recorded beaches of Chios, particularly those that rank high in the evaluation, constitute valuable natural resources, which are also under increased erosion risk and will most probably require technical adaptation measures. There could be significant impacts of sea level rise on the beach carrying and wave buffering capacities: some beaches were projected to be lost entirely by 2050 (and many more by 2100) in the absence of effective adaptation measures. It is noted that our beach erosion/retreat projections are conservative, as they are driven by the RSLR and do not take into account the (cumulative) effects of storm events (which, both observations and modeling suggest, could be significant at Komi beach), or the effects of the diminished land-sourced sediment supply to the beach due to the construction of the Kalamoti-Katraris Dam, e.g., [55]. It should also be mentioned that, although the study has focused on beach erosion, there could be other significant CV&C effects that might potentially impact on the socio-economic and environmental sustainability of island beaches, such as: freshwater and energy shortages [56], diminishing beach desirability due to unfavorable bio-climatic changes e.g., [57], and deterioration of the beach ecological status and related human welfare/health issues, e.g., [58]. Thus, the proposed approach could benefit from the incorporation of indicators related to such effects.
The second step of the proposed approach involves the collection of information relevant to and modelling of the beach erosion processes at a local (beach) level. Integrated assessments of the beach erosion risk under CV&C comprise assessments of [11,59,60,61,62]: (i) the erosion trends and projections under the RSLR and extreme sea levels and waves, (ii) the exposure of the natural and human environments (ecosystems, population, infrastructure/assets and activities) present in hazard zones and, thereby, subject to potential damages/losses, and (iii) the vulnerability of the characteristics and circumstances of coastal ecosystems, communities, assets and activities that make them susceptible to damages/losses.
Different approaches and morphodynamic models can be used depending on the scale/resolution of the application, the availability of topographic and hydrodynamic information, as well as the type of erosion (i.e., slow-onset erosion and drowning due to RSLR or rapid episodic erosion due to extreme events). In the present application (Komi beach), morphological and hydrodynamic information had to be collected (as no previous relevant information was available at local scale), which was then used to assess the long-term beach response to the RSLR (see Section 3.1) as well as the annual shoreline position variability and the response to particular wave events (Section 3.2). It is noteworthy, however, that in order to assess beach erosion trends in high spatio-temporal detail, additional morphological information should be collated/analyzed, such as high-resolution satellite imagery, repeated (LiDAR) surveys, unmanned aerial vehicle (UAV) optical photogrammetric surveys and ground video monitoring of the ‘dry’ beach morphodynamics, e.g., [43,63,64]. Similarly, beach erosion assessments under the present and future regimes should, ideally, involve simulations under different scenarios of RSLR and extreme wave and sea levels, in addition to those carried out in the Komi beach application.
Management of island beach erosion requires not only robust monitoring and projections but also well-planned beach maintenance/restoration through nourishment schemes, which could raise and extend the beach seawards in order to maintain the beach carrying and wave buffering capacities. In the Komi application (Step 3), the required volume of filling material has been estimated under several RLSR scenarios and found to be up to 143,000 m3, under the most demanding scenario (Table 2). Assessment of the potential MA deposits in the adjacent area (Step 4) has indicated that such volumes might be available; however, more information is needed on the thickness and texture of the potential MA deposit in order to verify this volume assessment. Generally, the availability of, and accessibility to, appropriate material for beach nourishment should be given particular attention, e.g., [65]. Since MA constitute a most suitable material for beach nourishment, the sustainability of potential neighboring MA deposits should be considered in marine spatial plans as a matter of priority (see EU Directive 2014/89/EU). However, in cases where beach nourishment schemes are environmentally unsound and/or prohibitively expensive, i.e., [66,67,68], there might be inevitable beach losses.
It is noteworthy that beach (coastal) erosion is increasingly considered in several complementary International and European policies and regulatory instruments, which prescribe the assessment, monitoring and mitigation/management of coastal erosion under a changing climate (e.g., the 2008 ICZM Protocol to the Barcelona Convention, and the European Water Framework (2000/60/EC), Flood Risk (2007/60/EC) and the amended Environmental Impact Assessment (2014/52/EU) Directives). The proposed framework may assist in the compliance to and implementation of this regulation.
Finally, it appears that the proposed framework can represent the status of island beaches, based on quantifiable geo-spatial and socio-economic characteristics and projections of beach erosion/retreat under different scenarios of mean sea level rise. It can provide to users, primarily coastal managers and relevant governance institutions, a better understanding of the challenges posed by beach erosion in island settings as well as prioritization of adaptation responses, efficient resource allocation and a roadmap for effective adaptation.

Author Contributions

Conceptualization, T.H. and A.V.; Methodology, O.A., T.H. and E.M.; Resources, A.C. and I.M.; Writing—Original Draft Preparation, All authors; Writing—Review and Editing, A.V. and T.H.; supervision, T.H.; project administration, T.H.; funding acquisition, T.H. and A.V. All authors have read and agreed to the published version of the manuscript.

Funding

This research is co-financed by Greece and the European Union (European Social Fund- ESF) through the Operational Programme «Human Resources Development, Education and Lifelong Learning 2014–2020» in the context of the project “Testing of a vertical integration approach for the study and adaptation to coastal erosion” (MIS 5047143).

Institutional Review Board Statement

Not applicable.

Informed Consent Statement

Not applicable.

Data Availability Statement

Not applicable.

Conflicts of Interest

The authors declare no conflict of interest.

References

  1. Luijendijk, A.; Hagenaars, G.; Ranasinghe, R.; Baart, F.; Donchyts, G.; Aarninkhof, S. The State of the World’s Beaches. Sci. Rep. 2018, 8, 6641. [Google Scholar] [CrossRef]
  2. Ackerman, R.A. The nest environment and the embryonic development of sea turtles. In The Biology of Sea Turtles; Lutz, P.L., Musick, J.A., Eds.; CRC Press: Boca Raton, FL, USA, 2017; Volume I, pp. 83–106. [Google Scholar]
  3. Neumann, B.; Vafeidis, A.T.; Zimmermann, J.; Nicholls, R.J. Future Coastal Population Growth and Exposure to Sea-Level Rise and Coastal Flooding—A Global Assessment. PLoS ONE 2015, 10, e0118571. [Google Scholar] [CrossRef] [PubMed] [Green Version]
  4. UNWTO. International Tourism Highlights, 2019th ed.; United Nations World Tourism Organisation: Madrid, Spain, 2019; Available online: https://www.e-unwto.org/doi/epdf/10.18111/9789284421152 (accessed on 1 June 2021).
  5. Tzoraki, O.; Monioudi, I.; Velegrakis, A.; Moutafis, N.; Pavlogeorgatos, G.; Kitsiou, D. Resilience of touristic island beaches under sea level rise: A methodological framework. Coast. Manag. 2018, 46, 78–102. [Google Scholar] [CrossRef]
  6. Toimil, A.; Díaz-Simal, P.; Losada, I.J.; Camus, P. Estimating the risk of loss of beach recreation value under climate change. Tour. Manag. 2018, 68, 387–400. [Google Scholar] [CrossRef]
  7. Hinkel, J.; Nicholls, R.J.; Tol, R.S.J.; Wang, Z.B.; Hamilton, J.M.; Boot, G.; Vafeidis, A.T.; McFadden, L.; Ganopolski, A.; Klein, R.J.T. A global analysis of erosion of sandy beaches and sea-level rise: An application of DIVA. Glob. Planet. Chang. 2013, 111, 150–158. [Google Scholar] [CrossRef]
  8. IPCC. Climate Change 2014: Impacts, Adaptation, and Vulnerability. Part A: Global and Sectoral Aspects. Contribution of Working Group II to the Fifth Assessment Report of the Intergovernmental Panel on Climate Change; Cambridge University Press: Cambridge, UK; New York, NY, USA, 2014. [Google Scholar]
  9. Mentaschi, L.; Vousdoukas, M.; Pekel, J.-F.; Voukouvalas, E.; Feyen, L. Global long-term observations of coastal erosion and accretion. Sci. Rep. 2018, 8, 12876. [Google Scholar] [CrossRef] [Green Version]
  10. Flor-Blanco, G.; Alcántara-Carrió, J.; Jackson, D.W.T.; Flor, G.; Flores-Soriano, C. Coastal erosion in NW Spain: Recent patterns under extreme storm wave events. Geomorphology 2021, 387, 107767. [Google Scholar] [CrossRef]
  11. Guisado-Pintado, E.; Jackson, D.W.T. Coastal impact from high-energy events and the importance of concurrent forcing parameters: The cases of Storm Ophelia (2017) and Storm Hector (2018) in NW Ireland. Front. Earth Sci. 2019, 7, 190. [Google Scholar] [CrossRef] [Green Version]
  12. Nicholls, R.J.; Cazenave, A. Sea-Level Rise and Its Impact on Coastal Zones. Science 2010, 328, 1517–1520. [Google Scholar] [CrossRef] [PubMed]
  13. Ranasinghe, R. Assessing climate change impacts on open sandy coasts: A review. Earth-Sci. Rev. 2016, 160, 320–332. [Google Scholar] [CrossRef] [Green Version]
  14. Monioudi, I.N.; Karditsa, A.; Chatzipavlis, A.; Alexandrakis, G.; Andreadis, O.; Velegrakis, A.F.; Poulos, S.; Ghionis, G.; Petrakis, S.; Sifnioti, D.; et al. Assessment of vulnerability of the eastern Cretan beaches (Greece) to sea level rise. Reg. Environ. Chang. 2016, 16, 1951–1962. [Google Scholar] [CrossRef]
  15. Peduzzi, P.; Velegrakis, A.F.; Estrella, M.; Chatenoux, B. Integrating the role of ecosystems in disaster risk and vulnerability assessments: Lessons from the Risk and Vulnerability Assessment Methodology Development Project (RiVAMP) in Negril Jamaica. In The Role of Ecosystems in Disaster Risk Reduction; Renaud, F.G., Ed.; United Nations University Press: Tokyo, Japan, 2013; pp. 109–139, ISBN-13: 978-9280812213. [Google Scholar]
  16. Romine, B.M.; Fletcher, C.H.; Neil Frazer, L.; Anderson, T.R. Beach erosion under rising sea-level modulated by coastal geomorphology and sediment availability on carbonate reef-fringed island coasts. Sedimentology 2016, 63, 1321–1332. [Google Scholar] [CrossRef]
  17. SETE. Association of the Greek Touristic Businesses, International Airline Arrivals: 2015 & Planning Report (Slots). 2016. Available online: http://sete.gr/media/4629/ypa-2015-and-slots-2016.pdf (accessed on 20 May 2021).
  18. UNWTO. Tourism Highlights. United Nations World Tourism Organisation; UNWTO: Madrid, Spain, 2017; ISBN 9789284419029. [Google Scholar]
  19. Vousdoukas, M.I.; Mentaschi, L.; Voukouvalas, E.; Verlaan, M.; Jevrejeva, S.; Jackson, L.; Feyen, L. Global probabilistic projections of extreme sea levels. Nat. Commun. 2018, 9, 2360. [Google Scholar] [CrossRef] [Green Version]
  20. Bellard, C.; Leclerc, C.; Courchamp, F. Impact of sea level rise on the 10 insular biodiversity hotspots. Glob. Ecol. Biogeogr. 2014, 23, 203–212. [Google Scholar] [CrossRef]
  21. Monioudi, I.; Velegrakis, A.; Chatzipavlis, A.; Rigos, A.; Karambas, T.V.; Vousdoukas, M.; Hasiotis, T.; Koukourouvli, N.; Peduzzi, P.; Manoutsoglou, E.; et al. Assessment of island beach erosion due to sea level rise: The case of the Aegean archipelago (Eastern Mediterranean). Nat. Hazards Earth Syst. Sci. 2017, 17, 449–466. [Google Scholar] [CrossRef] [Green Version]
  22. Asariotis, R. Climate change and adaptation for coastal transport infrastructure: A sustainable development challenge for SIDS in the Caribbean and beyond. In The Handbook of Natural Resources, 2nd ed.; Coastal and Marine Environments; Wang, Y., Ed.; CRC Press: Boca Raton, FL, USA, 2020; pp. 253–264. [Google Scholar]
  23. Leal Filho, W.; Krishnapillai, M.; Sidsaph, H.; Nagy, G.J.; Luetz, J.M.; Dyer, J.; Otoara Ha’apio, M.; Havea, P.H.; Raj, K.; Singh, P.; et al. Climate Change Adaptation on Small Island States: An Assessment of Limits and Constraints. J. Mar. Sci. Eng. 2021, 9, 602. [Google Scholar] [CrossRef]
  24. Vousdoukas, M.I.; Mentaschi, L.; Hinkel, J.; Ward, P.J.; Mognelli, I.; Ciscar, J.C.; Feyen, L. Economic motivation for raising coastal flood defenses in Europe. Nat. Commun. 2020, 11, 2119. [Google Scholar] [CrossRef] [PubMed]
  25. Narayan, S.; Beck, M.W.; Reguero, B.G.; Losada, I.J.; van Wesenbeeck, B.; Pontee, N.; Sanchirico, J.N.; Ingram, J.C.; Lange, J.-M.; Burks-Copes, K.A. The Effectiveness, Costs and Coastal Protection Benefits of Natural and Nature-Based Defences. PLoS ONE 2016, 11, e0154735. [Google Scholar] [CrossRef] [Green Version]
  26. Toimil, A.; Losada, I.J.; Camus, P.; Díaz-Simal, P. Managing coastal erosion under climate change at the regional scale. Coast. Eng. 2017, 128, 106–122. [Google Scholar] [CrossRef]
  27. Semeoshenkova, V.; Newton, A. Overview of erosion and beach quality issues in three Southern European countries: Portugal, Spain and Italy. Ocean. Coast. Manag. 2015, 118, 12–21. [Google Scholar] [CrossRef]
  28. Summers, A.; Fletcher, C.H.; Spirandelli, D.; McDonald, K.; Over, J.-C.; Anderson, T.; Barbee, M.; Romine, B.M. Failure to protect beaches under slowly rising sea level. Clim. Chang. 2018, 151, 427–443. [Google Scholar] [CrossRef] [Green Version]
  29. Velegrakis, A.F.; Ballay, A.; Poulos, S.; Radzevičius, R.; Bellec, V.; Manso, F. European marine aggregates resources: Origins, usage, and mining techniques. J. Coast. Res. 2010, 51, 1–14. [Google Scholar]
  30. Hasiotis, T.; Gazis, I.-Z.; Anastasatou, M.; Manoutsoglou, E.; Velegrakis, A.F.; Kapsimalis, V.; Karditsa, A.; Stamatakis, M. Searching for potential marine sand resources to mitigate beach erosion in island settings. Mar. Georesour. Geotechnol. 2020, 39, 527–542. [Google Scholar] [CrossRef]
  31. Kapsimalis, V.; Kyriakidou, C.; Chatzinaki, M.; Voulouvalas, E.; Panagiotopoulos, I.; Pappas, G.; Petrakis, S.; Tsoutsia, A.; Anagnostou, C.H. Natural and human-induced changes in two touristic beaches of SE Chios Island. In Proceedings of the 11th Hellenic Symposium of Oceanography and Fisheries, Mytilene, Lesvos, Greece, 13–17 May 2015; pp. 741–744. [Google Scholar]
  32. Zavadskas, E.K.; Mardani, A.; Turskis, Z.; Jusoh, A.; Nor, K.M.D. Development of TOPSIS Method to Solve Complicated Decision-Making Problems—An Overview on Developments from 2000 to 2015. Int. J. Inf. Technol. Decis. Making. 2016, 15, 645–682. [Google Scholar] [CrossRef]
  33. McKenna, J.; Williams, A.T.; Cooper, J.A.G. Blue flag or red herring: Do beach awards encourage the public to visit beaches? Tour. Manag. 2011, 32, 576–588. [Google Scholar] [CrossRef]
  34. Saaty, T.L. Risk—Its priority and probability: The analytic hierarchy process. Risk Anal. 1987, 7, 159–172. [Google Scholar] [CrossRef]
  35. Saaty, T.L. Relative measurement and its generalization in decision making why pairwise comparisons are central in mathematics for the measurement of intangible factors the analytic hierarchy/network process. Revista de la Real Academia de Ciencias Exactas, Fisicas y Naturales—Serie A. Matematicas 2008, 102, 251–318. [Google Scholar]
  36. Vousdoukas, M.I.; Mentaschi, L.; Voukouvalas, E.; Verlaan, M.; Feyen, L. Extreme Sea levels on the rise along Europe’s coasts. Earths Future 2017, 5, 304–323. [Google Scholar] [CrossRef]
  37. Tsimplis, M. Tidal oscillations in the Aegean and Ionian Seas. Estuar. Coast. Shelf Sci. 1994, 39, 201–208. [Google Scholar] [CrossRef]
  38. Folk, R. Petrology of Sedimentary Rocks; Hemphill Publishing Company: Austin, TX, USA, 1980; p. 182. [Google Scholar]
  39. Blott, S.J.; Pye, K. Gradistat: A Grain Size Distribution and Statistics Package for the Analysis of Unconsolidated Sediments. Earth Surf. Proc. Landf. 2001, 26, 1237–1248. [Google Scholar] [CrossRef]
  40. Karambas, T.V. Prediction of sediment transport in the swash zone by using a nonlinear wave model. Cont. Shelf Res. 2006, 26, 599–609. [Google Scholar] [CrossRef]
  41. Karambas, T.V. Design of detached breakwaters for coastal protection: Development and application of an advanced numerical model. In Proceedings of the 33rd International Conference on Coastal Engineering, Santander, Spain, 1–6 July 2012. [Google Scholar] [CrossRef]
  42. Vousdoukas, M.I.; Velegrakis, A.F.; Karambas, T.V. Morphology and sedimentology of a microtidal beach with beachrocks: Vatera Beach, Lesbos, Greece. Cont. Shelf Res. 2009, 29, 1937–1947. [Google Scholar] [CrossRef]
  43. Velegrakis, A.F.; Trygonis, V.; Chatzipavlis, A.E.; Karambas, T.V.; Vousdoukas, M.I.; Ghionis, G.; Monioudi, I.; Hasiotis, T.; Andreadis, O.; Psarros, F. Shoreline variability of an urban beach fronted by a beachrock reef from video imagery. Nat. Hazards 2016, 83, 201–222. [Google Scholar] [CrossRef]
  44. Tsiaras, A.C.; Karambas, T.V.; Koutsouvela, D. Design of Detached Emerged and Submerged Breakwaters for Coastal Protection: Development and Application of an Advanced Numerical Model. J. Waterw. Port Coast. Ocean. Eng. 2020, 146, 04020012. [Google Scholar] [CrossRef]
  45. Dean, R.G. Beach nourishment: Theory and practice. In Advanced Series on Ocean Engineering; World Scientific Publishing Company: Singapore, 2002. [Google Scholar]
  46. Hallermeier, R.J. A profile zonation for seasonal sand beaches from wave climate. Coast. Eng. 1981, 4, 253–277. [Google Scholar] [CrossRef]
  47. Vousdoukas, M.I.; Velegrakis, A.F.; Dimou, K.; Zervakis, V.; Conley, D.C. Wave run-up observations in microtidal, sediment-starved beaches of the Eastern Mediterranean. J. Mar. Syst. 2009, 78, 537–547. [Google Scholar] [CrossRef]
  48. Sanchez-Arcilla, A.; Gomez-Aguar, J.; Egozcue, J.; Ortego, M.I.; Galiatsatou, P.; Prinos, P. Extremes from scarce data. The role of Bayesian and scaling techniques in reducing uncertainty. J. Hydraul. Res. 2008, 46, 224–234. [Google Scholar] [CrossRef]
  49. Armaroli, C.; Ciavola, P.; Perini, L.; Calabrese, L.; Lorito, S.; Valentini, A.; Masina, M. Critical storm thresholds for significant morphological changes and damage along the Emilia-Romagna coastline, Italy. Geomorphology 2012, 143–144, 34–55. [Google Scholar] [CrossRef]
  50. Foley, B.; Dellaporta, K.; Sakellariou, D.; Bingham, B.S.; Eustice, R.C.R.M.; Evagelistis, D.; Ferrini, V.L.; Katsaros, K.; Kourkoumelis, D.; Mallios, A.; et al. The 2005 Chios ancient shipwreck survey -New methods for underwater archaeology. Hesperia 2009, 78, 269–305. [Google Scholar] [CrossRef] [Green Version]
  51. Radzevičius, R.; Velegrakis, A.F.; Bonne, W.; Kortekaas, S.; Garel, E.; Blažauskas, N.; Asariotis, R. Marine Aggregate Extraction Regulation in EU Member States. J. Coast. Res. 2010, 51, 15–36. [Google Scholar]
  52. Bigongiari, N.; Cipriani, L.; Pranzini, E.; Renzi, M.; Vitale, G. Assessing shelf aggregate environmental compatibility and suitability for beach nourishment: A case study for Tuscany (Italy). Mar. Pollut. Bull. 2015, 93, 183–193. [Google Scholar] [CrossRef]
  53. Scott, D.; Simpson, M.C.; Sim, R. The vulnerability of Caribbean coastal tourism to scenarios of climate change related sea level rise. J. Sustain. Tour. 2012, 20, 883–898. [Google Scholar] [CrossRef]
  54. Bagdanaviciute, I.; Kelpsaite, L.; Soomere, T. Multi-criteria evaluation approach to coastal vulnerability index development in micro-tidal low-lying areas. Ocean. Coast. Manag. 2015, 104, 124–135. [Google Scholar] [CrossRef]
  55. Velegrakis, A.F.; Vousdoukas, M.I.; Andreadis, O.; Pasakalidou, E.; Adamakis, G.; Meligonitis, R. Impacts of dams on their downstream beaches: A case study from Eresos coastal basin, Island of Lesvos, Greece. Mar. Georesour. Geotechnol. 2008, 26, 350–371. [Google Scholar] [CrossRef]
  56. Ault, T. Water resources: Island water stress. Nat. Clim. Chang. 2016, 6, 1062–1063. [Google Scholar] [CrossRef]
  57. De Freitas, C.R.; Scott, D.; McBoyle, G. A second generation climate index for tourism (CIT): Specification and verification. Int. J. Biometeorol. 2008, 52, 399–407. [Google Scholar] [CrossRef]
  58. Semeoshenkova, V.; Newton, A.; Contin, A.; Greggio, N. Development and application of an Integrated Beach Quality Index (BQI). Ocean. Coast. Manag. 2017, 143, 74–86. [Google Scholar] [CrossRef]
  59. UNFCCC. Policy Brief: Technologies for Averting, Minimizing and Addressing Loss and Damage in Coastal Zones. United Nations Framework Convention on Climate Change, Executive Committee of the Warsaw International Mechanism for Loss and Damage. 2020, p. 74. Available online: https://unfccc.int/ttclear/misc_/StaticFiles/gnwoerk_static/2020_coastalzones/cfecc85aaa8d43d38cd0f6ceae2b61e4/2bb696550804403fa08df8a924922c2e.pdf (accessed on 24 May 2021).
  60. Castelle, B.; Laporte-Fauret, Q.; Marieu, V.; Michalet, R.; Rosebery, D.; Bujan, S.; Lubac, B.; Bernard, J.B.; Valance, A.; Dupont, P.; et al. Nature-based solution along high-energy eroding sandy coasts: Preliminary tests on the reinstatement of natural dynamics in reprofiled coastal dunes. Water 2019, 11, 2518. [Google Scholar] [CrossRef] [Green Version]
  61. Cooper, J.A.G.; Masselink, G.; Coco, G.; Short, A.D.; Castelle, B.; Rogers, K.; Anthony, E.; Green, A.N.; Kelley, J.T.; Pilkey, O.H.; et al. Sandy beaches can survive sea-level rise. Nat. Clim. Chang. 2020, 10, 993–995. [Google Scholar] [CrossRef]
  62. Guisado-Pintado, E.; Jackson, D. Multi-scale variability of storm Ophelia 2017: The importance of synchronized environmental variables in coastal impact. Sci. Total Environ. 2018, 630, 287–301. [Google Scholar] [CrossRef]
  63. Andriolo, U.; Almeida, L.P.; Almar, R. Coupling terrestrial LiDAR and video imagery to perform 3D intertidal beach topography. Coast. Eng. 2018, 140, 232–239. [Google Scholar] [CrossRef]
  64. Taddia, Y.; Corbau, C.; Zambello, E.; Pellegrinelli, A. UAVs for Structure-From-Motion Coastal Monitoring: A Case Study to Assess the Evolution of Embryo Dunes over a Two-Year Time Frame in the Po River Delta, Italy. Sensors 2019, 19, 1717. [Google Scholar] [CrossRef] [Green Version]
  65. Anfuso, G.; Martınez-del-Pozo, J.A.; Rangel-Buitrago, N. Bad Practice in Erosion Management: The Southern Sicily Case Study. In Pitfalls of Shoreline Stabilization: Selected Case Studies; Cooper, J.A.G., Pilkey, O.H., Eds.; Springer: Berlin/Heidelberg, Germany, 2012; Volume 3, pp. 215–233. [Google Scholar] [CrossRef]
  66. Van Lancker, V.; Bonne, W.; Garel, E.; Degrendele, K.; Roche, M.; Dries Van den Eynde, D.; Bellec, V.; Briere, C.; Collins, M.B.; Velegrakis, A. Recommendations for the sustainable exploitation of tidal sandbanks. J. Coast. Res. 2010, 51, 151–164. [Google Scholar]
  67. Waye-Barker, G.A.; McIlwaine, P.; Lozach, S.; Cooper, K.M. The effects of marine sand and gravel extraction on the sediment composition and macrofaunal community of a commercial dredging site (15 years post-dredging). Mar. Pollut. Bull. 2015, 99, 207–215. [Google Scholar] [CrossRef]
  68. Pinto, C.A.; Silveira, M.T.; Teixeira, S.B. Beach nourishment practice in mainland Portugal (1950–2017): Overview and retrospective. Ocean. Coast. Manag. 2020, 192, 105211. [Google Scholar] [CrossRef]
Figure 1. (a) Chios island and Komi beach (red arrow); the blue line and circle show the Katraris river and the Kalamoti-Katraris Dam. (b) Field observations (KR: Katraris River). Photos of Komi beach, (c) from the ENE under calm conditions and (d) from WSW during a storm.
Jmse 09 00859 g001
Figure 2. (a) Distribution of various natural and human features and marine use restrictions around Chios, and the 3 sites (red boxes) selected for MA investigations (red arrow to Komi). (b) SBES and SSS tracks and surficial sediment samples of the Komi MA survey.
Jmse 09 00859 g002
Figure 3. (a) Ranking scores of all 153 recorded beaches of Chios (TOPSIS method) according to their socio-economic and environmental significance; the 15 most highly ranked beaches are shown in the red color; (b) digitized polygons of the beaches (clockwise beach numbering starting from the north) and selected beaches; (c) ranking scores of the 15 selected beaches (AHP method) based on their vulnerability to CV&C (under current and future conditions).
Jmse 09 00859 g003
Figure 4. (a) Bathymetric chart of the inshore area, also showing the location of the deployed instruments (the red line represents the shoreline), (b) shallow water SSS mosaic (for interpretation see Section 3.4, Figure 8d), (c) underwater camera photo showing the boundary between Posidonia oceanica and sandy sediments at about 10 m depth, (d) one year shoreline location variability, (e) mean grain-size and sorting (in Ø units) variations of the inshore samples and (f) mean grain size (in Ø units) differences along the shoreline.
Jmse 09 00859 g004
Figure 5. Wave characteristics extracted from the RBR records: (a) zero-moment wave height, (b) peak wave period, (c) maximum recorded wave height, (d) wave period corresponding to the maximum wave heights, and (e) wave energy corresponding to the zero-moment wave heights.
Jmse 09 00859 g005
Figure 6. (a) Wave conditions (zero-moment wave height—Hm0 and peak wave period—Tp) of a 44-h energetic event for which concurrent RBR (at 8 m depth) and ADV (at 1.7 m depth) hydrodynamic records are available (10–12 February 2021). (b) Wave characteristics, mean flow and bed shear stress recorded by the ADV sensor.
Jmse 09 00859 g006
Figure 7. Hydrodynamic model output. Wave height propagation and current circulation driven by the considered wave conditions: (a,c) Hs—1.4 m, Tp—6.0 s; (b,d) Hs—2.5 m, Tp—6.6 s. (e) Bed morphological changes along a cross-shore profile (location at panels a–d) projected from the morphodynamic simulations.
Jmse 09 00859 g007
Figure 8. (a) Bathymetric chart of the study area, (b) distribution of sand percentage (restricted at the limits of the offshore sample locations) (c) SSS mosaic and (d) geomorphological map of the study area. Blue boxes designate areas where sand could potentially be extracted.
Jmse 09 00859 g008
Table 1. Periods of field surveys and type of data collected.
February 2020July 2020October 2020January 2021February 2021
RTK beach and shoreline measurementsXX XX
Shoreline samplingXX X
Inshore bathymetry, morphology, sampling X
Offshore bathymetry, morphology, sampling X
RBR data ΧXX
High frequency ADV experiment X
Meteo data X
Table 2. Beach retreat results and ranking scores (AHP analysis) regarding the beach vulnerability to RSLR. Results are for the current status and future projections under the RCP4.5 emission scenario for the years 2050 and 2100. Width loss refers to the projected reduction of the max. beach width. For beach location see Figure 1a.
CurrentRCP4.5, 2050RCP4.5, 2100
Beach NameScoreRSLR + Tide
(m)
Retreat Range (m) Width Loss (%)ScoreRSLR + Tide
(m)
Retreat Range (m)Width Loss (%)Score
8. Giosonas0.0440.33.3–11.416–540.0460.636.6–21.732–1000.045
34. Agios Isidoros0.0240.33.3–11.437–1000.0250.636.6–21.774–1000.025
36. Glaroi0.0190.33.3–11.414–470.0190.636.6–21.728–900.019
41. Ormos Lo0.0850.33.3–11.437–1000.0890.636.6–21.774–1000.087
53. Bella Vista0.0770.222.5–8.96–220.0760.545.7–18.914–460.076
60. Kontari0.0750.222.5–8.910–370.0740.545.7–18.924–790.074
63. Karfas0.0920.222.5–8.98–270.0900.545.7–18.917–570.091
65. Megas Limnionas0.0900.222.5–8.921–240.0890.545.7–18.948–1000.090
72. Agia Fotini0.0920.222.5–8.913–470.0910.545.7–18.930–990.091
85. Viri0.0680.222.5–8.915–530.0670.545.7–18.934–1000.067
90. Komi0.1130.222.5–8.99–310.1110.545.7–18.920–650.112
93. Mavra Volia0.0260.222.5–8.98–280.0260.545.7–18.918–590.026
118. Lithi0.0870.242.7–9.58–300.0870.576.0–19.819–620.087
133. Managros0.0410.262.9–10.25–160.0420.586.1–20.110–320.042
140. Agia Markella0.0680.262.9–10.211–380.0690.586.1–20.123–750.068
Table 3. Estimated volumes, filling costs of nourishment for Komi beach according to different scenarios.
Scenario IDNourishment Width
y0—m)
Nourishment Height
(B—m)
Mean Grain Size of Nourishment Material
(d50F—mm)
Volume of Nourishment Material per m of Beach
(VN—m3/m)
Total Nourishment Volume
(V—m3)
Total Cost
(EUR)
(1)100.51.53942,900429,000
(2)100.52.01112,100121,000
(3)101.01.54448,400484,000
(4)101.02.01617,600176,000
(5)200.51.5120132,0001,320,000
(6)200.52.03033,000330,000
(7)201.01.5130143,0001,430,000
(8)201.02.04044,000440,000
Publisher’s Note: MDPI stays neutral with regard to jurisdictional claims in published maps and institutional affiliations.

