Article

Improving Significant Wave Height Forecasts Using a Joint Empirical Mode Decomposition–Long Short-Term Memory Network

1
School of Marine Sciences, Nanjing University of Information Science and Technology, Nanjing 210044, China
2
Southern Marine Science and Engineering Guangdong Laboratory (Zhuhai), Zhuhai 519082, China
3
Department of Atmospheric and Oceanic Sciences, University of California, Los Angeles, CA 90095, USA
*
Author to whom correspondence should be addressed.
J. Mar. Sci. Eng. 2021, 9(7), 744; https://doi.org/10.3390/jmse9070744
Submission received: 25 May 2021 / Revised: 19 June 2021 / Accepted: 28 June 2021 / Published: 5 July 2021
(This article belongs to the Section Physical Oceanography)

Abstract

:
Wave forecasts, though integral to ocean engineering activities, are often conducted using computationally expensive and time-consuming numerical models with accuracies that are blunted by numerical-model-inherent limitations. Additionally, artificial neural networks, though significantly computationally cheaper, faster, and effective, also experience difficulties with nonlinearities in the wave generation and evolution processes. To solve both problems, this study employs and couples empirical mode decomposition (EMD) and a long short-term memory (LSTM) network in a joint model for significant wave height forecasting, a method widely used in wind speed forecasting, but not yet for wave heights. Following a comparative analysis, the results demonstrate that EMD-LSTM significantly outperforms LSTM at every forecast horizon (3, 6, 12, 24, 48, and 72 h), considerably improving forecasting accuracy, especially for forecasts exceeding 24 h. Additionally, EMD-LSTM responds faster than LSTM to large waves. An error analysis comparing LSTM and EMD-LSTM demonstrates that LSTM errors are more systematic. This study also identifies that LSTM is not able to adequately predict high-frequency significant wave height intrinsic mode functions, which leaves room for further improvements.

1. Introduction

Surface gravity waves (hereinafter, waves) are crucial physical phenomena to be considered in ocean engineering and renewable energy [1,2,3], shipping [4,5], scour protection, offshore wind foundations and breakwaters [6,7], amongst other activities. As such, accurate forecasts of evolution are indispensable. Currently, these forecasts are performed through the use of third-generation numerical wave models such as WaveWatch III [8] and SWAN [9] but these models consume significant computational resources and time, in addition to being imperfect due to theoretical and computing rigidities. Copula approaches are also popular and are mandatory in an array of design norms [10,11], but may be limited in their ability to accurately represent inter-series dependencies. Artificial-intelligence-based methods can provide forecasts of similar quality for a fraction of the computational and time costs and display strong abilities to overcome nonlinear physics problems. For example, in an early study, Deo and Naidu [12] used an artificial neural network (ANN) for wave predictions over 3 to 24 h horizons and found a satisfactory agreement with observations. More recently, Mandal and Prabaharan [13] used a recurrent neural network (RNN) to predict wave heights at 3, 6, and 12 h horizons, achieving correlation coefficients with the observations of 0.95, 0.9, and 0.87, respectively. Zubier [14] used the nonlinear auto-regressive network with exogeneous (NARX) ANN for wave-height predictions in the eastern central Red Sea at 3, 6, 12 and 24 h horizons, and observed that model performance could be enhanced with the difference between wind and wave directions used as an input. Ali and Prasad [15] built a machine learning model for 30 min significant wave height predictions in the eastern coastal zones of Australia by coupling the extreme learning model (ELM) with the improved complete ensemble empirical mode decomposition method with adaptive noise. Relevant for the current study, Gao et al. [16] used LSTM for wave height forecasting in the Bohai Sea at an variety of buoy locations.
Due to strong nonlinearities in wave generation and evolution processes, forecasts are consequently complicated and thus require additional tools to overcome. For example, Fan et al. [17] coupled a third-generation wave model to LSTM and found that the joint SWAN-LSTM model’s forecasting efficacy was superior to those of extreme learning and support vector machine. To minimize computational cost, empirical mode decomposition is an efficient alternative to deal with wave nonlinearities. Although joint EMD-LSTM models were successfully applied in a variety of fields such as foreign exchange rate and stock price [18,19,20], electrical load [21], and metro passenger flow [22] forecasting, its use in earth science applications is comparatively rare. Dai et al. [23] applied the model to PM2.5 concentrations in Beijing and found that EMD-LSTM provided a higher accuracy than using LSTM alone. This result was observed in the study performed by Liu et al. [24], who found that the EMD-LSTM can improve the Yangtze River streamflow predictions even during floods. Within the field of meteorology and oceanography, Guo et al. [25] demonstrated that EMD-LSTM can provide more accurate, stable, and reliable El Niño forecasting results compared to traditional neural networks. Huang et al. [26] first used EMD to decompose wind speed time series into several intrinsic mode functions before LSTM and Gaussian process regression (GPR) were employed for predictions. The results demonstrated that this methodology outperformed other wind forecasting methods such as the auto regressive integrated moving average and the back propagation neural network. Tang et al. [27] combined EMD with particle swarm optimization and least square support vector machine in a joint EMD-PSO-LSSVM model for significant wave height predictions at 1, 3, and 6 h lead times and optimized forecasts in the offshore and deep-sea areas of the North Atlantic. Raj and Brown [28] jointly used a hybrid Boruta random forest (BRF)–ensemble empirical mode decomposition (EEMD)–bidirectional LSTM (BiLSTM) algorithm to predict significant wave height over 24 h based on inputs of a zero-up crossing wave period, peak energy wave period, and sea surface temperature. The results showed that the EEMD-BiLSTM outperformed all other tested models for short-term forecasting (up to 24 h), but the authors noted that the forecast horizon can be extended to medium and long terms.
Therefore, this study extends forecast horizons to 48 and 72 h horizons. Due to the lack of research in this area and the need to improve wave forecasts as demonstrated by Hurricane Dorian’s (2019) catastrophic landfall in The Bahamas, we use the National Data Buoy Center (NDBC) buoy observations of significant wave height in the Atlantic Ocean and initiate forecasting using a joint EMD-LSTM model. The rest of this paper is structured as follows: Section 2 describes the data and methodology employed, Section 3 presents the main findings of this study, and Section 4 summarizes the main findings of this study.

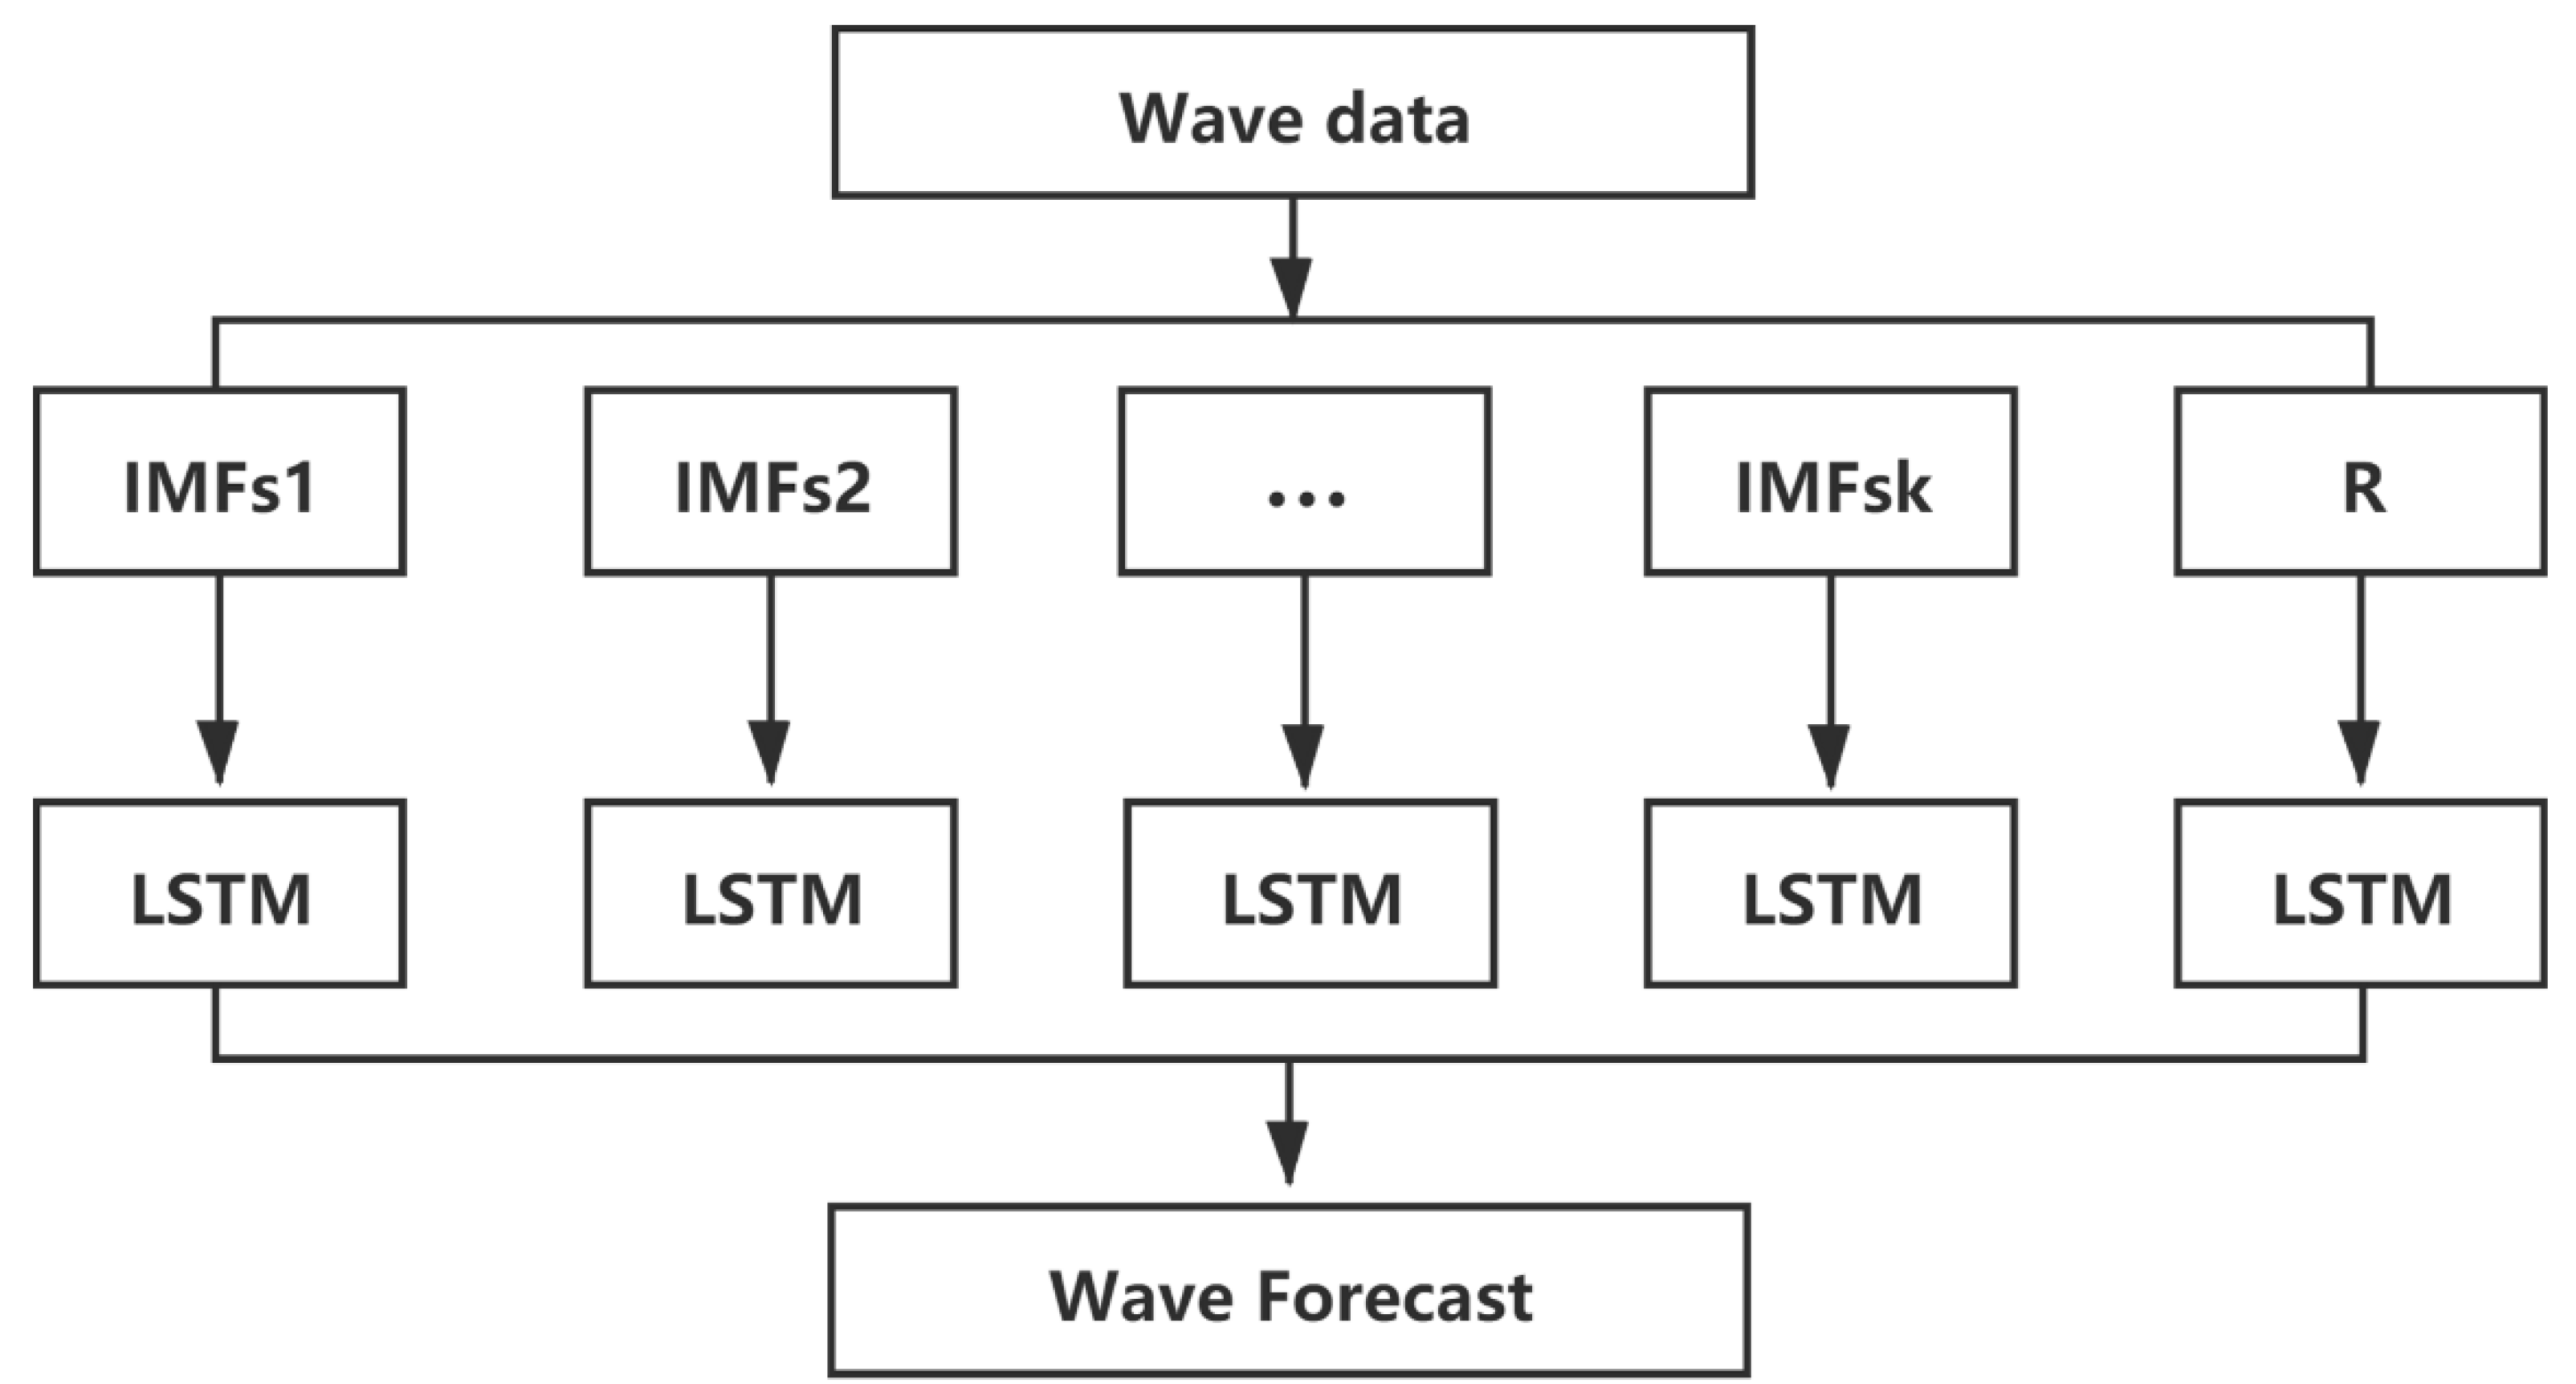
2. Data and Methodology

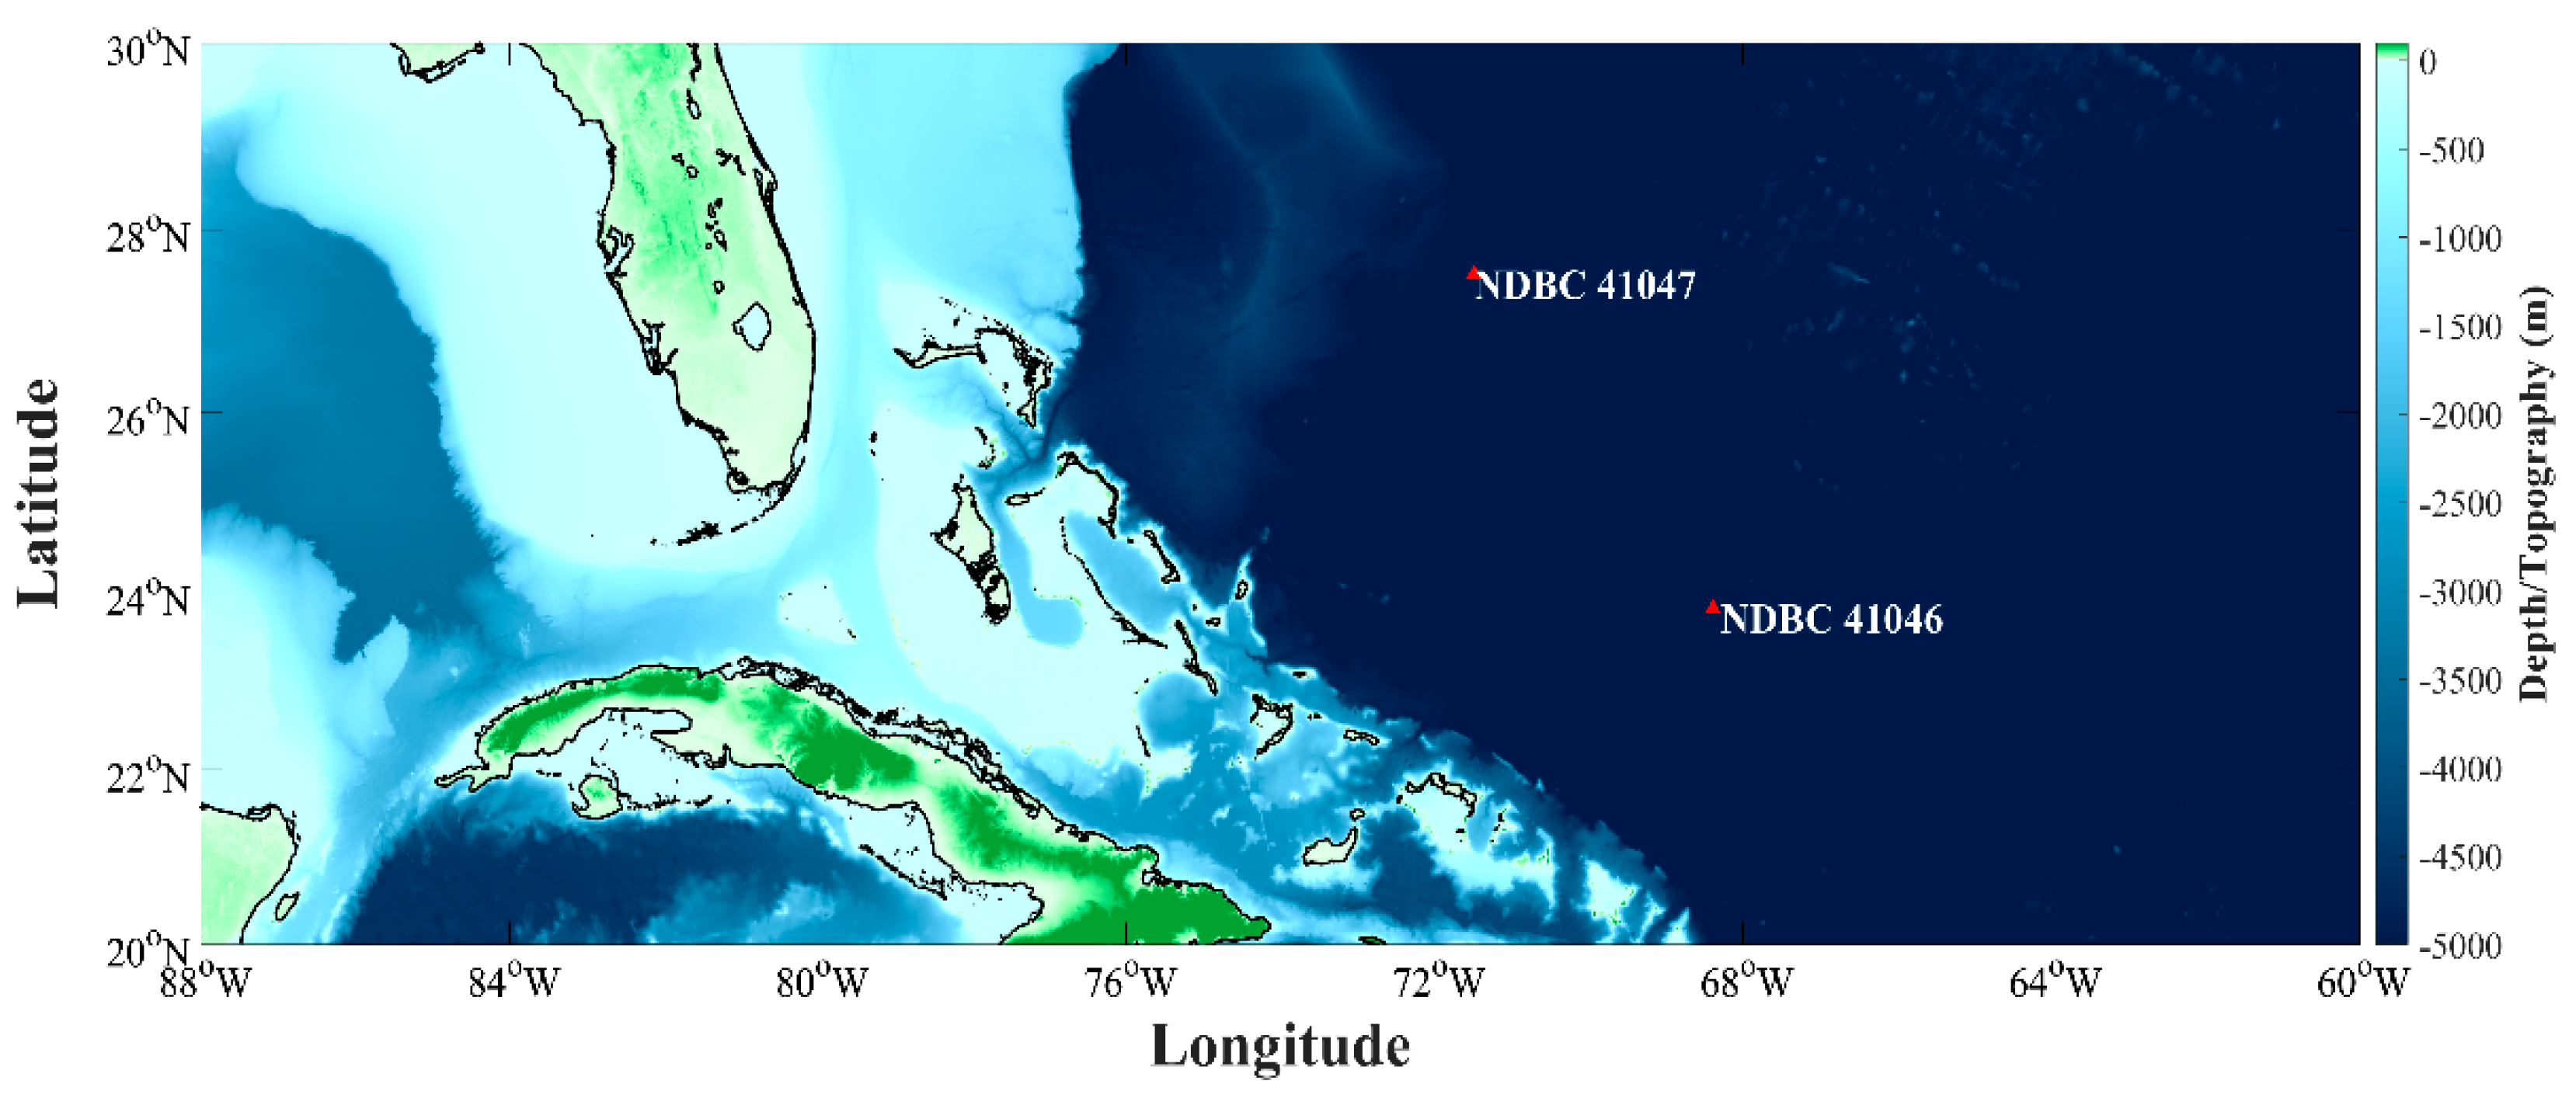
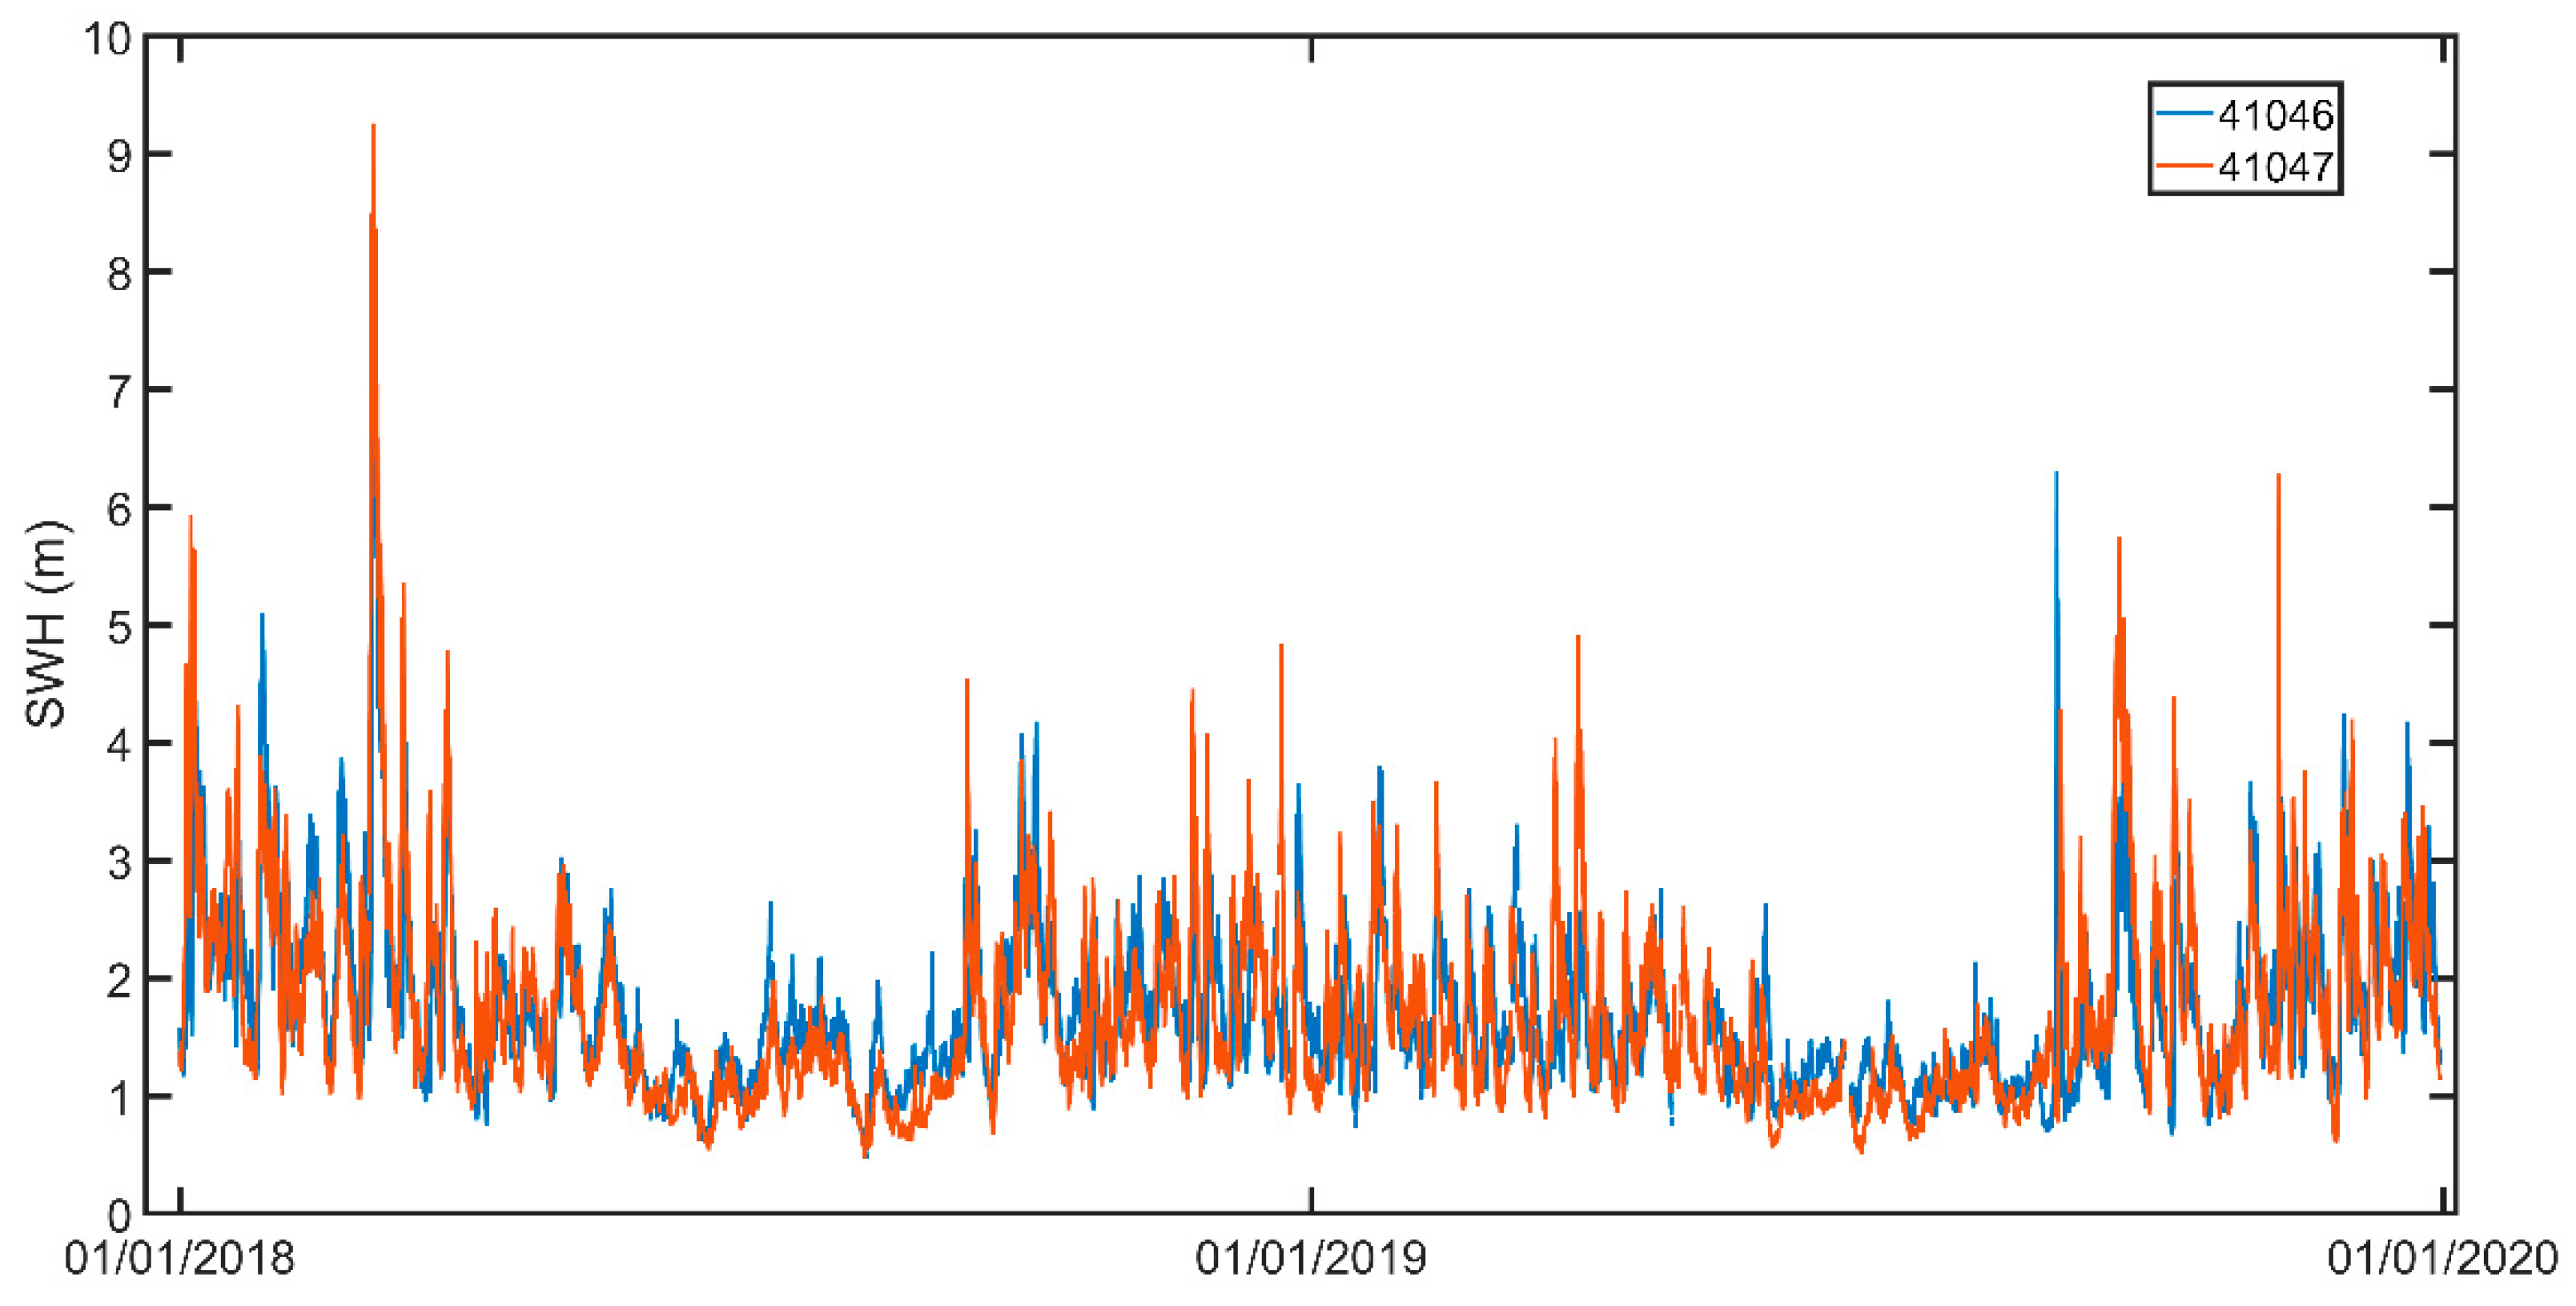
2.1. Buoy Data and Data Preprocessing

Observations of significant wave height were acquired from two buoys deployed in the Atlantic Ocean, east of The Bahamas (Figure 1). These buoys are owned, operated, and maintained by the NDBC. The acquired data ranges from 2018 to 2019 and are provided at an hourly resolution. Because EMD requires a stream of data that is not missing values, before LSTM model training, spline interpolation was performed to remove missing values from the time series. All relevant buoy statistics concerning geographical positions, water depth, and the number of observations before and after interpolation are available in Table 1.
In Figure 2, a full time series of significant wave height at both buoy locations is plotted. It can be observed that, generally, wave heights naturally fluctuate widely over the course of two years, excluding extreme events as may be caused by winter storms or passing hurricanes (e.g., Hurricanes Dorian and Humberto in September 2019), but generally range from 1–4 m. Here, the training dataset for LSTM and EMD-LSTM was set so the whole of 2018 and 2019 wave heights were used in the testing dataset. To ensure that wave conditions throughout the entire year could be captured, rather than seasonal trends, the full year was used instead of splitting the data into the traditional 70% training and 30% test datasets.

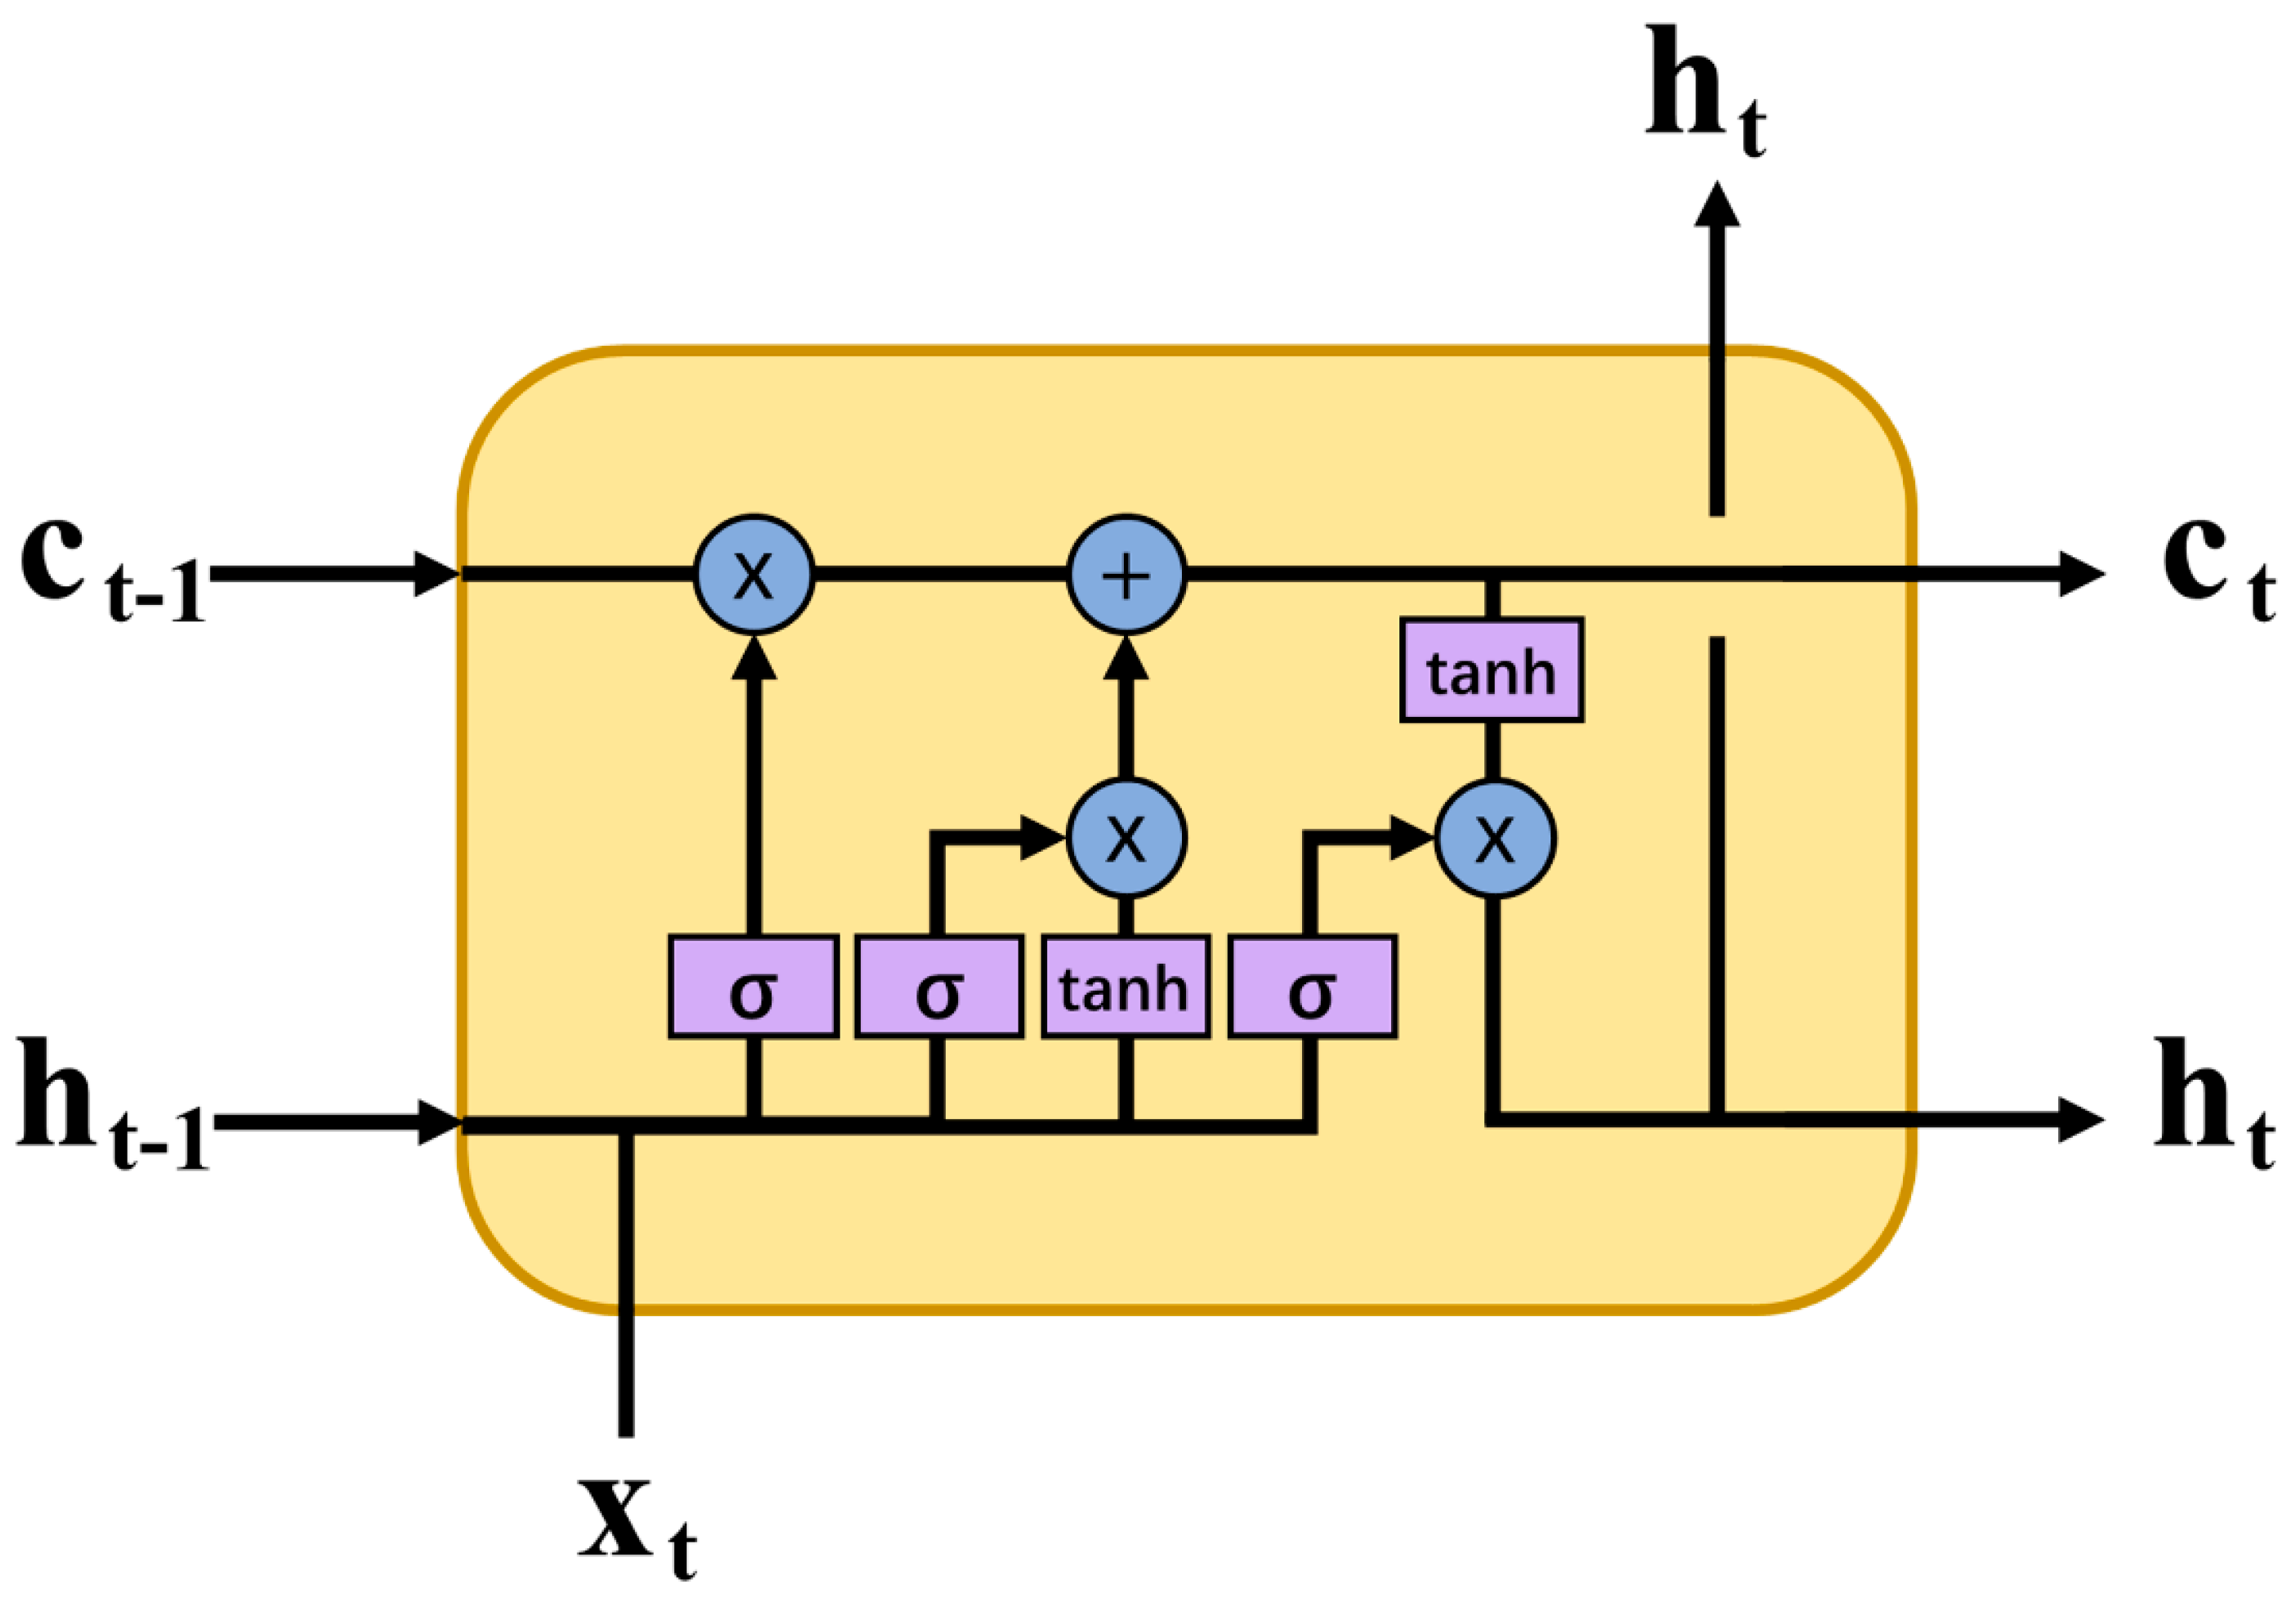
2.2. The Long Short-Term Memory Network

To eliminate the problems associated with vanishing gradients, LSTM belongs to a class of RNNs that is especially capable of analyzing time series. Through a series of forget ( f t ), input ( i t ), and output ( o t ) gates, the LSTM network can selectively remember patterns in long sequences of data, providing an advantage over conventional feed-forward neural networks and other RNNs. Past information is forgotten by the forget gate, with decisions on which information to delete defined as the value obtained by taking the sigmoid following receiving h t 1 and x t . The output of the sigmoid function ranges from 0 to 1 so that if the value is 0, information of the previous state is completely forgotten, and if the value is 1, information is completely retained. Information to be retained is saved in the input gate and following recording the values of h t 1 and x t , applies it to the sigmoid function. The value processed with the default tanh function and Hadamard product operator ( ) [29] is sent from the input gate. To represent the strength and direction of current information storage, i t ranges from 0 to 1 and C ¯ (the current state) ranges from −1 to 1. Each gate can be sequentially computed as follows:
f t = σ ( W x f x t + W h f h t 1 + b f )
i t = σ ( W x i x t + W h i h t 1 + b i )
o t = σ ( W x o x t + W h o h t 1 + b o )
C ¯ = tan h ( W x g x t + W h g h t 1 + b g )
c t = f t c t 1 + i t g t
h t = o t   tan h ( c t )
where W is each layer’s assigned weight, c t are the new cell states, x t is the input time step at t, b is the bias. A schematic of the LSTM memory block is depicted in Figure 3.

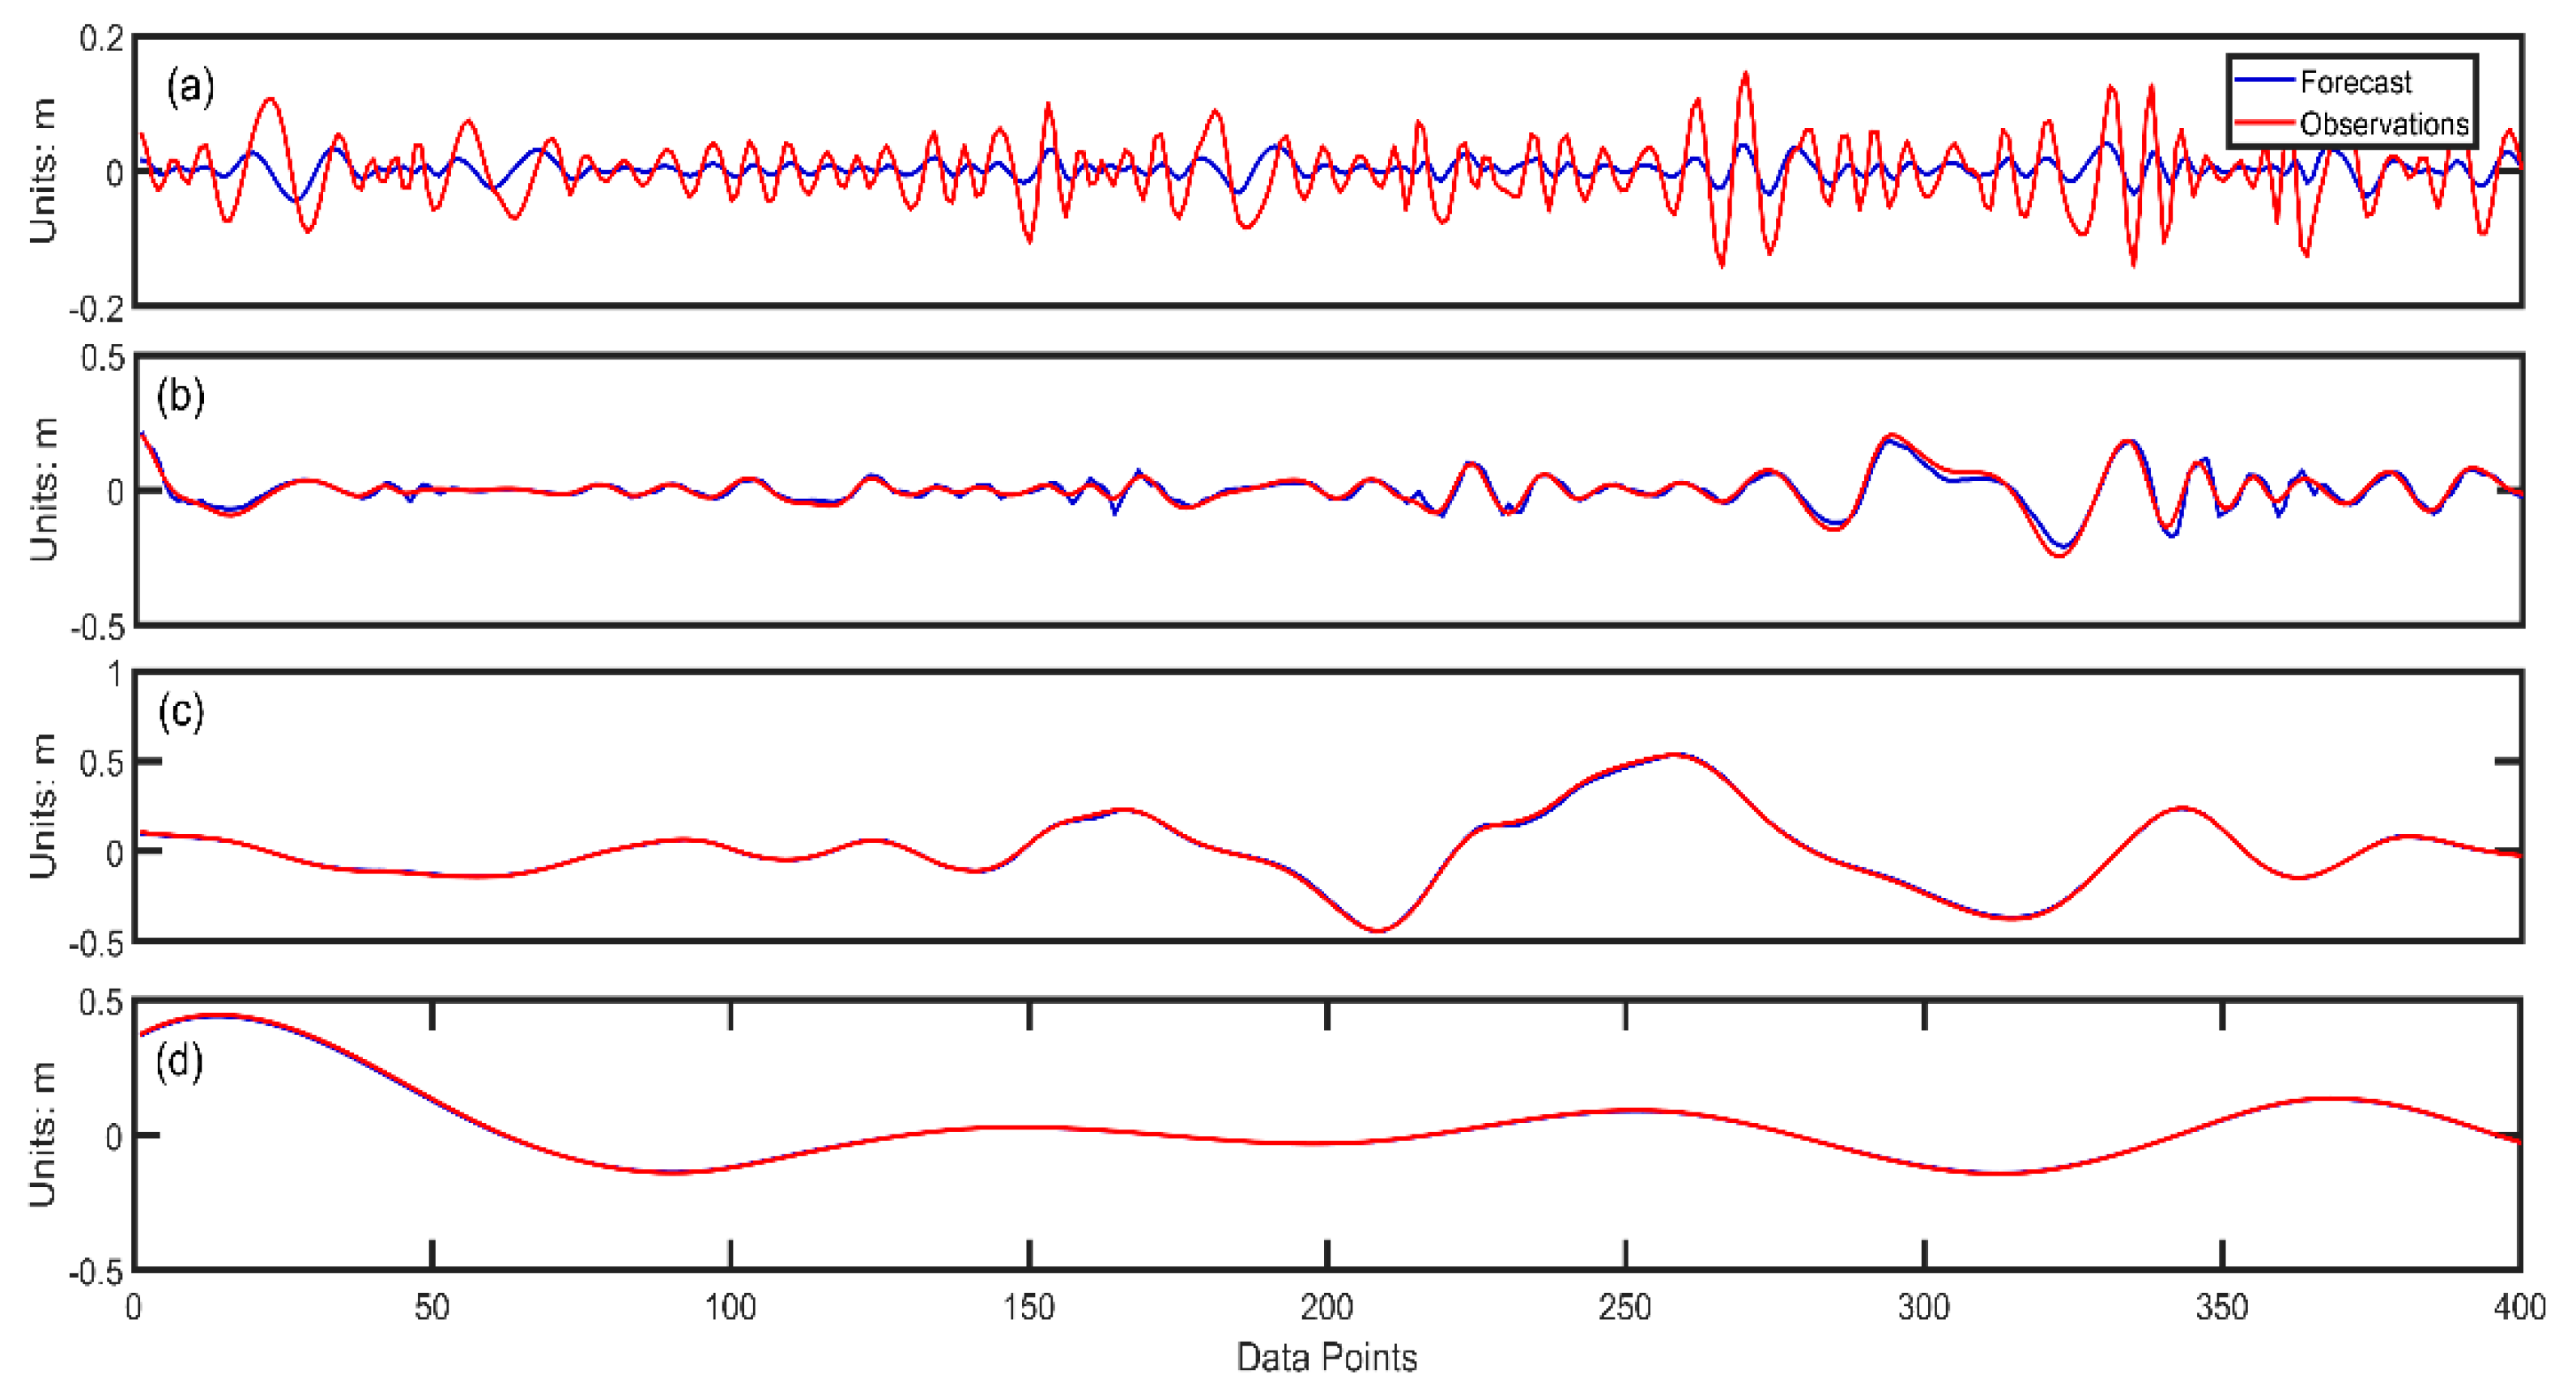
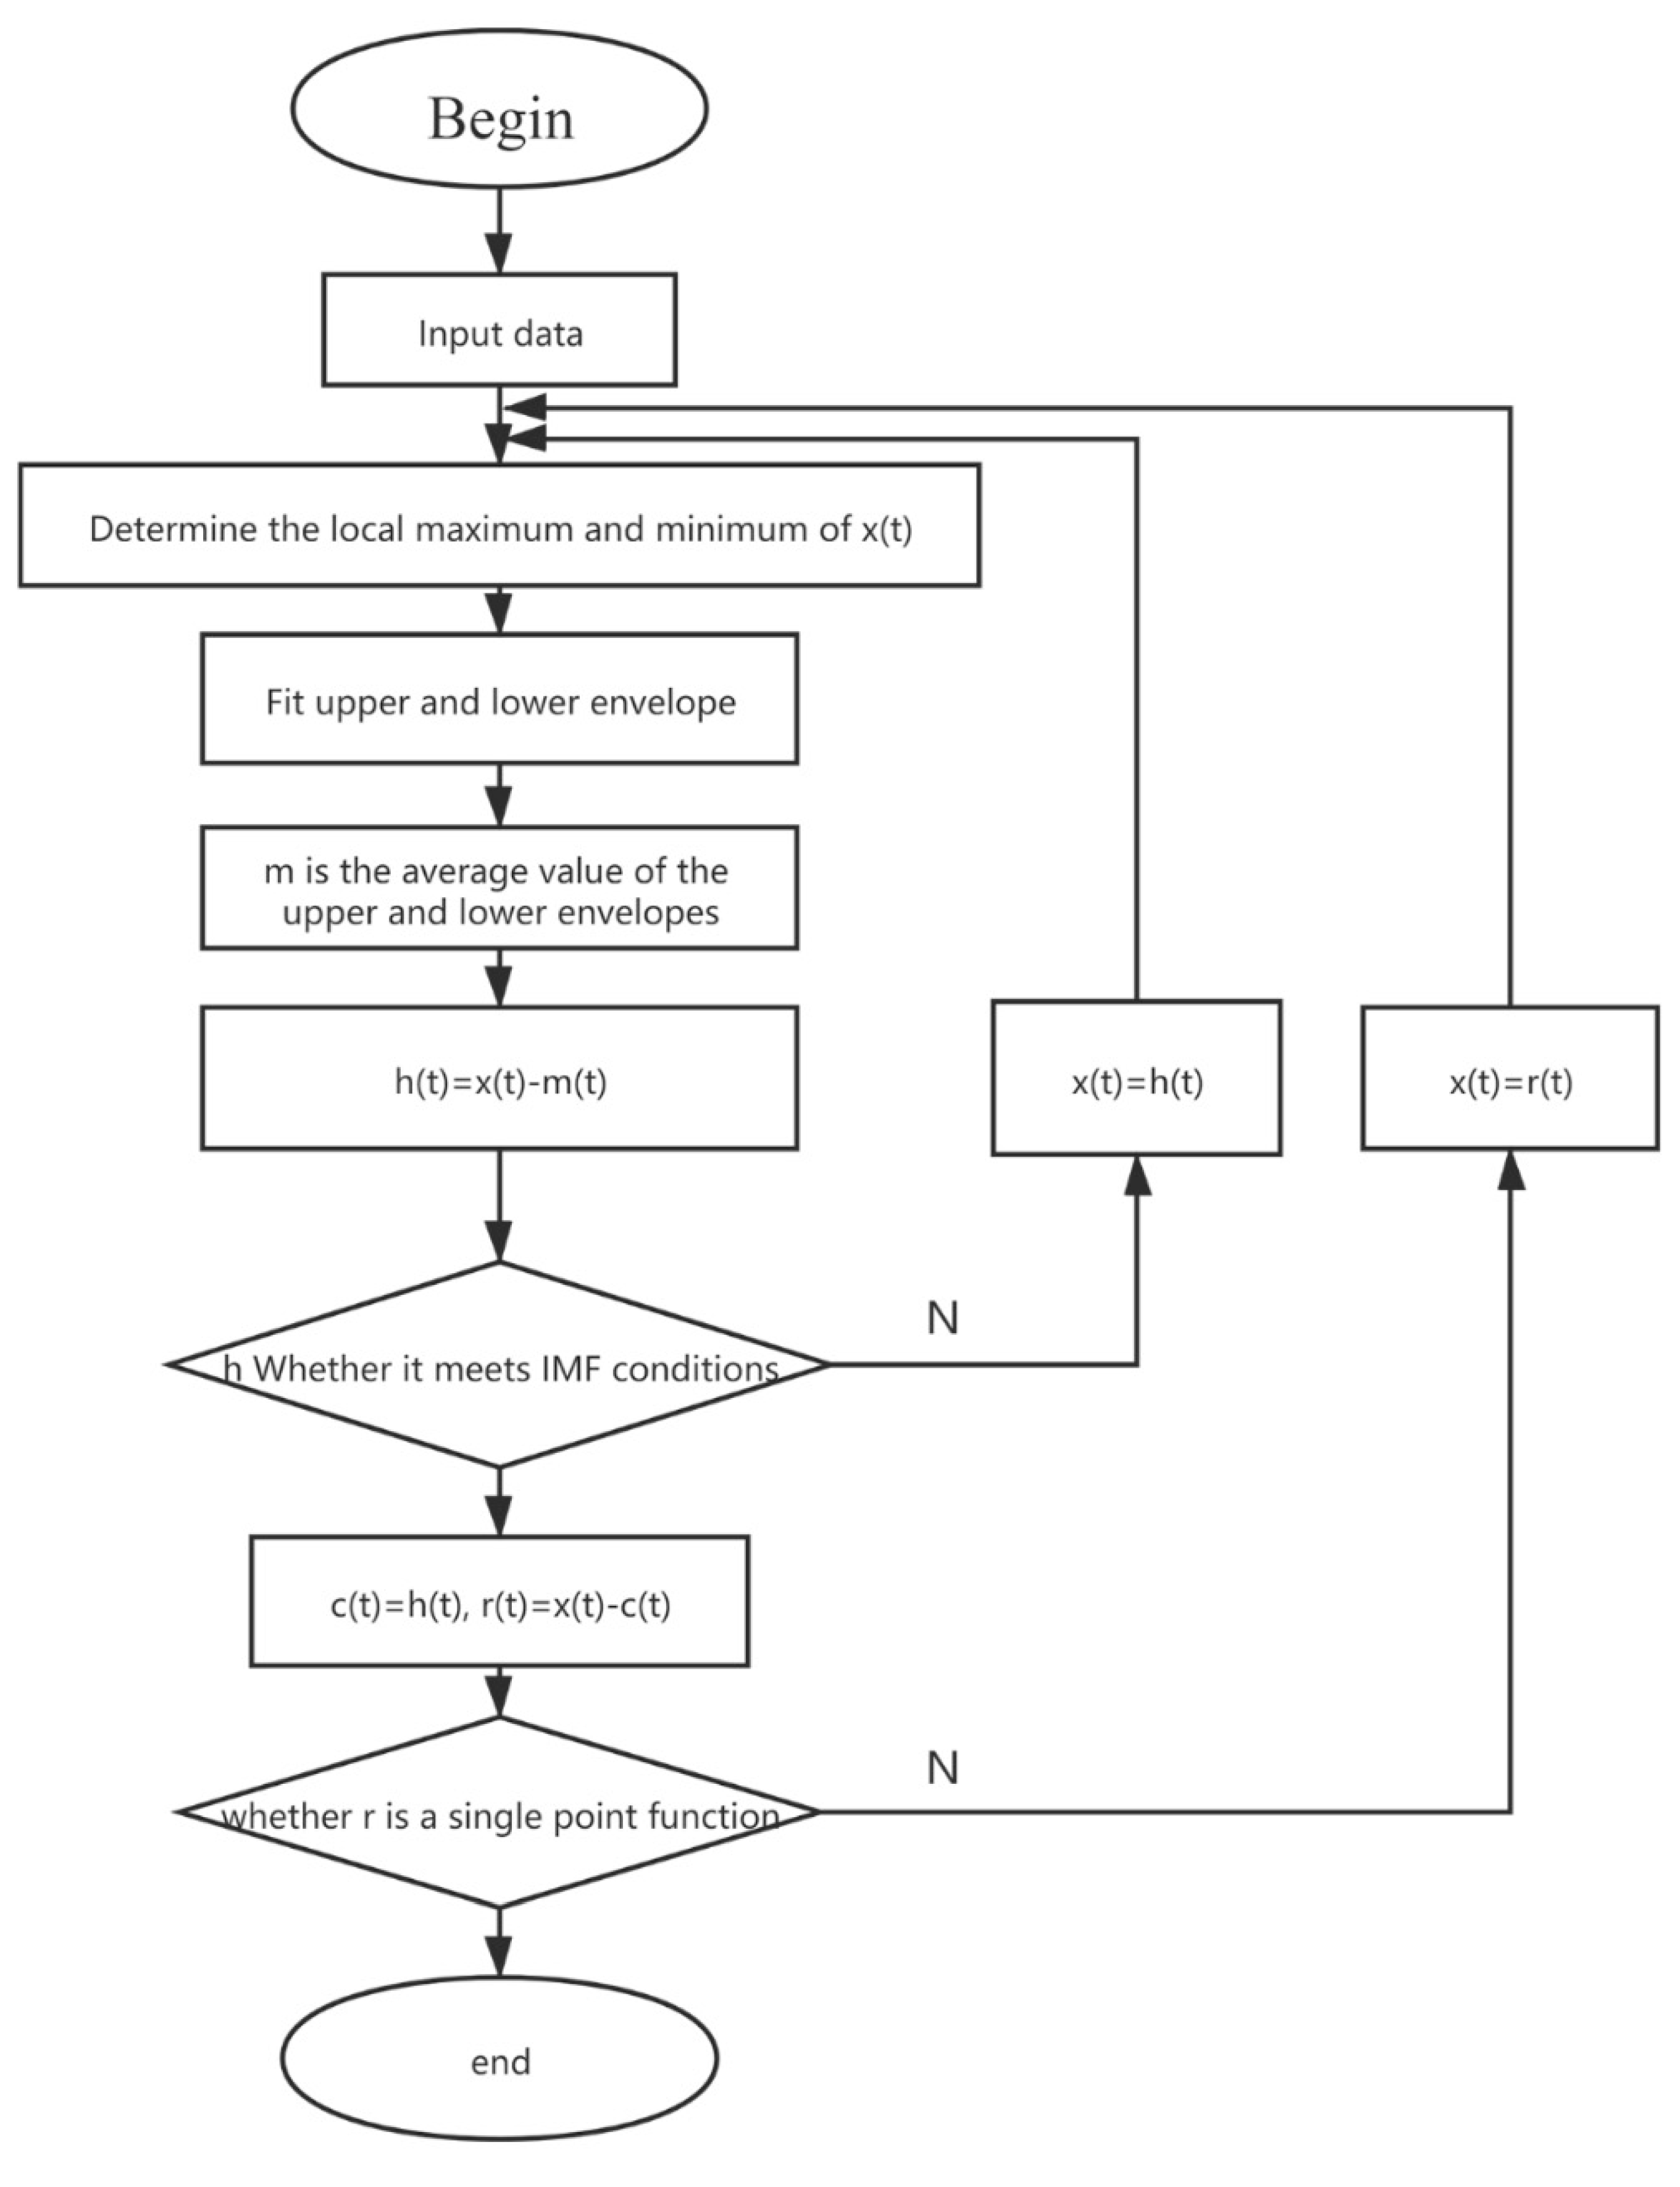
2.3. Empirical Mode Decomposition

Widely used in time series feature extraction, EMD provides a set of intrinsic mode functions (IMFs) decomposed from a signal, which allows users to decompose singular values and avoid being trapped in a local optimum [30]. To ensure model performance and robustness, all IMFs must meet the following two conditions: Firstly, for a given set of data sequence, the number of extremal points must be either equal to the number of zero crossings or, at the most, differ by one. Secondly, at any point, the mean value of the envelope of the local maxima and minima must be zero.
For an original signal x ( t ) , EMD decomposes x ( t ) through a sifting process, which is described as follows. An accompanying flowchart of the process is provided in Figure 4.
  • For signal   x ( t ) , identify all the maxima and minima.
  • Through a cubic spline interpolation, fit upper   u ( t ) and lower l ( t ) envelopes of signal x ( t ) . The mean of the two envelopes is the average envelope curve m 1 ( t ) :
    m 1 ( t ) = u ( t ) + l ( t ) 2
  • To obtain an IMF candidate, subtract m from x ( t ) :
    h 1 ( t ) = x ( t ) m 1 ( t )
  • If h 1 ( t ) does not satisfy the two IMF conditions, then h 1 ( t ) is set as the original signal and the prior step is repeated k times. Here, h k 1 ( t ) can be estimated as follows:
    h k 1 ( t ) = h 1 ( k 1 ) ( t ) m 1 k ( t )
    where h 1 ( k 1 ) ( t ) and h k 1 ( t ) represent the signal after shifting k − 1 and k times, respectively. m 1 k ( t ) is the average envelope of h k 1 ( t ) .
  • However, if h 1 ( t ) satisfies the two IMF conditions, then define h k 1 ( t ) as c 1 ( t ) . The standard deviation is defined as follows:
    S d = t = 0 T | h 1 ( k 1 ) ( t ) h k 1 ( t ) | 2 h 1 k 2 t ( 0.2 ,   0.3 )
  • To obtain a new signal r 1 ( t ) , subtract c 1 ( t ) from x ( t ) :
    r 1 ( t ) = x ( t ) c 1 ( t )
  • Repeat steps 1–6 until r n ( t ) cannot be further decomposed into IMFs. The residual of the original signal x ( t ) is given by r n ( t ) . The original signal x ( t ) can finally be presented as a collection of n components u i ( t ) ( i = 1 , 2 , , n   ) and a residual r n ( t ) :
    x ( t ) = i = 1 n u i ( t ) + r n ( t )
The theoretical foundations for both LSTM and EMD are both established and the full flowchart of the EMD-LSTM model is depicted in Figure 5. A total of thirteen IMFs and one residual were used in conjunction with the 2018 buoy data as the training dataset and predictions were compared to the 2019 buoy data that served as the testing dataset. The model’s activation function is the default tanh setting as a sensitivity test with the alternative ReLu activation function showed no meaningful difference between functions. The time step was set to six as this is the maximum allowed time step as established by Fan et al. [17] when using 1 year of data. Based on the 3, 6, 9, 12, 24, 48, and 72 h forecast windows, significant wave height forecasts were performed.

2.4. Performance Indicators
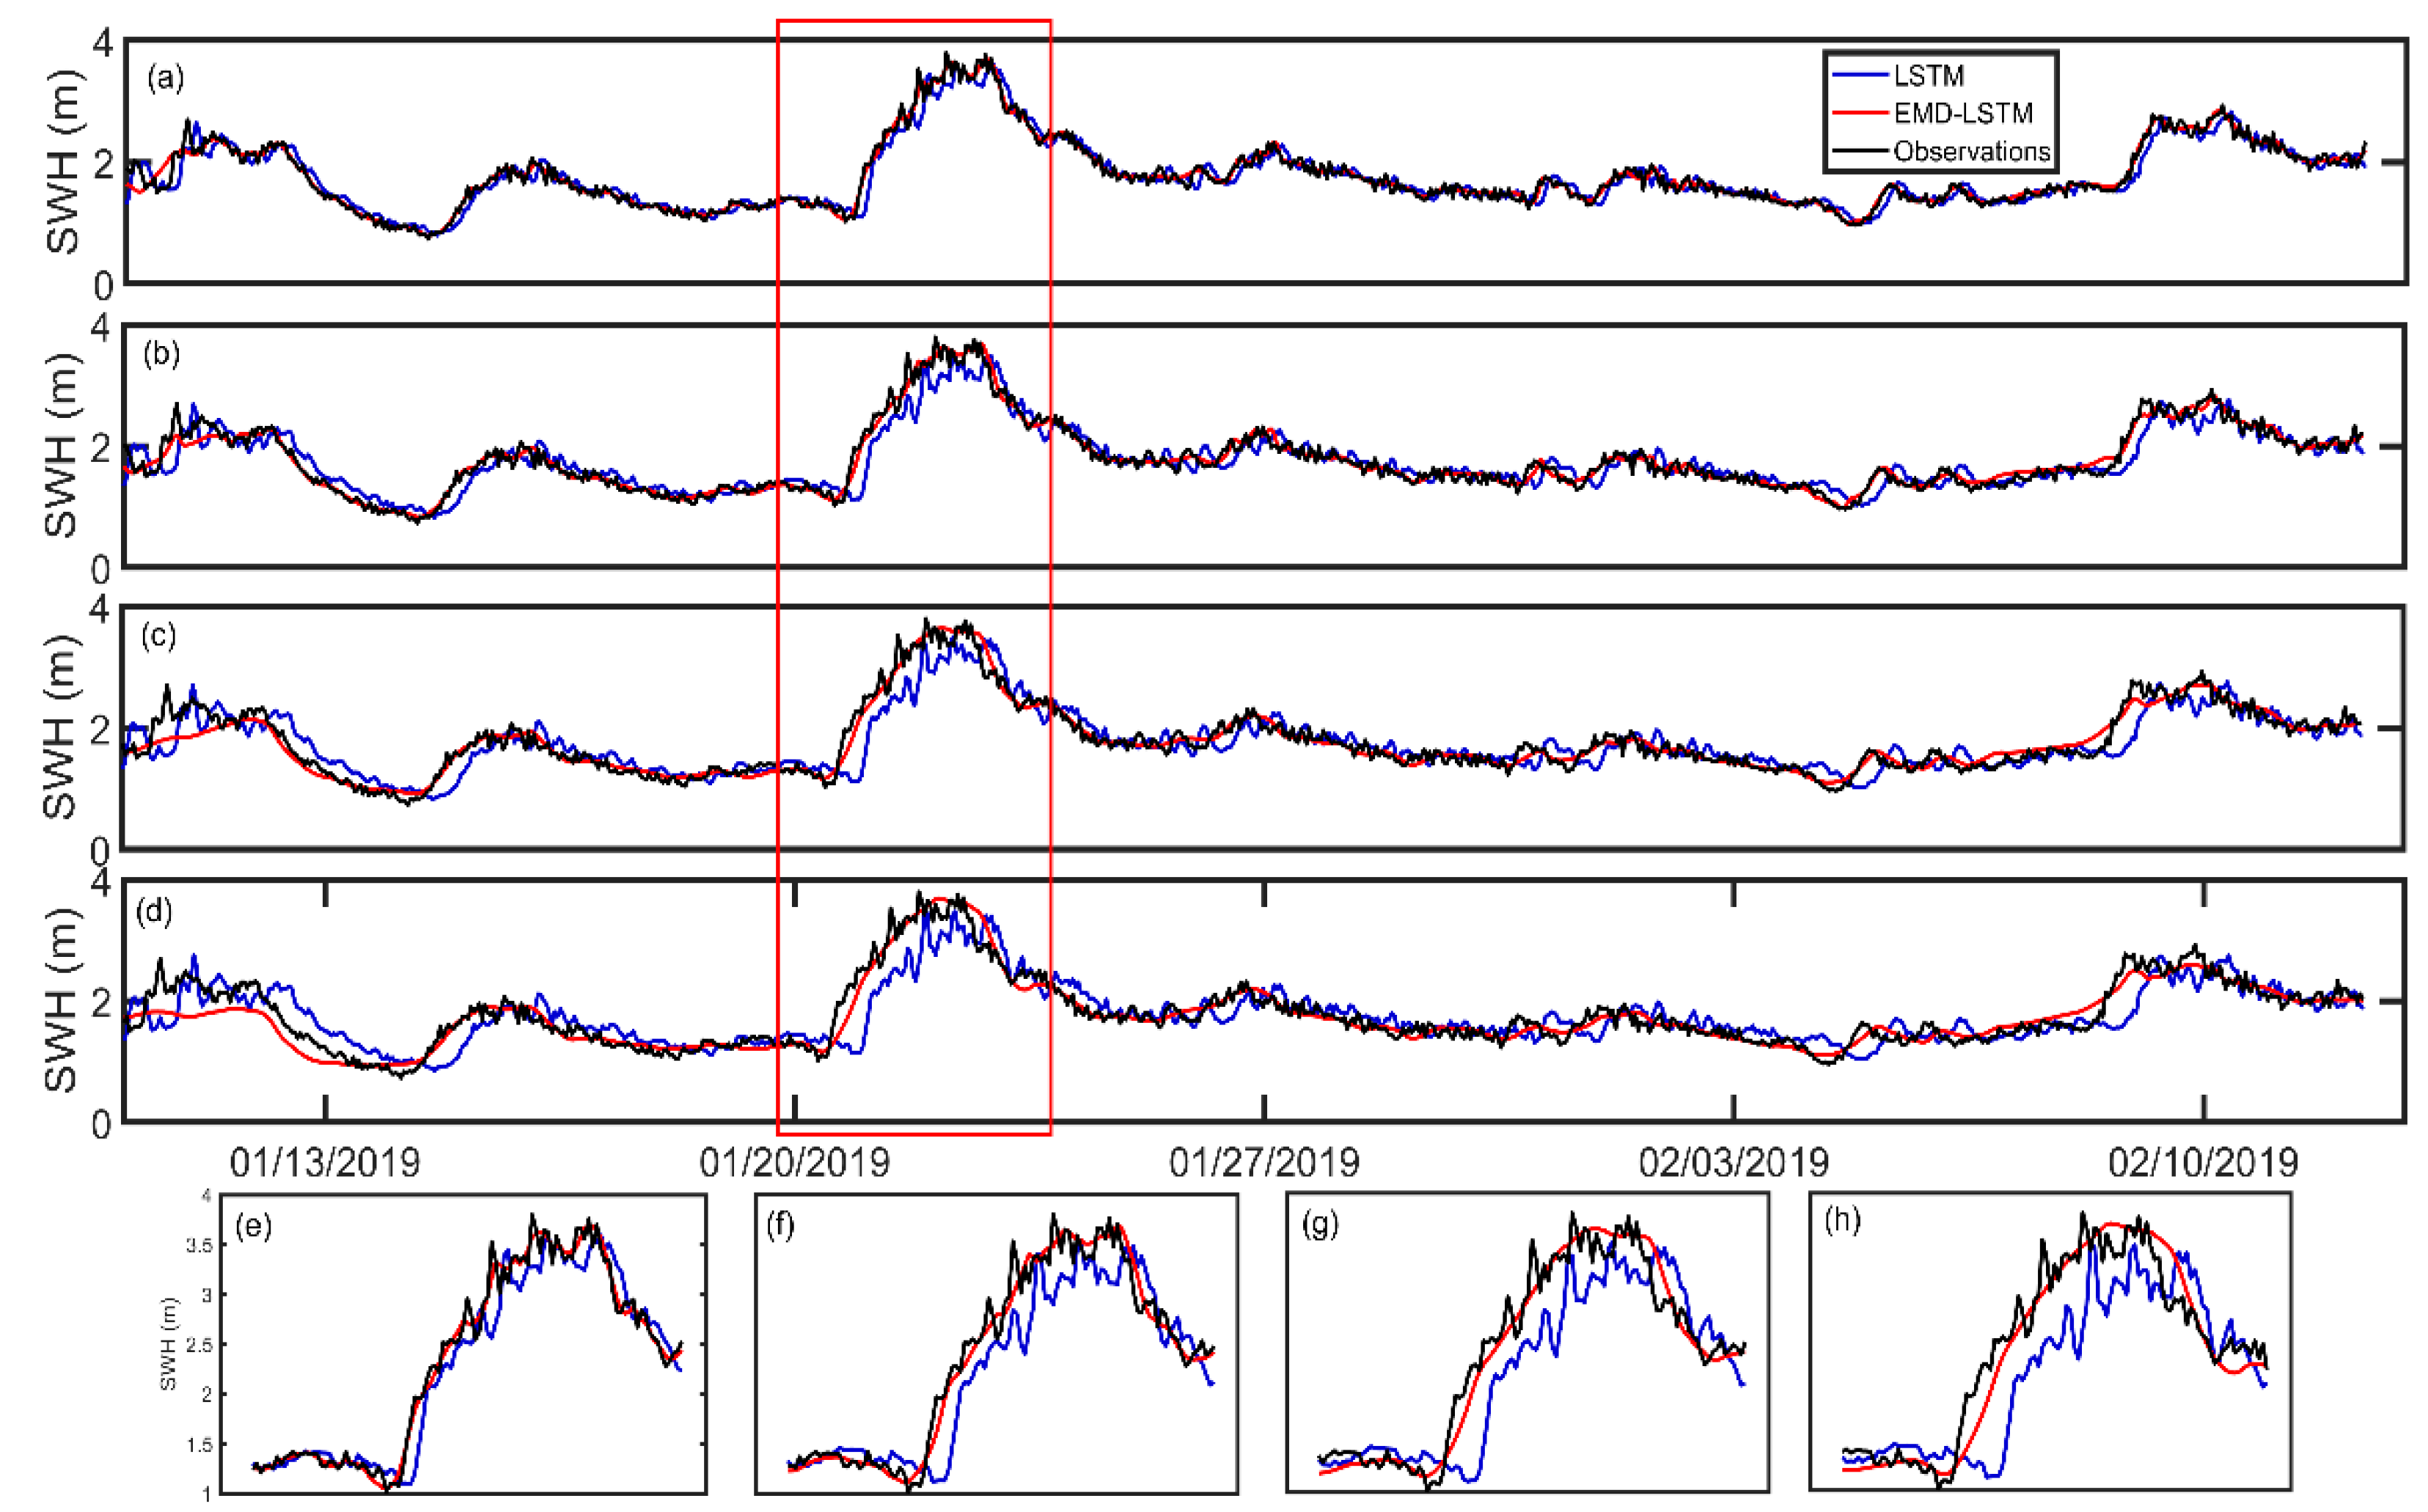
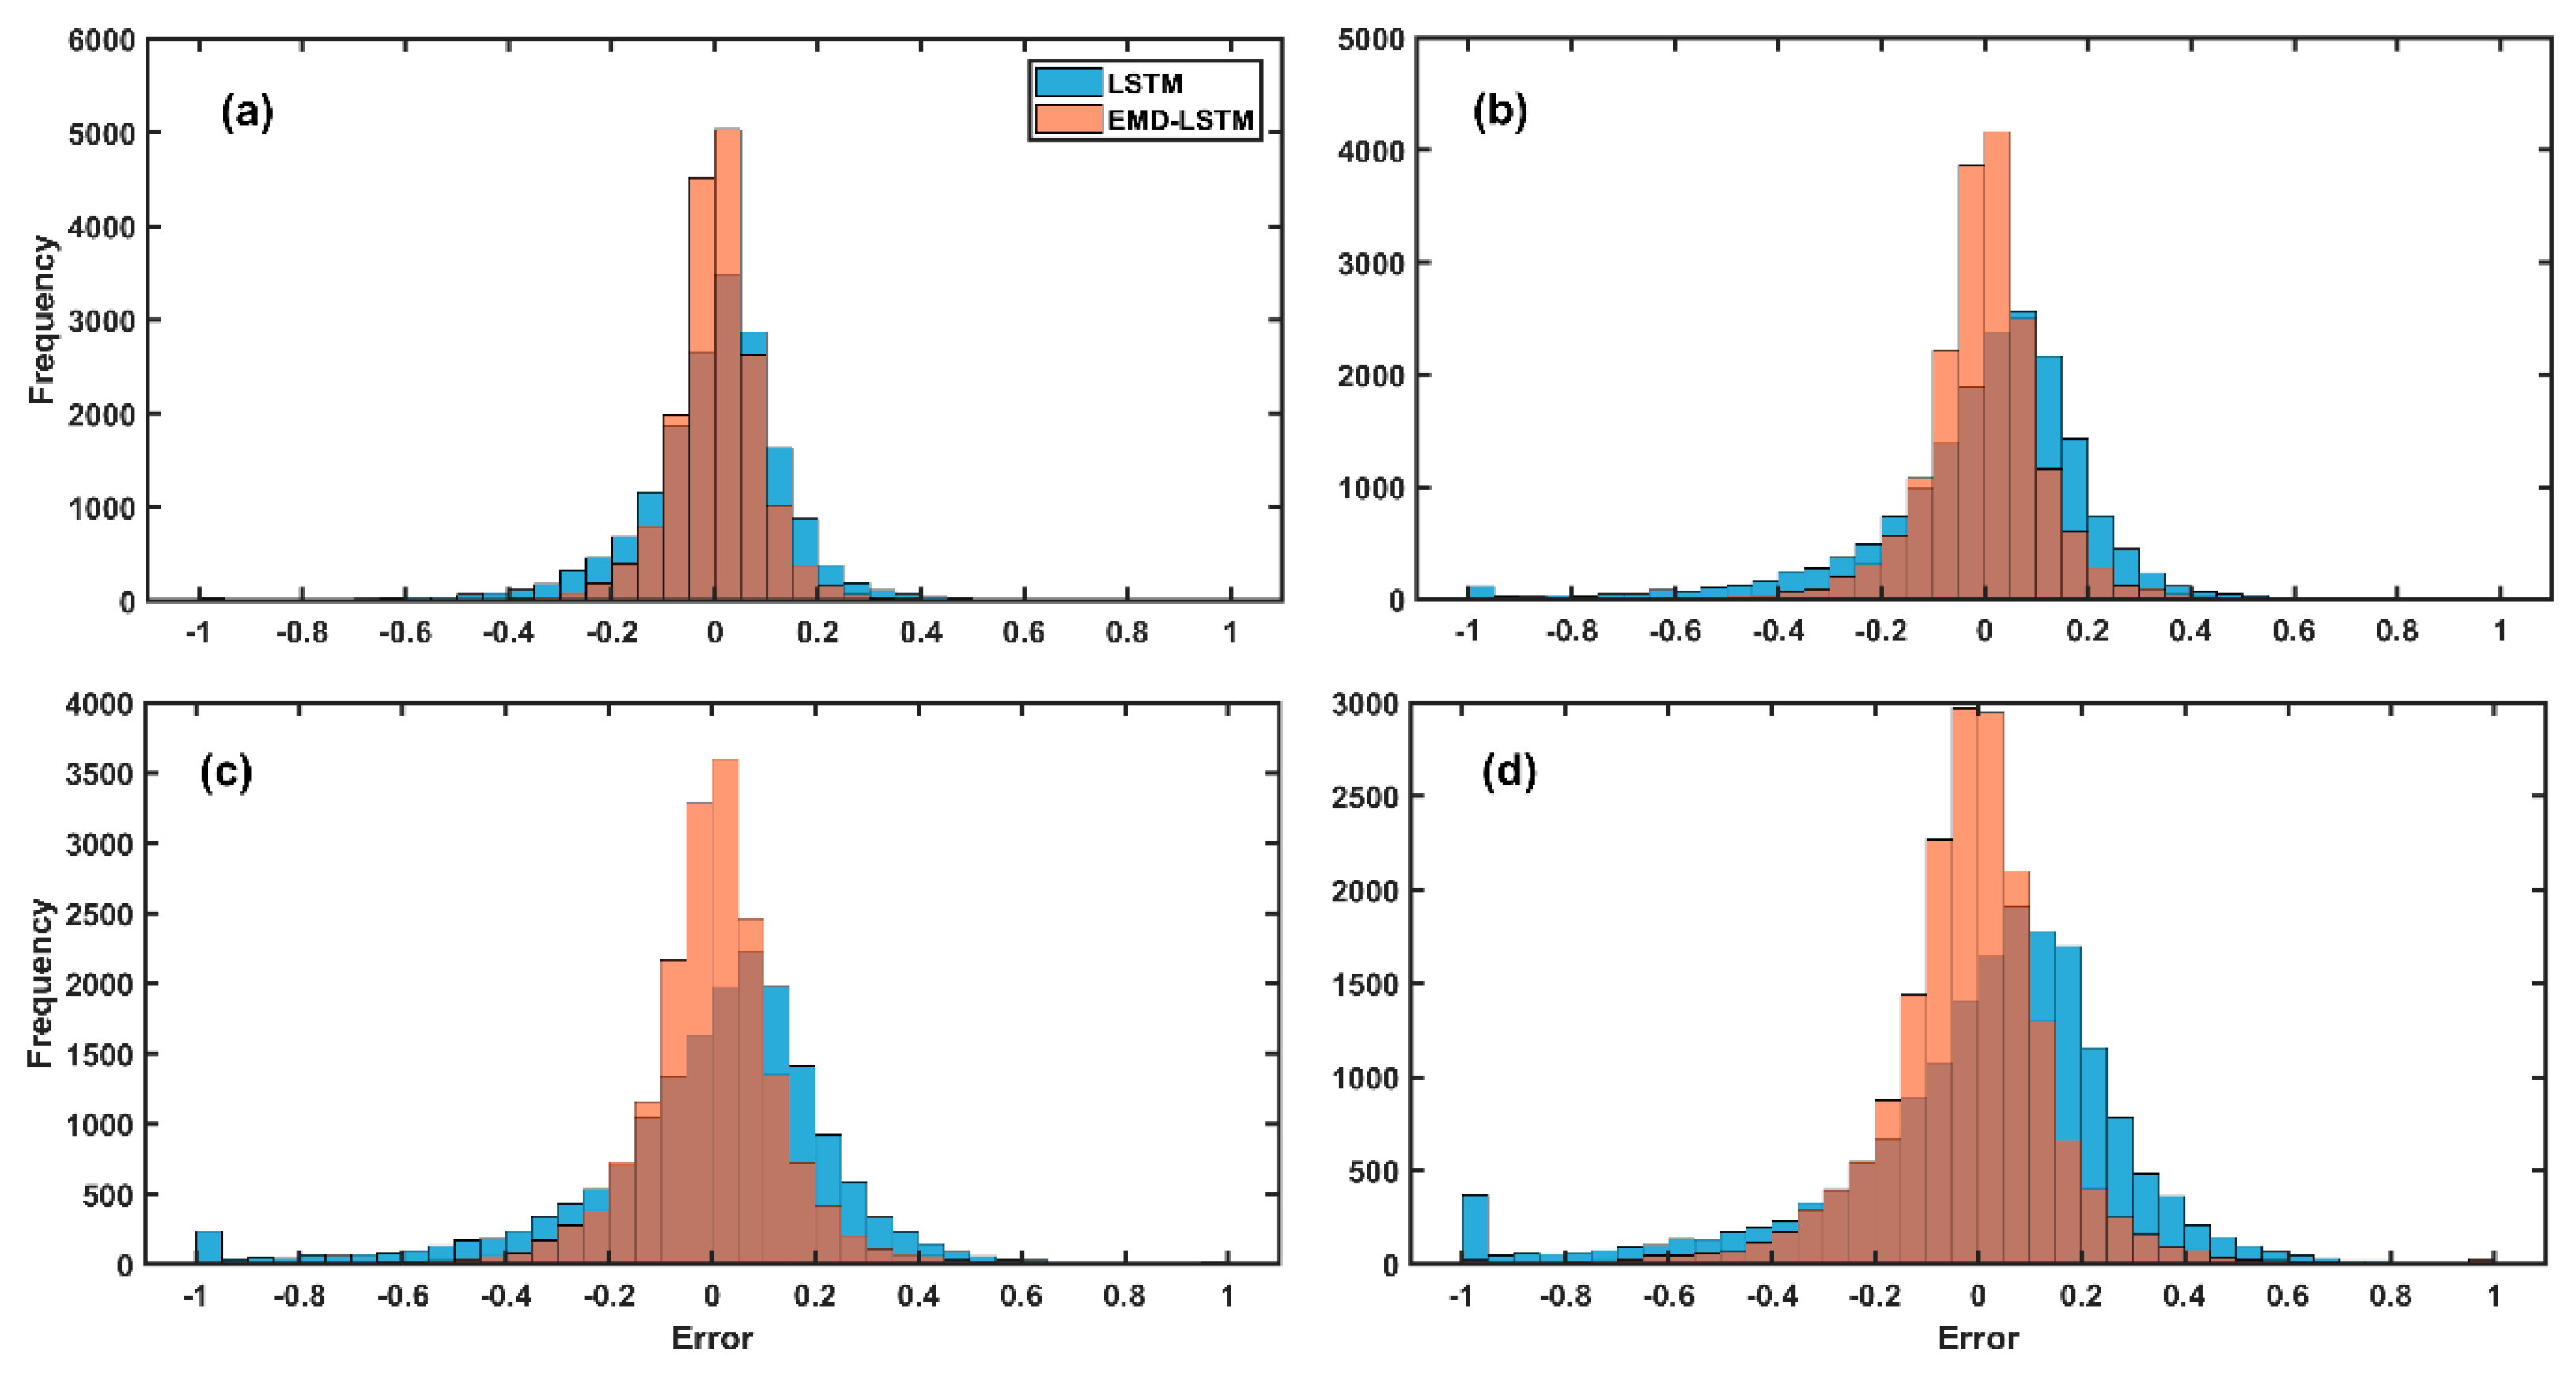
To assess the relative forecast efficacy of the LSTM and EMD-LSTM models, three commonly applied statistical techniques are used. The correlation coefficient (R), root mean square error (RMSE), and mean absolute percentage error (MAPE) are given as follows:
R = i = 1 n ( x i x ¯ ) ( y i y ¯ ) i = 1 n ( x i x ¯ ) 2 × i = 1 n ( y i y ¯ ) 2
R M S E = 1 n i = 1 n ( x i y i ) 2
M A P E = 100 % n i = 1 n | x i y i x i |
where x i and x ¯ are the observed and mean significant wave heights, respectively; y i and y ¯ are the predicted significant wave height and average predicted wave height, respectively; and the length of the time series is given by n.

3. Results

Although currently widely used in time series forecasting due to its powerful ability to selectively remember and forget information, LSTM is, as are all methods, restricted by its mathematical underpinnings and the scientific inability to completely observe physical phenomena. The addition of other tools is thus necessary. In this section, the efficacy of LSTM is compared when the model is integrated and undergirded with EMD. Using the performance indicators in Equations (13)–(15) with results presented in Figure 6, significant wave height (SWH) forecasting efficacy based on LSTM and EMD-LSTM for the 3, 6, 9, and 12 h windows can be examined. As can be easily observed, EMD-LSTM significantly better predicts trend changes in SWH than LSTM. At the 3 h forecast, the discrepancies between forecast accuracy in the two methods are minor and it is not easy to distinguish distinct advantages or disadvantages between the two. However, as time progresses, the LSTM’s forecast errors accumulate precipitously, as observed in later forecast horizons. For example, in Figure 6b–d where the forecast horizon is set to 6, 9, and 12 h, respectively, LSTM and EMD-LSTM forecasting results fall gradually out of phase with the observations, thus indicating worsening predictions. This is especially the case with large SWH values: when there are rapid changes in SWH, EMD-LSTM is superior. Thus, it can be concluded that LSTM on its own cannot accurately predict large SWH values.
To compare the forecast efficacy of these two methods more objectively, histograms of forecast errors are plotted in Figure 7. Errors larger than 1 m are binned together, while errors smaller than −1 m are binned together, and the total frequency of each occurrence (i.e., the occurrence of an error of a particular magnitude) is shown. Over time (i.e., as shown from Figure 7a–d that in sequence gives forecast errors at the 3, 6, 9, and 12 h windows), LSTM forecast errors gradually increase, though these errors are generally concentrated at 0.1 m, the frequency of errors at this magnitude also increases over time. By contrast, EMD-LSTM forecast errors are more evenly distributed and are distributed at around the 0 m mark. The frequency of errors greater than 1 m is also much lower than LSTM error frequencies. Thus, it can be demonstrated that the joint EMD-LSTM method not only displays a significantly higher prediction accuracy compared to LSTM, but also effectively minimizes the distribution of accumulated errors.
Listed in Table 2 are the results of the comprehensive error analysis conducted to determine the efficacy of both LSTM and EMD-LSTM over 3, 6, 9, 12, 24, 48 and 72 h forecast windows. There, it can be easily observed through enlarged forecast windows that RMSE and MAPE both steadily increased while R decreased for both LSTM and EMD-LSTM. However, EMD-LSTM’s performance, as measured by R, at each forecast window was noticeably higher than LSTM for either buoy. The degree of improvement in EMD-LSTM over LSTM clearly demonstrated that over increasingly longer time frames, the joint EMD-LSTM model was able to retard the growth of errors and maintain good correlations with the observations, with the most dramatic increase seen at the 72 h horizon that represented an ~93% increase in forecast skill. A different pattern was seen for MAPE, however. While the RMSE for EMD-LSTM was improved by approximately 25–45%, MAPE’s increase fluctuated. For buoy 41046′s short-term forecasts, MAPE’s degree of improvement was initially very large, ~78% at the 3 h horizon, but then dropped precipitously to ~27% at the 6 h window. Over a moderate-term horizon (9 and 12 h horizons), the degree of improvement stopped at ~8 and ~9%, respectively, before it increased again to ~40% at the 24 and 72 h long-term horizons. This pattern was not observed for buoy 41047 and, thus, this discrepancy may be due in part to data quality differences between the two buoys. Although buoys are assumed to be ground truth, the errors of buoys in their measurements as they imperfectly record the wave state must be considered. Additionally, because intermittency forces the use of interpolation (as in this study) or the introduction of reanalysis or model data (as may be found in other studies, e.g., [31]), these methods are not a perfect representation of the wave state. Errors consequently creep naturally and unavoidably into the results, following compounding by EMD-LSTM’s inherent errors, thus necessitating caution.
Though correlation is often the most valued performance metric, the RMSE, which carries the same unit as the measured variable, is even more important when considering, for example, the sensitivity of wave energy estimates to SWH (i.e., P H s 2 T p ). Here, minor increases or decreases in wave height ( H s 2 ) had a disproportionate and extremely large impact on total energy estimates; thus, precise forecasts for wave energy conversion operations are of primary importance to the commercial viability of this emerging field [32,33,34]. An example is provided in Figure 8 where it can be observed that an observed significant wave height of 3 m (black line) with forecast errors of ± 0.5   m for a given wave period (here ranging from 2–6 s), the maximum total wave energy predicted could then range anywhere from 18.75 kW/m for underestimations to overestimations of 36.75 kW/m, though the actual maximum value is 27 kW/m. Observations of RMSE’s evolution over time from the LSTM and EMD-LSTM models listed in Table 2 show that over increasingly long forecast horizons, RMSE increases. At the 72 h forecast window where LSTM’s RMSE was measured as 0.58 m, and EMD-LSTM’s RMSE was measured a 0.38 m for NDBC buoy 41046; a difference of 0.2 m could be observed. Similarly, for NDBC buoy 41047, the RMSE for LSTM was measured as 0.55, while for EMD-LSTM, it was 0.28, representing a halving of errors. Though these differences are minor, the total energy is proportional to the square of the wave height. Thus, these minor differences are essential to capture as they can lead to dramatically different forecasts, affecting not only wave energy estimates, but also forecasts of hurricane-induced waves [35,36,37] and storm surges [38,39]. Consequently, the joint EMD-LSTM model displays a dramatically lower RMSE for wave forecasts compared to LSTM alone and thus, wherever possible, should be used. As it is yet to be determined if the lower RMSEs produced by the joint EMD-LSTM model compared to LSTM are universally the case, caution should be applied in future studies.
In Figure 9a where the high-frequency IMFs are depicted, it can be easily seen that LSTM poorly predicts the observations, with only the main trends being captured and completely missing the extra and important details. Forecast skill improves significantly with the gradual lowering of frequencies, as shown in Figure 9b–d. Thus, it can be concluded that the EMD-LSTM model is able to significantly improve forecast quality for the primary reason that alone, LSTM is unable to capture high-frequency signals but following the decomposition of a given signal into a variety of components as achievable through EMD, lower-frequency signals can be separated from higher-frequency signals that contaminate underlying trends. As a result, forecast skill is significantly improved. With regards to high-frequency IMFs, it is hypothesized that the inclusion of wind information may increase the accuracy of wave forecasts, as shown in past research [40,41,42]. Although this is currently outside the scope of the present work, additional research into investigating this hypothesis is of significant value to overcome the present limitations of the EMD-LSTM model.

4. Conclusions

For oceanographic and maritime applications, precise, and not merely accurate, estimates and forecasts of significant wave height are crucial. It is for this reason that an equally wide array of physics-based numerical wave models and statistical techniques were developed to achieve both short- and long-term forecasts. We attempted to improve such forecasts through investigating the symbiosis and efficacy of EMD and LSTM network through a comparative analysis of wave forecasts conducted using LSTM alone. The results strongly suggest that in terms of accuracy, the joint EMD-LSTM network is superior to LSTM because EMD is able to decompose the original nonlinear significant wave height into a variety of IMFS, which then allows LSTM to better capture the changes in the trend. This result remains true, even up to a 72 h lead time as, judging from the forecasting evaluation indicators (root mean square error, mean average percent error, and correlation), EMD-LSTM remained superior to LSTM.
However, for rapid changes in the higher-frequency intrinsic mode functions (IMFs), LSTM is still unable to make effective predictions. Consequently, for raw, undecomposed significant wave height signals that contain high-frequency components, these components interfere with the accuracy of the model. For high-frequency IMFS that cannot currently be accurately predicted, errors may accrue from both instrumentation (i.e., buoys) and other noise. Additional errors may be due to only wave data being used to predict wave data and waves being generated by wind forcing (wind speed and direction) or modulated by ocean currents, which is a significant hindrance to further improvements. Naturally, wind speed should be a more feasible significant wave height predictor [43], but a weaker relationship between wind and waves may occur if there is swell contamination of the wave field. This necessitates careful screening when predictors are added, as these may serve to not only improve the prediction accuracy of significant wave height, but also to improve the response speed to extreme wave heights. This study used the EMD-LSTM method to predict significant wave height. Compared to previous studies, the accuracy of the forecast is considerably improved, and the correlation of the 72 h forecast reaches 0.7. However, in practical applications, because EMD decomposition requires continuous data, and the actual data are inevitably missing, certain interpolation processing should be performed. The EMD-LSTM network can provide more precise forecasts of significant wave height and thus can increase capacity for real-time scheduling of fishing boat operations, wave energy, or other offshore engineering activities.

Author Contributions

Methodology, S.Z., B.J.B., and W.S.; Project administration, S.Z.; Writing–original draft, S.Z., B.J.B., Y.Z., W.X., and C.D.; Writing–review and editing, C.D. All authors have read and agreed to the published version of the manuscript.

Funding

This study was supported by the Project supported by Southern Marine Science and Engineering Guangdong Laboratory (Zhuhai) (SML2020SP007), the Key Program of Marine Economy Development (Six Marine Industries) Special Foundation of Department of Natural Resources of Guangdong Province [GDNRC(2020)049], the National College Students’ Platform for Innovation and Entrepreneurship Training Program (202010300017Z), the Jiangsu Province College Students’ Platform for Innovation and Entrepreneurship Training Program (202010300017Z), and the NUIST Students’ Platform for Innovation and Entrepreneurship Training Program (202010300017Z).

Institutional Review Board Statement

Not applicable.

Informed Consent Statement

Not applicable.

Data Availability Statement

All data used in this study are available from the National Data Buoy Center at https://www.ndbc.noaa.gov/ (accessed on 4 July 2021).

Acknowledgments

The National Data Buoy Center is thanked for its publicly accessible datasets.

Conflicts of Interest

The authors declare no conflict of interest.

References

  1. Dinwoodie, I.; Catterson, V.M.; McMillan, D. Wave height forecasting to improve off-shore access and maintenance scheduling. In Proceedings of the Power and Energy Society General Meeting (PES), Vancouver, BC, Canada, 21–25 July 2013. [Google Scholar]
  2. Taylor, J.W.; Jeon, J. Probabilistic Forecasting of Wave Height for Offshore Wind Turbine Maintenance. Eur. J. Oper. Res. 2018, 267, 877–890. [Google Scholar] [CrossRef]
  3. Guillou, N.; Lavidas, G. Wave Energy Resource Assessment for Exploitation—A review. J. Mar. Sci. Eng. 2020, 8, 705. [Google Scholar] [CrossRef]
  4. Chen, C.; Shiotani, S. Numerical ship navigation based on weather and ocean simulation. Ocean Eng. 2013, 69, 44–53. [Google Scholar] [CrossRef] [Green Version]
  5. Chen, C.; Sasa, K. Statistical analysis of waves’ effects on ship navigation using high-resolution numerical wave simulation and shipboard measurements. Ocean Eng. 2021, 229, 108757. [Google Scholar] [CrossRef]
  6. Fazeres-Ferradosa, T.; Taveira-Pinto, F.; Vanem, E.; Reis, M.T.; Neves, L.D. Asymmetric copula-based distribution models for met-ocean data in offshore wind engineering applications. Wind Eng. 2018, 42, 304–334. [Google Scholar] [CrossRef] [Green Version]
  7. Fazeres-Ferradosa, T.; Welzel, M.; Schendel, A.; Baelus, L.; Santos, P.R.; Pinto, F.T. Extended characterization of damage in rubble mound scour protections. Coast. Eng. 2020, 148, 103671. [Google Scholar] [CrossRef]
  8. Tolman, H.L. User Manual and System Documentation of WAVEWATCH III TM Version 3.14. NOAA/NWS/NCEP/MMAB. Technical Note, May 2009; U.S. Department of Commerce, National Oceanic and Atmospheric Administration National Weather Service, National Centers for Environmental Prediction: College Park, MD, USA, 2019; p. 187.
  9. Booij, N.; Ris, R.C. A third-generation wave model for coastal regions 1. Model description and validation. J. Geophys. Res. Atmos. 1999, 104, 7649–7666. [Google Scholar] [CrossRef] [Green Version]
  10. Vanem, E.; Fazeres-Ferradosa, T.; Rosa-Santos, P.; Taveira-Pinto, F. Statistical description and modeling of extreme ocean wave conditions. Marit. Eng. 2019, 172, 124–132. [Google Scholar] [CrossRef]
  11. Jäger, W.S.; Nagler, T.; Czado, C.; McCall, R.T. A Statistical Simulation Method for Joint Time Series of Non-Stationary Hourly Wave Parameters. Coast. Eng. 2019, 146, 14–31. [Google Scholar] [CrossRef] [Green Version]
  12. Deo, M.C.; Naidu, C.S. Real Time Forecasting Using Neural Networks. Ocean Eng. 1998, 26, 191–203. [Google Scholar] [CrossRef]
  13. Mandal, S.; Prabaharan, N. Ocean wave forecasting using recurrent neural networks. Ocean Eng. 2006, 33, 1401–1410. [Google Scholar] [CrossRef]
  14. Zubier, K.M. Using an Artificial Neural Network for Wave Height Forecasting in the Red Sea. Indian J. Geo Mar. Sci. 2020, 49, 184–191. [Google Scholar]
  15. Ali, M.; Prasad, R. Significant wave height forecasting via an extreme learning machine model integrated with improved complete ensemble empirical mode decomposition. Renew. Sustain. Energy Rev. 2019, 104, 281–295. [Google Scholar] [CrossRef]
  16. Gao, S.; Huang, J.; Li, Y.; Liu, G.; Bi, F.; Bai, Z. A forecasting model for wave heights based on a long short-term memory neural network. Acta Oceanol. Sin. 2021, 40, 62–69. [Google Scholar] [CrossRef]
  17. Fan, S.; Xiao, N.; Dong, S. A novel model to predict significant wave height based on long short-term memory network. Ocean Eng. 2020, 205, 107298. [Google Scholar] [CrossRef]
  18. Zhang, B. Foreign exchange rates forecasting with an EMD-LSTM neural networks model. J. Phys. Conf. Ser. 2018, 1053, 012005. [Google Scholar] [CrossRef]
  19. Xuan, Y.; Yu, Y.; Wu, K. Prediction of Short-term Stock Prices Based on EMD-LSTM-CSI Neural Network Method. In Proceedings of the 2020 5th IEEE International Conference on Big Data Analytics (ICBDA), Xiamen, China, 8–11 May 2020; pp. 135–139. [Google Scholar]
  20. Yang, Y.; Yang, Y.; Xiao, J. A Hybrid Prediction Method for Stock Price Using LSTM and Ensemble EMD. Complexity 2002, 2020, 6431712. [Google Scholar]
  21. Zheng, H.; Yuan, J. Short-Term Load Forecasting Using EMD-LSTM Neural Networks with a Xgboost Algorithm for Feature Importance Evaluation. Energies 2017, 10, 1168. [Google Scholar] [CrossRef] [Green Version]
  22. Chen, Q.; Wen, D. Empirical mode decomposition based long short-term memory neural network forecasting model for the short-term metro passenger flow. PLoS ONE 2019, 15, e0231199. [Google Scholar] [CrossRef]
  23. Dai, S.; Chen, Q. Time series prediction based on EMD-LSTM model. J. Shenzhen Univ. Sci. Eng. 2020, 37, 265–270. [Google Scholar] [CrossRef]
  24. Liu, D.; Jiang, W.; Mu, L.; Wang, S. Streamflow Prediction Using Deep Learning Neural Network: Case Study of Yangtze River. IEEE Access 2020, 8, 90069–90086. [Google Scholar] [CrossRef]
  25. Guo, Y.; Cao, X. El Niño Index Prediction Using Deep Learning with Ensemble Empirical Mode Decomposition. Symmetry 2020, 12, 893. [Google Scholar] [CrossRef]
  26. Huang, Y.; Liu, S. Wind Speed Forecasting Method Using EEMD and the Combination Forecasting Method Based on GPR and LSTM. Sustainability 2018, 10, 3693. [Google Scholar] [CrossRef] [Green Version]
  27. Tang, G.; Du, H. An EMD-PSO-LSSVM hybrid model for significant wave height prediction. Ocean Sci. Discuss. 2021. [Google Scholar] [CrossRef]
  28. Raj, N.; Brown, J. An EEMD-BiLSTM Algorithm Integrated with Boruta Random Forest Optimiser for Significant Wave Height Forecasting along Coastal Areas of Queensland, Australia. Remote Sens. 2021, 13, 1456. [Google Scholar] [CrossRef]
  29. Yu, Y.; Si, X.; Hu, C.; Zhang, J. A Review of Recurrent Neural Networks: LSTM Cells and Network Architectures. Neural Computation 2019, 31, 1235–1270. [Google Scholar] [CrossRef]
  30. Huang, N.E.; Shen, Z. The empirical mode decomposition and the Hilbert spectrum for nonlinear and non-stationary time series analysis. R. Soc. Lond. Proc. Ser. A 1998, 454, 903–998. [Google Scholar] [CrossRef]
  31. Bethel, B.J.; Dong, C.; Zhou, S.; Cao, Y. Bidirectional Modeling of Surface Winds and Significant Wave Heights in the Caribbean Sea. J. Mar. Sci. Eng. 2021, 9, 547. [Google Scholar] [CrossRef]
  32. Ibarra-Berastegi, G.; Sáenz, J.; Esnaola, G.; Ezcurra, A.; Ulazia, A.; Rojo, N.; Gallastegui, G. Wave Energy Forecasting at Three Coastal Buoys in the Bay of Biscay. IEEE J. Ocean. Eng. 2016, 41, 923–929. [Google Scholar] [CrossRef]
  33. Mérigaud, A.; Ramos, V. Ocean forecasting for wave energy production. J. Mar. Res. 2017, 75, 459–505. [Google Scholar] [CrossRef] [Green Version]
  34. Ni, C. Data-driven models for short-term ocean wave power forecasting. IET Renew. Power Gener. 2021, 1–9. [Google Scholar] [CrossRef]
  35. Wang, T.; Yang, Z. A Sensitivity Analysis of the Wind Forcing Effect on the Accuracy of Large-Wave Hindcasting. J. Mar. Sci. Eng. 2018, 6, 139. [Google Scholar] [CrossRef] [Green Version]
  36. Kuznetsova, A.; Baydakov, G. Wind Waves Modeling Under Hurricane Wind Conditions. J. Phys. Conf. Ser. 2019, 1163, 012054. [Google Scholar] [CrossRef]
  37. Ding, Y.; Ding, T. Simulation and Prediction of Storm Surges and Waves Using a Fully Integrated Process Model and a Parametric Cyclonic Wind Model. J. Geophys. Res. Ocean. 2020, 25, e2019JC015793. [Google Scholar] [CrossRef]
  38. Kohno, N.; Dube, S.K. Recent Progress in Storm Surge Forecasting. Trop. Cyclone Res. Rev. 2018, 7, 128–139. [Google Scholar]
  39. Yang, K.; Paramygin, V.A. A Rapid Forecasting and Mapping System of Storm Surge and Coastal Flooding. Weather Forecast. 2020, 35, 1663–1681. [Google Scholar] [CrossRef] [Green Version]
  40. Bozorgzadeh, L.; Bakhtiari, M. Forecasting of Wind-Wave Height by Using Adaptive NeuroFuzzy Inference System and Decision Tree. J. Soft Comput. Civ. Eng. 2019, 3, 22–36. [Google Scholar]
  41. Chen, S.; Wang, Y. Improving Coastal Ocean Wave Height Forecasting during Typhoons by using Local Meteorological and Neighboring Wave Data in Support Vector Regression Models. J. Mar. Sci. Eng. 2020, 8, 149. [Google Scholar] [CrossRef] [Green Version]
  42. Wu, M.; Stefanakos, C. Multi-Step-Ahead Forecasting of Wave Conditions Based on a Physics-Based Machine Learning (PBML) Model for Marine Operations. J. Mar. Sci. Eng. 2020, 8, 992. [Google Scholar] [CrossRef]
  43. Wang, H.; Yang, J. Estimation of Significant Wave Heights from ASCAT Scatterometer Data via Deep Learning Network. Remote Sens. 2021, 13, 195. [Google Scholar] [CrossRef]
Figure 1. Locations of National Data Buoy Center buoys 41046 and 41047.
Jmse 09 00744 g001
Figure 2. Time series of significant wave height (m) recorded by National Data Buoy Center (NDBC) buoys 41046 (blue) and 41047 (red) over the 2-year, 2018–2019, period.
Jmse 09 00744 g002
Figure 3. The long short-term memory network block architecture.
Jmse 09 00744 g003
Figure 4. The EMD flowchart.
Jmse 09 00744 g004
Figure 5. The joint EMD-LSTM model flowchart.
Jmse 09 00744 g005
Figure 6. Comparison of LSTM (blue) and EMD-LSTM (red) significant wave height (m) forecasts with the observations (black) at the (a) 3, (b) 6, (c) 9, and (d) 12 h windows. The subplots provide a closer examination of deviations between observations and forecasts at the (e) 3, (f) 6, (g) 9, and (h) 12 h windows.
Jmse 09 00744 g006
Figure 7. Comparison of LSTM (blue) and EMD-LSTM (red) significant wave height (m) forecast errors at the (a) 3, (b) 6, (c) 9, and (d) 12 h windows for buoys 41046 and 41047.
Jmse 09 00744 g007
Figure 8. Hypothetical consequences of under (blue) and overestimating (red) a 3 m significant wave height (black) by ± 0.5 m.
Jmse 09 00744 g008
Figure 9. Comparison of (blue) significant wave height forecasts of (a) the second (b) third, (c) fourth, and (d) fifth intrinsic mode functions.
Jmse 09 00744 g009
Table 1. Selected National Data Buoy Center buoys and their relevant statistics. Data range from 1 January 2018–31 December 2019.
Buoy IDLatitude (°N)Longitude (°W)Water Depth (m)No. of Observations before InterpolationNo. of Observations after Interpolation
4104623.82268.384554917,42017,520
4104727.51471.494532117,40217,520
Table 2. Comparison of error statistics between LSTM and EMD-LSTM, in addition to the degrees of improvement for the 3, 6, 9, 12, 24, 48 and 72 h forecast windows for NDBC buoys 41046 and 41047.
LSTMEMD-LSTMDegree of Improvement
Forecast HoursRMSE (m)MAPE (%)RRMSE (m)MAPE (%)RRMSE (%)MAPE (%)R (%)
4104630.156.40.970.111.410.98530.177.81.5
60.229.20.920.126.680.97944.627.46.4
90.2811.10.880.1610.200.96042.47.89.1
120.3313.20.840.1912.010.95041.19.213.1
240.4519.00.670.2611.410.90041.839.934.3
480.5831.10.410.3818.900.79033.739.292.7
720.6033.70.320.4418.700.69026.144.5115.6
4104730.197.20.970.103.960.99146.844.92.1
60.2811.30.930.145.510.98250.251.25.6
90.3513.10.880.187.380.97149.243.710.3
120.4015.00.830.218.420.95747.043.915.3
240.5522.00.670.2811.760.92248.246.537.6
480.6733.40.430.4720.350.76929.939.178.9
720.7138.80.340.48210.75732.245.9122.6
Publisher’s Note: MDPI stays neutral with regard to jurisdictional claims in published maps and institutional affiliations.

