1. Introduction
Sea level fluctuations [
1,
2], hydrological dynamics and structural changes [
3,
4,
5] are among the factors that trigger transgression and regression events [
6,
7,
8] commonly recorded in coastal areas. In conjunction, these factors have an important impact on the evolution of a region’s environment through time. In the past few decades, several researchers have conducted studies using micro-paleontology [
9,
10,
11,
12,
13,
14], geomorphological [
15,
16], and geochemical (stable isotopes and trace elements) [
17,
18,
19,
20,
21,
22,
23] proxies with fruitful research results. However, most of these methods require complicated identification processes and professional skills, as well as expensive specialized instruments. Moreover, some indicators obtained through these proxies are not easily preserved to obtain continuous data because of the sedimentary environment [
24]; some geomorphological markers and/or sedimentary structures will be affected and even destroyed [
25]. Obviously, these factors will have a certain impact on the research results.
The question is, therefore, whether an index could be found that is relatively simple, fast, and does not require highly professional skills or complicated instruments to test for and reveal a transgression event. Considering the significant difference in the content of various soluble substances (such as various ions and compounds) between seawater and fresh water, the amount of various soluble substances attached to the sediments in the process of sediment deposition should also be variable. Consequently, the physicochemical properties of the lixivium of these sediments should also differ significantly (Sediment lixivium refers to the mixed liquid of water and sediment formed by soaking the pretreated sediment in solution). Based on this concept, we propose a multiparameter water quality meter for use in paleoenvironment research to measure the physicochemical properties of sediment lixivium and to reveal these transgression and regression events.
The multiparameter water quality meter is an inexpensive and easy-to-operate portable instrument. It can measure the physicochemical properties of water, such as total dissolved solids (TDS), salinity (SAL), and electrical conductivity (EC), with high precision (±1%). These properties are currently used mainly to study their changes in various forms of water, such as surface water and groundwater [
26,
27,
28,
29,
30,
31,
32]. Sylus [
31] discussed the impact of regional seawater intrusion on water quality through EC and TDS measurements of the coastal aquifers of the Gurpur and Netravathi river basins in the Dakshan Kannada district in India. Salmani [
32] studied TDS and the water flow of the Karoun River in southwest Iran, and proposed a model to predict the river flow and TDS changes. Yokoyama [
33] studied the sedimentary environment of Lake Biwa (Japan) through EC and discussed its relationship with sulphate ions and sulphates. In fact, EC is not only related to sulphate ions and sulphates but also to the solubility of electrolytes in water. Fang [
34,
35] used the EC of clay turbid water to study the sediments in the old, drowned valley plain of the Liaodong Peninsula (Northeast China), and reconstruct changes in the regional environment. In these studies, in addition to applying the physicochemical properties of water bodies to the study of surface water and groundwater quality [
31,
32], some attempts were made to apply such properties to the study of paleoenvironmental changes [
33,
34,
35]. However, the preparation and testing process of the sediment solution was not described in detail, sample spacing was large, and the resolution was not high. There is also a lack of research on the direct rebuilding of coastal environment change by TDS, which reflects the total amount of dissolved solids in water.
In view of the aforementioned discussion, we intended to introduce a multiparameter water quality meter to the field of paleocoastal environmental change research. Through preliminary experiments, we established an appropriate process for testing the physicochemical properties of sediment lixivium. According to the testing process, three physicochemical property indexes (TDS, SAL, and EC) of sediment lixivium of the Gangxi (GX) and Caoyankou (CYK) sections, located in the eastern margin of the Subei Basin, are determined. After comparing the test results of sediment lixivium with the indicators of diatoms and geochemical elements, we discuss the response of the physicochemical properties of sediment lixivium to changes in the sedimentary environment, as well as the feasibility of using these properties to reflect changes in coastal environment.
2. Regional Setting
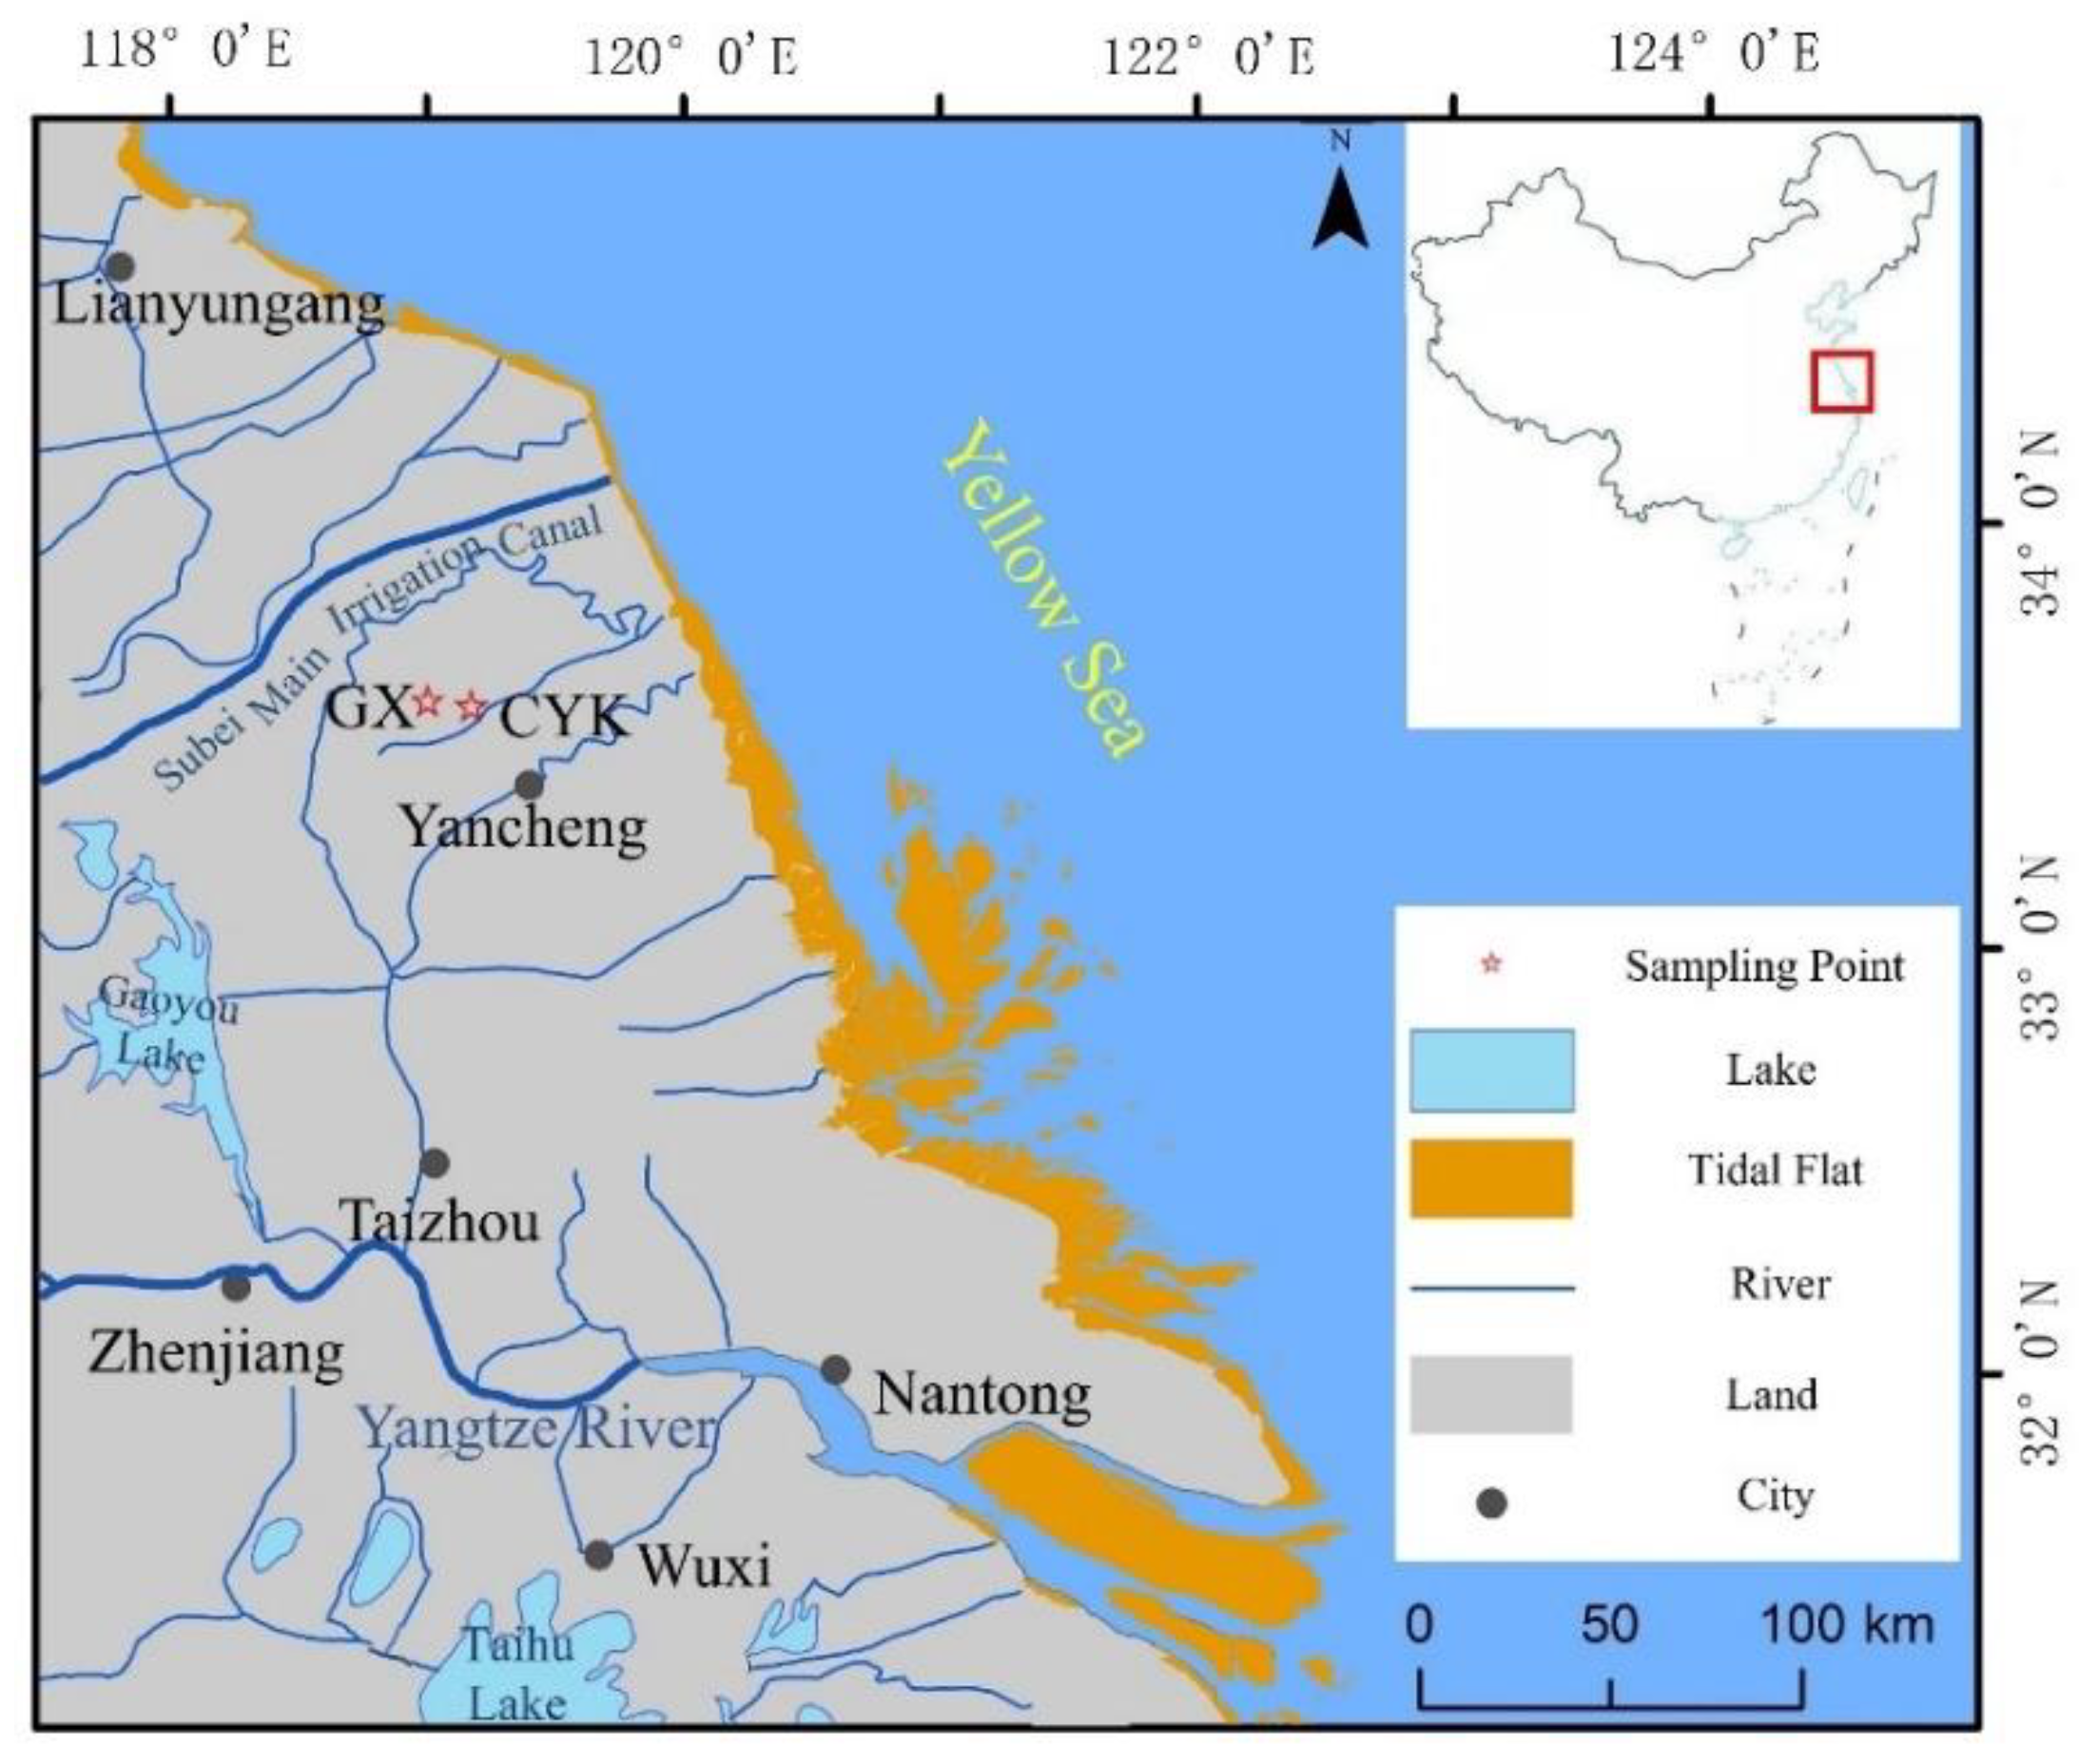
The Subei Basin is located on the eastern coast of China in northeastern Jiangsu Province. It is the onshore part of the Subei–South Yellow Sea Basin, including the Lixiahe Plain and the coastal plain (
Figure 1). The Subei Basin is a large-scale composite sedimentary basin formed during the Late Mesozoic on the basis of the Yangtze Block [
36]. This basin is a key zone connecting the ocean and land, with significant interaction between sea and land. The sediments in the Subei Basin comprise deposits left by the cross action of rivers, lakes, and seas. After long-term deposition, the overall terrain of the Subei Basin is low and flat, slightly higher in the southwest region and lower in the northeast. The Lixiahe area has the lowest depression in the entire Subei Basin; the altitude of the center is less than 2 m. There are dense river networks, developed water systems, and numerous lakes in Subei Basin. The Huaihe and Yihe rivers and other water systems run through the Subei Basin and flow into the Yellow Sea in the east. Lakes of various sizes, such as Hongze, Gaoyou, and Dazong are distributed among these water systems, forming lake groups.
The Subei Basin is located at mid-latitudes between 32° and 34° north latitude. It has a subtropical humid monsoon climate, an average annual temperature of 13.4 °C, with the temperature gradually increasing from the northeast to the southwest. The average annual precipitation is 1000 mm, with more precipitation in the east than in the west and more in the south than in the north; the annual sunshine hours are 2130–2430 h, with the highest in summer and the lowest in winter. The factors that influence the atmospheric circulation in the study area are the same as those in the eastern coastal areas of China, i.e., monsoon circulation. In winter, the northerly wind from the interior of the high-latitude continent prevails and the climate is cold and dry, whereas in summer, the southerly wind from the low-latitude Pacific Ocean prevails and the climate is hot and humid.
3. Material and Methods
3.1. Sedimentary Profile and Sampling
The research materials were obtained from the GX (33°30′56.907″ N, 119°54′00.662″ E) and CYK (33°35′04.776″ N, 119°57′49.279″ E) sections in the northeast of Jianhu County (
Figure 1). In this section, we will describe the lithology of the sediments in detail; we collected samples from the bottom to the top at a spacing of 2 cm. We collected 250 and 360 samples from the GX and CYK profiles, respectively.
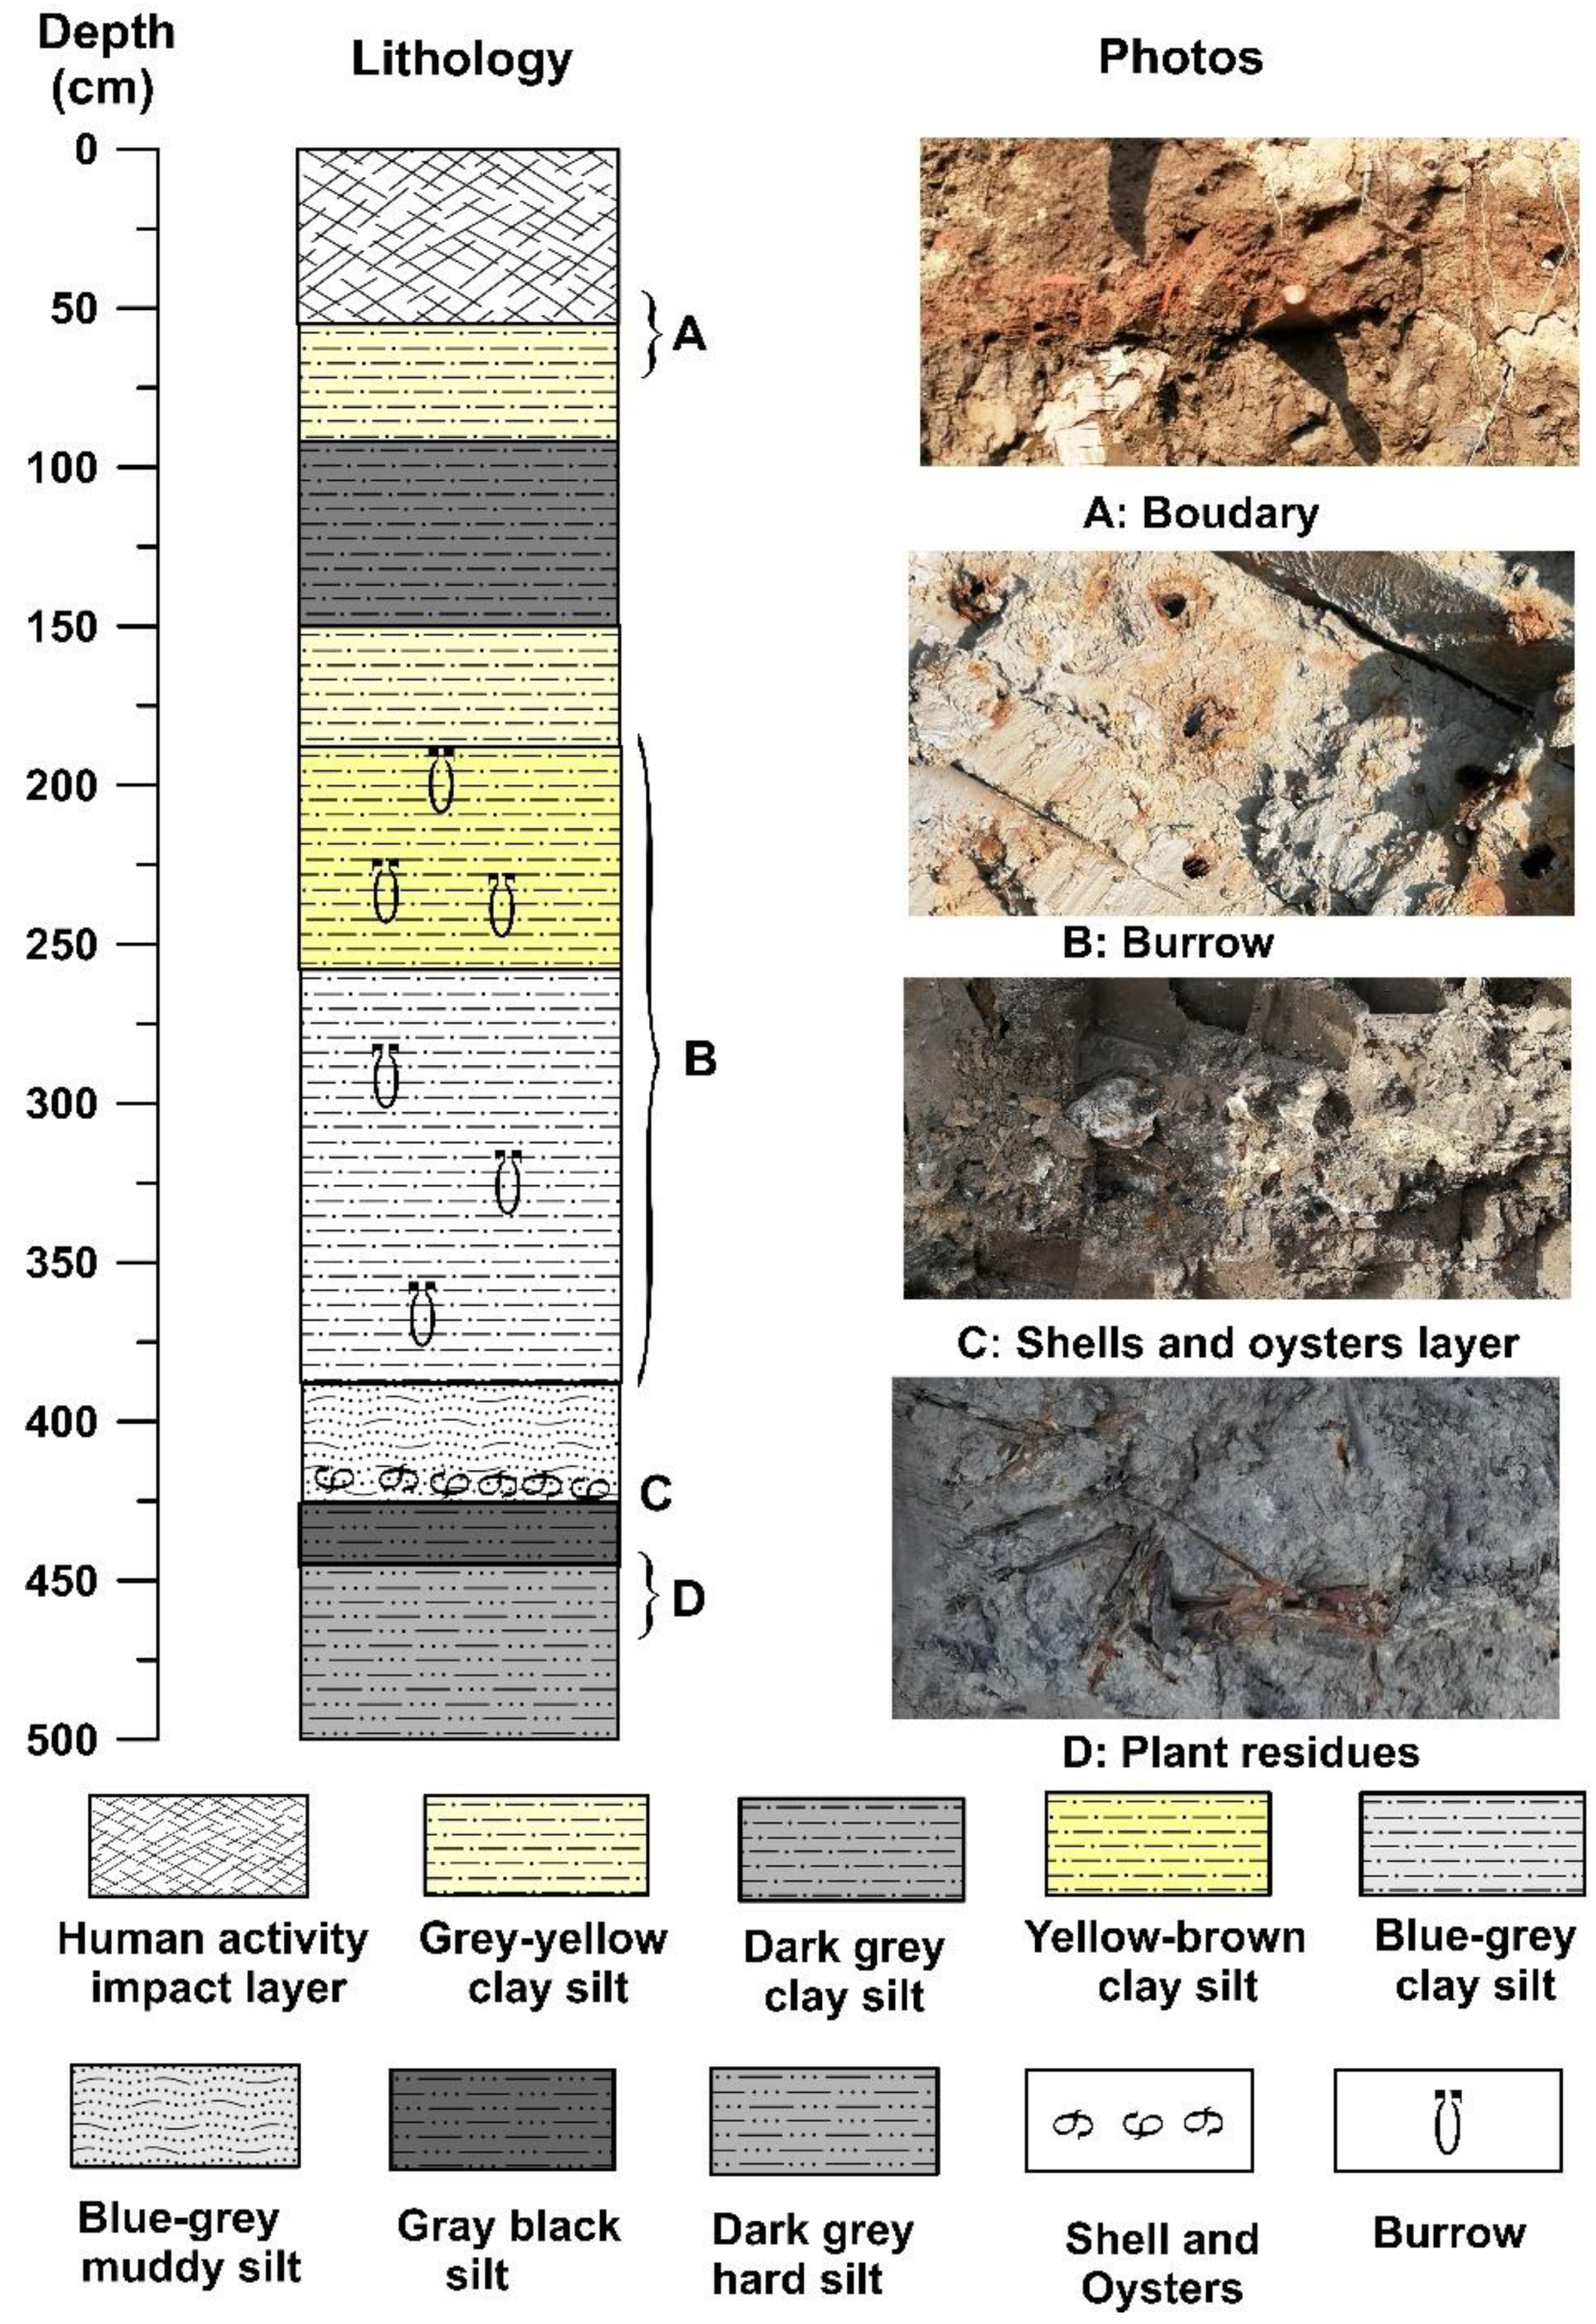
The depth of the GX section is approximately 5 m, and the altitude is between 0.5 m and −4.5 m. The sediment composition characteristics of the entire section change significantly from bottom to top. The section between 500 and 446 cm depth comprises dark-grey compact clay silt, with tubular plant residues (reeds) preserved in the sediment. At depths of 446–426 cm, the sediment is mainly grey-black silty clay. At depths of 426–150 cm, clay silt of various colors with horizontal bedding and vein bedding, or interbedding of clay silt and silty fine sand, with the sediments containing calcified burrows and marine shell fragments. The bottom of this layer (426 cm depth) comprises a large number of shells and oysters. At 150–55 cm, the lithology of sediment is mainly dark-grey to greyish yellow compact clay silt with a large number of iron manganese nodules. From 55 cm to 0 cm, the sediment is disorderly and has no obvious natural sequence, which is the disturbance layer resulting from human activities (
Figure 2).
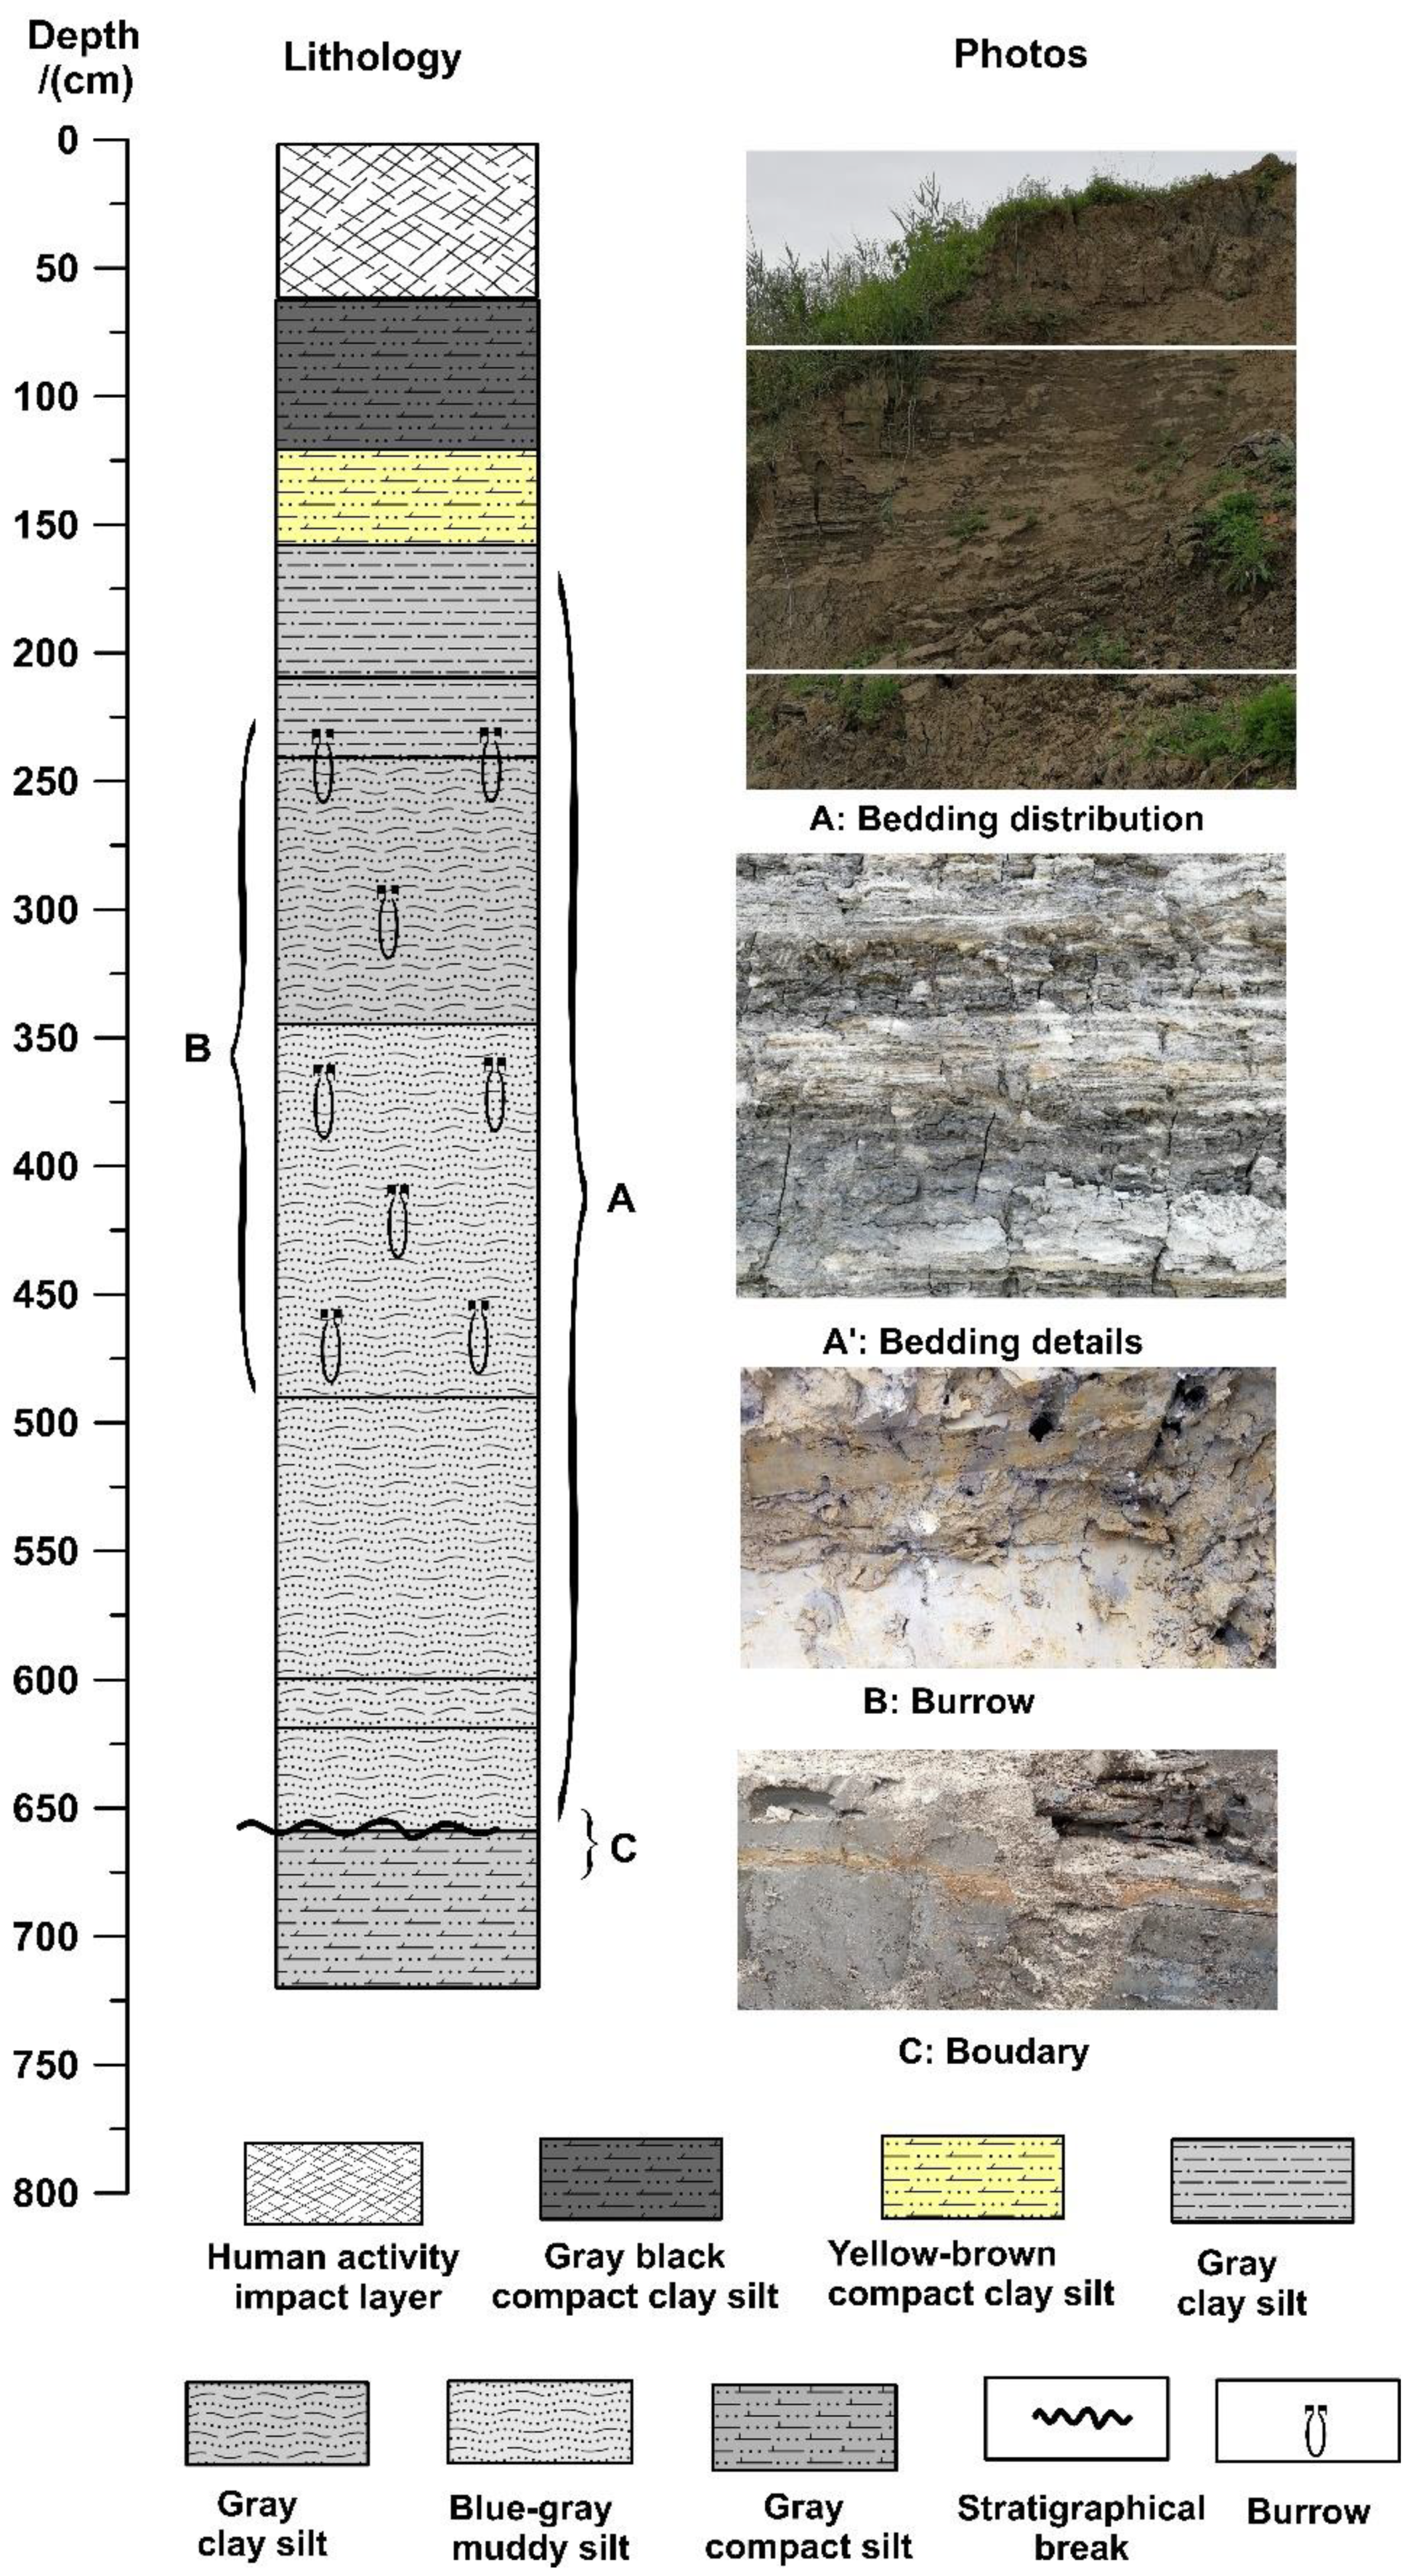
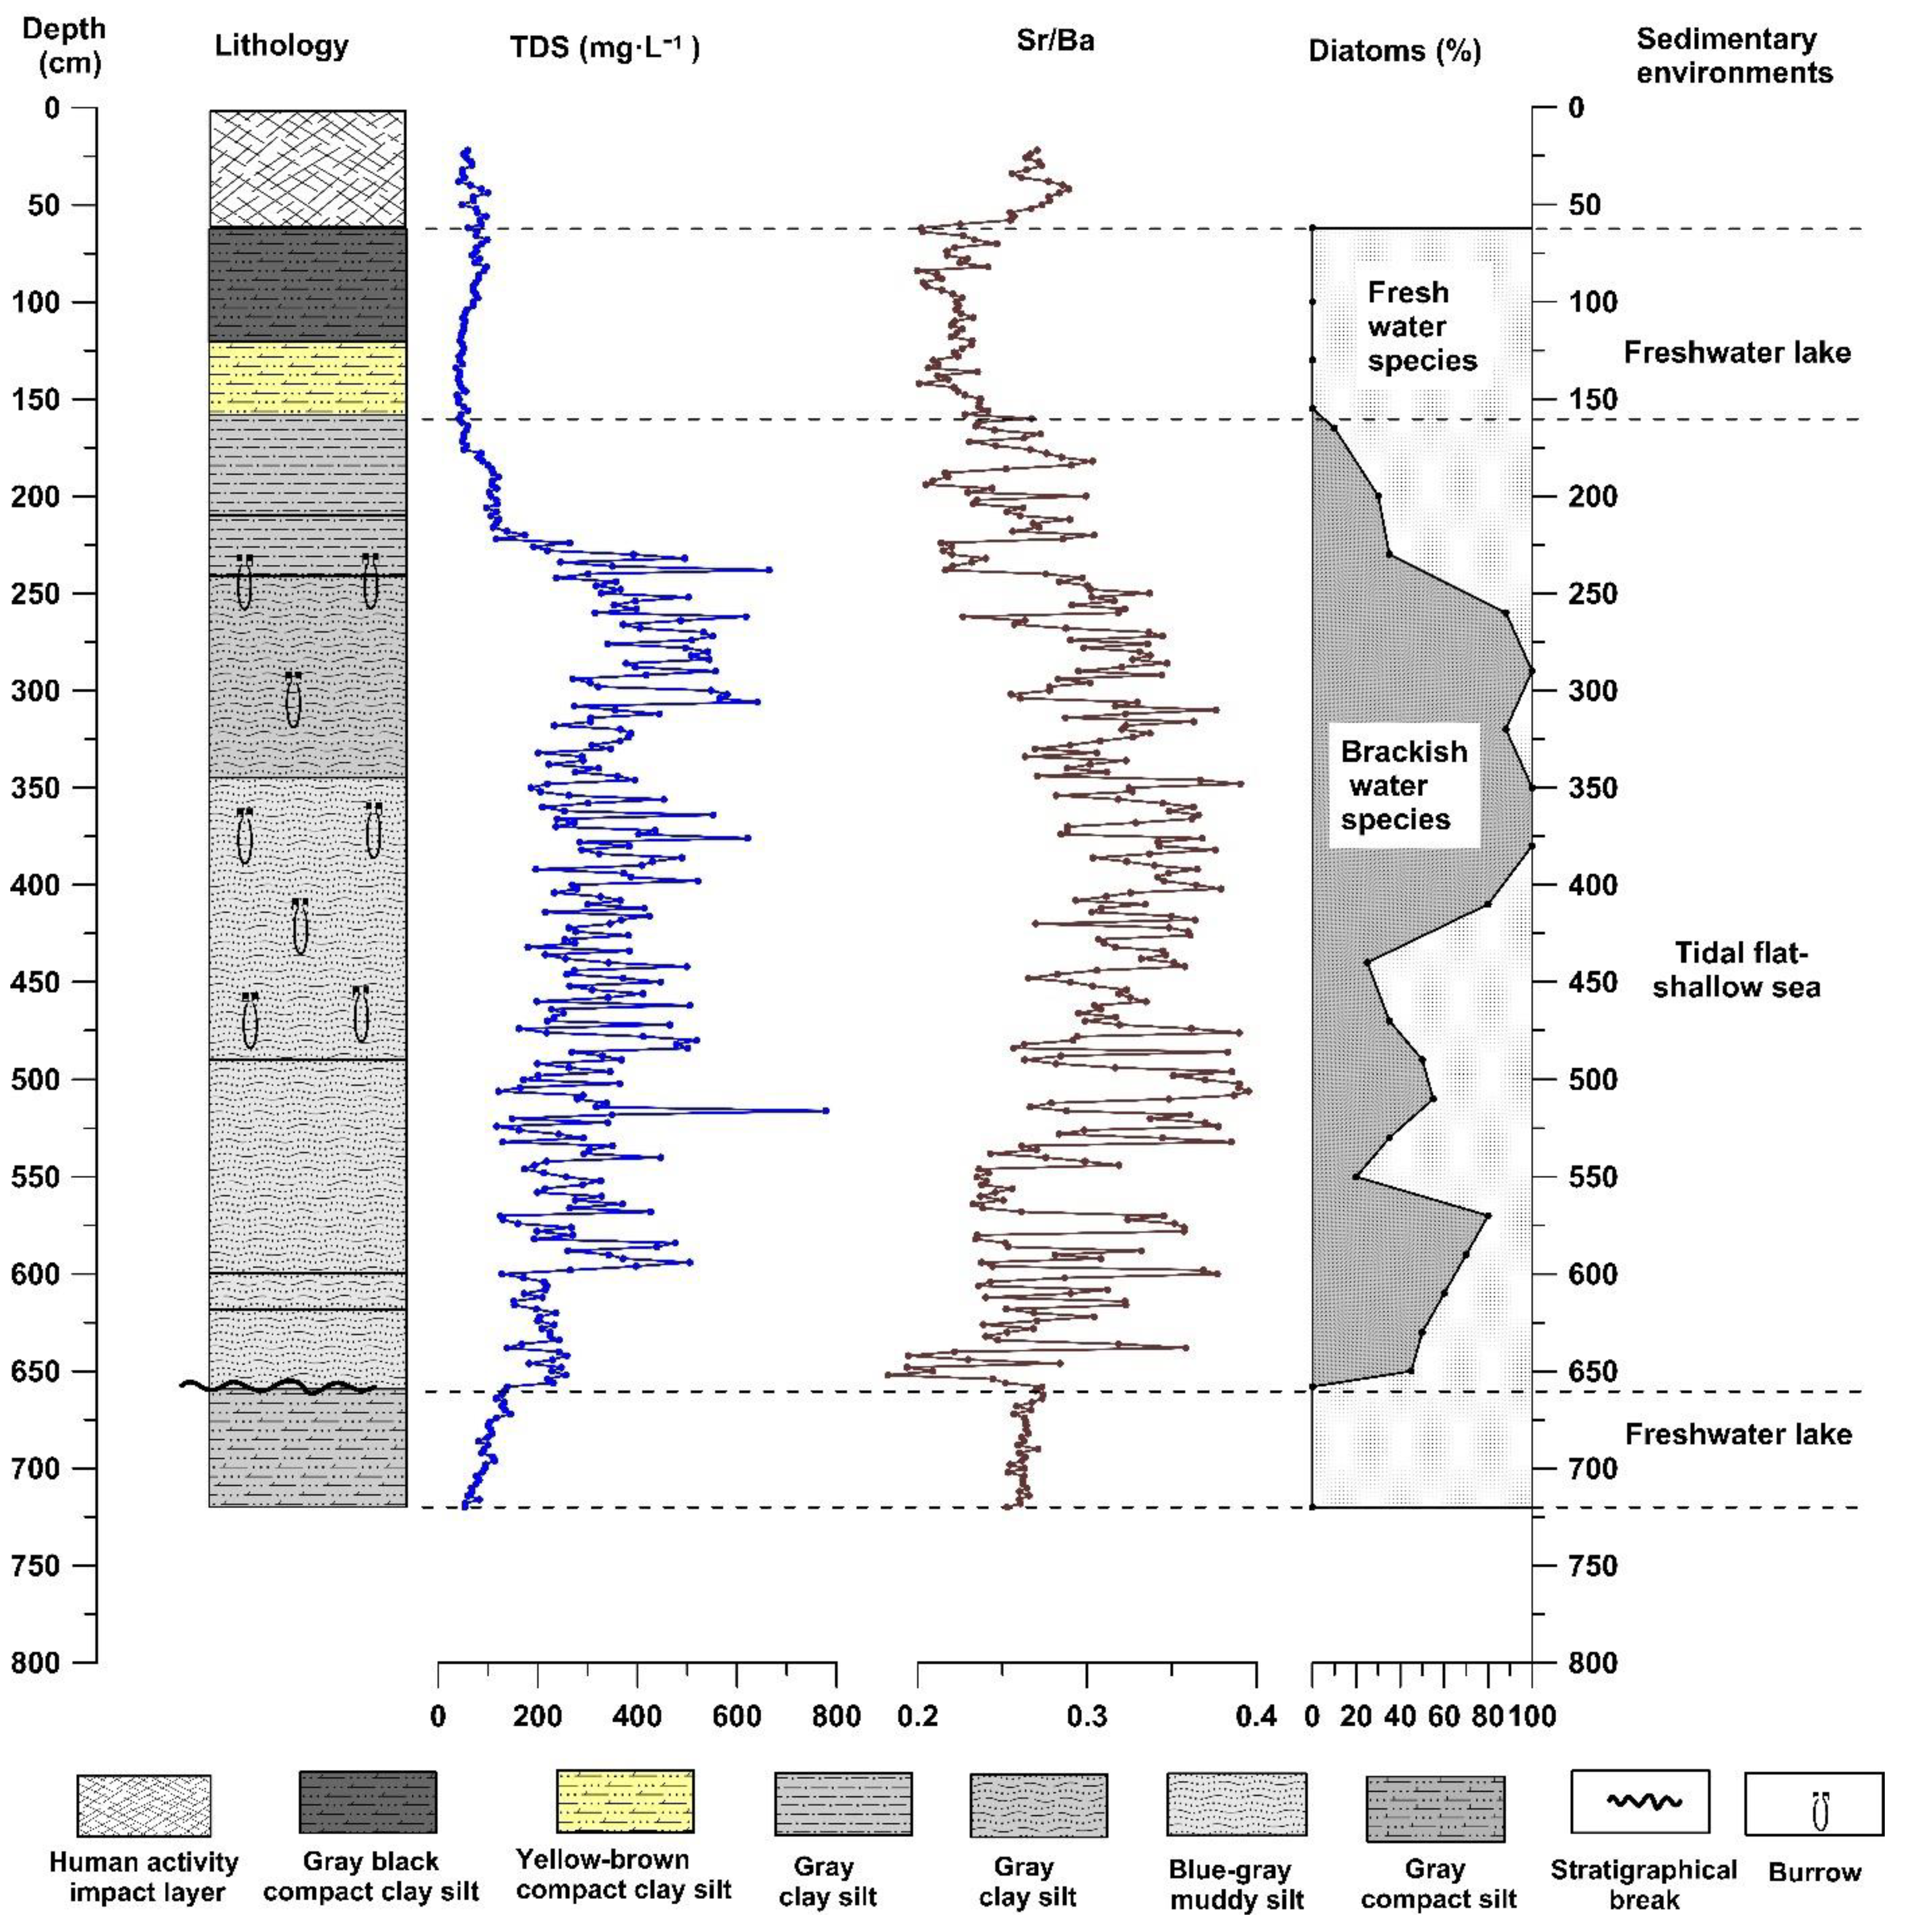
The depth of the CYK profile is approximately 7.2 m, and the altitude is between 1.92 and −5.28 m. The sediment composition of the profile changes significantly from bottom to top. At depths 720–658 cm, the sediment is grey compact clay silt with obvious sedimentary discontinuities at 658 cm. At depths of 658–345 cm, it is mainly grey to blue-grey mud silt with silt lamina. Grey mud silt with burrows is found at a depth of 345–240 cm. At depths of 240–210 cm, the sediment is mainly grey clay silt with burrows. At depths of 210–158 cm, there is grey clay silt with white silt lamina between the layers. At depths of 158–120 cm, the sediment is mainly yellow-brown compact clay silt with rust spots. Between the depths of 120 cm and 62 cm, the sediment is mainly dark-grey to grey-black clay silt, with the color gradually darkening upward. At depths of 62–0 cm, the sediment is mainly grey-yellow clay silt, the layer obviously affected by human activities (
Figure 3).
3.2. Experimental Methods for Physicochemical Properties of Sediment Lixiviums
No systematic study has been conducted on the physicochemical properties (TDS, SAL, EC) of sediment lixiviums. Therefore, to obtain relevant stable data, we conducted several preliminary tests to determine the appropriate process and optimal test time for measurements (the detailed experimental process was shown in part 4). Subsequently, we obtained the physicochemical property indexes for the two profiles.
3.3. Geochemical Element (Sr, Sr/Ba) Analysis Method
The sediment sample was first dried at low temperature, after which approximately 10 g was weighed, ground into a powder using an agate mortar, and passed through a 200-mesh fine sieve. Finally, the samples were pressed into pellets using the boric acid pressing method [
37] under high pressure. After completing sample preparation, the samples were instrument tested. The geochemical element content was assessed using an X-ray fluorescence spectrometer (PANalytical Co., Almelo, The Netherlands) at the Key Laboratory of Environmental Evolution and Ecological Construction of Jiangsu Province, School of Geography, Nanjing Normal University. The measurement error of the instrument was less than 5%.
3.4. Diatom Analysis Method
We selected 26 and 25 samples for diatom identification from the GX and CYK sections, respectively. Before identification, the sediments were pre-treated with hydrochloric acid and hydrogen peroxide. Subsequently, the samples were made into slices for observation under a microscope [
38].
4. Test Process of Physicochemical Properties of Sediment Lixivium
Choice of solvent: Water is the most commonly used solvent; moreover, distilled, deionized, purified, or ultrapure water is used often as a solvent in experiments. The physicochemical properties of the different types of water obviously differ. As regards distilled water, because of process differences, the lower the number of distillations, the greater the TDS of the water; the TDS will be close to zero after multiple distillations. Deionized water uses an anion/cation exchange resin to remove the anions/cations in the water; the TDS of the water can be reduced to less than 20 mg·L−1. Pure water contains a certain amount of dissolved solids, and the TDS is usually between 0 and 50 mg·L−1. Ultrapure water removes the conductive medium in the water almost completely and removes or reduces the non-dissociated colloidal substances and organic substances in the water to an extremely low level; the TDS test result is zero. Accordingly, aiming to minimize the influence of the solvent on the test results, we selected ultrapure water as solvent to prepare the sediment lixivium.
Preparation of sediment samples: Sediment shows differences in water content, particle size, cementation degree, and the like, because of the influence of the sedimentary environment, sediment source, compaction, and other factors. We intended to eliminate the influence of the precipitation rate of the attached substances on the sediment in the solvent, which is caused by the difference in the water content and the degree of cementation of the sediment. To achieve this, we uniformly dried the samples at a low and constant temperature. Subsequently, we ground them into powder and passed them through 200 mesh sieves. The experimental samples prepared in this manner could precipitate the attached soluble substances more quickly after being dissolved in the solvent.
Choice of container: Open containers are not suitable for storage during the experiment, as the sediment powder has to remain in the container for an extended time after dissolving. The solvent will evaporate and reduce, leading to a large error in the measured results. To minimize the error, a container with a lid should be chosen for the production of the sediment lixivium and the container should be covered to prevent or reduce evaporation.
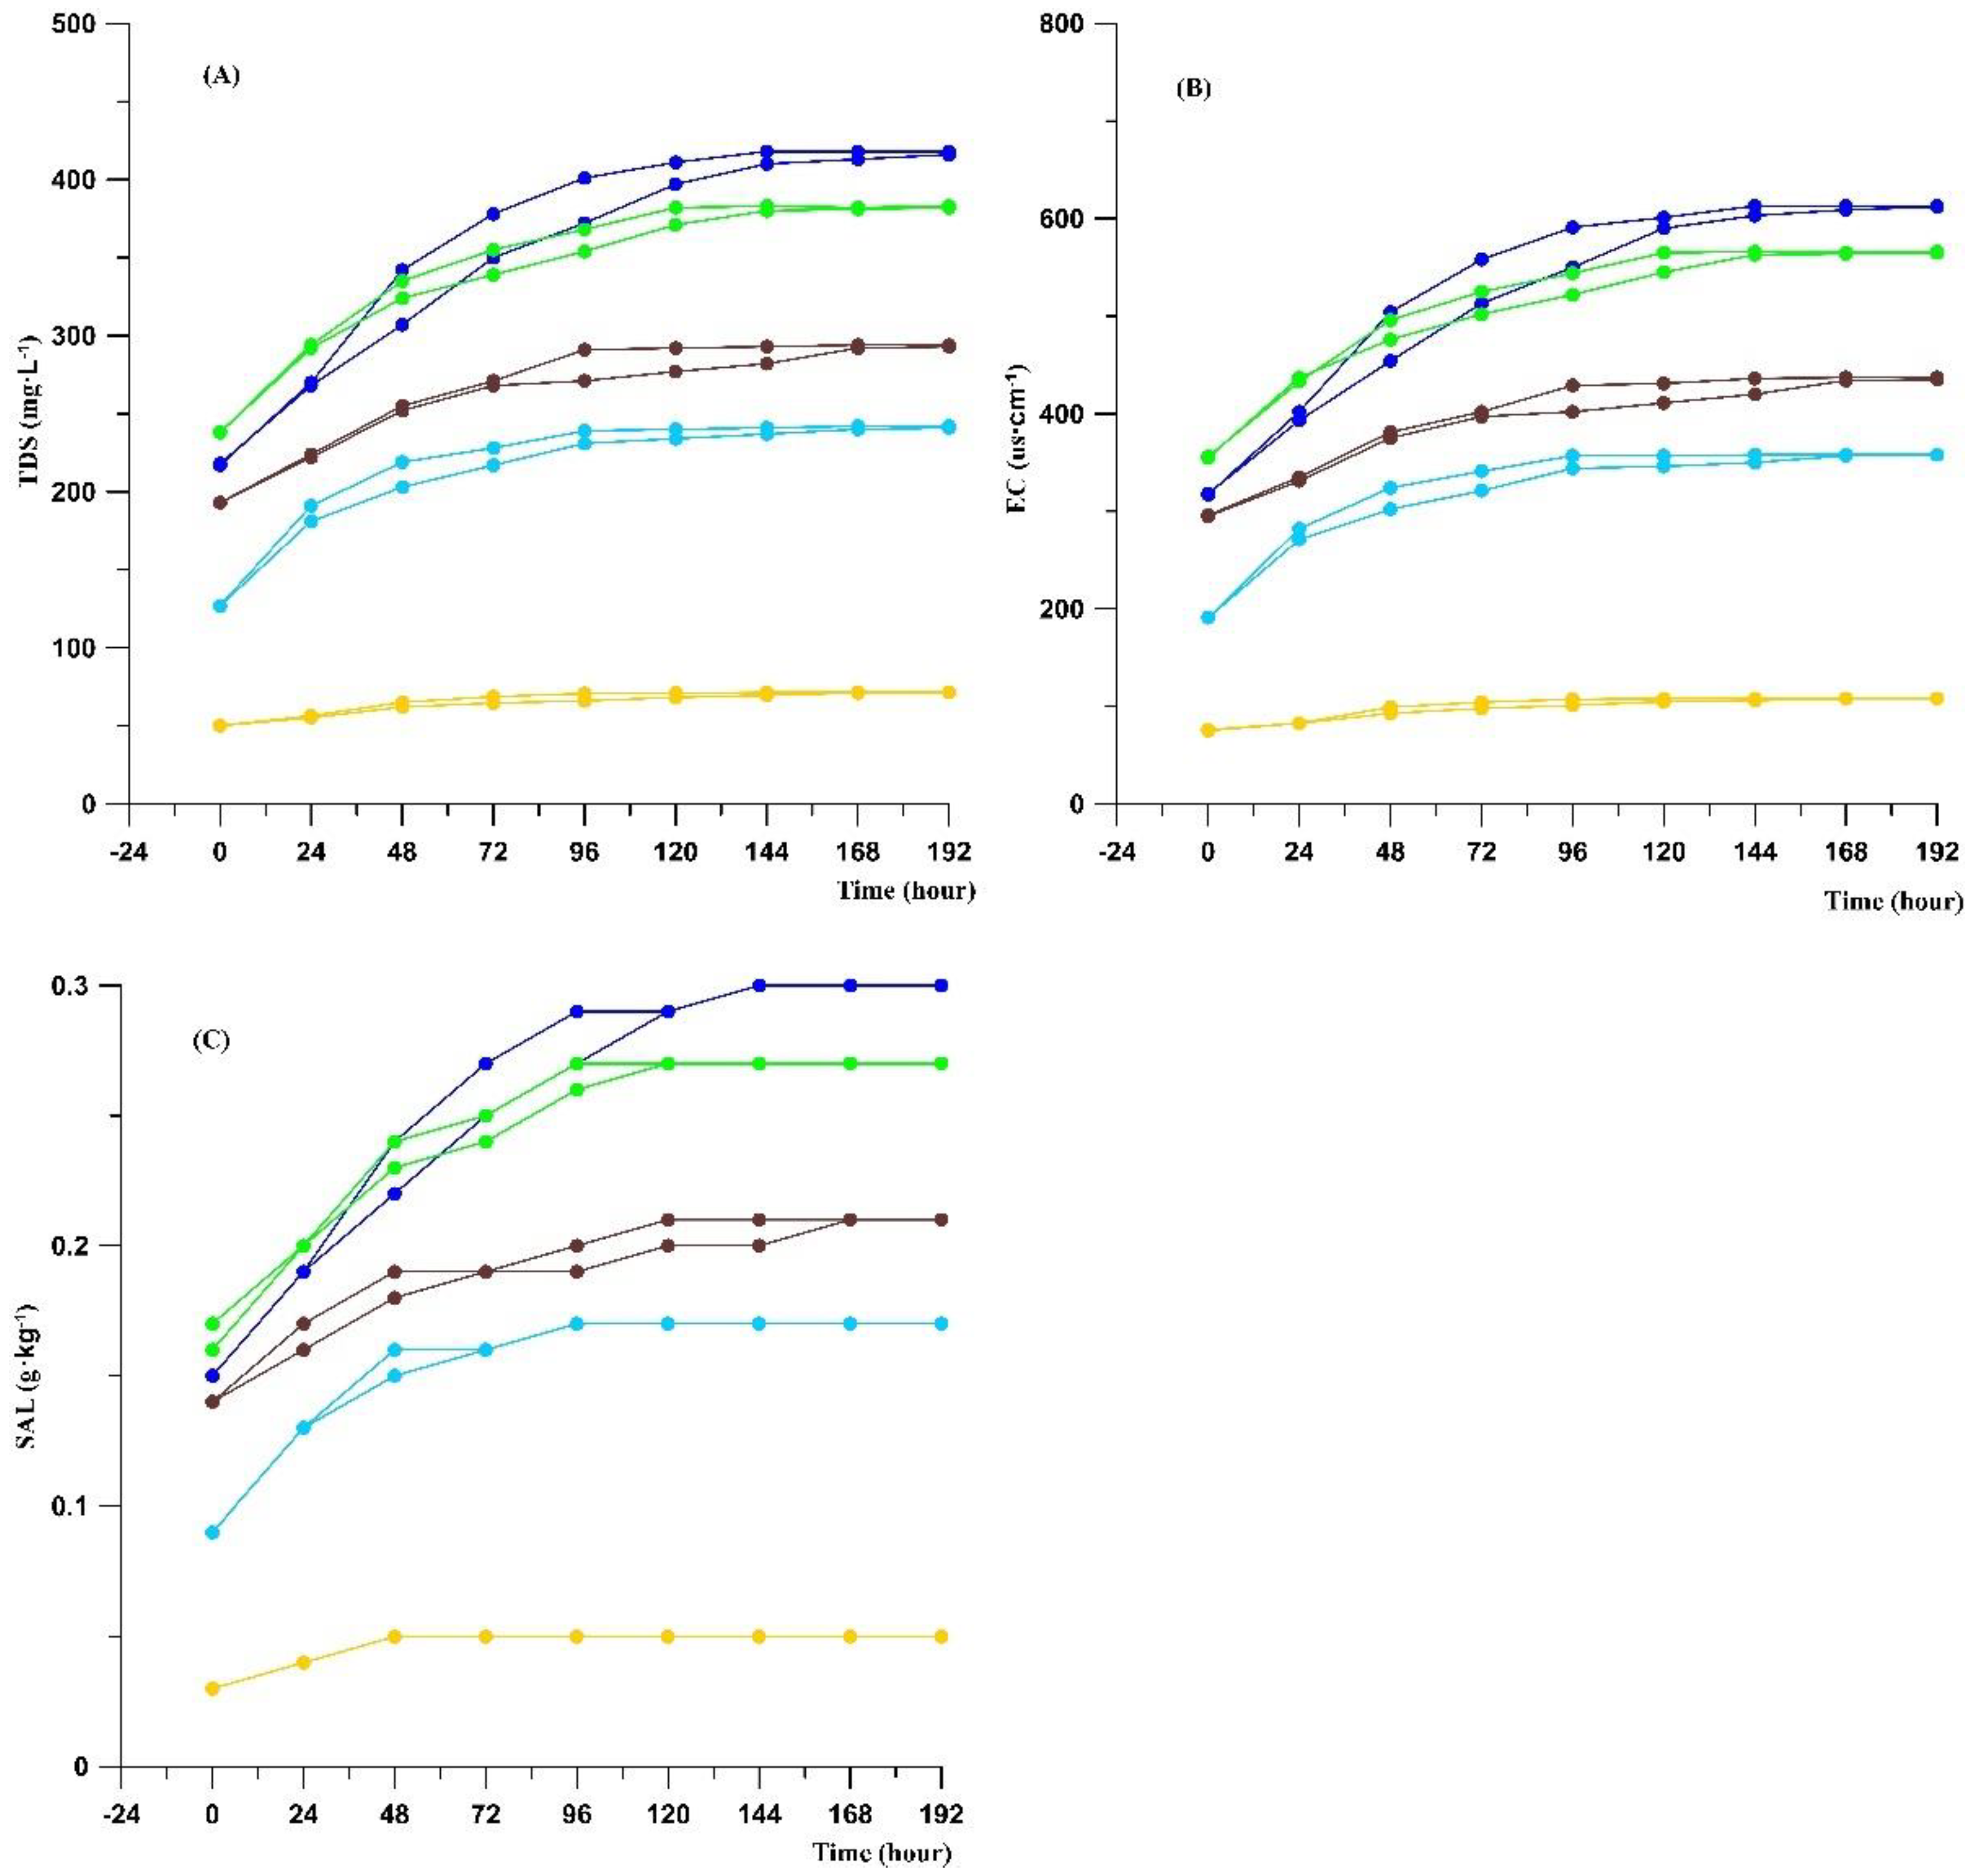
Preparation of sediment lixivium and determination of the test time: For comparison, the weight of the sample taken from the same section and the volume of added ultrapure water should be the same. We weighed 5 g of dried and ground sample with an electronic balance, placed it in a 150 mL container with a cover, added ultrapure water (100 mL), and stirred the mixture using a glass rod. Subsequently, we measured the physicochemical properties. After covering the container tightly and letting it stand for 24 h, we measured the physicochemical properties again, and then used a glass rod to fully stir the mixture again. This process was repeated six times. We discovered that the physicochemical properties tended to be stable (
Figure 4). To determine whether stirring the sediment lixivium every day is conducive to accelerating the dissolution of substances, we set up a reference group for comparative experiments. The samples in the reference group were stirred fully during the preparation but were not stirred again afterward. These samples were also measured every 24 h. After seven tests, the results tended to be stable (
Figure 2). Based on the test results, we concluded that if the sediment lixivium were stirred fully every day, the best test time should be 120 h. However, if the sediment lixivium were fully stirred only when it was prepared and then left unstirred, the best test time should be 168 h. The test instrument was a multiparameter water quality meter (model SX751; Shanghai Sanxin Instrument Factory, Shanghai, China). During the test, the probe of the instrument was immersed completely in the upper clarified solution of sediment lixiviums, and each index was measured three times, after which the average value was calculated.
5. Results
5.1. Variation Characteristics in Physicochemical Properties of Sediment Lixivium
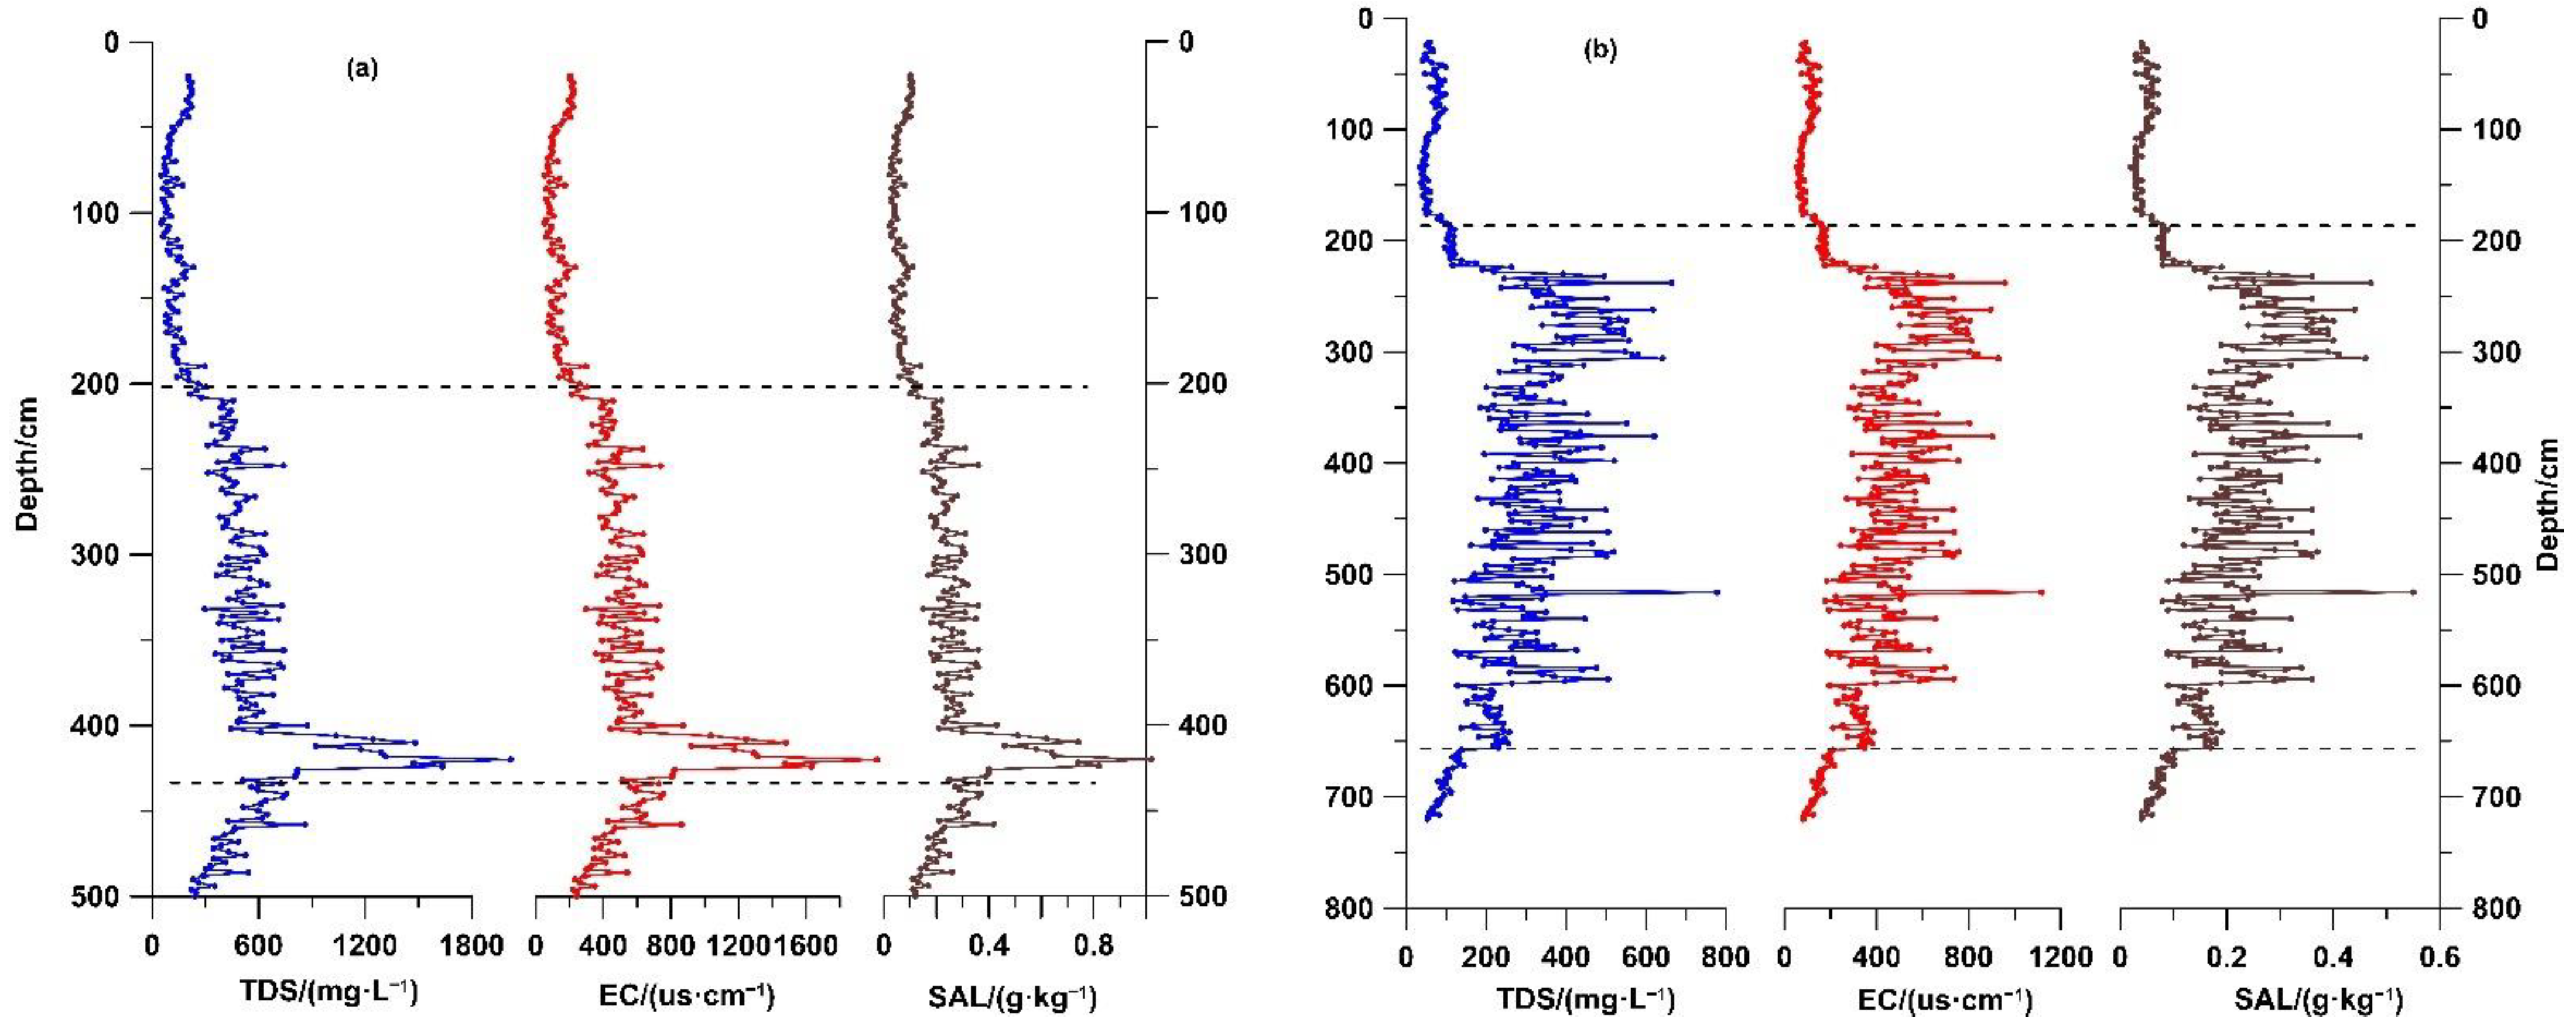
The three physicochemical property indexes TDS, EC, and SAL were measured in sediment lixiviums of the GX and CYK sections, with all showing obvious changes (
Figure 5,
Table 1). The changes in the three indices indicated that both the GX and CYK profiles could be divided into three stages. In stage I, the three indices TDS, EC, and SAL were all in the low-value stage and showed a gradual increasing trend. In stage II, the three indices all showed high values, and there were certain fluctuations in the CYK section. In stage III, the three indexes all showed low values. In addition,
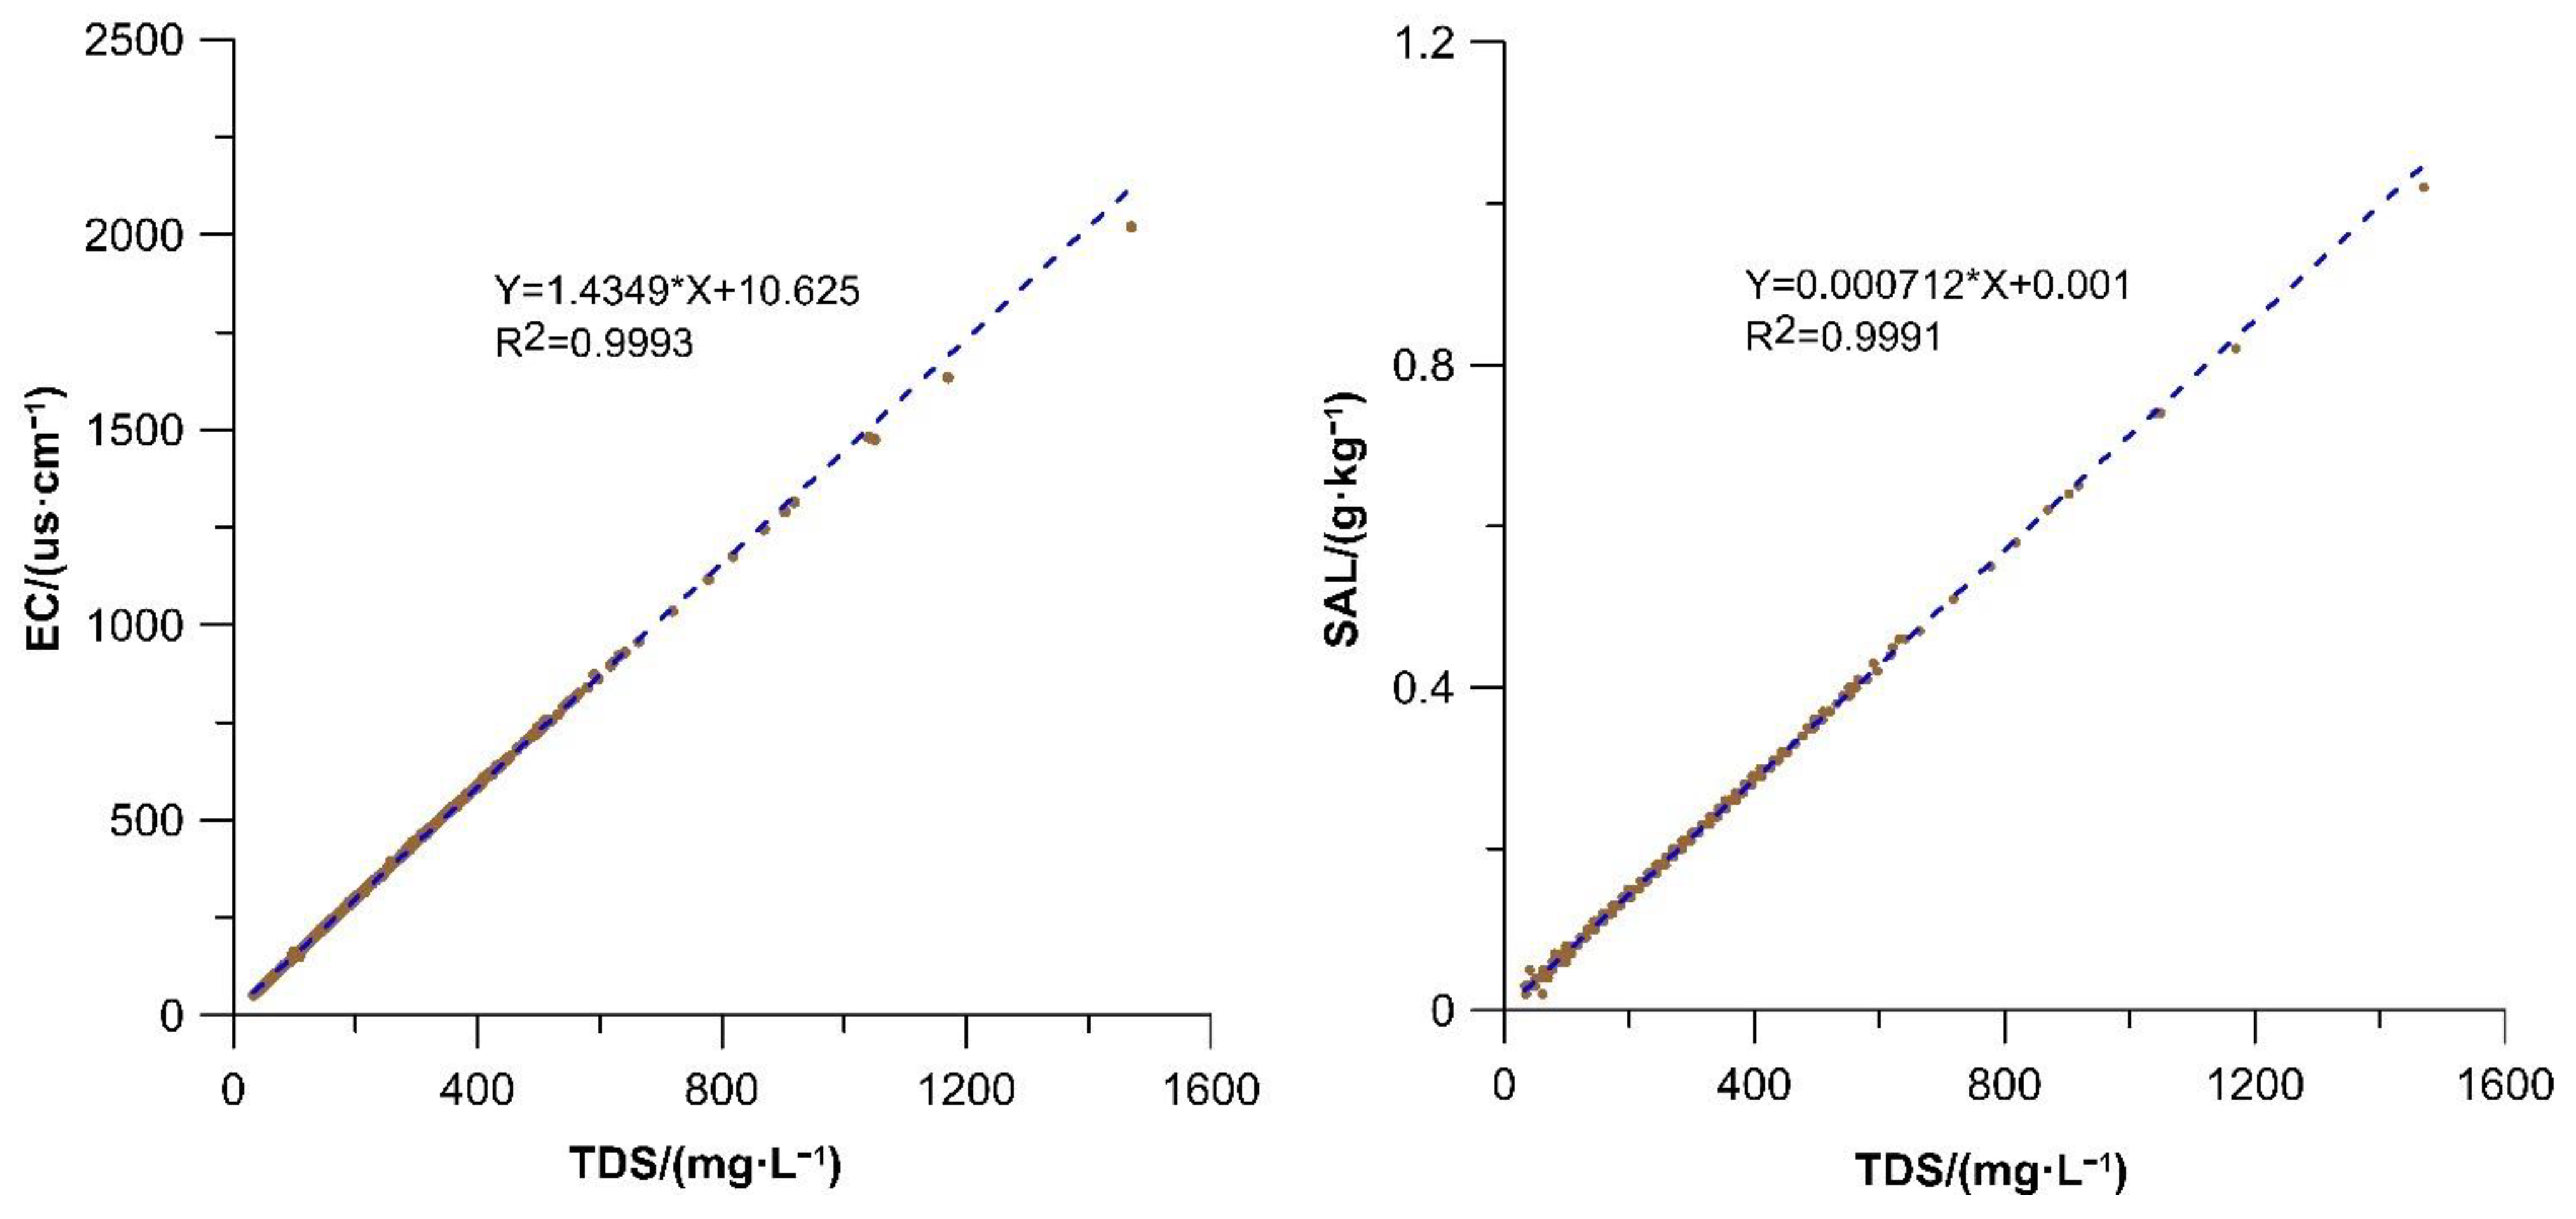
Figure 5 shows extremely good consistency among the TDS, EC, and SAL, with the calculated correlations between TDS and EC, and TDS and SAL all being close to 1 (
Figure 6).
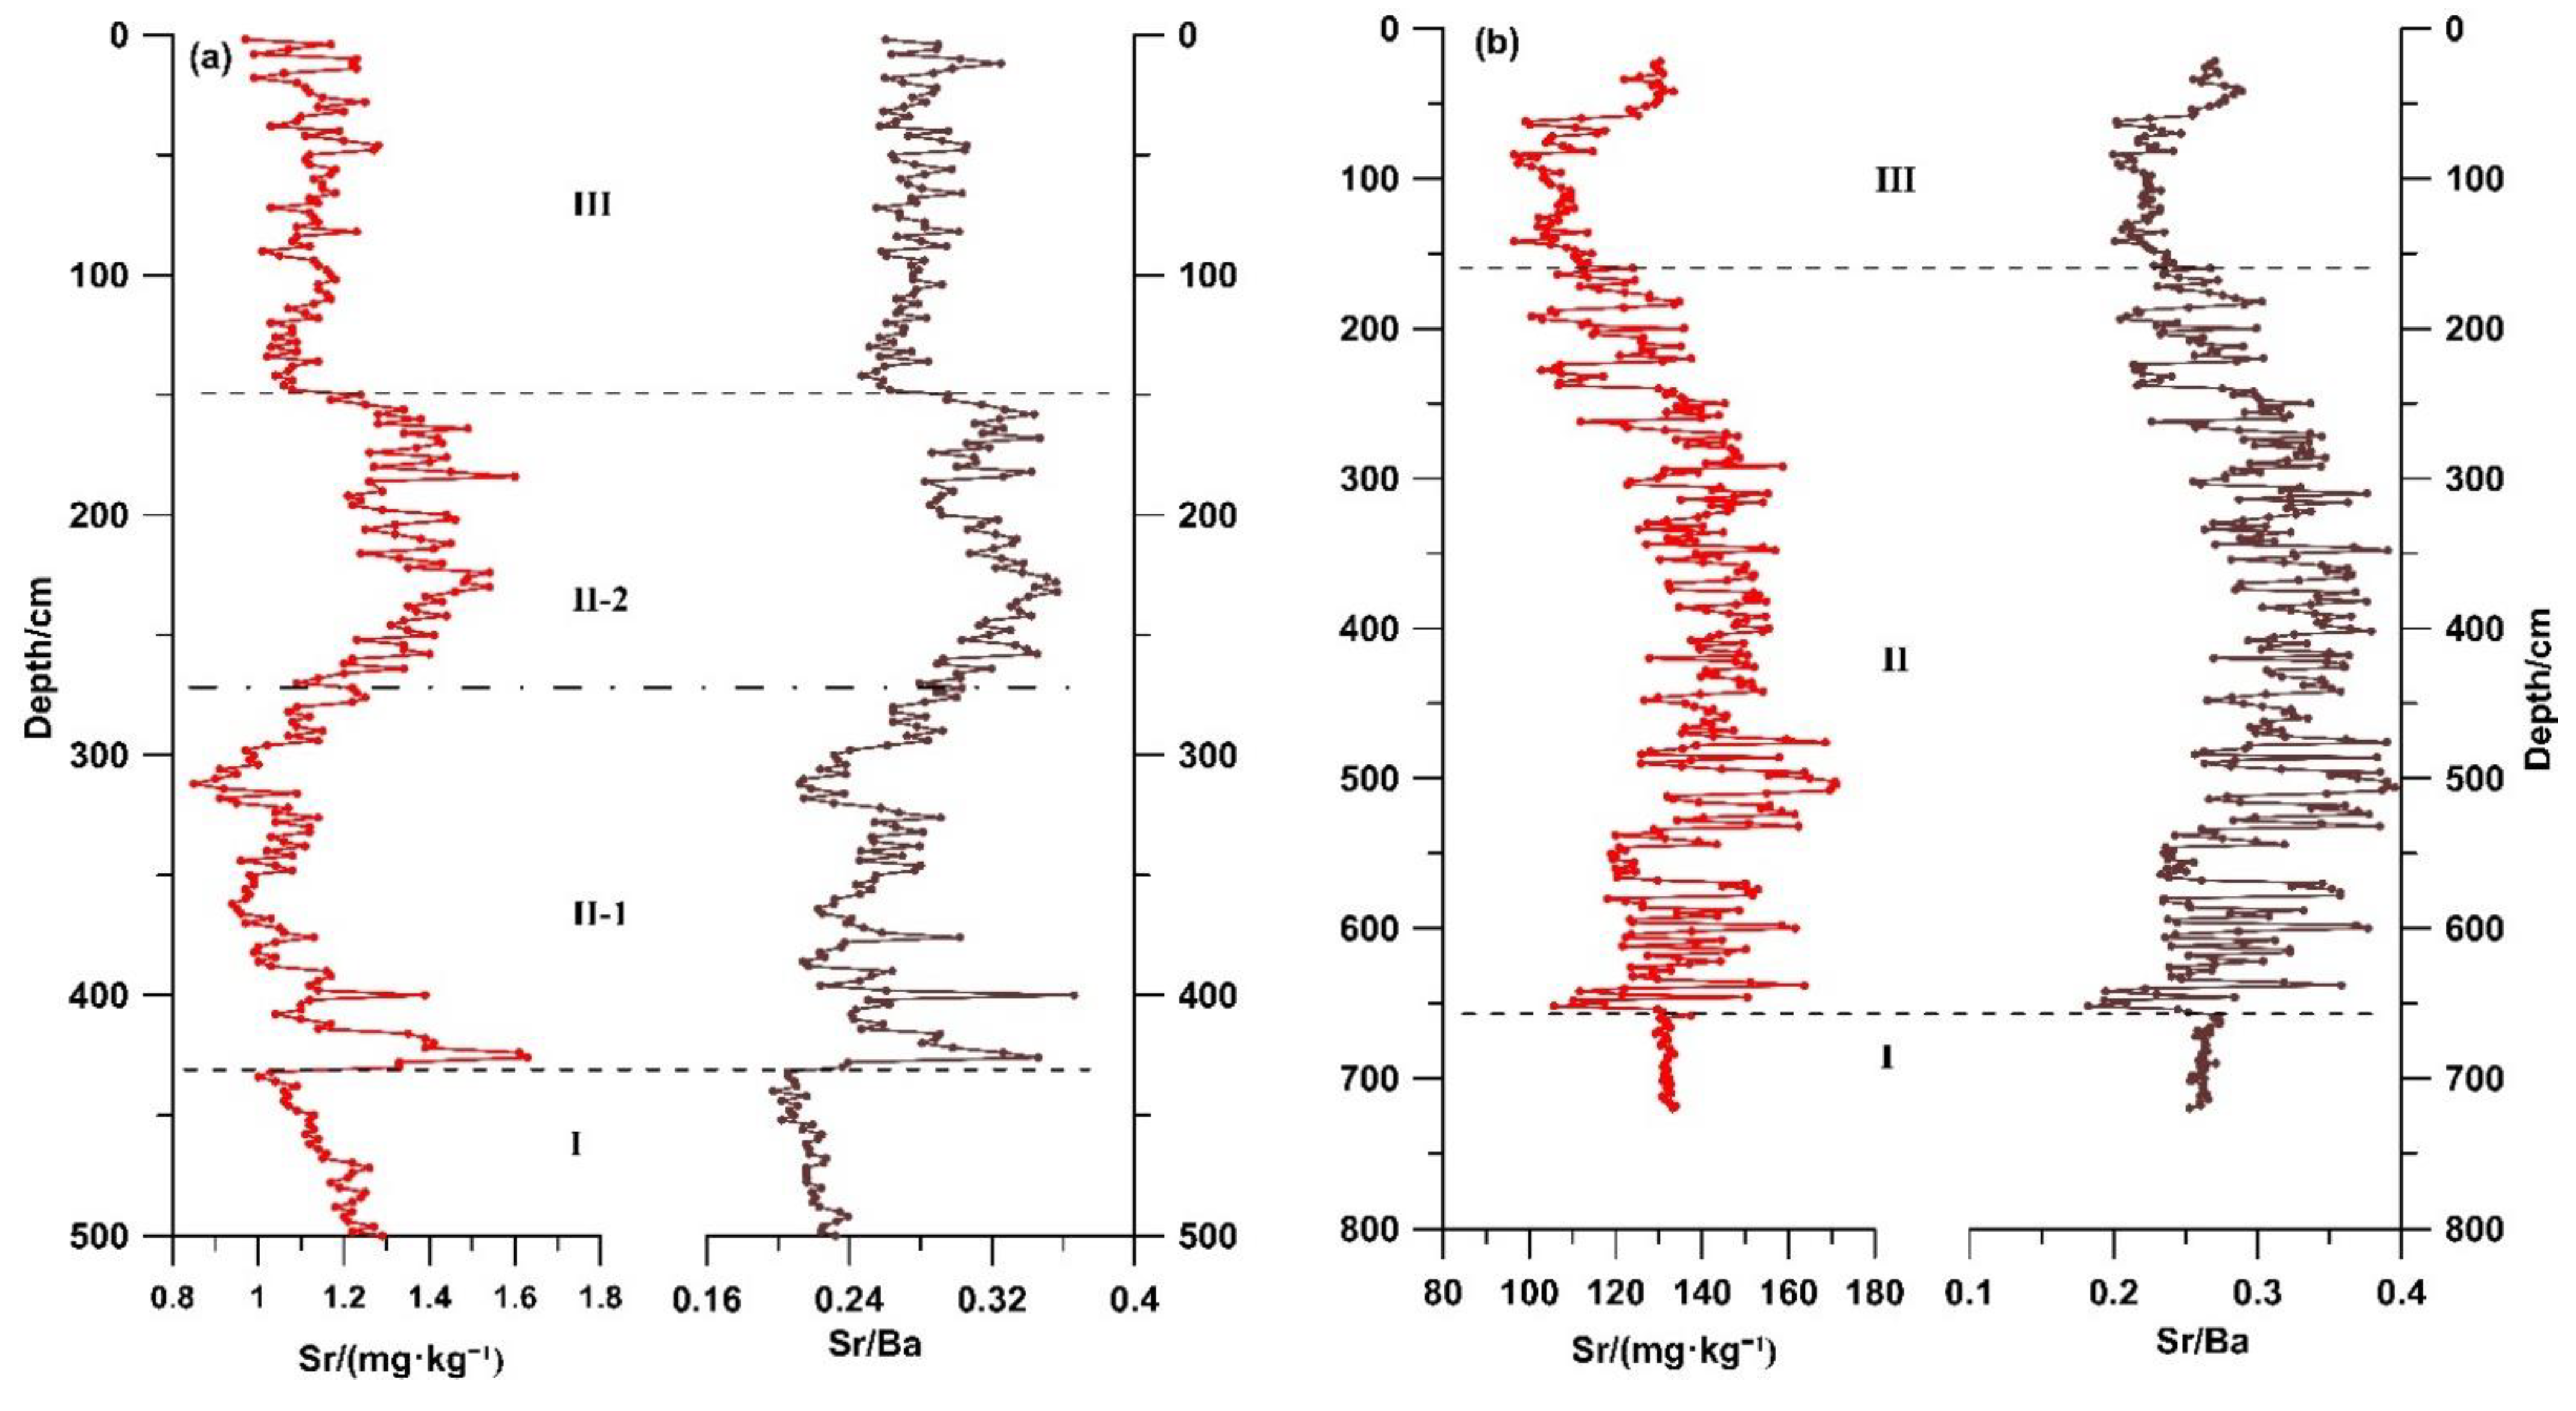
5.2. Variation Characteristics of Geochemical Elements Sr and Sr/Ba Ratio
The Sr/Ba ratios are also often used to indicate the changes in salinity and distinguish continental and marine sedimentary environments [
39,
40,
41,
42,
43]. Sr and Sr/Ba ratios were selected for geochemical analysis (
Figure 7,
Table 2). The changes in Sr and Sr/Ba indicated that both the GX and CYK profiles could be divided into three stages. In stage I, the Sr and Sr/Ba ratios were low with small fluctuations. In stage II, the Sr and Sr/Ba ratios were high, with obvious fluctuations, and in stage III, the Sr and Sr/Ba ratios became low again with small fluctuations.
In addition, in stage II of the GX profile, it could be divided into two sub stages according to the changes of Sr and Sr/Ba. In stage II-1, Sr and Sr/Ba increased rapidly and then decreased, and the overall values were low (average values: 119.98 mg∙kg−1 and 0.26, respectively); in stage II -2, Sr and Sr/Ba were overall high values (average values: 141.17 mg∙kg−1 and 0.32, respectively) with small fluctuations.
5.3. Variation Characteristics of Freshwater–Saltwater Diatom Proportion
The diatom fossils of 26 and 25 samples were identified from GX and CYK profiles, respectively, and a total of 34 species of diatoms were identified. Among these were eight freshwater and 26 brackish water diatom species. The changes in the combination of diatom species indicated that the GX and CYK profiles could be divided into multiple diatom distribution zones from bottom to top (
Figure 8 and
Figure 9). The distribution zones reflected a freshwater sedimentary environment, tidal flat–shallow sea sedimentary environment, and freshwater sedimentary environment, respectively.
6. Discussion
6.1. Reasons for Changes in Physicochemical Properties of Sediment Lixivium in Coastal Areas
The physicochemical properties of water reflect the amount of TDS, size of EC, and level of SAL in the water. TDS in the water was significantly correlated positively with EC and SAL (
Figure 6). The physicochemical properties were related mainly to the amounts of soluble substances attached (or adsorbed) by the sediment itself. When sediments are deposited, the concentration of TDS in the water will differ when the sedimentation environment differs (i.e., fresh water and salt water). These soluble substances can change the total amount of TDS attached to the sediments through adsorption (precipitation), precipitation (dissolution), ion exchange, and other methods. When the amount of TDS in the water is high, the amount of TDS attached to the sediments is also large, and vice versa. When the dried and ground sediment powder was dissolved in a sufficient amount of ultrapure water, the soluble solids attached to the sediment were released because of the extremely low TDS concentration in the ultrapure water, thereby increasing the amount of TDS in the solution. The larger the amount of TDS in the water of the original sedimentary environment, the larger would be the amount of TDS released into the ultrapure water, and vice versa. Therefore, the water environment of sediment deposition can be reconstructed according to the dissolved TDS (EC, SAL) in the ultrapure water.
6.2. Physicochemical Properties Index of Sediment Lixivium: A New Index Reflecting the Changes of Coastal Environment
Different sedimentary characteristics can be formed because of the differences in the dynamic conditions and the biological species living in the environment, as well as climate changes and sources of sediment. Therefore, sedimentary characteristics can also be used to invert the sedimentary environment. The distribution of diatom species in the sediments is controlled by environmental variables in the area, such as water temperature, salinity, depth, size of the water body, water depth, pH, and nutrients [
44]. Diatoms are extremely important indicators for reconstructing the environment of ancient coastal areas [
45,
46,
47,
48,
49,
50,
51,
52]. The geochemical elements Sr and Ba are both soluble in water and migrate with water. The concentration of sulfate ion in water increases because of evaporation or seawater intrusion into the water environment. Then the Ba ions in the water body form barium sulphate and precipitate first. The solubility of strontium salts (sulphate and carbonate) would be slightly higher than that of barium salts, and the strontium salts would be precipitated after barium sulphate precipitation [
53]. The change in the Sr and Sr/Ba ratio could indicate changes in salinity [
39,
40,
41,
42,
43].
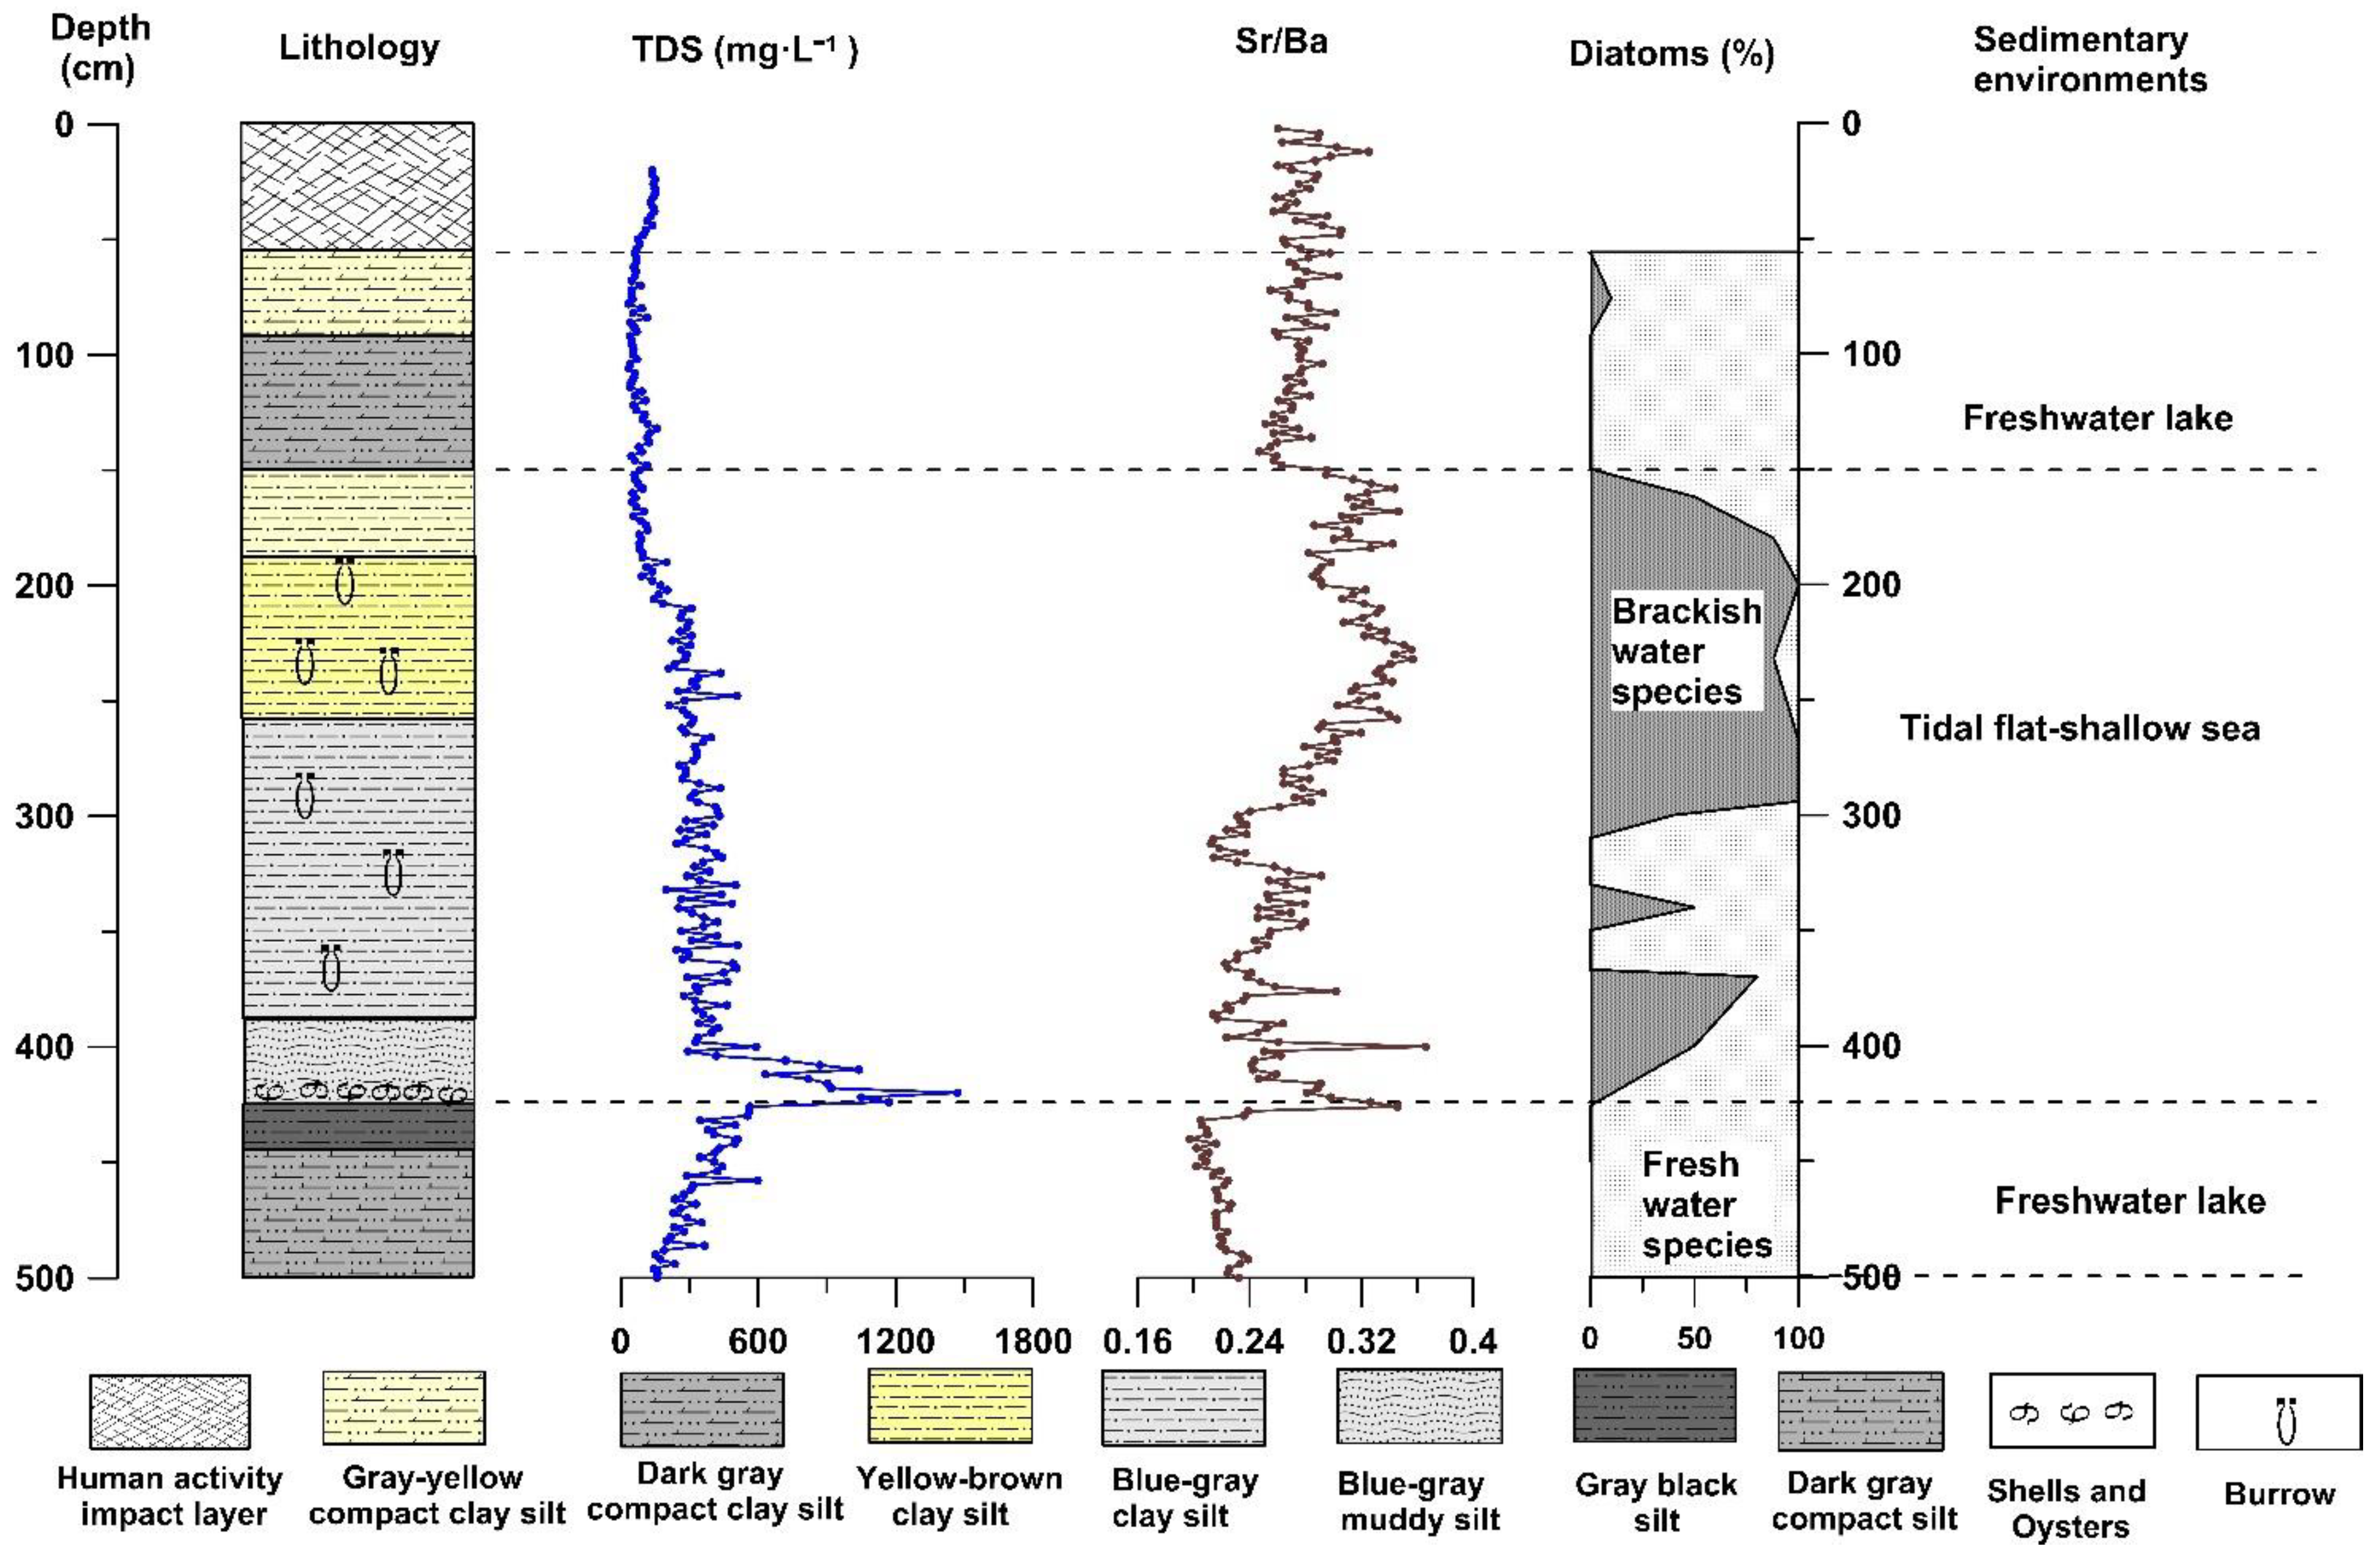
Sediment lithology, diatom species, geochemical elements and ratios, and physicochemical properties of sediment lixivium in the GX and CYK sections of the Subei Basin corresponded well. Their changing trends indicated that both profiles could be divided into three stages of sedimentary environments (
Figure 8 and
Figure 9), implying that these physicochemical property indexes could indicate the evolution of the coastal sedimentary environment. Furthermore,
Figure 8 and
Figure 9 show that the physicochemical property indexes agree well with the geochemical elements and ratios, as well as the diatom species generally. In particular, the stratigraphic boundary indicator at the beginning of transgression is highly consistent (the position of the dotted line in the lower part of
Figure 8 and
Figure 9). However, some slight differences are detected in the details of the record. The first difference is that in the process of transgression, some minor fluctuations recorded in the diatom species, and geochemical elements and ratios are not reflected in the physicochemical property indexes of sediment lixivium. For example, at a depth of 370–300 cm in the GX profile, the diatom species, geochemical elements, and ratios fluctuated significantly; however, the physicochemical property indexes of sediment lixivium were not recorded. This could be ascribed to the rapid deposition rate, loose sediments, and easy infiltration of the upper salty water when transgression occurred, which obscured the small fluctuation records. The second difference is that at the end of transgression, the boundary line indicated by the physicochemical property indexes of sediment lixivium was slightly lower than was the boundary line indicated by the diatom species, geochemical elements, and the ratios. This could be ascribed to the fact that after transgression, the research section was located in a freshwater lake sedimentary environment and, because of the long-term immersion in fresh water, the soluble solids in the adjacent strata were dissolved and diluted.
7. Conclusions
Based on a study of the experimental process and change mechanism of TDS, EC, and SAL of sediment lixivium in the sea–land interaction zone of the Subei Basin, as well as comparison with geochemical elements and ratios and diatom species, the following conclusions can be drawn:
- (1)
Through preliminary tests, a reasonable method of preparing sediment lixivium and the appropriate time for determining the physicochemical properties of sediment lixivium were determined. Ultrapure water had to be used in the process to ensure that the solvent did not contain soluble solids and to reduce the introduction of external errors. The reasonable time for testing the physicochemical property indexes of the sediment lixivium was determined as 120 h (fully stirred daily) or 168 h (no stirring) after the production of sediment lixivium. The physicochemical properties measured at this time were stable, which could reflect the difference in the water environment in the sediment deposition to the greatest extent. It should be noted that the test time for the physicochemical properties of sediment lixivium on the same profile should be tested simultaneously.
- (2)
The physicochemical property indexes (TDS, EC, and SAL) of the lixivium of sediments are extremely sensitive to changes in the water properties of the sedimentary environment, and could correspond well with geochemical elements and ratios and diatom species generally, indicating changes in the coastal sedimentary environment.
- (3)
Compared with other indexes, the physicochemical property indexes of sediment lixivium have obvious advantages. Large (expensive) instruments or advanced professional knowledge is not required. The test is simple, highly sensitive, accurate, and inexpensive. Accordingly, this method could be considered a relatively ideal new indicator for studying paleoenvironmental changes in coastal areas. Therefore, the method has broad application prospects.
- (4)
The physicochemical property indexes of sediment lixivium have many advantages, but also certain shortcomings. These include the fact that the records of the details during the transgression process are not obvious and, after the end of the transgression, the TDS adsorbed on the sediments could be reduced owing to the dilution effect of fresh water, resulting in a slight decrease in the boundary line that indicates the end of the transgression.
Author Contributions
Conceptualization, Q.S. and Y.C.; methodology, Y.C. and S.Z.; software, Q.S. and Y.C.; investigation, Q.S. and Y.C.; data curation, S.Z. and Y.C.; writing—original draft preparation, Q.S.; writing—review and editing, Q.S.; project administration, Q.S. All authors have read and agreed to the published version of the manuscript.
Funding
This work was supported by the National Natural Science Foundation of China (Grant No. 41671195 and 41801005); Marine science and technology innovation project of Jiangsu province (No. JSZRHYKJ202002).
Institutional Review Board Statement
Not applicable.
Informed Consent Statement
Not applicable.
Data Availability Statement
The data that support the findings of this study are available from the corresponding author upon request.
Acknowledgments
The authors would like to thank editors and reviewers for their valuable comments for the improvement of the manuscript.
Conflicts of Interest
The authors declare no conflict of interest.
References
- Louvari, M.A.; Drinia, H.; Kontakiotis, G.; Di Bella, L.; Antonarakou, A.; Anastasakis, G. Impact of latest-glacial to Holocene sea-level oscillations on central Aegean shelf ecosystems: A benthic foraminiferal palaeoenvironmental assessment of South Evoikos Gulf, Greece. J. Mar. Syst. 2019, 199, 103181. [Google Scholar] [CrossRef]
- Drinia, H.; Antonarakou, A.; Tsourou, T.; Kontakiotis, G.; Psychogiou, M.; Anastasakis, G. Foraminifera eco-biostratigraphy of the southern Evoikos outer shelf, central Aegean Sea, during MIS 5 to present. Cont. Shelf Res. 2016, 126, 36–49. [Google Scholar] [CrossRef]
- Kontakiotis, G.; Karakitsios, V.; Mortyn, P.G.; Antonarakou, A.; Drinia, H.; Anastasakis, G.; Agiadi, K.; Kafousia, N.; De Rafelis, M. New insights into the early Pliocene hydrographic dynamics and their relationship to the climatic evolution of the Mediterranean Sea. Palaeogeogr. Palaeoclimatol. Palaeoecol. 2016, 459, 348–364. [Google Scholar] [CrossRef]
- Kontakiotis, G.; Besiou, E.; Antonarakou, A.; Zarkogiannis, S.D.; Kostis, A.; Mortyn, P.G.; Moissette, P.; Cornée, J.-J.; Schulbert, C.; Drinia, H.; et al. Decoding sea surface and paleoclimate conditions in the eastern Mediterranean over the Tortonian-Messinian Transition. Palaeogeogr. Palaeoclimatol. Palaeoecol. 2019, 534, 109312. [Google Scholar] [CrossRef]
- Vasiliev, I.; Karakitsios, V.; Bouloubassi, I.; Agiadi, K.; Kontakiotis, G.; Antonarakou, A.; Triantaphyllou, M.; Gogou, A.; Kafousia, N.; De Rafélis, M.; et al. Large Sea Surface Temperature, Salinity, and Productivity-Preservation Changes Preceding the Onset of the Messinian Salinity Crisis in the Eastern Mediterranean Sea. Paleoceanogr. Paleoclimatol. 2019, 34, 182–202. [Google Scholar] [CrossRef]
- Lambeck, K.; Chappell, J. Sea level change through the last glacial cycle. Science 2001, 292, 679–686. [Google Scholar] [CrossRef] [PubMed]
- Lambeck, K.; Antonioli, F.; Purcell, A.; Silenzi, S. Sea-level change along the Italian coast for the past 10,000 yr. Quat. Sci. Rev. 2004, 23, 1567–1598. [Google Scholar] [CrossRef]
- Miller, K.G.; Kominz, M.A.; Browning, J.V.; Wright, J.D.; Mountain, G.S.; Katz, M.E.; Sugarman, P.J.; Cramer, B.S.; Christie-Blick, N.; Pekar, S.F. The Phanerozoic Record of Global Sea-Level Change. Science 2005, 310, 1293–1298. [Google Scholar] [CrossRef] [Green Version]
- Kontakiotis, G.; Antonarakou, A.; Mortyn, P.; Drinia, H.; Anastasakis, G.; Zarkogiannis, S.D.; Möbius, J. Morphological recognition of Globigerinoides ruber morphotypes and their susceptibility to diagenetic alteration in the eastern Mediterranean Sea. J. Mar. Syst. 2017, 174, 12–24. [Google Scholar] [CrossRef]
- Kontakiotis, G.; Efstathiou, E.; Zarkogiannis, S.; Besiou, E.; Antonarakou, A. Latitudinal Differentiation among Modern Planktonic Foraminiferal Populations of Central Mediterranean: Species–Specific Distribution Patterns and Size Variability. J. Mar. Sci. Eng. 2021, 9, 551. [Google Scholar] [CrossRef]
- Antonarakou, A.; Kontakiotis, G.; Zarkogiannis, S.D.; Mortyn, P.; Drinia, H.; Koskeridou, E.; Anastasakis, G. Planktonic foraminiferal abnormalities in coastal and open marine eastern Mediterranean environments: A natural stress monitoring approach in recent and early Holocene marine systems. J. Mar. Syst. 2018, 181, 63–78. [Google Scholar] [CrossRef]
- Giamali, C.; Koskeridou, E.; Antonarakou, A.; Ioakim, C.; Kontakiotis, G.; Karageorgis, A.P.; Roussakis, G.; Karakitsios, V. Multiproxy ecosystem response of abrupt Holocene climatic changes in the northeastern Mediterranean sedimentary archive and hydrologic regime. Quat. Res. 2019, 92, 665–685. [Google Scholar] [CrossRef]
- Giamali, C.; Kontakiotis, G.; Koskeridou, E.; Ioakim, C.; Antonarakou, A. Key Environmental Factors Controlling Planktonic Foraminiferal and Pteropod Community’s Response to Late Quaternary Hydroclimate Changes in the South Aegean Sea (Eastern Mediterranean). J. Mar. Sci. Eng. 2020, 8, 709. [Google Scholar] [CrossRef]
- Zarkogiannis, S.; Kontakiotis, G.; Antonarakou, A. Recent planktonic foraminifera population and size response to Eastern Mediterranean hydrography. Revue Micropaléontologie 2020, 69, 100450. [Google Scholar] [CrossRef]
- Lighty, R.G.; MacIntyre, I.G.; Stuckenrath, R. Submerged early Holocene barrier reef south-east Florida shelf. Nature 1978, 276, 59–60. [Google Scholar] [CrossRef]
- Goff, J.A.; Austin, J.A.; Goodman-Tchernov, B.N. Estuarine development and early Holocene transgression across an aeolianite substrate, Caesarea, central Israel. Cont. Shelf Res. 2018, 158, 33–44. [Google Scholar] [CrossRef]
- Liu, R.; Qin, J.; Mei, X. Sedimentary environment changes of the Ningshao Plain since the later stage of the Late Pleistocene: Evidence from palynology and stable organic carbon isotopes. Quat. Int. 2014, 333, 188–197. [Google Scholar] [CrossRef]
- Jarvis, I.; Mabrouk, A.; Moody, R.T.; de Cabrera, S. Late Cretaceous (Campanian) carbon isotope events, sea-level change and correlation of the Tethyan and Boreal realms. Palaeogeogr. Palaeoclimatol. Palaeoecol. 2002, 188, 215–248. [Google Scholar] [CrossRef]
- Kontakiotis, G. Late Quaternary paleoenvironmental reconstruction and paleoclimatic implications of the Aegean Sea (eastern Mediterranean) based on paleoceanographic indexes and stable isotopes. Quat. Int. 2016, 401, 28–42. [Google Scholar] [CrossRef] [Green Version]
- Kontakiotis, G.; Mortyn, P.G.; Antonarakou, A.; Martínez-Botí, M.A.; Triantaphyllou, M.V. Field-based validation of a diagenetic effect on G. ruber Mg/Ca paleothermometry: Core top results from the Aegean Sea (eastern Mediterranean). Geochem. Geophys. Geosyst. 2011, 12. [Google Scholar] [CrossRef]
- Kontakiotis, G.; Moforis, L.; Karakitsios, V.; Antonarakou, A. Sedimentary Facies Analysis, Reservoir Characteristics and Paleogeography Significance of the Early Jurassic to Eocene Carbonates in Epirus (Ionian Zone, Western Greece). J. Mar. Sci. Eng. 2020, 8, 706. [Google Scholar] [CrossRef]
- Kontakiotis, G.; Mortyn, P.G.; Antonarakou, A.; Drinia, H. Assessing the reliability of foraminiferal Mg/Ca thermometry by comparing field-samples and culture experiments: A review. Geol. Q. 2016, 60, 547–560. [Google Scholar] [CrossRef] [Green Version]
- Antonarakou, A.; Kontakiotis, G.; Mortyn, P.G.; Drinia, H.; Sprovieri, M.; Besiou, E.; Tripsanas, E. Biotic and geochemical (δ18O, δ13C, Mg/Ca, Ba/Ca) responses of Globigerinoides ruber morphotypes to upper water column variations during the last deglaciation, Gulf of Mexico. Geochim. Cosmochim. Acta 2015, 170, 69–93. [Google Scholar] [CrossRef]
- Wang, P. The use and misuse of microfossils in marine transgression studies. Quat. Sci. 1992, 12, 321–331. [Google Scholar]
- Zhang, M.; Liu, S.; Chen, M. Late Quaternary Event Geology of Coastal Zone in China; Geological Publishing House: Beijing, China, 2000. [Google Scholar]
- Makri, P.; Stathopoulou, E.; Hermides, D.; Kontakiotis, G.; Zarkogiannis, S.D.; Skilodimou, H.D.; Bathrellos, G.D.; Antonarakou, A.; Scoullos, M. The Environmental Impact of a Complex Hydrogeological System on Hydrocarbon-Pollutants’ Natural Attenuation: The Case of the Coastal Aquifers in Eleusis, West Attica, Greece. J. Mar. Sci. Eng. 2020, 8, 1018. [Google Scholar] [CrossRef]
- Hermides, D.; Makri, P.; Kontakiotis, G.; Antonarakou, A. Advances in the Coastal and Submarine Groundwater Processes: Controls and Environmental Impact on the Thriassion Plain and Eleusis Gulf (Attica, Greece). J. Mar. Sci. Eng. 2020, 8, 944. [Google Scholar] [CrossRef]
- Pesce, S.F.; Wunderlin, D.A. Use of water quality indices to verify the impact of Córdoba City (Argentina) on Suquía River. Water Res. 2000, 34, 2915–2926. [Google Scholar] [CrossRef]
- Cude, C.G. Oregon water quality index a tool for evaluating water quality management effectiveness. JAWRA J. Am. Water Resour. Assoc. 2001, 37, 125–137. [Google Scholar] [CrossRef]
- Subramani, T.; Elango, L.; Damodarasamy, S.R. Groundwater quality and its suitability for drinking and agricultural use in Chithar River Basin, Tamil Nadu, India. Environ. Earth Sci. 2005, 47, 1099–1110. [Google Scholar] [CrossRef]
- Sylus, K.; Ramesh, H. The Study of Sea Water Intrusion in Coastal Aquifer by Electrical Conductivity and Total Dissolved Solid Method in Gurpur and Netravathi River Basin. Aquat. Procedia 2015, 4, 57–64. [Google Scholar] [CrossRef]
- Salmani, M.H.; Jajaei, E.S. Forecasting models for flow and total dissolved solids in Karoun river-Iran. J. Hydrol. 2016, 535, 148–159. [Google Scholar] [CrossRef]
- Yokoyama, T. Measuration of Electric Conductivity. In A Handbook of Quaternary Research (2); Japan Association for Quaternary Research, Ed.; University of Tokyo Press: Tokyo, Japan, 1993; pp. 109–118. [Google Scholar]
- Fang, J.; Wu, Y.; Li, R.; Zhou, J.; Kang, L.; Chai, R.; Ma, N. Discussion on the marine regression event during the Early-Middle Holocene in the Liaoning Coast. Earth Sci. Front. 2009, 16, 396–403. [Google Scholar]
- Fang, J.; Yang, Y.; Ma, H.; Liu, B.; Wang, H.; Yu, L.; Liu, J.; Hu, K. Edimentary environmental analysis based on the electric conductivity and Ph of stirred clayed drilling cores in water and diatom recovered from the old drowned valley plain in the Dagu Mountain, Liaodong Peninsula in china. Acta Oceanol. Sin. 2012, 34, 133–141. [Google Scholar]
- Chen, Y.; Yan, Q.; Xu, S. Evolution of the sedimentary environments in north Jiangsu basin and its tectonic setting. Sci. Geol. Sin. 1993, 28, 151–160. [Google Scholar]
- Ji, A.; Tao, G.; Zhuo, S.; Luo, L. X-ray Fluorescence Spectrometric Analysis; Science Press: Beijing, China, 2003; pp. 201–203. [Google Scholar]
- Shu, Q.; Zhao, Y.; Frechen, M.; Zhang, J.; Chen, Y.; Liu, Y.; Yang, P. Chronology of a sedimentary sequence from the land–ocean interaction zone in the North Jiangsu Basin. Quat. Int. 2021, 580, 78–86. [Google Scholar] [CrossRef]
- Zhao, Y.; Yan, M. Geochemistry of Sediments of the China Shelf Sea; Science Press: Beijing, China, 1994; pp. 43–48. [Google Scholar]
- Liu, Y.; Song, T. Discussion on characteristics of geochemical and sedimentary environments of the Shisanlitai Formation of Fuzhou Bay, Liaoning province. Acta Sedimentol. Sin. 2009, 27, 1018–1026. [Google Scholar]
- Yu, Y.; Zhang, C.; Zhang, S.; Shi, H.; Du, J. Research on source direction of Neogene Zhujiang Formation in Huizhou Depression. Fault Block Oil Gas Field 2012, 19, 17–21. [Google Scholar]
- Wei, W.; Algeo, T.J. Elemental proxies for paleosalinity analysis of ancient shales and mudrocks. Geochim. Cosmochim. Acta 2020, 287, 341–366. [Google Scholar] [CrossRef]
- Wei, W.; Algeo, T.J.; Lu, Y.; Lu, Y.; Liu, H.; Zhang, S.; Peng, L.; Zhang, J.; Chen, L. Identifying marine incursions into the Paleogene Bohai Bay Basin lake system in northeastern China. Int. J. Coal Geol. 2018, 200, 1–17. [Google Scholar] [CrossRef]
- Bradshaw, E.G.; Anderson, N.J.; Jensen, J.P.; Jeppesen, E. Phosphorus dynamics in Danish lakes and the implications for diatom ecology and palaeoecology. Freshw. Biol. 2002, 47, 1963–1975. [Google Scholar] [CrossRef]
- Zong, Y.; Huang, G.; Switzer, A.D.; Yu, F.; Yim, W.W.-S. An evolutionary model for the Holocene formation of the Pearl River delta, China. Holocene 2009, 19, 129–142. [Google Scholar] [CrossRef] [Green Version]
- Long, A.J.; Barlow, N.; Dawson, S.; Hill, J.; Innes, J.B.; Kelham, C.; Milne, F.D.; Dawson, A. Lateglacial and Holocene relative sea-level changes and first evidence for the Storegga tsunami in Sutherland, Scotland. J. Quat. Sci. 2016, 31, 239–255. [Google Scholar] [CrossRef] [Green Version]
- Lund, J.W.G.; Hendey, N.I. An Introductory Account of the Smaller Algae of British Coastal Waters. Part V. Bacillariophyceae (Diatoms). J. Ecol. 1965, 53, 549. [Google Scholar] [CrossRef]
- Sancetta, C. Oceanographic and ecologic significance of diatoms in surface sediments of the Bering and Okhotsk seas. Deep Sea Res. Oceanogr. Res. Pap. 1981, 28, 789–817. [Google Scholar] [CrossRef]
- Round, F.E.; Crawford, R.M.; Mann, D.G. The Diatoms; Cambridge University Press: Cambridge, UK, 1990; pp. 1–747. [Google Scholar]
- Tomas, C.R. Identifying Marine Phytoplankton; Academic Press: San Diego, CA, USA, 1997. [Google Scholar]
- Pushkar, V.; Roof, S.R.; Cherepanova, M.V.; Hopkins, D.M.; Brigham-Grette, J. Paleogeographic and paleoclimatic significance of diatoms from middle Pleistocene marine and glaciomarine deposits on Baldwin Peninsula, northwestern Alaska. Palaeogeogr. Palaeoclimatol. Palaeoecol. 1999, 152, 67–85. [Google Scholar] [CrossRef]
- Lan, B.; Lan, D.; Zheng, Z.; Shi, X. Diatoms and their palaeoenvironments from the cores of Xijiang Delta in China. Acta Oceanol. Sin. 2008, 30, 93–99. [Google Scholar]
- Liu, Y.; Cao, L. Introduction to Element Geochemistry; Geological Publishing House: Beijing, China, 1993; pp. 42–56. [Google Scholar]
| Publisher’s Note: MDPI stays neutral with regard to jurisdictional claims in published maps and institutional affiliations. |
© 2021 by the authors. Licensee MDPI, Basel, Switzerland. This article is an open access article distributed under the terms and conditions of the Creative Commons Attribution (CC BY) license (https://creativecommons.org/licenses/by/4.0/).


