Article

Solid-Fluid Coupled Numerical Analysis of Suction Caisson Installation in Sand

State Key Laboratory of Hydroscience and Engineering, Department of Hydraulic Engineering, Tsinghua University, Beijing 100084, China
*
Author to whom correspondence should be addressed.
J. Mar. Sci. Eng. 2021, 9(7), 704; https://doi.org/10.3390/jmse9070704
Submission received: 1 June 2021 / Revised: 19 June 2021 / Accepted: 23 June 2021 / Published: 26 June 2021
(This article belongs to the Special Issue Instability and Failure of Subsea Structures)

Abstract

:
Suction caissons are widely used foundations in offshore engineering. The change in excess pore pressure and seepage field caused by penetration and suction significantly affects the soil resistance around the caisson wall and tip, and also affects the deformation of the soil within and adjacent to the caisson. This study uses Arbitrary Lagrangian–Eulerian (ALE) large deformation solid-fluid coupled FEM to investigate the changes in suction pressure and the seepage field during the process of the suction caisson installation in sand. A nonlinear Drucker-Prager model is used to model soil, while Coulomb friction is applied at the soil-caisson interface. The ALE solid-fluid coupled FEM is shown to be able to successfully simulate both jacked penetration and suction penetration caisson installation processes in sand observed in centrifuge tests. The difference in penetration resistance for jacked and suction installation is found to be caused by the seepage and excess pore pressure generated during the suction caisson installation, highlighting the importance of using solid-fluid coupled effective stress-based analysis to consider seepage in the evaluation of suction caisson penetration.

1. Introduction

With rapid offshore wind turbine development, suction caissons are becoming widely used. Compared with traditional forms of foundations, a significant advantage of the suction caisson is its cost effectiveness, due to its simple installation equipment requirement, short installation time, convenience in transportation, and recycle and reuse potential [1,2,3,4,5]. Suction caissons are installed in the seabed soil by creating suction within the caisson, which is distinct from other types of foundations. Due to this unique installation feature, it has been observed both in situ [6] and in laboratory experiments [7,8,9,10] that the penetration resistance during suction installation can be almost an order of magnitude smaller than that during jacked installation, where the caisson is directly pushed into the ground via external force without the application of suction. This has been attributed to seepage within the soil due to the pore pressure gradient created by suction [11]. On the flipside, the pressure gradient could also lead to piping and soil plugging if the applied suction is too large. Therefore, it is important to understand the solid-fluid coupled suction installation process considering both seepage and penetration.
A series of in situ tests have been conducted to evaluate the evolution of penetration resistance during suction caisson installation [2,6,12]. Various centrifuge model tests have also been carried out to investigate the effect of caisson size and wall thickness on the penetration resistance [9,10,13]. Guo et al. [14] performed 1g model tests on caisson installation in soft clay and found that the applied suction pressure affects the height of soil plug inside the caisson. Subsequently, in order to explore the influence of seepage on the soil inside the caisson, Panagoulias et al. [15] applied water pressure at the base of the soil to generate seepage in 1g tests. Bending elements have been applied in centrifuge tests to explore the change in mechanical properties of the soil inside the caisson due to the suction pressure [13], showing a reduction within the in-caisson soil during suction penetration due to seepage. These experimental studies have provided important insights into the penetration and seepage process during suction installation, though changes in soil effective stress, caisson tip resistance, outside wall friction, and inside wall friction, which are important for the pinpointing of the effect of suction on penetration resistance, could not be distinguished due to limitations in measurement.
Numerical methods can aid the analysis of the suction installation process. Due to the large deformation within the local soil during penetration, large deformation analysis methods such as RITSS (Remeshing and Interpolation Technique with Small Strain), ALE (Arbitrary Lagrangian–Eulerian), CEL (Coupled Eulerian–Lagrangian), MPM (Material Point Method) have been adopted for its simulation [16,17,18,19,20,21]. Zhou and Randolph [18] used RITSS to investigate the resistance of jacked penetration and suction penetration in clay. Wang et al. [19] used the Abaqus ALE method to analyze the influence of soil-caisson friction angle and caisson geometry on penetration resistance and soil plug. However, these methods often treat soil as a single-phase material using total stress analysis and does not consider the effect of seepage within the soil. Mehravar et al. [22] used Flac3D to conduct simulations using both total stress and effective stress analysis, but were focused on clay grounds where seepage is very limited. Existing numerical simulation of suction caisson penetration either only considered the large penetration deformation, or only considered the solid-fluid coupling. Houlsby and Byrne [23,24] proposed a theoretical formula to predict penetration resistance during the jacked and suction process, which has the advantage of being simple and easy to understand in engineering applications. However, the changes in effective stress and seepage field during the entire installation process cannot be assessed. This paper combines large deformation and solid-fluid coupling methods to fully consider the entire suction caisson penetration process and analyze the mechanism of suction caisson penetration through numerical means.
This study develops a large deformation two-phase analysis approach using the ALE method with u-p solid-fluid coupled formulation to investigate the penetration resistance evolution associated with seepage and penetration during suction caisson installation in sand. A numerical method for modeling the large deformation of two-phase solid-fluid coupled soil in Abaqus ALE is developed in Section 2. In Section 3, the numerical model for simulating suction caisson installation in sand is presented in detail. Using the proposed large deformation effective stress analysis method, Section 4 simulates the centrifuge tests of Tran et al. [9], and analyzes the effect of seepage and effective stress change on suction penetration compared with jacked penetration.

2. Large Deformation Solid-Fluid Coupled Analysis Method

2.1. Large Deformation Analysis Method-ALE

The ALE method adopts a motion description method different from the traditional Lagrange description and Euler description. In this method, a reference configuration that can be independent of the initial configuration and the current configuration movement is introduced to realize that grid can move independent of the material in large deformation problems. The ALE solution process for large deformation can be summed as follows: (1) perform Lagrangian analysis to obtain deformation, (2) re-mesh the grid according to the deformation, (3) attach the material information to the new mesh. ALE has been widely used in the field of geotechnical engineering, where large deformation problems are frequently encountered. The reliability of ALE implementation in Abaqus for large deformation problems has been verified in CPT penetration, strip foundation penetration, and open pipe penetration simulations [25,26,27]. However, solid-fluid coupled features are not available for ALE analysis in Abaqus. In this study, a solid-fluid coupling formulation for modeling the soil as a two-phase medium is implemented in Abaqus ALE as a VUMAT subroutine, following the reported procedure of Hamann and Grabe [28] for CEL analysis.

2.2. Solid-Fluid Coupling Formulation

A u-p formulation is used for solid-fluid coupling where the unknown variables are the pore water pressure pw and the displacement of the solid u [29]. For saturated soil, the momentum balance equation of the mixture of solid and fluid can be expressed as:
S T σ ρ u ¨ + ρ g = 0
where S is the differential operator, σ is the total stress, u ¨ is the current acceleration of the solid phase, g is the gravity acceleration, ρ is the saturated density of soil, ρ = ( 1 n ) ρ s + n ρ w , n is the porosity of soil, ρ s is the solid phase density, ρ w is the fluid phase density.
The momentum balance of the fluid follows:
p w R ρ w u ¨ + ρ w g = 0
where R represents the viscous drag forces, and can be written as:
κ R = w
where κ = k f ρ w g is the intrinsic permeability, k f is permeability coefficient, w is the average velocity of the percolating fluid.
The mass conservation equation can be expressed as:
T w + α I ε v o l + ( n K w + α n K s ) p ˙ w = 0
where ε vol is the strain rate of the solid skeleton, α is the Biot’s constant, which is approximately 1 for soil, I is an identity tensor, K w is the fluid bulk modulus, K s is the bulk modulus of the solid grains.
Combining Equation (2) and Equation (4) using Equation (3):
( n K w + α n K s ) p ˙ w = T κ ( p w ρ w g + ρ w u ¨ ) α I ε v o l
The governing equations of the u-p formulation is thus Equations (1) and (5). This formulation omits the relative fluid acceleration in the solid-fluid mixture, which is negligible in the relatively low frequency loading during suction caisson installation [28].

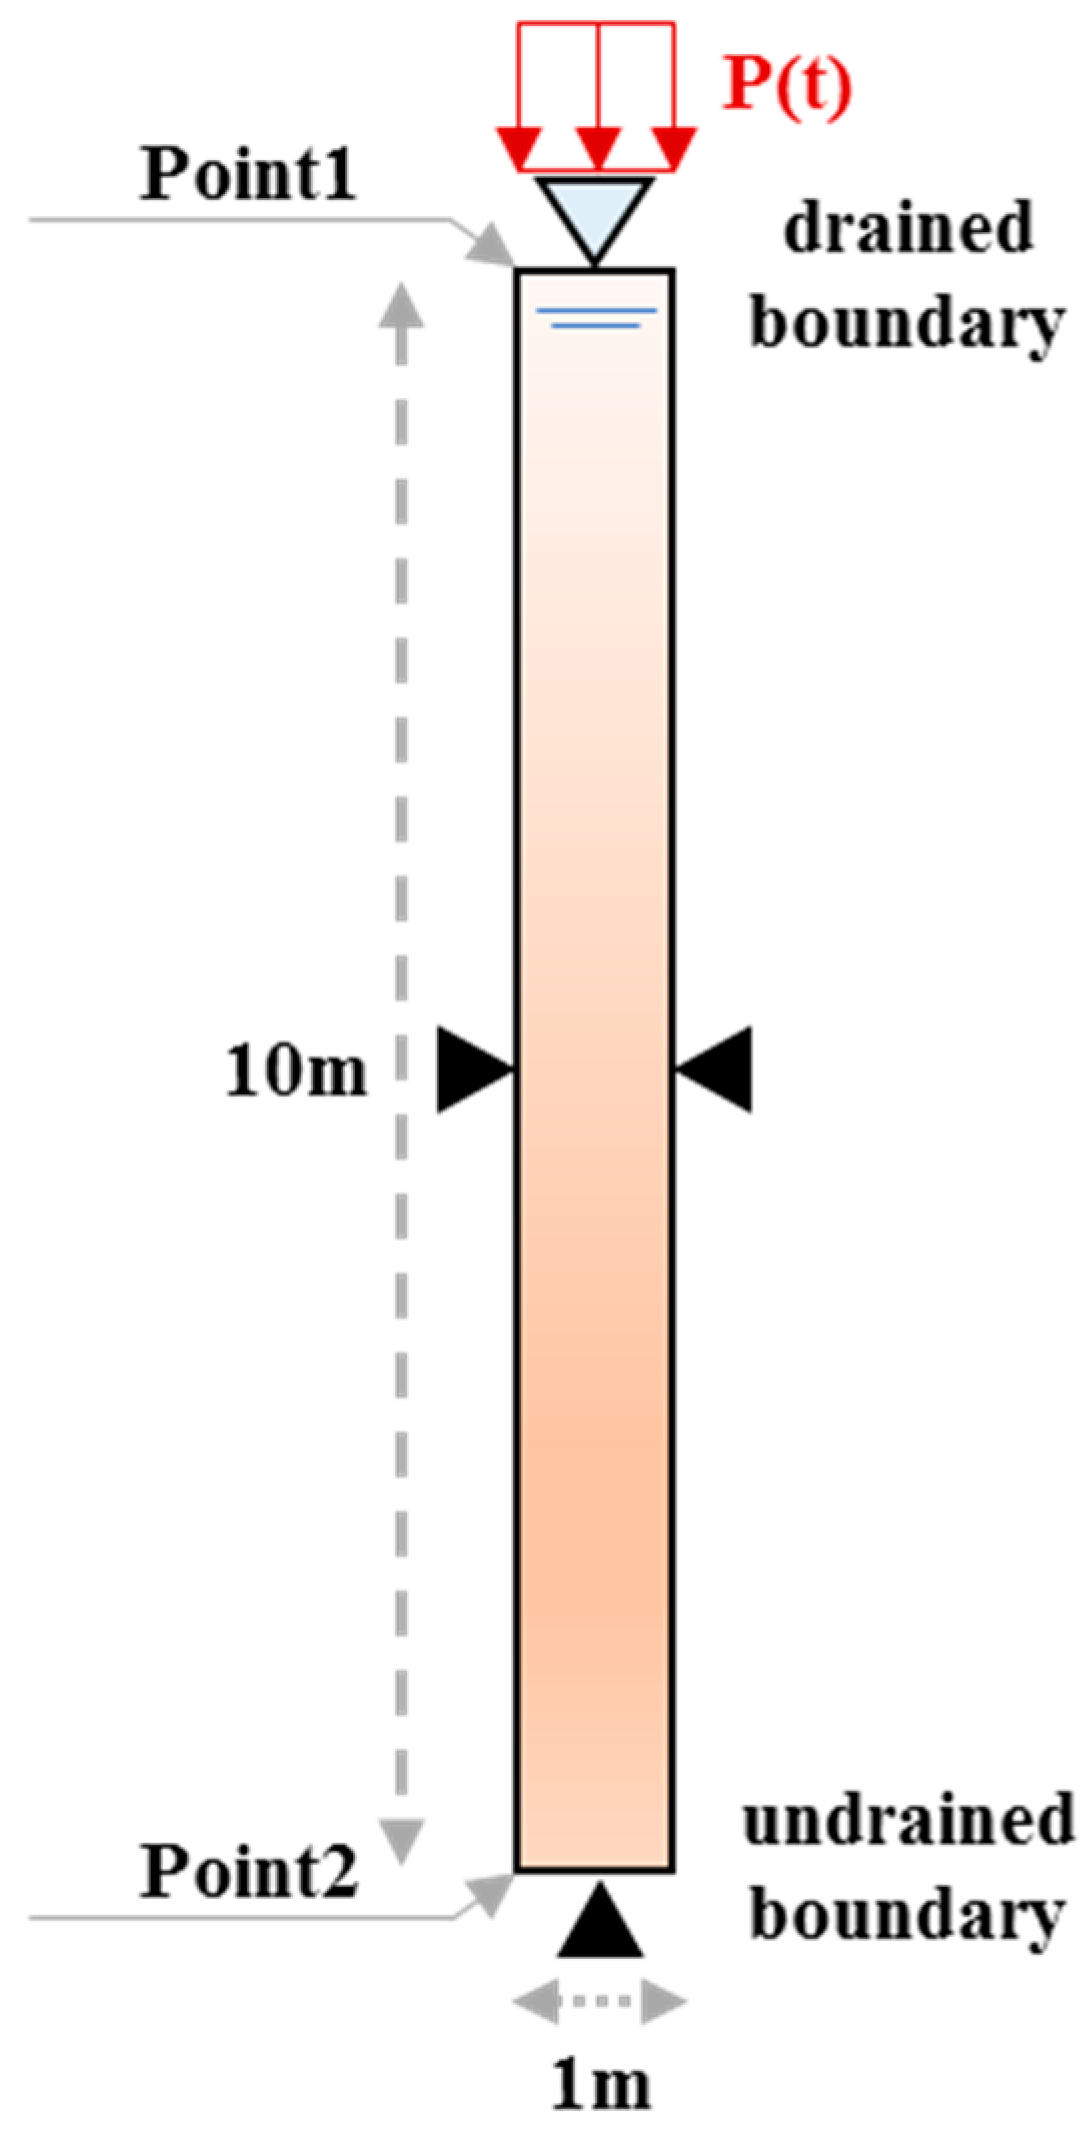
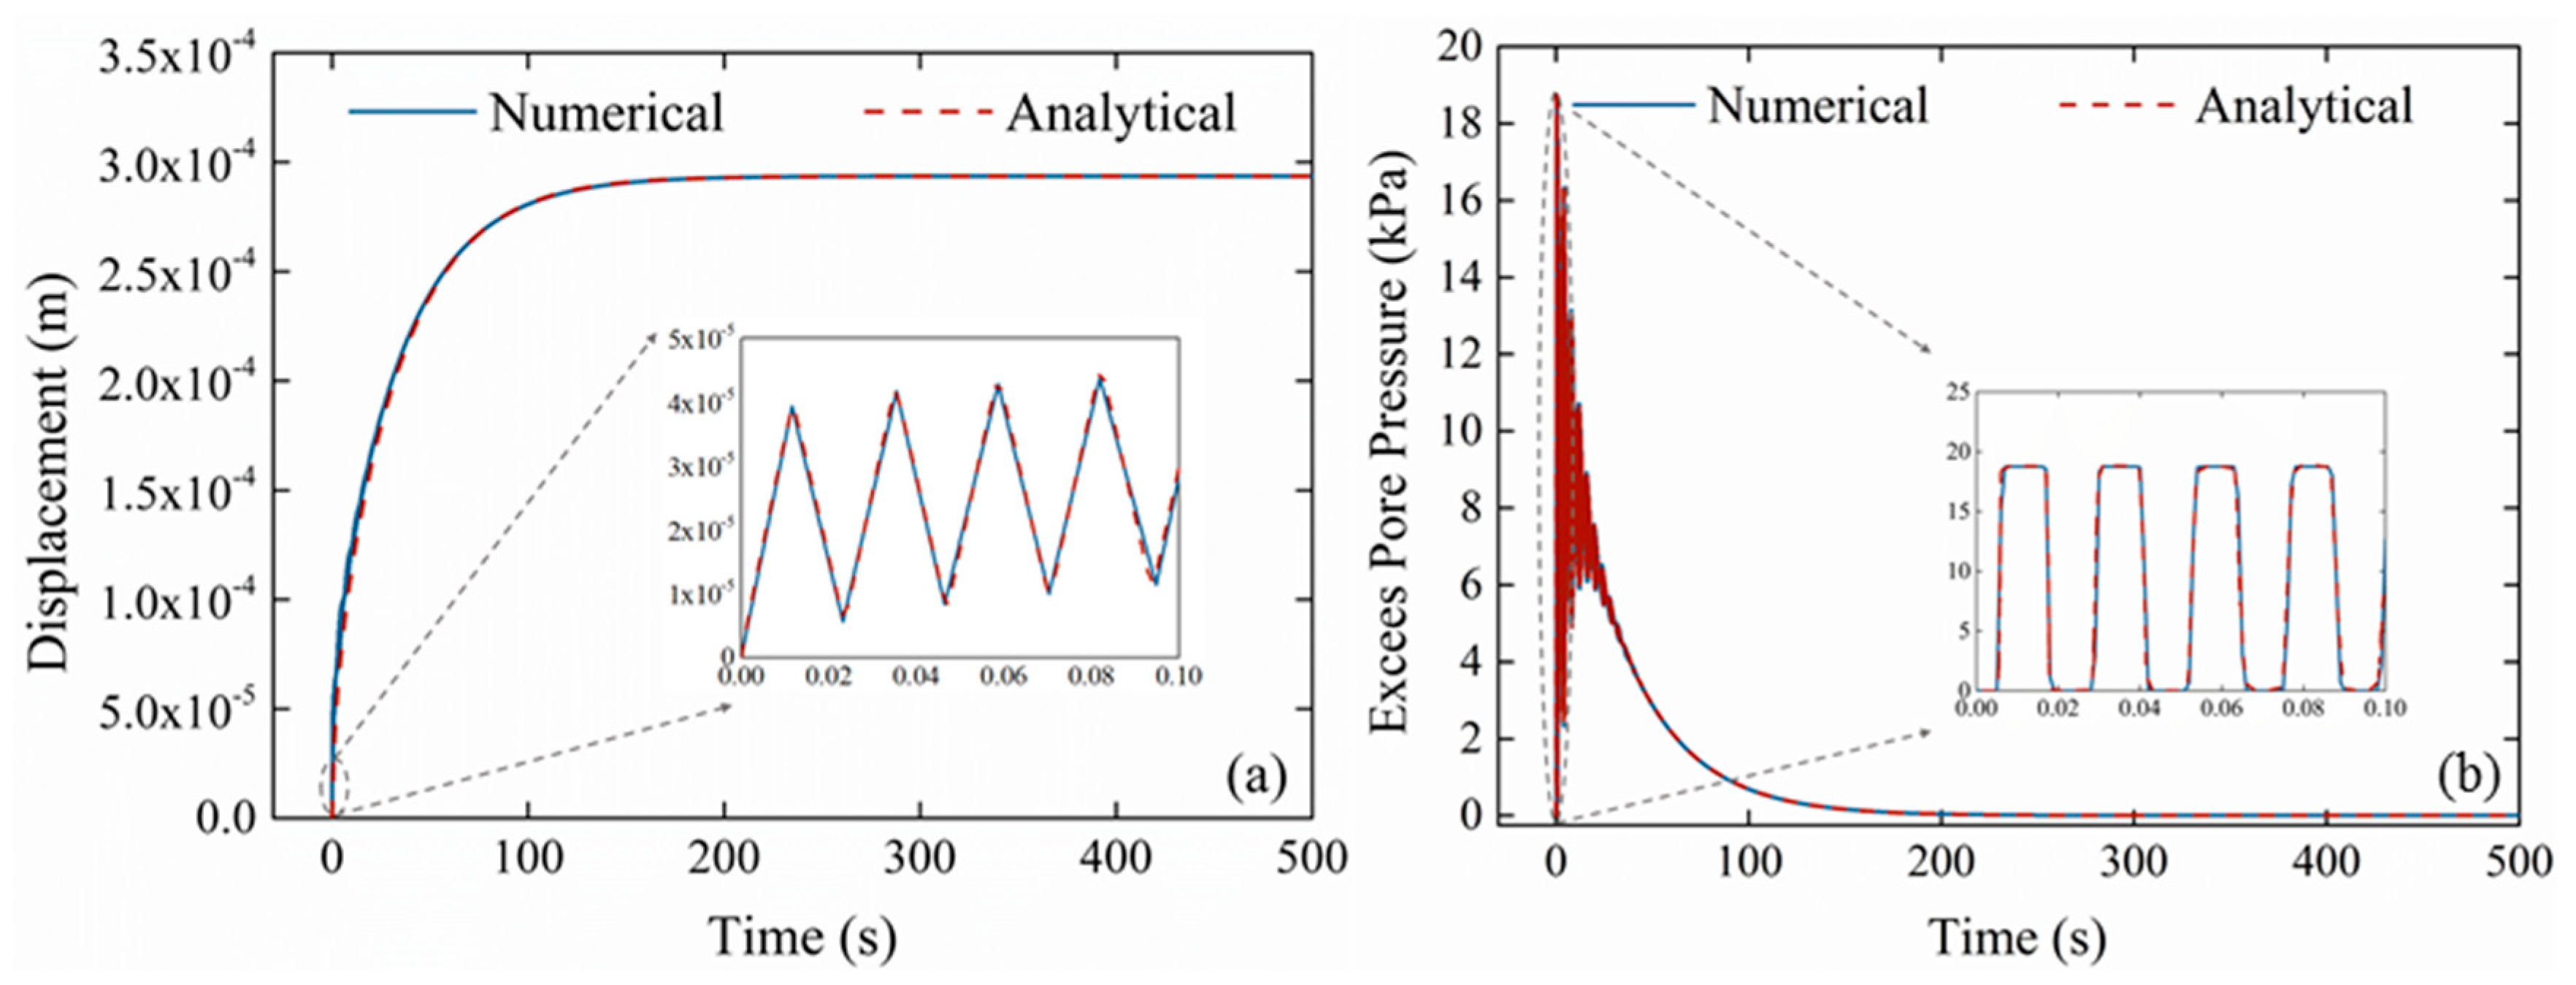
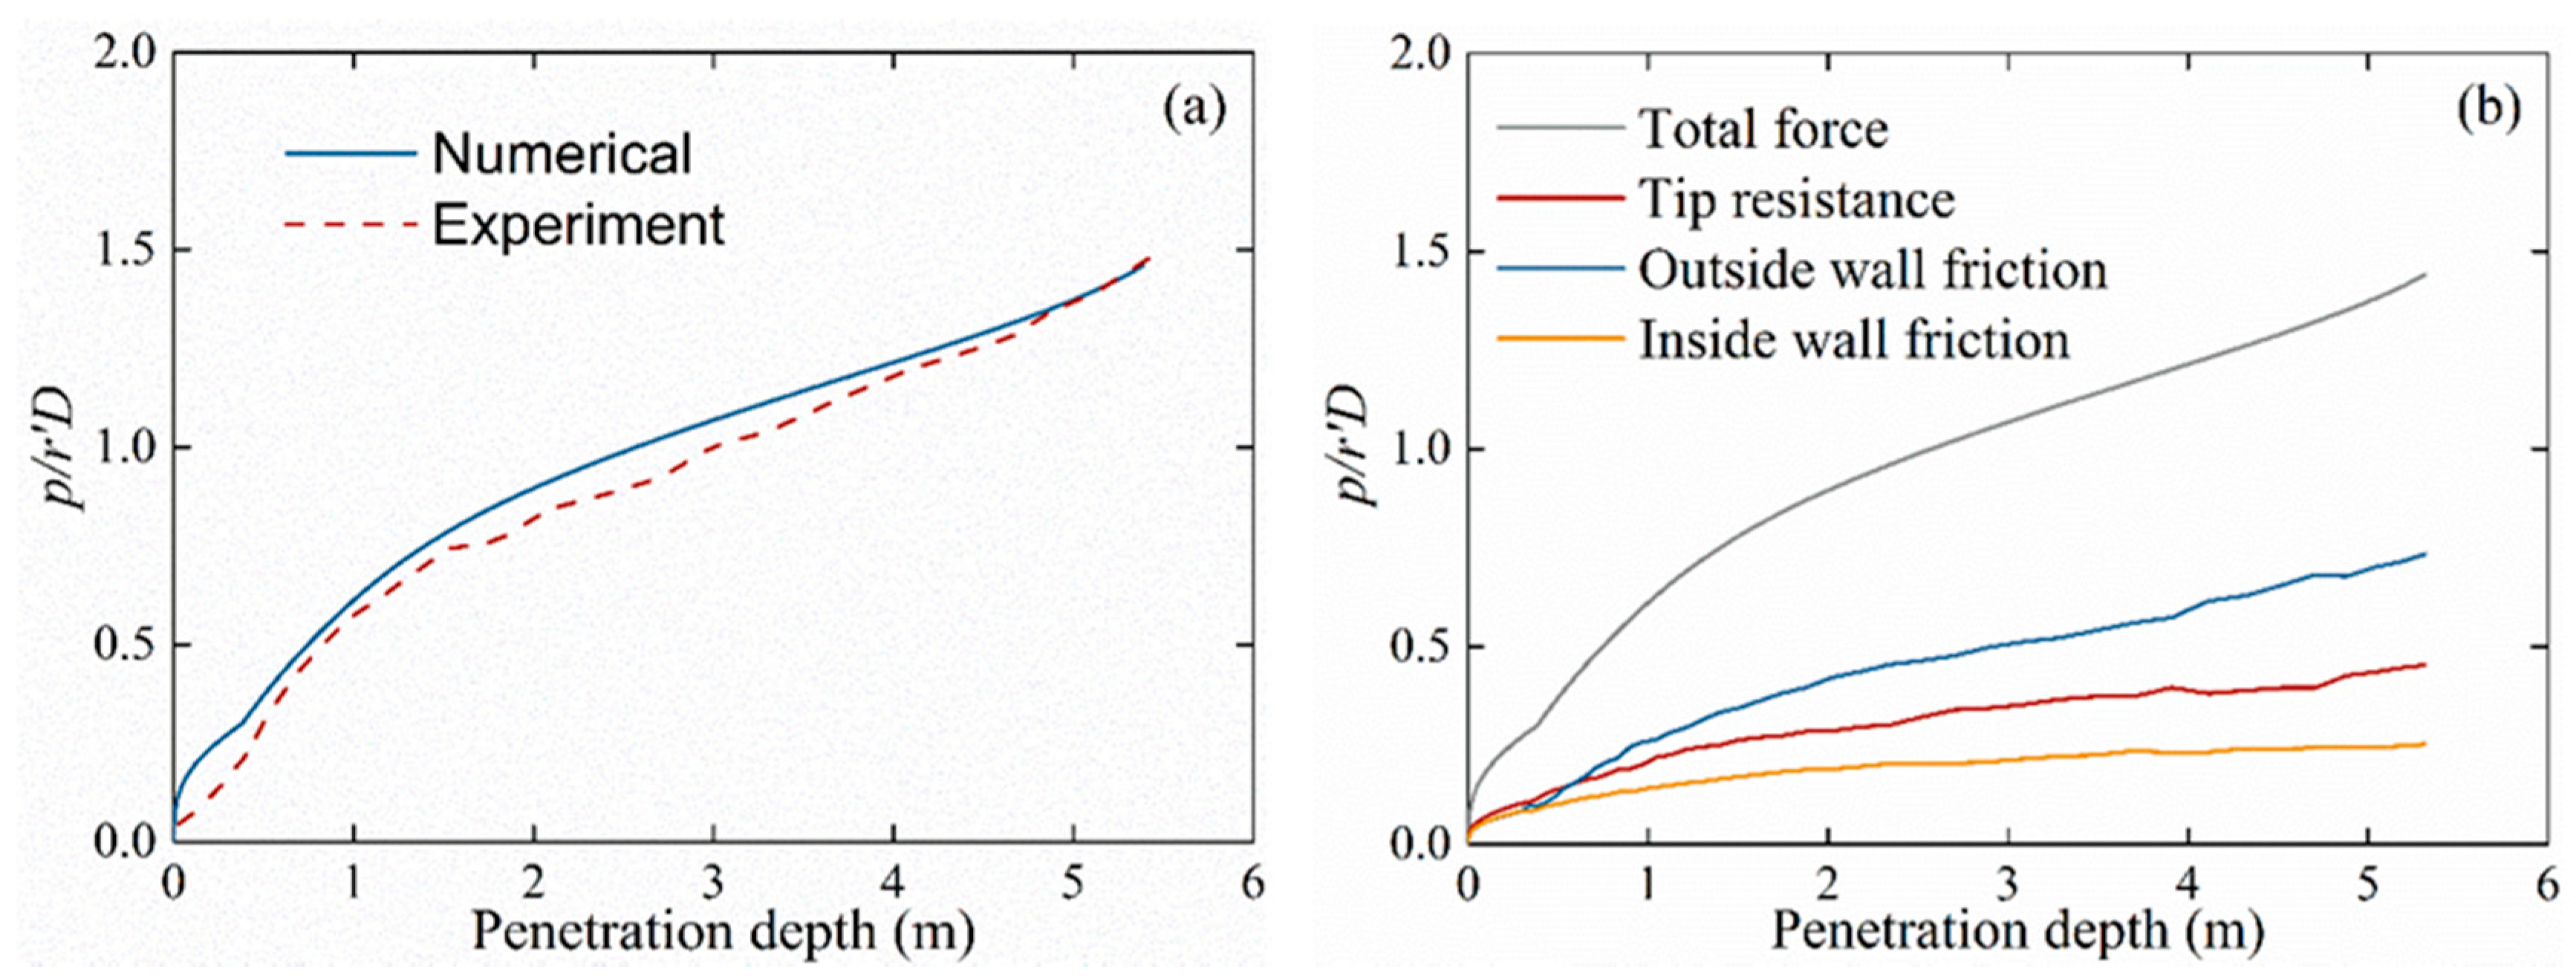
2.3. Validation of Solid-Fluid Coupling Analysis Method

In order to verify the reliability of the method and its implementation, a benchmark dynamic 1D consolidation problem is solved and compared with existing the analytical solution. The penetration of the suction caisson is essentially a dynamic process. In this process, the development of deformation and pore pressure are coupled and cannot be considered as a quasi-static problem. The actual simulation is a dynamic process, rendering it necessary to use the theoretical solution of dynamic consolidation for comparison and verification. The definition of the problem is shown in Figure 1. Downward pressure P(t) = 10 kPa is linearly applied on the surface of a 10 m soil column within ∆t = 3 × 10⁻⁷ s, and then kept constant. The normal displacements of the sides and base of the soil column are constrained. The soil surface is drained (i.e., pore pressure p w = 0 kPa). The base and sides are impermeable. Soil is assumed to be linear-elastic with parameters shown in Table 1.
Figure 2 compares the numerical simulation results of the displacement of Point 1 at the surface and the excess pore pressure of Point 2 at the base with the corresponding analytical solution [30]. At the initiation of loading, the instantaneous application of loading causes a compression wave to propagate within the soil column and be reflected at the base, evident from the oscillation of excess pore pressure at Point 2 in Figure 2b, and the initial oscillatory increase in settlement in Figure 2a. As excess pore pressure dissipates, oscillations in both displacement and excess pore pressure damps down and the vertical displacement at Point 1 gradually increases. The numerical results are in excellent agreement with the analytical solution, proving the validity of the implemented coupled formulation. The sign conventions for pore pressure and stress follow soil mechanics conventions, with compression being positive.

3. Numerical Model for Suction Caisson Installation Simulation

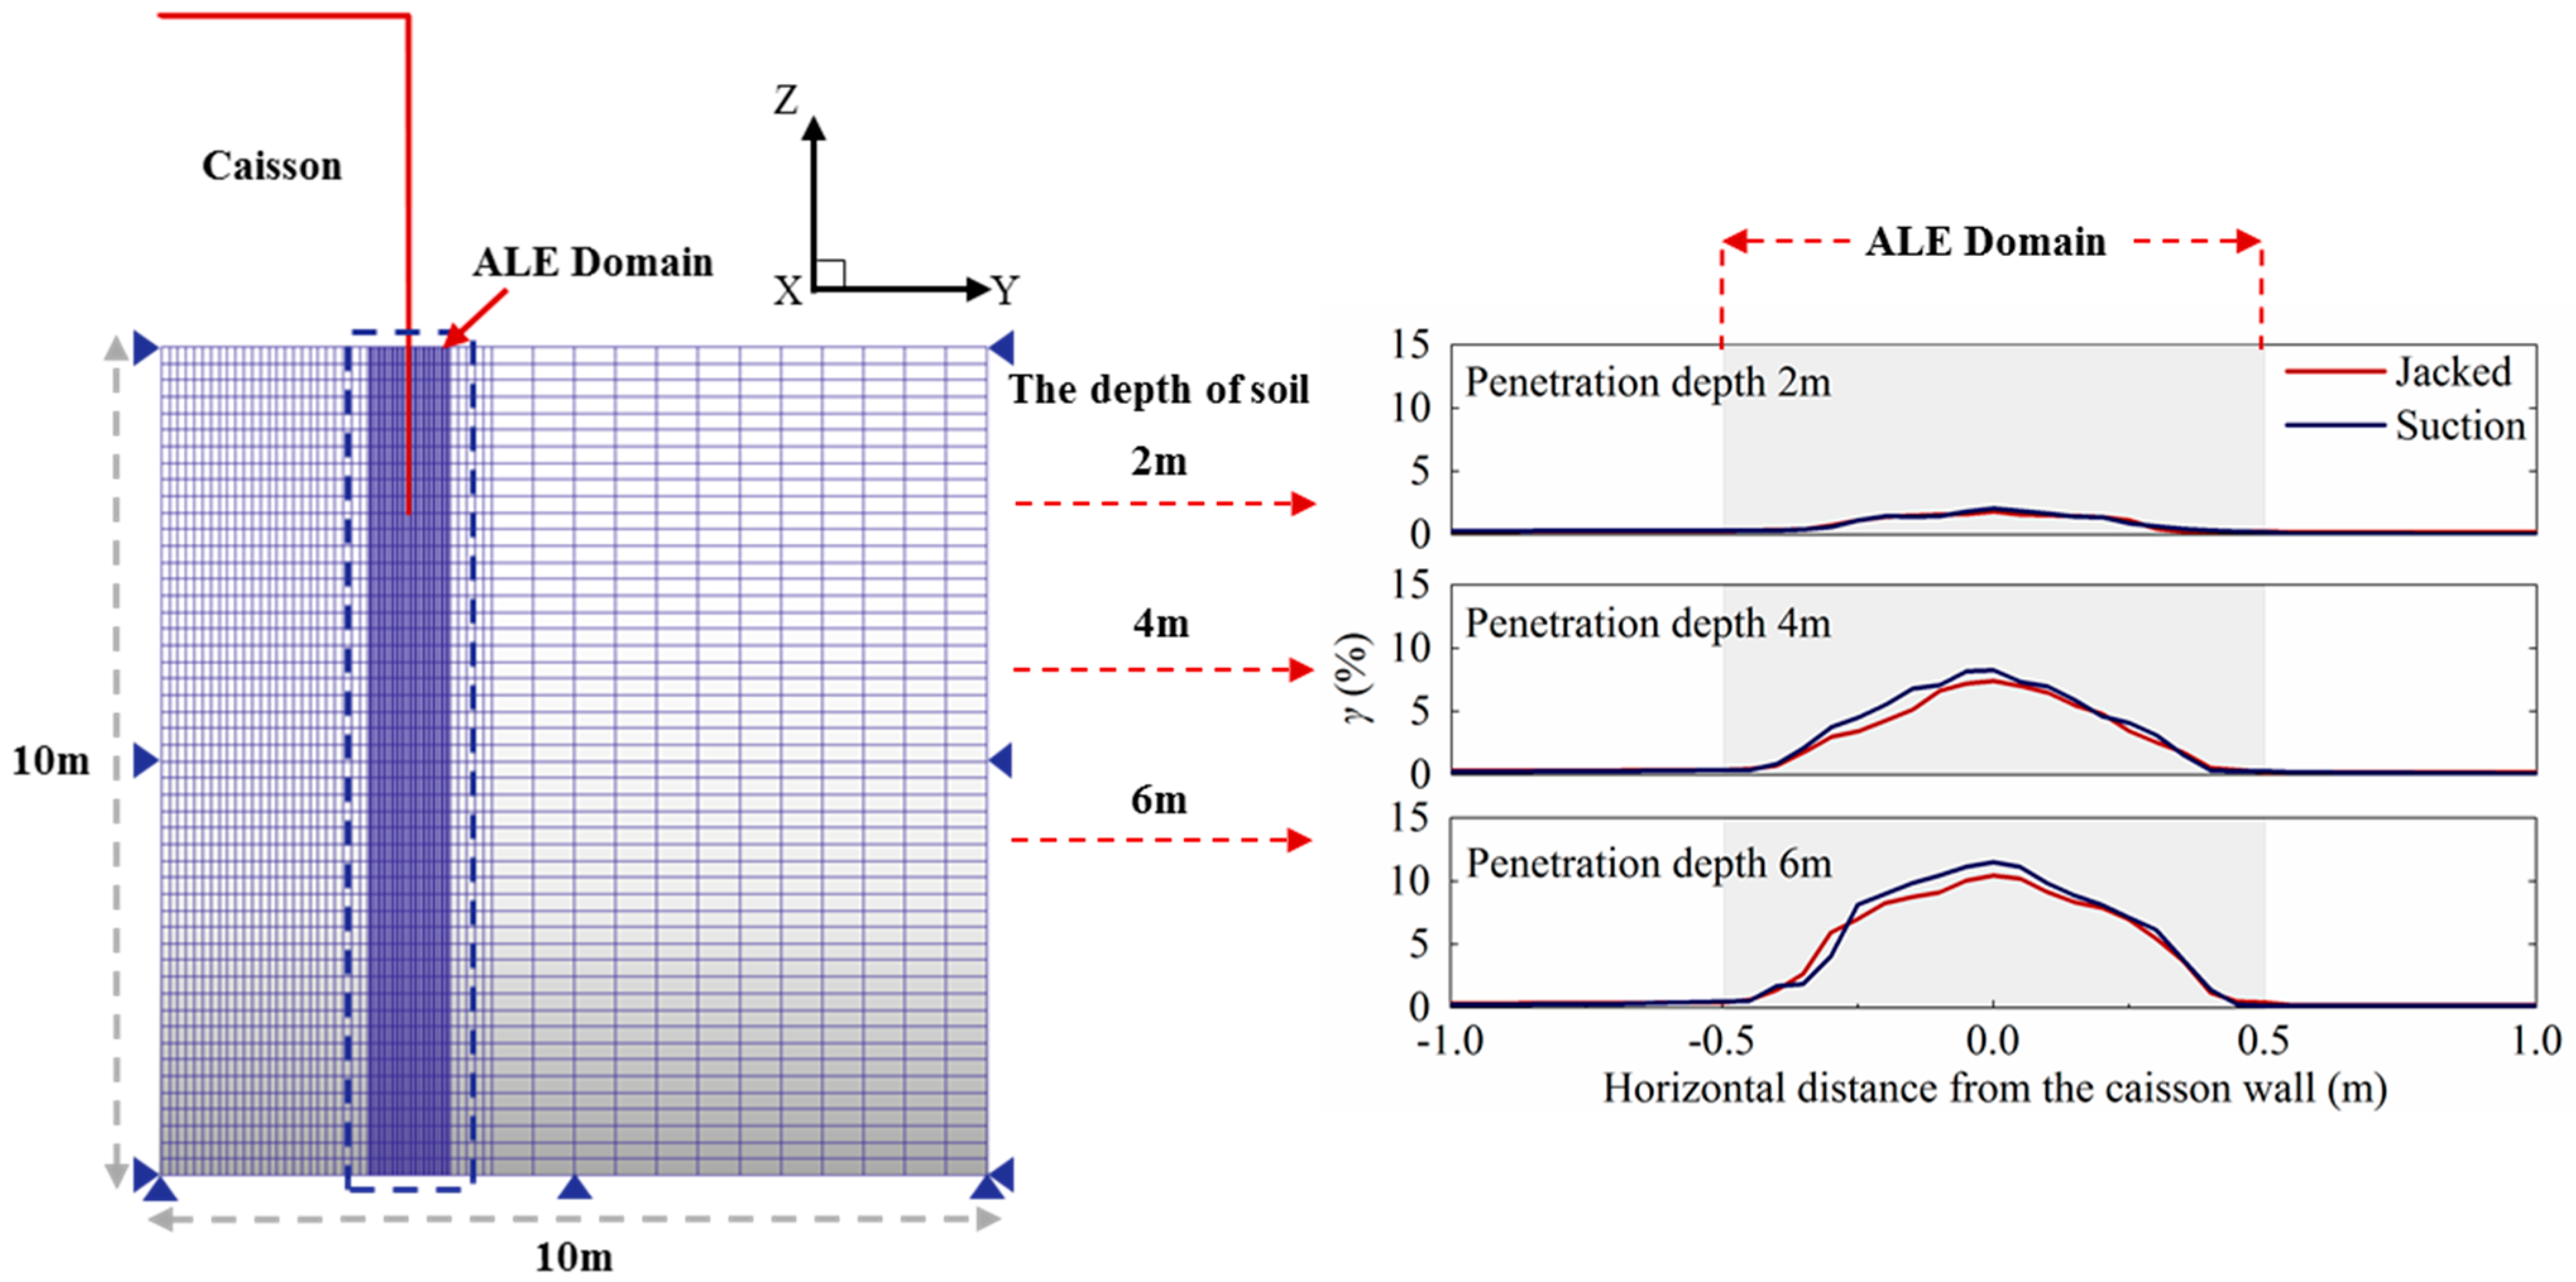
3.1. Numerical Model Setup

Applying the solid-fluid coupled ALE method proposed in the previous section, effective stress numerical analysis of the suction caisson installation process can be conducted. In this study, both jacked penetration and suction penetration processes are analyzed. The experiments of Tran [9] are simulated and analyzed. In prototype scale, the suction caisson’s diameter D = 6 m, height H = 6 m, wall thickness t = 0.03 m, which are adopted in the simulations. Figure 3 shows the axisymmetric model and the corresponding mesh grid. The normal displacement of nodes on the base and outer boundaries are constrained, and the lateral displacement of nodes on the center axis is constrained. The ground surface is drained, while other boundaries are undrained. Jacked penetration is achieved by imposing a velocity boundary condition on the caisson cap. In the suction case, suction is simulated by applying a negative pore pressure boundary condition and a corresponding upward counter-pressure at the surface of the soil inside the caisson, at the same time, applying a corresponding downward pressure on the caisson cap. The suction pressure is applied incrementally until penetration is terminated, when the soil inside the caisson comes into contact with the caisson cap. In this numerical calculation method, since the ALE method cannot impose drained boundary conditions and considering the efficiency of calculation, it is necessary to limit the range of the ALE region, which is only defined in a region within 0.5 m distance of the caisson wall, where the large deformation of the soil occurs, as shown in Figure 3. During the jacked and suction penetration process, when the penetration depth of the suction bucket reaches 2 m, 4 m, and 6 m, the shear strain distribution at the corresponding depths is analyzed. As shown in Figure 3, the large shear strain is mainly concentrated within 0.5 m horizontal distances from the caisson wall which was also verified by Ragni’s PIV tests [31], and the size of the ALE domain is shown to be adequate in the analysis.

3.2. Soil and Contact Model

Soil is simulated using a nonlinear Drucker–Prager model to capture the basic elato-plastic behavior of sand. Strain is decomposed into elastic and plastic components in the model:
ε = ε e + ε p
where ε , ε e , ε p , denote the strain tensor and its elastic and plastic components, respectively. The elastic constitutive behavior follows:
ε e = 1 2 G s + 1 3 K p I
in which s = σ p I is the deviatoric stress tensor, p = 1 3 tr [ σ ] is mean effective stress, with σ being the effective stress tensor. G and K are the elastic shear modulus and bulk modulus, respectively. G and K are functions of sand void ratio and mean effective stress [32]:
K = 1 + e κ 0 P a ( p P a ) m
G = G 0 ( 2.973 e ) 2 1 + e P a ( p P a ) m
where e is the void ratio, P a is the atmospheric pressure, and G 0 , κ 0 and m are material parameters, adopted as 200, 0.008 and 0.5 in this study, respectively, following typical values for sand.
For plastic response, the Drucker–Prager yield surface is adopted:
Φ = 1 2 s : s + η p ξ c
with c being the cohesion, and η and ξ are material parameters which depend on the friction angle   φ :
η = 6 sin φ 3 ( 3 sin φ )
ξ = 6 cos φ 3 ( 3 sin φ )
Associative flow rule is adopted for simplicity:
ε ˙ p = γ ˙ N
where the flow direction N is given by:
N = 1 2 s : s s + η 3 I
The hardening law is defined by Equation (15). H is the isotropic hardening modulus associated with plastic strain:
H = d c d ε p
In the implementation of the model, to avoid numerical difficulties at zero effective stress during seepage, a p m i n is set as the minimum effective confining pressure, thus for p to be:
p = { K ε v e ε v e > 0 p m i n ε v e < 0
with ε v e being the elastic volume strain and p min = 0.5 kPa.
The face-to-face contact pair in Abaqus is used for describing the interface between soil and suction caisson. The normal direction of the contact is impenetrable. Coulomb friction is assumed contact, where the friction coefficient is assumed to be 0.35.
Centrifuge tests of both jacked and suction penetration for caisson installation performed by Tran [9] are simulated in this study. For these simulations, the soil properties reported by Tran [9] are adopted in the simulations, as listed in Table 2. The only exception here is the permeability coefficient k f . k f is reported to be 1 × 10⁻⁴ m/s at 1g level, and as water was directly used in the centrifuge model tests instead of viscous fluid, this corresponds to 1 × 10⁻² m/s in prototype scale, due to the discrepancy between dynamic and consolidation time scales. However, k f = 1 × 10⁻⁴ m/s is adopted in the simulations for computation efficiency. It is shown in later analysis that the influence of permeability on simulation results is negligible for k f > 1 × 10⁻⁴ m/s.

4. Analysis of Jacked and Suction Penetration

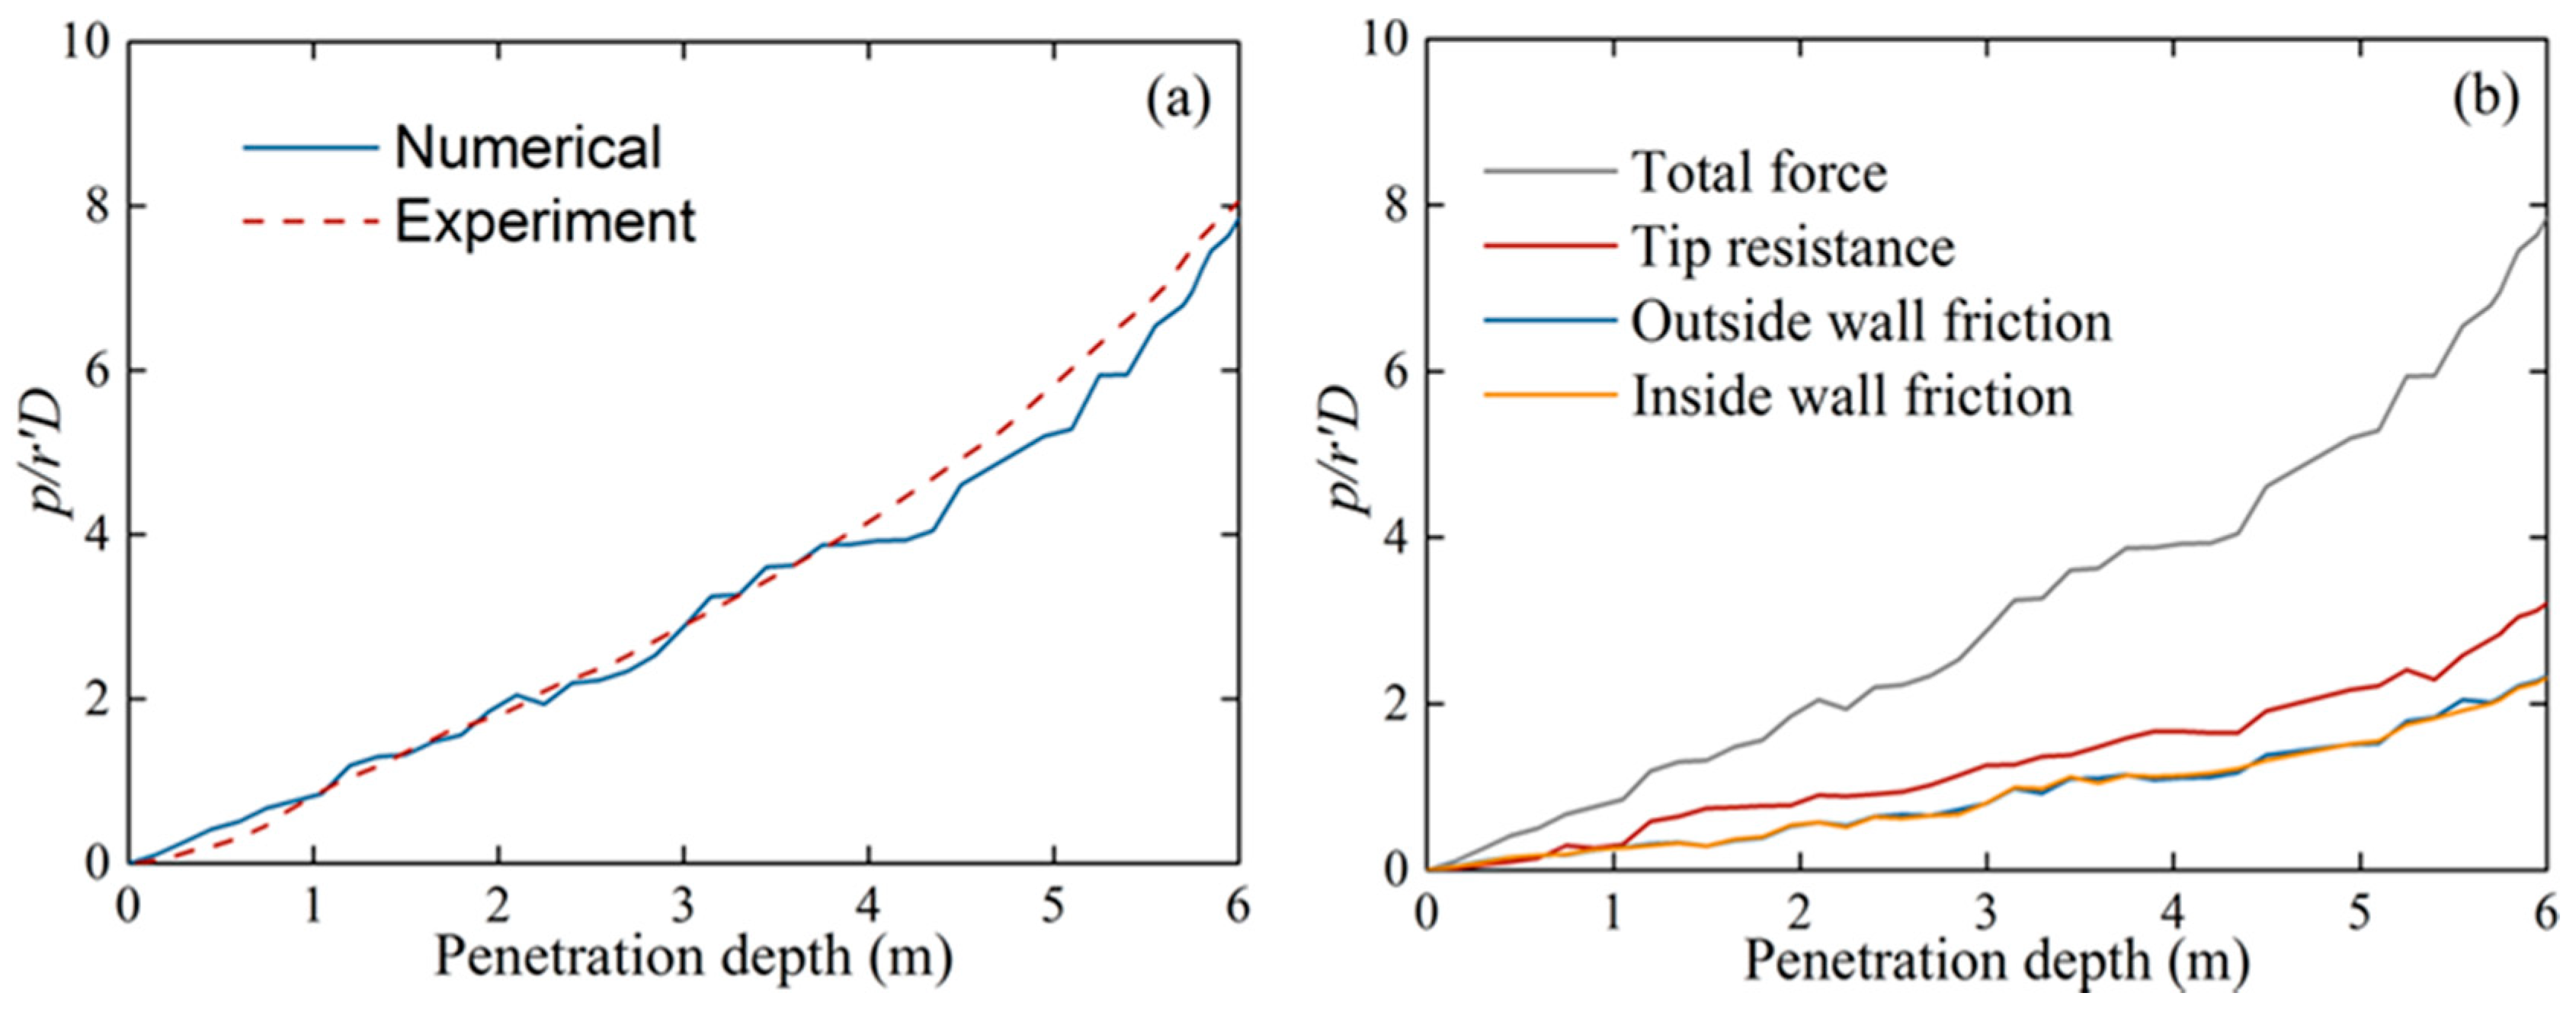
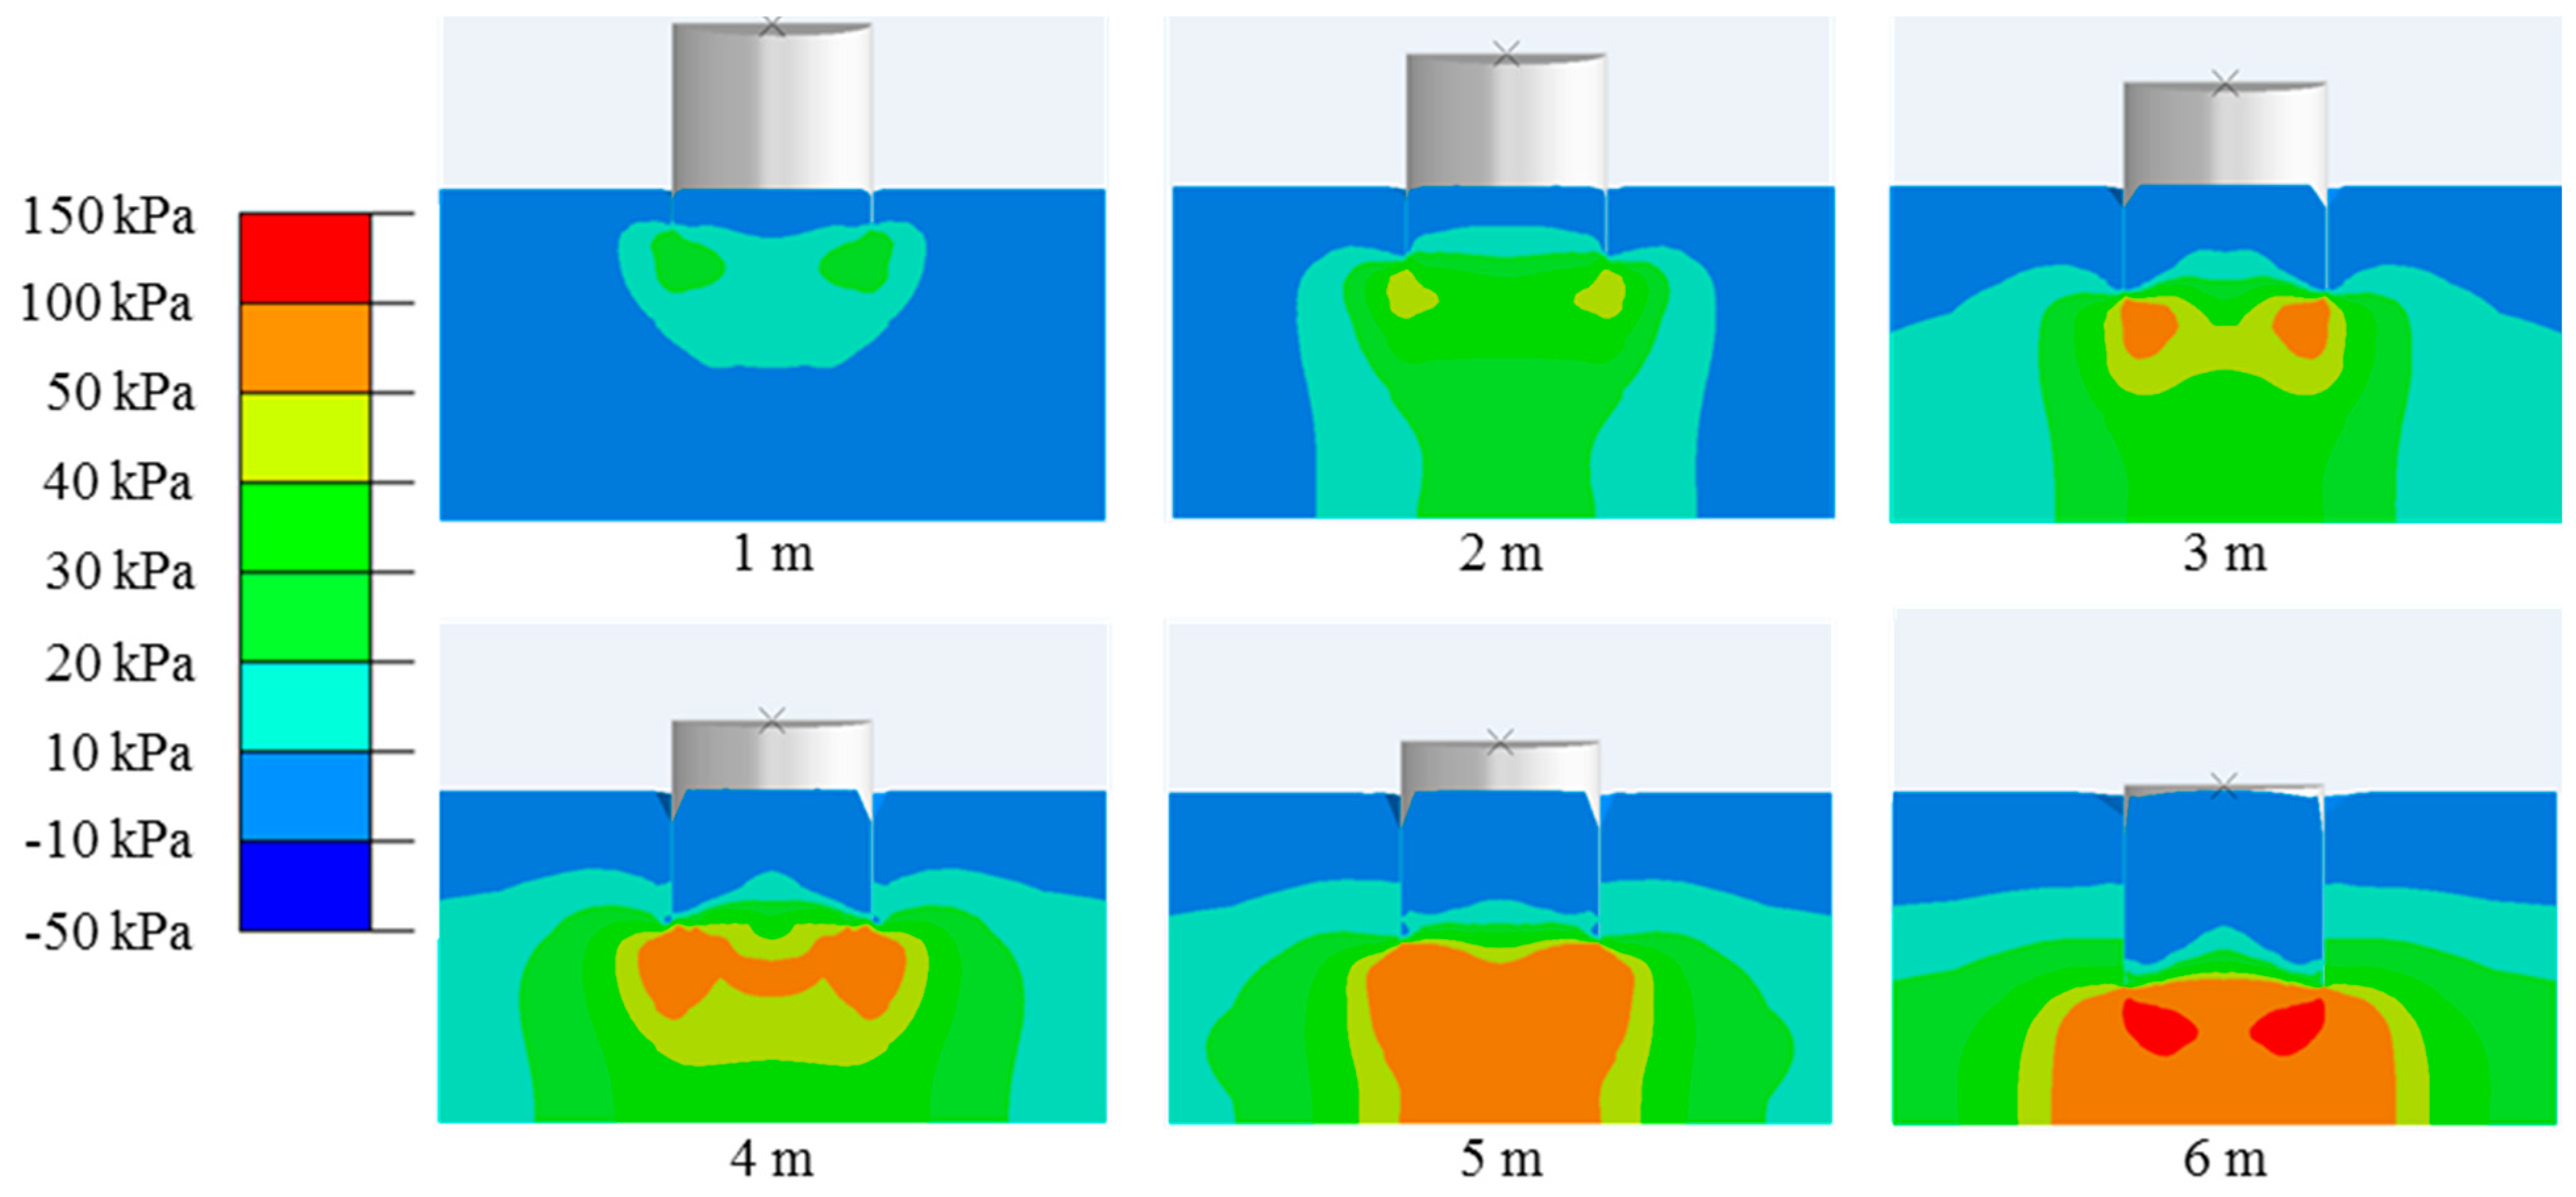
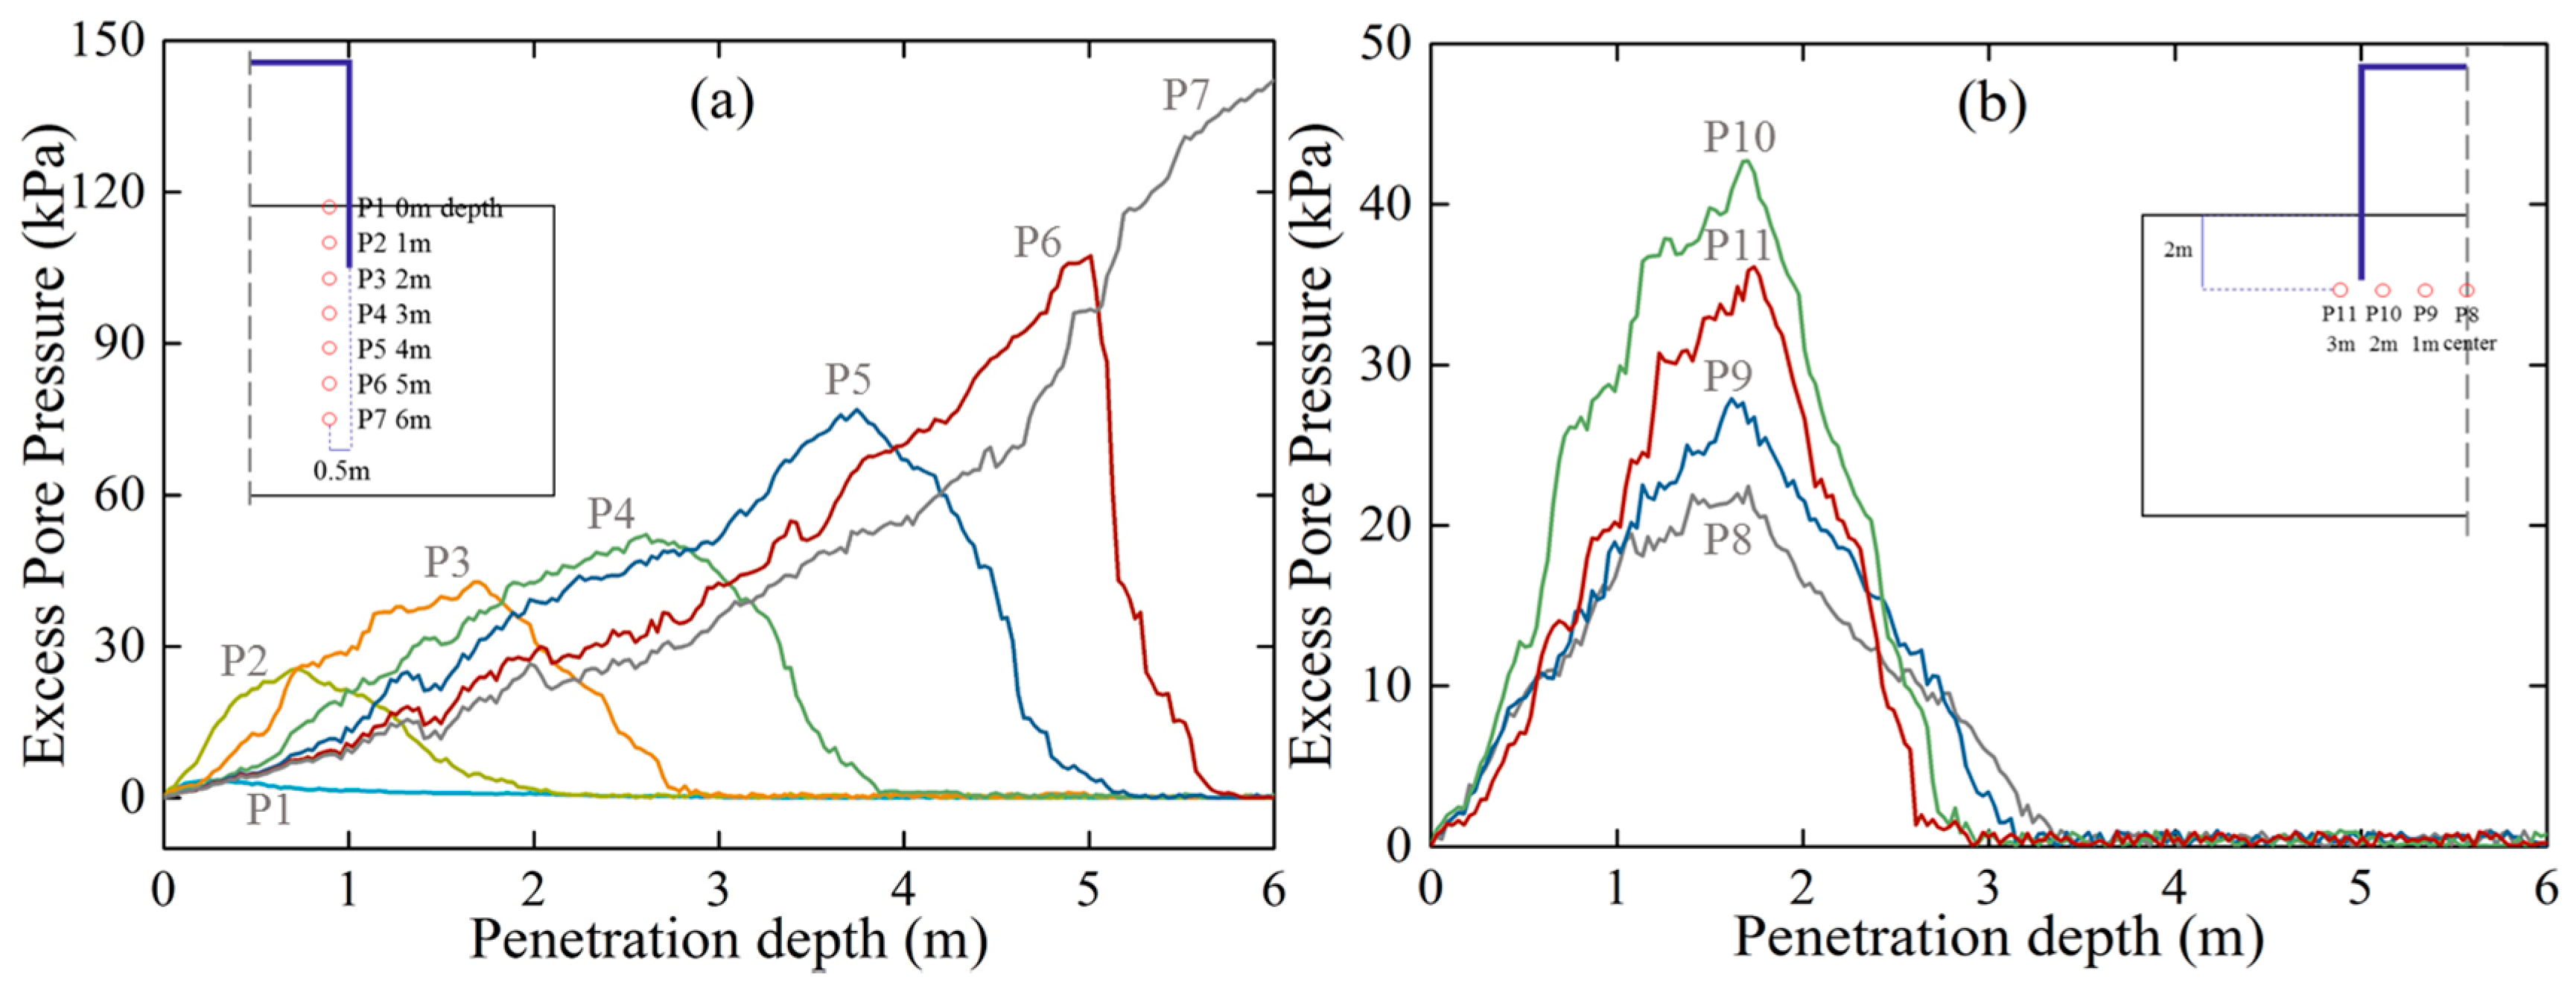
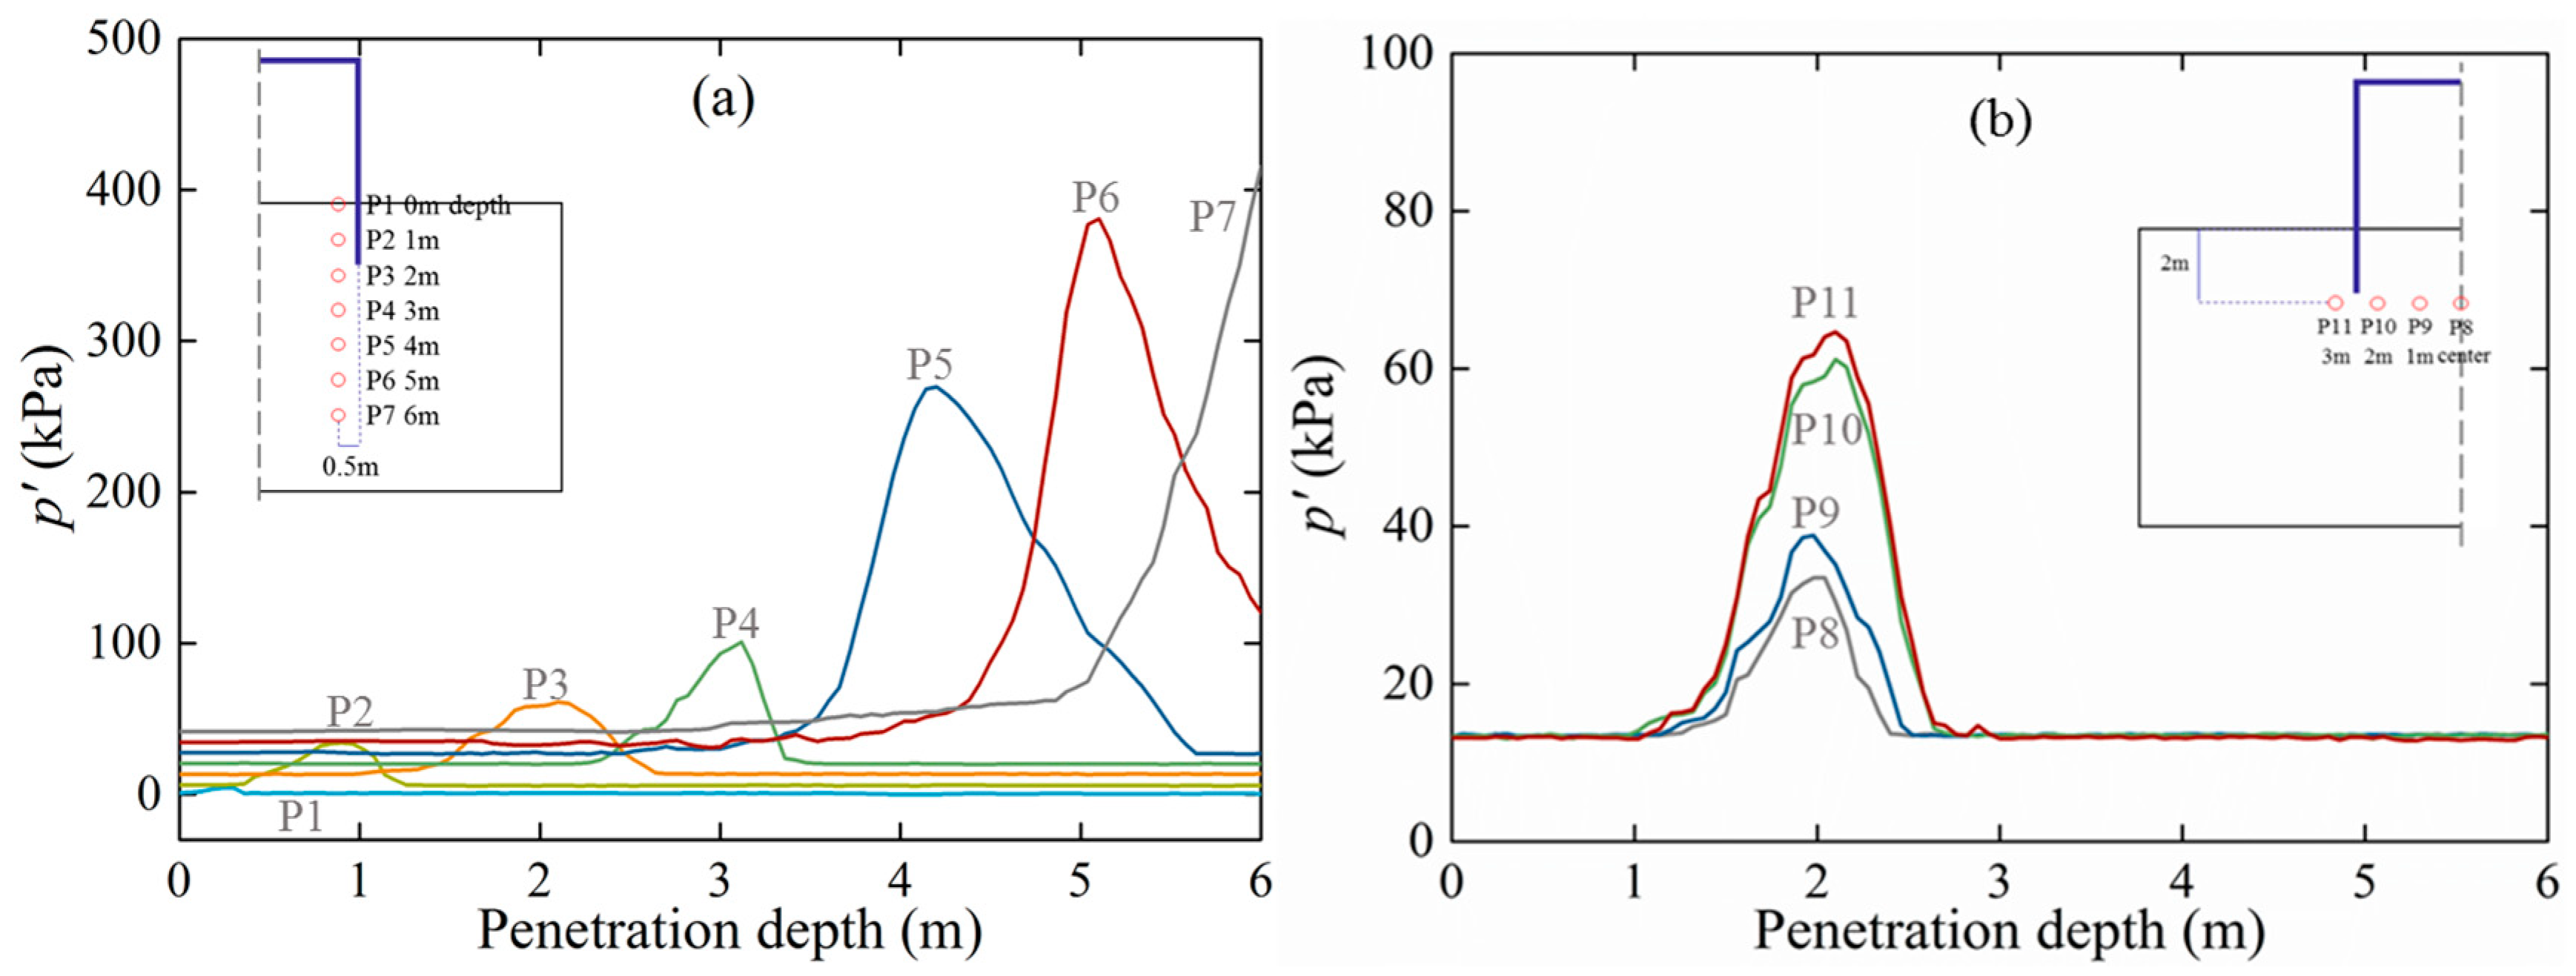
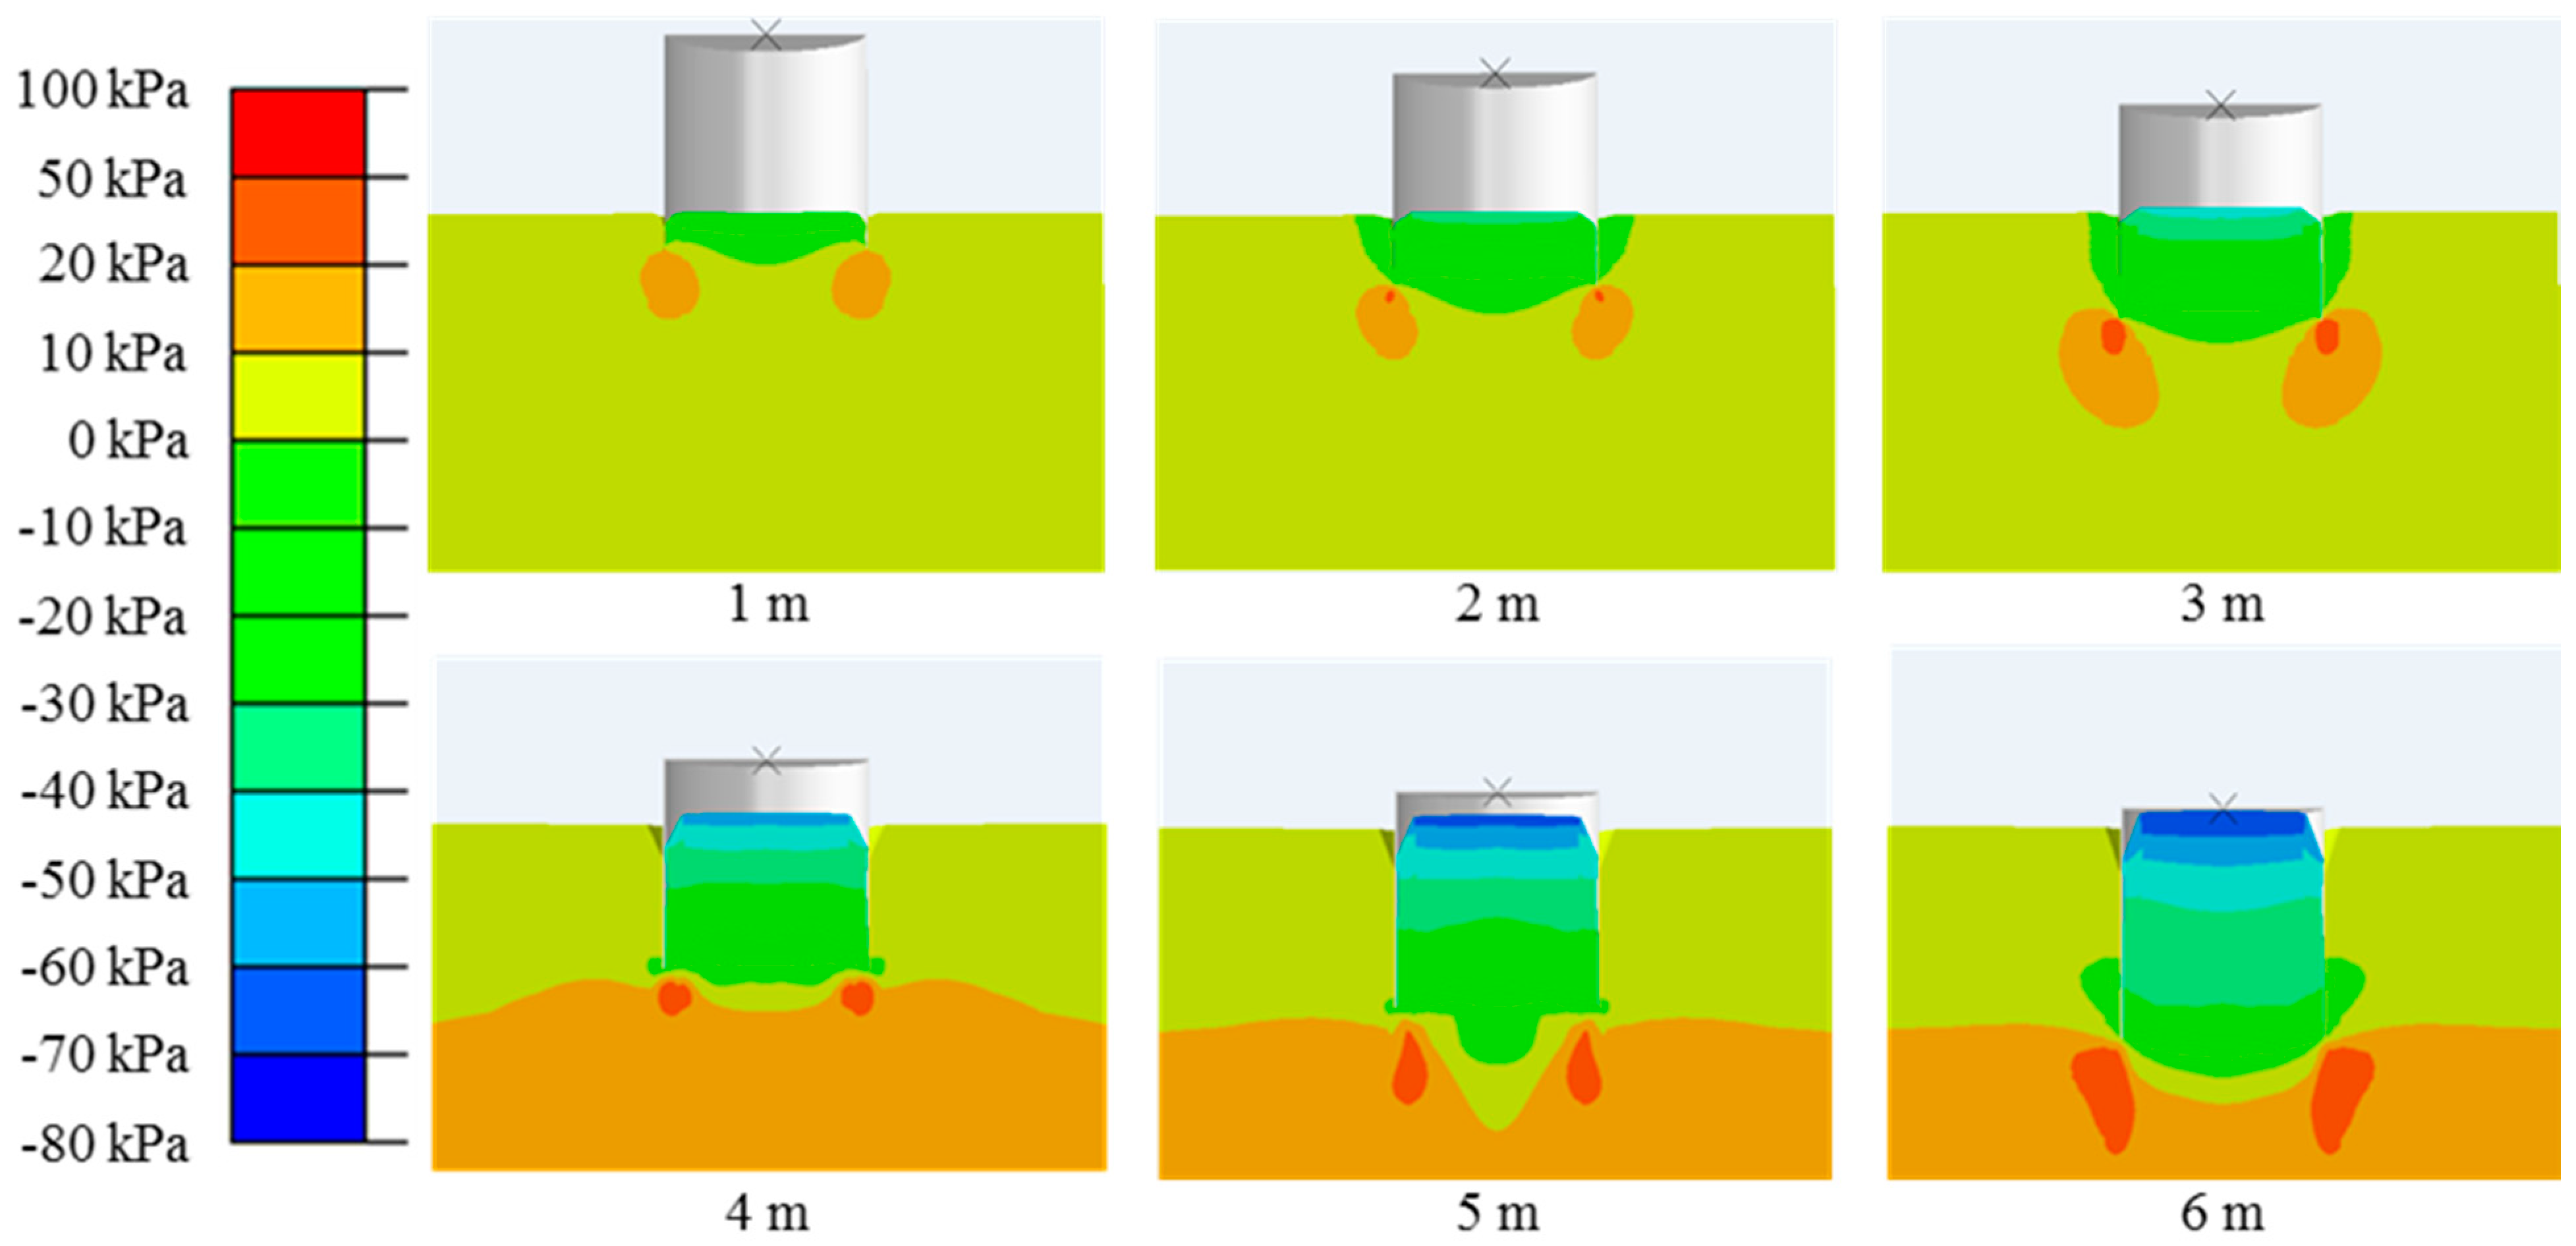
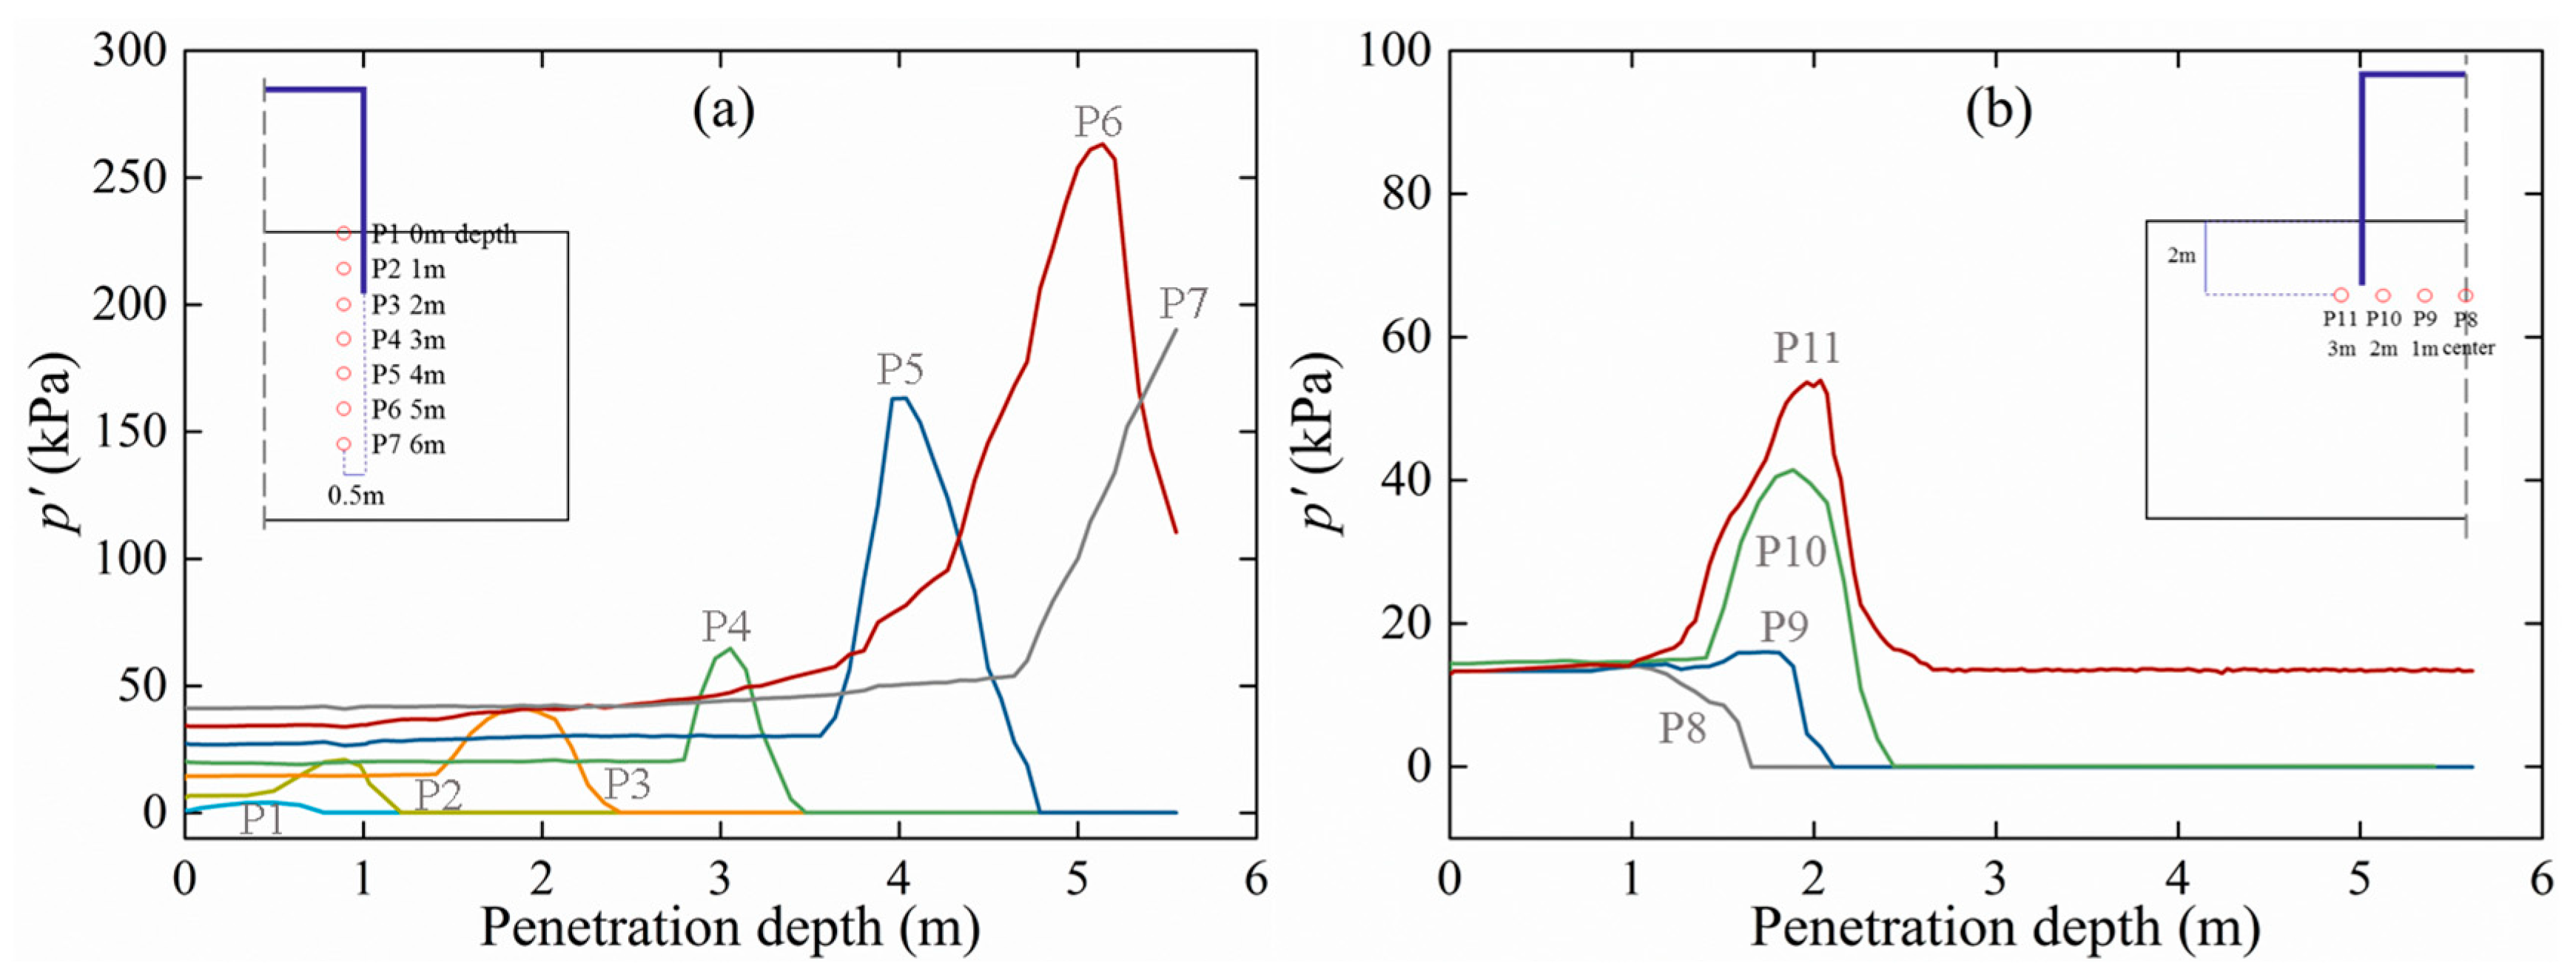
4.1. Jacked Penetration

Simulation of the jacked caisson installation process is first analyzed using the numerical model described in Section 3. The same penetration velocity of 0.01 m/s in the experiment by Tran [9] is adopted in the simulation. Figure 4 shows the penetration resistance obtained via numerical simulation and experiment during the jacked penetration process. The penetration resistance of the suction caisson gradually increases with penetration depth, with the numerical simulation showing good agreement with experimental measurement (Figure 4a). The numerical simulation can be conveniently used to assess the various components contributing to the total penetration resistance, including outside wall friction, inside wall friction, and tip resistance, which is difficult to distinguish in the experiment. Figure 4b shows that during this jacked penetration process, the inside and outside wall friction forces are almost the same, as is expected, while the tip resistance is slightly greater.
Figure 5 shows the excess pore pressure contours at six instances with penetration depths ranging from 1 m to 6 m during jacked penetration. The insertion of the caisson walls compresses the soil to cause excess pore pressure to increase within the soil. The excess pore pressure is most significant at the caisson tip. In the solid-fluid analysis of this study, the local excess pore pressure can dissipate within the sandy ground during penetration, resulting in the distributed excess pore pressure zone around the caisson tip, visible in Figure 5. As the caisson is installed, the excess pore pressure continues to spread to greater areas outside the caisson. The maximum excess pore pressure at the caisson tip can reach approximately 150 kPa.
For further analysis of the excess pore pressure within the ground during jacked penetration, the excess pore pressure evolution with caisson jacked penetration depth at typical points within the soil is plotted in Figure 6. Figure 6a shows that the evolution of the excess pore pressure along a column of points 0.5 m inside the caisson wall (P1–P7). When the caisson penetrates, the excess pore pressure at each point gradually increases and reaches a peak as the soil is compressed by caisson insertion. The peak excess pore pressure is achieved slightly before the caisson tip passes the depth of the point. Once the caisson tip penetrates beyond the depth of the point, the excess pore pressure at the point starts to decrease until it returns to zero. The surface drainage condition dictates that the peak value of excess pore pressure achieved by P1–P7 increases with increasing depth. The excess pore pressure development at a row of points at 2 m depth (P8–P11) is plotted in Figure 6b. Comparison of P8–P10 shows lower excess pore pressure at points farther from the caisson tip. Comparison of P10 and P11, which are at the same distance from the caisson tip, shows that the excess pore pressure accumulation inside of the caisson is greater than that outside of the caisson, due to the better drainage conditions outside the caisson to allow for quicker excess pore pressure dissipation.
The mean effective stress development at the same points as those in Figure 6 are plotted in Figure 7. The increase of effective stress in Figure 7a resembles that of the excess pore pressure in Figure 6a. However, the peak effective stress occurs when the caisson tip reaches the point, whereas the excess pore pressure peaks slightly earlier. The insertion of the caisson walls compresses the soil to increase the total stress, which is first reflected in the increase of excess pore pressure. As the excess pore pressure spreads, the effective stress also increases. When the penetration depth of the caisson exceeds a point in the column, the total stress recovers and the excess pore pressure dissipates. The effective stress begins to decrease to return to its initial value. Figure 7b shows a similar trend of increasing peak mean effective stress from P8 to P10, as the distance from the wall increases, as that of the excess pore pressure in Figure 6b. However, the peak mean effective stress at P11 is slightly greater than that at P10, which is opposite to the trend for excess pore pressure.

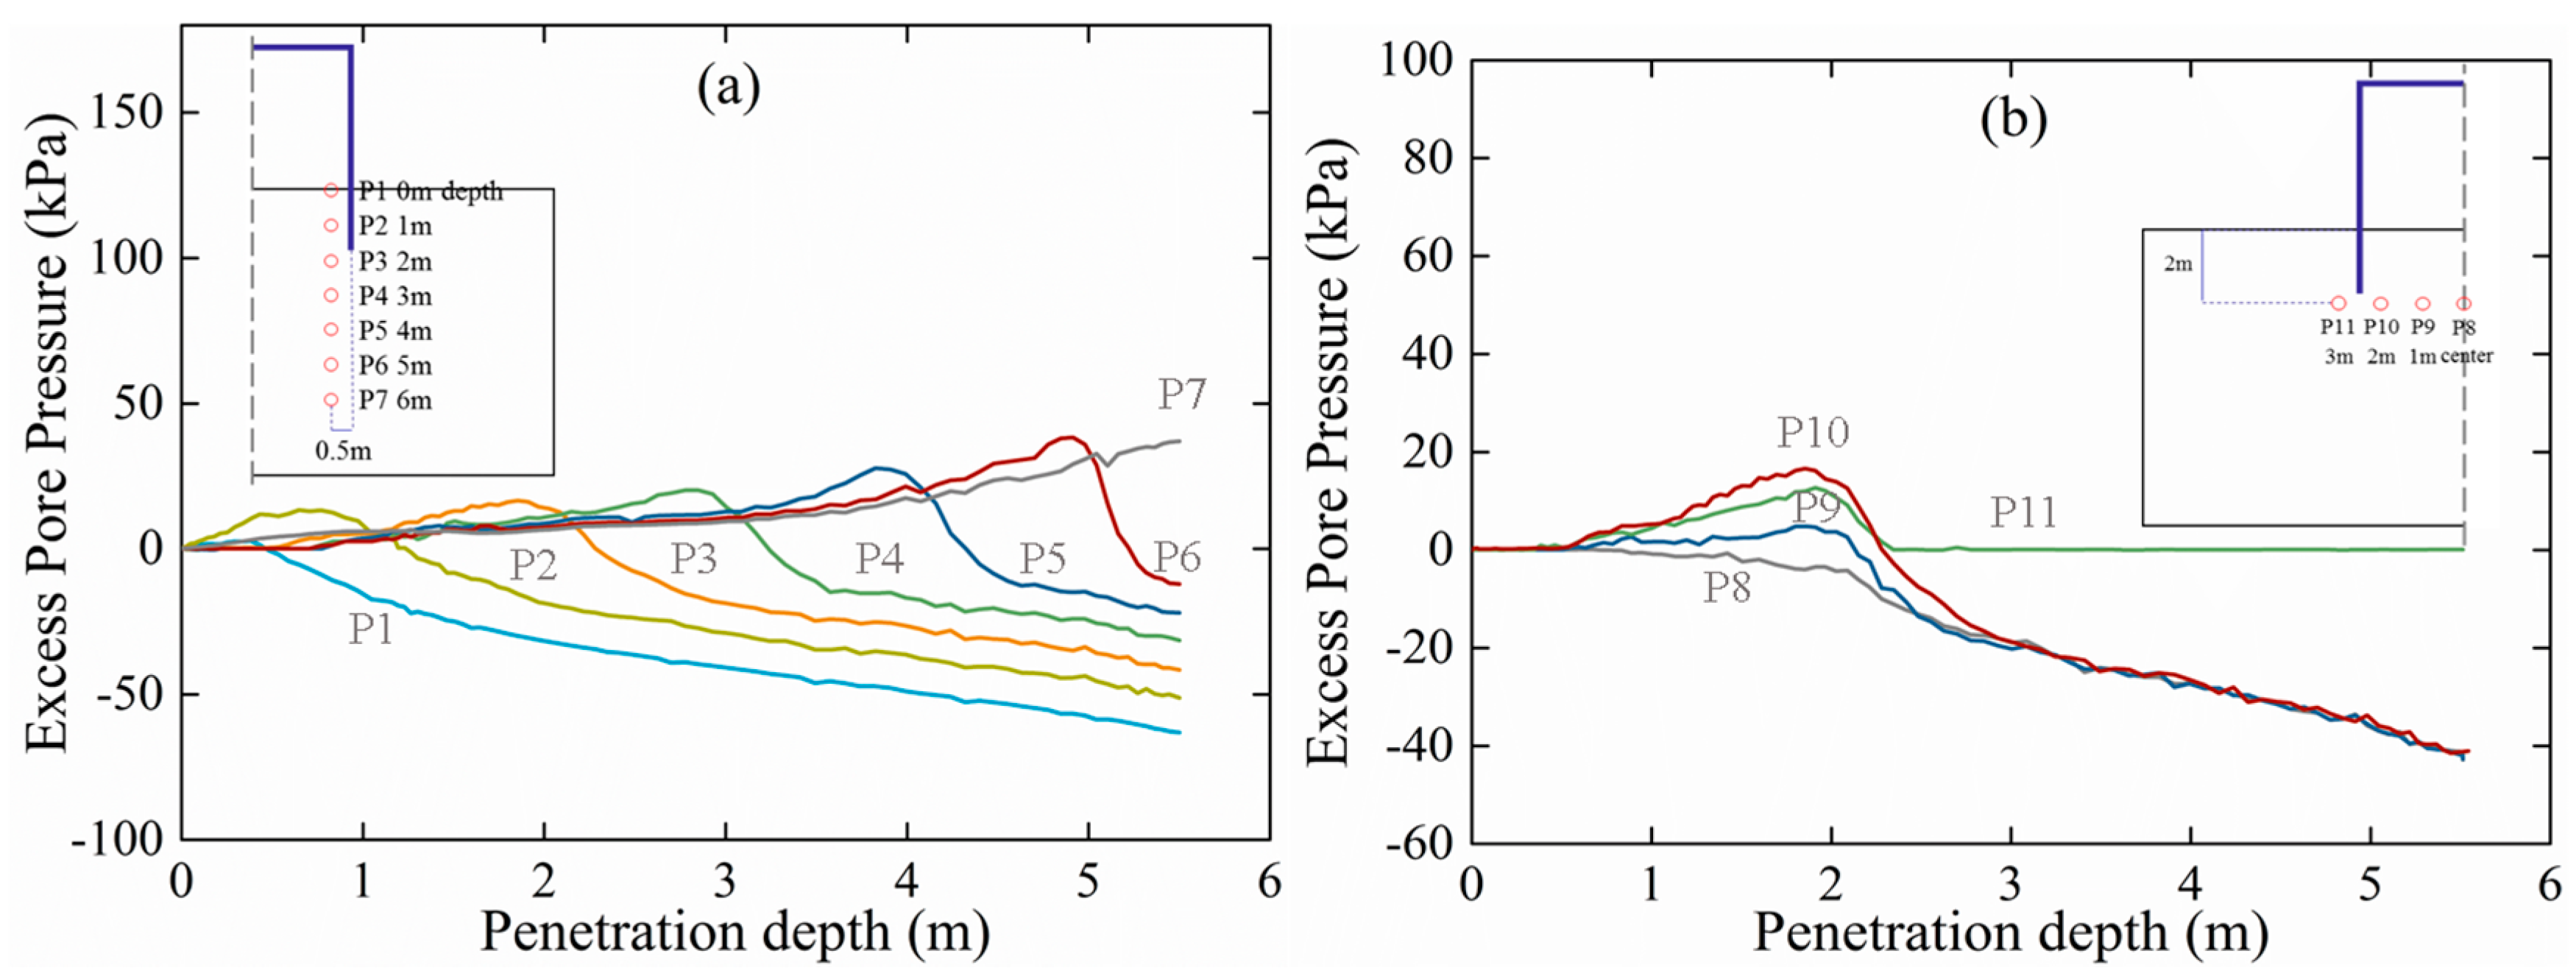
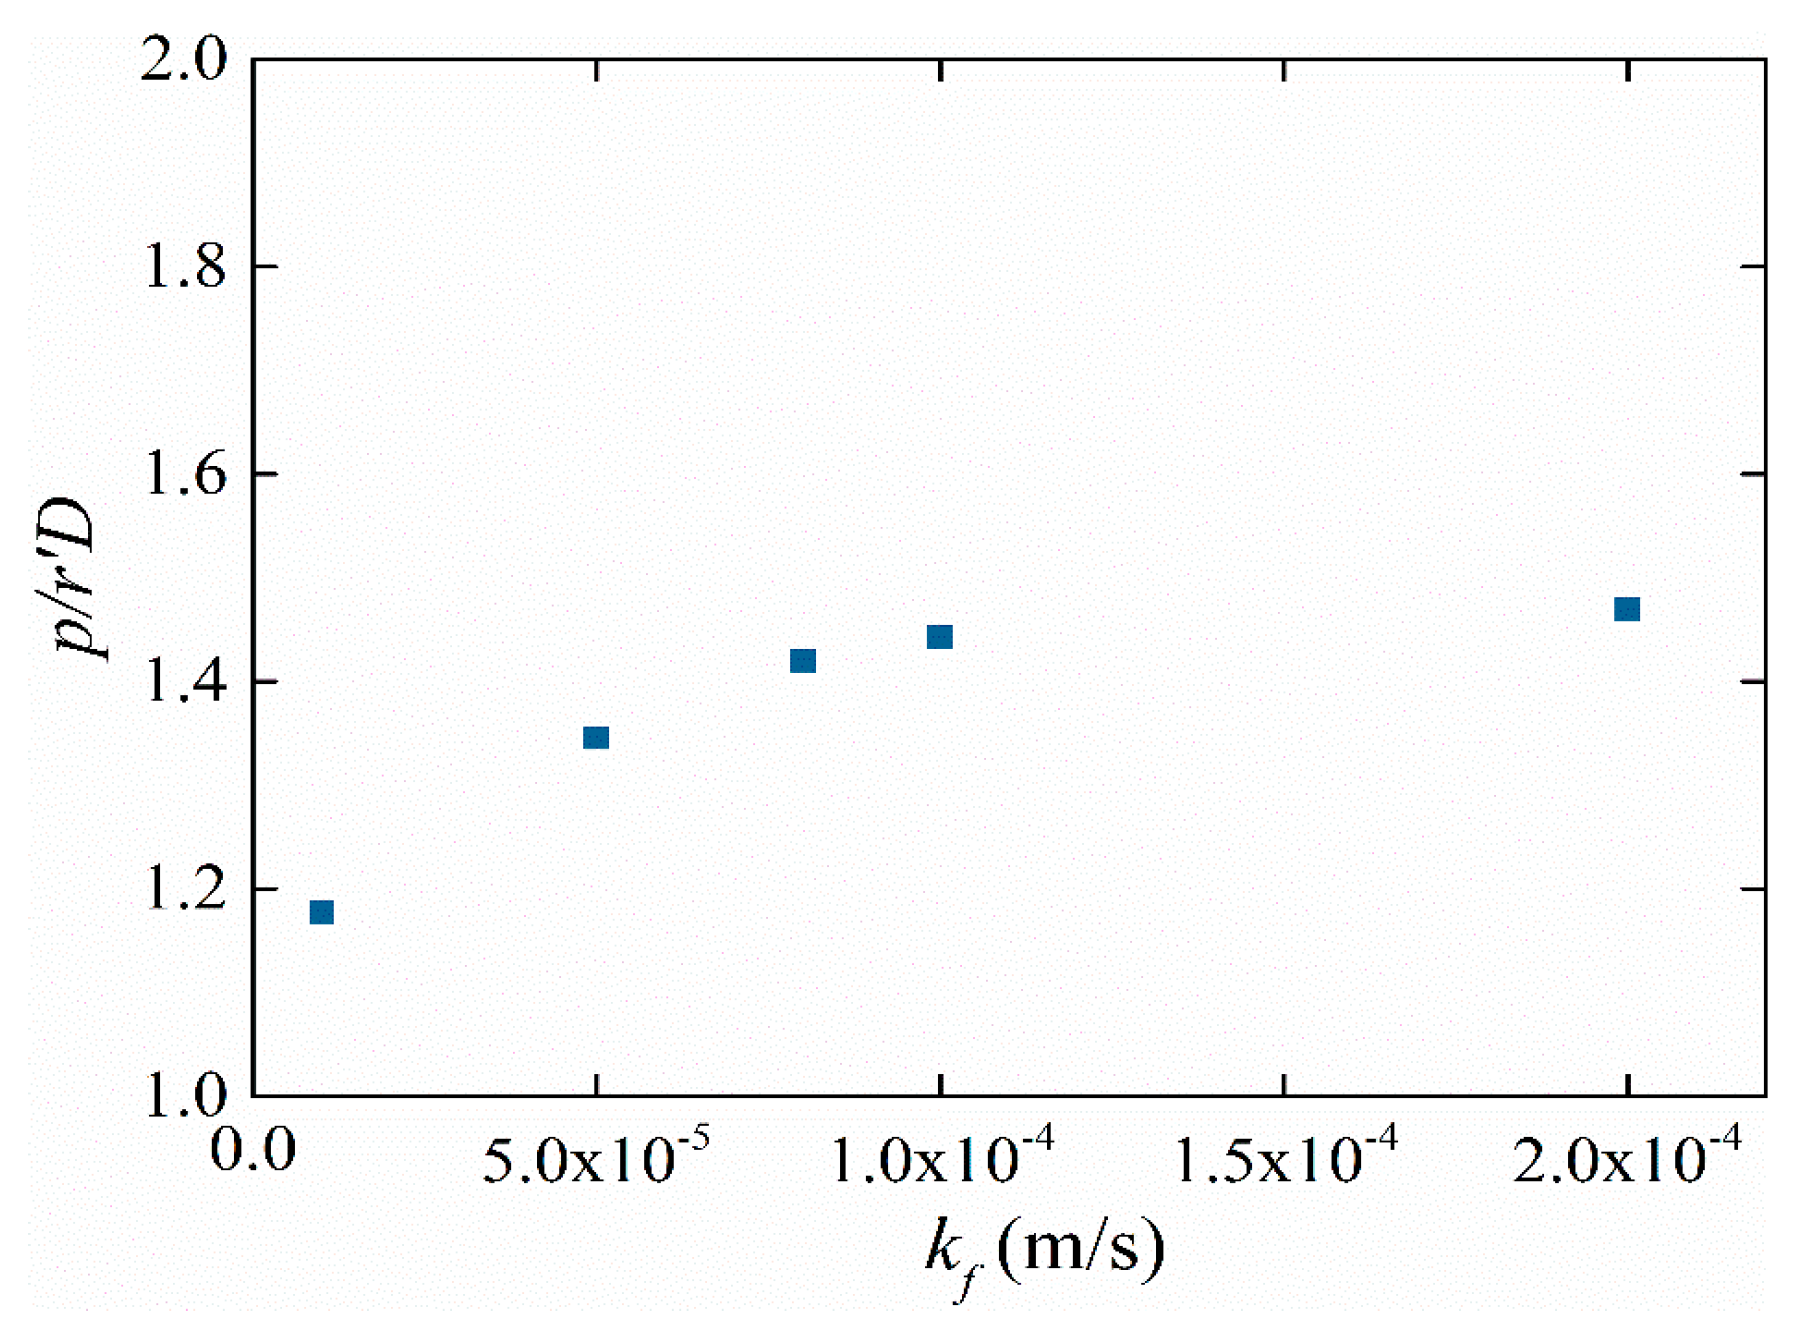
4.2. Suction Penetration

The suction caisson installation process is analyzed by applying an increasing negative pore pressure at the surface of the in-caisson soil. Since the time history of the suction pressure is not provided for the centrifuge experiment, this study assumes that the suction pressure changes linearly within 200 s of the penetration process [33]. Figure 8 shows the penetration resistance obtained via numerical simulation and experiment during the suction penetration process. The penetration resistance of the suction caisson also gradually increases with penetration depth, with the numerical simulation fitting well with experiment measurement (Figure 8a). The components contributing to the total penetration resistance during the suction penetration process is the same as the jacked penetration process, including outside wall friction, inside wall friction, and tip resistance. However, the required penetration resistance during the suction penetration process is significantly lower than the jacked penetration process. Figure 8b illustrates the reason for this phenomenon. The inside and outside friction of the caisson remain almost the same during the jacked penetrating process. Whereas in the suction penetration process, the suction pressure produces seepage inside of the suction caisson, which causes its inside wall friction to be significantly lower than the outside wall friction. At the same time, due to the effect of seepage and soil degradation, the resistance at the caisson tip is also reduced.
Figure 9 shows the excess pore pressure contours at six depths ranging from 1 m to 6 m during the suction penetration. Harireche et al. [34] also analyzed the seepage field change during the installation of the suction caisson, but only considered fluid-solid coupling and did not consider large penetration deformation. In comparison, the method in this study can simulate the large deformation of the suction caisson penetration along with the pore pressure caused by the penetration of the suction barrel can be considered. With the gradual penetration of the suction caisson, on one hand, the insertion of the caisson walls compresses the soil to generate an increasing total stress which is initially taken up by the positive pore pressure at the caisson tip. As the excess pore pressure spreads, the effective stress also increases. When the penetration depth of the caisson exceeds a point in the column, the total stress recovers and the excess pore pressure dissipates. The effective stress begins to decrease to return to its initial value. On the other hand, due to the suction pressure gradually applied to the surface of the soil in the caisson, the negative pore pressure continuously spreads downward into the in-caisson soil. When the negative pore pressure spreads to the end of the caisson, it begins to diffuse from the inside of the caisson to the outside. Due to the hydraulic gradient and subsequent seepage inside the suction caisson in Figure 9, the effective stress of the soil in the caisson will decrease, which causes the inside wall friction to be significantly lower than the outside wall friction and the tip resistance to be reduced.
The excess pore pressure evolution with caisson suction penetration depth at typical points within the soil is plotted in Figure 10. Figure 10a shows that the evolution of the excess pore pressure along a column of points 0.5 m inside the caisson wall (P1–P7). When the caisson penetrates, the excess pore pressure at each point gradually increases and reaches a peak as the soil is compressed by caisson insertion. The peak value of the excess pore pressure increases from about 13.9 kPa at P2 to 36.7 kPa at P7. The peak value change of P1 is not obvious due to the suction pressure boundary condition. Once the caisson tip penetrates beyond the depth of the point, the excess pore pressure at the point starts to decrease and is mainly affected by the suction pressure. The surface negative pore pressure condition dictates that the closer the element in the caisson is to the soil surface, the more it is affected by suction pressure and the greater the reduction of its excess pore pressure. The excess pore pressure development at a row of points at 2 m depth (P8–P11) is plotted in Figure 10b. Comparison of P8–P10 shows the lower excess pore pressure at points farther from the caisson tip. Once the caisson has penetrated more than 2 m, the excess pore pressure of P8–P10 all begins to drop significantly. Under the influence of suction pressure, the excess pore pressure of P8–P10 tends to be consistent and begins to decrease linearly until −41 kPa. Once the caisson tip penetrates beyond the depth of the P11, the excess pore pressure at the point outside the caisson starts to decrease until it returns to zero. There is no obvious negative excess pore pressure like P10. The influence of suction pressure is mainly concentrated on the soil inside the caisson.
The mean effective stress development at the same points as those in Figure 10 are plotted in Figure 11. Comparing P1–P7 in Figure 11a, in the process of suction penetration, the effective stress increases due to the penetration of the suction caisson. The effective stress peak value increases from 20 kPa at P2 to 263 kPa at P6. The caisson cannot reach P7 due to the soil plug effect, so the effective stress at this point does not reach its peak. Seepage is generated in the soil inside caisson under the influence of the suction pressure. This seepage generates an upward force, which causes the effective stress of the soil in the suction caisson to significantly decrease. At 0–4 m depth of the soil in the caisson, the effective stress can reach zero, i.e., liquefaction state [35]. In this case, a soil plug of 0.45 m is formed under the action of the seepage force in the simulation, while the actual measured soil plug in the centrifuge test was 0.59 m, showing relatively good agreement. Wang et al. [19] also used the Abaqus ALE method to analyze the change of penetration resistance and soil plug, but only considered the large deformation during the penetration process. The total stress method is only suitable for the nearly undrained process in clay, and cannot be applied to installation in sand. It cannot take into consideration the change of inside wall friction which caused seepage during the suction penetration process in sand. Using the method proposed in this study, further research can be conducted to investigate various aspects of the installation process, including the forming of soil plugs. In future studies, high fidelity constitutive models may be implemented for soil for more detailed analysis. Figure 11b shows a trend of increasing peak mean effective stress from P8 to P10 as the distance from the wall increases. The peak mean effective stress at P11 is obviously greater than that at P10, as the outside soil is not affected by the suction-induced effective stress change. Once the penetration depth of the caisson exceeds 2 m, the effective stress at P11 returns to its initial value, and the effective stress at P10 is lower than its initial effective stress level under the influence of seepage.
The difference in installation method can cause changes in the soil modulus, especially inside the caisson, which in turn may affect the caisson bearing capacity and the natural frequency of the supporting offshore wind turbine [36]. Figure 12 shows the distribution of the shear modulus of points 1–11 at the final depth of jacked and suction penetration. The comparison shows distinct soil modulus for the two installation methods. During the suction penetration process, under the influence of suction, the effective stress can reach zero at 0–4 m depth of the soil in the caisson, thereby significantly reducing the soil modulus in the suction caisson compared with the jacked penetration process (Figure 12a). During the jacked penetration process, the shear modulus of the soil inside and outside the suction caisson are the same (Figure 12b). For the process of suction penetration, shear modulus inside the suction caisson is significantly lower than that of the soil outside the suction caisson.
Strictly speaking, the permeability coefficient should be 1 × 10⁻² m/s; to speed up calculation, the permeability coefficient is artificially reduced and it is demonstrated that the reduction of the permeability coefficient has little effect on penetration resistance when the permeability coefficient exceeds 1 × 10⁻⁴ m/s. As shown in Figure 13, the penetration resistance of the suction caisson at the final penetration depth of 5.55 m increases with increasing permeability, but gradually stabilizes after the permeability coefficient increases to 8 × 10⁻⁵ m/s. This is because when the permeability is great enough, diffusion of excess pore pressure is fast enough in the soil that a further increase in permeability only affects the amount of seepage flow but not soil response. At the simulation permeability coefficient of 1 × 10⁻⁴ m/s, the seepage flow is 0.4 cm3/s, which is approximately 1/100 that of the centrifuge test [9], corresponding to the 1:100 ratio between simulation and experiment permeability coefficients. This shows that the permeability coefficient adopted in this study is reasonable for the simulations.

5. Conclusions

An ALE large deformation solid-fluid coupled FEM method was developed in this study to investigate the changes in suction pressure and the seepage field during the process of the suction caisson installation in sand. Upon validation of the solid-fluid coupling formulation and implementation using a dynamic consolidation example, the numerical method was applied to the simulation of caisson installation in sand.
The centrifuge tests conducted by Tran [9] on both jacked penetration and suction penetration were simulated using the effective stress-based approach, showing excellent agreement between the measured and simulated penetration resistance. As observed in the experiments, the simulation showed that the penetration resistance is significantly smaller under suction installation. In addition, the numerical simulation allowed for the decomposition of penetration resistance into tip resistance, outside wall friction, and inside wall friction. Results showed that the reduction in penetration resistance in suction installation is mostly attributed to decrease in inside wall friction and tip resistance.
Analysis of the excess pore pressure and effective stress in the soil in the solid-fluid coupled analysis provided insight and explanation for the difference in penetration resistance for the two types of installation processes. In jacked penetration, the installation of the caisson causes increase in excess pore pressure and mean effective stress near the caisson tip. In contrast, during suction penetration, the suction applied within the caisson causes negative excess pore pressure to be formed in the in-caisson soil, generating upward seepage, which induces mean effective stress reduction. The mean effective stress can reach zero in the in-caisson soil. This reduction in effective stress significantly reduces the inside wall friction and tip resistance. It also causes the rise of the soil surface within the caisson, forming a soil plug, which limits the penetration of the caisson.
The significance of this study is that it is, to the best of our knowledge, the first study that uses solid-fluid large deformation analysis to investigate the installation process of suction caissons. Compared with existing studies that either adopt large strain formulation or solid-fluid coupling alone, this integrated analysis is much more realistic, and shows excellent simulations of penetration resistance, excess pore water pressure, and seepage flow under one unified framework. The analysis in this study is a preliminary effort in investigating solid-fluid coupling influences on suction caisson installation. Using the method proposed in this study, further research can be conducted to investigate various aspects of the installation process, including the forming of soil plugs. In future studies, high fidelity constitutive models may be implemented for soil for more detailed analysis.

Author Contributions

Literature, H.W. and R.W.; figures, H.W. and R.W.; study design, H.W., R.W. and J.-M.Z. All authors have read and agreed to the published version of the manuscript.

Funding

This study was funded by the National Natural Science Foundation of China (grant number 52022046 and grant number 52038005) and the State Key Laboratory of Hydroscience and Hydraulic Engineering (grant number 2021-KY-04).

Institutional Review Board Statement

Not applicable.

Informed Consent Statement

Not applicable.

Data Availability Statement

The data presented in this study are available on request from the corresponding author.

Conflicts of Interest

The authors declare no conflict of interest.

References

  1. Colliat, J.L.; Dendani, H. Girassol: Geotechnical design analyses and installation of the suction anchors. In Proceedings of the SUT International Conference on Offshore Site Investigation and Geotechnics, London, UK, 26–28 November 2002. [Google Scholar]
  2. Tjelta, T.I. Suction piles: Their position and application today. In Proceedings of the 11th International Offshore and Polar Engineering Conference, Stavanger, Norway, 17–22 June 2001. [Google Scholar]
  3. Feld, T.; Rasmussen, J.L.; Sørensen, P.H. Structural and economic optimization of offshore wind turbine support structure and foundation. In Proceedings of the 18th International Conference on OMAE, St. John’s, NL, Canada, 11–16 July 1999. [Google Scholar]
  4. Feld, T. Suction Buckets: A New Innovative Foundation Concept, Applied to Offshore Wind Turbines. Ph.D. Thesis, Aalborg University, Aalborg, Denmark, 2001. [Google Scholar]
  5. Senpere, D.; Auvergne, G.A. Suction anchor piles—A proven alternative to driving or drilling. In Proceedings of the Offshore Technology Conference, Houston, TX, USA, 3–6 May 1982. [Google Scholar]
  6. Hogervorst, J.R. Field trails with large diameter suction piles. In Proceedings of the Offshore Technology Conference, Houston, TX, USA, 5–8 May 1980. [Google Scholar]
  7. Allersma, H.G.B.; Hogervorst, J.R.; Pimoulle, M. Centrifuge modelling of suction pile installation using a percussion technique. In Proceedings of the 11th International Offshore and Polar Engineering Conference, Stavanger, Norway, 17–22 June 2001. [Google Scholar]
  8. Allersma, H.G.B. Centrifuge research on suction piles: Installation and bearing capacity. In Proceedings of the International Conference on Foundations: Innovations, Observations, Design and Practice, Dundee, UK, 2–5 September 2003. [Google Scholar]
  9. Tran, M.N. Installation of Suction Caissons in Dense Sand and the Influence of Silt and Cemented Layers. Ph.D. Thesis, University of Sydney, Sydney, Australia, 2005. [Google Scholar]
  10. Chen, W.; Zhou, H.; Randolph, M.F. Effect of installation method on external shaft friction of caissons in soft clay. J. Geotech. Geoenviron. Eng. 2009, 135, 605–615. [Google Scholar] [CrossRef]
  11. Byrne, B.W.; Houlsby, G.T. Experimental investigations of the response of suction caissons to transient combined loading. J. Geotech. Geoenviron. Eng. 2004, 130, 240–253. [Google Scholar] [CrossRef] [Green Version]
  12. Erbrich, C.T.; Tjelta, T.I. Installation of bucket foundations and suction caissons in sand-geotechnical performance. In Proceedings of the Offshore Technology Conference, Houston, TX, USA, 3–6 May 1999. [Google Scholar]
  13. Kim, J.H.; Kim, D.S. Soil plug heave induced by suction bucket installation on sand via centrifuge model tests. Mar. Georesources Geotechnol. 2020, 38, 1245–1256. [Google Scholar] [CrossRef]
  14. Guo, Z.; Wang, L.; Yuan, F.; Li, L. Model tests on installation techniques of suction caissons in a soft clay seabed. Appl. Ocean. Res. 2012, 34, 116–125. [Google Scholar] [CrossRef]
  15. Panagoulias, S.; van Dijk, B.F.J.; Drummen, T.; Askarinejad, A.; Pisanò, F. Critical suction pressure during installation of suction caissons in sand. In Proceedings of the 8th International Conference on Offshore Site Investigation & Geotechnics, London, UK, 12–14 September 2017. [Google Scholar]
  16. Andersen, K.H.; Jostad, H.P. Shear strength along outside wall of suction anchors in clay after installation. In Proceedings of the 12th International Offshore and Polar Engineering Conference, Cupertino, CA, USA, 26–31 May 2002. [Google Scholar]
  17. Cao, J.; Philips, R.; Popescu, R.; Audibert, J.M.E.; Al-Khafaji, Z. Numerical analysis of the behavior of suction caissons in clay. In Proceedings of the 12th International Offshore and Polar Engineering Conference, Cupertino, CA, USA, 26–31 May 2002. [Google Scholar]
  18. Zhou, H.; Randolph, M.F. Numerical simulation of caissons installation in clay by suction and by jacking. In Proceedings of the 16th International Offshore and Polar Engineering Conference, San Francisco, CA, USA, 28 May–2 June 2006. [Google Scholar]
  19. Wang, Y.; Zhu, X.; Lv, Y.; Yang, Q. Large deformation finite element analysis of the installation of suction caisson in clay. Mar. Georesources Geotechnol. 2018, 36, 883–894. [Google Scholar] [CrossRef]
  20. Guo, Z.; Jeng, D.; Guo, W.; He, R. Simplified approximation for seepage effect on penetration resistance of suction caissons in sand. Ships Offshore Struct. 2017, 12, 980–990. [Google Scholar] [CrossRef]
  21. Stapelfeldt, M.; Bienen, B.; Grabe, J. Insights into Suction Caisson Installation Utilising the Material Point Method. In Proceedings of the 16th International Conference of IACMAG, Saint Martin d’Hères, France, 30 June–3 July 2020. [Google Scholar]
  22. Mehravar, M.; Harireche, O.; Faramarzi, A.; Alani, A.M. Modelling the variation of suction pressure during caisson installation in sand using FLAC3D. Ships Offshore Struct. 2017, 12, 893–899. [Google Scholar] [CrossRef]
  23. Houlsby, G.T.; Byrne, B.W. Design procedures for installation of suction caissons in sand. Geotech. Eng. 2005, 158, 135–144. [Google Scholar] [CrossRef]
  24. Houlsby, G.T.; Byrne, B.W. Design procedures for installation of suction caissons in clay and other materials. Geotech. Eng. 2005, 158, 75–82. [Google Scholar] [CrossRef]
  25. Walker, J.; Yu, H.S. Adaptive finite element analysis of cone penetration in clay. Acta Geotech. 2006, 1, 43–57. [Google Scholar] [CrossRef]
  26. Nazem, M.; Carter, J.P.; Airey, D.W. Arbitrary Lagrangian-Eulerian method for dynamic analysis of geotechnical problems. Comput. Geotech. 2009, 36, 549–557. [Google Scholar] [CrossRef]
  27. Sheng, D.; Nazem, M.; Carter, J.P. Some computational aspects for solving deep penetration problems in geomechanics. Comput. Mech. 2009, 44, 549–561. [Google Scholar] [CrossRef] [Green Version]
  28. Hamann, T.; Grabe, J. A simple dynamic approach for the numerical modelling of soil as a two-phase material. Geotechnik 2013, 36, 180–191. [Google Scholar] [CrossRef]
  29. Zienkiewicz, O.C.; Chan, A.H.C.; Pastor, M.; Schrefler, B.A.; Shiomi, T. Computational Geomechanics; Wiley: New York, NY, USA, 1999; pp. 7–31. [Google Scholar]
  30. Schanz, M.; Cheng, A.H.D. Transient wave propagation in a one-dimensional poroelastic column. Acta Mech. 2000, 145, 1–18. [Google Scholar] [CrossRef]
  31. Ragni, R.; Bienen, B.; Stanier, S.; O’Loughlin, C.; Cassidy, M. Observations during suction bucket installation in sand. Int. J. Phys. Model. Geotech. 2019, 20, 1–49. [Google Scholar] [CrossRef]
  32. Richart, F.E.; Woods, R.E.; Hall, J.J.R. Vibration of Soils and Foundations; International Series in Theoretical and Applied Mechanics; Prentice-Hall: Hoboken, NJ, USA, 1970. [Google Scholar]
  33. Tran, M.N.; Mark, F.R.; David, W.A. Installation of suction caissons in sand with silt layers. J. Geotech. Geoenviron. Eng. 2007, 133, 1183–1191. [Google Scholar] [CrossRef]
  34. Harireche, O.; Mehravar, M.; Alani, A.M. Suction caisson installation in sand with isotropic permeability varying with depth. Appl. Ocean. Res. 2013, 43, 256–263. [Google Scholar] [CrossRef] [Green Version]
  35. Wang, R.; Cao, W.; Xue, L.; Zhang, J.M. An anisotropic plasticity model incorporating fabric evolution for monotonic and cyclic behavior of sand. Acta Geotech. 2021, 16, 43–65. [Google Scholar] [CrossRef]
  36. Bordón, J.D.R.; Aznárez, J.J.; Maeso, O. Dynamic model of open shell structures buried in poroelastic soils. Comput. Mech. 2017, 60, 269–288. [Google Scholar] [CrossRef]
Figure 1. Geometry and boundary conditions of a fully saturated soil column.
Jmse 09 00704 g001
Figure 2. Comparison of numerical and analytical solutions for a 1D dynamic consolidation problem: (a) Vertical displacement at point 1; (b) Excess pore water pressure at point 2.
Jmse 09 00704 g002
Figure 3. Numerical model for suction caisson installation analysis along with the shear strain distribution within soil near the caisson wall during a typical jacked penetration process.
Jmse 09 00704 g003
Figure 4. Jacked penetration resistance: (a) Numerical and centrifuge test results for penetration resistance; (b) Decomposition of penetration resistance from numerical results.
Jmse 09 00704 g004
Figure 5. Excess pore pressure distribution during jacked penetration.
Jmse 09 00704 g005
Figure 6. Excess pore pressure evolution with caisson jacked penetration depth at typical points within the soil: (a) Points P1 to P7 at 0 m to 6 m depths 0.5 m inside the caisson wall; (b) Points P8 to P11 at 0 m to 3 m horizontal distances from the center of the caisson at 2 m depth.
Jmse 09 00704 g006
Figure 7. Mean effective stress evolution with caisson jacked penetration depth at typical points within the soil: (a) Points P1 to P7; (b) Points P8 to P11.
Jmse 09 00704 g007
Figure 8. Suction penetration resistance: (a) Numerical and centrifuge test results for penetration resistance; (b) Decomposition of penetration resistance from numerical results.
Jmse 09 00704 g008
Figure 9. Excess pore pressure at different suction penetration depths.
Jmse 09 00704 g009
Figure 10. Excess pore pressure evolution with caisson suction penetration depth at typical points within the soil: (a) Points P1 to P7 at 0 m to 6 m depths 0.5 m inside the caisson wall; (b) Points P8 to P11 at 0 m to 3 m horizontal distances from the center of the caisson at 2 m depth.
Jmse 09 00704 g010
Figure 11. Mean effective stress evolution with caisson suction penetration depth at typical points within the soil: (a) Points P1 to P7; (b) Points P8 to P11.
Jmse 09 00704 g011
Figure 12. Shear modulus distribution at typical points within the soil at the end of jacked and suction penetration: (a) Points P1 to P7 at 0 m to 6 m depths 0.5 m inside the caisson wall; (b) Points P8 to P11 at 0 m to 3 m horizontal distances from the center of the caisson at 2 m depth.
Jmse 09 00704 g012
Figure 13. Influence of permeability coefficient kf on suction penetration resistance.
Jmse 09 00704 g013
Table 1. Soil properties of the fully saturated soil column.
E (Pa)μnKw (Pa)Ks (Pa) k f   ( m / s ) ρw (kg/m3)ρ (kg/m3)
2.54 × 1080.2980.483.3 × 1091 × 10103.55 × 10−510001884
Table 2. Soil parameters adopted for the simulation of the centrifuge tests by Tran [9].
PropertyValue
Specific gravity Gs2.67
Saturated weight γ sat (kN/m3)20.0
Permeability coefficient k f (m/s)1 × 10−4
Void ratio e0.67
Peak friction angle φ43°
Poisson’s ratio μ0.3
Cohesion c0
Publisher’s Note: MDPI stays neutral with regard to jurisdictional claims in published maps and institutional affiliations.

