Article

A Phenomenological Study of Lab-Scale Tidal Turbine Loading under Combined Irregular Wave and Shear Flow Conditions

by
Matthew Allmark
1,*,†,
Rodrigo Martinez
2,†,
Stephanie Ordonez-Sanchez
2,†,
Catherine Lloyd
1,†,
Tim O’Doherty
1,†,
Grégory Germain
3,†,
Benoît Gaurier
3,† and
Cameron Johnstone
2,†
1
Cardiff Marine Energy Research Group, College of Physical Sciences and Engineering, Cardiff University, The Parade, Cardiff CF24 3AA, UK
2
Energy Systems Research Unit, Department of Mechanical and Aerospace Engineering, University of Strathclyde, 75 Montrose St, Glasgow G1 1XQ, UK
3
IFREMER, Marine and Structures Laboratory, Centre Manche Mer du Nord, 150 Quai Gambetta, 62200 Boulogne-sur-Mer, France
*
Author to whom correspondence should be addressed.
These authors contributed equally to this work.
J. Mar. Sci. Eng. 2021, 9(6), 593; https://doi.org/10.3390/jmse9060593
Submission received: 22 April 2021 / Revised: 18 May 2021 / Accepted: 23 May 2021 / Published: 29 May 2021
(This article belongs to the Special Issue Marine Renewables–Infrastructures and Physical Testing)

Abstract

:
Tidal devices are likely to faced with shear flows and subjected to various wave climates. The paper presents an experimental study of the combined impacts of shear profile and irregular waves on the loading of a 1/20th scale device operating at peak power extraction. The experiments presented were conducted at various depths to facilitate analysis of the effects of the shear flow and wave impact on the device at various positions in the water column. The fluid field was measured at three different upstream positions and at three depths (top, middle and bottom of the rotor) for each experiment; in doing so, data from the device were captured three times. The fluid measurements were of a high quality and were analysed to present the structure flow upstream of the device, which contained velocity and turbulence profiles. The upstream measurement was utilised to understand the development of flow structures in the approach to the device, and the impact of the flow structures measured was confirmed via cross-covariance calculations. The long datasets gathered were used to produce full rotational probability density functions for the blade-root-bending moments for three blades. The spectral characteristics were also considered, and showed that rotor loading quantities are less reactive to smaller scale flow structures.

1. Introduction

There have been exciting developments in recent years which show promising signs that the tidal stream sector is approaching commercialisation. The breakthrough project known as MeyGen is underway at the Pentland Firth, where the first 6 MW array of Horizontal Axis Tidal Turbines (HATTs) was installed in 2017. The four 1.5 MW turbines had by 2018 generated more than 17 GWh of electricity for the grid [1]. Phase 1B will see the deployment of an additional two turbines and a sub-sea hub which will allow multiple turbines to be connected to a single power cable and thus reducing costs. Phase 1c involves the construction and deployment of 49 new turbines at an estimated cost of £420m. Atlantis Energy believe that this will be a transformative phase for the industry as economies of scale become significant with increased production of turbines [2]. The cost of turbine construction and the associated cost of deploying turbines need to be reduced if the technology is to become economically viable.
Commercialisation relies upon the continuation of research into improving HATT design and survivability. Nova Innovation, who successfully delivered the first grid connected off-shore array of tidal turbines near the Shetlands in Scotland, have been awarded with two European grants projects to bring down the cost of tidal energy. The EnFAIT project has already reported a reduction in operational costs of 15% and are aiming for a 40% reduction by 2022. The second project called ELEMENT started in June 2019 with the aim of reducing the overall lifetime cost of TS energy by 17% [3]. As the industry develops, certain needs are growing: being able to understand and describe the loading faced by HATTs, which should aid in improved design, and understating a device’s fatigue life and reliability.
It is known that real sea conditions are comprised of a combination of irregular waves and currents. These wave–current interactions may have a direct impact on a HATT performance; for example, rotor thrust and power have been shown to decrease as the turbulence intensity (TI) levels increase [4,5,6,7], and wave-induced rotor load fluctuations can be up to three times the average loads [7,8,9,10,11,12]. A further aspect of the sea conditions faced by tidal devices is the presence of shear in the flow, which can arise due to sea bed interactions or due to the wake of upstream bathymetric features or devices [6,13,14,15,16,17,18]. The combination of wave and current shear effects in the tidal resource will generate complex loading patterns with extremes loads, oscillatory components and stochastic components.
There have been many laboratory studies into differing aspects of the three flow artefacts discussed above. There have been many articles focused on quantifying and modelling HATT power production under turbulent flow cases with a focus on spectral characterisation and modelling of loading and power production [6,14,15,18,19,20,21,22,23,24,25,26]. Many laboratory-scale experiments detail the effects of upstream devices both in low turbulence and high turbulence scenarios with results presented in a phenomenological sense [6,14,15,17,27,28]. There has also been significant research into combined wave and current effects with both regular and irregular waves [8,9,25,29,30]. There have been studies considering combine turbulence and velocity shear flows [11,12,16,29,31,32,33].
The research presented herein seeks to build on current research activities by providing a detailed phenomenological study of HATT performance under combined wave–current shear flows. This work details an experimental campaign for which a turbine was installed in various positions within a complex flow field with and without irregular waves. The approach aimed to develop statistical and spectral descriptions of the device’s operation under these complex conditions. Our paper is arranged as follows. The next section, Section 2 presents an overview of the experimental methodology and test setup. This is followed by a relatively detailed description of the flow field upstream of the laboratory-scale device in Section 3. The turbine results section comprises of two parts: the first presents a statistical description of blade loading, Section 4; and finally, spectral analysis which utilises power spectral density estimates and spectral coherence measurements to help describe the HATT response, is presented in Section 5.

2. Methodology and Experimental Setup

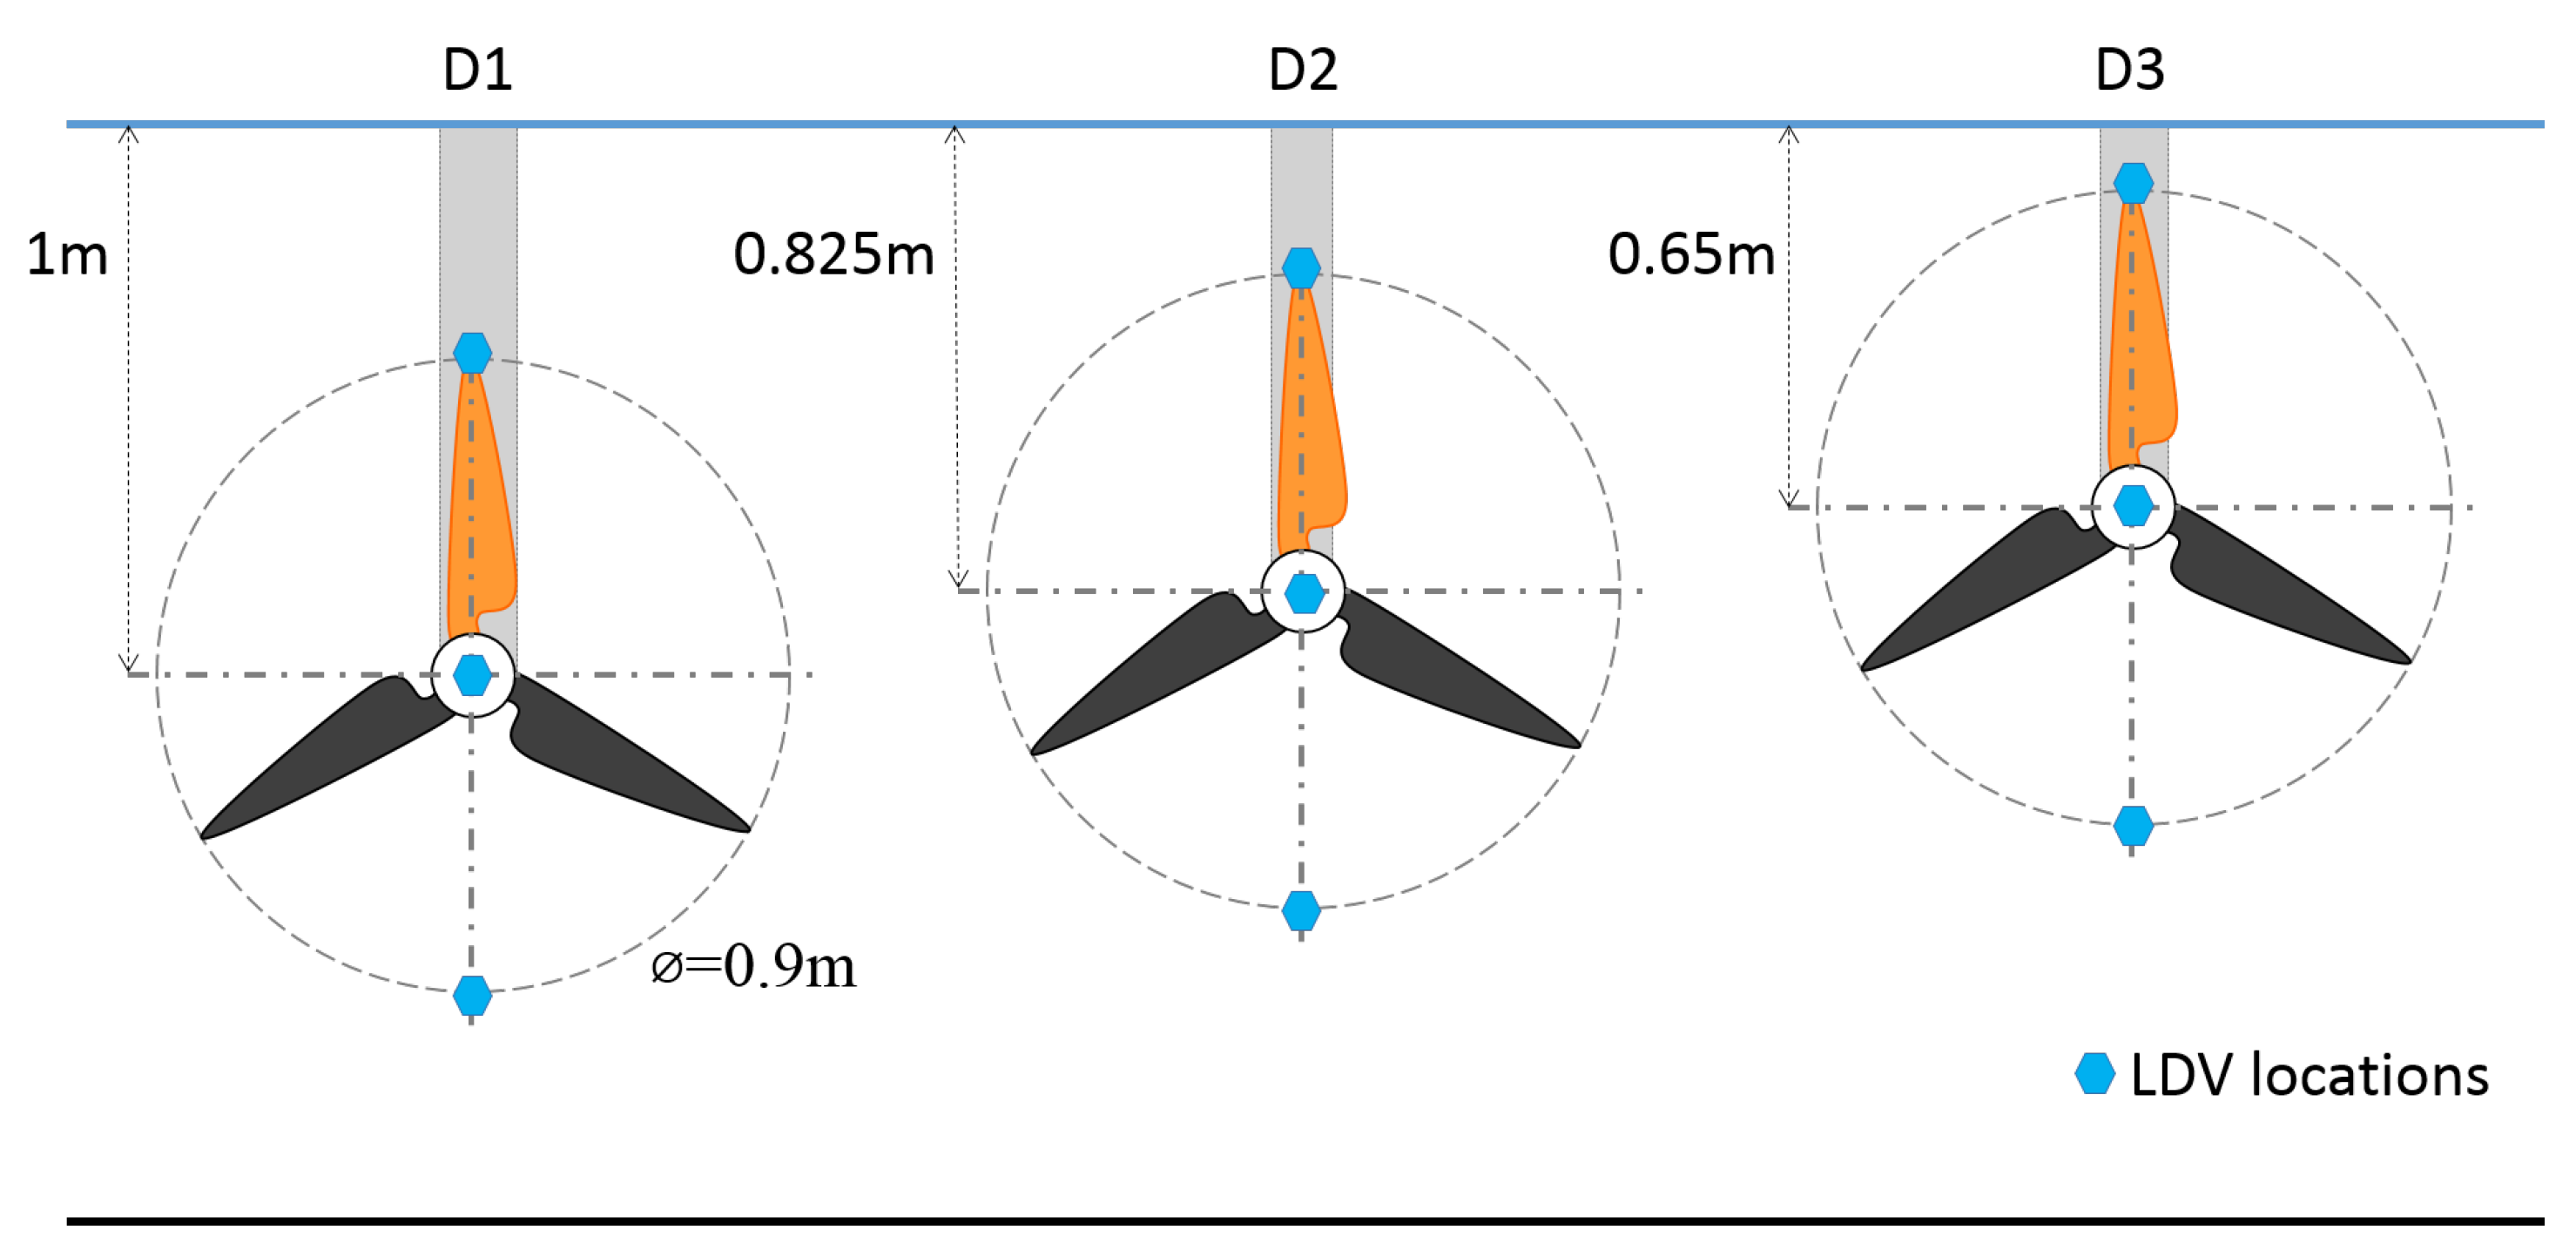
To study the effects of combined wave–current shear flows, laboratory-scale testing of a 1/20th scale HATT was undertaken. Figure 1a shows the setup as a plan view schematic and Figure 1b show a photograph of the experimental apparatus. Figure 1c shows a side view schematic. The turbine was mounted on a 0.105 m in diameter stanchion connected to a supporting structure above the 4 × 2 × 18 m wave and current flume of IFREMER [34], as seen in Figure 1b. The turbine was mounted at three different depths (1, 0.825 and 0.65 m) below the water’s surface (Figure 2), and centred in the cross-stream direction, 2 m from each of the side walls (Figure 1a).
The flow speed was measured with a Laser Doppler Velocimeter (LDV) mounted at three different distances upstream of the turbine (1, 2 and 3 m) as shown in Figure 1a. For each of the rotor depths, flow measurements at the top of the rotor, at hub height and at the bottom of the rotor were taken (Figure 2). The wave height was measured with a resistive wave gauge placed in line with the rotor plane 0.78 m from the centre of the rotor (Figure 1a). The resistive wave gauges were calibrated to measure the distance from water’s surface to the still water line (SWL) via zeroing prior to tank operation. An extra set of flow characterisation tests were performed once the turbine was removed from the tank. In this case, the LDV position was moved to the rotor plane.
The turbine was subjected to current-only, CO, and current with irregular waves, JSP, for each of the depth cases outlined in Figure 2—referred to in future as D1, D2 and D3, respectively. The parameters used for each of the conditions are presented in Table 1. The irregular waves’ parameters are the significant wave height H S and the peak frequency F P .
The shear flow for these test cases was generated via the blockage posed by the wake maker, which was installed at a depth of 500 mm (Figure 1c). The wave marker was installed 4 m upstream of the device, and testing at the differing depths gave an opportunity to consider the exposure of the device to wave loading and to differing portions of the flow profile generated in the wake of the wave marker. For context, Table 1 shows the wave parameters at full scale when considering sites of 25–40 m depth, calculated by scaling the wave characteristics to maintain relative depth (0.63), wave steepness (0.05) and Froude number (0.82). Froude number is defined in Equation (1), where u ¯ is the mean stream-wise velocity in ms−1, g is acceleration due to gravity in ms−2 and H s is the significant wave height in m.
F r = u ¯ g × H s
The data were captured whilst the HATT operated at peak power, which, for the instrumented device tested, coincided with a tip-speed ratio of λ = 4 relative to the mean inlet velocity of u ¯ = 1 ms−1. The testing was undertaken with a constant rotational velocity of 85 RPM with standard deviation σ R P M < 2 % . Here, tip-speed ratio is defined in the usual way, as shown in Equation (2), where R is the turbine radius in m and ω is the turbine rotational speed in rads−1.
λ = ω R u ¯

2.1. Turbine Model

The turbine used in the experiments was a three-bladed HATT with a 0.9 m diameter at a 1:20 Froude scale. This scales geometrically to a typical 18 m full-scale tidal turbine. Details on the development of this model can be found in [35]. A Bosch Rexroth permanent magnet synchronous machine and drive system was used to control the turbine using an encoder feedback for servo-control [35]. The encoder feedback value was logged and stored by the Bosch Rexroth system at 200 Hz. The encoder was a ECN 113 encoder, manufactured by Heidenhain, Germany, with an accuracy of 20″. The blade profile design was based on a Wortmann FX 63-137 profile. Further information on the blade profile and design can be found in [31,35,36].

Turbine Measurement Instrumentation

Rotor torque and thrust signals were measured via an Applied Measurements combined torque/thrust transducer. The transducer was fitted between directly behind the rotor hub to avoid recording friction forces from the dynamic seals and bearings. The transducer was factory calibrated and the associated calibration values were used to infer torque τ and thrust T values. The out-of-plane ( M X Y ) and in-plane ( M Z ) blade root bending moments (BRBM) were measured with strain gauges mounted in two independent full-bridge configurations on each of the blade roots. Calibration details for these measurements can be found in [35]. The strain gauges sets were fitted by Applied Measurements. Tests where the turbine was stationary and the water was still were performed regularly to record any offset or drift in the instruments readings. The data were logged via an NI Compact RIO at 200 Hz.

3. Flow Characterisation

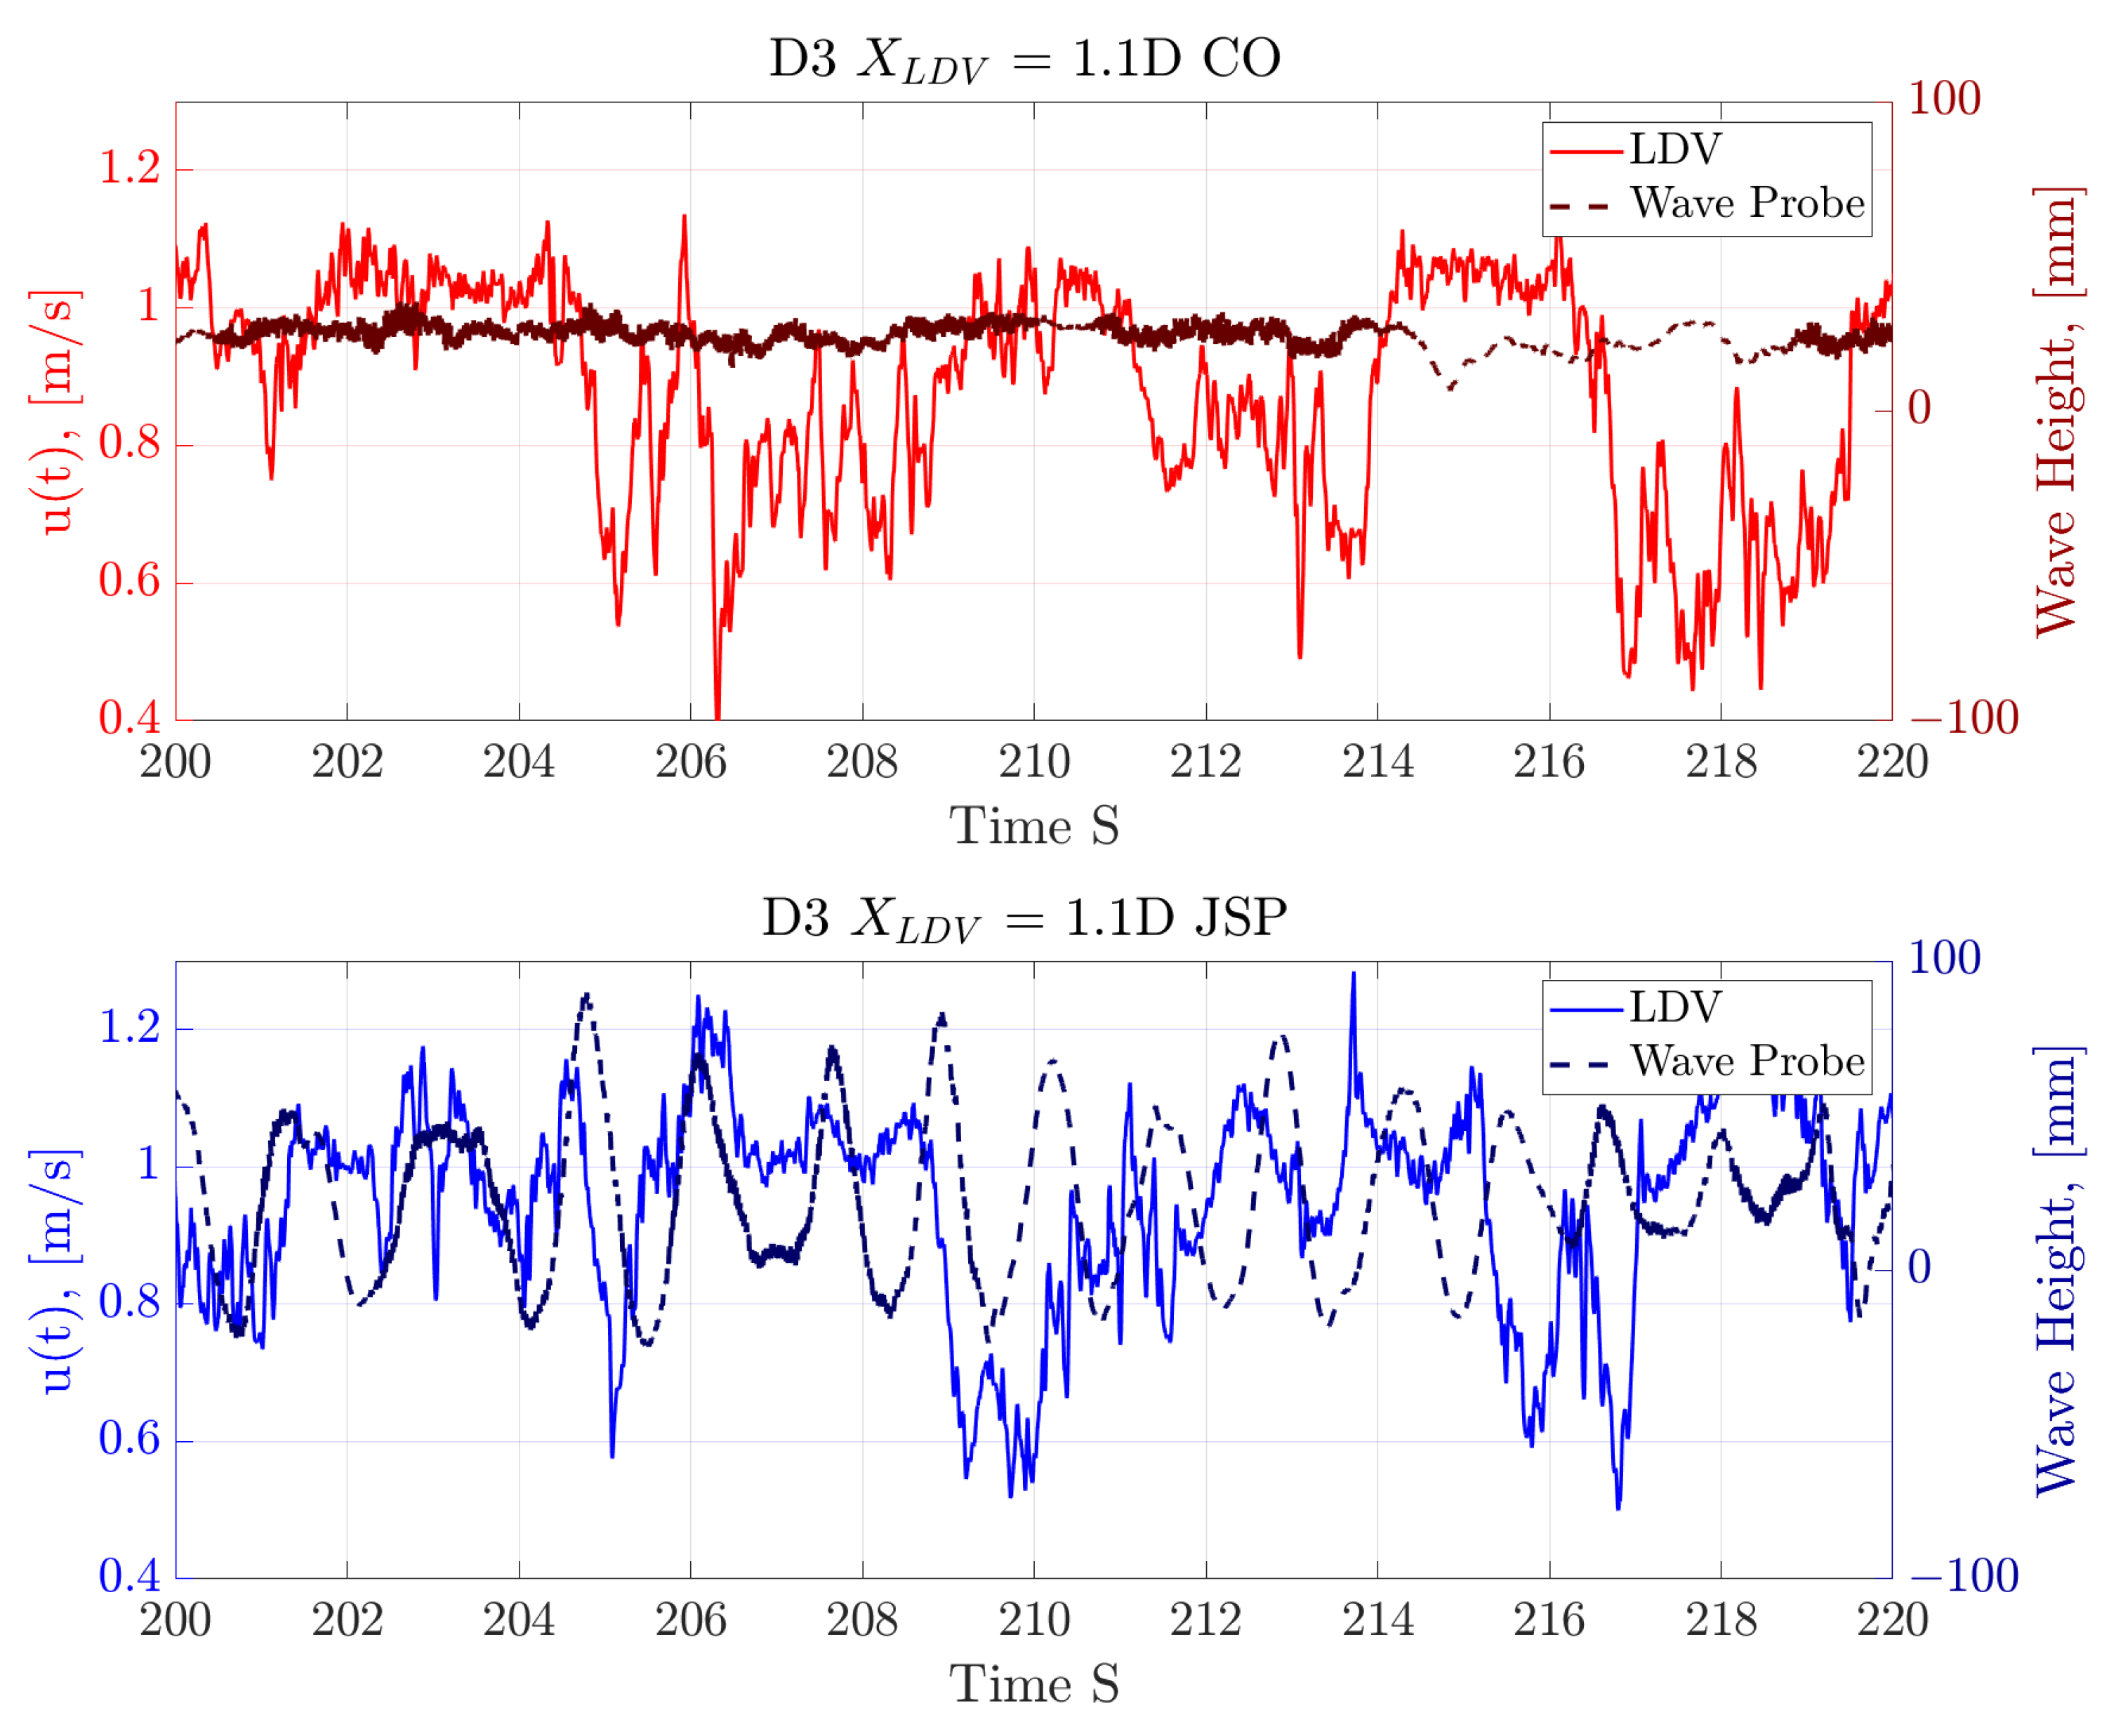
This section presents a review of the flow characteristics observed for the CO and JSP cases. Comparisons between the flow measurements made at each of the three upstream LDV positions and the supplementary measurements taken at the turbine rotor plane were made to confirm the nature of flow development approaching the turbine. Figure 3 shows an example time series of the LDV and wave probe data captured; the LDV data shown were captured for the D3 depth inline with the rotor hub.
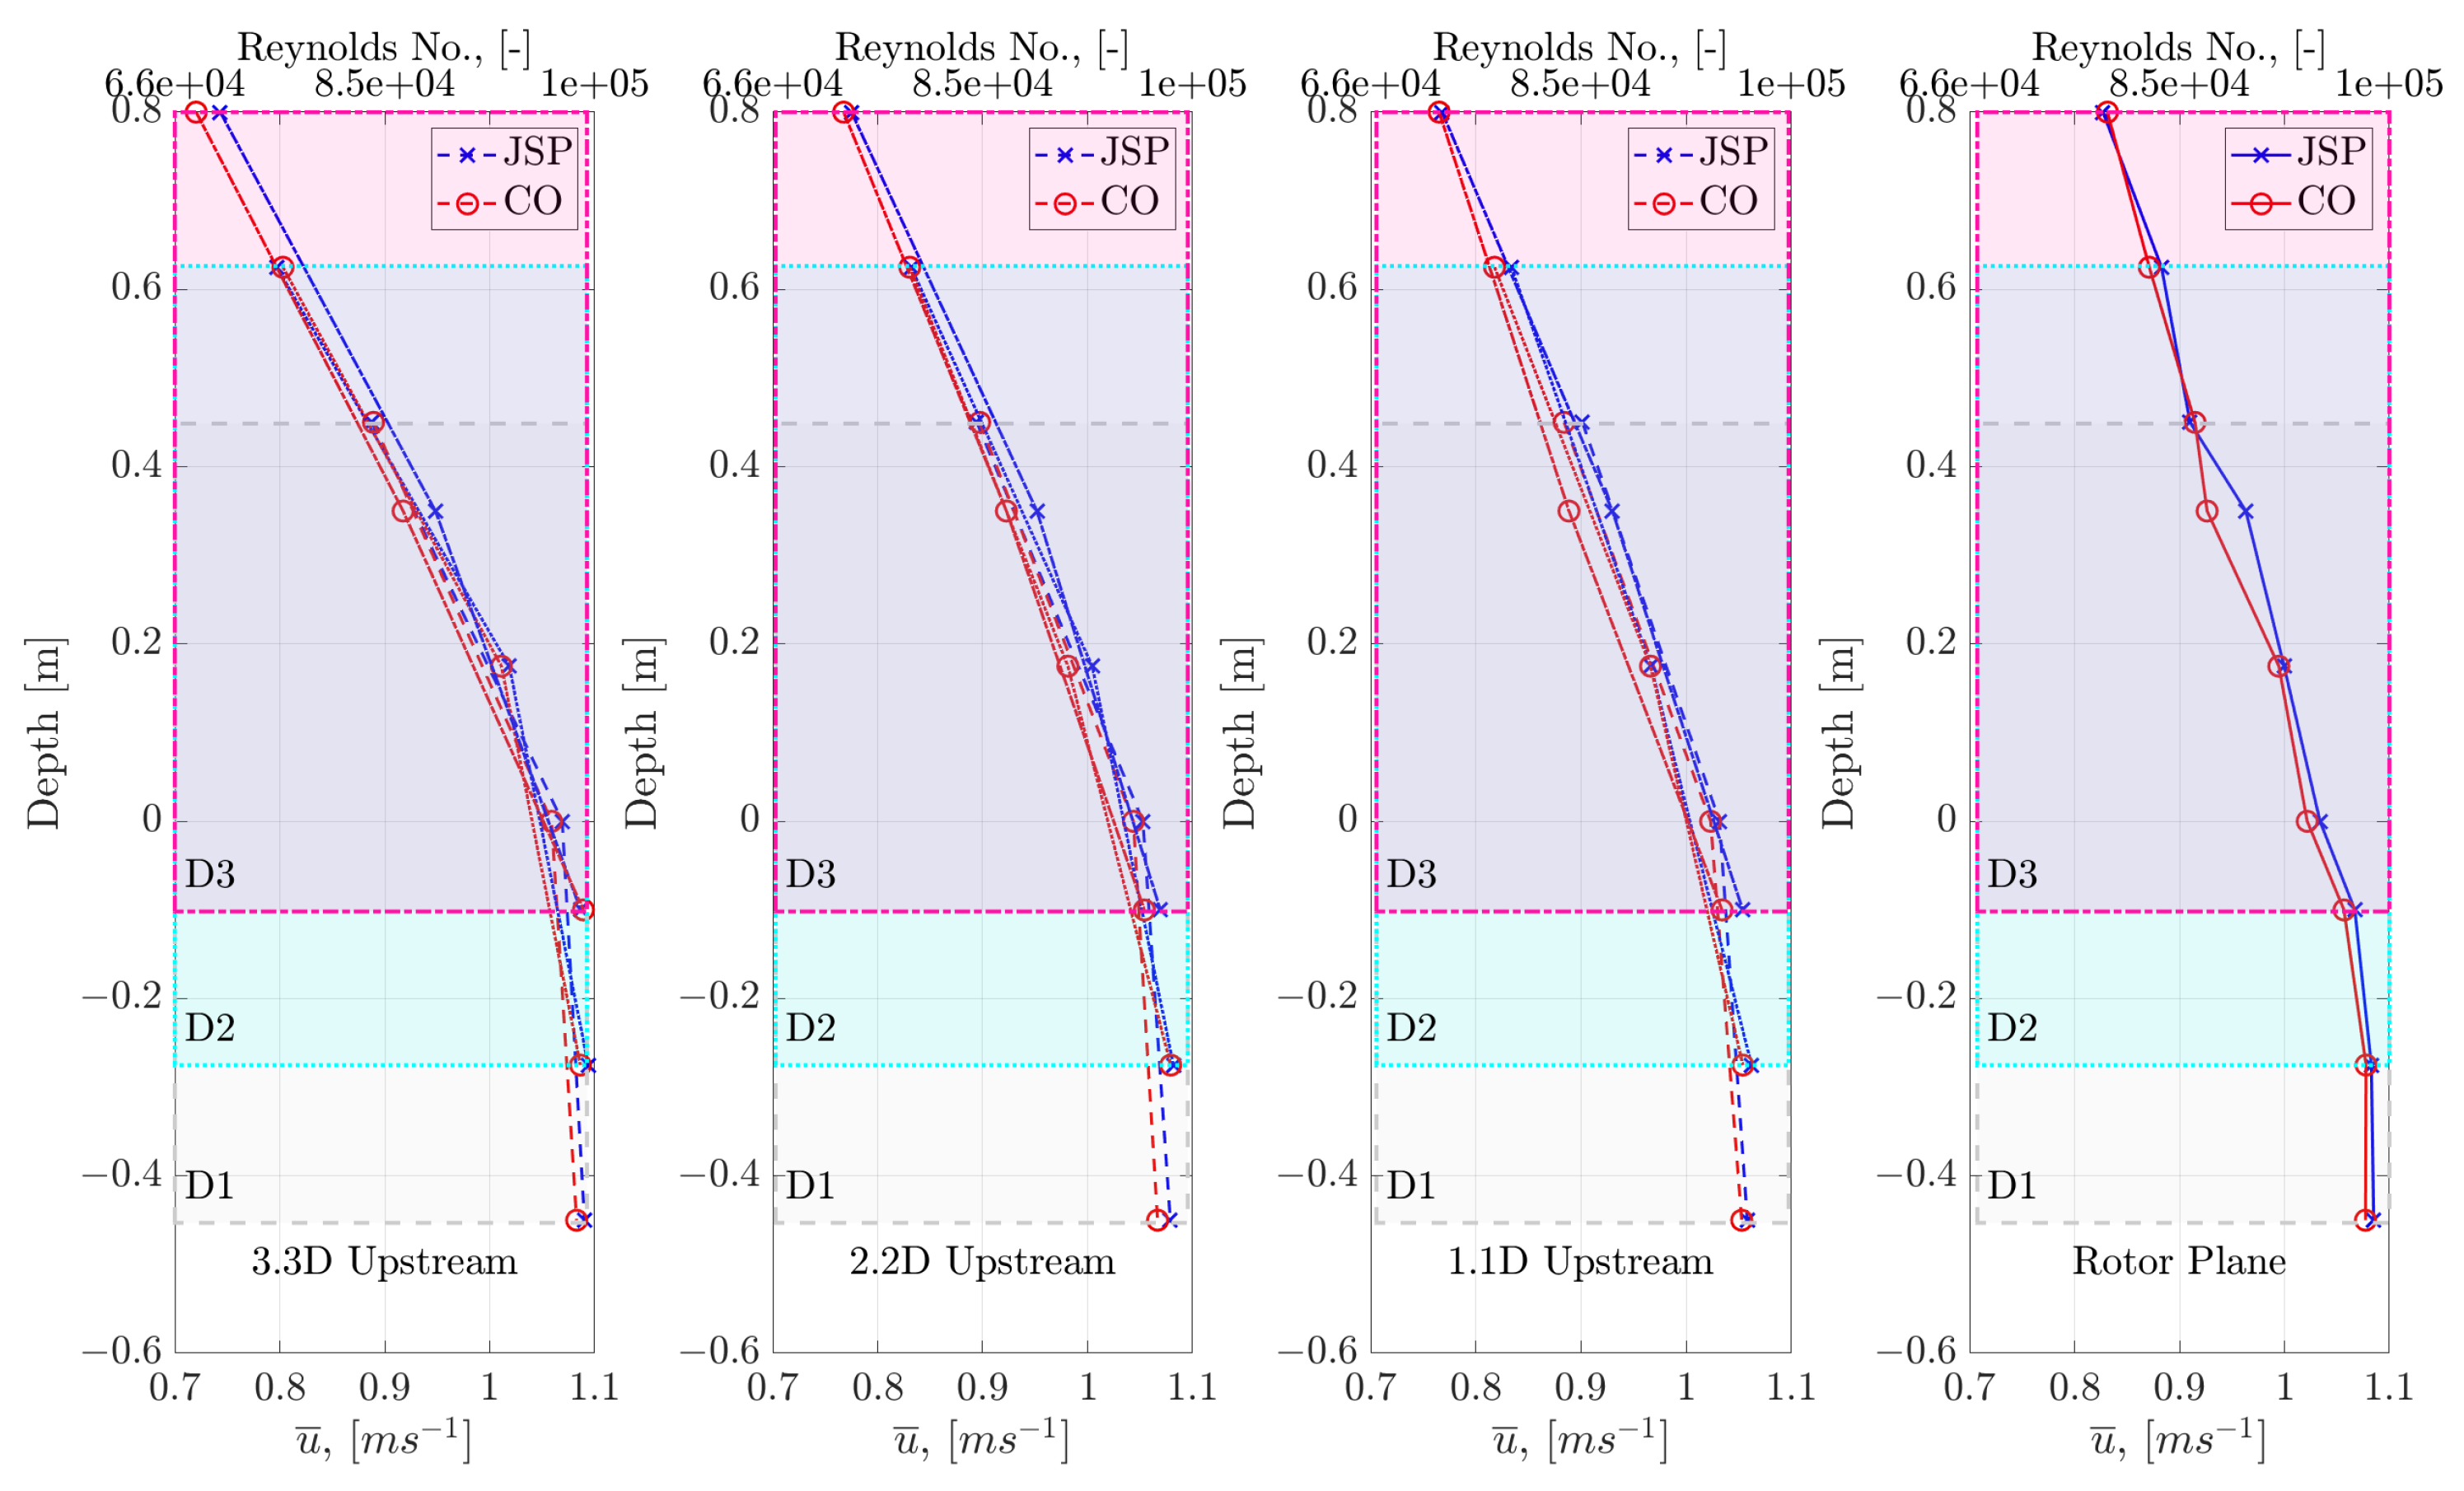
Figure 4 shows the mean flow velocity recorded at differing depths and differing upstream measurement positions. Figure 4 presents an upper x-axis indicating the chord length based Reynolds number, defined as: R e = ρ u ¯ L c h o r d μ —where L c h o r d is the chord length of the blade at 0.7 of the radius, L c h o r d = 83.6 mm, r h o is the density of water in kg m−3 and μ is the dynamic viscosity of water in P a . s . Immediately apparent is the drastic inverse profile created by the presence of the wave maker. A large blockage impinging on the flow arising from the submerged wave maker (as illustrated in Figure 1c) generated a clear shear layer which dominated the flow profile up to and presumably passed the turbine rotor plane. Evidence of flow recovery can be observed in the upper part of the water column as distance from the wave maker increases. The results indicate little difference in the observed mean flow velocities with the wave maker in action or stationary, i.e., with and without the waves. The profile developed, whilst inverted, shows similar flow velocity values to those observed in [24], albeit over a smaller depth.
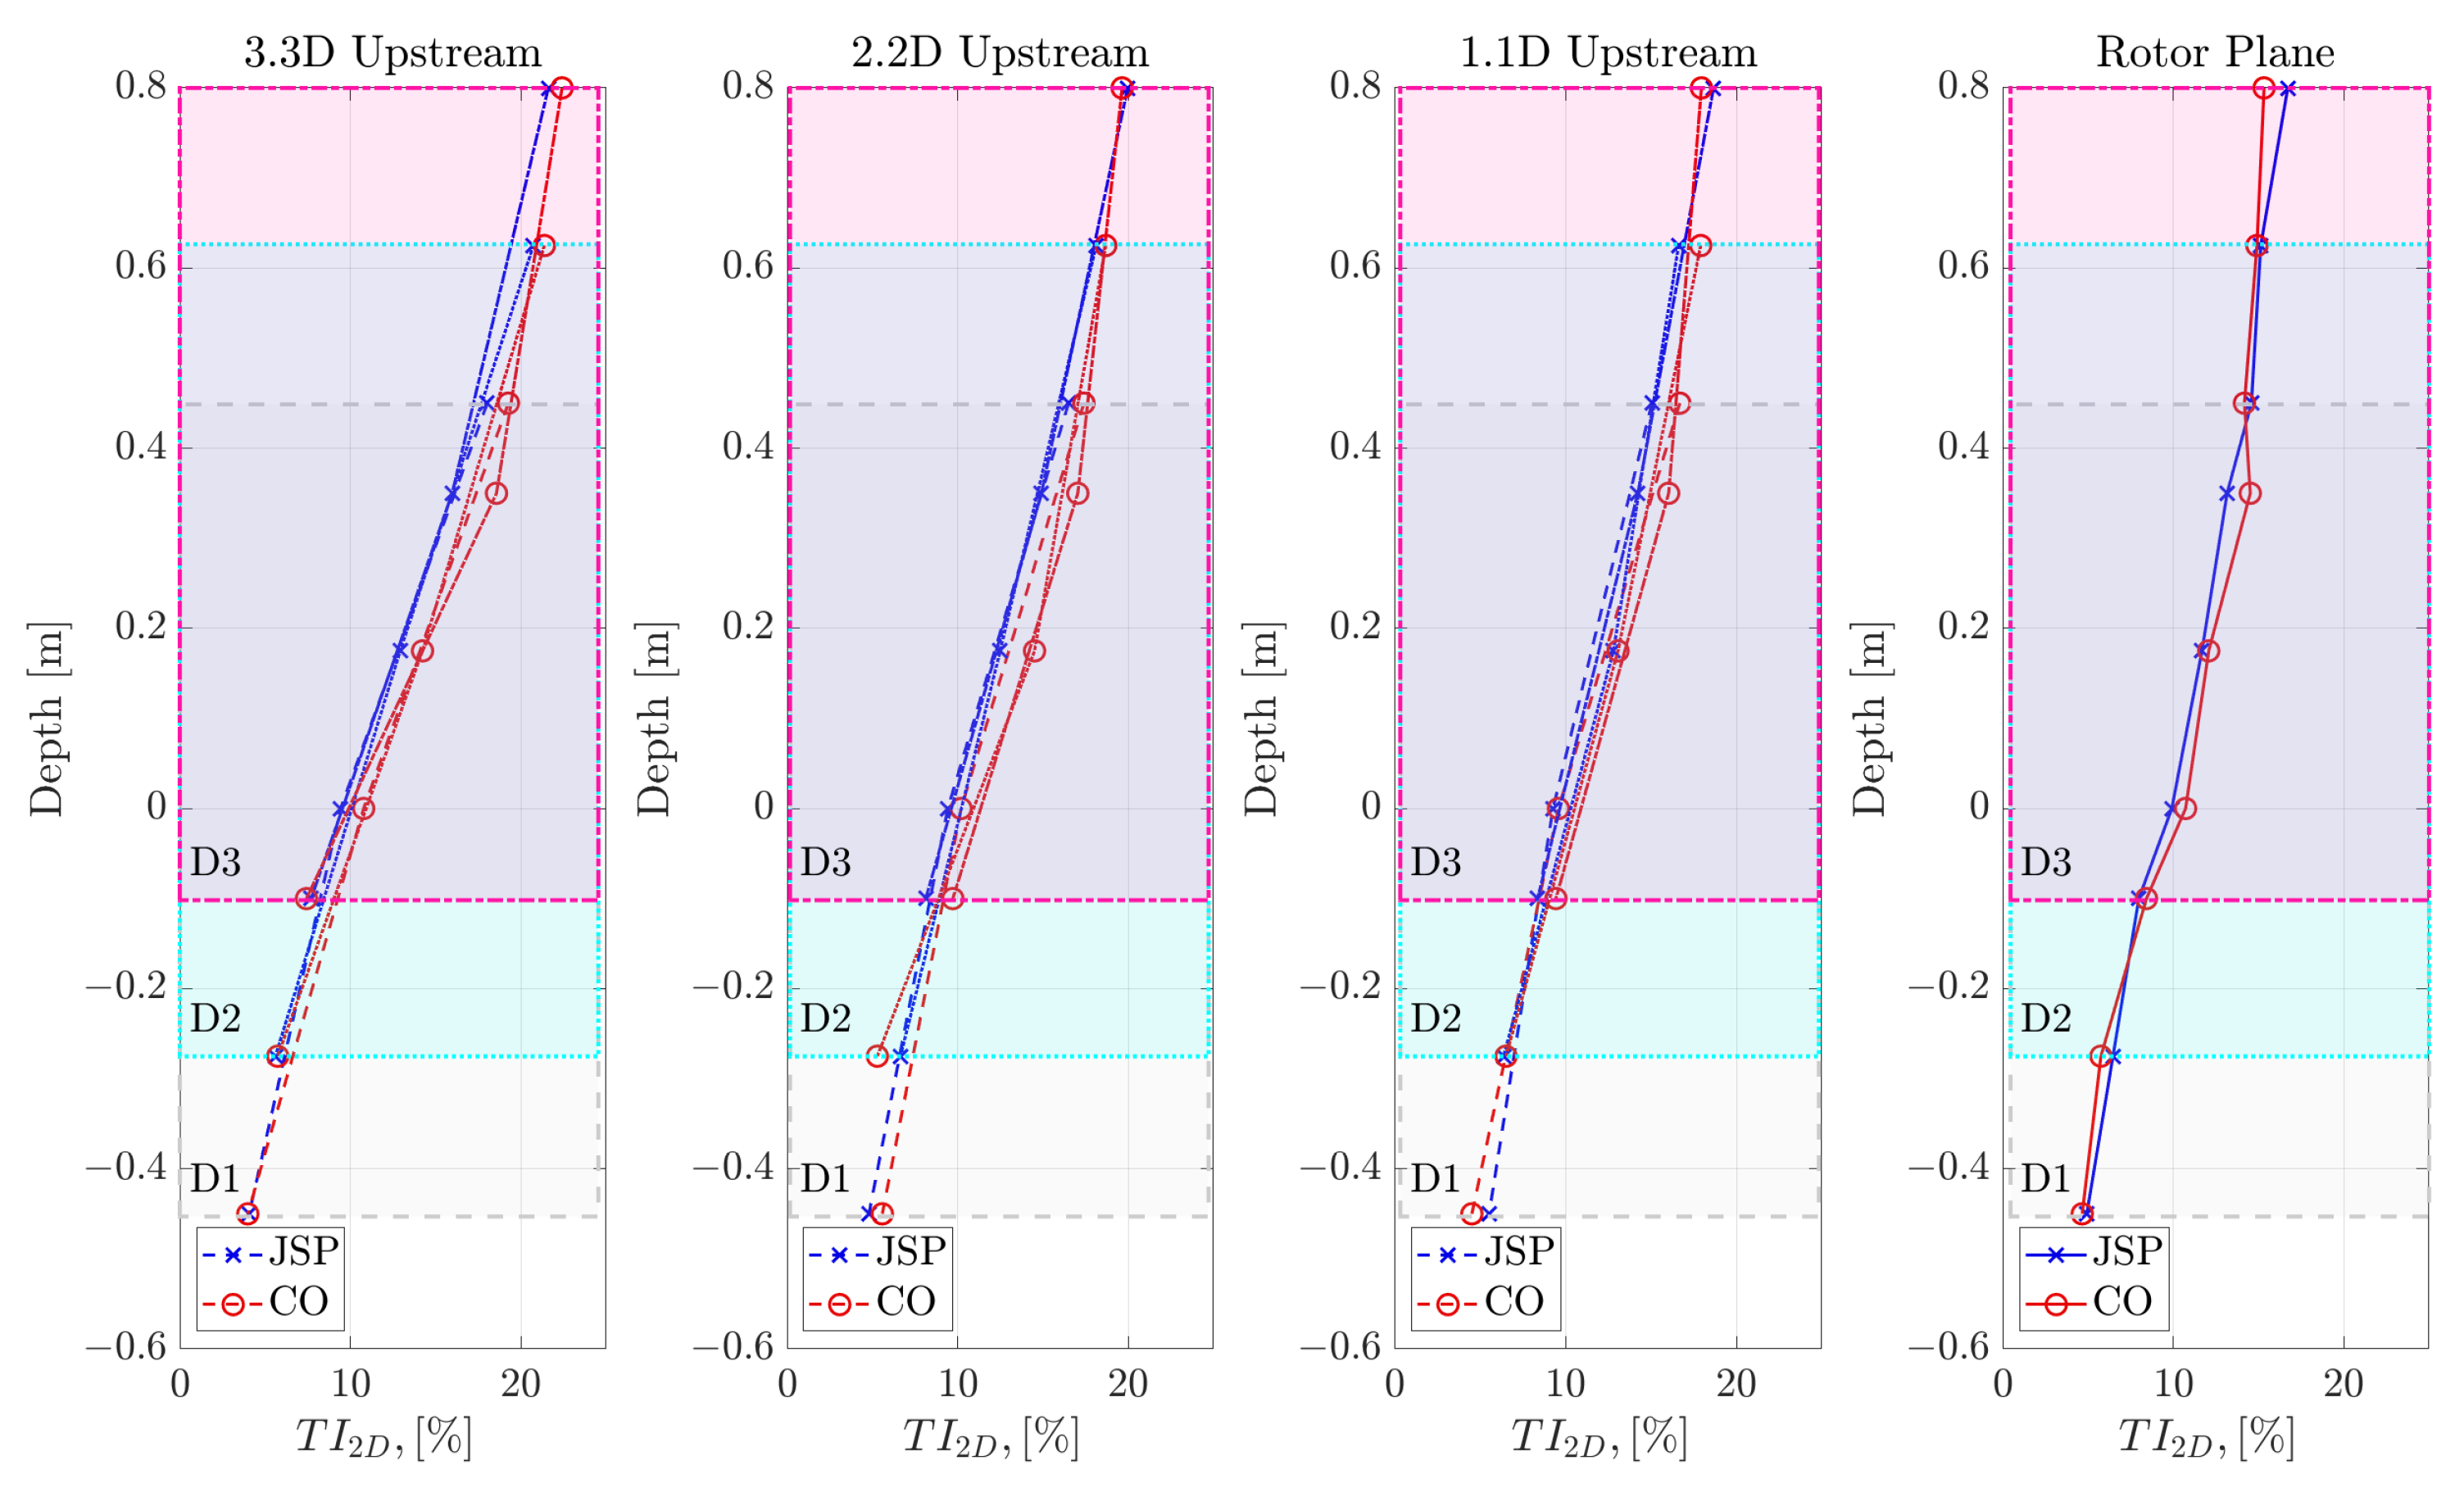
The presence of the wave maker inducing shear in the flow will generate turbulence in its wake; as a result, a turbulent profile was expected. To observe the structure of the turbulence profile, the 2-dimensional turbulence intensity T I 2 D was calculated for each depth and LDV position. Figure 5 shows the results of this exercise. The T I 2 D was calculated in the usual way via Equation (3).
T I 2 D = 100 × 1 2 ( σ u 2 + σ v 2 ) u ¯ 2 + v ¯ 2
Figure 5 confirms that a significant turbulence profile exists with average T I 2 D values of 5–8% observed in the lower portion of the water column and values ranging from 23 % to 15 % observed in the upper portion of the water column, when moving from 3.3D upstream to the turbine rotor plane. Two-dimensional turbulent kinetic energy T K E 2 D , defined as T K E 2 D = 1 2 ( σ u 2 + σ v 2 ) , was calculated for the same datasets, yielding similar trends as exhibited in Figure 5 for T I 2 D . Mean TKE values of 0.02 m2 s−2 at the 3.3D and 0.01 m2 s−1 at the turbine rotor plane were observed, which are consistent with field measurements or similar mean velocity values [37]. Moving away from the blockage posed by the wave maker (toward the rotor plane), in the upper portion of the water column, a decrease in T I 2 D and T K E 2 D was observed, which is consistent with localised turbulence generation in the wake of some obstruction [4], confirming the cause of the higher T I 2 D values as the result of the wave maker. The localised blockage of the wave marker in diverting and distorting the flow was a source of turbulent energy generation which was not sustained past the blockage, and as such the level of turbulence dissipated as one moved downstream from the blockage. This is corroborated by the turbulent dissipation rate at the highest point in the water column, which was higher in the vicinity of the wave marker (≈0.2 m2 s−3) and lower at the rotor plane (≈0.002 m2 s−3).
The CO cases generally exhibited marginally higher T I values than the JSP cases; however, the T I levels from both cases became almost equal in measurements taken at 1.1D and at the rotor plane. Interestingly, at 1.1D and the rotor plane for the highest point measured (0.8 m), a higher T I value was observed for the JSP case than for the CO case. Although very similar T I 2 D values were observed in both cases, these findings could be consistent with turbulent effects predominating over wave effects as the driver of fluid velocity fluctuations. As the downstream distance from the wave maker increased, the turbulence energy decayed, and the orbital effects from the wave became more significant, relative to turbulence, in creating fluid velocity fluctuations. Presumably, the motion of the wave maker reduced the turbulence observed, as it was not present as a constant blockage, as in the CO case, which meant the blockage would be reduced at times (due to the motion of the paddle out of the water) and would have been moving with the fluid flow at other times. Lower down the water column, in the region −0.45 m < depth < −0.2 m, consistent T I 2 D values were observed for all upstream positions.
An estimate of the integral length scale, L , associated with stream-wise velocity fluctuations, was calculated for each of the measurement positions to develop an understanding of how the large scale turbulent structures changed with depth and approaching the rotor plane. An estimate of the integral time scale, T , can be developed via integration of the auto-correlation function with respect to time between 0 < t < T 0 , where T 0 is the time lag associated with the first zero-crossing of the auto-correlation function [4]. The integral length scale can then be found by using L = u ¯ · T . The auto-correlation and the integral used to develop an estimate of T are defined as follows:
T = 0 T 0 R ( t ) · d t
where
R ( t ) = u ( t ) u ( t t ) ¯ σ u 2
For the CO case a slightly larger L (≈0.6 m) was observed in the centre of the water column ( 0.2 < d e p t h < 0.45 ) relative to L 0.4 m at the upper and lower extremes of the water column. This effect was not observed in the JSP cases, which yielded a more consistent L 0.5 m throughout the water column. In both cases the integral length scale observed was of the order of the submergence depth of the wave maker.
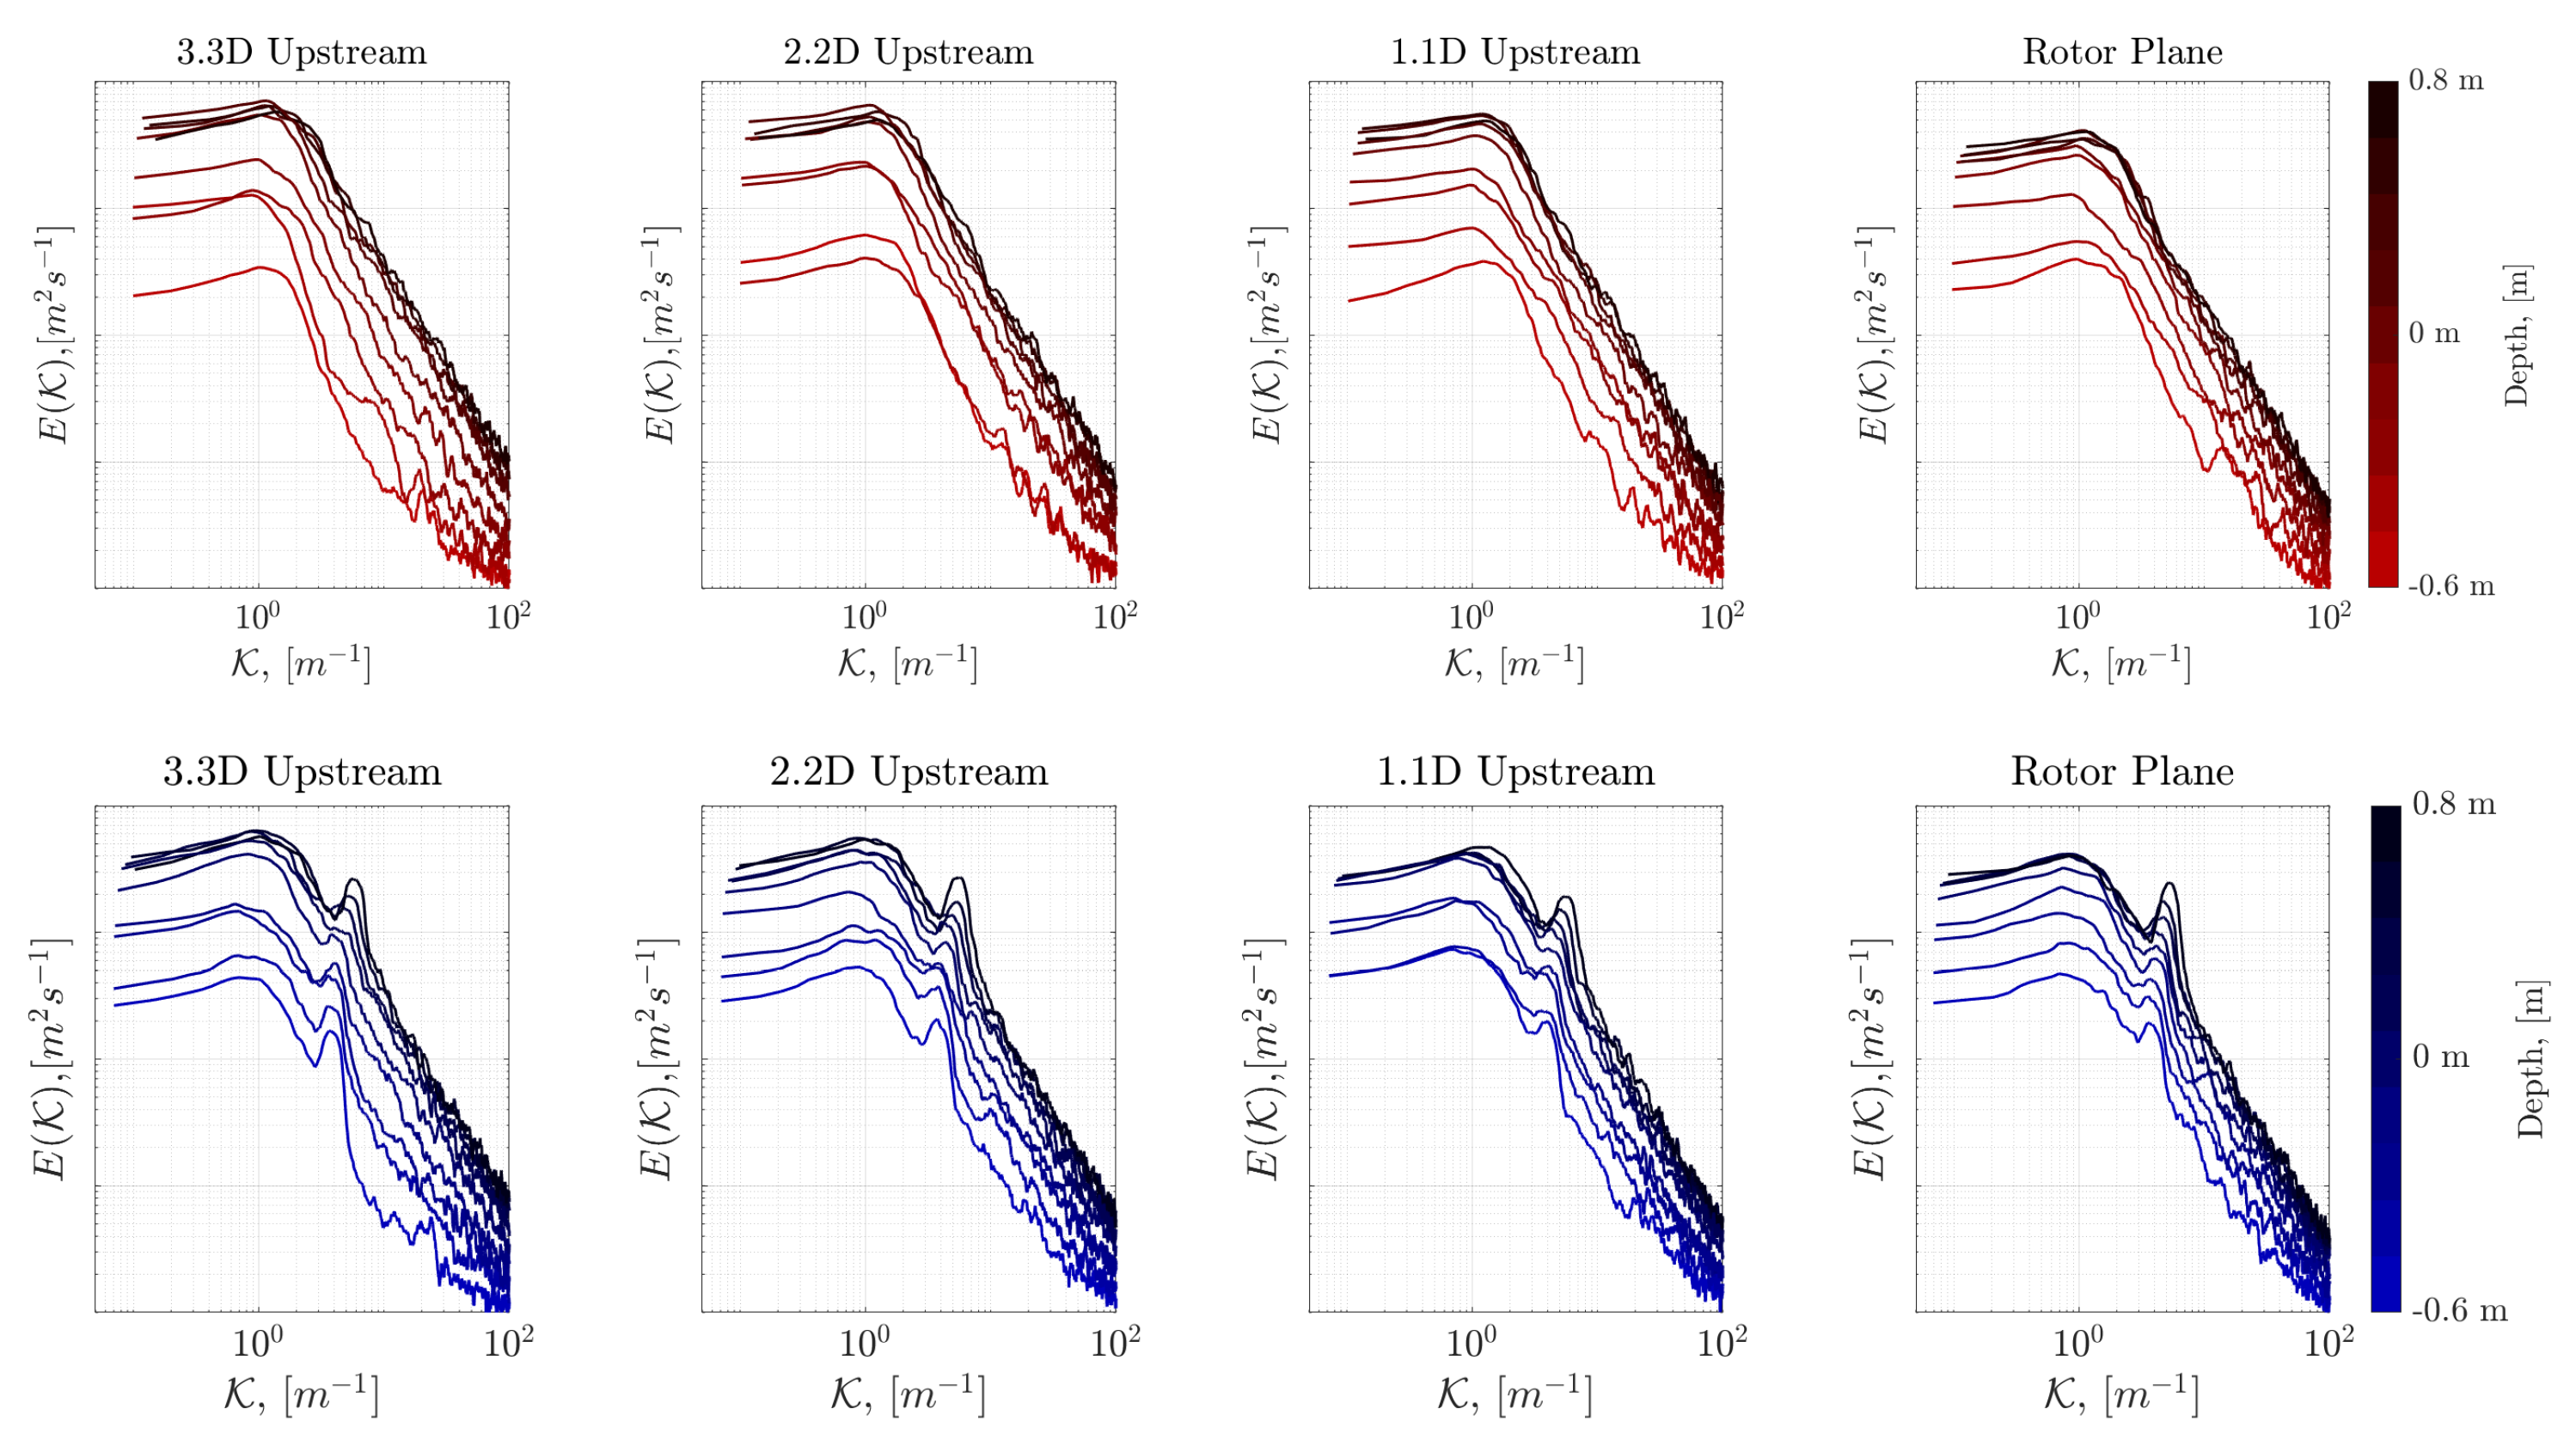
A common method of analysing flow measurements is to study the power spectral density (PSD) of flow measurement time series. Spectral analysis of fluid velocity measurements was undertaken in detail by Taylor [38] and is utilised frequently, as it provides a clear depiction of the turbulent energy cascade over varying scales which resulted in the well known 5 / 3 law—developed by Kolmogorov via dimensional analysis. Here, the power spectral densities were calculated for each flow velocity time series captured, in wave number space, as defined in Equations (6) and (7). The spectral shape was considered at each of the differing upstream locations and at the turbine rotor plane, with and without the wave maker in action.
E ( K ) = R ( t ) e i K t d t
where
K = 2 π f u ¯
Figure 6 shows the resulting PSDs plotted at differing positions, with the upper charts showing the CO case and the lower charts showing the JSP case. The findings are consistent with observations made above: essentially, a reduction in energy at low K can be observed approaching the turbine rotor plane, and a more substantial reduction can be observed with depth—these findings can be observed for both the CO and JSP cases. Each plot generally tends towards the f 5 / 3 slope indicating that in general the measurements captured a portion of the inertial sub-range. At greater depths, where lower TI and higher Reynolds number were observed, some deviation from the f 5 / 3 slope can be observed—this is common to all traces but was seen to be most remarkable closer to the wave maker (at 3.3D). A difference in peak spectral energy for the highest point in the water column measured of 0.031 m2 s−1 was observed between the 3.3D upstream case and the measurements made in the rotor plane.
Figure 6 shows that the inclusion of the irregular wave in the JSP case led to the spectral peak at the wave number corresponding to the peak frequency F P , but had had little broadband effect. Interestingly, the relative contribution of turbulent energy to wave energy in flow transients can be observed in the lower charts. This was done qualitatively by considering the relative amplitudes at low wave numbers ( K < 1 ) and at the peak frequency, F P (in turbulent wave number space, K 5.5 ). All traces show that the turbulent energy generating region is dominant over wave contributions to fluid velocity fluctuations—which is in agreement with the findings of Figure 5. This shows that for the given wave maker submersion depth, turbine positioning and wave characteristics utilised, the waves’ contribution to fluid velocity fluctuations was smaller than the contributions of the larger turbulent structures developed by the blockage of the wave maker.
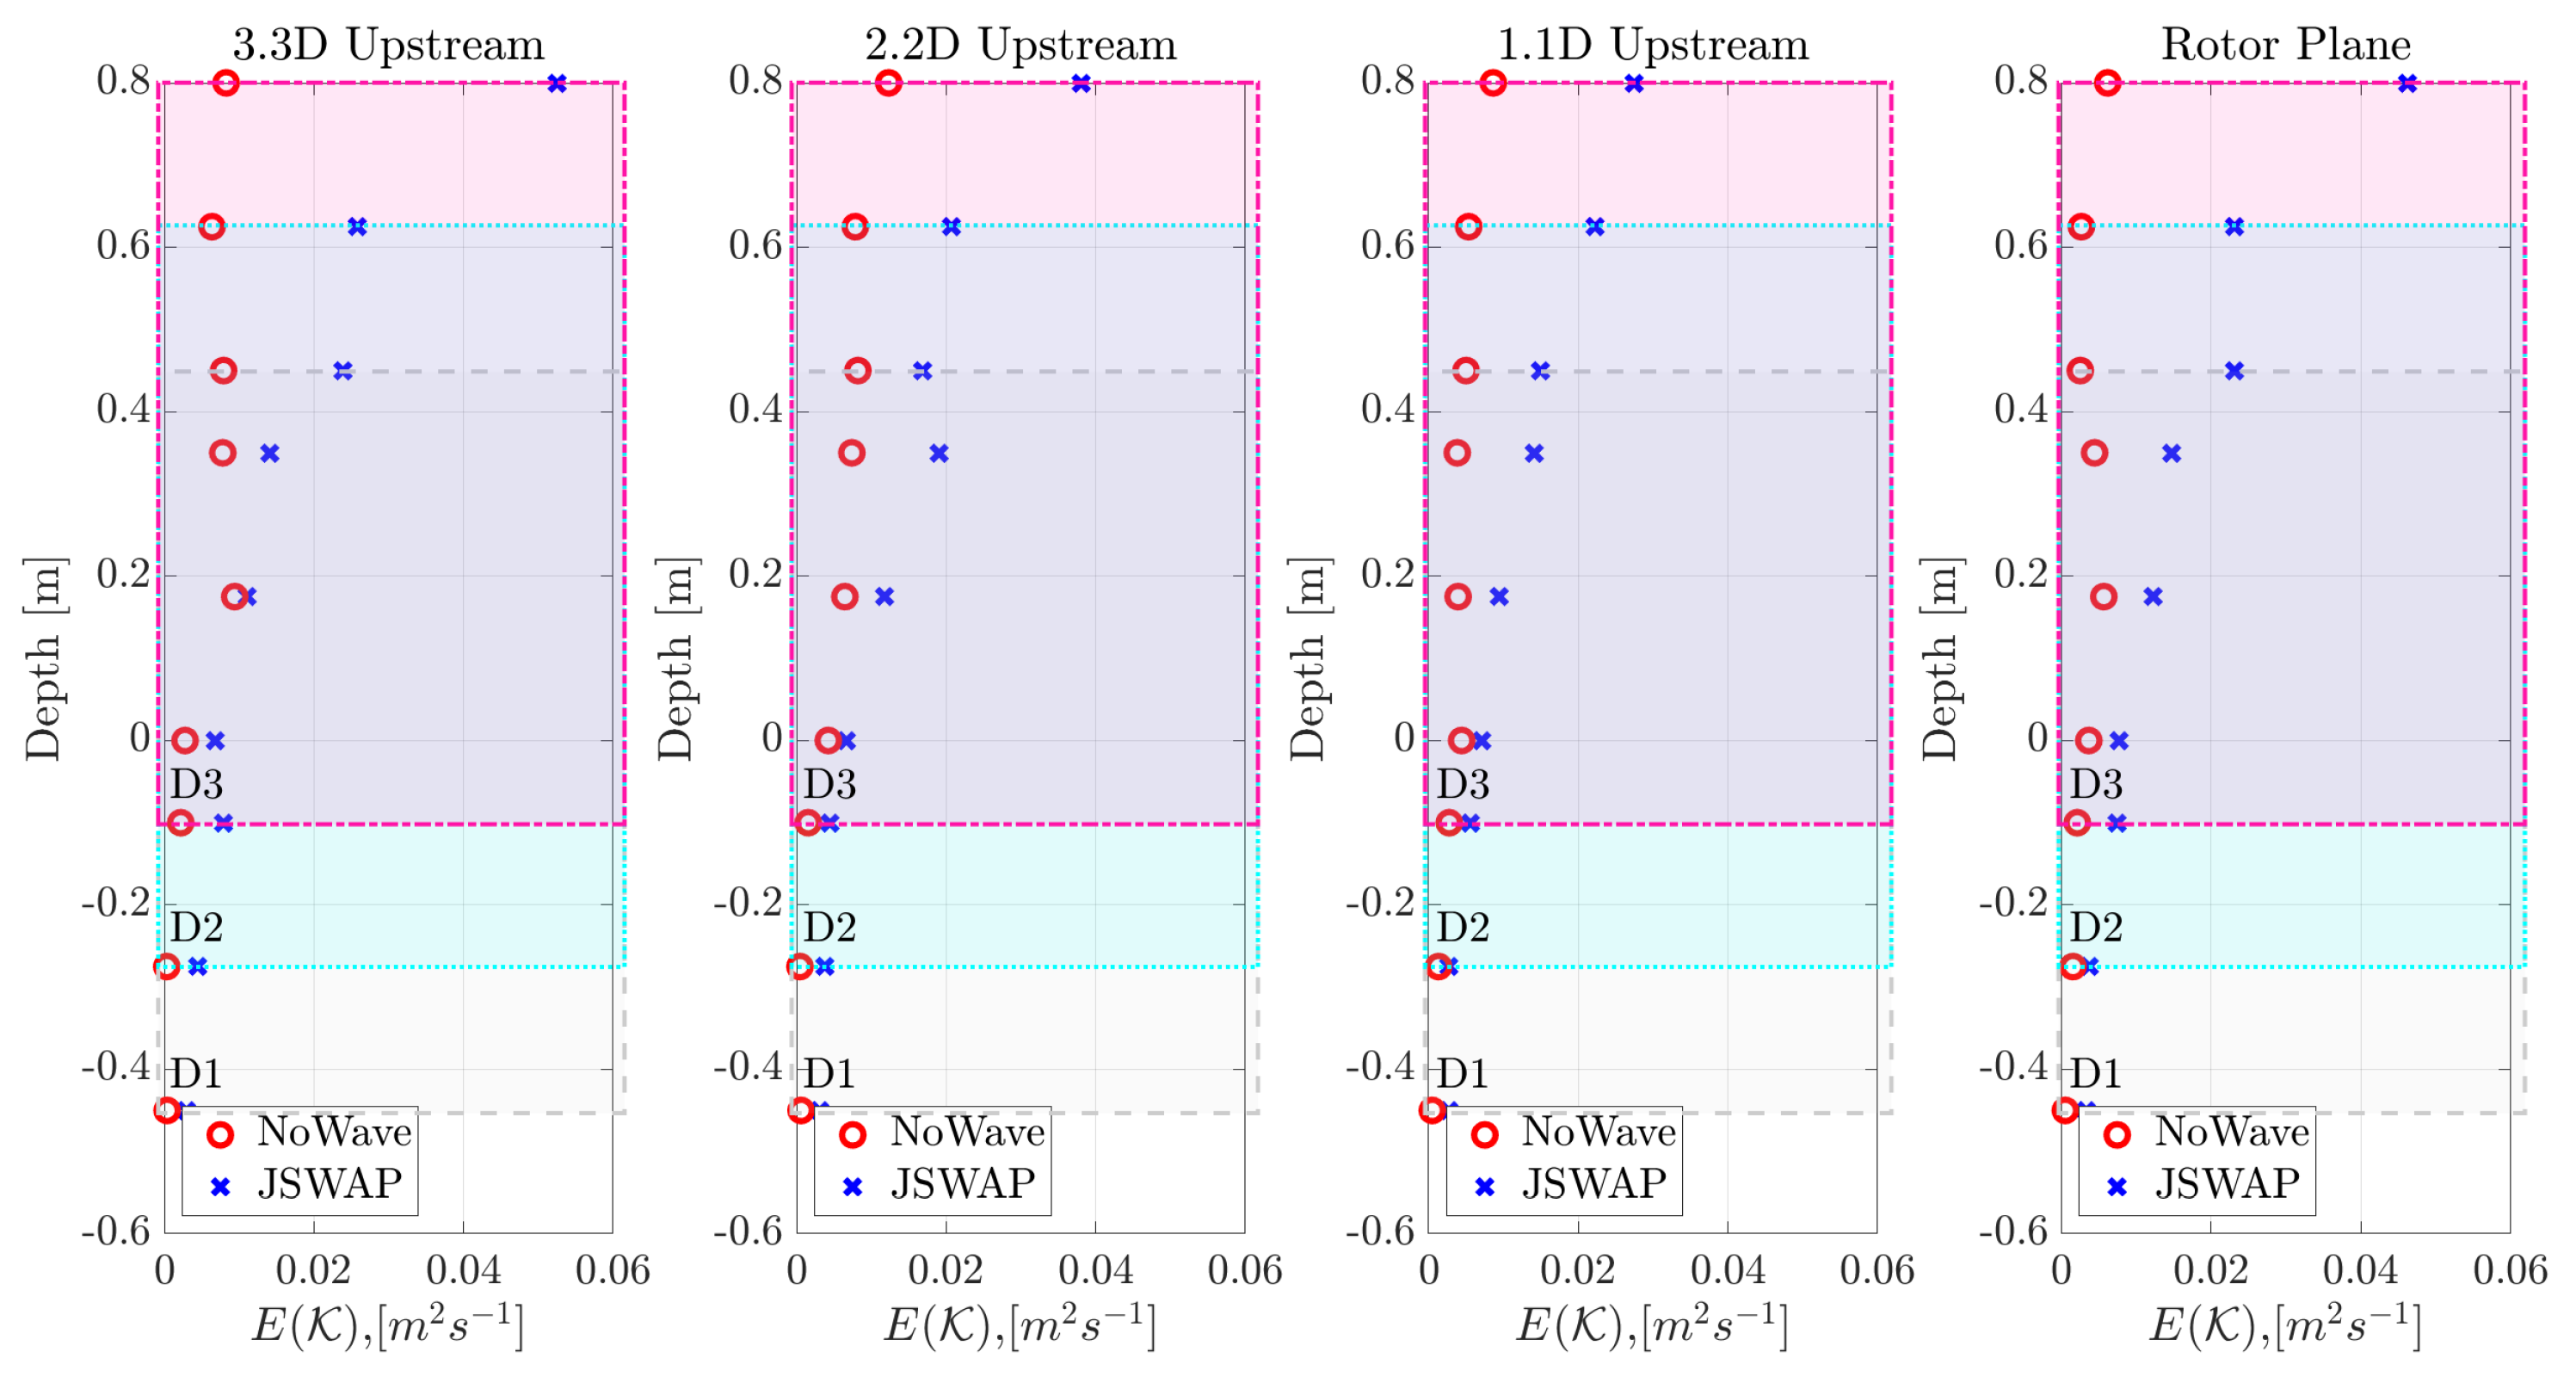
Figure 7 shows the spectral energy observed at the average wave frequency with the same amplitude plotted for the CO case for comparison. As expected, energy at this frequency is a function of depth. The greatest amplitudes were observed closer to the surface. The presence of the wave, whilst greater in the upper portion of the water column, did not show any discernible trends across LDV positions from 3.3D upstream to the turbine rotor plane.
The data analysis presented shows clearly the shear layer created in the flow by the wave maker producing both flow and turbulence profiles. The analysis also showed the impact of the irregular waves was clearly visible in the flow spectra and seemed to have an impact on mixing in the shear layer, but the wave effects by no means dominated over the turbulence effects produced by the presence of the wave maker.

4. Turbine Performance

4.1. Mean Rotor Performance

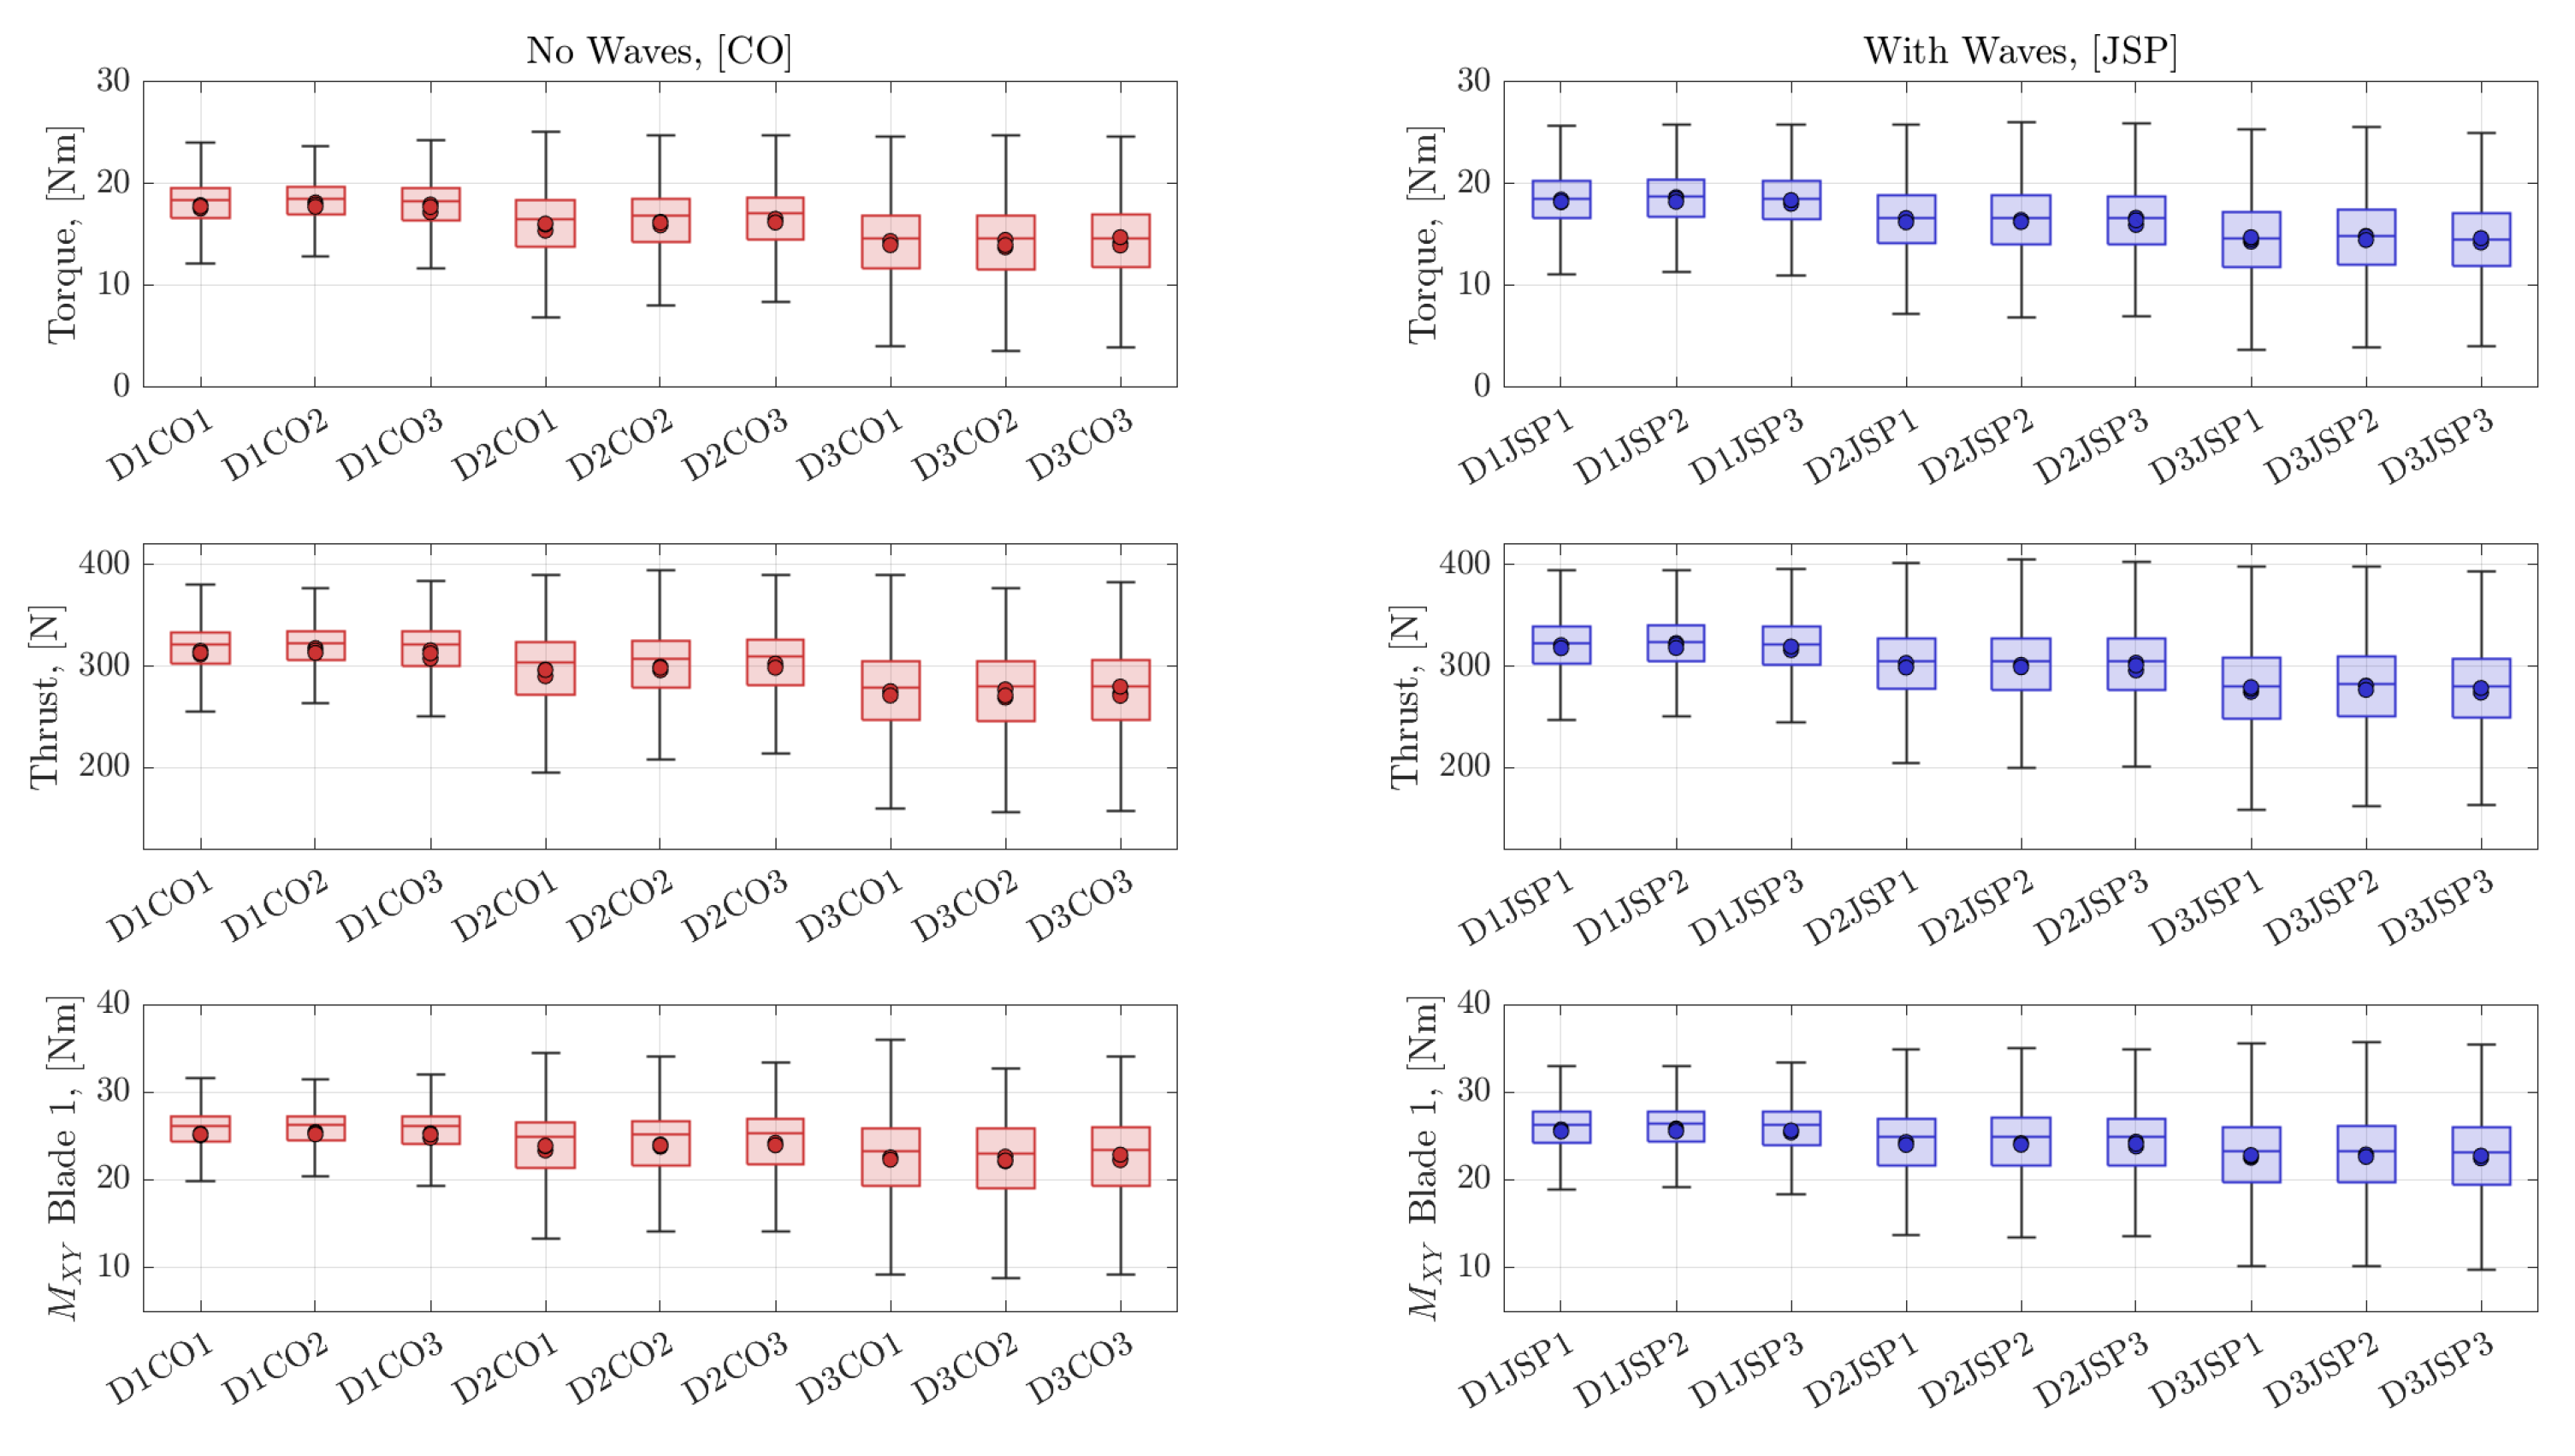
In this Section, the bulk statistics of the operational loads measured for each case are compared, facilitating a comparison of the rotor performance at different rotor depths, with and without the superimposed irregular waves. Figure 8 presents the box plots of the data recorded for torque, thrust and out-of-plane BRBM, M X Y . The horizontal line within each box indicates the median values of the dataset; the upper and lower bounds of the boxes show the upper and lower quartiles of the dataset, whereas the error bars indicate the maximum and minimum values observed—(note: data points a distance of 1.5 times the interquartile range away from the upper or lower bounds of the box have been omitted as outliers to aid presentation). The circles indicate the mean values for the datasets recorded; repeat cases are shown individually.
The upper chart in Figure 8 shows that the average values (mean and median) of the torque measured decreased with decreasing rotor depth, which is consistent with the flow profiles observed in the findings presented in Section 3. The mean values closer to the water’s surface (D3) were 20% lower than at 1 m depth (D1). An increasing spread of the torque data was observed with decreased rotor depth—again inline with the findings of Section 3, where greater turbulence intensity was observed closer to the water’s surface. Values of σ τ closer to the surface were found to be higher than the values at mid-depth by a factor of almost two. These general trends were consistent for both the CO and JSP cases—however, a slightly higher spread in the data was observed for the JSP cases due to the additional wave induced velocity fluctuations. All datasets showed a tendency towards negative skew; however, this tendency was stronger in the CO cases and in greater rotor submersion cases, with the greatest skew being observed in D1 and the least skew being observed in D3 cases.
As the rotor got closer to the water’s surface (D3), the average thrust reduced by ∼ 12 % of the values at depth D1. The reduction in the average thrust with decreasing rotor depth was due to the flow velocity deficit that was present towards the water’s surface (Figure 4). The difference in average thrust between CO and JSP cases was negligible (∼1% maximum). However, the scatter between repeat runs was higher for the current-only cases than for the irregular wave cases by a factor of around 1.5. The relative standard deviation σ T bars indicate that σ T increased as the rotor depth decreased. Closer to the water’s surface, σ T was larger than at mid-depth by a factor of 1.5.
The average BRBM, M X Y , decreased by a factor or 0.9 closer to the water’s surface, and the relative σ M X Y at the rotor’s top position was almost double the mid-depth values.
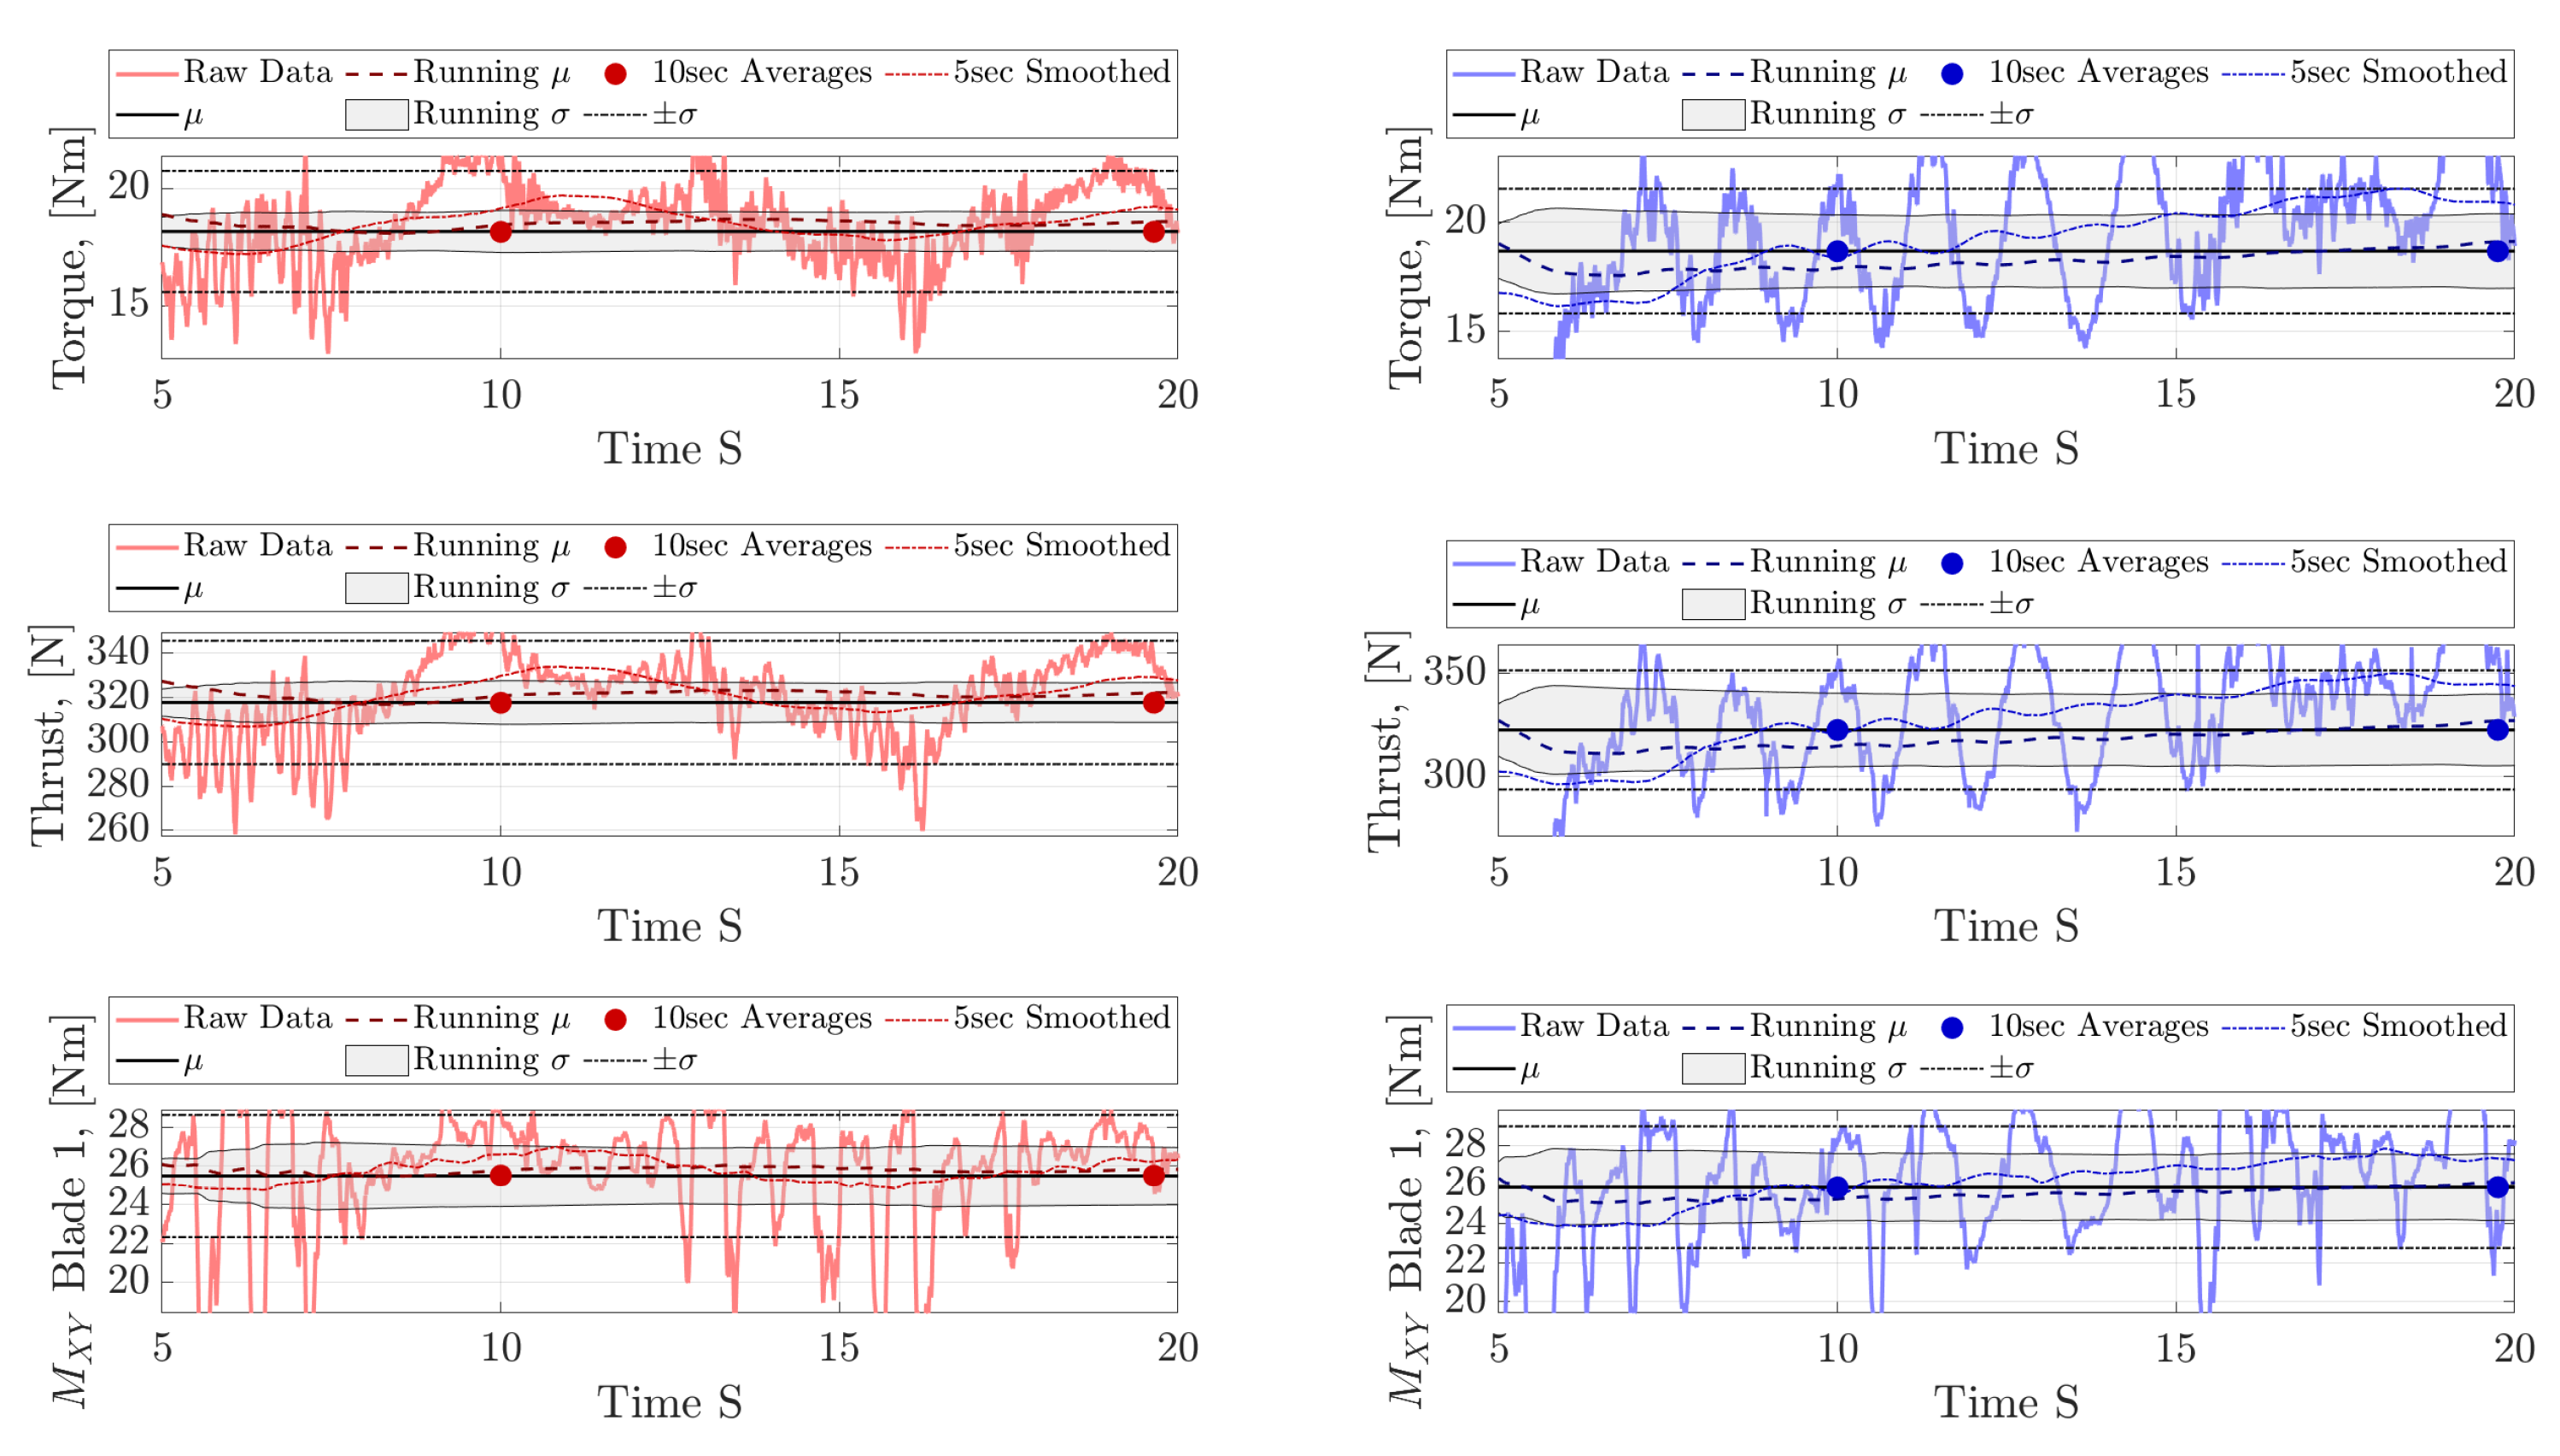
Figure 9 shows an example of the loading time series captured for an instance of the D1 depth case for both CO (left) and JSP (right) scenarios. The figure shows the development of the statistics with running mean and standard deviations plotted. Horizontal lines demarcating ± σ are also plotted. To consider aspects of processing the data, the results of processing the data through 10 s averages and smoothing the data via convolution with a 5 s window have also been presented. The upper and lower bounds of the y-axis for each plot have been set to the 5th and 95th percentiles of the plotted datasets, respectively.
Figure 9 shows that the mean and standard deviation converge to fixed values within a relatively short amount of time—a length of time far shorter than the length of the datasets gathered, giving us confidence in the statistics presented. In the rotor measurements, torque and thrust, the effect of the wave is relatively pronounced, and oscillatory behaviour arising from the wave can be seen in the right plots for torque and thrust. The effect of the wave is less clear in the blade BRBM plots, which exhibit a significant oscillation in both the CO and the JSP cases, which was presumably due to the rotation of the device through profiled flow. These plots starkly highlight effect of the phase deconstruction when summing blade loading over the rotor, as detailed in [39].
The 10 s mean values were found to be incredibly stable; this approach to processing the data has removed all transients from the datasets, which highlights the obvious requirement for compromise between data resolution versus data storage. The 5 s smooth data, generated via convolution with a simple uniform window function of 5 s length, showed good performance in reducing the spread of data whilst representing the effects of large flow structured on device loading. The following section addresses the cross-correlation between the measured LDV results and the loading quantities presented in this section.

4.2. Analysis of Cross-Covariance

To investigate the development of flow structures from measurement to impact on the scale model HATT, the cross-covariance between the measured LDV data and the device loading data was calculated via Equation (8), where X and Y are differing signals which are made explicit within the Figure 10, Figure 11, Figure 12 and Figure 13.
R X Y ( t ) = X ( t ) Y ( t t ) ¯ σ X σ Y
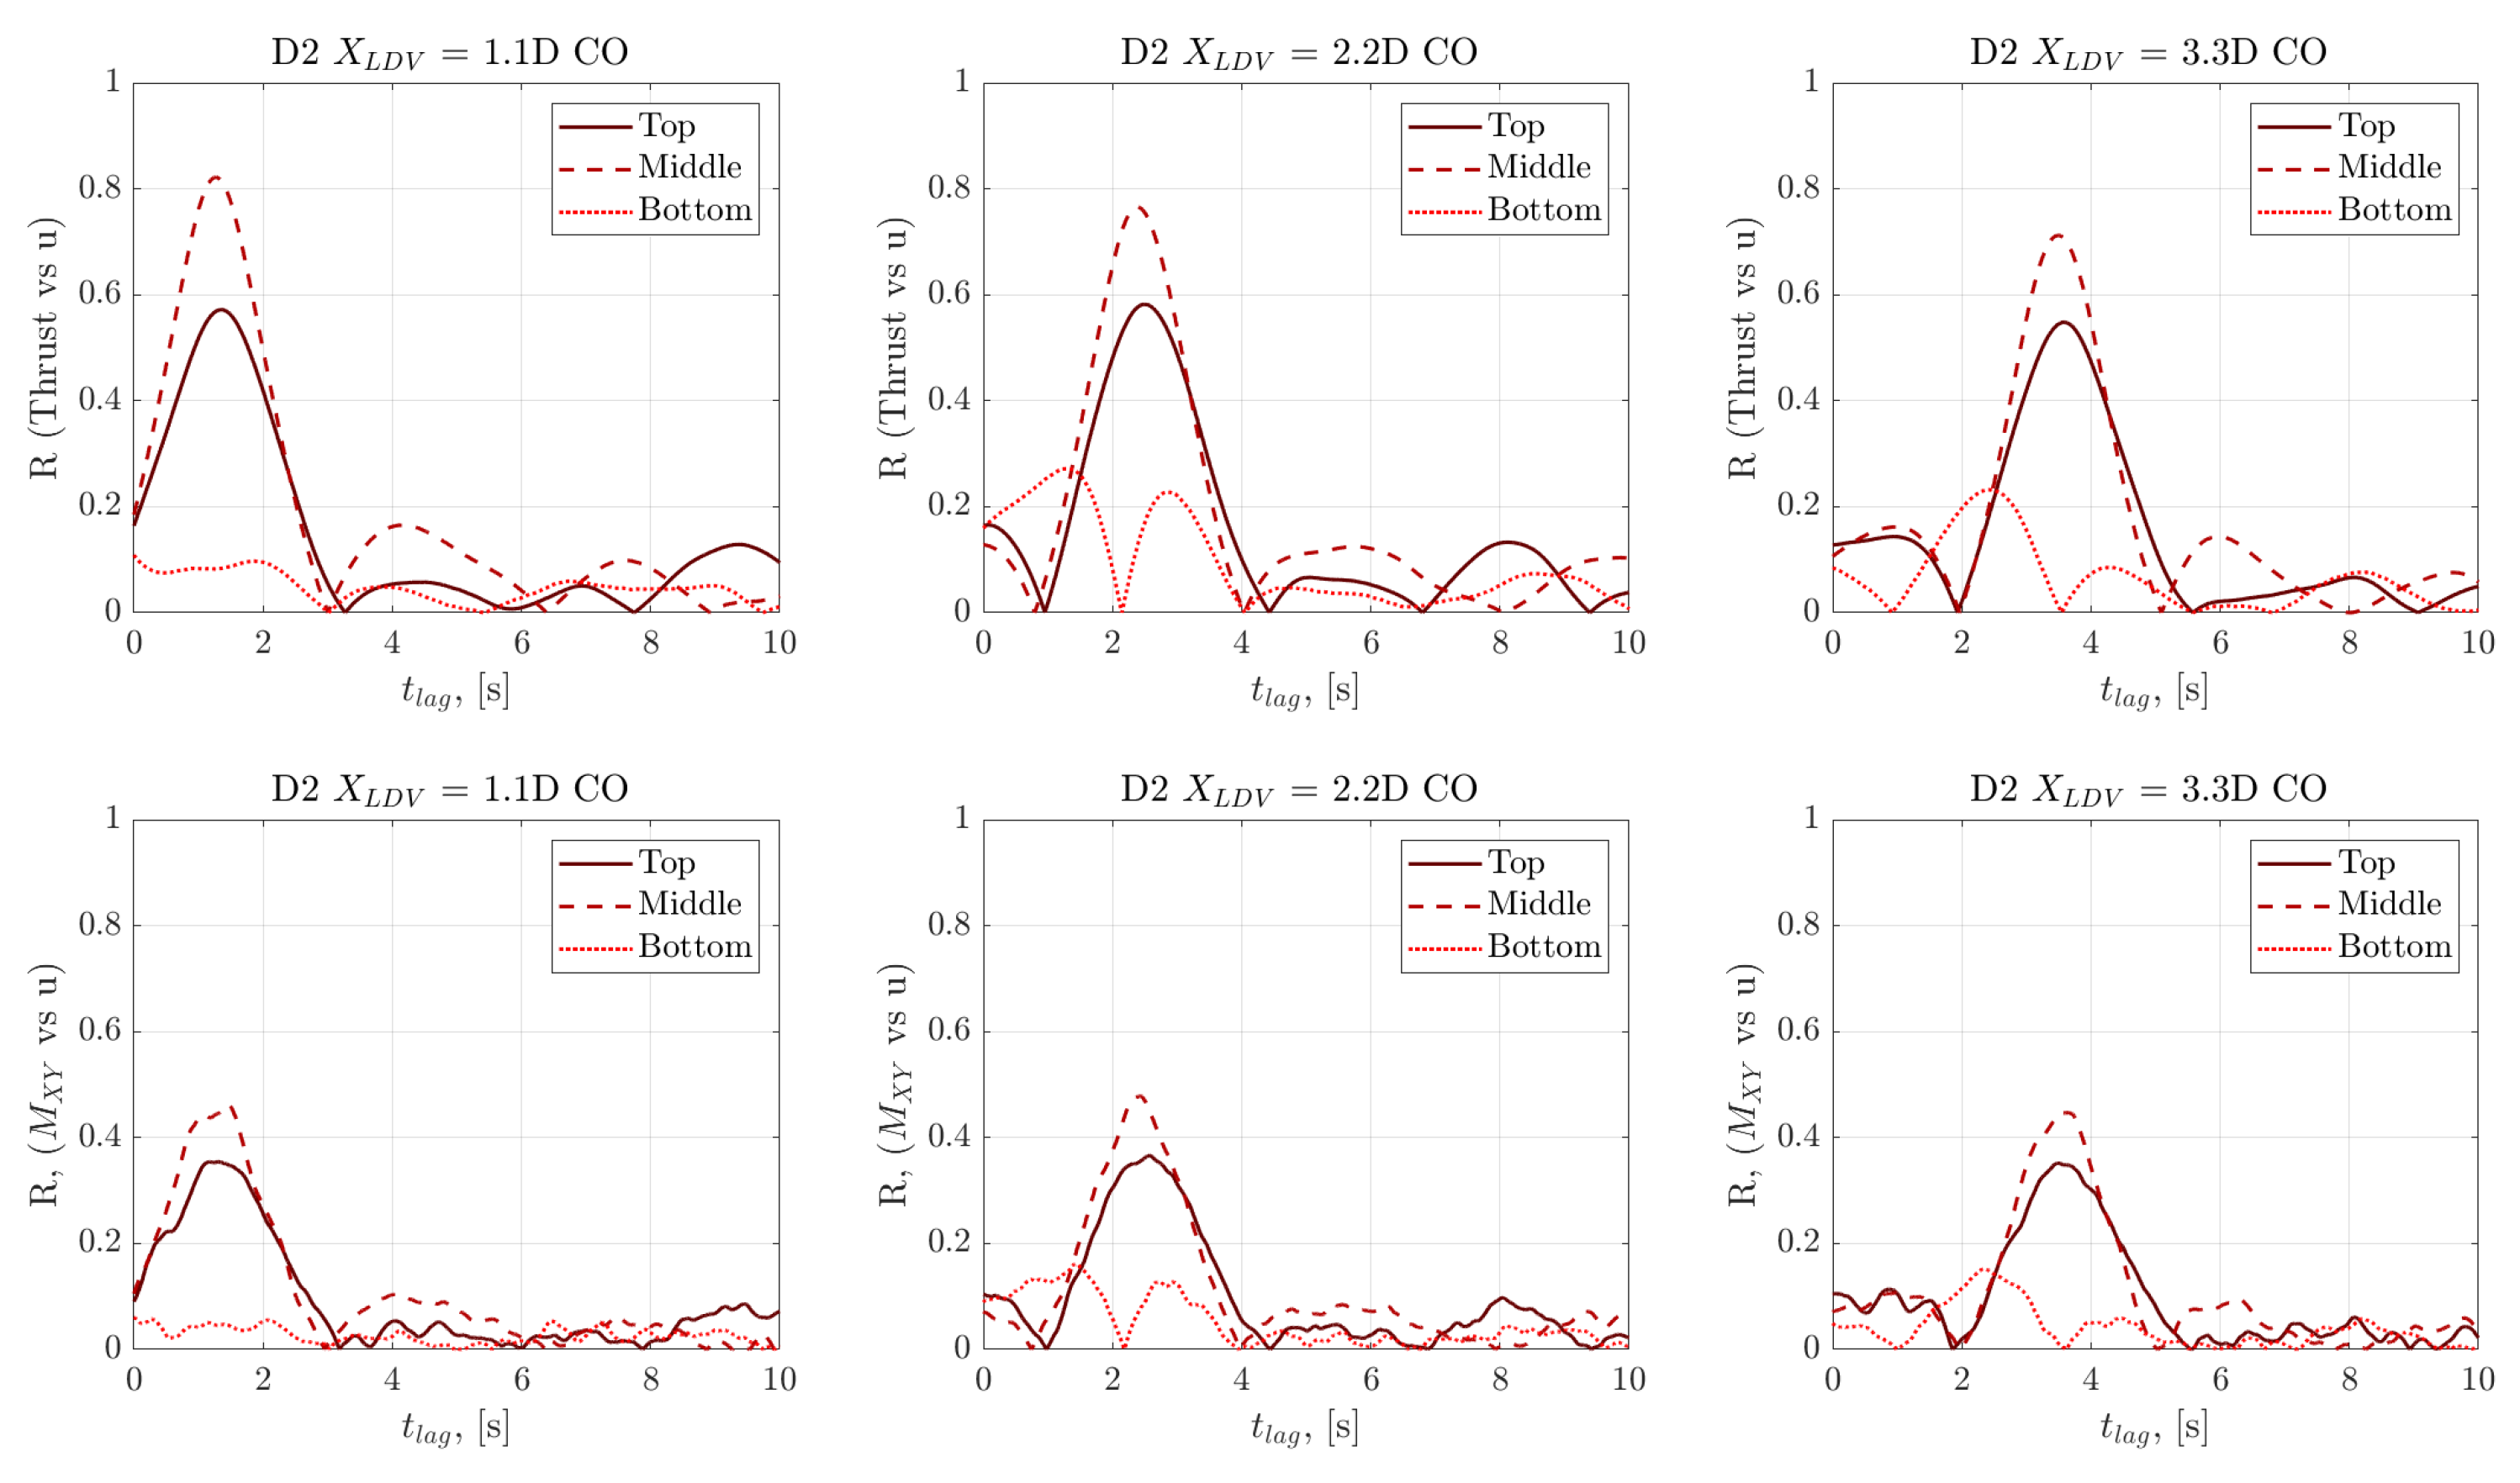
The development of the cross-covariance between the LDV measurements and the thrust (upper charts) and BRBM (lower charts) measurements is presented in Figure 10 for the depth D2 case and the range of upstream LDV positions undertaken. The charts show that for thrust and BRBM, a clear peak cross-covariance coefficient for each of the middle and upper LDV positions and all three upstream locations was found. The cross-covariance coefficient in these cases was significantly higher for the thrust cases rather than the BRBM cases, suggesting that structures in the flow (as characterised by the LDV measurements) impacted only partially the turbine rotor, thereby generating a smaller correlation between LDV measurements and blade loading. The lowest LDV position, aligned with the bottom dead centre of the blades, yielded far less clear results in the cross-covariance function, which was likely due to the effect of having the LDV located in a region where the flow perturbations measured were not representative of the characteristics of the flow experienced by the majority of rotor. The greatest cross-covariance coefficients were found when the LDV position was centred with respect to the rotor, whilst moderate agreement was found for the case where the LDV was positioned at the top dead centre of the rotor. Small periodic perturbations in the cross-correlation coefficients were observed and are potentially related to subsequent “eddies” passing through the LDV whilst previous “eddies” impacted the device.
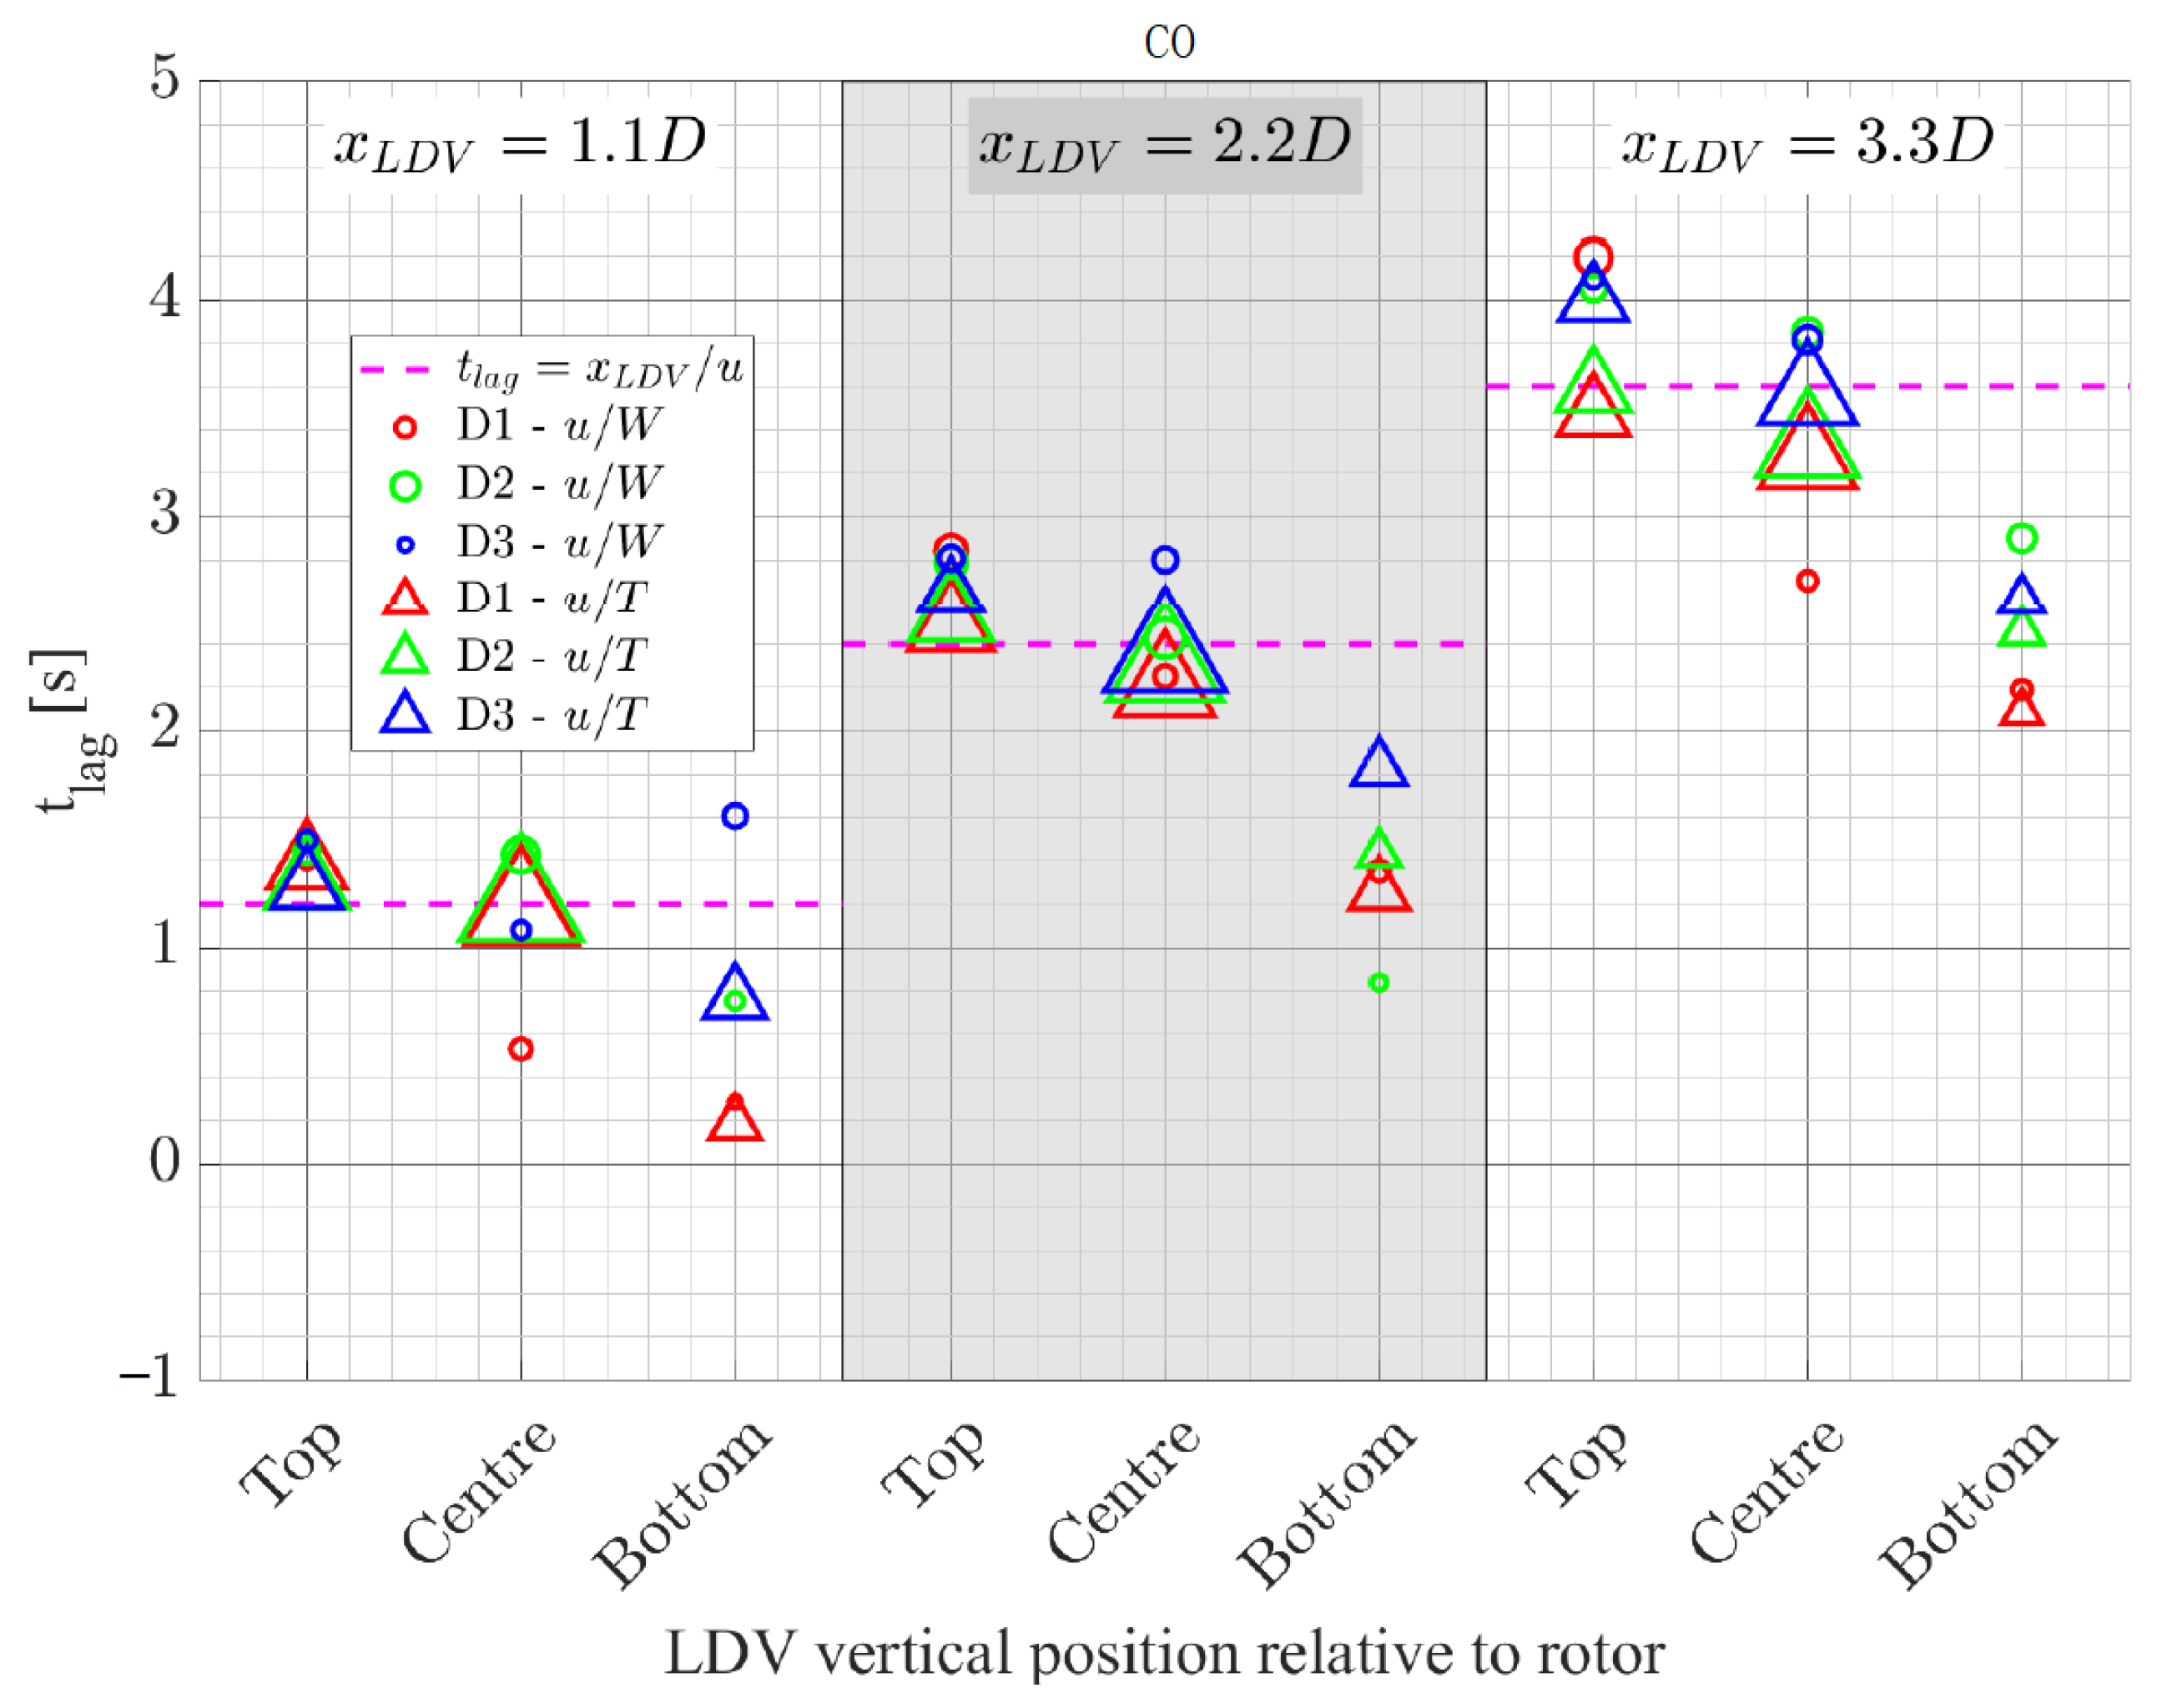
Figure 11 shows a summary of the time values observed for the peak cross-covariance coefficients calculated between the LDV and the rotor thrust signals ( u / T ) and between the LDV and the wave probe signals ( u / W ). The figure is supplemented by dashed lines representing the theoretical time lag values estimated utilising Taylor’s frozen hypothesis, which states that, for relatively small levels of turbulence, the turbulence structures are carried with the mean flow. As such, the theoretical time lags were calculated via t l a g = x L D V u . Within Figure 11, the horizontal axis is divided into three sections, one for each of the upstream distances between the LDV position and the rotor positions x L D V (1.1D, 2.2D and 3.3D). For the CO case in Figure 11, it seems that when the horizontal position of the LDV probe was closer to the rotor and the vertical position was in line with the centre of the rotor, the calculated lag t l a g had the best match between the theory and the cross-covariance function. For all x L D V , when the LDV is positioned at the top of the rotor, t l a g was higher than the theory and when it is positioned at the bottom of the rotor it is lower than the theory. This behaviour is consistent with the velocity depth profiles shown in Figure 4 in which the flow slows down as it gets closer to the water’s surface.
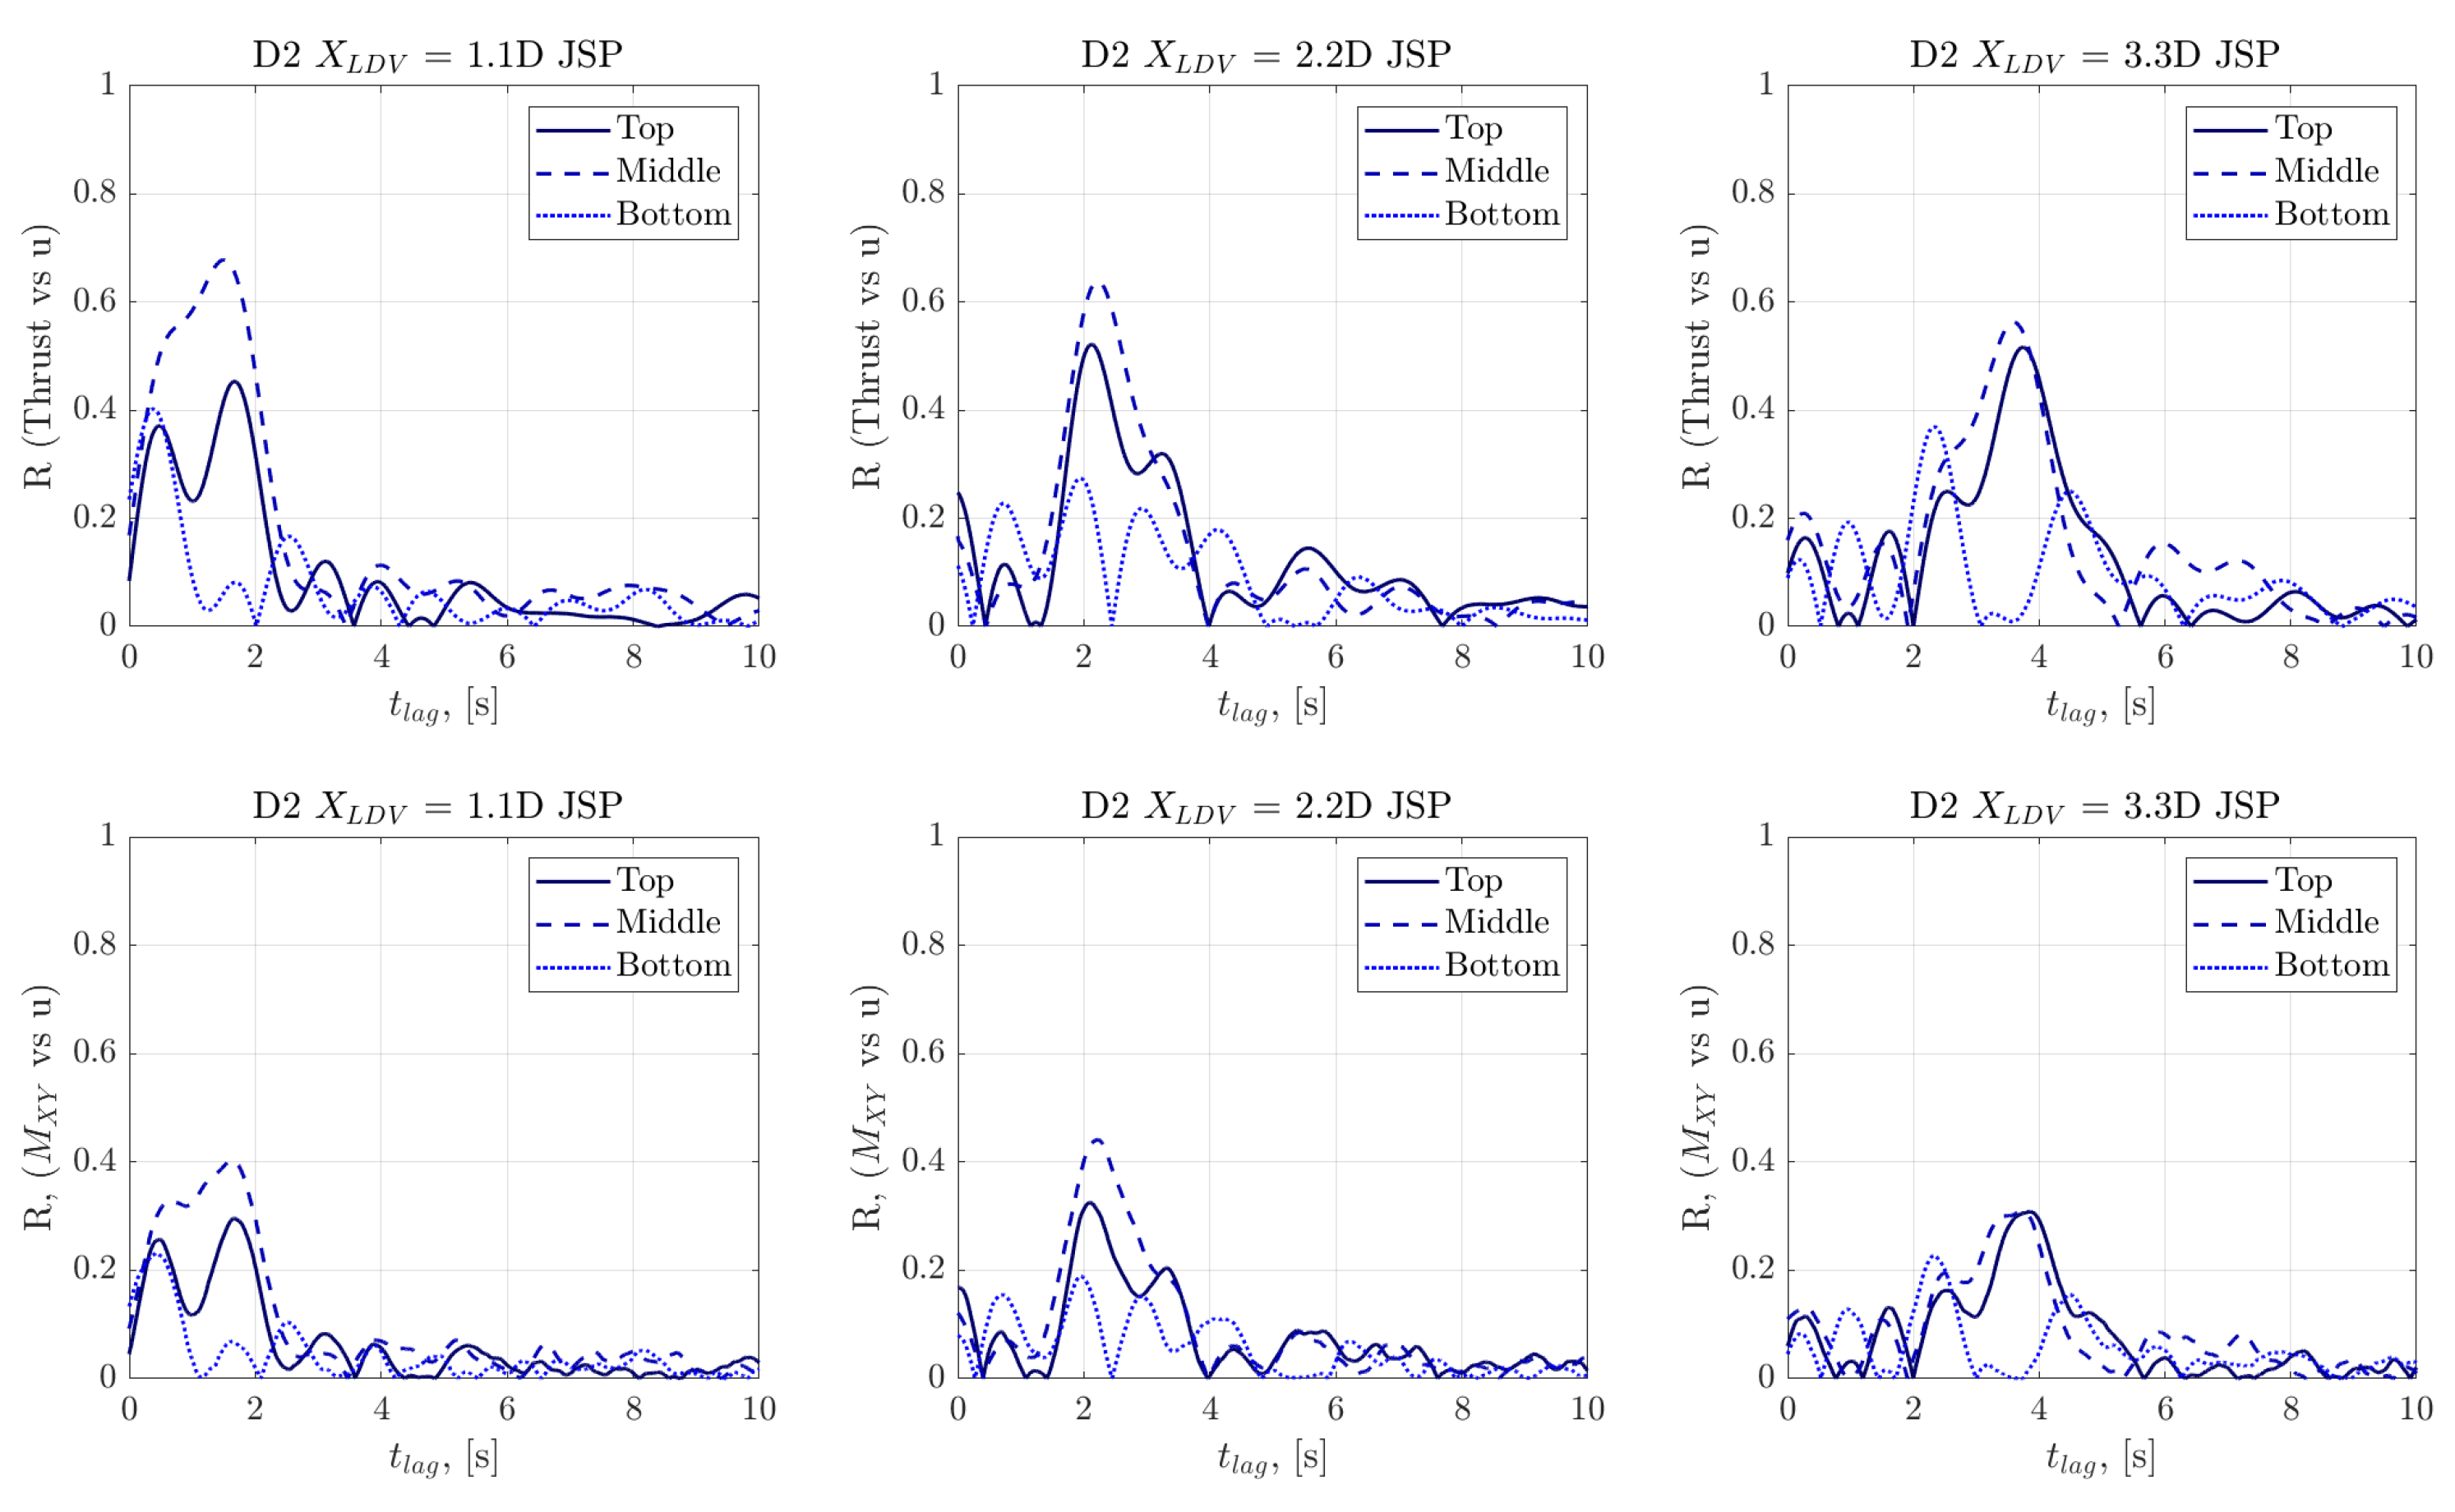
Figure 12 shows the cross-covariance coefficient against time lag for JSP cases for LDV vs. thrust measurements and LDV vs. BRBM measurements. Similar overall trends can be observed in Figure 12 as in Figure 10; however, the introduction of the irregular wave has created greater complexity, and as such, lower cross-covariance coefficient values were observed in the JSP case. The singular peaks observed in the upper and middle cases for the CO conditions are replaced with double peaks, which were created by the loose periodicity of the wave—this is further seen in the higher frequency cyclic nature of the background co-variance generated by the similarity between wave structures. To check this notion, the spectra of the plots were calculated to identify the peak frequency in the cross-covariance function, which was found to be ≈0.7 Hz, which coincides with the reciprocal of the average wave period of ≈1.4 s.
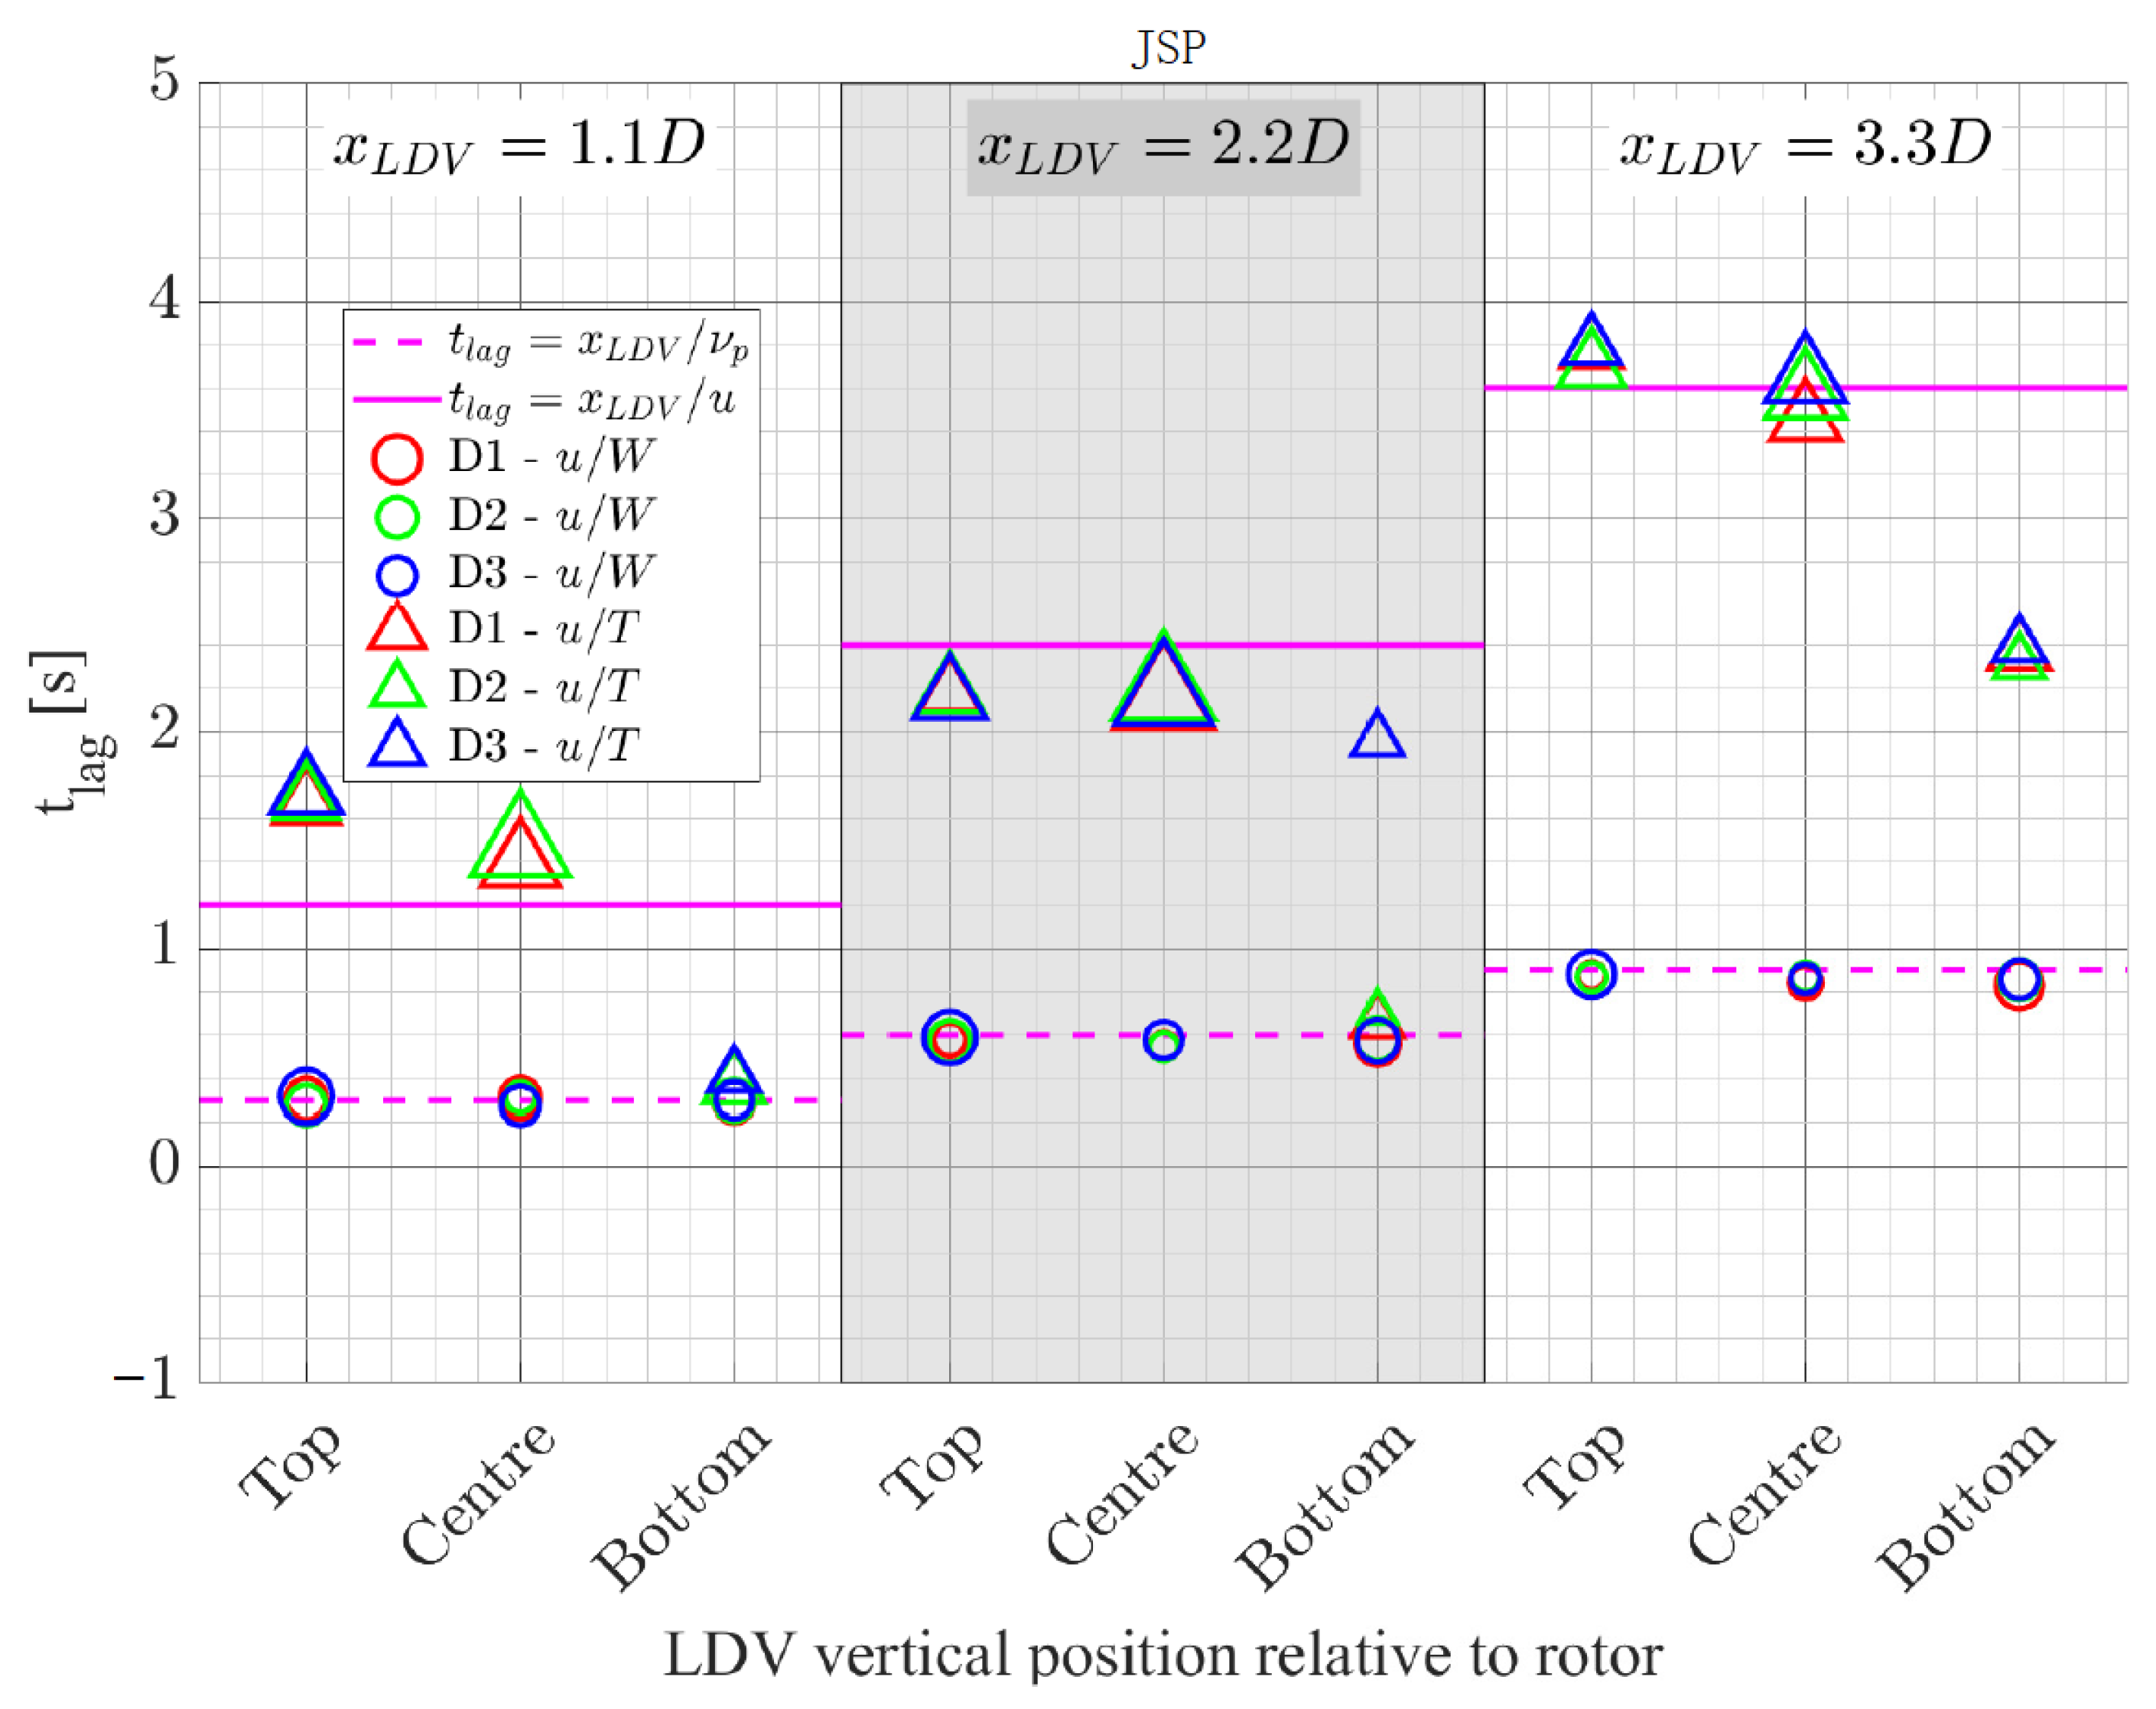
The cross-covariance function for the JSP case in Figure 13 has two distinctive t l a g values: one associated with the current velocity and Taylor’s hypothesis (solid lines) and a second one associated with the waves’ group velocity ν p (dashed lines) as given by Equation (A12) in Appendix A. Compared with the CO case (Figure 11), the u / T correlation behaves in a similar manner. The difference in the calculated t l a g was due to the wave orbitals in the water column, which are also believed to have caused the double peaks in Figure 12. On the other hand, t l a g calculated with the u / W correlation has an almost exact match with the theory (dashed lines) regardless of the LDV position relative to the rotor. In the presence of waves, R values of the u / W cases are higher than in the CO case.

4.3. Variation of Blade Root Bending Moments

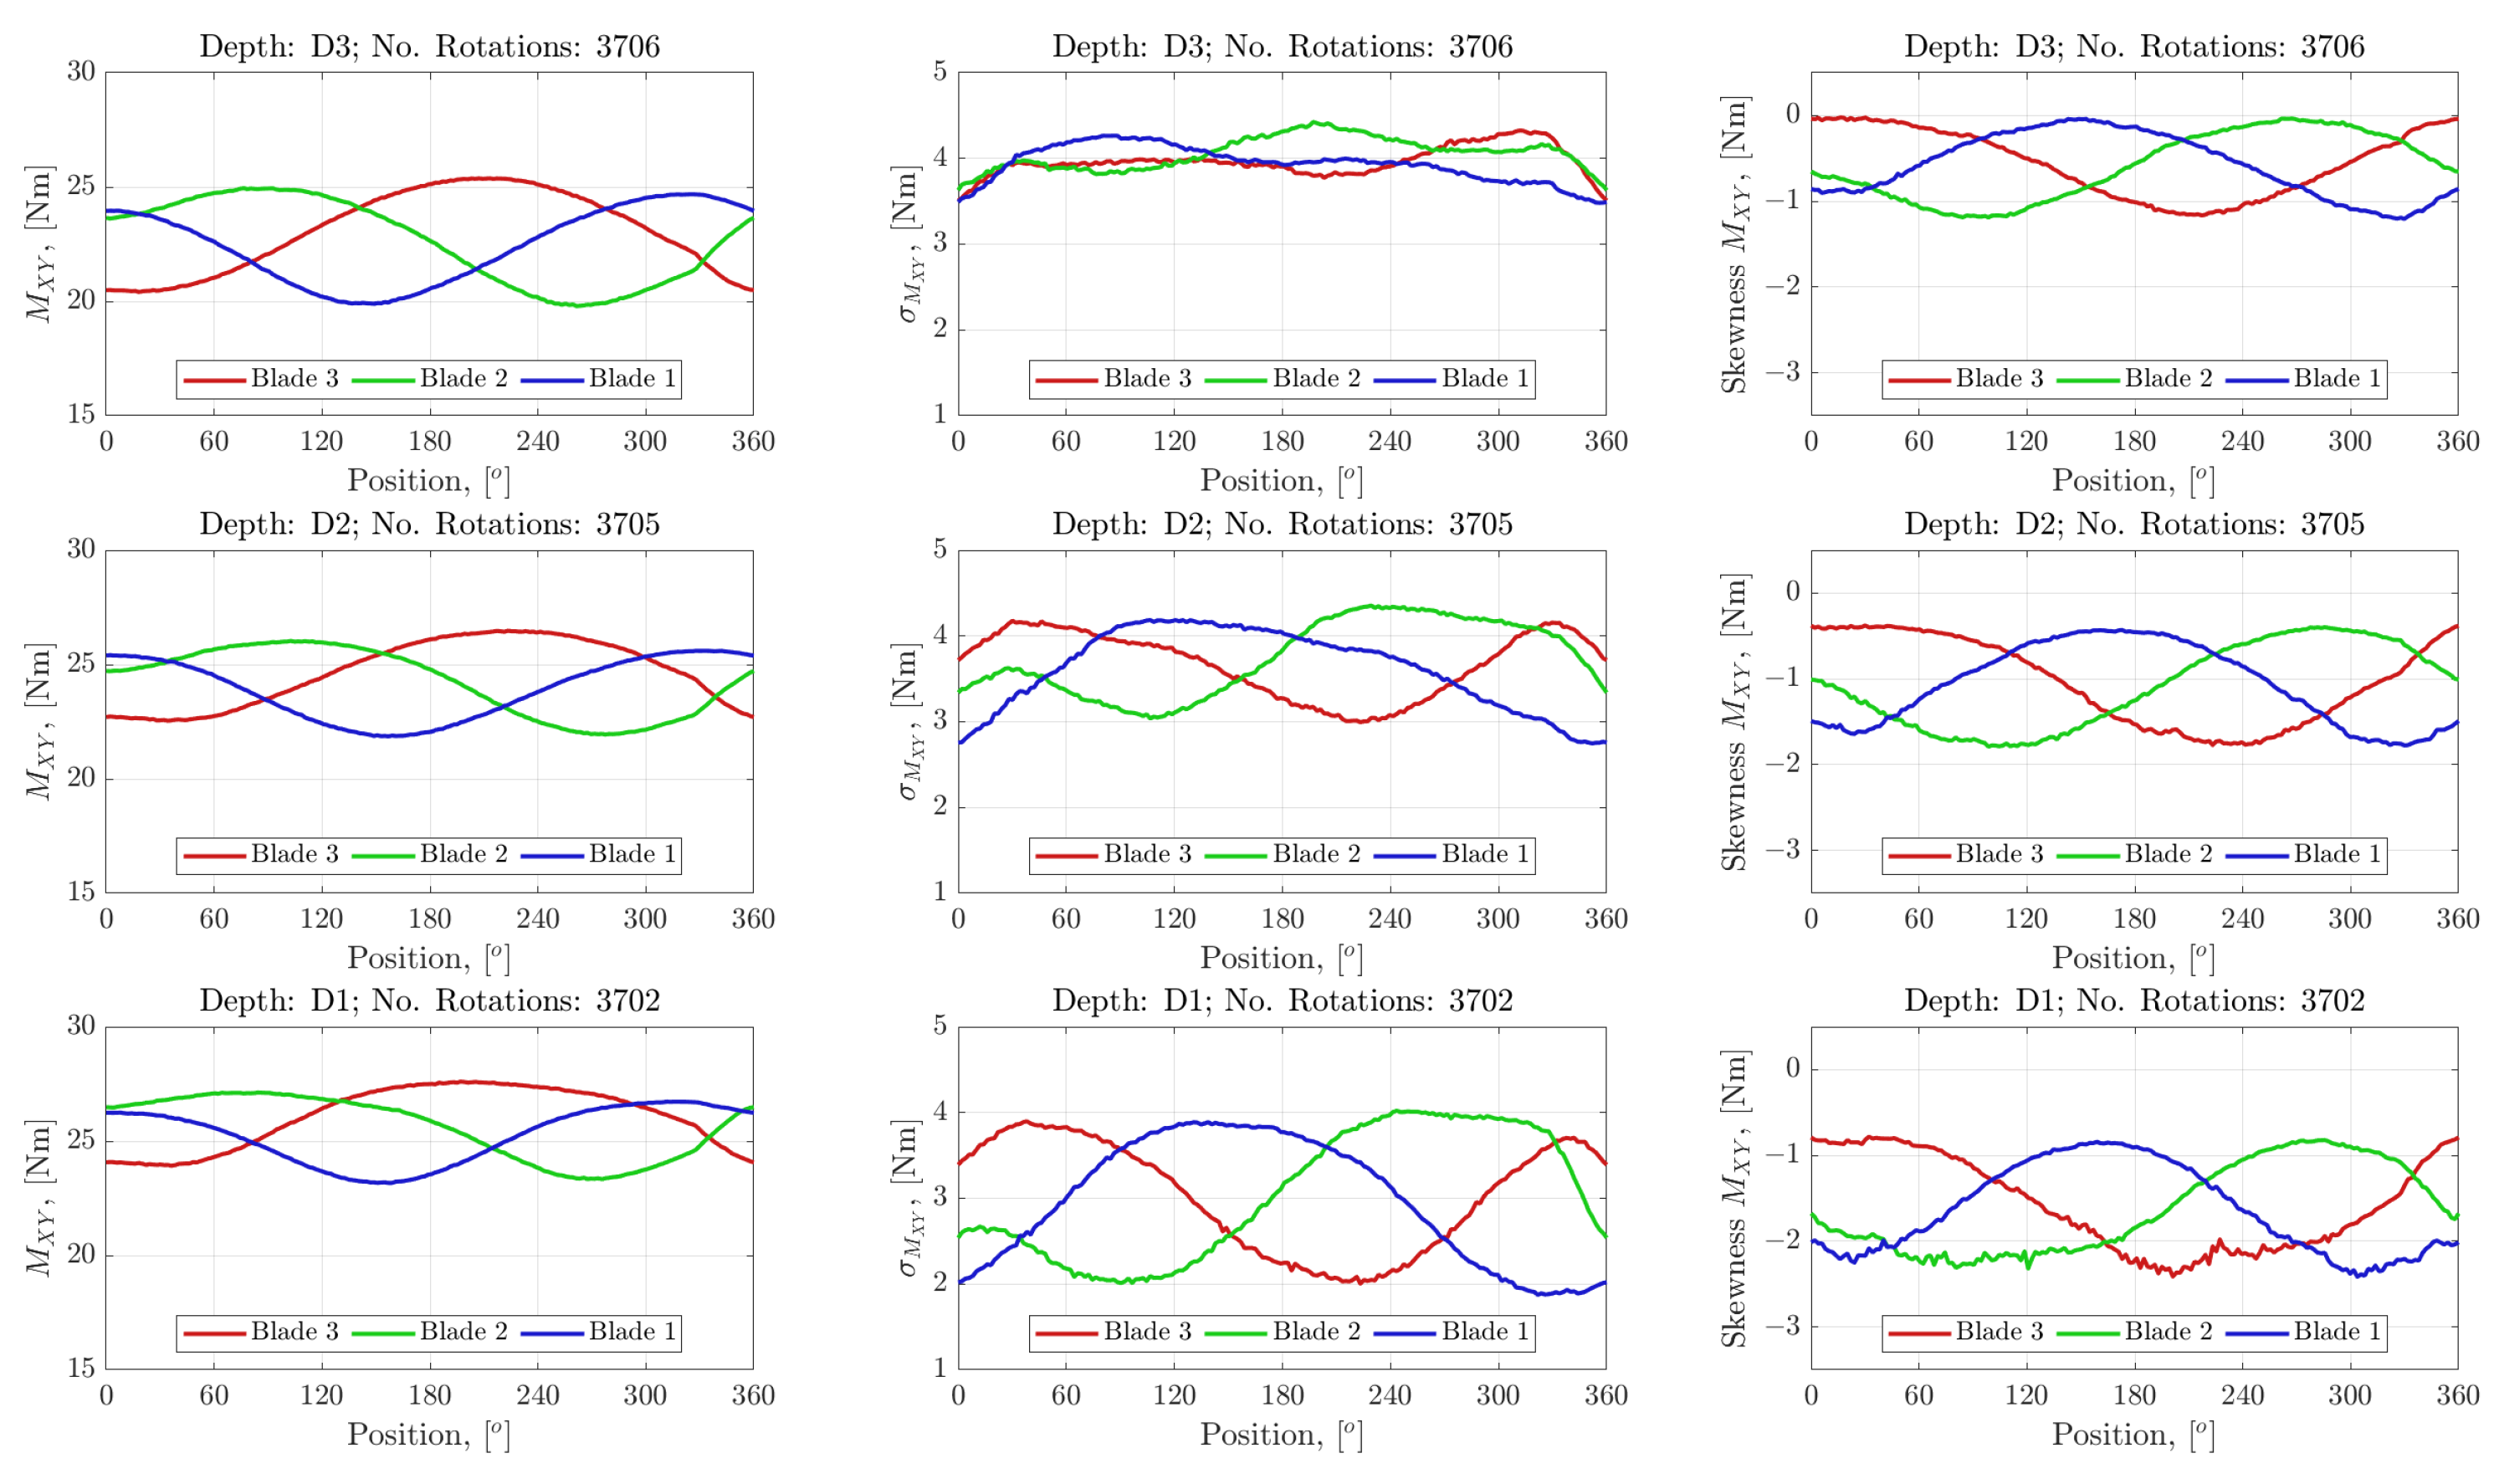
A statistical analysis of the variation of the out-of-plane BRBM, M X Y , with turbine positions, is presented for each blade. The approach here is to characterise the effects of operating with differing portions of rotor in the shear layer developed, as detailed in Section 3, by analysing the device’s operation at the different depths, with and without the presence of the irregular waves. The positional analysis was utilised to observe periodicity in the loading statistics due to the rotation of each blade through the shear layer and profiles (both velocity and turbulent) observed in the flow. To undertake this analysis, time synchronous averaging (TSA), as detailed in [40], was utilised. This involved re-sampling the M X Y data for each case onto specified rotor positions, which was achieved by utilising the synchronised encoder measurements. The relatively long datasets facilitated a statistical description of the BRBM for each of the re-sampling positions, as the data from the three experiments conducted for any particular depth and wave cases were combined, giving approximately 3700 and 5200 rotations over which the statistics were developed for the CO and JSP cases, respectively.
Figure 14 shows, for the CO case, the probability density function for M X Y against rotational position plotted as a surface for each turbine depth. Overlaid onto the plots are the mean, median and modal averages. The figures show clearly that the TSA process can be used to develop and understanding of the “average” cyclic load on the blade root and can be used to characterise the effects of both the flow profile and the turbulence profile in terms of the probability of the blade generating a particular value of M X Y given the blade position.
Within Figure 14 and Figure 15 the 120 phase shift between blades can be easily observed—we note that the device was set up such that the 0 reference was set when blade 3 was vertically upwards. It can be seen that each blade produced a smaller M X Y as it swept upwards through shear layer created in the wake of the wave marker, resulting in the cyclic drop in bending moment per revolution. This reduction in M X Y towards the upper portion of the rotation was reduced with increasing depth; conversely, the average traces generally increased in magnitude as greater portions of the rotor moved out of the wake of the wave maker and into the accelerated flow in the bypass region lower down the water column, i.e., moving from D3 to D1.
The PDFs suggest that a there is a greater spread of the data towards the top of the water column (D3), which is more evenly spread throughout the rotation, whereas at D1, the greatest installation depth, the spread of data is reduced but has become more position dependent—a smaller spread can be seen for when the blade was in the lower portion of the rotor sweep compared to when the blade was at the top of the rotation. This can be further observed in Figure 15, where the development of the periodicity of the standard deviation with depth is very clear, along with the increase in overall magnitude of the standard deviation as one moves further into the wake of the wave maker, i.e., from D1 to D3. The periodicity developed with increasing depth can be seen to be 180 out of phase with the mean loading oscillations, which arose due to the inverse mean flow and TI profiles generated by the setup; see Section 3.
Figure 15 also presents the variation in the skewness of M X Y with position and depth. As with the standard deviation, oscillations in the skewness increased with increasing depth. The periodicity was found to be in-phase with the mean loading and generally negative. Inception of the PDF surfaces in Figure 14 suggests the periodic structure of the skewness may in part have arisen due to the spreading, and the potential bi-modality in some cases, of the PDF when each blade was at the top, dead centre—i.e., at 0 for Blade 1. This notion is supported by the more chaotic nature of the mode average trace in the regions of lower average M X Y .
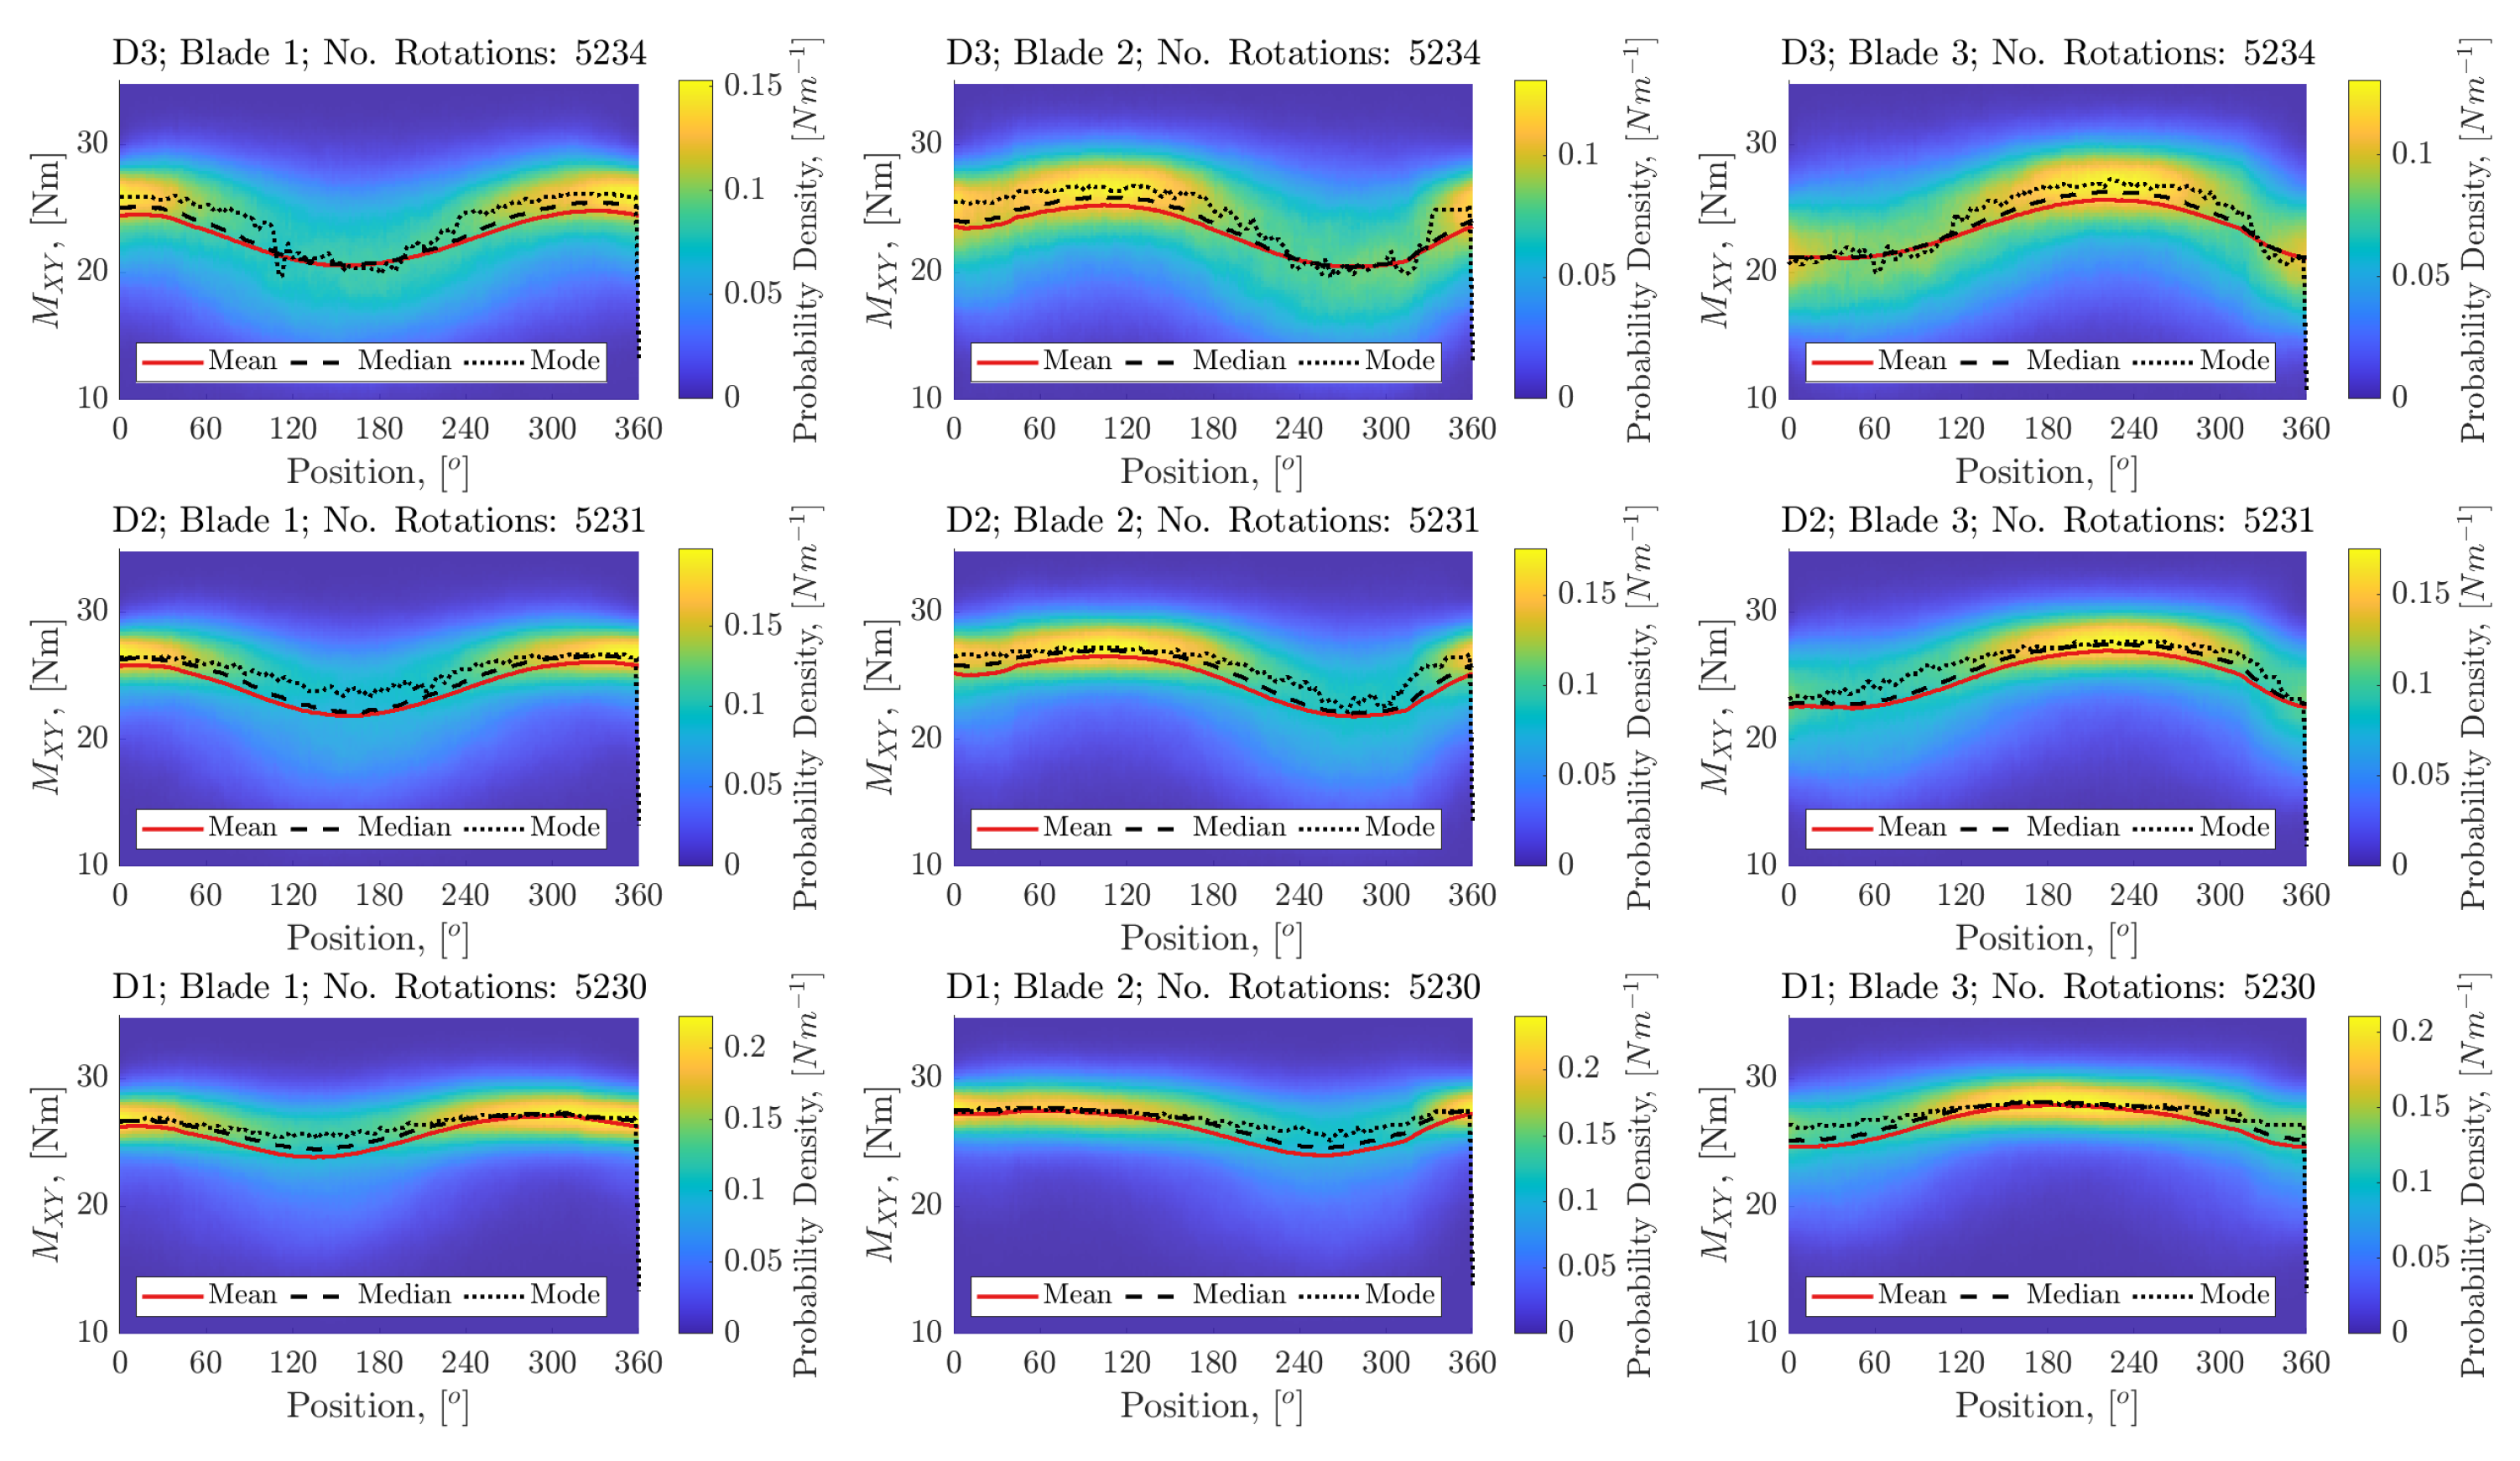
Figure 16 shows, for the JSP case, the probability density function for M X Y against rotational position plotted as a surface for each turbine depth again with the mean, median and modal averages overlaid. The figures again show clearly that the TSA process can be used to develop and understanding of the “average” cyclic load on the blade root and can be used to characterise the underlying periodicity in the presence of the irregular waves.
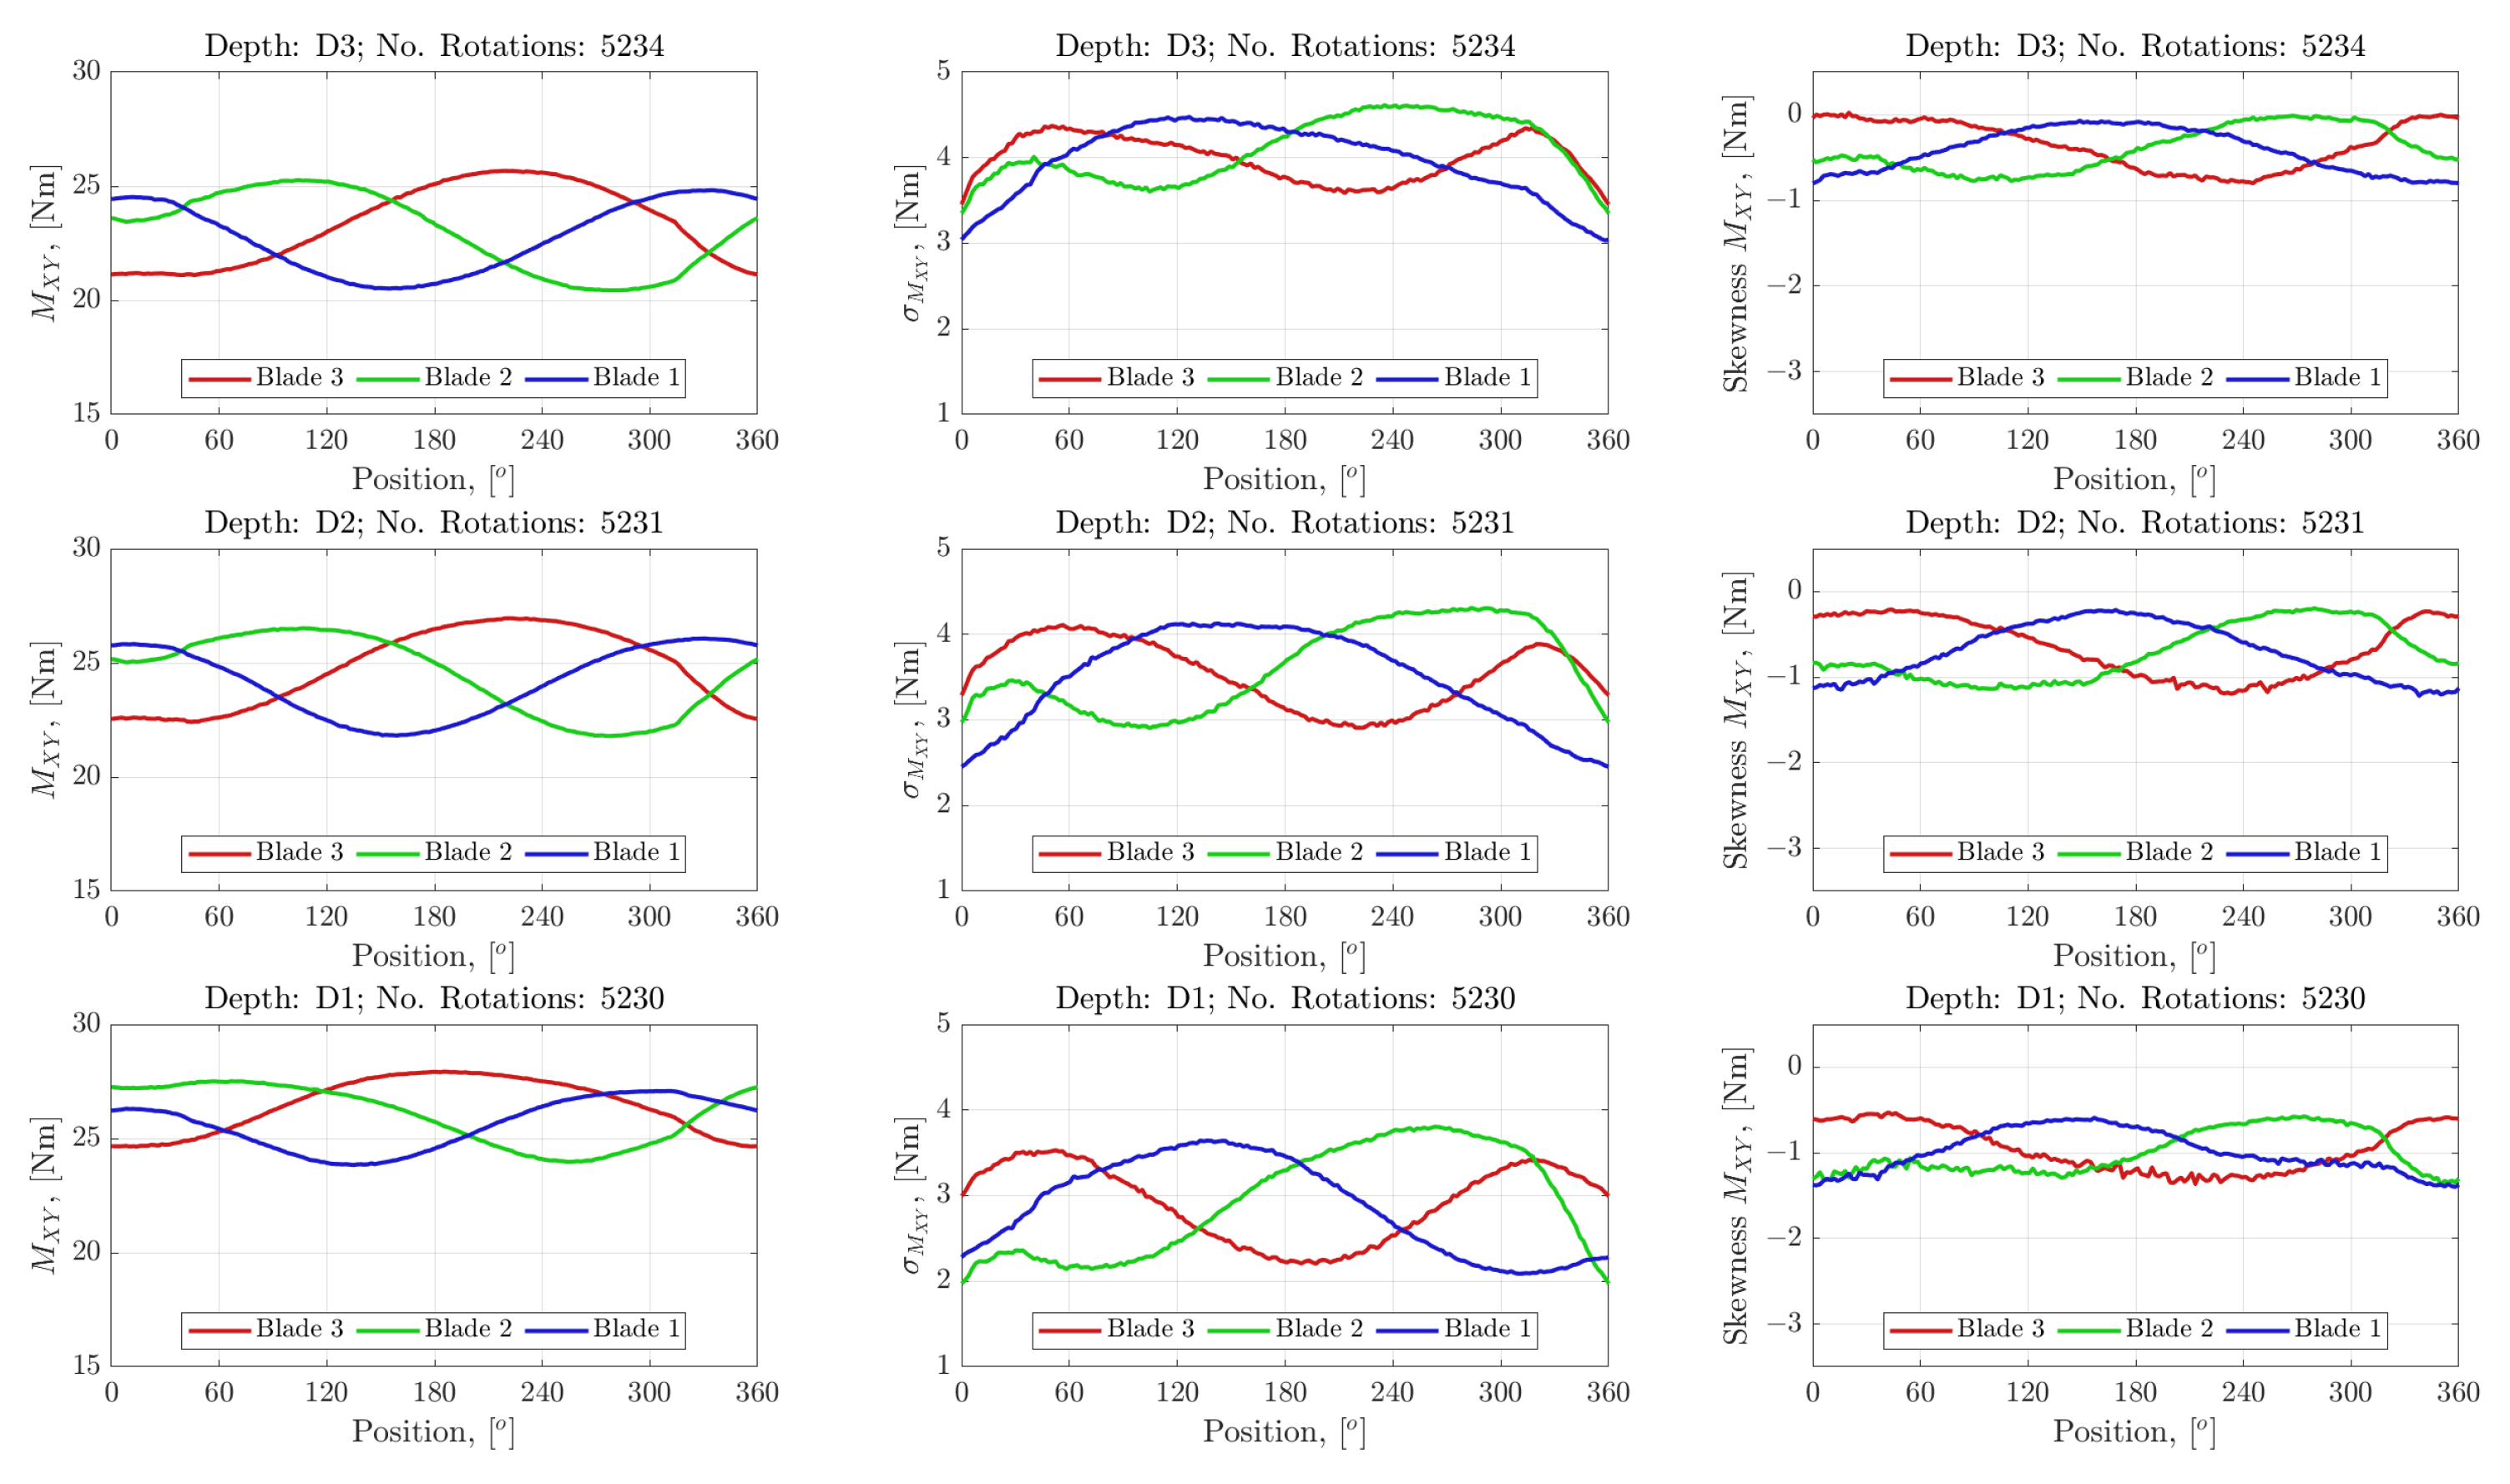
Within Figure 16 and Figure 17, as with the CO case, the 120 phase shift between blades can be easily observed—again, we note that the device was set up such that the 0 reference was set when blade 3 was vertically upwards. Again, each blade produced a smaller M X Y as it swept upwards into the wake of the wave marker, resulting in the cyclic drop in bending moment once per revolution. This reduction in M X Y towards the upper portion of the rotation was again reduced with increasing depth. The average traces generally increased in magnitude as greater portions of the rotor moved out of the wake of the wave maker and into the accelerated flow in the bypass region lower down the water column, i.e., moving from D3 to D1.
The PDFs suggest that a there is a greater spread of the data towards the top of the water column (D3). The extent of the spread of BRBM is more notable for the JSP cases, particularly at the upper portion of the water column where the effect of the wave was greater. The spread of the data appears to be more consistent with position, and as such the development of positional dependency on the spread of data is not as clear in Figure 16 as in Figure 14. An increase in overall magnitude of the standard deviation as one moves from depth D1 to D3 is still relatively pronounced, again, following the turbulence profiles, and in this case due to the impact of superimposed waves. Furthermore, the effect of depth with respect to the periodicity of the spread of data is not clear. The reduced oscillations in standard deviation can be seen to be 180 out of phase with the mean loading oscillations—again arising due to the inverse mean flow and TI profiles generated by the setup; see Section 3.
Figure 17 also shows the relationship between depth and level of Skewness does not hold in JSP case and the amplitude of the periodic variation in skewness is reduced greatly. This was reflected in Figure 16 where agreement between the three average measures (mode, median and mean) is generally better with all three representing the centre of the PDFs which was not the case in Figure 14.

5. Spectral Analysis

5.1. Power Spectral Density

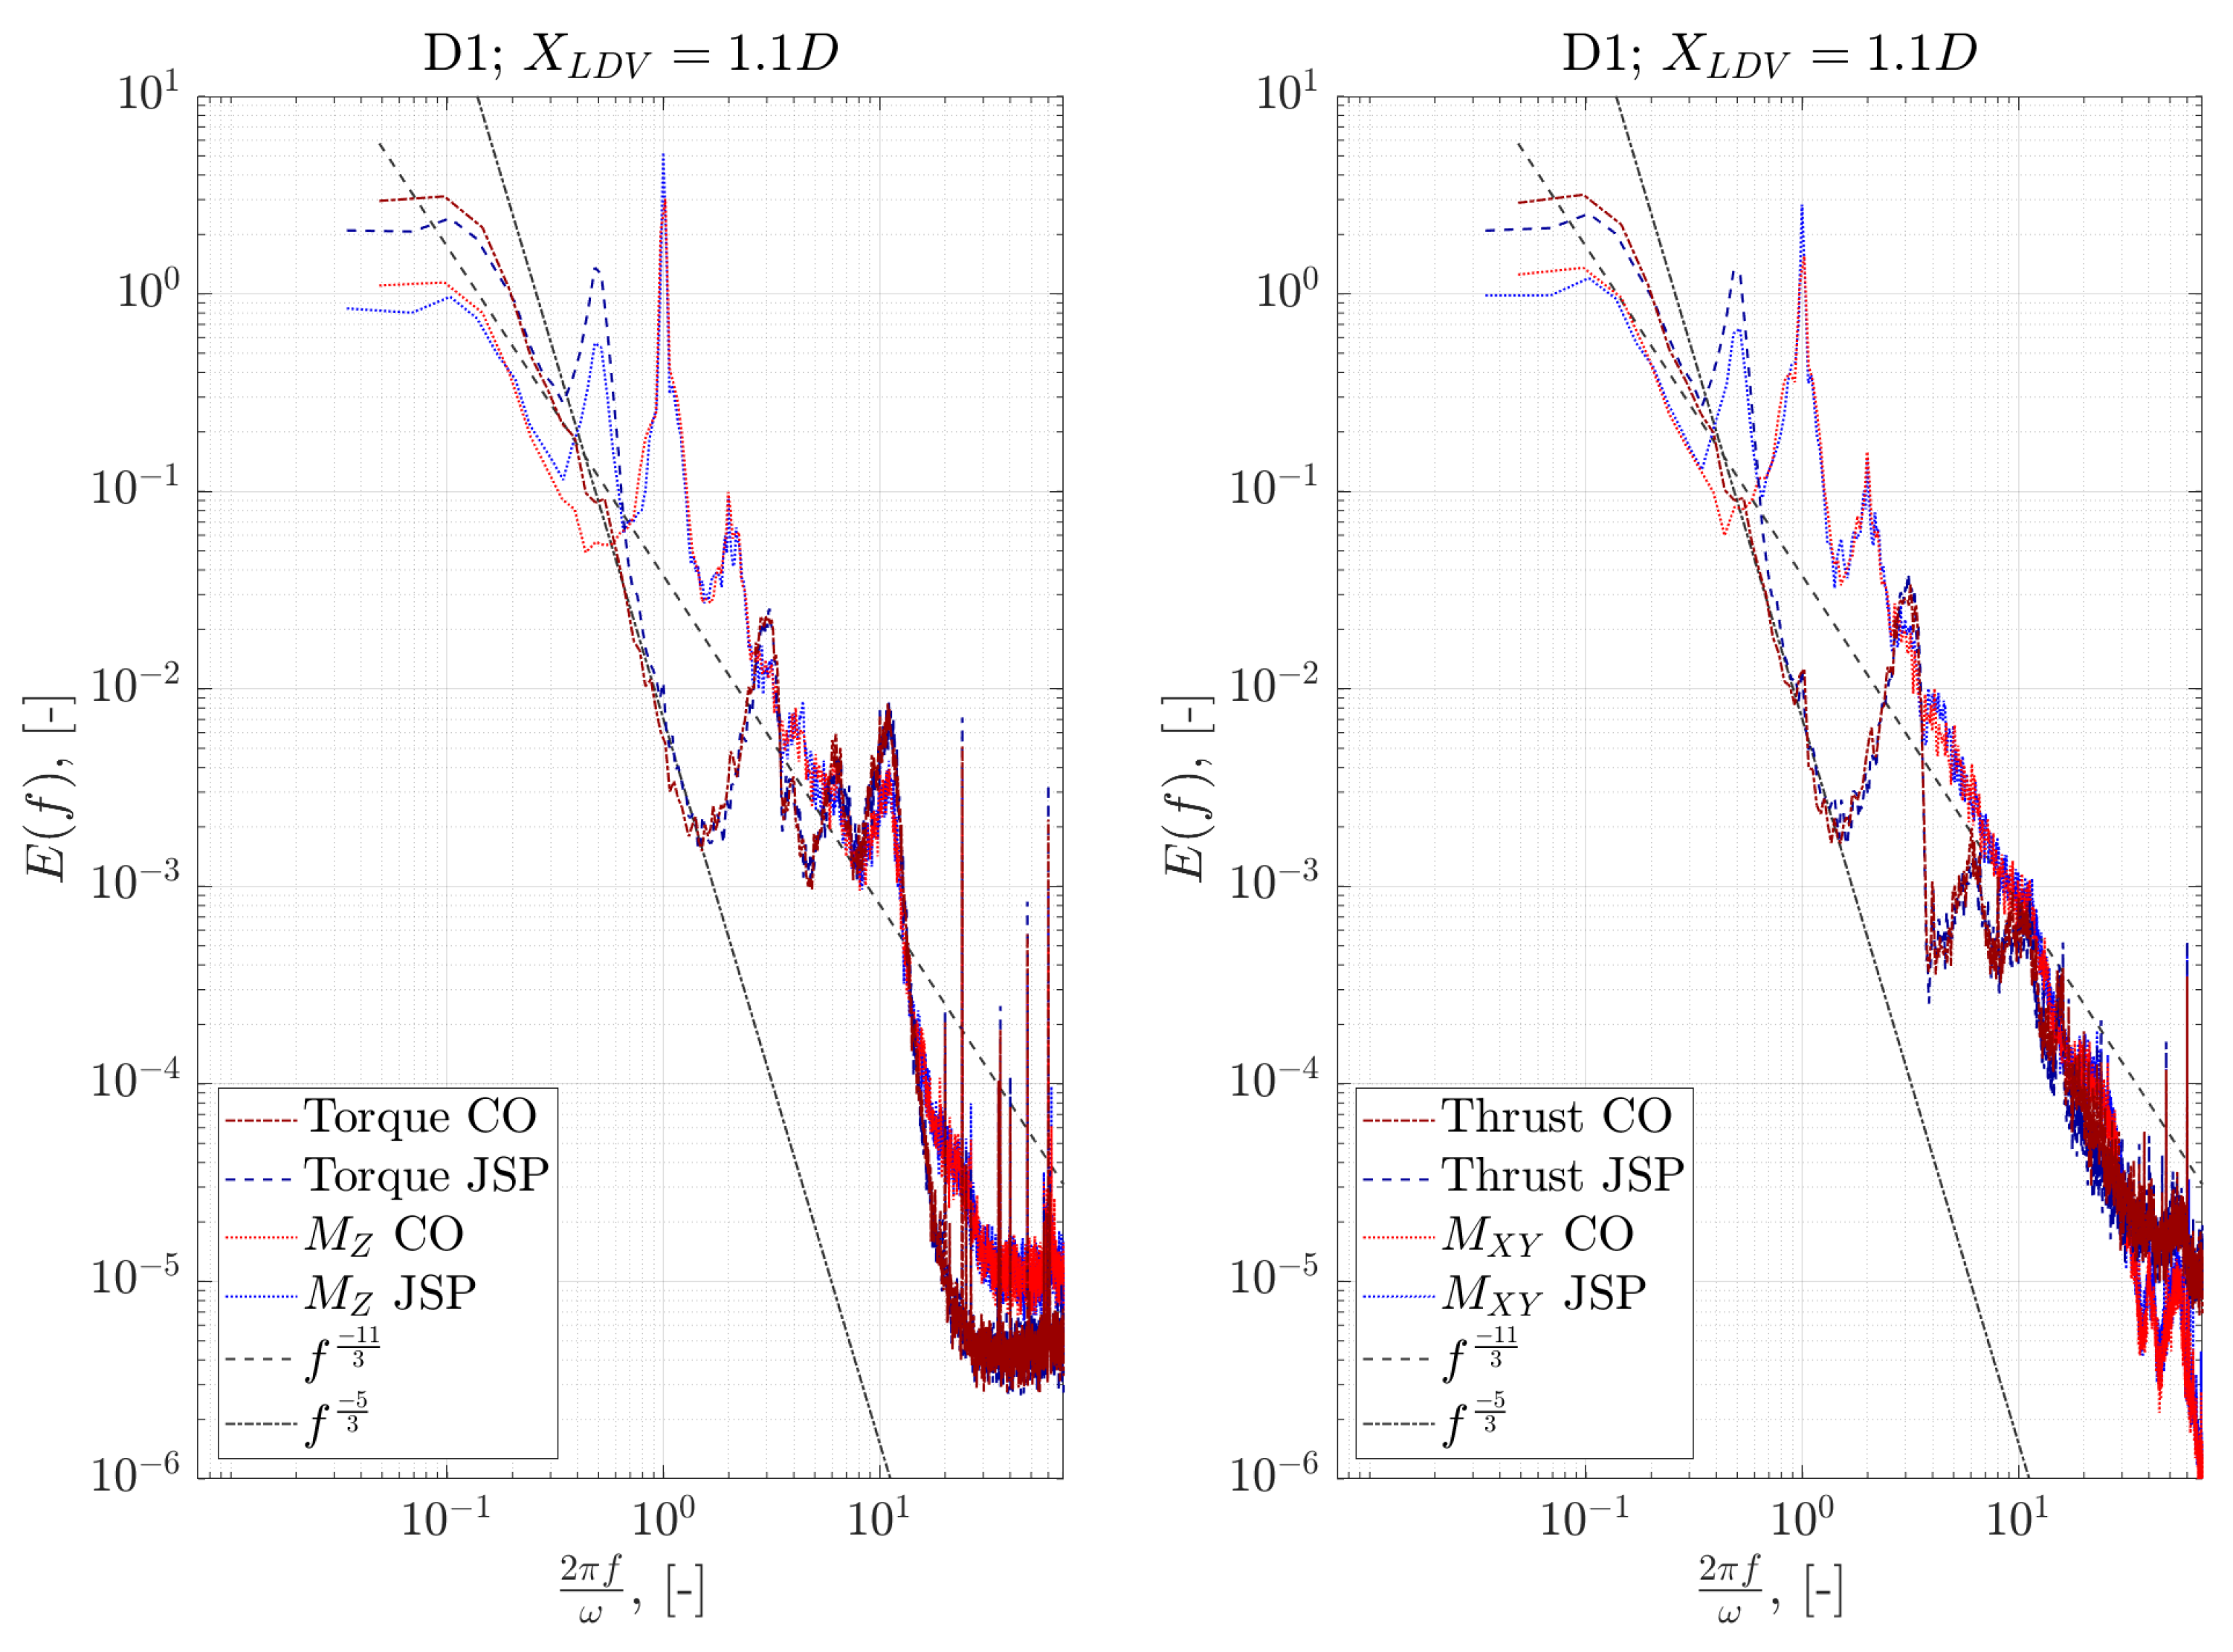
To observe the distribution of load fluctuations with respect to frequency, the PSDs of the rotor loads were calculated. Specifically, PSDs were calculated using normalised rotor thrust, rotor torque and in-plane and out-of-plane BRBM signals, where, for a given signal X, the normalising was achieved via Equation (9). Figure 18 shows the PSDs calculated for test cases where the LDA was at the hub centre, depth 1.1 D; and upstream of the turbine rotor for rotor depth D1. The PSDs calculated were then averaged over repeated tests for similar cases to improve the stability and statistical significance of the spectra shown in Figure 18.
Z = x x ¯ σ x
Firstly, Figure 18 shows that low frequency energy, prior to the inertial sub-range, contributes a significant portion of the transient energy within the measured rotor and BRBM signals—reflected in the larger amplitudes and spectral shapes observed in the 2 π f ω < 0.1 region. Interestingly, the BRBM quantities, both in-plane and out-of-plane, showed lower energy at the lower frequencies when compared with the rotor quantities, suggesting a smaller effect on individual blades arising from larger turbulent structures—although this finding is likely to be length-scale dependant.
At the dominant wave frequency, 2 π f ω 0.5 , clear contributions to the load variability from the waves can be observed for the JSP cases. Unsurprisingly, no contribution can be observed at the wave frequency for the CO case, and the level of this peak for the JSP was similar for all cases, suggesting that the relative contribution of the wave energy to load oscillations was consistent across all tests. The effect of the wave was found to be more pronounced in the overall rotor loading (torque and thrust) rather than the in the BRBM measurements. Furthermore, the relative effect of the wave was slightly smaller in both the rotor and BRBM quantities in comparison with the low frequency energy developed due to the turbulent flow fluctuations associated with larger turbulent flow structures. The observed relative contributions of low frequency turbulent energy and wave energy to the loading transients will clearly differ depending on the parameters of the turbulence and the waves being considered [41].
The next region discussed, and of major importance in defining load transients, is the region 1 < 2 π f ω < 10 , as it characterises loads associated with the rotational movement of the device. Between the first and third harmonic of the rotational speed of the HATT, both the rotor torque and thrust traces deviate significantly from the fluid velocity gradient ( f 5 3 ) traces and the BRBM traces. This shows that the thrust and torque spectra do not exhibit the f 5 3 properties inherent in the fluid velocity spectra. The steeper nature of the curve in the inertial sub-range region for the rotor load traces suggests that large turbulent structures have greater impact on the rotor loading than mid to smaller sized turbulence structures. Indeed, this effect was captured in a model proposed in [21], which through energy balance considerations leads to a modified spectral gradient for rotor quantities of f 11 3 . To illustrate the agreement a f 11 3 trace has been included in Figure 18.
Both the in-plane and out-of-plane BRBM traces showed prominent peak amplitudes at the rotational frequency of the turbine, followed by a less prominent peak at two times the rotational frequency of the turbine. This was expected due to the profiled flow the turbine was subjected to: clearly each blade will experience a full load cycle moving from the faster to slower flow regions and returning, as shown in Section 4.3. The phase relationship between the three blades ensures that the effect of the profile is negated at this frequency in the combined rotor load measurements—however, the effect of the profile can be observed in rotor quantities at the third harmonic of the rotational speed. This agrees with the findings of Section 4.3 and the findings of [19,39]. Given the effect of the profile on generating the dominant amplitude within the BRBM structures, it was expected that discrepancies between the amplitudes measured at the differing depths (and hence differing positions within the profiled flow) would be observed—however, this was not the case, suggesting that a more drastic profile is required before such significant changes in the BRBM spectra occur.
Peaks of various size, generally decaying in amplitude from the third harmonic for rotor quantities or first harmonic for BRBM quantities, can be observed at integer multiples of the rotational speed of the turbine. For toque and in-plane BRBM (left plots), a significant amplitude can be observed at the 10th harmonics of the rotational speed, which arose due to the cogging torque of permanent magnet synchronous machine used for power take off which had 10 pole pairs.
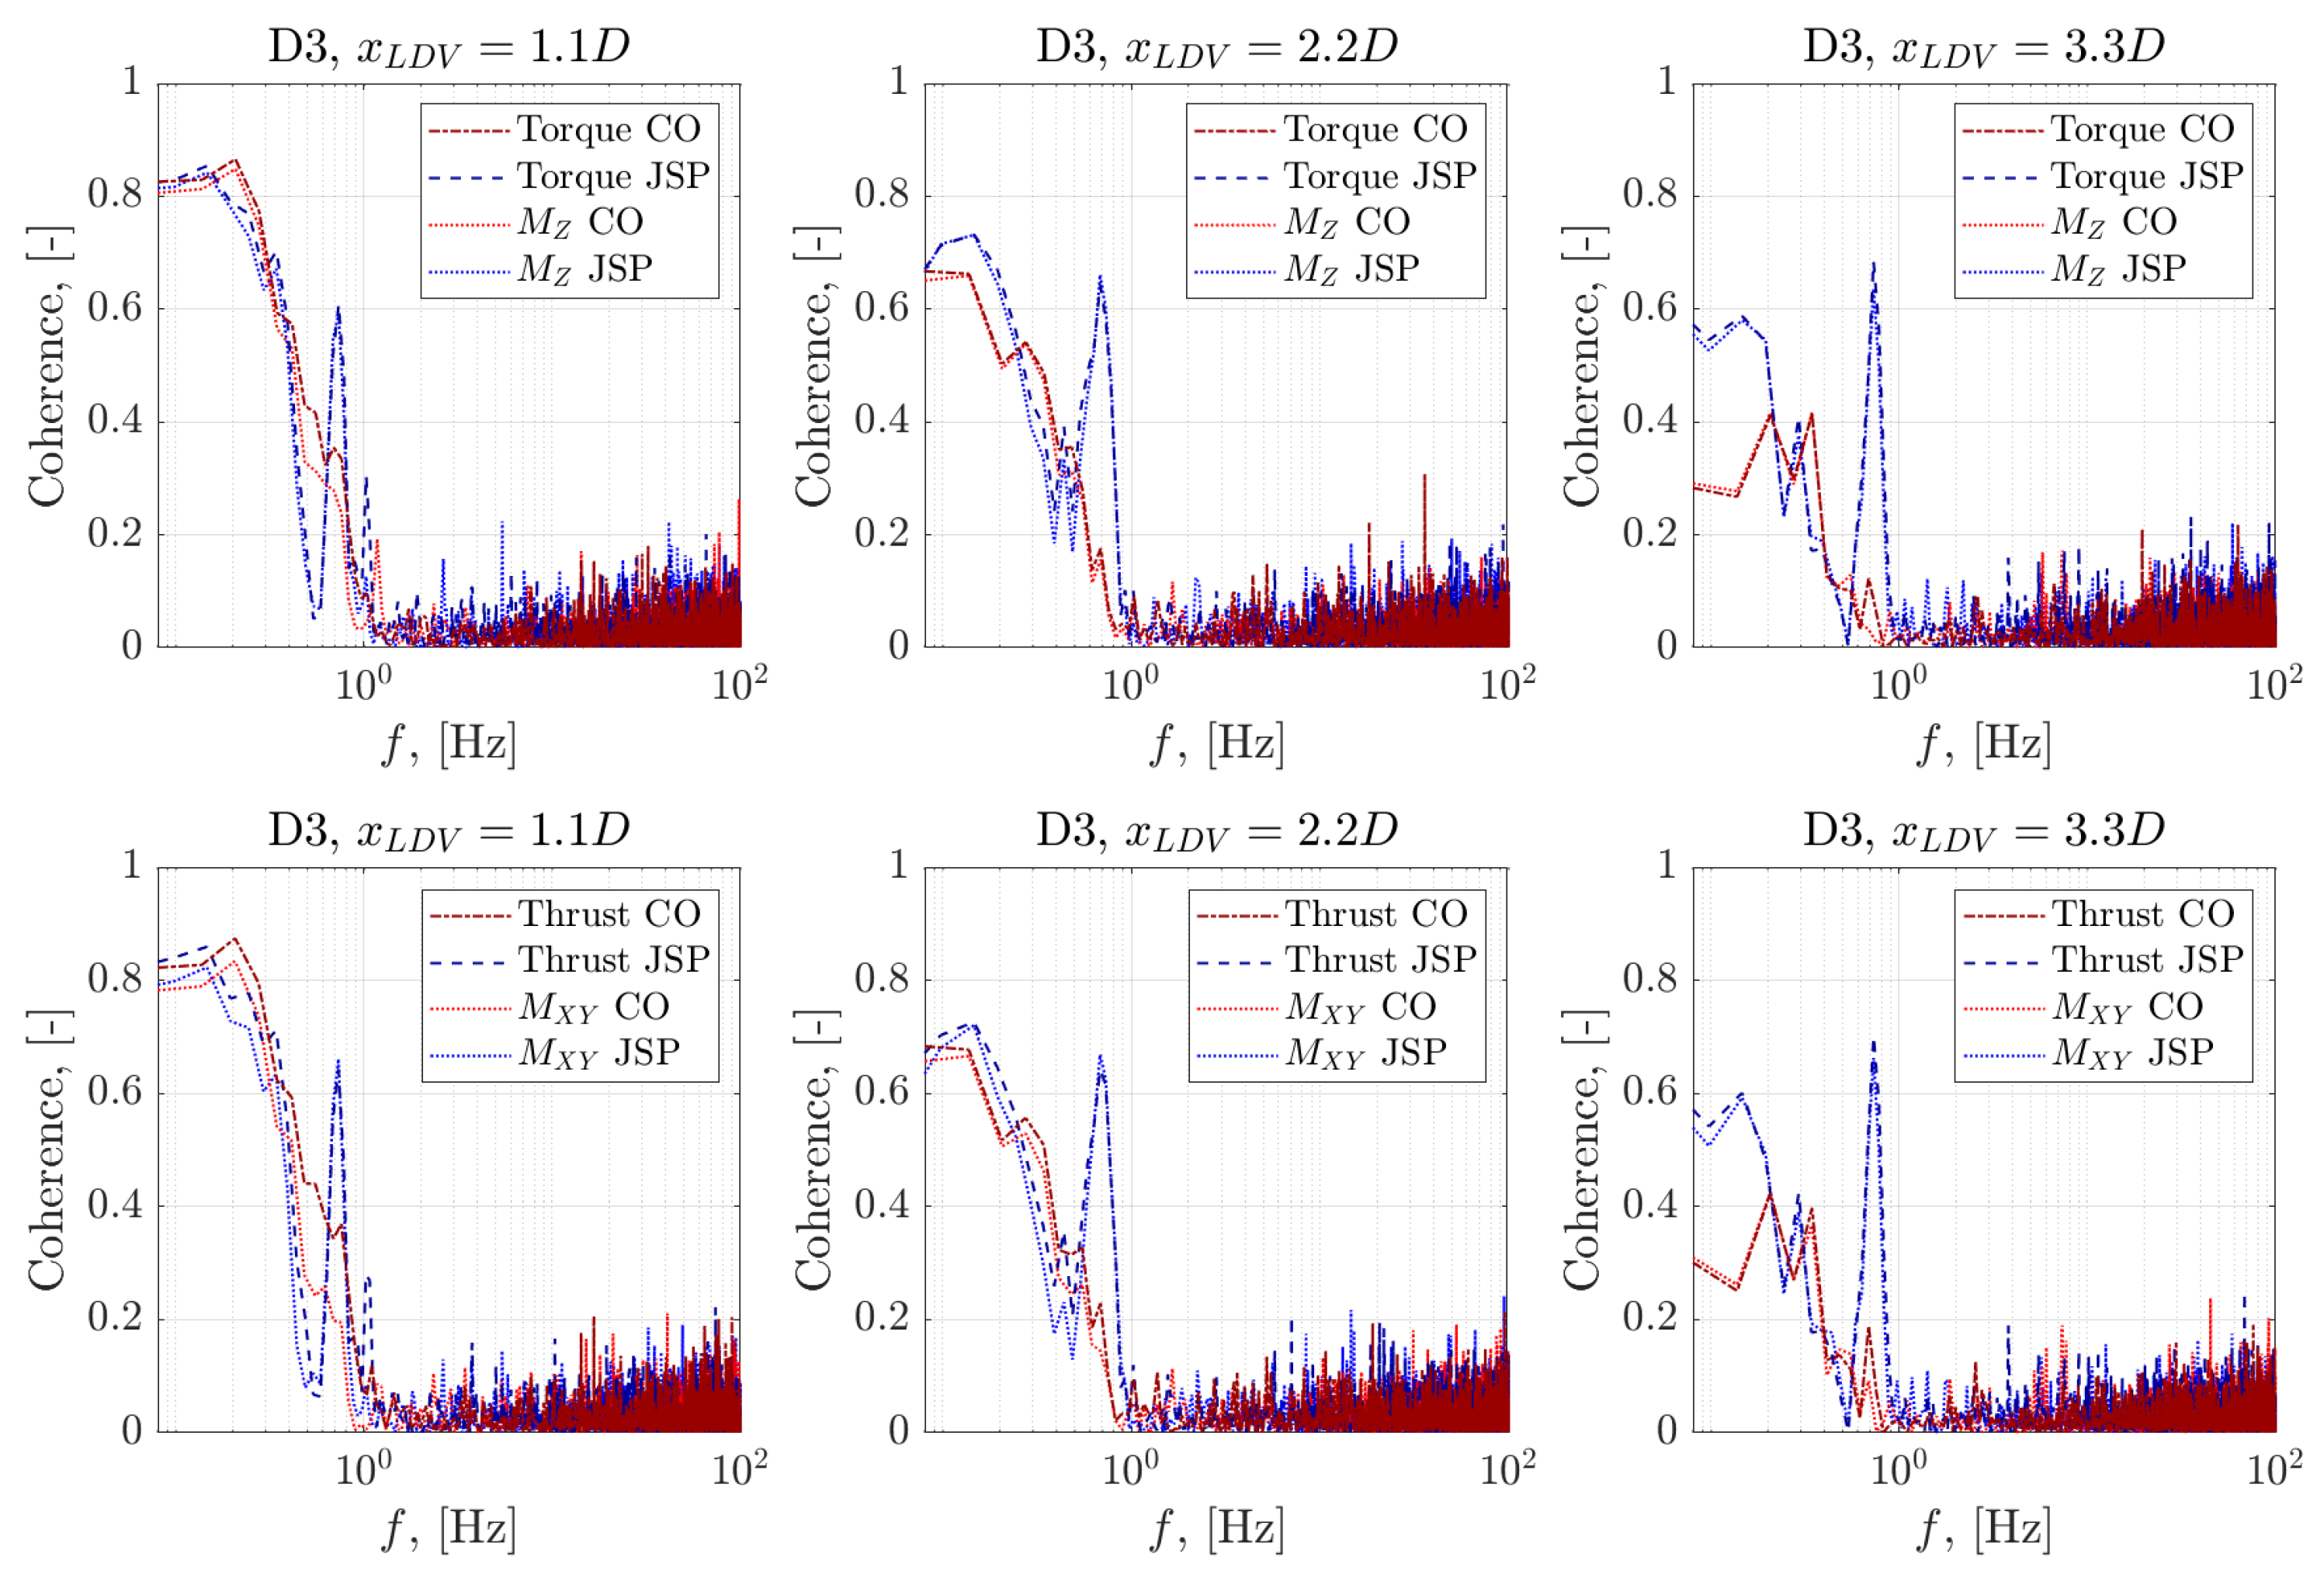
In terms of understanding the loading experienced by a HATT, the analysis above suggested that utilising fluid velocity measurements can inform developers of the transient loading likely to have been experienced by a device—in this way fluid velocity spectra taken from prior resource surveys could possibly be utilised to understand the survivability of a device within a given flow regime. This appears to be particularly consistent for lower frequencies prior to the inertial sub-range where the spectral energy is associated with turbulent energy generation and with dominant wave frequencies (or wave energy). To study this notion in more depth, the spectral cohesion between load quantities and the LDV measurements taken at differing distances upstream was compared.

5.2. Spectral Cohesion Analysis

The spectral coherence between two signals is defined as the magnitude squared cross-spectral density of the two signals normalised by the product of the power spectral densities of each of the signals. The definition of the spectral coherence is defined in Equations (10) and (11), where ρ x y ( t ) is the cross-correlation function for the two variables.
C x y ( f ) = G x y ( f ) G x x ( f ) G y y ( f )
G x y ( f ) = ρ x y ( t ) · e i ω t · d t
Spectral coherence can be used to understand dependencies between specific quantities as they arise at differing frequencies. In linear systems, coherence can be used to define causality between differing input and output quantities; specifically, for a single input to output system, the coherence will be equal to unity for all frequencies. Figure 19 shows the spectral cohesion between the stream-wise fluid velocity signals captured at differing positions downstream and the corresponding rotor and BRBM loads measured.
As suggested above and immediately observable is that the greatest coherence observed was generally at lower frequencies, which either correspond to the turbulence or wave characteristics—for the latter a distinct peak at 0.7 Hz can be observed. The coherence between turbulent structures ( f < 0.5 Hz) in the fluid velocity measurements and the load measurements was improved for LDV measurements taken closer to the HATT, ranging from 0.82 at 1.1 D to 0.58 at 3.3D. The coherence at the dominant wave frequency increased with distance way from the HATT and increased proximity to the wave maker. For frequencies above 1 Hz, the coherence reduced till negligible, which suggests smaller flow structures are not manifested as load oscillations in the same way as larger flow structures—this was consistent for all cases. For the JSP cases, a small peak in coherence was observed at the reciprocal of the given time lag between LDA measurement of a flow feature, and it reached the turbine as defined by Taylor’s hypothesis; i.e., the peak was observed at just under 0.5 Hz for an LDV upstream distance of 2 m (2.2 D). The sizes of these peaks were not significant for coherence, but increased from 0.25 to 0.42 with increasing upstream distance.
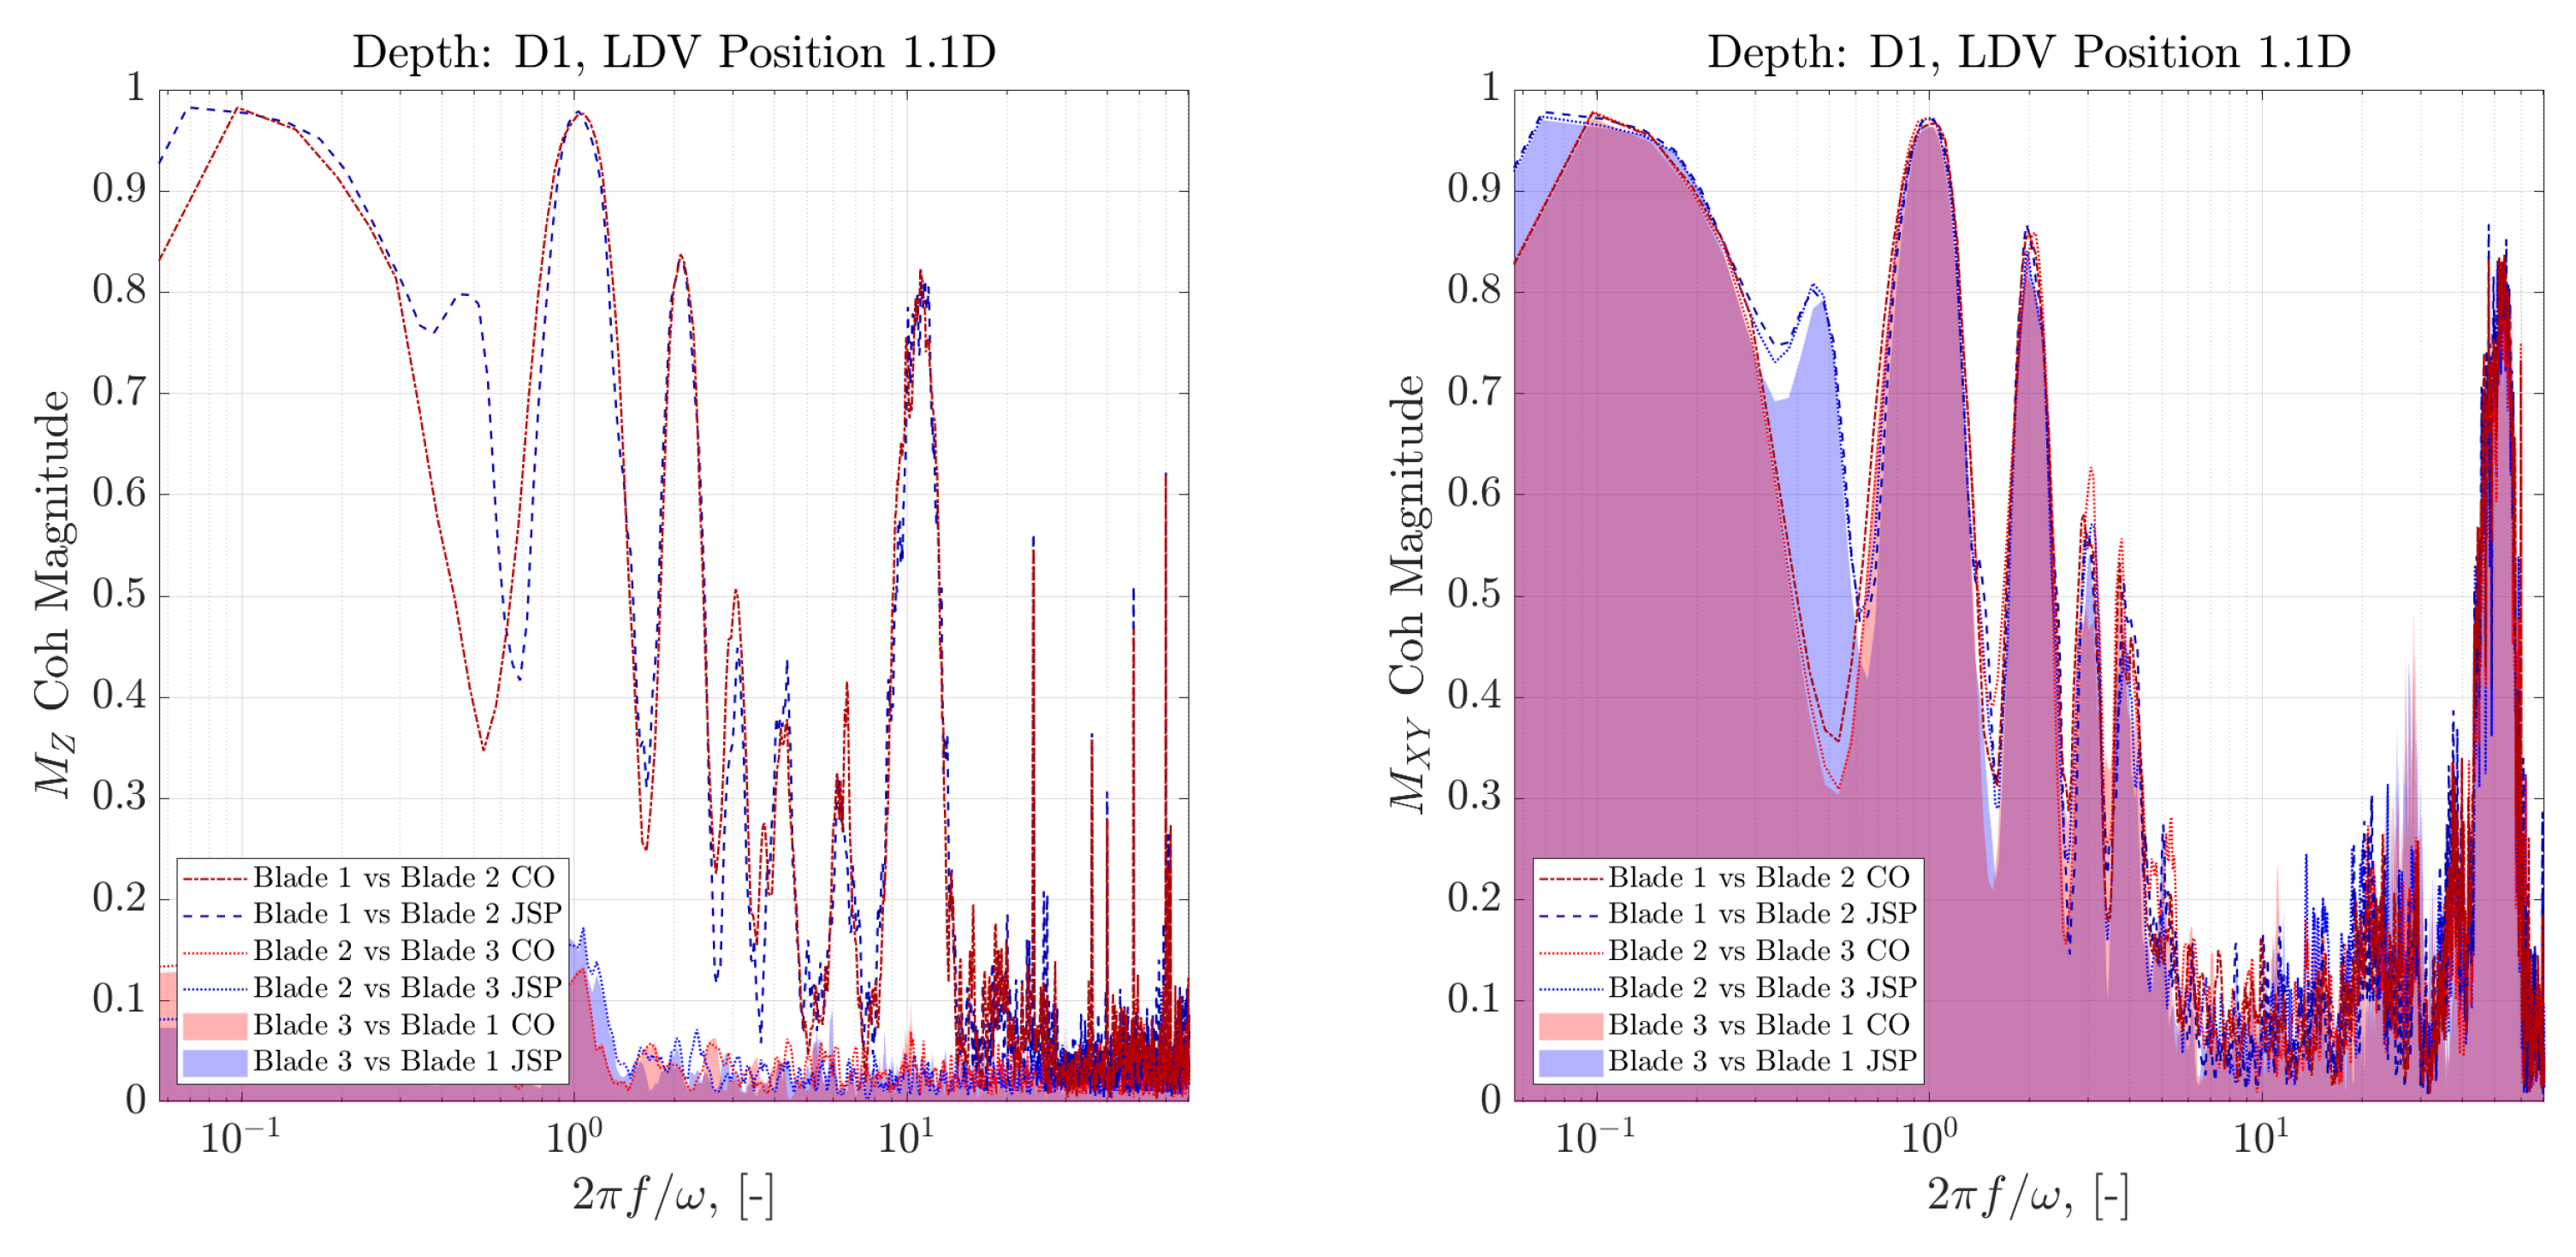
The results are closed by consideration of the spectral cohesion between blades. Figure 20 shows the spectral cohesion between blades for M z (left) and M X Y (right)—note that due to a transducer error, only the cohesion between blades 1 and 2 is available for the M z measurements. Immediately apparent in Figure 20 is the strong cohesion between blade loads at lower frequencies, again due to the large scale turbulent structures. Coherence in loading caused by such structures again is likely to be dependent on the sizes of the turbulent structures hitting the rotor, and indeed this notion seems to be corroborated by the lack of coherence at non-harmonics of the rotational frequency of the device in the inertial sub-range as the turbulent structures break down. In the JSP cases there is strong cohesion at the wave frequency, as expected, showing the penetration of the wave induce orbitals through the water column. Observable in all traces is the strong cohesion for the rotational frequency of the devices with lesser peaks observed at harmonics of this fundamental frequency. In the left trace, strong cohesion can be observed at 2 π f ω = 10 , which shows the effect of the motor pole pairs reflecting through the drive shaft onto the blade loads. An unexpected cohesion in M X Y can be observed at 2 π f ω 13.5 : this was likely due to natural resonance in the device, as small commensurate peak can be observed within Figure 18.

6. Conclusions

This paper presents an experimental study of a 1/20th scale HATT, at differing positions in the water column, subjected to combined irregular wave and shear flows. The experiments presented were conducted at differing depths to facilitate analysis of the effects of the shear flow and wave impact on the device.
Cross-covariance calculations confirmed that flow structure could be detected in load measurements with a time lag defined by Taylor’s hypothesis in the CO case. In the JSP case a more complex situation was uncovered, where time lags associated with both the mean flow and the wave packet velocity were detected. The ability to measure flow structures upstream of the device and relate these measurements to loading transients is highly dependent on the positions of the upstream measurements relative to the flow field and tidal device.
Full rotational PDFs for the BRBM, M X Y , for each of the three blades showed that the PDF of BRBM is dependent on the angular position of the rotor with respect to the upstream flow field. The angular position of the rotor was also shown to have an impact on higher-order statistics, such as the skewness of the data, such that the degree of variation was dependent on the rotor position in the water column. This approach shows promise as a potential monitoring technique which after normalising could be utilised to develop a model of the rotor behaviour under stochastic loading, including both irregular waves and flow shear.
The spectral characteristics show that rotor quantities, within the inertia sub-range, adhere to a f 11 3 gradient—showing that the rotor loading become less reactive to smaller scale flow structures. Adherence to this gradient in the blade loading spectra was not observed, which means that individual blade loading is impacted more by smaller flow structures. Spectral coherence was found to be strongest between fluid velocity measurements and loading at lower frequencies. The degree of cohesion was highly dependent on the flow measurement position. Loading cohesion between blades also exhibited strong alignment at lower frequencies. Throughout the observed spectra and spectral cohesion, rotational artefacts of the rotor where observed. This highlighted the levels of load oscillation due to rotation through the shear layer, but also showed the phase decomposition between blades resulting in the destruction of 1 · ω harmonic in the rotor developed spectra.

Author Contributions

Conceptualisation, M.A., R.M. and S.O.-S.; methodology, M.A., R.M., C.L. and S.O.-S.; software, M.A.; validation, M.A., R.M. and S.O.-S.; formal analysis, M.A. and R.M.; investigation, T.O., G.G., B.G. and C.J.; resources, T.O., G.G., B.G. and C.J.; data curation, M.A.; writing—original draft preparation, M.A. and R.M.; writing—review and editing, M.A., R.M., S.O.-S. and T.O.; visualization, M.A. and R.M.; supervision, T.O., G.G., B.G. and C.J.; project administration, C.L., T.O. and C.J.; funding acquisition, T.O., G.G., B.G. and C.J. All authors have read and agreed to the published version of the manuscript.

Funding

This laboratory study was funded by the Engineering and Physical Sciences Research Council (EPSRC) under the Cardiff University Impact Acceleration Account (EP/R51150X/1) and the Dynamic Loadings on Turbines in a Tidal Array (DyLoTTA) project (EP/N020782/1); Initial device testing and characterisation funded by EC H2020 Marinet2 project (reference number 731084).

Institutional Review Board Statement

Not applicable.

Informed Consent Statement

Not applicable.

Data Availability Statement

All data and code to reproduce figures can be found at http://doi.org/10.17035/d.2021.0134828496 (accessed on 28 May 2021).

Conflicts of Interest

The authors declare no conflict of interest.

Appendix A. Time Lag Calculation—Combined Wave and Current

In the case of waves travelling in a current, it is possible to calculate the time lag when the upstream LDV detects a wave-induced flow perturbation and the time when the perturbation reaches the rotor using linear wave theory; e.g., see [42]. According to [43], waves superimposed on a mean current experience a Doppler shift. This shift is the change in angular frequency of a wave from the reference frame of an observer who is moving relative to the wave source. This change in frequency is defined as:
σ = ω k U
where σ is the rotational frequency of the waves seen from a reference frame in which U = 0 (i.e., the viewer is moving with the current), ω is the rotational frequency of the waves seen from a reference frame in which U is the current velocity, k is the wavenumber and U is the stream-wise flow velocity.
Free propagating waves only exist when the wave angular frequency ω and wavenumber k satisfy the frequency dispersion relation—e.g., [44]. The dispersion relation describes how waves propagate in a medium. For deep water waves the dispersion relation is described as:
Ω = g k
and:
Ω 2 = σ 2
where Ω is the dispersion relation and g the acceleration due to gravity.
The dispersion relation for waves following a current is given by combing Equations (A1) and (A3):
Ω 2 = ω k U 2
Combining Equations (A2) and (A4) gives:
g k 2 = ω k U 2
Solving for the wave angular frequency ω :
ω = k U + g k
The velocity at which the phase of the wave propagates in terms of the wave angular frequency ω is given by:
c p = ω k
where c p is the phase velocity.
The wavenumber k and wavelength L are given by:
k = 2 π L
L = g T 2 2 π
where T is the wave period.
Combining Equations (A6)–(A9) gives:
c p = U + g T 2 π
The common definitions of speed U = d / t , can be modified with the time lag t l a g , the phase velocity c p from Equation (A10) and the known distance between the LDV stream-wise position and the rotor x L D V , giving:
c p = x L D V t l a g
replacing c p with Equation (A10) and solving for t l a g gives:
t l a g = x L D V U + g T 2 π
As there are two different velocities in combined wave and current conditions ( c p and u), it is anticipated that there will be two different time lags. One associated with the evolution of large turbulent flow structures (u) and another one associated with waves propagation ( c p ).

References

  1. SIMEC Atlantis Energy. Tidal Stream Projects: MeyGen. Available online: https://simecatlantis.com/projects/meygen/ (accessed on 17 May 2021).
  2. Meygen Ltd. Lessons Learnt from MeyGen Phase 1a: Design Phase. Technical Report; 2017. Available online: https://tethys.pnnl.gov/sites/default/files/publications/MeyGen-2017-Part1.pdf (accessed on 17 May 2021).
  3. Nova Innovation. Nova Wins €5 Million European Tidal Energy Project to Slash Cost of Tidal Energy. Available online: https://www.novainnovation.com/news/news_/i/nova-wins-5million-euro-european-tidal-energy-project-to-slash-the-cost-of-tidal-energy/ (accessed on 17 May 2021).
  4. Blackmore, T.; Myers, L.E.; Bahaj, A.S. Effects of turbulence on tidal turbines: Implications to performance, blade loads, and condition monitoring. Int. J. Mar. Energy 2016, 14, 1–26. [Google Scholar] [CrossRef] [Green Version]
  5. Maganga, F.; Germain, G.; King, J.; Pinon, G.; Rivoalen, E. Experimental characterisation of flow effects on marine current turbine behaviour and on its wake properties. IET Renew. Power Gener. 2010, 4, 498–509. [Google Scholar] [CrossRef] [Green Version]
  6. Mycek, P.; Gaurier, B.; Germain, G.; Pinon, G.; Rivoalen, E. Experimental study of the turbulence intensity effects on marine current turbines behaviour. Part I: One single turbine. Renew. Energy 2014, 66, 729–746. [Google Scholar] [CrossRef] [Green Version]
  7. Gaurier, B.; Davies, P.; Deuff, A.; Germain, G. Flume tank characterization of marine current turbine blade behaviour under current and wave loading. Renew. Energy 2013, 59, 1–12. [Google Scholar] [CrossRef] [Green Version]
  8. Martinez, R.; Ordonez-Sanchez, S.; Allmark, M.; Lloyd, C.; O’Doherty, T.; Germain, G.; Gaurier, B.; Johnstone, C. Analysis of the effects of control strategies and wave climates on the loading and performance of a laboratory scale horizontal axis tidal turbine. Ocean Eng. 2020, 212, 107713. [Google Scholar] [CrossRef]
  9. Ordonez-Sanchez, S.; Allmark, M.; Porter, K.E.; Ellis, R.; Lloyd, C.; Santic, I.; O’Doherty, T.; Johnstone, C. Analysis of a Horizontal-Axis Tidal Turbine Performance in the Presence of Regular and Irregular Waves Using Two Control Strategies. Energies 2019, 12, 367. [Google Scholar] [CrossRef] [Green Version]
  10. Draycott, S.; Nambiar, A.; Sellar, B.G.; Davey, T.A.D.; Venugopal, V. Assessing extreme loads on a tidal turbine using focused wave groups in energetic currents. Renew. Energy 2019, 135, 1013–1024. [Google Scholar] [CrossRef] [Green Version]
  11. Draycott, S.; Payne, G.S.; Steynor, J.; Nambiar, A.; Sellar, B.G.; Venugopal, V. An experimental investigation into non-linear wave loading on horizontal axis tidal turbines. J. Fluids Struct. 2019, 84, 199–217. [Google Scholar] [CrossRef]
  12. Draycott, S.; Steynor, J.; Nambiar, A.; Sellar, B.; Venugopal, V. Experimental assessment of tidal turbine loading from irregular waves over a tidal cycle. J. Ocean. Eng. Mar. Energy 2019, 5, 173–187. [Google Scholar] [CrossRef] [Green Version]
  13. Lewis, M.; Neill, S.P.; Robins, P.; Hashemi, M.R.; Ward, S. Characteristics of the velocity profile at tidal-stream energy sites. Renew. Energy 2017, 114, 258–272. [Google Scholar] [CrossRef]
  14. Allmark, M.; Ellis, R.; Ebdon, T.; Lloyd, C.; Ordonez-Sanchez, S.; Martinez, R.; Mason-Jones, A.; Johnstone, C.; O’Doherty, T. A detailed study of tidal turbine power production and dynamic loading under grid generated turbulence and turbine wake operation. Renew. Energy 2020, 169, 1422–1439. [Google Scholar] [CrossRef]
  15. Mycek, P.; Gaurier, B.; Germain, G.; Pinon, G.; Rivoalen, E. Experimental study of the turbulence intensity effects on marine current turbines behaviour. Part II: Two interacting turbines. Renew. Energy 2014, 68, 876–892. [Google Scholar] [CrossRef] [Green Version]
  16. Ahmed, U.; Apsley, D.D.; Afgan, I.; Stallard, T.; Stansby, P.K. Fluctuating loads on a tidal turbine due to velocity shear and turbulence: Comparison of CFD with field data. Renew. Energy 2017, 112, 235–246. [Google Scholar] [CrossRef] [Green Version]
  17. Ebdon, T.; Allmark, M.; O’Doherty, D.; Mason-Jones, A.; O’Doherty, T.; Germain, G.; Gaurier, B. The impact of turbulence and turbine operating condition on the wakes of tidal turbines. Renew. Energy 2021, 165. [Google Scholar] [CrossRef]
  18. Gaurier, B.; Ikhennicheu, M.; Germain, G.; Druault, P. Experimental study of bathymetry generated turbulence on tidal turbine behaviour. Renew. Energy 2020, 156, 1158–1170. [Google Scholar] [CrossRef]
  19. Deskos, G.; Payne, G.S.; Gaurier, B.; Graham, M. On the spectral behaviour of the turbulence-driven power fluctuations of horizontal-axis turbines. J. Fluid Mech. 2020, 904, 13–14. [Google Scholar] [CrossRef]
  20. Blackmore, T.; Blunden, L.S.; Shah, K.; Myers, L.E.; Bahaj, A.S. The impact of a real tidal flow on the fatigue loads acting on a tidal turbine. In Proceedings of the 3rd Asian Wave and Tidal Energy Conference, Singapore, 24–28 October 2016. [Google Scholar] [CrossRef]
  21. Tobin, N.; Zhu, H.; Chamorro, L.P. Spectral behaviour of the turbulence-driven power fluctuations of wind turbines. J. Turbul. 2015, 16, 832–846. [Google Scholar] [CrossRef]
  22. Milne, I. An Experimental Investigation of Turbulence and Unsteady Loading on Tidal Turbines. Ph.D. Thesis, The University of Auckland, Auckland, New Zealand, 2014. [Google Scholar]
  23. Milne, I.A.; Day, A.H.; Sharma, R.N.; Flay, R.G. The characterisation of the hydrodynamic loads on tidal turbines due to turbulence. Renew. Sustain. Energy Rev. 2016, 56, 851–864. [Google Scholar] [CrossRef] [Green Version]
  24. Sentchev, A.; Thiébaut, M.; Schmitt, F.G. Impact of turbulence on power production by a free-stream tidal turbine in real sea conditions. Renew. Energy 2020, 147, 1932–1940. [Google Scholar] [CrossRef]
  25. Chamorro, L.P.; Hill, C.; Morton, S.; Ellis, C.; Arndt, R.E.; Sotiropoulos, F. On the interaction between a turbulent open channel flow and an axial-flow turbine. J. Fluid Mech. 2013, 716, 658–670. [Google Scholar] [CrossRef]
  26. Medina, O.D.; Schmitt, F.G.; Calif, R.; Germain, G.; Gaurier, B. Turbulence analysis and multiscale correlations between synchronized flow velocity and marine turbine power production. Renew. Energy 2017, 112, 314–327. [Google Scholar] [CrossRef] [Green Version]
  27. Noble, D.R.; Draycott, S.; Nambiar, A.; Sellar, B.G.; Steynor, J.; Kiprakis, A. Experimental Assessment of Flow, Performance, and Loads for Tidal Turbines in a Closely-Spaced Array. Energies 2020, 13, 1977. [Google Scholar] [CrossRef]
  28. Gaurier, B.; Carlier, C.; Germain, G.; Pinon, G.; Rivoalen, E. Three tidal turbines in interaction: An experimental study of turbulence intensity effects on wakes and turbine performance. Renew. Energy 2020, 148, 1150–1164. [Google Scholar] [CrossRef]
  29. Lloyd, C.; Allmark, M.; Ordonez-Sanchez, S.; Martinez, R.; Johnstone, C.; Germain, G.; Gaurier, B.; Mason-Jones, A.; O’Doherty, T. Validation of the dynamic load characteristics on a Tidal Stream Turbine when subjected to wave and current interaction. Ocean. Eng. 2021, 222. [Google Scholar] [CrossRef]
  30. Porter, K.; Ordonez-Sanchez, S.; Murray, R.; Allmark, M.; Johnstone, C.; O’Doherty, T.; Mason-Jones, A.; Doman, D.; Pegg, M. Flume testing of passively adaptive composite tidal turbine blades under combined wave and current loading. J. Fluids Struct. 2020, 93. [Google Scholar] [CrossRef]
  31. Allmark, M. Performance Assessment of a Horizontal Axis Tidal Turbine in a High Velocity Shear Environment. Ph.D. Thesis, Cardiff University, Cardiff, UK, 2010. [Google Scholar]
  32. Ke, S.; Wen-Quan, W.; Yan, Y. The hydrodynamic performance of a tidal-stream turbine in shear flow. Ocean. Eng. 2020, 199, 107035. [Google Scholar] [CrossRef]
  33. Martinez, R.; Payne, G.S.; Bruce, T. The effects of oblique waves and current on the loadings and performance of tidal turbines. Ocean. Eng. 2017, 164, 55–64. [Google Scholar] [CrossRef]
  34. Gaurier, B.; Germain, G.; Facq, J.V.; Thomas, B. Wave and Current Flume Tank of IFREMER at Boulogne-sur-mer. Description of the Facility and Its Equipment; Technical Report; Institut Français de Recherche pour l’Exploitation de la Mer (IFREMER): Boulogne-sur-Mer, France, 2018. [Google Scholar] [CrossRef]
  35. Allmark, M.; Ellis, R.; Lloyd, C.; Ordonez-Sanchez, S.; Johannesen, K.; Byrne, C.; Johnstone, C.; O’Doherty, T.; Mason-Jones, A. The development, design and characterisation of a scale model Horizontal Axis Tidal Turbine for dynamic load quantification. Renew. Energy 2020, 156, 913–930. [Google Scholar] [CrossRef]
  36. Ellis, R.; Allmark, M.; Doherty, T.O.; Mason-jones, A.; Ordonez-sanchez, S.; Johannesen, K.; Johnstone, C. Design Process for a Scale Horizontal Axis Tidal Turbine Blade. In Proceedings of the 4th Asian Wave and Tidal Energy Conference, Taipei, Taiwan, 9–13 September 2018; pp. 1–8. [Google Scholar]
  37. Perez, L.; Cossu, R.; Couzi, C.; Penesis, I. Wave-turbulence decomposition methods applied to tidal energy site assessment. Energies 2020, 13, 1245. [Google Scholar] [CrossRef] [Green Version]
  38. Taylor, G.I. Statistical Theory of Turbulence. Proc. R. Soc. Lond. Ser. A Math. Phys. Sci. 1935, 151, 421–444. [Google Scholar] [CrossRef] [Green Version]
  39. Allmark, M.; Grosvenor, R.; Prickett, P. An approach to the characterisation of the performance of a tidal stream turbine. Renew. Energy 2017, 111. [Google Scholar] [CrossRef]
  40. Allmark, M. Condition Monitoring and Fault Diagnosis of Tidal Stream Turbines Subjected to Rotor Imbalance Faults. Ph.D. Thesis, Cardiff University, Cardiff, UK, 2016. [Google Scholar]
  41. Martinez, R.; Gaurier, B.; Ordonez-Sanchez, S.; Facq, J.V.; Germain, G.; Johnstone, C.; Santic, I.; Salvatore, F.; Davey, T.; Old, C.; et al. Tidal Energy Round Robin Tests: A Comparison of Flow Measurements and Turbine Loading. J. Mar. Sci. Eng. 2021, 9, 425. [Google Scholar] [CrossRef]
  42. Dean, R.G.; Dalrymple, R.A. Water Wave Mechanics for Engineers and Scientists; World Scientific: Singapore, 1991. [Google Scholar] [CrossRef]
  43. Phillips, O. The Dynamics of the Upper Ocean; Cambridge Monographs on Mechanics; Cambridge University Press: Cambridge, UK, 1977. [Google Scholar]
  44. Peregrine, D.H. Interaction of water waves and currents. Adv. Appl. Mech. 1976, 16, 9–117. [Google Scholar] [CrossRef]
Figure 1. Schematics and photographs of the experimental setup. (a) Plan view schematic of the experimental setup showing the upstream LDV positions. (b) Photograph of the setup showing the instrumented turbine and the wave probe. (c) Side view of the setup showing the wave marker submersion depth, with the depth labelling convention defined.
Jmse 09 00593 g001
Figure 2. Front view of the rotor indicating the three rotor depths D1, D2 and D3. Blue markers indicate the LDV positions relative to the rotor depth: top, middle, bottom.
Jmse 09 00593 g002
Figure 3. Time series of the stream-wise fluid velocity measured via the LDV and wave height measured via the wave probes. The measurements were made at the rotor plane for the D3 depth with the LDV aligned with the turbine rotor centre. Wave height here is defined as the deviation from the SWL with positive values above the SWL.
Jmse 09 00593 g003
Figure 4. Mean stream-wise fluid velocity, u ¯ , against depth. Each chart presents the results for differing LDV positions; shaded regions highlight the turbine rotor span at each of the depths tested—D1, D2 and D3.
Jmse 09 00593 g004
Figure 5. Mean 2-D TI against depth. Each chart presents the results for differing LDV positions; shaded regions highlight the turbine rotor span at each of the depths tested—D1, D2 and D3.
Jmse 09 00593 g005
Figure 6. PSD plot for each fluid velocity time series captured. Upper plots show the CO cases, whereas lower plots show the JSP cases. The colour bars to the right of the charts indicate the corresponding depths.
Jmse 09 00593 g006
Figure 7. Plots showing the amplitude observed at the average wave frequency at differing depths and upstream LDV positions for the CO and JSP cases.
Jmse 09 00593 g007
Figure 8. Box plots of turbine loading for every case undertaken, including repeats. Upper charts show torque, central charts thrust and lower charts BRBM. Left charts show the CO cases and right charts show JSP cases.
Jmse 09 00593 g008
Figure 9. Example plots showing the rotor loading time series obtained for the rotor submerged to depth D3. The left plots show the CO cases and the right plots show the JSP cases. The top, middle and bottom plots show rotor torque, rotor thrust and blade 1 out-of-plane ( M X Y ) blade root bending moments, respectively. The upper and lower bounds of the y-axis for each plot have been set to the 5th and 95th percentiles of the plotted datasets, respectively.
Jmse 09 00593 g009
Figure 10. Development of the cross-covariance coefficient at differing lag values between LDV measurements and rotor torque meaurements. Upper charts show the thrust, whereas the lower charts show out-of-plane ( M X Y ) BRBM correlations with the fluid velocity measurements.
Jmse 09 00593 g010
Figure 11. Comparison of lag between LDV, wave probe and thrust transducer signals obtained from cross-correlation for current-only cases. The size of a marker is relative to the R value of the cross-correlation function ranging from 0.2 to 0.8.
Jmse 09 00593 g011
Figure 12. Development of the cross-covariance coefficient at lag values differing between LDV measurements and rotor torque measurements. Upper charts show the thrust, whereas the lower charts show out-of-plane ( M X Y ) BRBM correlations with the fluid velocity measurements.
Jmse 09 00593 g012
Figure 13. Comparison of lag between LDV, wave probe and thrust transducer signals obtained from cross-correlation for irregular wave cases. Three vertical sections for each LDV streamwise position. Filled markers are for cross-correlation between U / H and empty markers for U / T . Different marker colours indicate different rotor depths. Each section is divided in three for each LDV vertical position relative to the rotor: top, middle and bottom. The size of a marker is relative to the R value of the cross-correlation function ranging from 0.2 to 0.8.
Jmse 09 00593 g013
Figure 14. The probability density of M X Y , as distributed with rotational position, with mean, median and mode averages overlaid for the CO cases. Position reference: 0 is the rotor position when blade 3 is at the top, dead centre or pointing upward toward the water’s surface.
Jmse 09 00593 g014
Figure 15. Plots showing the positional variation statistically of the out-of-plane BRBM measurements taken at differing submersion depths. Leftmost charts show mean BRBM, central charts show standard deviation and rightmost charts show skewness. Upper, middle and lower charts show submersion depths D3, D2 and D1, respectively. The data shown are for the CO cases.
Jmse 09 00593 g015
Figure 16. The probability density of M X Y , as distributed with rotational position, with mean, median and mode averages overlaid for the JSP cases. Position reference: 0 is the rotor position when blade 3 at top, dead centre or pointing upward toward the water’s surface.
Jmse 09 00593 g016
Figure 17. Plots showing the positional variation statistically of the out-of-plane BRBM measurements taken at different submersion depths. Leftmost charts show mean BRBM, central charts show standard deviation and rightmost charts show skewness. Upper, middle and lower charts show submersion depths D3, D2 and D1, respectively. The data shown are for the JSP cases.
Jmse 09 00593 g017
Figure 18. Mean power spectral density plots for torque-wise loading (Left) and thrust-wise loading (right) for all three datasets gathered at the D1 case for both CO and JSP experiments.
Jmse 09 00593 g018
Figure 19. Spectral cohesion between rotor and blade loading quantities and the fluid velocity measurements taken at differing upstream positions for the D3 case. The upper charts show torque-wise loading and the lower charts show thrust-wise loading.
Jmse 09 00593 g019
Figure 20. Spectral cohesion between blade loading quantities for the D1 case. The left chart shows torque-wise loading and the right chart shows thrust-wise loading.
Jmse 09 00593 g020
Table 1. Flow velocity and wave conditions utilised during the test campaign with full-scale equivalent wave characteristics defined.
CaseWave TypeWaterFlowWaveWaveWave
DepthSpeedHeightFrequencyLength
h [m] u ¯ [m/s] H S [m] F P [Hz]L [m]
COCurrent Only21.0---
JSPJONSWAP21.00.150.703.19
JSP 1,*JONSWAP253.531.880.2039.83
JSP 1,**JONSWAP404.473.000.1663.73
1 Full scale wave characteristics for * 25 m and ** 40 m depth at consistent relative depth (0.63), wave steepness (0.05) and wave height-based Froude number (0.82).
Publisher’s Note: MDPI stays neutral with regard to jurisdictional claims in published maps and institutional affiliations.