Article

Impacts of Plastic-Made Packaging on Marine Key Species: Effects Following Water Acidification and Ecological Implications

1
Department of Life Sciences, University of Trieste, 34127 Trieste, Italy
2
CoNISMa, Piazzale Flaminio, 9, 00192 Rome, Italy
3
Bioscience Research Center, Via Aurelia Vecchia, 32, 58015 Orbetello, Italy
4
Stazione Zoologica Anton Dohrn, 80121 Naples, Italy
*
Author to whom correspondence should be addressed.
J. Mar. Sci. Eng. 2021, 9(4), 432; https://doi.org/10.3390/jmse9040432
Submission received: 17 March 2021 / Revised: 4 April 2021 / Accepted: 13 April 2021 / Published: 17 April 2021
(This article belongs to the Special Issue Marine Litter)

Abstract

:
This study evaluates the impacts of 16 different leachates of plastic-made packaging on marine species of different trophic levels (bacteria, algae, echinoderms). Standard ecotoxicological endpoints (inhibition of bioluminescence, inhibition of growth, embryo-toxicity) and alterations of ecologically significant parameters (i.e., echinoderms’ body-size) were measured following exposure under different pH water conditions: marine standard (pH 8.1) and two increasingly acidic conditions (pH 7.8 and 7.5) in order to evaluate possible variations induced by ocean acidification. The results obtained in this study evidence that the tested doses are not able to significantly affect bacteria (Vibrio fischeri) and algae (Phaeodactylum tricornutum). On the contrary, Paracentrotus lividus larvae were significantly affected by several packaging types (13 out of 16) with meaningless differences between pH conditions.

1. Introduction

In Europe, plastic production reached almost 58 million tonnes in 2019 and packaging represents the largest end-use market accounting for approximately 40% of the total demand, the growth of which has been accelerated by a global shift from reusable to single-use containers [1,2]. A wide variety of resin types are used for the production of packaging and food packaging: polystyrene (PS) and expanded-polystyrene (EPS) are widely present as containers of fish products; polyethylene terephthalate (PET) is used in water and juices bottles, as well as for the production of shopping bags; polyethylene (PE) is used for milk bottles and food packaging films; polypropylene (PP) is applied for microwave containers, sweets and snack wrappers [2]. Considering the huge production of these type of products and their short lifetime (from production to disposal is about 0.5 years, [1]), a proper waste management strategy is clearly necessary. According to Plastics Europe (2020) [2], since 2006, the quantity of plastic post-consumer packaging waste sent to recycling sites has increased by 92%. The new Directive (EU) 2019/852 on Packaging and Packaging Waste set 50% as the recycling target for plastic packaging by 2025 and 55% by 2030, strengthening interest and commitment to the correct management of plastic materials. Meanwhile, many mistakes have been made and the evidence of such mistakes is clearly visible. In fact, food wrappers represent a consistent slice of marine litter. In 2019, the International Coastal Clean-up (ICC) world campaign collected a total of 32,485,488 litter items, of which 4,771,602 were food containers, thus, representing the most abundant litter item [3]. Plastic litter is widespread along the coasts of European Countries and in Italy, where waste is found at levels of 6.2 items per linear meter of beach and plastic accounts for 80% of the total waste recorded [4]. The situation is aggravated by the presence of waste dumps along the beaches, a phenomenon that is well documented and particularly frequent in Tripoli (3 ha), Beirut (Borj Hammoud, 15 ha), Normandy (10 ha), and Saida. Moreover, legal and illegal dumps [5] in coastal areas could represent a potential risk to the preservation of marine ecosystems. In these areas, the waste loss represents a significant and direct impact on marine ecosystems [6].
Large plastic packaging abandoned in the marine environment could affect wildlife via direct mechanical damage due to ingestion or trapping, and is also consistent source of microplastics (MPs). In fact, macro litter can be reduced in tiny particles by the action of wind, waves and solar radiation [7,8]. Meso- and micro-plastics represent the principal fractions of plastic litter that are found worldwide in abiotic matrices [9,10,11,12,13,14] and can be transferred efficiently throughout the trophic web [15,16]. This can lead to effects on detritivores [17] and filter feeder species [18,19,20], while also affecting marine foodstuffs and humans [21,22,23,24]. Recent research highlighted that plastics can interact at different levels with feeding responses in tested species (i.e., hard corals, [25]; oysters, [26]; sea anemones, [27]. Furthermore, other important biological functions could be impacted such as spore settlement and aggregation in Ulva tepida [28] and settlement and growth in bryozoans [29].
Plastic litter has the ability to release both microparticles and chemicals into marine water that able to affect marine species [30,31]. Plastic leachates contain chemicals and environmental pollutants previously adsorbed by waste surfaces, such as plastic additives (i.e., phthalates and bisphenol A), as reported in the literature [30,31].
The recent literature has evidenced that global changes could not only affect temperatures, but also induce water acidification [32] that will affect marine species and rocky subtidal communities [33,34]. Moreover, the occurrence of temporary sources of pH acidification in coastal marine ecosystems does not represent a rare phenomenon: temporary water acidification is reported to originate from effluents of municipal or industrial waste-water treatment plants [35], acidification from estuarine inputs [36] and from intense activities by primary producers [37]. Coastal transitional ecosystems are naturally pH pulsating environments due to their fluctuating overall balance between a surplus of respiration and primary production [38,39]. Marine water acidification could impact juvenile and larval-stage development in calcifying organisms such as corals, molluscs, and echinoderms [32,40,41,42]. Previous research has evidenced effects on fertilization and larval survival rates of echinoderms as a consequence of ocean acidification [43]. Changes in the ecotoxicity of chemicals with marine water chemical features have been reported in the literature [44]. Furthermore, the effects induced by water acidification on ecotoxicological responses of marine species exposed to chemicals under controlled pH and temperature conditions have only recently been highlighted [45,46].
This study aims to determine the effects of leachates of plastic-made packaging—(16 different types were tested) obtained from products bought in the supermarket—in three marine species belonging to different trophic levels. Classical ecotoxicological endpoints (inhibition of bioluminescence, inhibition of growth, embryo-toxicity) and innovative endpoint of ecological relevance (i.e., larval body size) were measured in order to collect information of ecological relevance. Packaging leachates differently affected the tested marine species at natural marine water pH (8.1). We also tested lower pH levels to evaluate the possible combined effects between packaging type and water acidification. In particular, two different acidified scenarios were prepared: A1 (pH 7.80), representative of a slight acidification (−0.3 pH units from standard water), and A2 (−0.6 pH units from standard water), representative of an extremely acidified context.

2. Material and Methods

2.1. Experimental Design, Packaging Types and Leachates

Different plastic packaging types (i.e., 16) intended for food and drink products were bought in the supermarket and used to perform this study. The packaging was separated from the contents and cleaned of any food residues, if present, by careful washing with ultra-pure deionized water. Furthermore, to conduct the experimentation, care was taken to select the part of the packaging that was originally not in contact with the food.
Their detailed chemical composition and industrial use is reported in Table 1. Each plastic packaging type was cut into squares (2 × 2 cm) and 10 pieces were put in glass jars with 500 mL of filtered (0.45 μm) natural sea water (MW), opportunely corrected to pH 8.10 before starting the leaching test. A standard exposure plastic surface/water of 160 cm2/L was obtained. This value was obtained by the exposure of square tiles of 2 × 2 cm dimensions on each side that were added to a litre of marine water.
Exposure doses, in terms of g/L, obtained by the standardization of the exposed surface are reported in Table 2 and ranged from 0.03 to 2.42 g/L. Leaching time was fixed at T28 days, plastic pieces were maintained in agitation (100 rpm), under a natural light–dark cycle (16:8). At the end of the leaching time, the water was filtered at 0.45 μm and toxicity was tested in marine species belonging to different trophic levels. The packaging types that were found to be toxic in this first phase of the study were further tested at water pH 7.80 and 7.50 on the more sensitive organism (i.e., P. lividus).

2.2. μFT-IR Characterization of Plastic-Made Packaging

Chemical composition of plastic materials was determined by μFT-IR at the beginning and at the end of the test (T0 and T28) to evaluate plastic degradation during the experiments for each pH scenarios. Analyses were performed by μFT-IR (Thermo, i-10 Nicolet MX infrared imaging microscope, Thermo Fisher Scientific) equipped with standard detector for microscopy optimized to work under room temperature conditions (DTGS) operating in the spectral range 7600–450 cm−1 and with the liquid nitrogen cooled MCT-A operating within the spectral range 7800–650 cm−1. Thermo Scientific™ OMNIC™ Picta™ user interface elaborated recorded data. Filters used to filtrate leaching water were also explored to determine the release of microfibers in water.

2.3. Ecotoxicological Tests: Exposure and Endpoints

Species from three taxonomic groups of ecological relevance in marine ecosystems were tested under standardized water conditions (pH 8.1): Bacteria (Vibrio fischeri), Algae (Phaeodactylum tricornutum), and Echinodermata (Paracentrotus lividus). Leachates were tested as such (100%) for P. tricornutum and P. lividus, and 90% for V. fischeri.
V. fischeri—A standardized protocol was used for the test on bacteria. Tests were performed according to UNI EN ISO 11348-3:2009 using a Microtox® photometer and lyophilised bacteria purchased by Microbiotests Inc. The percentage of inhibition of natural bioluminescence was calculated after 15 and 30 min of exposure to packaging leachates on two experimental replicates.
P. tricornutum—A standardized protocol was used for the test on algae (ISO 10253:2016 (E). An algal lot purchased by Ecotox® was tested after pre-enrichment in an ASW (Artificial Sea Water) culture medium. Illumination, temperature, salinity, and dark–light photo-cycles were set as reported in the protocol. Cell density measures were calculated from light absorbance by a spectrophotometer (Onda, mod. UV-30 scan; wavelength 670 nm, optical length 10 cm). The spectrophotometer response was calibrated using cell density versus an absorbance curve developed on tested algal stock performing counts by Burker chamber at each of the 10 points scalar dilution of 106 cell/mL stock. Percentage of growth inhibition (I %) after 72 h of exposure was calculated for three experimental replicates. Growth inhibition was calculated as detailed in the literature [47].
P. lividus—Embryotoxicity after 72 h of exposure was tested following EPA 600/R-95-136/Section 15 adapted by Sartori et al. (2017) [48]. Mature specimens of sea urchin were caught in a natural marine areas (Tuscany) and maintained in captivity until the commencement of the experiment. Exposure tests were performed under fasting conditions as reported by the method. Percentages of abnormal larvae were calculated on 100 plutei, randomly chosen, in each experimental replicate (n = 3). Larvae were considered abnormal if they showed developmental arrest, all arms were missing or of different lengths, additional arms with crossed lateral rods, an asymmetrical body width and other anomalies listed in the literature [48]. Results were normalized compared to controls according to Abbott (1987) [49].

2.4. pH Effects on Embryo Toxicity and Body-Size of P. lividus

For P. lividus, three different packaging leachate types (Type_6 = PP; Type_13 = PP + PE; Type_16 = PET) were tested at different pH values (7.80 and 7.50, in addition to pH 8.1) and dilutions (100%; 50%; 25%) in order to evaluate changes in embryo-toxicity and body-size. The plastic types were chosen on the basis of the severity of the induced effect (obtained in the first phase of the experiment at pH 8.10). Selected types were: Type_16, Type_13 and Type_6 corresponding to severe (89.29% of abnormal larvae), moderate (65.56%) and slight (34.18%) effects, respectively. Results were normalized compared to controls according to Abbott (1987) [49]. A series of 100-50-25% dilutions were tested to evaluate the effective concentration (EC50). To better characterize the ecotoxicological responses of echinoderms, a further endpoint was used: the % reduction of arm length. Body-size of plutei was obtained measuring the mean arm lengths (Figure S1) by stereomicroscopy (Nikon, SMZ-800 N equipped with Nikon’s software Nikon ACT-1). Measurements were performed on 15 normal and 15 anomalous animals.

2.5. Quality Assurance and Quality Control

Bioscience Research Center is a certified laboratory (ISO 9001:2015) and applies a severe control procedure under guidelines of the UNI EN ISO 17025:2005 to ensure the quality of produced data (ACCREDIA 1715L). QA/QC tests were performed as described by reference methods. Positive controls were performed by the direct exposure of tested species to standard toxicants. In particular, V. fischeri was tested with 3,5′-dichlorophenol (I% 30 min = 42.26 ± 3.63); P. tricornutum responses were measured by K2Cr2O7 (EC50 = 16.21 ± 1.72 mg/L); P. lividus was tested with Cu(NO3)2*3H2O (EC50 = 22.6-68.34 μg/L), yielding responses that were within the acceptability criteria defined by standard methods. Negative controls (n = 2 for V. fischeri, n = 3 for P. tricornutum and P. lividus) were performed on natural filtered (0.45 µm) marine water (MW) under different experimental conditions (pH = 8.20 ± 0.01; 7.82 ± 0.01; 7.52 ± 0.01). Recorded data were within the acceptability of tests under standard conditions (pH = 8.20).

2.6. EC50 Calculation and Statistical Analyses

Data were statistically analyzed by GraphPad Prism (GraphPad Software, San Diego, CA, USA, www.graphpad.com, accessed on 16 March 2021). Routines related to column statistics (mean, standard deviation, min–max ranges), t-test, and EC50 values were performed. Differences were considered significant at p-value < 0.05 [50].
Multivariate (ANOSIM two-way) tests were performed by Primer v6.0 (Primer-E Ltd., Plymouth Marine Laboratory, Plymouth, UK) following the methods reported by Clarke and Warwick (2001) [51] to evaluate the effect of water acidification and chemical composition of plastic packaging on biometrics of echinoderms. Analyses were performed on a Euclidean matrix of distance, calculated on normalized biometric data. A two factors nested experimental design was applied: “packaging type” (Control, Type_6, Type_13, Type_16; four levels, fixed) and “pH” (ST, A1, A2; three levels, fixed).

3. Results

3.1. μFT-IR Characterization of Plastic-Made Packaging

µFT-IR analysis of the plastic materials did not show significant changes in the superficial chemical fingerprint after 28 days of conditioning in marine water under different pH levels. In fact, compared to T0 spectra, T28 ones showed changes <5% of the total matches (for further details refer to supplementary materials). No microfibers (>0.45 micron) were found in filters of leachates.

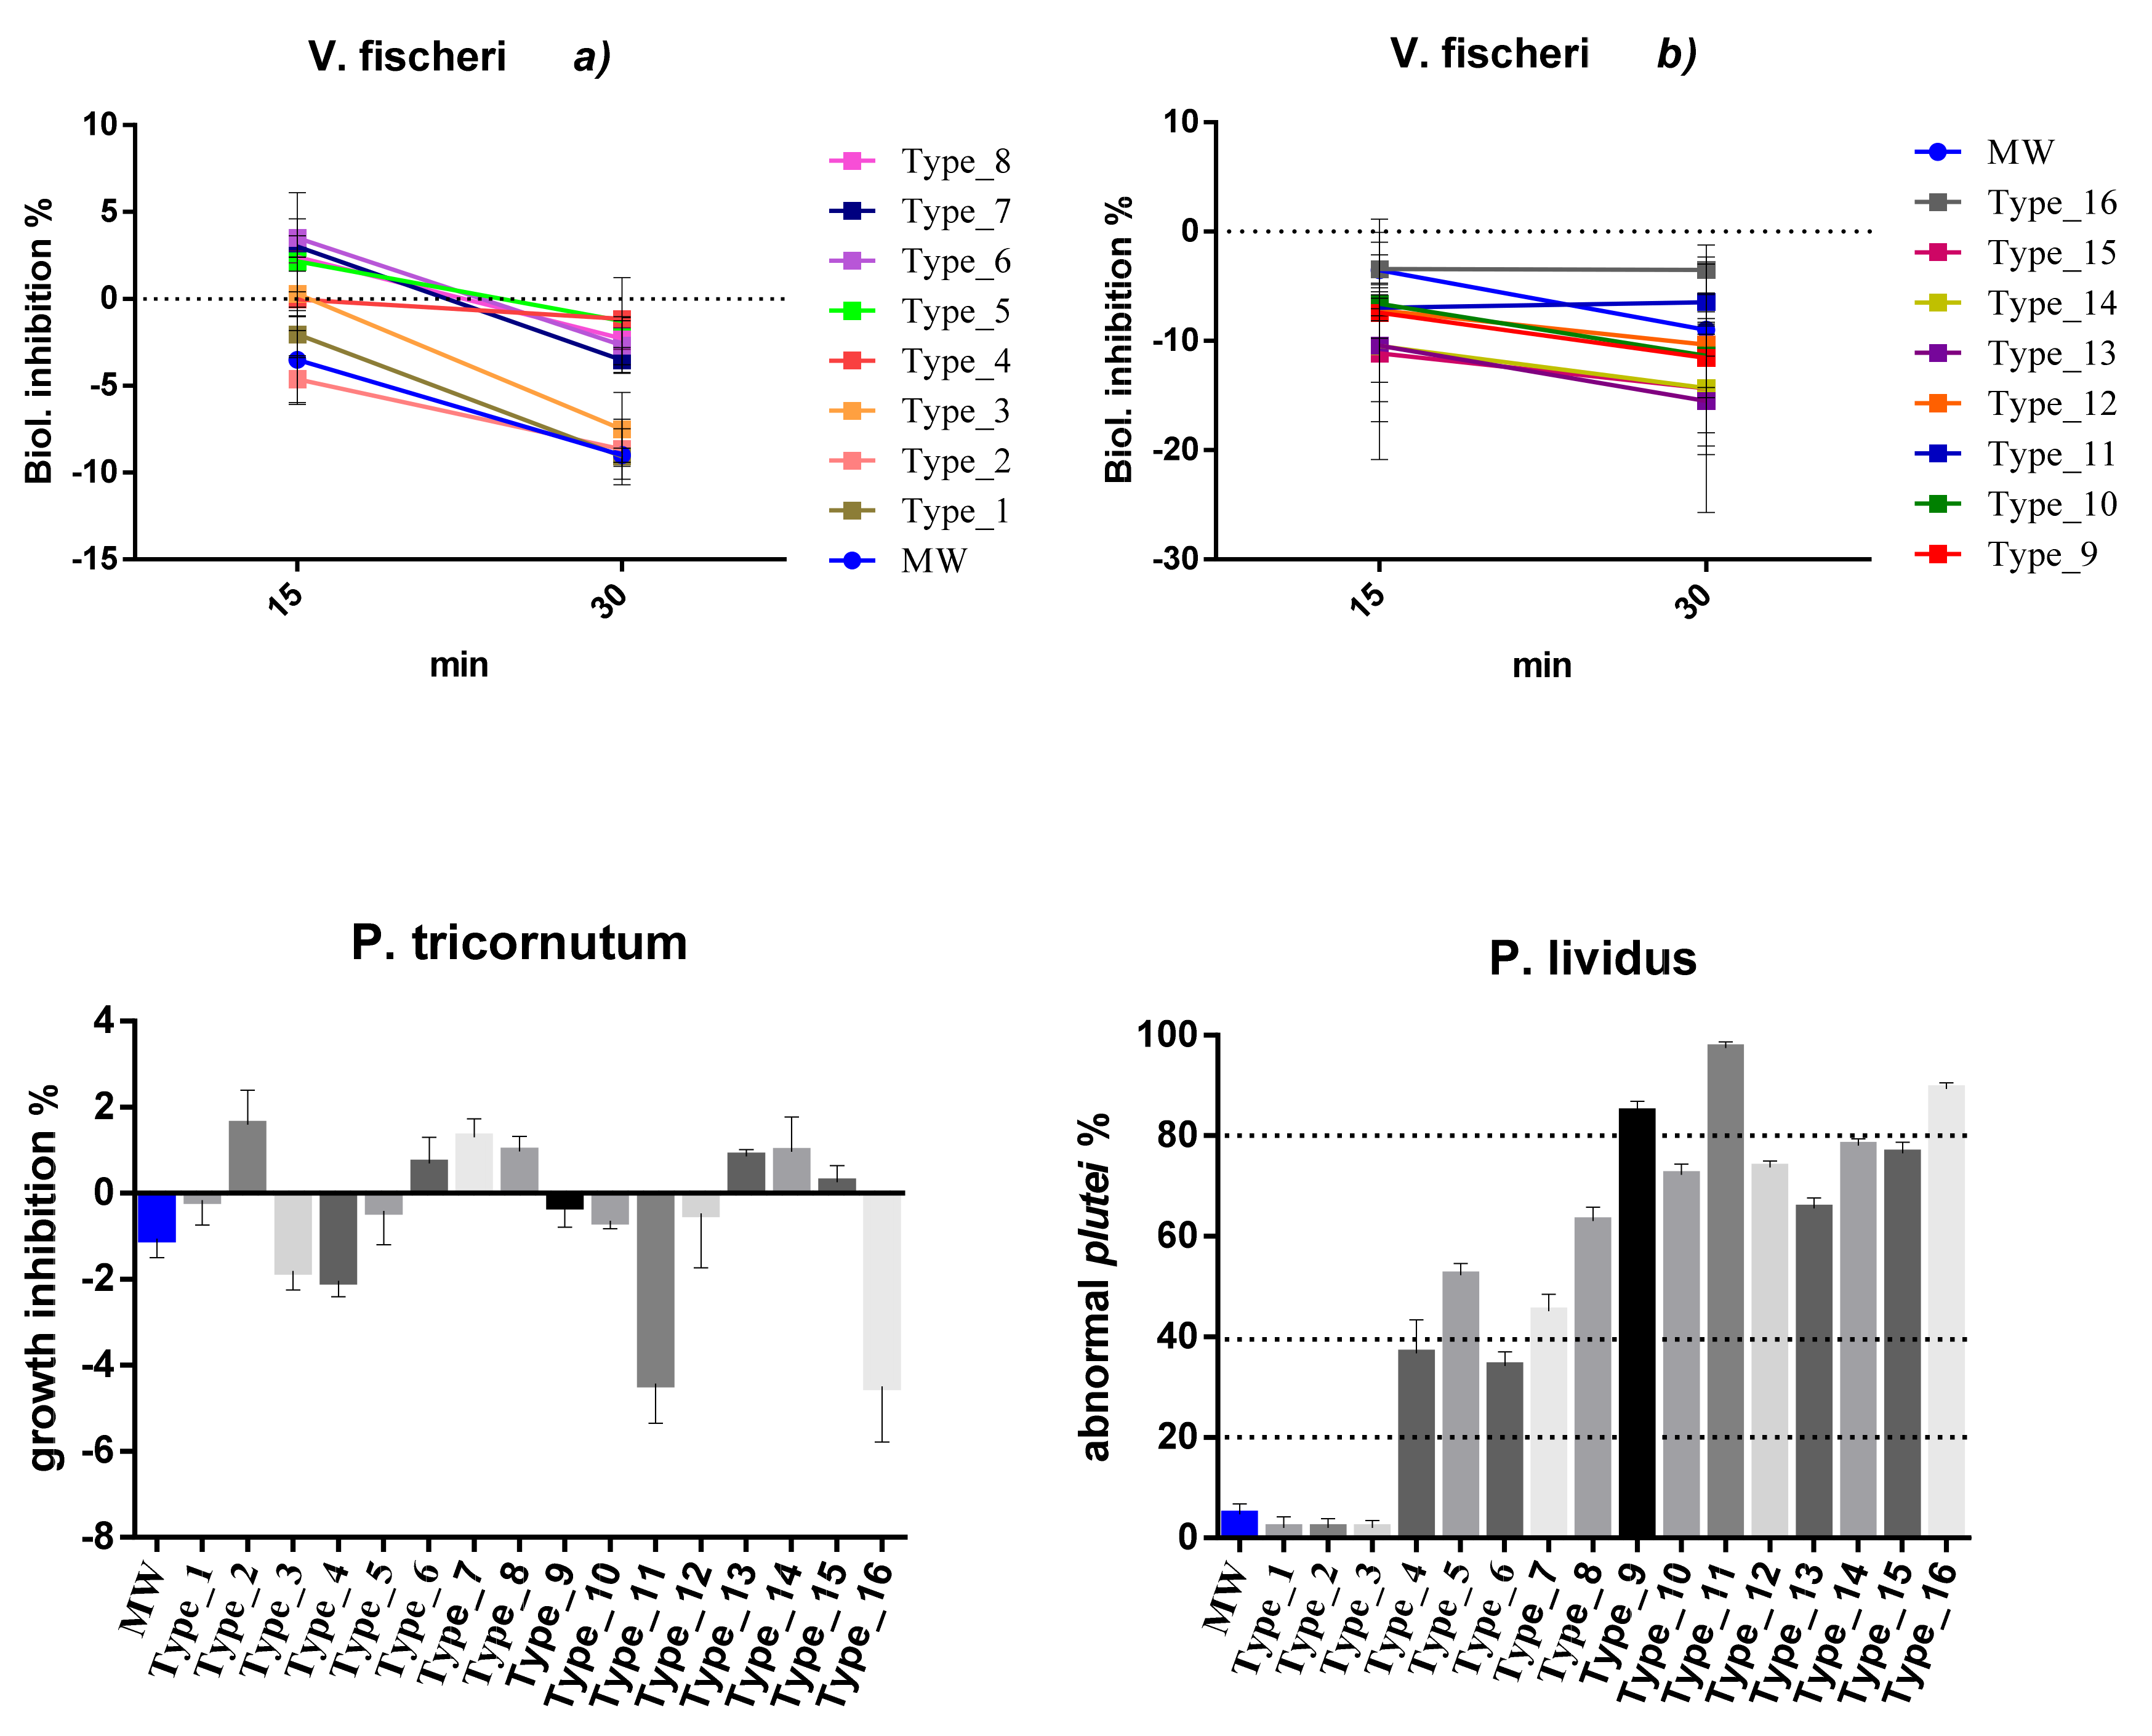
3.2. Ecotoxicological Responses at pH Standard (8.1)

Ecotoxicological effects recorded in this study under standard pH conditions (ST) are reported in Table 3 and summarized in Figure 1. A significant effect (>20%) was recorded only in echinoderm larvae.
Concerning the species V. fischeri, inhibition of bioluminescence ranged between −11.12% and +3.50% after 15 min of exposure at 90% dilution. Negative values correspond to stimulation. Recorded effects were always lower than 20%. Consequently, tested leachates can be considered as not being toxic for this species. Longer exposure times (30 min) did not significantly change the percentage effect (between −15.49% and +3.50%) with it always remaining under 20%.
As regards P. tricornutum, the mean effect percentages ranged between −4.49% and +1.59%; in some cases, inducing algal growth inhibition (Type_2, 6, 7, 8, 13, 14, 15), in others, biostimulating (Type_1, 3, 4, 5, 9, 10, 11, 12, 16). Globally tested leachates can be considered as not being toxic at the tested doses.
Significant toxicity was recorded, on the contrary, in P. lividus exposed to almost all plastic materials. In particular, packaging types one to three (i.e., Type_1 = PP; Type_2 = PDMS; Type_3 = PP) were shown to not be toxic under the tested doses with mean effects of 2.04%. All other types reported effect > 20% (cut-off level of toxicity), inducing slight (20–39%; Type_4 = PET; Type_6 = PP), moderate (40–79%; Type_5 = PT-CX; Type_7 = PS; Type_8 = PET; Type_10 = PS; Type_12 = PET+COLOUR; Type_13 = PP + PE; Type_14 = EPDM; Type_15 = PE) and severe (80–100%; Type_9 = PE+PET; Type_11 = PET; Type_16 = PET) effects. Structural anomalies recorded on exposed embryos of P. lividus are represented in Figure S2 and consist of cross lateral rods, split lateral rods, bended arms, crossed and exposed lateral rods, asymmetrical larval body growth, unequal antero-lateral arms, elongation of one of the post-oral arms, and broken or exposed lateral arms.

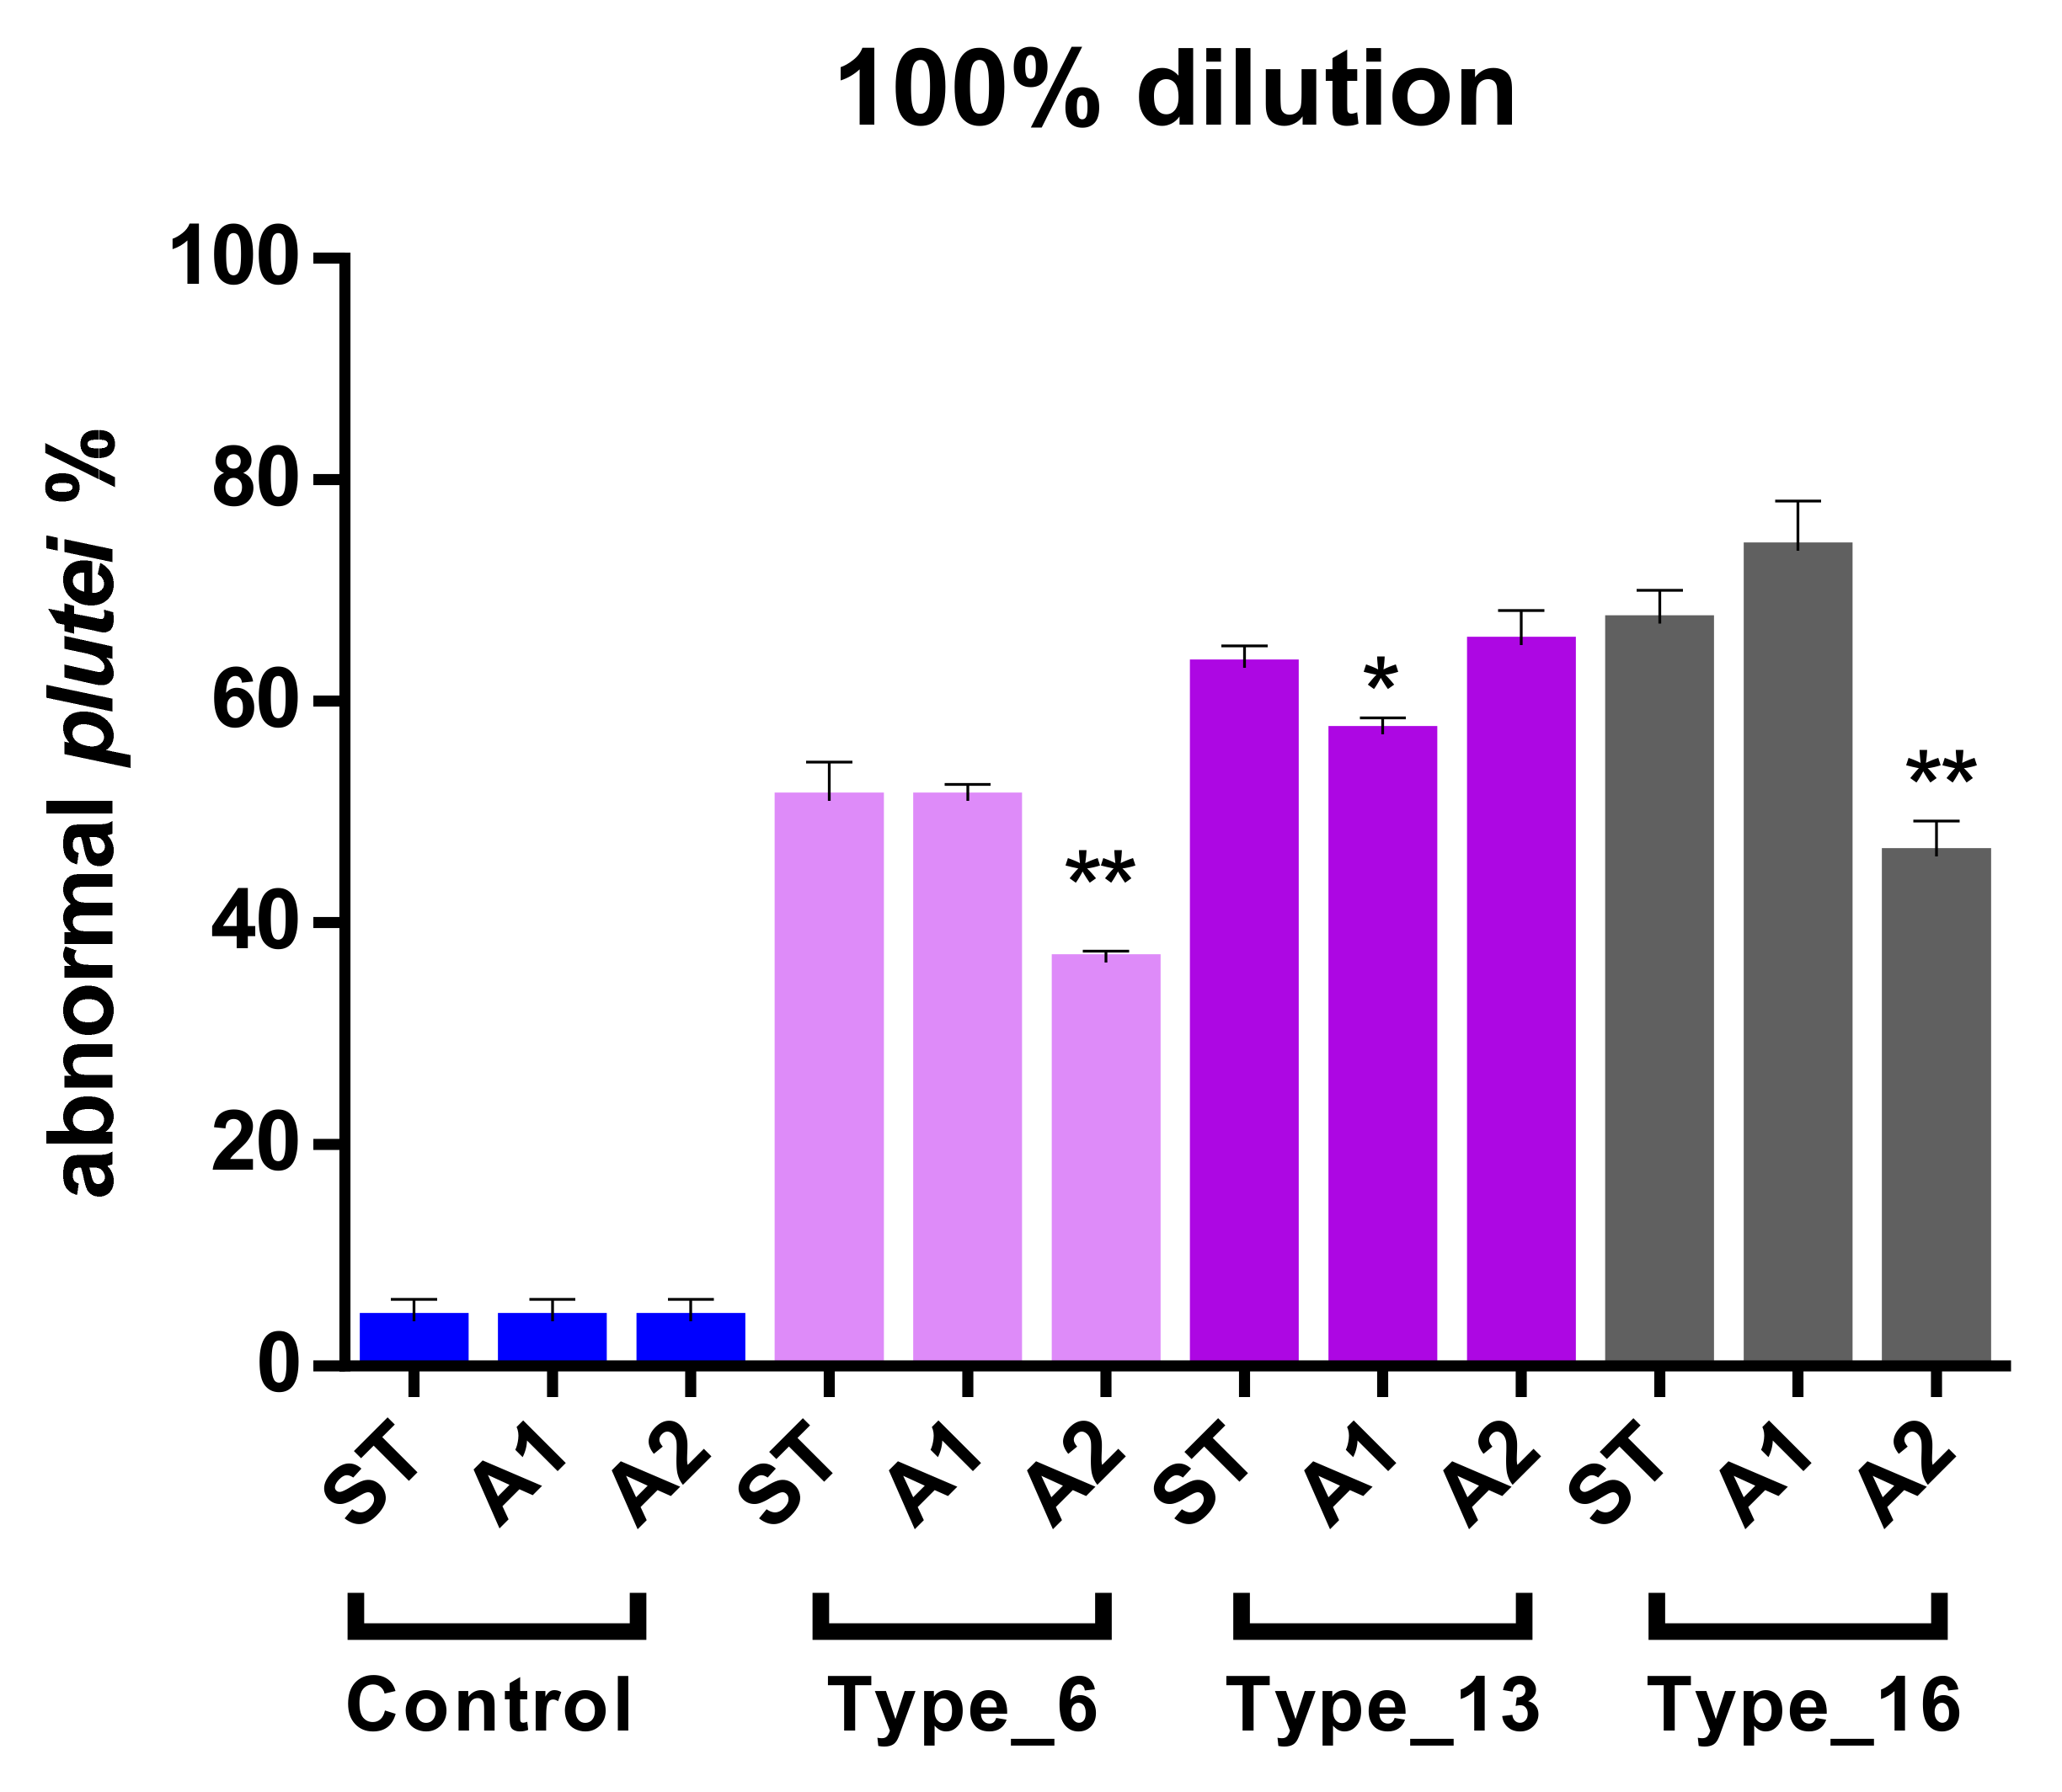
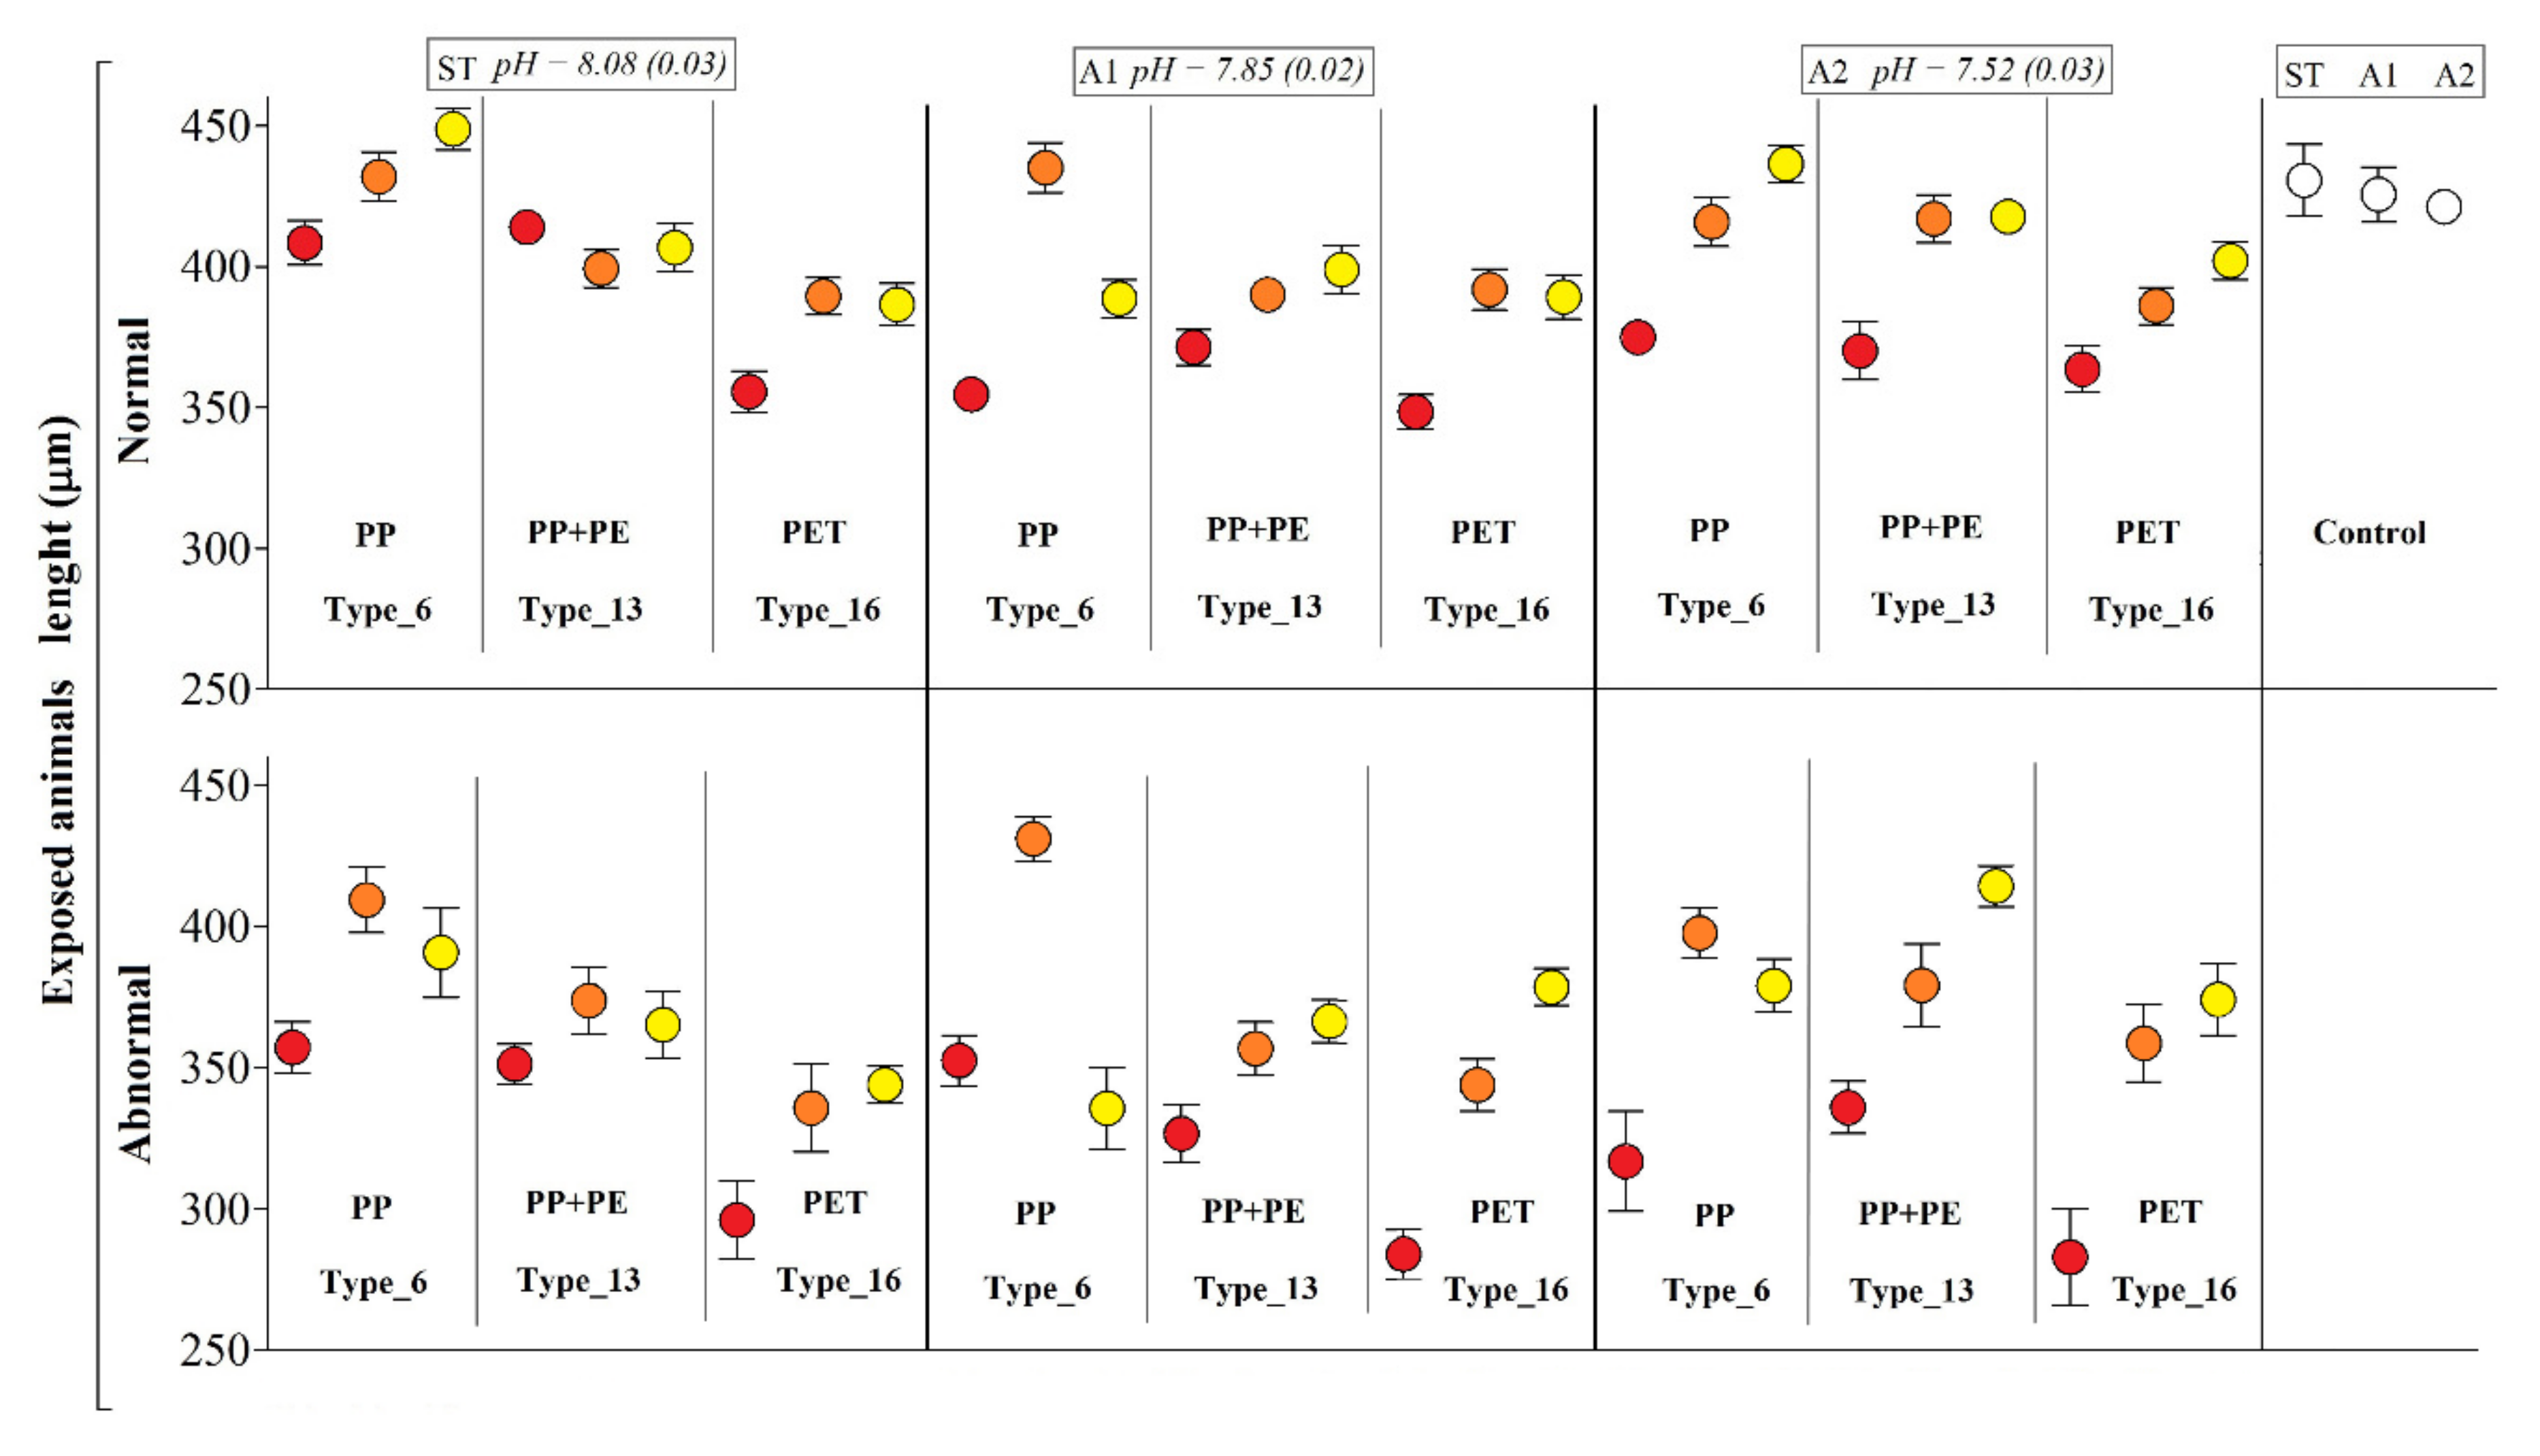
3.3. Water Acidification: Embryo Toxicity and Body-Size Reduction in P. lividus

Ecotoxicological responses of P. lividus exposed to plastic leachates (100% of dilution), under different pH conditions are reported in Table 4. Effects were evaluated by means of abnormal development and biometrics impairment at 72 h of exposure.
As regards the percentage of abnormal larvae, controls reported the same values of anomalous larvae (4.00%), without significant differences between pH. At pH standard and A1 (weakly acid), the severity of polymer-based toxicity was: Type_16 > Type_13 > Type_6. In more acidified conditions (A2), Type_13 was the more toxic treatment. Type_6 (i.e., PP) induced less severe effects, corresponding to 51.04%, 51.74% and 36.46% in ST, A1 and A2 scenarios, respectively. Effects of water acidification on abnormalities (recorded effect at the maximum tested dose) were tested by t-test and are reported in Table 5 and Figure 2.
Acidified conditions (A1, A2) often unexpectedly differed from standard (ST) pH, that is, decreasing the % of anomalous larvae. In particular, for Type_6 and Type_16, ST vs. A1 was not significantly different (p-value > 0.05), while significant differences (p-value < 0.01) were reported between ST vs. A2 and between A1 vs. A2. Type_13 corresponded to weak differences (0.01 < p-value < 0.05) in ST vs. A1 and A1 vs. A2. As regards the EC50 values, there was a trend reversal in polymer-based toxicity in ST and A1 scenarios: Type_6 > Type_13 > Type_16. The calculation of EC50 in A2 was possible only for Type_13 and corresponded to 64.5%.
The ability of Type_16 to induce more severe effects was confirmed by the mean length reduction (%) in abnormal larvae in respect to controls (up to 32.97%) and to normal plutei (up to 22.18%) (Figure 3 and Table 5). Biometrics revealed to be sensitive enough to also highlight differences between controls and normal larvae (at pH 8.1, Figure 3). Figure 4 shows the effects on body-size of P. lividus larvae, after exposure to the three different plastic packaging types, water pH and dilution of leachates. Multivariate statistical analyses were performed on both normal and abnormal embryos to detect differences between factors. The ANOSIM test (two way) (Table 6) evidenced that, concerning abnormal embryos, pH is not effective to determine body-size differences (Global R = −0.034; p = 72.1%), while the type of plastic packaging material significantly affects this aspect (Global R = 0.287; p = 0.2%). In particular, larger differences were recorded between PP−PET (Global R = 0.142; p = 3.4%), while no differences were recorded between PP−Negative control (Global R = −0.327; p = 90%). A significant effect of packaging type was also recorded on the body-size of normal embryos (Global R = −0.270; p = 1.7%). Also, in this case, larger differences are recorded between PP-PET (Global R = 0.142; p = 3.4%), while no differences were recorded between PP−Negative control (p = 100%). In this case, pH showed a non-significant but higher effect than on abnormal embryos (Global R = 0.017; p = 33.8%).

4. Discussion

Plastic pollution in marine environments can severely affect ecosystems via different direct and indirect threats, causing physical damage, biological threats and chemical harm [10,52,53]. Only recently are we beginning to realize and study the chemical hazards associated with plastic litter known to be associated with a “cocktail of chemicals”. In fact, leaching processes in marine habitats could determine significant releases of chemicals from plastic packaging and produce effects on marine species [30,31].
Results obtained in this study at pH standard (8.1 units) on leachates, evidenced that the tested doses are not able to significantly affect bacteria (V. fischeri) and algae (P. tricornutum). On the contrary, P. lividus larvae were significantly affected by several packaging leachates, meaning that this is a sensitive organism for testing plastic pollution. A total of 13 out of 16 packaging types were toxic. Specifically, Type_4 and 6 induced slight effects (<40%), Type_5, 7, 8, 10, 12, 13, 14, 15 medium effects (40–80%), and Type_9, 11, 16 severe effects (>80%). The first category is represented by PET and PP intended for water bottles and bread containers; the second one is composed of a great variety of single type (cellophane, PS, PET, PE, EPDM) and combined polymers (PE + PET, PP + PE, PET + COLOR) intended to contain butter, yogurt, meat, mozzarella, cakes, as well as being generically used to produce “shopping bags” and “freezer bags”. The more hazardous category is represented by PET (alone or in combination with PE), intended for “bags”, “cake trays” and “new type shopping bags”. PET, together with PP and PE is the resin that is used more frequently for packaging purposes [2]. Other studies have reported the toxicity of PET leachates (100 mg/L, 100% dilution) to echinoderm larvae [54]: leachates prepared after only 72 h of conditioning in marine water induced abnormal development in 27.2% of cases, under fasting conditions. In the present study, the plastic concentration never exceeded 12 mg/L but a longer leaching time (28 days) evidently contributed to increased toxicity, inducing more severe consequences (up to 97.45%). The sensitivity of echinoderm larvae to plastic pollution is well documented in the literature. In 2012, Feng et al. [55] reported that exposure to polysiloxane could affect the embryonic development of sea urchins (Arbacia punctulata). Oliviero et al. (2019) [56] reported a drastic reduction in larval length (33%) in plutei exposed to PVC leachates, probably due to the presence of phthalates. PVC leachates (72 h, 10% dilution) containing polycyclic aromatic hydrocarbons and polychlorinated biphenyls affected sea urchin development, inducing developmental delays, malformation of skeletal structures and nervous and immune systems, as well as abnormal axis formation [57].
The second part of this study was conducted focusing the attention on leachates of packaging which corresponded to slight (Type_6), moderate (Type_13) and severe (Type_16) toxicity, at different pH conditions. Different pH levels were prepared to simulate acidified (−0.3 pH units = 7.80) and extremely acidified (−0.6 pH units = 7.50) conditions in marine water. Ocean acidification is considered one of the principal consequences of global climate change [58] and this study wanted to understand the possible combined effect of plastic-made packaging leachates and water acidification on the ecotoxicological responses of P. lividus larvae. Effects on echinoderms consisted of both the percentage of abnormalities and biometrics variations. Acidification alone did not induce significant differences (as shown by controls) suggesting a low sensitivity to water acidification. However, echinoderms were capable of discerning chemical changes in the water medium that were not detectable by µFT-IR analysis, thus, providing a first alarm. In fact, on the one hand, no spectral variations were observed on plastic surfaces conditioned in standard and acidified marine water; on the other hand, echinoderms exposed to leachates at acidified conditions (A1–A2) highlighted statistically significant differences in respect to standard pH. In particular, acidified scenarios induced a lower percentage of anomalous larvae, suggesting a complex plastic–pH interaction that is difficult to understand. In this regard, a useful contribution could come from a more detailed chemical analysis. In fact, detailed information on leached chemical additives may require additional chemical analysis, such as adsorption chromatography coupled with GC–MS (not performed in this context).
The level of packaging-based severity shows Type_16 as the most toxic, and Type_6 as the least hazardous (confirming the results of the first part of the experiment). Type_16 is PET used for the production of new type of shopping bags, whereas Type_6 is PP intended to contain bread. Type_16 was also more toxic in terms of biometric impairment, resulting in animals being shorter than 30.51, 32.39 and 32.97% in ST, A1 and A2 conditions, respectively (abnormal vs. controls). Biometrics also demonstrated to be a sensitive endpoint in observing variations between abnormal and normal-formed embryos of treated animals. In fact, the first one highlighted arm lengths that were 16.73, 18.47 and 22.18% shorter. Biometrics can show a reduction in body-size when a stress condition is present in the environment: organisms under stress conditions activate metabolic patterns that cause energy consumption. If organisms have low levels of energy available, their development will be reduced. Thus, biometric variations could be considered a precocious marker of stress, as reported by other similar studies [54].
Another important implication of organisms’ biomass reduction is the minor energy flow into the trophic web. Lindeman [59] was the first to demonstrate that ecosystem functioning can be represented by energy flow through a trophic pyramid or food web. The efficiency of energy transfer among higher trophic levels is often consistent with the hypothesis that trophic structure may control the fraction of energy consumed within each trophic level, rather than energetics controlling trophic structure [60]. This energy transformation at each trophic level (as well as by each organism) represents the storage of potential energy that fuels metabolic processes and power output at each trophic level. Energy flow reflects the transfer of energy for productivity by all trophic levels [61]. Each level of the trophic web cannot consume more matter than is available, and energy is lost during each transfer between trophic levels, moreover, a portion of the assimilated energy must be used to support metabolic work (e.g., for maintenance, food acquisition, and various other activities) and is lost through respiration [61]. When organisms have less energy, one of the consequences is reduced reproductive success, involving minor organisms, thus, less matter and energy is available in the trophic web.
Analyzed in its entirety, the multivariate analysis highlighted that acid conditions were not relevant to induce important biometric impairment, and therefore, additional expenditure of energy was not required. In fact, the factor “acidification” influenced the occurrence of developmental anomalies in a positive way: larvae exposed to acid scenarios (A1, A2) statistically differed from standard water reporting a decreasing in the anomalous larvae percentage. Further studies are necessary to better elucidate this aspect.

5. Conclusions

This study aimed to determine the effects of leachates of plastic-made packaging (16 different types tested) in three marine species, belonging to different trophic levels. Tested doses were not able to significantly affect bacteria (V. fischeri) and algae (P. tricornutum). On the contrary, P. lividus larvae were significantly affected by several packaging leachates (13 out of 16), making this a sensitive organism for testing plastic pollution. The most hazardous polymer was the PET (alone or in a combination with PE) inducing up to 97.45% of abnormal larvae and plutei, with a mean arm length that was 30.51% shorter than the controls. This study also aimed to explore the combined effect between “packaging type” and “water acidification” (in the frame of global changes) on the ecotoxicological responses of P. lividus. Globally, water acidification was not able to induce biometric impairment, thus, additional expenditure of energy was not required. As a consequence, exposure to acidic water positively influenced the occurrence of developmental anomalies, decreasing the percentage of anomalous larvae. Further studies are necessary to better elucidate this aspect. Finally, biometric variations could be considered a precocious marker of stress in echinoderm larvae.

Supplementary Materials

The following are available online at https://www.mdpi.com/article/10.3390/jmse9040432/s1, Figure S1: Determination of body-size of P. lividus obtained by measuring the mean arms lengths (L1 + L2)/2; expressed in µm. Figure S2. Representation of recorded anomalies in P. lividus exposed to different plastic packaging types. (a) normal; (b–w) examples of different types of alterations: alteration of L1/L2 ratio, cross lateral rods, split lateral rods, bended arms, crossed and exposed lateral rods, asymmetrical larval body growth, unequal antero-lateral arms, elongation of one of the post-oral arms, broken lateral rods, exposed lateral rods, etc.

Author Contributions

Conceptualization, M.R. and S.A.; methodology, validation, S.A.; formal analysis, M.P.; investigation, S.A., F.P., E.G.; resources, M.R.; writing—original draft preparation, M.P., M.R.; writing—review and editing, M.P., M.R., A.T.; visualization, M.P.; supervision, M.R.; project administration, M.R.; funding acquisition, M.R. All authors have read and agreed to the published version of the manuscript.

Funding

This research was funded by Bioscience Research Center, grant number 022019BSRC.

Institutional Review Board Statement

Not applicable.

Informed Consent Statement

Not applicable.

Data Availability Statement

Original data could be available on request under a specific agreement with BsRC.

Conflicts of Interest

The authors declare no conflict of interest.

References

  1. Geyer, R.; Jambeck, J.R.; Law, K.L. Production, Use, and Fate of All Plastics Ever Made. Sci. Adv. 2017, 3, e1700782. [Google Scholar] [CrossRef] [PubMed] [Green Version]
  2. Plastics Europe. Plastics—The Facts; PlasticEurope: Brussels, Belgium, 2020. [Google Scholar]
  3. Ocean Conservancy. Together, We Are Team Ocean; Ocean Conservancy: Washington, DC, USA, 2020. [Google Scholar]
  4. Carpentieri, S.; Di Vito, S.; Zampetti, G.; Scocchera, E.; Nuglio, S.; Cugnata, F. Beach Litter, Indagine sui rifiuti nelle spiagge italiane. Legambiente, Maggio. 2018. Available online: https://www.legambiente.it/sites/default/files/docs/dossier_beachlitter2018.pdf (accessed on 28 December 2018).
  5. Guerranti, C.; Cannas, S.; Scopetani, C.; Fastelli, P.; Cincinelli, A.; Renzi, M. Plastic litter in aquatic environments of Maremma Regional Park (Tyrrhenian Sea, Italy): Contribution by the Ombrone river and levels in marine sediments. Mar. Pollut. Bull. 2017, 117, 366–370. [Google Scholar] [CrossRef] [PubMed]
  6. AEA. Problemi Prioritari per L’ambiente Mediterraneo; Report AEA 4/2006; AEA: Copenaghen, Denmark, 2006; p. 92. ISSN 1725–9177. [Google Scholar]
  7. UNEP. Marine Litter Assessment in the Mediterranean; UNEP/MAP 48; UNEP/MAP: Vassileos Konstantinou Ave., Athens, Greece, 2015; p. 45. ISBN 978-92-807-3564-2. Available online: www.unepmap.org (accessed on 15 April 2020).
  8. UNEP. Marine Plastic Debris and Microplastics—Global Lessons and Research to Inspire Action and Guide Policy Change; United Nations Environment Programme: Nairobi, Kenya, 2016; p. 192. Available online: http://ec.europa.eu/environment/marine/good-environmental-status/descriptor10/pdf/Marine_plastic_debris_and_microplastic_technical_report_advance_copy.pdf (accessed on 28 December 2018).
  9. Browne, M.A.; Crump, P.; Niven, S.J.; Teuten, E.; Tonkin, A.; Galloway, T.S.; Thompson, R.C. Accumulation of microplastic on shorelines worldwide: Sources and sinks. Env. Sci. Technol. 2011, 45, 9175–9179. [Google Scholar] [CrossRef] [PubMed]
  10. Eerkes-Medrano, D.; Thompson, R.C.; Aldrige, D.C. Microplastic in freshwater systems: A review of the emerging threats, identification of knowledge gaps and prioritization of research needs. Water Res. 2015, 75, 63–82. [Google Scholar] [CrossRef]
  11. Mani, T.; Hauk, A.; Walter, U.; Burkhardt-Holm, P. Microplastics profile along the Rhine river. Sci. Rep. 2015, 5, 17988. [Google Scholar] [CrossRef]
  12. Alomar, C.; Estarellas, F.; Deudero, S. Microplastics in the Mediterranean Sea: Deposition in coastal shallow sediments, spatial variation and preferential grain size. Marine. Environ. Res. 2016, 115, 1–10. [Google Scholar] [CrossRef]
  13. Blašković, A.; Fastelli, P.; Čižmek, H.; Guerranti, C.; Renzi, M. Plastic litter in sediments from the Croatian marine protected area of the natural park of Telaščica bay (Adriatic Sea). Mar. Pollut. Bull. 2017, 114, 583–586. [Google Scholar] [CrossRef]
  14. Blašković, A.; Guerranti, C.; Fastelli, P.; Anselmi, S.; Renzi, M. Plastic levels in sediments closed to Cecina river estuary (Tuscany, Italy). Mar. Pollut. Bull. 2018, 135, 105–109. [Google Scholar] [CrossRef]
  15. Setälä, O.; Fleming-Lehtinen, V.; Lehtiniemi, M. Ingestion and transfer of microplastics in the planktonic food web. Environ. Pollut. 2014, 185, 77–83. [Google Scholar] [CrossRef]
  16. Romeo, T.; Pietro, B.; Pedà, C.; Consoli, P.; Andaloro, F.; Fossi, M.C. First evidence of presence of plastic debris in stomach of large pelagic fish in the Mediterranean Sea. Mar. Pollut. Bull. 2015, 95, 358–361. [Google Scholar] [CrossRef]
  17. Renzi, M.; Blašković, A.; Bernardi, G.; Russo, G.F. Plastic litter transfer from sediments towards marine trophic webs: A case study on holothurians. Mar. Pollut. Bull. 2018, 135, 376–385. [Google Scholar] [CrossRef]
  18. Thompson, R.C.; Olsen, Y.; Mitchell, R.P.; Davis, A.; Rowland, S.J.; John, A.W.G.; McGonigle, D.; Russel, A.E. Lost at sea: Where is all the plastic? Science 2004, 304, 838. [Google Scholar] [CrossRef]
  19. Graham, E.R.; Thompson, J.T. Deposit- and suspension-feeding sea cucumbers (Echinodermata) ingest plastic fragments. J. Exper. Mar. Biol. Ecol. 2009, 368, 22–29. [Google Scholar] [CrossRef]
  20. Murray, F.; Cowie, P.R. Plastic contamination in the decapod crustacean Nephrops norvegicus (Linnaeus, 1758). Mar. Pollut. Bull. 2011, 62, 1207–1217. [Google Scholar] [CrossRef]
  21. Renzi, M.; Cannas, S.; Fastelli, P.; Marcelli, M.; Guerranti, C.; Barone, L.; Massara, F. Is the microplastic selective according to the habitat? Records in Amphioxus sands, Mäerl bed habitats and Cymodocea nodosa habitats. Mar. Pollut. Bull. 2018, 130, 179–183. [Google Scholar] [CrossRef]
  22. Renzi, M.; Guerranti, C.; Blašković, A. Microplastic contents from maricoltured and natural mussels. Mar. Pollut. Bull. 2018, 131, 248–251. [Google Scholar] [CrossRef]
  23. Renzi, M.; Specchiulli, A.; Blašković, A.; Manzo, C.; Mancinelli, G.; Cilenti, L. Marine litter in stomach content of small pelagic fishes from the adriatic sea: Sardines (Sardina pilchardus) and anchovies (Engraulis encrasicolus). Environ. Sci. Pollut. Res. 2018, 26, 2771–2781. [Google Scholar] [CrossRef]
  24. Renzi, M.; Blašković, A. Litter & microplastics features in table salts from marine origin: Italian versus Croatian brands. Mar. Pollut. Bull. 2018, 135, 62–68. [Google Scholar]
  25. Allen, A.S.; Seymour, A.C.; Rittschof, D. Chemoreception drives plastic consumption in a hard coral. Mar. Pollut. Bull. 2017, 124, 198–205. [Google Scholar] [CrossRef]
  26. Li, H.-X.; Ma, L.-S.; Lin, L.; Ni, Z.-X.; Xu, X.-R.; Shi, H.-H.; Yan, Y.; Zheng, G.-M.; Rittschof, D. Microplastics in oysters Saccostrea cucullata along the Pearl River Estuary, China. Environ. Pollut. 2018, 236, 619–625. [Google Scholar] [CrossRef]
  27. Diana, Z.; Sawickij, N.; Rivera, N.A.; Hsu-Kim, H.; Rittschof, D. Plastic pellets trigger feeding responses in sea anemones. Aquat. Toxicol. 2020, 222, 105447. [Google Scholar] [CrossRef] [PubMed]
  28. Agusman, Q.Y.; Wu, Z.; He, J.; Rittschof, D.; Su, P.; Ke, C.; Feng, D. Conspecific cues that induce spore settlement in the biofouling and green tide-forming alga Ulva tepida provide a potential aggregation mechanism. Int. Biodeterior. Biodegrad. 2019, 145, 104807. [Google Scholar] [CrossRef]
  29. Li, H.-X.; Orihuela, B.; Zhu, M.; Rittschof, D. Recyclable plastics as substrata for settlement and growth of bryozoans Bugula neritina and barnacles Amphibalanus amphitrite. Environ. Pollut. 2016, 218, 973–980. [Google Scholar] [CrossRef] [PubMed]
  30. Rochman, C.M.; Hoh, E.; Kurobe, T.; Teh, S.J. Ingested plastic transfers contaminants to fish and induces hepatic stress. Nat. Sci. Rep. 2013, 3, 3263. [Google Scholar] [CrossRef]
  31. Pedà, C.; Caccamo, L.; Fossi, M.C.; Gai, F.; Genovese, L.; Perdichizzi, A.; Andaloro, F.; Romeo, T.; Maricchiolo, G. Intestinal alterations in European sea bass Dicentrarchus labrax (Linnaeus, 1758) exposed to microplastics: Preliminary results. Environ. Pollut. 2016, 212, 251–256. [Google Scholar] [CrossRef]
  32. Dupont, S.; Lundve, B.; Thorndyke, M. Near future ocean acidification increases growth rate of the lecithotrophic larvae and juvenile of the seastar Crossaster papposus. J. Exp. Zool. Part B 2010, 314, 382–389. [Google Scholar] [CrossRef]
  33. Asnaghi, V.; Chiantore, M.; Mangialajo, L.; Gazeau, F.; Francour, P.; Alliouane, S.; Gattuso, J.P. Cascading effects of ocean acidification in a rocky subtidal community. PLoS ONE 2013, 8, e61978. [Google Scholar]
  34. Asnaghi, V.; Mangialajo, L.; Gattuso, J.P.; Francour, P.; Privitera, D.; Chiantore, M. Effect of ocean acidification and diet on thickness and carbonate elemental composition of the test juvenile sea urchin. Mar. Environ. Res. 2014, 93, 78–84. [Google Scholar] [CrossRef]
  35. Aniyikaiye, T.E.; Oluseyi, T.; Odiyo, J.O.; Edokpayi, J.N. Physico-chemical analysis of wastewater discharge from selected paint industries in Lagos, Nigeria. Int. J. Environ. Res. Public Health 2019, 16, 1235. [Google Scholar] [CrossRef] [Green Version]
  36. Sammut, J.; Melville, M.; Callinan, R.; Fraser, G. Estuarine Acidification: Impacts on Aquatic Biota of Draining Acid Sulphate Soils. Aust. Geogr. Stud. 1995, 33, 89–100. [Google Scholar] [CrossRef]
  37. Hinga, K.R. Effects of pH on coastal marine phytoplankton. Mar. Ecol. Prog. Ser. 2002, 238, 281–300. [Google Scholar] [CrossRef]
  38. Specchiulli, A.; Focardi, S.; Renzi, M.; Scirocco, T.; Cilenti, L.; Breber, P.; Bastianoni, S. Environmental heterogeneity patterns and assessment of trophic levels in two Mediterranean lagoons: Orbetello and Varano, Italy. Sci. Total. Environ. 2008, 402, 285–298. [Google Scholar] [CrossRef]
  39. Basset, A.; Barbone, E.; Rosati, I.; Vignes, F.; Breber, P.; Specchiulli, A.; D’Adamo, R.; Renzi, M.; Focardi, S.E.; Ungaro, N.; et al. Resistance and resilience of ecosystem descriptors and properties to dystrophic events: A study case in a Mediterranean lagoon. Transit. Waters Bull. 2013, 7, 1–22. [Google Scholar]
  40. Kurihara, H.; Kato, S.; Ishimatsu, A. Effects of increased seawater pCO2 on early development of the oyster Crassostrea gigas. Aquat. Biol. 2007, 1, 91–98. [Google Scholar] [CrossRef]
  41. Dupont, S.; Ortega-Martinez, O.; Thorndyke, M. Impact of near-future ocean acidification on echinoderms. Ecotoxicology 2010, 19, 449–462. [Google Scholar] [CrossRef]
  42. Suwa, R.; Nakamura, M.; Morita, M.; Shimada, K.; Iguchi, A.; Sakai, K.; Suzuki, A. Effects of acidified seawater on early life stages of scleractinian corals (Genus Acropora). Fish. Sci. 2009, 76, 93–99. [Google Scholar] [CrossRef]
  43. Martin, S.; Richier, S.; Pedrotti, M.-L.; Dupont, S.; Castejon, C.; Gerakis, Y.; Kerros, M.-E.; Oberhänsl, F.; Teyssié, J.-L.; Jeffree, R.; et al. Early development and molecular plasticity in the Mediterranean Sea urchin Paracentrotus lividus exposed to CO2-driven acidification. J. Exp. Biol. 2011, 214, 1357–1368. [Google Scholar] [CrossRef] [Green Version]
  44. Chou, P.-I.; Ng, D.-Q.; Li, I.-C.; Lin, Y.-P. Effects of dissolved oxygen, pH, salinity and humic acid on the release of metal ions from PbS, CuS and ZnS during a simulated storm event. Sci. Total Environ. 2018, 624, 1401–1410. [Google Scholar] [CrossRef]
  45. Serra-Compte, A.; Maulvault, A.L.; Camacho, C.; Álvarez-Muñoz, D.; Barceló, D.; Rodríguez-Mozaz, S.; Marques, A. Effects of water warming and acidification on bioconcentration, metabolization and depuration of pharmaceuticals and endocrine disrupting compounds in marine mussels (Mytilus galloprovincialis). Environ. Pollut. 2018, 236, 824–834. [Google Scholar] [CrossRef]
  46. Fastelli, P.; Renzi, M. Exposure of key marine species to sunscreens: Changing ecotoxicity as a possible indirect effect of global warming. Mar. Pollut. Bull. 2019, 149, 110517. [Google Scholar] [CrossRef]
  47. Renzi, M.; Roselli, L.; Giovani, A.; Focardi, S.E.; Basset, A. Early warning tools for ecotoxicity assessment based on Phaeodactylum tricornutum. Ecotoxicology 2014, 23, 1055–1072. [Google Scholar] [CrossRef]
  48. Sartori, D.; Macchia, S.; Vitiello, V.; Morroni, L.; Onorati, F.; Pellegrini, D. ISPRA, Quaderni—Ricerca Marina n. 11/2017; Macchia, S., Sartori, D., Eds.; ISPRA: Roma, Italy, 2017; p. 60. [Google Scholar]
  49. Abbott, W.S. A method of computing the effectiveness of an insecticide. J. Am. Mosq. Control Assoc. 1987, 3, 302–303. [Google Scholar] [CrossRef]
  50. Sarni, A.; Onorati, F. Controls variability in algal growth inhibition test on Dunaliella tertiolecta as possible scale threshold. Biol. Mar. Medit. 2009, 14, 33–49. [Google Scholar]
  51. Clarke, K.R.; Warwick, R.M. A further biodiversity index applicable to species lists: Variation in taxonomic distinctness. Mar. Ecol. Prog. Ser. 2001, 216, 265–278. [Google Scholar] [CrossRef]
  52. Besseling, E.; Redondo-Hasselerharm, P.; Foekema, E.M.; Koelmans, A.A. Quantifying Ecological Risks of Aquatic Micro- and Nanoplastic. Crit. Rev. Environ. Sci. Technol. 2018, 49, 32–80. [Google Scholar] [CrossRef] [Green Version]
  53. Bucci, K.; Tulio, M.; Rochman, C.M. What is known and unknown about the effects of plastic pollution: A meta-analysis and systematic review. Ecol. Appl. 2019, 30, e02044. [Google Scholar] [CrossRef]
  54. Piccardo, M.; Provenza, F.; Grazioli, E.; Cavallo, A.; Terlizzi, A.; Renzi, M. PET microplastics toxicity on marine key species is influenced by pH, particle size and food variations. Sci. Total. Environ. 2020, 715, 136947. [Google Scholar] [CrossRef]
  55. Feng, D.Q.; Rittschof, D.; Orihuela, B.; Kwok, K.W.H.; Stafslien, S.; Chisholm, B. The effects of model polysiloxane and fouling-release coatings on embryonic development of a sea urchin (Arbacia punctulata) and a fish (Oryzias latipes). Aquat. Toxicol. 2012, 110, 162–169. [Google Scholar] [CrossRef]
  56. Oliviero, Maria, Tania Tato, Simona Schiavo, Sonia Manzo, and Ricardo Beiras. Leachates of Micronized Plastic Toys Provoke Embryotoxic Effects upon Sea Urchin Paracentrotus lividus. Environ. Pollut. 2019, 247, 706–715.
  57. Rendell-Bhatti, F.; Paganos, P.; Pouch, A.; Mitchell, C.; D’Aniello, S.; Godley, B.J.; Pazdro, K.; Arnone, M.I.; Jimenez-Guri, E. Developmental Toxicity of Plastic Leachates on the Sea Urchin Paracentrotus Lividus. Environ. Pollut. 2021, 269, 115744. [Google Scholar] [CrossRef]
  58. Raven, J. Ocean Acidification Due to Increasing Atmospheric Carbon Dioxide; The Royal Society: Cardiff, UK, 2005; Volume 12/05. [Google Scholar]
  59. Kontrick, A.V. Microplastics and Human Health: Our Great Future to Think About Now. J. Med Toxicol. 2018, 14, 117–119. [Google Scholar] [CrossRef] [PubMed] [Green Version]
  60. Wetzel, R.G. Death, detritus, and energy flow in aquatic ecosystems. Freshw. Biol. 1995, 33, 83–89. [Google Scholar] [CrossRef]
  61. Schowalter, T.D. Insect Ecology: An Ecosystem Approach; Academic press: Cambridge, MA, USA, 2016. [Google Scholar]
Figure 1. Mean percentage of effects in tested species for each packaging type. Results are expressed in percentage (%). Standard deviation is represented. Negative values represent stimulation while positive values imply inhibition. MW = marine water (negative control, blue colour). Data are reported under standard pH conditions (8.10). Effect (>20%) was recorded only in echinoderm larvae. Echinoderm data were corrected with Abbott’s correction: (X − Y)/(100 − Y)*100, where X is the effect cause by the sample and Y is the effect cause by the control. Leachate dilution: 100% for echinoderms and algae; 90% for bacteria.
Jmse 09 00432 g001
Figure 2. Effect of water acidification in determining abnormal development of P. lividus larvae (100% of dilution). T-test was performed within each plastic type comparing the different scenarios of acidification (ST vs. A1; ST vs. A2; A1 vs. A2). * means weakly significant (0.05 < p-value < 0.01) and ** significant (p-value < 0.01) compared to both other pH conditions. ST means natural pH.
Jmse 09 00432 g002
Figure 3. Body-size reduction in P. lividus larvae exposed to different plastic types according to water pH (100% dilution). Mean arms lengths of anomalous larvae are compared respect to (a) controls and (b) normal larvae. (c) shows comparison between normal-developed larvae and controls. In all cases, Type_16 (i.e., PET) induced more evident effects.
Jmse 09 00432 g003
Figure 4. Body-size of P. lividus larvae exposed to different plastic types according to water pH and leachate dilutions. Results are expressed as mean arms lengths (±SD) and calculated in both normal and abnormal larvae. Negative controls on the right. Tests were performed under three different pH scenarios: ST = standard marine water, pH 8.1; A1 = acidified (−0.3 pH units), pH 7.80; A2 = extremely acidified (−0.6 pH units), pH 7.50. Three different dilutions of the initial packaging leachate were used (red dots = 100%; orange dots = 50%; yellow dots = 25%) for PP (Type_6), PP + PE (Type_13), and PET (Type_16). Data present the Abbott’s correction.
Jmse 09 00432 g004
Table 1. Description of the packaging tested reported as “sample name”, chemical composition (with abbreviations) and industrial use.
SampleAbbreviationChemical CompositionIndustrial Use
Type_1PPPolypropylenePackaging for Mozzarella cheese
Type_2PDMSPoly (dimethyl siloxane) Siloprene E3078Baking paper
Type_3PPPolypropylene atacticPasta packaging
Type_4PETPolyethylene terephthalateWater bottle
Type_5PT-CXCellophaneButter envelope
Type_6PPPolypropyleneContainer of bread
Type_7PSPolystyrene atacticYogurt can
Type_8PETPolyethylene terephthalate Shopping bag (recent type)
Type_9PE+PETPolyethylene + Polyethylene terephthalateBag
Type_10PSPolystyrene atacticMeat tray
Type_11PETPolyethylene terephthalateCake tray
Type_12PET + COLOURPolyethylene terephthalate + colourPackaging for Mozzarella cheese
Type_13PP + PEPolypropylene + polyethylene copolymerCake envelope
Type_14EPDMPoly (ethylene:prophylene:diene)Shopping bag (old type)
Type_15PEPolyethyleneFreezer bag
Type_16PETPolyethylene terephthalateShopping bag (new type)
Table 2. Mean dose (±standard deviation; SD) of each packaging materials calculated from a standard exposure surface of 160 cm2/L.
SampleStandard Exposed Surface 160 cm2/L
Mean Dose (g/L)SD (g/L)
Type_11.740.004
Type_20.250.018
Type_30.270.001
Type_41.130.007
Type_50.360.002
Type_62.420.011
Type_70.960.009
Type_80.080.001
Type_90.160.001
Type_100.780.003
Type_110.860.007
Type_120.240.001
Type_130.120.001
Type_140.03<0.001
Type_150.160.012
Type_160.06<0.001
Table 3. Synthesis of the ecotoxicological responses for each tested packaging leachate type. Data are expressed as mean effects (% ± standard deviation, SD) at the maximum dose tested (100% for P. tricornutum and P. lividus; 90% for V. fischeri). MW = marine water, i.e., negative control. White bars indicate no effect (<20%); light grey, grey and dark grey bars show slight (20–39%), moderate (40–79%) and severe (80–100%) effects. Values in bold represent the sample type selected for the subsequent analysis.
V. fischeriP. tricornutumP. lividus
Sample TypeI% (15 min)I% (30 min)I% (72 h)% Abnormal (72 h)
MeanSDMeanSDMeanSDMeanSD
MW−3.522.56−90.4−.050.454.742.08
Type_1−2.031.35−9.081.61−0.150.592.042.16
Type_2−4.621.34−8.661.731.590.812.041.83
Type_30.281.32−7.512.12−1.80.452.041.41
Type_4−0.030.43−1.150.12−2.040.3636.736.68
Type_52.153.97−1.282.5−0.40.852.32.36
Type_63.51.11−2.681.610.70.6134.182.89
Type_73.020.62−3.530.721.30.4445.153.3
Type_82.410.34−2.280.620.970.3663.012.75
Type_9−7.432.33−11.563.61−0.290.584.692.16
Type_10−6.581.11−11.352.89−0.640.1872.192.22
Type_11−6.961.19−6.460.86−4.420.9297.451.29
Type_12−7.198.35−10.358.03−0.471.2773.721.26
Type_13−10.413.37−15.494.120.850.1665.562.06
Type_14−10.4610.4−14.3211.370.960.8178.061.29
Type_15−11.126.27−14.346.050.250.3976.532.16
Type_16−3.421.29−3.482.28−4.491.389.291.29
Table 4. Ecotoxicological responses in P. lividus exposed to 3 pre-selected plastic packaging leachates under different pH conditions. Data reported are expressed as % of anomalous plutei, as mean length reduction in abnormal larvae compared to the corresponding control and normal plutei (at the maximum dose of exposure, 100%), and as EC50. Data are grouped according to pH levels (ST = 8.1; A1 = 7.80; A2 = 7.50 pH). NC = not calculable because the effect at maximum concentration was lower than 50%.
SampleAbnormal LarvaeBiometrics Reduction (Abnormal vs. Cnt) Biometrics Reduction (Abnormal vs. Normal) EC50
MeanSD
Control_ST42 NC
Type_6PP51.043.4616.2012.5750.15
Type_13PP + PE63.542.0017.5715.1252.67
Type_16PET67.013.0630.5116.7388.71
Control_A14.002.00 NC
Type_6PP51.741.5316.110.6144.58
Type_13PP + PE57.991.5322.2412.0251.08
Type_16PET73.614.5132.3918.4760.91
Control_A24.002.00 NC
Type_6PP36.461.0024.9515.50NC
Type_13PP + PE65.093.1320.439.2464.50
Type_16PET46.533.2132.9722.18NC
Table 5. Effect of water acidification in P. lividus ecotoxicological responses (100% of leachate dilution). T-test was performed within each plastic type comparing the different scenarios of acidification (ST vs. A1; ST vs. A2; and A1 vs. A2). “Weakly significant” corresponds to 0.05 < p-value < 0.01 and “Significant” to p-value < 0.01.
TypeComparisonp-ValueSignificance Level
Type_6 (PP)ST vs. A1
ST vs. A2
A1 vs. A2
0.653
0.009
<0.001
-
Significant
Significant
Type_13 (PP + PE)ST vs. A1
ST vs. A2
A1 vs. A2
0.020
0.213
0.015
Weakly significant
-
Weakly significant
Type_16 (PET)ST vs. A1
ST vs. A2
A1 vs. A2
0.831
<0.001
0.001
-
Significant
Significant
Table 6. ANOSIM test performed on factors affecting biometrics of echinoderms. Notes: Pairwise test performed between couples of considered levels of tested factors is reported (Sign. Couples). Only significant relationships are reported. * = slightly significant.
FactorsLevelsPairwiseGlobal RSign. Level %Sign. Couples
NORMALpH3ST-A1; ST-A2; A1-A20.0170.34-
packaging type4Type_6-Type_13; Type_6-Type_16; Type_13-Type_16; Cnt-Type_6; Cnt-Type_13; Cnt-Type_160.1423.4 *Type_6-Type_16 *
ABNORMALpH3ST-A1; ST-A2; A1-A20.03472.1-
packaging type4Type_6-Type_13; Type_6-Type_16; Type_13-Type_16; Cnt-Type_6; Cnt-Type_13; Cnt-Type_160.2870.2 *Type_6-Type_16 *
Publisher’s Note: MDPI stays neutral with regard to jurisdictional claims in published maps and institutional affiliations.

