Abstract
Extreme sea waves, although rare, can be notably dangerous when associated with energetic sea states and can generate risks for the navigation. In the last few years, they have been the object of extensive research from the scientific community that helped with understanding the main physical aspects; however, the estimate of extreme waves probability in operational forecasts is still debated. In this study, we analyzed a number of sea-states that occurred in a precise area of the Mediterranean sea, near the location of a reported accident, with the objective of relating the probability of extreme events with different sea state conditions. For this purpose, we performed phase-resolving simulations of wave spectra obtained from a WaveWatch III hindcast, using a Higher Order Spectral Method. We produced statistics of the sea-surface elevation field, calculating crest distributions and the probability of extreme events from the analysis of a long time-series of the surface elevation. We found a good matching between the distributions of the numerically simulated field and theory, namely Tayfun second- and third- order ones, in contrast with a significant underestimate given by the Rayleigh distribution. We then related spectral quantities like angular spreading and wave steepness to the probability of occurrence of extreme events finding an enhanced probability for high mean steepness seas and narrow spectra, in accordance with literature results, finding also that the case study of the reported accident was not amongst the most dangerous. Finally, we related the skewness and kurtosis of the surface elevation to the wave steepness to explain the discrepancy between theoretical and numerical distributions.
1. Introduction
The study and prediction of open seas states is of major importance for the safety of navigation and marine structures. In the last few decades, many ship accidents have been reported in the presence of extreme waves [1,2,3] in coastal and deep water, all over the world. Most of these reports are from Atlantic and Pacific Ocean and the North Sea, owing to the more extreme conditions that can be encountered in those areas, but a number of them were also registered in the Mediterranean Sea. In many cases, large ships navigating in apparently safe conditions, even if notably energetic, came across abnormally large waves, at least twice as high as the significant wave height. These so called ‘rogue’ or ‘freak’ waves have been recognized and studied thoroughly by the scientific community and their generation mechanisms have been established to be mainly due to dispersive focusing, spatial focusing, waves interaction with wind, currents and topography, and modulation (or Benjamin–Feir) instability [4,5,6]. Which of these mechanisms is the dominant one in typical oceanic seas is still debated and, even if Benjamin–Feir instability seems to be the main actor for narrowband or unidirectional spectra, in multidirectional short-crested seas, its effect can be less relevant [4,7].
Understanding their generation mechanisms has been of crucial importance when attempting to predict their appearance in given sea conditions, in a probabilistic sense. Indeed, talking about extreme or rogue or freak waves requires a statistical approach because of the stochastic nature of ocean waves in general and of the low rate of occurrence of these kind of events. Ocean waves in a given sea state can be predicted in terms of probability of occurrence of a given wave or crest height, and different sea conditions can give rise to different statistical description, with probability distributions that can be predicted theoretically or fitted with ad-hoc representations.
If the wave field is considered as an infinite sum of elementary waves with different frequencies and random phases, in the linear approximation, the wave and crest heights are described by the Rayleigh distribution—namely, adopting the definition of rogue waves H > 2.2 H, where H is the significant wave height, gives an exceedance probability of , while adopting the crests criterion gives an exceedance probability of . In real world, it has been shown from measurements [8,9] and laboratory experiments [10] that the probability distribution can be strongly non-Gaussian, especially concerning wave crests. However, establishing whether reported accidents [3] were caused by extreme waves is impossible because of the lack of a wave record, but interesting information can be obtained with a reanalysis of those sea states. Namely, with proper tools and methodologies, it is now possible to approach the problem with a quantitative statistical analysis and to associate the sea state during an accident with a certain probability distribution.
In this work, we have focused the attention on a specific accident that occurred to the cruise ship Louis Majesty in March 2010, which, during navigation from Barcelona to Genoa in storm conditions with significant wave height higher than 4 m, encountered a large wave hitting deck 5, 16.7 m above the floating line, and causing important damage to the ship, several injured persons, and two deaths. The estimation of the real sea conditions reconstructed by previous studies is not definitive and ranges from m [2], to m [11], with nearby Begur buoy registering m. However, it is clear how the wave hitting the ship was noticeably higher than the significant wave height. A reanalysis of that accident has been done by Cavaleri et al. [11], modeling the sea state with a system of two coupled Nonlinear Schrödinger (CNLS) equations, motivated by a crossing sea condition found with the WAM hindcast. Their results suggested that the incident angle of the two wave systems was associated with an enhanced maximum crest amplitude, giving a possible physical interpretation for the presence of rogue waves in crossing seas.
The first objective of our study is therefore to analyze the Louis Majesty accident, and to evaluate the associated probability of occurrence of extreme events, comparing the accident circumstances to other sea conditions in the same area, in order to establish whether the sea conditions encountered by the ship were particularly unusual and if they could be a priori related to a higher probability of occurrence of extreme waves. Secondly, we will exploit such statistical analysis of many different sea states to assess the accuracy of theoretical distributions in real conditions, which will help with understanding their dependence on macroscopic spectral quantities and identifying the optimal formulations to be used in operational forecasts.
The most natural numerical approach for a statistical reanalysis of this type is with high resolution phase-resolving models, which describe the temporal evolution of the sea surface, solving for both wave amplitude and phase. Indeed, phase-averaging models, e.g., WAM [12], WaveWatch III [13], typically employed to perform large-scale as well as regional forecasts and hindcasts, give satisfactory results in terms of macroscopic observables, as significant wave height, mean wave direction, peak period, angular spreading, etc., but lack in the description of local phenomena. Recent works [14,15] have introduced the possibility to estimate extreme sea waves from spectral models, through statistical distributions based on mean wave parameters, showing promising results in a comparison with stereo camera observations. However, phase-resolving models have the advantage to directly reconstruct statistical distributions from the surface elevation, which is a prognostic variable, and are therefore particularly suited for a reanalysis of single events. Concerning deep water gravity waves, this approach consists of the numerical solution of the Euler equations in potential form, which can be achieved with different methods. The more widely adopted are for sure the Boundary Element Method (BEM) [16,17] and the Higher Order Spectral (HOS) method proposed independently by Dommermuth and Yue [18] and West et al. [19]. In particular, the latter has proven to be more powerful in terms of computational efficiency and fast convergence and is the one that has been used in the present study. The method has been widely validated in several configurations, e.g., nonlinear energy transfers [20,21], modulational instabilities [22] or freak waves [23,24]. In particular, there are a few recent studies where this method has been coupled with wave forecasting models (WAM,WWIII) [7,25,26], simulating with the HOS method the free evolution of the hindcast spectra extracted from the global model.
A similar coupled WWIII/HOS methodology has been used in this work, coupling wave spectra from a wave hindcast produced by the Environmental Modelling and Monitoring Laboratory for the Sustainable Development (LaMMA) Consortium [27] with local HOS phase-resolving simulations, without interaction with winds, currents, and topography, in order to evaluate the sole effect of nonlinear interactions. With phase-resolving simulations, it would then be possible to follow a statistical approach for the description of the wave system, evaluating crest height distributions as well as integral statistics (skewness, kurtosis) of surface elevation. As stated above, the present approach is mostly suitable for offline simulations of wave spectra as its direct implementation in forecast routines is not feasible because of its computational cost. However, associating in advance a given sea state with a certain probability of extreme events can help to establish criteria that can be used in operational wave models.
It is worth remarking that our analysis is not intended to give an absolute number of this probability, which may vary significantly with different hindcast models, hindcast resolution, atmospheric wind forcing models used for the hindcast, and so on, but, fixing all these conditions, to compare it to other cases that have been analyzed.
The paper is organized as follows: in Section 2, we show the numerical methods used for phase-resolving HOS simulations Section 2.1 and for WWIII hindcast Section 2.2. In Section 2.3, we give details of the set of HOS simulations that has been performed. In Section 3, we show our main results in terms of wave spectra Section 3.1 and wave statistics Section 3.2. Finally, in Section 4, we draw our conclusions.
2. Numerical Methods
2.1. Higher Order Spectral Method
The HOS method is formulated under the assumptions of incompressible, inviscid, and irrotational flow, which allow for applying the potential flow theory, expressing the velocity field through a potential, , and the continuity equation through the Laplace equation
with the horizontal coordinates, and z the vertical one. The continuity equation is coupled with a dynamic and a kinematic boundary condition, to ensure, respectively, the continuity of the pressure field and a zero flux through the free surface . These two conditions, expressed in terms of the free surface elevation and the surface potential , read as follows:
In our work, the time evolution of the above set of equations is numerically solved through the HOS-ocean open-source code [23,28,29] (https://github.com/LHEEA/HOS-ocean, accessed on 3 March 2010 ), which is based on the West et al. [19] version of the HOS scheme for iterative evaluation of the vertical velocity . The equations are discretized in space on a pseudo-spectral regular grid in a double periodic domain in the two horizontal directions, performing derivation operations in the spectral domain, through the Fast Fourier Transform (FFT), and arithmetic operations in the physical space. In the vertical direction, an infinite water depth is considered, since it is out of the scope of this study to evaluate the effect of bathymetry and finite depth. Moreover, the analyzed location described in next section is characterized by an approximate depth of m; thus, finite depth effects are negligible. Time discretization consists of a Runge–Kutta 4th-order scheme, with an adaptive time-step changed dynamically to achieve a prescribed tolerance [23] (typically of the order –). Nonlinear interactions among wave components are accounted for up to an arbitrary order M in wave steepness. In the present study, we have adopted a nonlinearity order of in order to take into account up to third order nonlinearities, with a full dealiasing.
An initial wave surface elevation field obtained as a realization of a given wave spectrum is evolved in time without external forcing and dissipation. Phenomena like wind–wave interactions and wave-breaking are not described in HOS-ocean, even if they could be modeled and taken into account in HOS methods [24,30,31]. The initial wave spectrum can be given in parametric form with the Joint North Sea Wave Project (JONSWAP) spectrum or through a directional WWIII spectrum. The directional spectrum is then converted into a wavenumber spectrum and the surface elevation and the velocity potential are initialized in a linear way with random phases [21]. The Dommermuth adjustment scheme [23,32] is used to smooth the initial transient from a linear to a fully nonlinear field in a few wave peak periods (5–10). Several works [20,22,33,34] have validated the HOS method in different configurations, e.g., standing wave, propagation of regular waves, nonlinear focusing of irregular waves, crossing seas, with a good general agreement. Concerning the particular numerical code used in this study, HOS-ocean, it has been demonstrated [29,34], for regular waves, an exponential decay of error with nonlinearity order and the number of grid cells thanks to the pseudospectral formulation. Moreover, wave focusing tests with different wave steepness have shown an average global error of around and of less than on the height of the focused wave, with respect to wave tank experiments.
2.2. WaveWatch III Hindcast
Wave data were extracted from the LaMMA Consortium wave hindcast, covering the period 1990–2018 [27,35]. This wave hindcast was produced for the Mediterranean Sea at high-resolution, up to 500 m on some coasts of the Ligurian and Tyrrhenian Seas, and around 6 km on the rest of the Mediterranean coasts, while the minimum offshore resolution is of 30 km. The wave model adopted was WaveWatch III (WW3) [13], a full-spectral third generation ocean wind-wave model developed at National Oceanic and Atmospheric Administration and National Centers for Environmental Predictions (NOAA/NCEP), with an unstructured computational grid. The model solves for a transport equation in conservative form of the spectral action density, where the effects of physical phenomena at play (wind forcing, wave dissipation, nonlinear wave interactions, etc.), are added through different explicit source/sink terms in the spectral space. Hindcast simulations were performed using the discrete interaction approximation (DIA, [36]) to model nonlinear wave–wave interactions, and the source term package ST4 [37,38], with default parameters, to model wind forcing and dissipation due to wave breaking.
Wind forcing of the wave model was based on a dynamic downscaling of the ERA5 reanalysis dataset of the European Centre for Medium-Range Weather Forecasts (ECMWF), obtained through a nesting between BOLAM [39] and MOLOCH [40] models, with a maximum resolution of about 2.5 km for the area of interest. In addition to gridded wave and wind data, wave spectral data were extracted in more than 2000 points, distributed throughout the Mediterranean, but with a particular concentration along the high-resolution coastal areas. The wave spectrum has a resolution of (36 directional bands) with 30 frequency intervals, ranging from 0.0418 Hz to 1.1181 Hz. A wave model calibration was performed in a previous work [27,35] comparing the numerical results for twelve storms with data from seven buoys, in the area with higher resolution.
2.3. Numerical Simulations
We have focused our study on the accident that happened to the Louis Majesty cruise ship on 3 March 2010 between 2:00 p.m. and 3:00 p.m. UTC. At that time, the position of the ship was approximately N, E. For the present work, we have considered the WWIII spectra at the location N, E, at a distance of about 11 km, which is the closest point of extraction from our hindcast, corresponding to the position of the Begur Buoy of Puertos del Estado [41]. Figure 1a shows the significant wave height and the wave direction on the northwestern Mediterranean area at the time of the accident: as we can see, the region in the neighborhood of the buoy and of the ship was characterized by a system of waves coming from E N-E, with the most energetic conditions located approximately in the middle of the Gulf of Lion. We can also see in Figure 1b a zoom on the area of the accident showing the position of the buoy (circle) and the approximate position of the ship (star). The time series of the significant wave height at the buoy position in Figure 2a, measured by the buoy and by our hindcast, shows a good overall agreement for the year 2010, quantified in Figure 2b with a scatterplot between observed and model significant wave height, resulting in a correlation coefficient of , and in a mean bias error of . For a thorough assessment of hindcast performances, we remind the reader to refer to [27]. It is worth noting that the hindcast underestimates the significant wave height at the time of the accident m with respect to buoy observations m. Moreover, a different expected significant wave height also with respect to the analysis of Cavaleri et al. [11] denotes a certain variability between the hindcasts, which could lead to slightly different results in absolute terms. In any case, focusing our attention on the comparison amongst different sea states, all obtained from the same hindcast (resolution, parametrization and wind forcing), excludes the related variability.
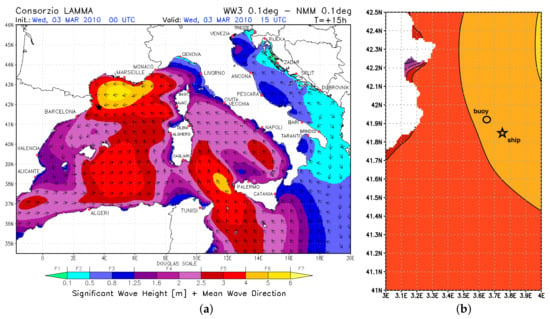
Figure 1.
Significant wave height and mean wave direction on the northwest Mediterranean Sea on 3 March 2010 at 3:00 p.m. UTC (a), and zoom on the area of the accident (b). The star indicates ship position, the circle indicates Begur buoy position http://www.puertos.es/es-es/oceanografia/Paginas/portus.aspx (accessed on 1 September 2020).
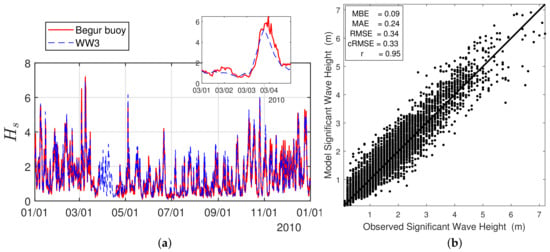
Figure 2.
Time series of the significant wave height during year 2010 from the present WWIII hindcast and from Begur buoy (a), with the inset showing the period from 1 March 2010 to 4 March 2010; on the right panel; (b) scatter plot representation of the significant wave height, with mean bias error (MBE), mean absolute error (MAE), root mean-square error (RMSE), centered root mean-square error (cRMSE), and correlation coefficient (r).
In order to analyze the sea state conditions encountered by the Louis Majesty ship in a broader context, we have performed a series of 54 simulations of different sea conditions that occurred in the same location at different times of the 2010 year, selecting amongst the most energetic ones (see Table 1). In particular, we have fixed a threshold for the significant wave height m, and we have picked the events associated with distinct peaks in the time series analysis, discarding consecutive cases with similar spectral characteristics. The significant wave height , where is the standard deviation of surface elevation, spans from 1.9 m to 6.75 m, the wave steepness , where is the peak wavenumber, spans from 0.028 to 0.066, and the angular spreading from 0.2 to 1.09. For the sake of completeness, we have also reported the peak period and the Benjamin–Feir Index (BFI), which is the ratio between wave steepness and spectral bandwidth. All these quantities are evaluated directly from the directional wave spectrum through the relations reported in Appendix A. Finally, the peak direction refers to the direction from where waves are coming and for the bimodal cases to the direction of the dominant mode, which in most cases is clearly larger than the secondary one.

Table 1.
List of the events simulated with HOS model with the respective average spectral quantities: peak direction (coming from), wave steepness , Benjamin–Feir Index (BFI), significant wave height , peak period and spectral angular spreading . ☆ denotes a crossing sea condition; the gray line corresponds to the Louis Majesty accident date and time.
For each “event,” we have extracted the directional wave spectrum at that specific position from the WWIII hindcast, and we have used it to initialize the amplitude of the surface elevation and the velocity potential of the HOS simulations, while the phases are initialized randomly. In this way, each HOS simulation represents a different realization and is subjected to statistical variability. For the Louis Majesty accident case, we have performed different realizations, showing in the results an average value and a confidence interval, to give an idea of the statistical error. In each case, we have properly rotated the spectrum to align the mean direction of wave propagation with the x-axis. As a result of a grid convergence study, we have adopted a resolution of dealiased modes for all the simulations, with a domain size of , where is the peak wavelength. This discretization means that the highest wavenumber solved by the HOS solver (free of dealiasing errors) is , which is consistent with previous literature studies [22,23,24]. Moreover, it has been shown [42] that too high numerical resolutions, in certain ranges of the physical parameters (), can lead to numerical instabilities due to the impossibility of representing the wave-breaking phenomena, the surface elevation being a single-valued function.
Each set of simulations has been performed for a time of , which for the cases considered means a physical time ranging from 55 to 90 minutes, largely exceeding the typical duration of a wave record. Such a long duration was initially guessed to have the possibility of making longer and more robust statistics. However, upon verification that steady conditions were maintained, we restricted the averaging windows on shorter intervals, as will be shown in Section 3. The surface elevation and spectra, which have been used in the statistical analysis, are saved every peak period [28,43,44].
3. Results and Discussion
In this section, we show the results of our set of numerical experiments focusing the attention on the spectral evolution and on the statistical analysis of the surface elevation and extreme events. For every case, we have done a single realization, averaging the statistical quantities over a time window to obtain accurate statistics. Only for case , which refers to the Louis Majesty accident, we have performed nine different realizations to have an estimate of the confidence interval.
3.1. Spectral Evolution
In Figure 3, we show three snapshots at , and of the surface elevation spectrum, available directly in the HOS method as the Fourier transform of , for three different cases. The Louis Majesty accident spectrum, which has an angular spreading of , is compared to the two extreme cases (in terms of angular spreading) of our set of simulations: case with and case with . The three pictures of the initial spectra reveal very different sea conditions. For case , the shape is fairly symmetric with a low initial angular spreading that remains limited in angular direction also for later times. For case (Louis Majesty accident), the initial shape is much more irregular with a large angular spreading that seems to grow more rapidly with respect to the previous case. The presence of a second connected peak, even if much smaller than the dominant one, highlights a possible imminent crossing sea condition, which has been confirmed analysing spectra during the following daytime. Finally, case presents a double peak configuration with two distinct peaks at and , and different frequencies. In all the three cases, we can see how the spectra coherence decays rapidly and with very similar time scales. According to this finding, we have decided to make the statistical analysis only in time windows up to without going further.
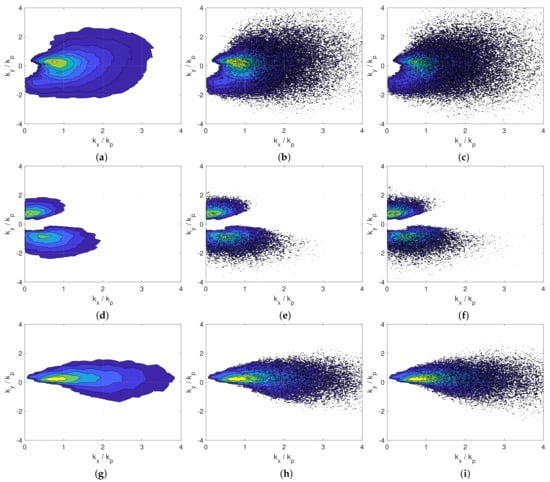
Figure 3.
Evolution of the wavenumber spectrum for three different cases: (a)–(c) case , (d)–(f) case , (g)–(i) case . (a,d,g) , (b,e,h) , (c,f,i) . Contour lines range from to .
In Figure 4, we show the omnidirectional spectrum , where is evaluated through the complex amplitude function [21], at different times for case . The scalings are very close to the power law, in accordance with Zakharov and Filonenko theory [45] and with previous numerical studies [24,46]. However, for long periods of time (), there is an accumulation of energy at a high wavenumber that might be due to the absence of a physical dissipation in the model. It is worth remarking that, in order to analyze the wave field evolution on longer times, ad-hoc terms to model the energy dissipation should be added. They have been formulated by previous studies, notably by filtering out high wave numbers with low pass filters in the spectral domain; however, we have preferred to avoid this effect by analyzing the wave fields on shorter time windows.
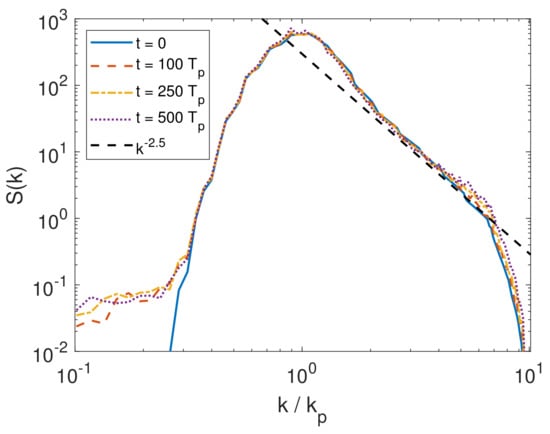
Figure 4.
Time evolution of the omnidirectional spectrum for the case . A power law is also plotted.
3.2. Wave Statistics
3.2.1. Integral Statistics
In this section, we show the statistics of the nonlinear wave fields. We start analyzing integral statistics of the surface elevation , like skewness , and kurtosis , which determine respectively the asymmetry of the probability density function and the weight of tails. It has been shown that these two statistical quantities, expressing respectively the third and fourth order moments of a statistical distribution (see Appendix A for details), are of great importance in determining an increased probability of occurrence of extreme phenomena [47,48,49] due to nonlinear interactions. It is worth noting that the skewness is (symmetric distribution) and the kurtosis for linear waves. Positive values of skewness are mainly due to the nonlinear shape of waves (crests more frequents than troughs), while values of kurtosis greater than 3 imply a higher frequency of extreme events with respect to the linear distribution. Figure 5 shows the time evolution of the skewness and the excess kurtosis of surface elevation. We have compared case representing the Louis Majesty accident, to case , where we have detected the maximum average kurtosis. An initial transient of the order of , which is due to the smooth shifting from a linear to a nonlinear field, is present in both the statistics. After this initial stage, the skewness reaches a steady-state value in case , while in case a higher peak is observed, followed by a slow descent, reaching a more stationary value only after . The evolution of the kurtosis is more irregular, but it oscillates around an average positive value in both cases, without any significant dynamics.
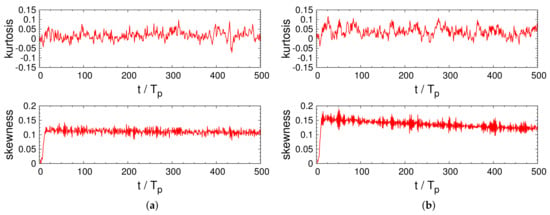
Figure 5.
Evolution of skewness and excess kurtosis of the surface elevation: (a) case , (b) case .
It has been shown experimentally [10,43,50] and numerically [23,24] with HOS simulations that, for narrowband JONSWAP spectra (large Benjamin–Feir index, see Appendix A), third and fourth order statistics deviate strongly from Gaussianity, with especially the kurtosis reaching values close to 4. Such high values of the kurtosis, due to the high tails of the distribution, are directly linked to an increased probability of extreme events, as recorded in such cases, and correspond typically to the modulational instability generation mechanisms. Complementary studies [7,26] have shown on the other side that HOS simulations initiated with hindcast ocean spectra (WWIII, WAM) yield non-Gaussian crest distributions associated with quasi-Gaussian values of skewness and kurtosis, claiming that extreme waves in real sea states are mainly due to second-order bound harmonic waves, instead of that to modulational instability.
3.2.2. Crest Distributions
Wave crests are defined as the local maxima of the surface elevation and their identification is straightforward also in short-crested seas, whereas the wave height might be of difficult definition and calculation. For this reason, in this study, we have restricted the analysis to crest heights to compute distributions and probability of extreme events. In particular, crests are identified from the surface elevation field as local space maxima. The space-time analysis is done considering snapshots of the surface field spaced in time by to avoid considering multiple times exactly the same events. In Figure 6, we show, for the same cases analyzed in the previous section, the distribution of wave crests in terms of exceedance probability. In the same plot, we can see the comparison between HOS results and theoretical predictions: linear Rayleigh, second-order Tayfun [51], and third-order Tayfun [7,52], with the values of skewness and kurtosis obtained from HOS simulations, and Forristall distribution [53] (see Appendix A). The comparison with the linear Rayleigh distribution is used to have a standard reference which only depends on the significant wave height and is therefore constant, fixed . In this way, it is more immediate to quantify the probability distributions in an absolute sense and to evaluate their degree of nonlinearity. The HOS distribution is calculated using all the local maxima in a time window between t = 20–100 , in order to discard the initial transient and the late evolution where effects like angular spreading and high wavenumber energy accumulation start to play a role. For the computation of Tayfun distributions, we have used the mean skewness and kurtosis of the surface elevation averaged in the same time window. The number of crests identified in this time window, analyzing the surface elevation at regular interval of , is of = 840,724 for case , and of = 913,386 for case .
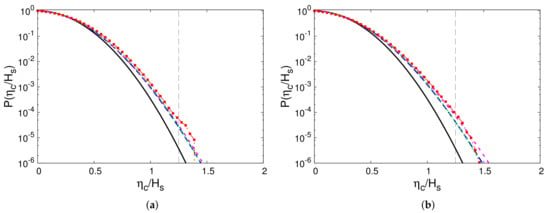
Figure 6.
Exceedance probability of crest heights normalized with , . (a) case , (b) case . Black solid line — Rayleigh distribution, blue dashed line − − Tayfun second order distribution, magenta short dashed line - - Tayfun third order distribution, green dotted line · · · Forristall distribution, red squares ⊡ HOS simulation. The vertical line at represents the threshold to identify extreme events.
Even if the two distributions differ significantly from a quantitative point of view, their comparisons to the respective theoretical distributions are similar. In both cases, they are always higher than the Rayleigh distribution and in particular, at the threshold , used for the identification of rogue waves; the difference is at least one order of magnitude. Both Tayfun and Forristall distributions are very close to the results of simulations, especially regarding the third-order distribution in case . This is less evident in case , where the HOS distribution is even higher of the third-order Tayfun. As we will show in the following section, this good matching with second- and third-order Tayfun distributions is generally true for all the cases that we have tested and we can therefore state that second-order nonlinearities are mainly responsible for extreme waves generation, while third-order nonlinearities play a minor role for the sea states analyzed in this study.
This is in agreement with similar analysis carried out with the same coupled method (WWIII/WAM with HOS) on different events [7,26].
3.2.3. Dependence of Statistics on Macroscopic Observables
In this section, we present the overall results of all cases considered in this study, showing the dependence between statistical integral quantities and macroscopic physical observables. Notably, to quantify the deviation from the Rayleigh distribution, we evaluate the probability associated with the number of crests exceeding the threshold , and we normalize it with the same probability for the Rayleigh distribution. This probability ratio, , has been found to be always greater than one in our simulations, concentrating in particular in the range between 10 and 20. The following figures are scatter plots where each point represents a different case # of Table 1, with the red point highlighting the Louis Majesty accident case, with error bars showing a confidence interval estimated with nine different realizations. In Figure 7a, we have related this probability with the angular spreading and the wave steepness for each case. In terms of the angular spreading, we do not see a distinct correlation, but it just emerges that the upper envelope is a decreasing function of . This is in agreement with the findings of [24], where this analysis was done for JONSWAP spectra at fixed steepness and bandwidth, and where they showed a decay of the probability of rogue waves increasing . In our case, the trend is not so marked because the steepness varies among the cases, resulting in a number of long crested waves (small spreading) associated with small steepness so that nonlinear effects and deviation from Gaussian statistics become negligible. Indeed, as we can see in Figure 7b, the correlation between the wave steepness and the probability of extreme events is more clear, with an increased probability for higher values of the steepness. The greater part of samples has values of between 0.05 and 0.06, and there are a few cases with . On the same plot, we show the probability that would be predicted by a second- (blue line) and a third- (red line) order Tayfun distribution estimated with the sole steepness parameter. The two distributions define the upper and lower limits with respect to the actual values of the probabilities estimated from the HOS simulations; therefore, the second order approximation is not sufficient to have an exact estimation, while the third order one is overestimating the results. However, both of them significantly increase the prediction of extreme events with respect to the Rayleigh distribution. We can also see how, in terms of absolute probability, the Louis Majesty accident was not characterized by particularly severe conditions if compared to other cases.
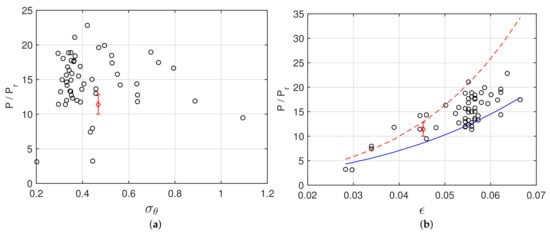
Figure 7.
Probability of extreme waves normalized with the Rayleigh probability as a function of angular spreading (a), and wave steepness (b). The red diamond ⋄ indicates case (Louis Majesty accident), with error bars indicating a confidence interval. The blue line in (b) indicates the theoretical probability estimated from the second-order Tayfun distribution. The red dashed line indicates the theoretical probability estimated from the third-order Tayfun distribution.
A more detailed representation is given in Figure 8, where we show the comparison of the probability of extreme events with different theoretical distributions by means of different normalizations. In panel (a), the probability obtained from HOS simulations is divided by the probabilities estimated from the generalized Tayfun second-order distributions [9,51], with different estimates of the steepness parameter, namely:
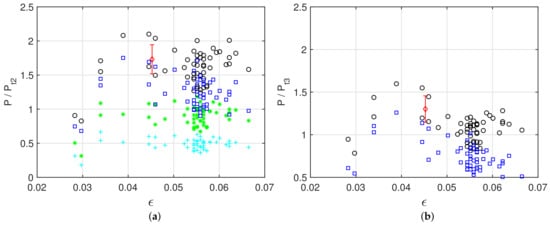
Figure 8.
Probability of extreme events normalized with second-order distributions (a), and with the Tayfun third-order distribution (b), as a function of wave steepness. The red diamond (⋄) indicates case (Louis Majesty accident), with error bars indicating a confidence interval. Black circles (∘) correspond to with in the Tayfun distribution. Blue squares (□) correspond to with in the Tayfun distribution. Green stars (*) correspond to with in the Tayfun distribution. Cyan crosses (+) correspond to with . In panel (b), black circles (∘) correspond to with and from the HOS simulation. Blue squares (□) correspond to with and estimated from in the Tayfun distribution.
- the steepness parameter is estimated from the skewness of the surface elevation, ;
- the steepness parameter is estimated a priori from the peak wavenumber, ;
- the steepness parameter is estimated a priori from the mean wavenumber, ;
- the steepness parameter is estimated a priori from the mean wavenumber and corrected with the bandwidth , [9].
In panel (b), the probability obtained from HOS simulations is divided by the third-order Tayfun distribution, where the steepness parameter is estimated:
- from the skewness of the surface elevation;
- a priori from the peak wavenumber.
Such different formulations of the theoretical distributions have been compared against HOS results in order to have a clearer idea on which one could be more promising in a forecasting optics. Fedele & Tayfun [9] proposed to include the bandwidth in the steepness evaluation, showing better accuracy with respect to the simple mean wave steepness [51], accurate only in narrowband conditions, while more recent works [7] found a good agreement between theory and observations also with the latter definition. Thus, a more comprehensive comparison of all the different parametrizations for different sea conditions can be useful to generalize their use. The probability calculated from simulations is on average ∼1.6 times the second-order Tayfun probability estimated from the HOS skewness, and ∼1.1 times the third-order Tayfun probability estimated from the HOS skewness and kurtosis. This implies that second-order nonlinearities are mainly responsible for extreme waves generation and that third-order nonlinearities play a minor role, although it is important to obtain a precise statistical description, as anticipated in the previous section (see Figure 6). We can also see how, in both cases, when we evaluate the Tayfun distributions a priori, it gives an overestimation of the probability of extreme events, leading to values of lower than one. Concerning the a priori estimate of the second-order Tayfun distribution, Figure 8a shows that the version including the bandwidth appears to be the most accurate, while the distribution evaluated with the mean steepness is higher than the HOS distribution (), and the one evaluated with the peak steepness is lower than the HOS distribution (). However it is worth noting that, from a more qualitative point of view, they all show the same trend, namely they are approximately constant with respect to the wave steepness and therefore they only differ by a fixed amount. Moreover, considering as a reference, the self-consistent normalization identified by black circles, the closest parametrized distribution is the one with the peak steepness, thus deriving definitive conclusions is not straightforward.
Figure 9a,b show the average values of the skewness and kurtosis of the surface elevation of the HOS simulations. A clear correlation between the steepness and these two integral statistics is evident, which, if related to the results from Figure 7b, also implies higher probabilities of extreme waves for higher values of the skewness and kurtosis. This is a central result of nonlinear wave theory [47,48] and is due to the fact that third and fourth order statistical moments, measuring the departure from Gaussianity, give an estimate of the degree of nonlinearity of the wave field. In the same figures, we have reported the curves representing the values of skewness and kurtosis predicted in the narrowband approximation [7,48,54], and also used to estimate the skewness and kurtosis from the steepness in the Tayfun a priori distributions, and . Even if the type of dependence (linear and quadratic, respectively) is correct, the above expressions do not ensure an exact fit of the skewness and the kurtosis obtained from the present HOS simulations.
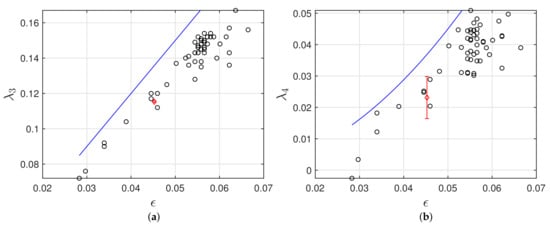
Figure 9.
Dependence of skewness (a) and kurtosis (b) on wave steepness . The red diamond ⋄ indicates case (Louis Majesty accident), with error bars indicating confidence interval. The blue lines represent the theoretical curves for the narrowband approximation and .
Concerning the Louis Majesty case, the skewness and the kurtosis are well below the mean when compared to the other cases. If we relate those integral statistical quantities to the absolute probability of extreme waves, this is in accordance with the results shown in Figure 7, where the HOS probability is normalized with the reference Rayleigh probability, giving therefore an estimate of the absolute number of extreme events.
Finally, we show in Figure 10 the relation between the direction of wave peaks (coming-from) and the probability of extreme events normalized with the third order Tayfun. The directions from where waves are coming are mainly four: around ∼ (Northeast), ∼ (East), ∼ (Southwest), ∼ (North), with a clear dominance of the latter. In the same plot, we have highlighted the cases corresponding to initial crossing sea conditions, i.e., where at least two peaks at different angular directions are present (see Table 1). It is worth noting that the cases where we have registered the higher discrepancy with respect to the Tayfun third-order distribution are those relative to crossing seas, which is possibly related to the fact that such distribution does not take into account energy partitioning amongst distinct angular directions. Moreover, from a more phenomenological point of view, it would be interesting to relate those cases with particular meteomarine conditions. Indeed, an analysis of wave and meteorological maps suggests similar atmospheric circulation conditions for the cases with enhanced probabilities of extreme events (those corresponding to 70–80), with a main flux coming from the northeast and a secondary flux from the southeast, associated with a general cyclonic circulation. Concerning the Louis Majesty case, it was not configured as a proper crossing sea because of the lack of a distinct second peak, but it had a dominant and a very small secondary peak, and the regional circulation was similar to the previously mentioned one. Investigating also wave spectra in the hours following the accident, we have noticed the growth of the second peak for a few hours after the accident. Therefore, even if a second large peak is not explicitly present at 3:00 p.m. UTC, we can classify that event as an imminent crossing-sea condition, which is consistent with the large angular spreading of the spectrum.
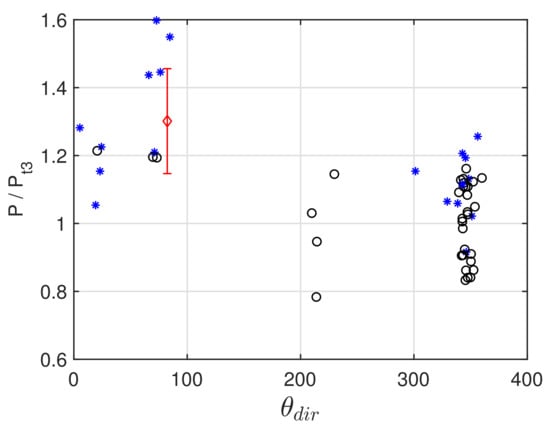
Figure 10.
Wave direction (coming-from) versus probability of extreme waves normalized with the Tayfun third-order probability . Blue stars * denote crossing seas. The red diamond ⋄ indicates case (Louis Majesty accident), with error bars indicating a confidence interval.
4. Conclusions
In this work, we have analyzed a number of sea states that occurred off the Cabo de Begur, at the Begur buoy location during the year 2010. One of the cases that we have analyzed refers to the date and time of the reported accident of the Louis Majesty cruise ship, which happened in the close vicinity of that point. A total number of 54 sea states were selected amongst the most energetic ones.
For every sea state, we have extracted the associated wave spectrum from a WWIII hindcast and we have used these spectra to initialize phase resolving simulations with the High Order Spectral Method. The objectives were: (a) to verify, with a statistical analysis, the probability that the Louis Majesty ship had to encounter extreme conditions, comparing the results to the other cases analyzed; and (b) to analyze the dependence of the probability of extreme events from the macroscopic spectral quantities like angular spreading and steepness, in order to verify the accuracy of the theoretical relations that can be used in wave forecasting systems.
From the analysis of wave spectra, we have shown the wide range of conditions that we have considered, with particularly big differences in the angular spreading and in the spectral shapes (single, double peaked). Moreover, we have used this preliminary evaluation to restrict the statistical analysis to limited time windows because of the degradation of the spectra and of an unphysical accumulation of energy at high frequency for long periods of time.
Resolving the sea surface elevation has made a deep statistical analysis possible in terms of integral statistics and distributions to gather information that is not available from phase averaged models. The time evolution of skewness and excess kurtosis have shown that no significant dynamics are present, and that both quantities reach average values above the Gaussian ones, with kurtosis showing more significant oscillations around the stationary-state. The distributions of wave crests show that the Rayleigh distribution roughly underestimates the cumulative probability at the threshold of around one order of magnitude, while second and third order Tayfun distributions give a good prediction.
To have a global estimate of this trend for all the cases, we have shown a series of plots where the probability of wave crests exceeding the given threshold is related to the angular spreading of the spectrum, the wave steepness, and the wave directions. In this way, it has been possible to show a quantitative comparison between the different cases, and, in particular, it has emerged that the conditions for the Louis Majesty case were not the worst, in terms of probability of extreme events. Moreover, we have shown how theoretical distributions, based on spectral parameters like the Tayfun ones, give the possibility of having a good prediction of the distribution of wave crests, and therefore to have valuable criteria for the evaluation of the probability of extreme events. Tayfun distributions evaluated with the actual values of skewness and kurtosis from simulations have been computed as well to have a reference estimate for comparison with parametrized distributions, finding a convergence between the numerical simulation and the reference distributions passing from the second- to the third-order approximation. We have also shown that, for the cases considered in this study, the relations derived for narrowband waves can be used as an upper bound for the estimation of the skewness and the kurtosis of the surface elevation, which measure quantitatively the nonlinearity of the wave field.
It is worth remarking that different parametrizations of the phase-averaged model (WWIII), as well as the assumptions made with the HOS method (no wave interactions with winds and currents, no wave-breaking dissipation), could affect the results in terms of absolute numbers, and their effect should be addressed in complementary studies. However, since our focus was on the inter-comparison between different sea-states with fixed models and parameters conditions, this type of analysis can help to estimate the different tendencies of some particular sea states to develop extreme waves. Moreover, the comparison with theoretical distributions is fully consistent since they have been derived from the sole nonlinear theory, without further physical assumptions. In our opinion, the coupling of a phase-averaged wave model such as WWIII with the HOS method can give a valuable contribution in the understanding of extreme waves phenomena and in offline reanalysis of dangerous sea states in order to give guidelines for operational forecasting models. Our analysis goes in this direction. Further works with different hindcast models, hindcast grids, and geographical locations will help to delineate a complete picture and to provide operational methods that could improve the safety of navigation.
Author Contributions
Conceptualization, A.I. and C.B.; methodology A.I. and C.B.; formal analysis, A.I.; results interpretation, A.I., C.B. and M.O.; writing—original draft preparation, A.I., C.B. and M.O.; writing—review and editing, A.I., C.B., M.O.; supervision, C.B. All authors have read and agreed to the published version of the manuscript.
Funding
This research was funded by the GIAS and the SICOMAR plus Interreg projects. M.O. has been funded by the “Departments of Excellence 2018/2022” Grant awarded by the Italian Ministry of Education, University and Research (MIUR) (L.232/2016), and by The Simons Foundation.
Institutional Review Board Statement
Not applicable.
Informed Consent Statement
Not applicable.
Data Availability Statement
The data presented in this study are available upon reasonable request from the corresponding author.
Acknowledgments
The authors acknowledge Puertos del Estado organization for providing data of the Begur Buoy and the authors of HOS-ocean open-source code for the technical support and helpful discussion in the code setup phase. M.O. acknowledges the LaMMA Consortium for the support.
Conflicts of Interest
The authors declare no conflict of interest.
Appendix A
Appendix A.1. Spectral Integral Quantities
The total energy used for the computation of is evaluated from the wave directional spectrum
The peak wavenumber refers to the frequency of the spectral peak, which is estimated as follows [55,56]:
where is the omnidirectional spectrum. The Benjamin–Feir Index (BFI) in the limit of infinite depth is estimated as
where is the peakedness parameter [57]. The angular spreading is estimated as [7,13]:
where is the zero order spectral moment, and .
In the paper, three different definitions of the wave steepness have been used for the computation of theoretical distributions, being
where is the mean spectral wavenumber related to the mean spectral frequency , and is the bandwidth.
Appendix A.2. Physical Integral Quantities
Deviations from Gaussianity in the distribution of surface elevation can be measured with the skewness and kurtosis, which weight respectively the asymmetry of the distribution and the importance of tails. The skewness is defined as
where is the standard deviation. The excess kurtosis is
Appendix A.3. Theoretical Distributions
The Rayleigh exceedance distribution of wave crests for linear waves is:
The second-order Tayfun distribution [51] is
where we have used , , or . The third-order Tayfun distribution is
where is a parameter that expresses fourth order cumulants and can be approximated by [7,58]. The Forristall distribution [53] is
with
and , , with the latter being zero in our simulations since we have considered infinite depth.
References
- Didenkulova, I.; Slunyaev, A.; Pelinovsky, E.; Kharif, C. Freak waves in 2005. Nat. Hazards Earth Syst. Sci. 2006, 6, 1007–1015. [Google Scholar] [CrossRef]
- Nikolkina, I.; Didenkulova, I. Rogue waves in 2006–2010. Nat. Hazards Earth Syst. Sci. 2011, 11, 2913–2924. [Google Scholar] [CrossRef]
- Didenkulova, E. Catalogue of rogue waves occurred in the World Ocean from 2011 to 2018 reported by mass media sources. Ocean. Coast. Manag. 2020, 188, 105076. [Google Scholar] [CrossRef]
- Kharif, C.; Pelinovsky, E. Physical mechanisms of the rogue wave phenomenon. Eur. J. Mech. B/Fluids 2003, 22, 603–634. [Google Scholar] [CrossRef]
- Dysthe, K.; Krogstad, H.E.; Müller, P. Oceanic rogue waves. Annu. Rev. Fluid Mech. 2008, 40, 287–310. [Google Scholar] [CrossRef]
- Onorato, M.; Residori, S.; Bortolozzo, U.; Montina, A.; Arecchi, F. Rogue waves and their generating mechanisms in different physical contexts. Phys. Rep. 2013, 528, 47–89. [Google Scholar] [CrossRef]
- Fedele, F.; Brennan, J.; De León, S.P.; Dudley, J.; Dias, F. Real world ocean rogue waves explained without the modulational instability. Sci. Rep. 2016, 6, 27715. [Google Scholar] [CrossRef]
- Mori, N.; Liu, P.C.; Yasuda, T. Analysis of freak wave measurements in the Sea of Japan. Ocean. Eng. 2002, 29, 1399–1414. [Google Scholar] [CrossRef]
- Fedele, F.; Tayfun, M.A. On nonlinear wave groups and crest statistics. J. Fluid Mech. 2009, 620, 221. [Google Scholar] [CrossRef]
- Onorato, M.; Osborne, A.R.; Serio, M.; Cavaleri, L.; Brandini, C.; Stansberg, C. Observation of strongly non-Gaussian statistics for random sea surface gravity waves in wave flume experiments. Phys. Rev. E 2004, 70, 067302. [Google Scholar] [CrossRef]
- Cavaleri, L.; Bertotti, L.; Torrisi, L.; Bitner-Gregersen, E.; Serio, M.; Onorato, M. Rogue waves in crossing seas: The Louis Majesty accident. J. Geophys. Res. Ocean. 2012, 117. [Google Scholar] [CrossRef]
- Komen, G.J.; Cavaleri, L.; Donelan, M.; Hasselmann, K.; Hasselmann, S.; Janssen, P. Dynamics and Modelling of Ocean Waves; Cambridge University Press: Cambridge, UK, 1996. [Google Scholar]
- Tolman, H.L. User manual and system documentation of WAVEWATCH III TM version 3.14. MMAB Contrib. 2009, 276, 220. [Google Scholar]
- Barbariol, F.; Alves, J.H.G.; Benetazzo, A.; Bergamasco, F.; Bertotti, L.; Carniel, S.; Cavaleri, L.; Chao, Y.Y.; Chawla, A.; Ricchi, A.; et al. Numerical modeling of space-time wave extremes using WAVEWATCH III. Ocean Dyn. 2017, 67, 535–549. [Google Scholar] [CrossRef]
- Benetazzo, A.; Barbariol, F.; Pezzutto, P.; Staneva, J.; Behrens, A.; Davison, S.; Bergamasco, F.; Sclavo, M.; Cavaleri, L. Towards a unified framework for extreme sea waves from spectral models: Rationale and applications. Ocean Eng. 2021, 219, 108263. [Google Scholar] [CrossRef]
- Brebbia, C.A. The Boundary Element Method for Engineers; Number BOOK; Pentech Press: Devon, UK, 1980. [Google Scholar]
- Grilli, S.T.; Guyenne, P.; Dias, F. A fully nonlinear model for three-dimensional overturning waves over an arbitrary bottom. Int. J. Numer. Methods Fluids 2001, 35, 829–867. [Google Scholar] [CrossRef]
- Dommermuth, D.G.; Yue, D.K. A high-order spectral method for the study of nonlinear gravity waves. J. Fluid Mech. 1987, 184, 267–288. [Google Scholar] [CrossRef]
- West, B.J.; Brueckner, K.A.; Janda, R.S.; Milder, D.M.; Milton, R.L. A new numerical method for surface hydrodynamics. J. Geophys. Res. Ocean. 1987, 92, 11803–11824. [Google Scholar] [CrossRef]
- Brandini, C. Nonlinear Interaction Processes in Extreme Waves Dynamics. Ph.D. Thesis, Università di Firenze, Florence, Italy, 2000. [Google Scholar]
- Tanaka, M. A method of studying nonlinear random field of surface gravity waves by direct numerical simulation. Fluid Dyn. Res. 2001, 28, 41. [Google Scholar] [CrossRef]
- Toffoli, A.; Bitner-Gregersen, E.; Osborne, A.R.; Serio, M.; Monbaliu, J.; Onorato, M. Extreme waves in random crossing seas: Laboratory experiments and numerical simulations. Geophys. Res. Lett. 2011, 38. [Google Scholar] [CrossRef]
- Ducrozet, G.; Bonnefoy, F.; Le Touzé, D.; Ferrant, P. 3D HOS simulations of extreme waves in open seas. Nat. Hazards Earth Syst. Sci. 2007, 7, 109–122. [Google Scholar] [CrossRef]
- Xiao, W.; Liu, Y.; Wu, G.; Yue, D.K. Rogue wave occurrence and dynamics by direct simulations of nonlinear wave-field evolution. J. Fluid Mech. 2013, 720, 357–392. [Google Scholar] [CrossRef]
- Bitner-Gregersen, E.; Fernández, L.; Lefèvre, J.; Monbaliu, J.; Toffoli, A. The North Sea Andrea storm and numerical simulations. Nat. Hazards Earth Syst. Sci. 2014, 14, 1407. [Google Scholar] [CrossRef]
- Dias, F.; Brennan, J.; Ponce de León, S.; Clancy, C.; Dudley, J. Local analysis of wave fields produced from hindcasted rogue wave sea states. In International Conference on Offshore Mechanics and Arctic Engineering; American Society of Mechanical Engineers: New York, NY, USA, 2015; Volume 56499, p. V003T02A020. [Google Scholar]
- Vannucchi, V.; Taddei, S.; Capecchi, V.; Bendoni, M.; Brandini, C. Dynamical Downscaling of ERA5 Data on the North-Western Mediterranean Sea: From Atmosphere to High-Resolution Coastal Wave Climate. J. Mar. Sci. Eng. 2021, 9, 208. [Google Scholar] [CrossRef]
- Bonnefoy, F.; Ducrozet, G.; Le Touzé, D.; Ferrant, P. Time domain simulation of nonlinear water waves using spectral methods. In Advances in Numerical Simulation of Nonlinear Water Waves; World Scientific: Singapore, 2010; pp. 129–164. [Google Scholar]
- Ducrozet, G.; Bonnefoy, F.; Le Touzé, D.; Ferrant, P. HOS-ocean: Open-source solver for nonlinear waves in open ocean based on High-Order Spectral method. Comput. Phys. Commun. 2016, 203, 245–254. [Google Scholar] [CrossRef]
- Touboul, J. On the influence of wind on extreme wave events. Nat. Hazards Earth Syst. Sci. 2007, 7, 123–128. [Google Scholar] [CrossRef][Green Version]
- Seiffert, B.R.; Ducrozet, G. Simulation of breaking waves using the high-order spectral method with laboratory experiments: Wave-breaking energy dissipation. Ocean Dyn. 2018, 68, 65–89. [Google Scholar] [CrossRef]
- Dommermuth, D. The initialization of nonlinear waves using an adjustment scheme. Wave Motion 2000, 32, 307–317. [Google Scholar] [CrossRef]
- Bonnefoy, F. Modélisation Expérimentale et Numérique des états de mer Complexes. Ph.D. Thesis, Université de Nantes, Nantes, France, 2005. [Google Scholar]
- Ducrozet, G. Modelisation of Nonlinear Processes in Generation and Propagation of Sea States with a Spectral Approach. Ph.D. Thesis, Université de Nantes, Nantes, France, 2007. [Google Scholar]
- Brandini, C.; Capecchi, V.; Pasi, F.; Taddei, S.; Vannucchi, V. Special Project Progress Report SPITBRAN, Evaluation of Coastal Climate Trends in the Mediterranean Area by Means of High-Resolution and Multi-Model Downscaling of ERA5 Reanalysis; Technical Report; LaMMA Consortium: Florence, Italy, 2019. [Google Scholar]
- Hasselmann, S.; Hasselmann, K.; Allender, J.; Barnett, T. Computations and parameterizations of the nonlinear energy transfer in a gravity-wave specturm. Part II: Parameterizations of the nonlinear energy transfer for application in wave models. J. Phys. Oceanogr. 1985, 15, 1378–1391. [Google Scholar] [CrossRef]
- Ardhuin, F.; Rogers, E.; Babanin, A.V.; Filipot, J.F.; Magne, R.; Roland, A.; Van Der Westhuysen, A.; Queffeulou, P.; Lefevre, J.M.; Aouf, L.; et al. Semiempirical dissipation source functions for ocean waves. Part I: Definition, calibration, and validation. J. Phys. Oceanogr. 2010, 40, 1917–1941. [Google Scholar] [CrossRef]
- Leckler, F.; Ardhuin, F.; Filipot, J.F.; Mironov, A. Dissipation source terms and whitecap statistics. Ocean Model. 2013, 70, 62–74. [Google Scholar] [CrossRef][Green Version]
- Buzzi, A.; Davolio, S.; Malguzzi, P.; Drofa, O.; Mastrangelo, D. Heavy rainfall episodes over Liguria in autumn 2011: Numerical forecasting experiments. Nat. Hazards Earth Syst. Sci. 2014, 14, 1325–1340. [Google Scholar] [CrossRef]
- Malguzzi, P.; Grossi, G.; Buzzi, A.; Ranzi, R.; Buizza, R. The 1966 “century” flood in Italy: A meteorological and hydrological revisitation. J. Geophys. Res. Atmos. 2006, 111. [Google Scholar] [CrossRef]
- Conjunto de Datos: REDEXT. Technical Report. Puertos del Estado. 2015. Available online: https://bancodatos.puertos.es/BD/informes/INT_2.pdf (accessed on 1 September 2020).
- Ducrozet, G.; Bonnefoy, F.; Perignon, Y. Applicability and limitations of highly nonlinear potential flow solvers in the context of water waves. Ocean Eng. 2017, 142, 233–244. [Google Scholar] [CrossRef]
- Toffoli, A.; Gramstad, O.; Trulsen, K.; Monbaliu, J.; Bitner-Gregersen, E.; Onorato, M. Evolution of weakly nonlinear random directional waves: Laboratory experiments and numerical simulations. J. Fluid Mech. 2010, 664, 313. [Google Scholar] [CrossRef]
- Trulsen, K.; Nieto Borge, J.C.; Gramstad, O.; Aouf, L.; Lefèvre, J.M. Crossing sea state and rogue wave probability during the P restige accident. J. Geophys. Res. Ocean. 2015, 120, 7113–7136. [Google Scholar] [CrossRef]
- Zakharov, V.; Filonenko, N. Energy spectrum for stochastic oscillations of the surface of a liquid. Sov. Phys. Dokl. 1967, 11, 881. [Google Scholar]
- Onorato, M.; Osborne, A.R.; Serio, M.; Resio, D.; Pushkarev, A.; Zakharov, V.E.; Brandini, C. Freely decaying weak turbulence for sea surface gravity waves. Phys. Rev. Lett. 2002, 89, 144501. [Google Scholar] [CrossRef] [PubMed]
- Janssen, P.A. Nonlinear four-wave interactions and freak waves. J. Phys. Oceanogr. 2003, 33, 863–884. [Google Scholar]
- Mori, N.; Janssen, P.A. On kurtosis and occurrence probability of freak waves. J. Phys. Oceanogr. 2006, 36, 1471–1483. [Google Scholar] [CrossRef]
- Toffoli, A.; Benoit, M.; Onorato, M.; Bitner-Gregersen, E. The effect of third-order nonlinearity on statistical properties of random directional waves in finite depth. Nonlinear Process. Geophys. 2009, 16, 131. [Google Scholar]
- Mori, N.; Onorato, M.; Janssen, P.A.; Osborne, A.R.; Serio, M. On the extreme statistics of long-crested deep water waves: Theory and experiments. J. Geophys. Res. Ocean. 2007, 112. [Google Scholar] [CrossRef]
- Tayfun, M.A. Narrow-band nonlinear sea waves. J. Geophys. Res. Ocean. 1980, 85, 1548–1552. [Google Scholar] [CrossRef]
- Tayfun, M.A.; Fedele, F. Wave-height distributions and nonlinear effects. Ocean Eng. 2007, 34, 1631–1649. [Google Scholar] [CrossRef]
- Forristall, G.Z. Wave crest distributions: Observations and second-order theory. J. Phys. Oceanogr. 2000, 30, 1931–1943. [Google Scholar] [CrossRef]
- Janssen, P.A. On some consequences of the canonical transformation in the Hamiltonian theory of water waves. J. Fluid Mech. 2009, 637, 1. [Google Scholar] [CrossRef]
- Young, I. The determination of confidence limits associated with estimates of the spectral peak frequency. Ocean Eng. 1995, 22, 669–686. [Google Scholar] [CrossRef]
- Serio, M.; Onorato, M.; Osborne, A.R.; Janssen, P.A. On the computation of the Benjamin–Feir Index. II Nuovo C. 2005, 28, 893–903. [Google Scholar]
- Goda, Y. Random Seas and Design of Maritime Structures; World Scientific: Singapore, 2010. [Google Scholar]
- Tayfun, M.A.; Fedele, F. Expected shape of extreme waves in storm seas. In Proceedings of the International Conference on Offshore Mechanics and Arctic Engineering, San Diego, CA, USA, 10–15 June 2007; Volume 42681, pp. 53–60. [Google Scholar]
Publisher’s Note: MDPI stays neutral with regard to jurisdictional claims in published maps and institutional affiliations. |
© 2021 by the authors. Licensee MDPI, Basel, Switzerland. This article is an open access article distributed under the terms and conditions of the Creative Commons Attribution (CC BY) license (https://creativecommons.org/licenses/by/4.0/).