Article

Hemocyte Health Status Based on Four Biomarkers to Assess Recovery Capacity in American Lobster (Homarus americanus) after Exposure to Marine Diesel and Diluted Bitumen

by
Camille Berthod
1,*,
Marie-Hélène Bénard-Déraspe
2,
Jean-François Laplante
2,
Nicolas Lemaire
2,
Madeleine Nadeau
3,
Nicolas Toupoint
1,2,
Gaëlle Triffault-Bouchet
4 and
Richard Saint-Louis
5
1
Institut des Sciences de la Mer de Rimouski (ISMER), Université du Québec à Rimouski (UQAR), 310 Allée des Ursulines, CP 3300, Rimouski, QC G5L 3A1, Canada
2
MERINOV, Centre d’Innovation de l’aquaculture et des Pêches du Québec, Secteur Aquaculture, 107-125 Chemin du Parc, Cap-aux-Meules, QC G4T 1B3, Canada
3
Centre d’expertise en Gestion des Risques d’incidents Maritimes (CEGRIM), 125 chemin du Parc, bureau 108, Cap-aux-Meules, QC G4T 1B3, Canada
4
Ministère de l’Environnement et de la Lutte Contre les Changements Climatiques (MELCC), 675, boulevard René-Lévesque Est, Quebec City, QC G1R 5V7, Canada
5
Département de Biologie, Chimie et Géographie, Université du Québec à Rimouski, 310 allée des Ursulines, Rimouski, QC G5L 3A1, Canada
*
Author to whom correspondence should be addressed.
J. Mar. Sci. Eng. 2021, 9(4), 370; https://doi.org/10.3390/jmse9040370
Submission received: 4 January 2021 / Revised: 24 March 2021 / Accepted: 25 March 2021 / Published: 30 March 2021
(This article belongs to the Special Issue Pollutions of Nanocomposites in Aquatic Systems)

Abstract

:
The growing transportation of petroleum products pose a significant risk of marine diesel or diluted bitumen (dilbit) spills at sea. Despite the economic importance of the American lobster, there have been few studies assessing the impact study of such a spill on their population. In the lobster industry, lobster quality is monitored according to the Brix index of hemolymph. In our research, the effectiveness of three other biomarkers operative in the industry was assessed in hemolymph during contamination (over 96 h) by marine diesel and dilbit (Cold Lake Blend; CLB), as well as in the subsequent recovery period, according to two temperature cycles. At the end of the experiment, chemical and tainting assays were performed. Our results demonstrate that, among the four tested biomarkers, lysosomal stability and ethoxyresorufin O-deethylase (EROD) induction exhibit higher sensitivity. Increasing the temperature did not shorten the recovery period. Viability cellular impacts were greater in lobsters exposed to dilbit than that in those exposed to marine diesel. Marine diesel exposure appears to be more problematic for the lobster fishery, as the cooked lobster meat still presented a hydrocarbon odor even after 3 months of live holding. Finally, the high PAH concentrations measured in lobster eggs suggest potential adverse transgenerational effects of marine diesel exposure.

1. Introduction

The American lobsters, Homarus americanus (Milne-Edwards, 1837), is found in the Northwest Atlantic Ocean, between Newfoundland (Canada) and North Carolina (USA). This species is one of the most important exploited crustaceans in the Northwest Atlantic and its fishery represents the major local economy for many North Atlantic coastal communities. The total catch reported for this species by the FAO (Food and Agriculture Organization) in 2016 was 162,547 t. In 2017, the countries with the highest catches were Canada (97,452 t) [1] and the United States (62,006 t) [2]. American lobster is the most valuable species for Canadian fisheries ($1.4 B), contributing to 45% of the whole commercial value of all fisheries in Atlantic Canada in 2018 [3].
However, this economy has become threatened by another important sector in Canada. The oil industry. Indeed, Canada is one of the world’s largest oil producers, benefiting from the third-largest oil reserves at the global scale, mostly in the form of unconventional oil (including diluted bitumen). In 2019, the proven crude oil reserves in Canada accumulated 168.5 billion barrels, of which 164.1 and 4.4 billion barrels were extracted from oil sands and conventional sources, respectively [4]. Most of the crude oil produced in Canada is exported to international markets for further refining. In 2018, 1.7 million barrels of oil (96 billion liters) were shipped daily to domestic refineries [4]. Domestic scales of petroleum products were 1.9 million barrels per day (110 billion liters), with 30% represented by diesel [5]. The exploitation and transport of this resource are still increasing, concomitantly with the demand for petroleum products [6]. Although the frequency of large oil spills from tankers has been decreasing worldwide [7], inshore fisheries remain vulnerable to such a risk. Coastal areas are more likely to be exposed to small and medium petroleum product spills (<1000 m3), due to increased human activities [8], with small diesel spills (10–100 m3) being the most common in Canada, following an annual frequency of 0.6 [7]. Two small spill events occurring in the Gulf of St. Lawrence (eastern Canada) illustrate that for lobster fishery, the risk of exposure to hydrocarbons is real. In September 2013, 5 m3 of heavy fuel were released into the marine waters of the Baie de Sept-Îles from an inland spill of 450 m3, caused by human error at an industrial site. In September 2014, 100 m3 of diesel leaked in Cap-aux-Meules Harbour (Îles-de-la-Madeleine), due to a failure in a pipeline that annually pipes 40 million liters of diesel from this harbor to a local power plant. Globally, there is an increased probability of small to medium spill events of various petroleum products, from diesel to diluted bitumen, due to the ongoing expansion of routine shipping operations and coastal activities.
Oil spills contaminate sediments [9] and the accumulated compounds degrade slowly [10]. Benthic invertebrates can take up hydrocarbons by feeding on contaminated material, or through direct absorption from sediments or water [11,12]. For lobsters, this results in high levels of PAHs, which can then persist over years: up to six and seven years after for the Braer [13] and Amoco Cadiz [14] oil spills, respectively. Significantly elevated concentrations of total aromatics were found in the hepatopancreas of American lobster and their decrease was measured only after 11 days of depuration [15]. Few reviews have reported the impact of hydrocarbons on lobsters during oil spills or laboratory experiments, highlighting higher mortalities or lower abundances as major impacts [16,17]. For example, a loss of 9 million lobsters was estimated after the North Cape oil spill in 1996 (23,000 barrels of home heating oil), based on observed abundances in the affected area compared to reference sites [18,19,20], in addition to the 2.9 million lobsters stranded on the beaches [21]. In crustaceans, integument damage may appear following an oil spill, thus compromising the integrity of their epicuticle, which serves as a physical barrier between the environment and the more permeable inner layers of the exoskeleton [19,22]. Behavioral effects have also been observed in lobsters, such as an increase in the delay between noticing food and pursuing it [23,24,25,26], disorientated behavior, and uncoordinated movements [27]. Sublethal effects of heavy fuel oil have been observed in red rock lobster (Jasus edwardsii), such as a change in circulating immune cell populations, which recovered by the conclusion of a 96 h exposure period [28]. The depuration of PAHs appeared to be particularly slow in red rock lobster and significantly elevated PAH levels were still evident after 10 days of depuration [28]. Furthermore, exposed lobsters may be unfit for human consumption due to gill-tissue damage [29], as well as deterioration in meat color and smell [30]. As a matter of fact, tainting occurs when the organism accumulates enough hydrocarbons to cause an “off” flavor or odor in the seafood [11]. These organisms are unsuitable for consumption until this tainting disappears, where associated delays can take from days to up to a year after exposure, depending on the species [17]. A study of Williams et al. [15] observed that the odor of raw treated lobsters differed significantly from that of the control, even after 21 days of depuration; however, cooking appeared to remove the oily odor from the raw lobster. Despite the risk of diluted bitumen (dilbit) or diesel marine spills, to the best of our knowledge, there have been no studies dealing with the impacts of a dilbit spill on American lobsters and no studies on the sub-lethal impact of a marine diesel or dilbit spill. In addition, due to the bioavailability of soluble compounds and persistent polycyclic aromatic, organic sulfur, and heterocyclic compounds, it can be assumed that light petroleum products (e.g., marine diesel) are more toxic than heavy petroleum products (e.g., dilbit), despite their greater tendency to bind receiving organisms and environments.
Sub-lethal levels of contamination are usually quantified using biomarkers as exhibited observable or measurable changes at the molecular, biochemical, cellular, or physiological level. Biomarkers can reveal the exposure of a living organism to a present or past chemical substance and its associated effects [31]. The monitoring of such markers can facilitate the early detection of pathogens or anthropomorphic stressors. For example, McDonald et al. [32] measured a significant induction of enzymatic activity in gray shrimp (Penaeus aztecus), for individuals sampled near (<100 m) an oil platform. Among the major physiological functions, the immune system is a significant mechanism that reflects the individual’s health status. A deterioration in immune functions can quickly lead to morbidity or mortality [33]. The efficiency of an individual’s immune system can be compromised when specific tolerance thresholds of environmental conditions are exceeded, thus increasing their susceptibility to pathogens [34]. In crustaceans, immunity is supported by hemocytes, circulating cells that are involved in multiple physiological functions and homeostasis processes. Therefore, the study of hemocyte functions is a prime target for use in the determination of health status.
In the lobster industry, the Brix index is routinely measured from the hemolymph, to evaluate the global lobster health. Simon et al. [35] identified the Brix index as the most accurate and practical biomarker among eighteen hemolymph parameters, for reflecting the state of energetic reserves in spiny lobsters. Indeed, the Brix index value is highly correlated with the hemolymph total protein [35,36,37,38], triglycerides, cholesterol, calcium, and phosphorus concentrations as well as with lipase activity [35]. To measure the lobster health status, various physiological changes can be assessed by assaying total blood proteins with the Brix index [39,40]. As Battison [41] pointed out, other applications could include the evaluation of lobsters subjected to different suspected exposure conditions to noxious or infectious agent(s). However, the effectiveness of the Brix index as an indicator of lobster quality following a petroleum product spill not yet known.
In this context, our study aims to test three biomarkers in addition to the Brix index, in punctured lobster hemolymph which is routinely monitored in industrial practices after contamination by two petroleum products: CLB or marine diesel. These are cell viability, lysosomal membrane stability, and activity of a phase I detoxification enzyme (ethoxyresorufin O-deethylase; EROD). An initial sub-lethal effect is easily measured using Trypan blue (TB) dye exclusion to assess cell viability, which is one of the most common methods. It is based on the ability of the membrane of viable cells to exclude the dye. Destabilization of the lysosomal membrane is another recommended biomarker for monitoring the impact of petroleum hydrocarbon pollution [42] as the excessive lysosome activity induced by dissolved hydrocarbons leads to an increase of enzymatic activity and can cause the destabilization of their membranes. The measurement of this destabilization by the neutral red retention (NRR) assay provides a sensitive index of the cell condition that can be related to the grade of contamination or recovery. Finally, the ethoxyresorufin-O-deethylase (EROD) biomarker is often used to assess exposure of marine organisms to PAHs. The EROD activity is measured to observe the induction of phase I P450 enzymes [43,44,45], which are responsible for xenobiotic biotransformation and are involved in reactive oxygen species production and accumulation. This enzyme family exhibits the highest levels in cell tissues of organs involved in food processing [45,46,47], explaining why EROD activity is classically measured in the hepatopancreas for crustaceans. A few studies have measured this activity induction in hemolymph [48], but not in lobsters. These four biomarkers were tested at the end of exposure, as well as over 3 weeks following contamination. We also intended to explore the influence of water temperature on lobster recovery, as it may modulate the efficiency of this operation [49]. In order to check the quality of lobsters in the context of industrial sales, the olfactory, visual, and taste quality were tested after the recovery phase. In addition, this study provides new data on the sublethal impacts of unconventional oil and marine diesel spills on American lobster and their recovery capacity. For exploratory purposes, chemical analyses of lobster tissue were carried out after several months in a fishpond.

2. Materials and Methods

2.1. Conditions of Oil Spill Simulation

2.1.1. Oil Products

Two types of petroleum products were tested: diluted bitumen (dilbit) from Alberta Cold Lake Blend (CLB) and a classical marine diesel from New Brunswick (Table 1).

2.1.2. Water Accommodated Fraction

In this study, lobsters were exposed to oil physically dispersed by the technique of water accommodated fraction (WAF). The WAF was prepared according to the standardized protocol of Singer et al. [51], modified by Barron and Ka’aihue [52] and Payne et al. [53] for CLB and marine diesel, respectively. The WAF was prepared before each exposure by adding the tested oil products (1:10) to filtered natural seawater (0.2 µm), collected in Cap-aux-Meules, in a fluorinated polyethylene carboy with 20% headspace. The solution was gently mixed for 18 h then left to settle for 6 h after the cessation of stirring. The contaminated seawater was then recovered and diluted with filtered natural seawater for the exposure. The dilutions used were 0% and 60% of WAF for Control and CLB/marine diesel treatments, respectively.

2.1.3. Monitoring of Dissolved Aromatic Hydrocarbons by Fluorescence

During lobster exposure, the concentration of the aromatic hydrocarbon dissolved fraction of crude oil was estimated using the Cyclops-7 submersible fluorometric sensor, equipped with the “O” sensor (Turner Designs, San José, CA, USA) for the detection of crude oil. It is one of the five UV submersible fluorometers that are commercially available for in situ measurements of PAHs, and one of the most commonly used in delineating oil plumes in the field [54,55]. Its fluorescence optical specifications are excitation wavelengths at 325/120 nm and emission wavelengths at 410–600 nm. The Cyclops-7 sensor was controlled by a DataBank module, which was connected to a computer by proprietary software (Turner Designs, San José, CA, USA). The sensor was calibrated with an aqueous solution of 100 μg∙L−1 of tetrasodium 1,3,6,8-pyretetetrasulfonate (PTSA), a highly water-soluble pyrene derivative (CAS 6528-53-6; Sigma-Aldrich, Darmstadt, Germany). The fluorescence measurements were used as an indicator of hydrocarbon concentration and, thus, were expressed in equivalent μg PTSA∙L−1. The sensor response was linear within the PTSA concentration range used, from 5 to 550 μg∙L−1. The measurements were made in situ in 15-liters exposure tanks.

2.2. Animals

One batch of lobsters (Homarus americanus; sex ratio 1:1), captured during the 2018 fishing season in Lobster Fishing Area 22 (LFA 22, Quebec City, Canada), was kept in a Merinov containment unit (without feeding) in Cap-aux-Meules, and maintained at 2 °C to induce natural winter dormancy. A total of fifty-four (54) lobsters were used for the experiment, including 30 females and 24 males (88.3 ± 0.5 mm mean length and 559.5 ± 9.5 g).

2.3. Exposure and Recovery

Two series of assays were performed, with similar exposure conditions, but two different thermal regimes for recovery. For each series, twenty-seven (27) lobsters were randomly assigned to nine (3 × 3) independent 15 L tanks (Figure 1) of oxygenated natural seawater, in order to carry out the following treatments in triplicate: Control (uncontaminated natural seawater), Cold Lake Blend (WAF-CLB) and marine diesel (WAF-Diesel). Three lobsters were used per replicate per treatment per series. Exposure was carried out for 96 h at 4 °C with filtered natural seawater for Control and 60% diluted WAF for CLB and marine diesel (no feeding and water renewal). During the exposure, the physicochemical characteristics of the water were monitored daily (i.e., temperature, salinity, dissolved oxygen and ammonia).
At the end of the exposure, the lobsters were removed and placed in two series of new tanks filled with uncontaminated and unfiltered natural seawater, thus starting the depuration period. The recovery period is defined as the time required for an organism to return to its pre-exposure health state. This recovery time depends on the type of pollutant and the amount accumulated in tissues. At this stage, two thermal conditions were applied during the three weeks: series A, with a constant water temperature at 4 °C, and series B, with a water temperature gradually increasing from 4 to 9 °C. The tanks were cleaned, the water was renewed daily, and the physicochemical characteristics of the water were monitored daily (i.e., temperature, salinity, dissolved oxygen, and ammonia). The seawater physicochemical characteristics did not change during the assay, with a level of ammonia remaining lower than the toxic levels for lobster (5.2 ppm for adult lobsters at 5 °C [56]). Finally, the dissolved aromatic compounds concentration of the crude oils was also measured daily, as described earlier (by fluorescence).
At the end of the three weeks of recovery, the lobsters were returned to open live holding tanks dedicated to long-term contention at a constant temperature of 2 °C. Three months later, the organoleptic conditions (odor and color, before and after cooking) and PAH concentrations of tissues were checked.
Throughout the study (exposure and recovery) the lobsters were not fed in order to approximate industrial conditions, where no feed is provided to the lobster holding tanks. In addition, as benthic invertebrates can uptake hydrocarbons through the consumption of contaminated prey, the absence of food avoids the input of contamination from food as well as an additional variable in the analysis of results.
The results presented for the exposure impacts combined the two series values for each condition. As the environmental conditions were the same for series A and B, the data of both were grouped together for each treatment (n = 2 × 3). Then, the results of the recovery were presented by differentiating the two temperature templates.

2.4. Hemolymph Sampling

The Hemolymph puncture allows for rapid and non-lethal sampling. For each experimental condition, each lobster was punctured during the exposure period at the following times: 0 h (before exposure) and 96 h (end of exposure), and at: 24, 72, 168, 336 and 504 h in the recovery period (i.e., 1, 2, and 3 weeks of recovery). The 0 h time point during the exposure period corresponds to the puncturing of lobsters just before placing them in their tanks with associated samples, representing the initial health status.
The hemolymph was punctured under the abdomen (after the first pair of pleopods) with a 3 mL syringe and a 23 G needle. Two 0.5 mL hemolymph punctures were performed: the first for the Brix index test and a second one, using a preloaded syringe of a PBS_EDTA mixture (0.5 mL; 15 mM), for the three other biotests (TB, NRR, and EROD).

2.5. Biotests

2.5.1. Brix Index

The Brix index (%) value was obtained by reading a 0.5 mL hemolymph volume in a refractometer (PAL-1; Atago), which had been calibrated beforehand using deionized water (0). The Brix index can be converted into a refractive index (RI), as follows [57]:
RI = 0.0015   ×   Brix + 1.3325
The total protein (TP; mg/mL) in the hemolymph can then be determined, using the refractive index RI, as follows:
TP =   5449.417   ×   RI 7295.321

2.5.2. Cellular Viability

The viability of hemocytes was assessed by a membrane integrity test, the Trypan blue dye exclusion method. After the hemolymph puncture, as described above, 40 µL of cell suspension was added to 20 µL of Trypan blue dye solution (CAS 72-57-1). After 15 min, 20 μL of the mixture was deposited on a glass slide and observed using an optical microscope. Fifty cells were classified according to two categories: (1) Living cells, uncolored; and (2) dead cells, blue-colored.

2.5.3. Lysosomal Membrane Destabilization Index

The lysosomal membrane destabilization index was determined using NRR assay, performed according to the method described by Song et al. [58] modified by Small et al. [59]. A stock solution of neutral red dye (3-amino-7-dimethylamino-2-methylphenazine hydrochloride, C15H17ClN4, Sigma) was prepared by dissolving 2.22 mg in 1 mL of dimethyl sulfoxide (DMSO, C2H6OS, Sigma-Aldrich). The dye stock solution was kept at 4 °C until required. A working solution was made daily by dissolving 8.5 µL of the dye stock solution in 500 µL of physiological saline solution (NaCl 19.31 g∙L−1; KCl 0.65 g∙L−1; CaCl2 1.38 g∙L−1; MgSO4 1.73 g∙L−1; Na2SO4 0.38 g∙L−1; HEPES 0.82 g∙L−1 adjusted to the pH of natural seawater). The hemolymph (0.2 mL) was transferred to an Eppendorf tube with physiological saline solution (0.2 mL). An aliquot of 40 µL was transferred to a positively charged microscope slide and incubated in a dark humidity chamber at ambient temperature for 15 min to allow cells to attach to the slide. Then, the working solution (40 µL) was put on the slide. After 15 min in the same humidity chamber, a cover slip was placed on the slide. After 45 min, normal and destabilized cells were counted using a light microscope. In healthy cells, neutral red is retained in the lysosomes, turning them red, while the cytosol is colorless. For damaged cells, the efflux of red dye into the cytosol results in redness of the cytosol. Increased cellular retention of neutral red dye, therefore, corresponds to a healthier lobster. For each sample, at least 50 hemocytes were analyzed. The lysosomal membrane destabilization index (LDI; %) was calculated as the number of hemocytes with destabilized lysosomes (DH), as follows:
L D I = ( DH 50 ) ×   100

2.5.4. EROD

The EROD activity test used for this study was based on the method described by Burgeot and Ménard [60] and modified according to Monari et al. [48] to adapt it to the hemolymph. The resorufin formation was followed by fluorimetry at 585 nm using a microplate reader (BioTek Epoch2), with an excitation wavelength of 530 nm. The fluorescence of the samples indicates the resorufin concentration by a standard curve. EROD activity is related to the protein concentration determined according to the Bradford assay [61]. The activities are expressed in picomoles per minute and per milligram of protein:
E R O D = [ resorufin ]   ×   reaction   volume time   ( min )   ×   [ protein ]   ×   volume

2.6. Tainting Assay

An oil spill can affect the olfactory, visual, and taste quality of crustaceans, precluding their commercial value. Tainted seafood presents abnormal odor or flavor, atypical of the seafood itself [62]. This degradation may persist beyond the recovery period [63]. Three months after the experiments, one lobster per treatment and per series (for a total of 6) was sacrificed to perform olfactory and visual evaluations in fresh and cooked (after 15 min in boiling water) states. However, due to this low number of specimens, these qualitative results are only indicative.

2.7. Tissues Analysis for Polycyclic Aromatic Hydrocarbons (PAHs)

After 3 months of live holding, 2 lobsters per treatment and per series (for a total of 12) were sacrificed and tissues were analyzed for their PAH contents. Lobsters were boiled (15 min) and several tissues were recovered for chemical analysis: abdomen, claw, and hepatopancreas. In addition, three females of the sampled lobsters (1 in Control and 2 for marine diesel treatment) had spawned during this stage, thus permitting us to also assess PAHs in the eggs. Tissues were kept at −20 °C until further analysis.

2.7.1. PAHs Extraction

Lobster tissues were freeze-dried (FreeZone, Labconco, USA) and homogenized into a fine powder using a Virtis homogenizer. A sub-sample of about 300 mg was suspended in 5 mL of tetramethylammonium hydroxide (TMAH, 25% water; Sigma Aldrich, Darmstadt, Germany) in a 12 mL glass tube with a Teflon-lined cap and vortexed for 1 min. The mixture was then heated (60 °C) for one h with manual stirring every 15 min, in order to complete the alkaline digestion. After cooling the mixture to room temperature, 1.0 mL of deionized water, 1.0 g of NaCl, and 4.0 mL of hexane/toluene mix (1:1) were added before stirring for one h (Wrist Action Shaker; Burrell Scientific, Pittsburgh, PA, USA). The mixture was centrifuged (at 3000 g), and the upper organic layer was recovered. A second extraction step was performed with another 4 mL of hexane/toluene mix (1:1) and this recovered organic layer was added to the first one. The whole organic extract was then cleaned on a silica column topped with sodium sulfate. The volume of the cleaned extract was reduced under a gentle stream of nitrogen, at room temperature, to a final volume of 1000 µL. A volume of 150 µL of the concentrated extract was pipetted and transferred to a GC vial equipped with a glass insert and a volume of 50 µL of a solution of deuterated PAHs was added as an internal standard.

2.7.2. PAHs Detection and Quantification

PAH analyses were performed using a gas chromatograph (GC, Agilent Technologies 6850 series II; Santa Clara, CA, USA) coupled to a mass spectrometer (MS, Agilent Technologies 5975B VL MSD). Injection (1µL) was performed using an Agilent Technologies Auto sampler 6850 series, at a temperature of 250 °C with a splitless injection mode. The capillary column was an Rxi®-5ms (30 m × 0.25 mm ID × 0.25 µm FT, 5% diphenyl and 95% polysiloxane from RESTEK), with helium as the carrier gas at a flow rate of 1 mL/min. The oven temperature program was set as follows: 50 °C for 2 min, 15 °C/min until 275 °C and 2 min hold, 15 °C/min until 325 °C and 15 min hold, and a post-run of 2 min at 300 °C. The detection of PAHs was performed in scan mode between 50 to 500 amu, with positive ion detection, where quantification of each PAH was based on the ratio of the signal of their molecular ion relative to the signal of the appropriate internal standard. Sample blanks were processed and analyzed. Thirty-five PAHs (∑35Total-PAHs) were quantified. Among them, sixteen PAHs classified as priority pollutants by the United States Environmental Protection Agency [64] were quantified (∑16PAHs-EPA), along with 19 alkylated PAHs (∑19Alkylated-PAHs).

2.8. Statistical Treatment of Biomarker Responses

At first, the assumptions of normality and the homoscedasticity were verified using the Shapiro and Bartlett tests, respectively. Exposure data were analyzed by performing two-way repeated measures analysis of variance (ANOVA) to determine the significance of the effects of treatment and time. The post hoc Tukey’s multiple comparison test was performed for comparison among the 2 times (0 and 96 h) and 3 treatments. Recovery data were first analyzed using one-way ANOVA followed by Tukey’s test to compare the effects of petroleum treatments (CLB and marine diesel) to Control at each time. Secondly, each treatment was analyzed by performing a two-way repeated measures ANOVA, followed by Tukey’s test, to determine the significance of the effects of time and series.
All tests were regarded as statistically significant when p < 0.05. All data were statistically analyzed using R software version 3.5.2 [65].
The chemical analysis was not assessed statistically, due to the low number of replicates.

3. Results

3.1. Exposure

3.1.1. Monitoring of Dissolved Aromatic Hydrocarbons in Experimental Units

Figure 2 shows the dissolved aromatic hydrocarbons concentrations during exposure (0–96 h), expressed in equivalent PTSA and measured with the fluorescent probe during the experiments of series A and B combined.
At 0 h, the tanks contained either clean filtered sea-water or 60% WAF with CLB (WAF-CLB) or marine diesel (WAF-Diesel) mixed in clean sea-water, with no lobsters. The concentration of dissolved aromatic hydrocarbons was significantly higher in exposure tanks (WAF-CLB and WAF-Diesel) than in the Control. Moreover, this concentration was significantly higher in WAF-Diesel tanks than in WAF-CLB. Hydrocarbon concentrations estimated by Cyclops-7 were in the range of LC50, which is 6–400 µg/L with the mean 50 µg/L of dissolved PAH concentration according to McCay [66]. At the end of the exposure (96 h), the concentration of dissolved aromatic hydrocarbons in WAF-Diesel tanks was equal to that of WAF-CLB, thus decreasing by a 0.6 factor; both remained significantly greater than the Control. Despite an initial evaporation of the lightest compounds during the preparation of the WAFs (24 h), evaporation seemed to continue during the exposure of the lobsters to the WAF-Diesel, unlike the WAF-CLB.

3.1.2. Sublethal Impacts after 96 h Exposure

Figure 3 shows the total protein concentrations, as inferred from measurements of the Brix index, before (0 h) and after exposure (96 h). This concentration did not differ significantly between the measuring points, nor between the three treatments (Control, WAF-CLB, and WAF-Diesel).
Figure 4 and Figure 5 shows the cellular impacts, namely on cell viability and lysosomal stability, respectively, measured before (0 h) and after 96 h of exposure to hydrocarbons. Globally, the cell viability tended to drastically decrease in lobsters exposed to WAF-CLB (13.2 ± 2.5% nonviable at 0 h vs. 19.9 ± 3.0% at 96 h), whereas this trend was inverse for Control and stable for WAF-Diesel. An impact on cell viability after exposure was only observed in lobsters exposed to WAF-CLB, with a significant 2-fold higher fraction of nonviable cells when compared to both Control and WAF-Diesel treatments, which exhibited similar values.
The lysosomal membranes (Figure 5) were significantly destabilized when exposed to both types of oil (CLB and marine diesel), affecting 45.4 ± 2.1% and 39.8 ± 2.5% of cells, respectively, vs. 16.0 ± 2% in the Control after 96 h of exposure. The two treatments affected the lysosomal membrane stability in the same way.
The EROD biomarker was used to measure the biotransformation activity of contamination in the hemolymph. EROD activities and associated induction rates between before (0 h) and after exposure (96 h) are presented in Table 2. Inductions of the hemolymph EROD activity were observed in lobsters exposed to both WAF-CLB and WAF-Diesel, with a significantly higher activity than the Control and an induction rate close to 2. As with the NRR biomarker, the two treatments had similar values for the EROD biomarker.

3.2. Recovery Capacity
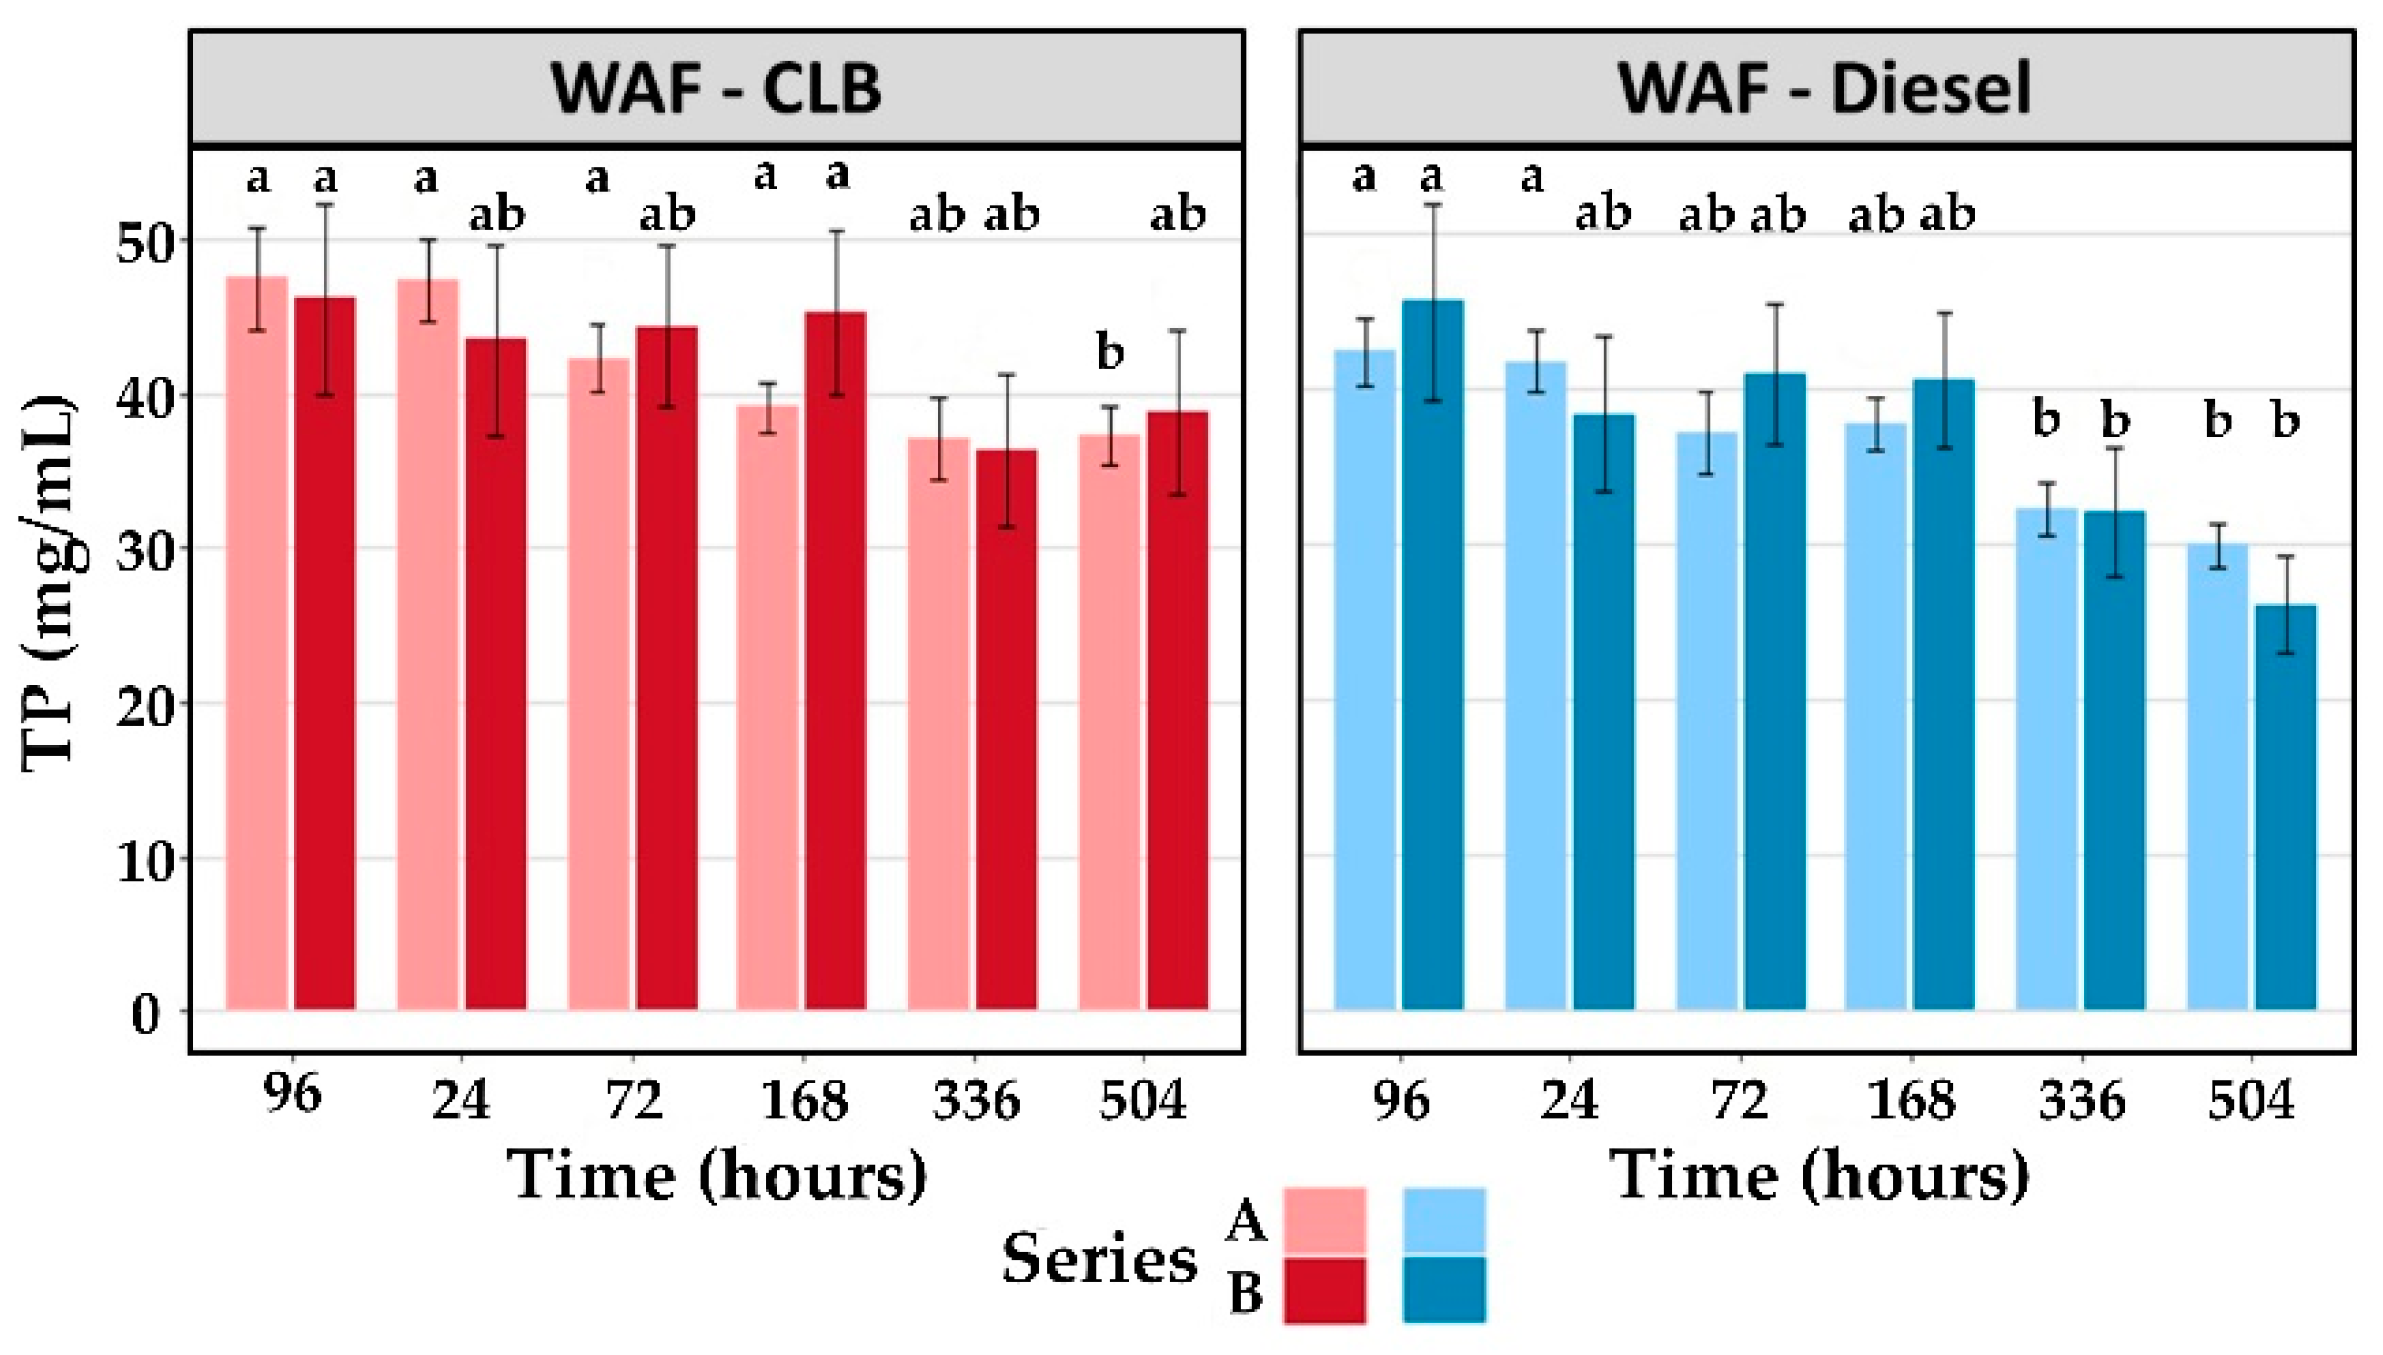
3.2.1. Brix Index

Table 3 shows the results for the Brix index of series A and B obtained during the recovery period. No significant effect of oil product exposure was observed in terms of the total protein content in the hemolymph of lobsters during the recovery period, regardless the oil or thermal system.
Nevertheless, at the end of recovery (504 h), in lobsters exposed to hydrocarbons, the total protein content seems to be lower in lobsters exposed to WAF-Diesel than those exposed to WAF-CLB.
Figure 6 shows the time effect according to the oil treatments (WAF-CLB and WAF-Diesel). In Control lobsters, the Brix index did not change during the recovery in series B. In series A, a significant decrease was measured from 2 weeks of recovery (336 h). For the oil treatments, the level of total protein tended to gradually reduce during the depuration phase in series A (Figure 6). In lobsters exposed to WAF-Diesel, the values significant decreased during recovery in the two series, from 2 weeks (336 h). In lobsters exposed to WAF-CLB in series A, the difference was significant from 3 weeks of recovery (504 h). Decreases in total protein may be due to the non-feeding condition applied during this study.

3.2.2. Cellular Viability

Globally, the percentage of dead cells was relatively low (<25%), regardless the thermal conditions (series A and B; Table 4).
In series A, the viability effect was significantly different in the WAF-CLB lobsters at the beginning of recovery (0 h), but reached the Control and WAF-Diesel values at 24 h of recovery. When the temperature increased in series B, the percentage of nonviable cells decreased and reached the control values from 72 h of recovery. In the lobsters exposed to WAF-Diesel, the cell viability was equivalent to the Control in both series (see Table 4).
During the recovery period (3 weeks), the percentage of nonviable cells did not vary significantly in Control lobsters and those exposed to WAF-Diesel, for both series. A significant decrease was measured in lobsters exposed to WAF-CLB in both series. Figure 7 shows the percentage of nonviable cells for these lobsters in both series.
In lobsters exposed to WAF-CLB in series A (constant 4 °C), a significant decrease in the percentage of nonviable hemocytes was observed in the first 24 h of recovery. In series B, this percentage significantly decreased from 1 week (168 h) of depuration. The decrease under an increasing temperature (series B) was slower, than that under a constant temperature (series A).

3.2.3. Lysosomal Membrane Destabilization Index

Table 5 shows the percentage of hemocytes with destabilization of the lysosomal membrane during the recovery period.
The percentage of destabilized lysosomal membrane of hemocytes decreased during recovery. In lobsters impacted by petroleum products (CLB or marine diesel), this percentage decreased and reached those of the controls from 2 weeks (336 h) when the temperature remained constant (Table 5). However, when it increased, these values were reached more rapidly those of the Controls: from 72 h for lobsters impacted by WAF-CLB and from 1 week (168 h) for those impacted by WAF-Diesel.
During the 3 weeks of depuration (504 h), the percentage of lysosomal membrane destabilization in lobsters exposed to WAF-CLB significantly decreased for both series (Figure 8). This reduction was observed from 1 week (168 h) of recovery and continue until 3 weeks (504 h) in series A. When the temperature increased (series B), this reduction was observed from 24 h and seemed to have stagnated from 2 weeks of recovery (336 h) in lobsters exposed to WAF-CLB. For lobsters exposed to WAF-Diesel (Figure 8), the percentage of lysosomal membrane destabilization decreased significantly from 2 weeks in series A (336 h) and 1 week in series B (168 h). For both treatments (CLB and marine diesel), the decrease of percentage of destabilization of the lysosomal membrane was measured earlier when the temperature was increased (series B).

3.2.4. EROD

Table 6 shows the EROD activity during the recovery periods in both series (A and B).
The EROD activity measured after 96 h of exposure decreased and reached the Control values during the recovery period. In series A, under all exposure conditions (WAF-CLB and WAF-Diesel), the induction of EROD enzyme activity was not significantly different from the control from 72 h of recovery. The same pattern was observed when the temperature was increased (series B) for the lobsters exposed to WAF-Diesel. However, for those exposed to WAF-CLB, these values were not significantly different from the control after 24 h of recovery.
Figure 9 shows the significant decrease of EROD activity during recovery period in series A and B for lobsters exposed to petroleum product (CLB and marine diesel).
This decrease in lobsters exposed to WAF-CLB was significant after 168 h of recovery in series A and seemed to continue to decrease, although not significantly. In series B, two significant decreases were measured, after 24 and 504 h of recovery. This pattern corresponded to the observed percentage of degraded lysosomes. For those exposed to WAF-Diesel, this decrease was significant from 168 h of recovery in series A and 72 h in series B. In the two series, the value after 3 weeks of recovery (504 h) was significantly decreased compared with that after the first week of recovery (i.e., 168 h in series A and 72 h in series B).
A decrease in EROD activity was measured earlier when the temperature was increased (series B) for lobsters exposed to WAF-CLB and WAF-Diesel compared with those in series A. However, the initial values at the end of exposure were higher in series B than in series A, but not significantly for lobsters exposed to WAF-CLB. After 1 week of recovery (168 h), the EROD activity in lobsters exposed to WAF-CLB remained constant in series B while it continued to decrease in series A.

3.3. Tainting Assay

At the end of the exposure, the lobsters exposed to petroleum products all had a hydrocarbon smell; however, the odor was stronger in lobsters exposed to WAF-Diesel. After three weeks of recovery (504 h), only lobsters exposed to WAF-Diesel still had a marked hydrocarbon odor which persisted after three months of contention at 2 °C. After cooking, this odor was even stronger. In the case of WAF-CLB lobsters, only one of the two lobsters (series B) had a slight hydrocarbon smell after cooking, especially in the hepatopancreas, even though this smell was not present before cooking.
In the fresh state, the dorsal view of the abdominal muscles showed no apparent difference in any of the treatments or series. Conversely, some variation in color was observed in the ventral view of the abdominal muscle depending on the treatment: (1) Control: dew and yellowish; (2) WAF-CLB: white; (3) WAF-Diesel: white or greenish. After cooking, only lobsters exposed to WAF-CLB in series A had a noticeable change of color of the abdominal muscles (see Figure 10c). They were slightly duller white than the lobsters of other treatments.

3.4. Chemical Analysis

Figure 11 shows the concentrations of 16 PAHs classified by the US_EPA as a priority pollutant, and 19 alkylated PAHs that were measured in different lobster tissues after 3 weeks of recovery and 3 months of live holding.
The ∑16PAHs-EPA was higher in the hepatopancreas of lobsters exposed to WAF-Diesel when compared with that in both Control and WAF-CLB treatments (Figure 11). Despite the few available sample eggs in Control lobsters, a difference in concentration was clearly demonstrated compared to eggs in lobsters exposed to WAF-Diesel. In claw and abdomen, ∑16PAHs-EPA concentrations were globally lower than in the two other tissues (Figure 11a,b). It seems that there were no significant differences between treatments, due to the high standard errors (Figure 11a). Nevertheless, lobsters exposed to WAF-CLB seemed to have higher concentration of ∑16PAHs-EPA in their abdomen, compared to those of the other treatments.
Similarly, as for ∑16PAHs-EPA, ∑19Alkylated-PAHs levels were also measured in tissues (Figure 11c,d). In claws, there did not seem to be any difference between the treatments. In the abdomen, ∑19PAH-Alkyl appeared to be higher in lobsters exposed to WAF-CLB and WAF-Diesel compared to Control. However, the standard errors were too large to confirm any significant difference. The concentrations measured in hepatopancreas and eggs were clearly higher in lobsters exposed to WAF-Diesel compared with Control as well as WAF-CLB in the hepatopancreas.
Details of ∑35Total-PAHs for each treatment are presented in Figure 12a,b, respectively in hepatopancreas and eggs.

4. Discussion

4.1. Biomarkers and Industry

Our study demonstrated that the Brix index, as a biomarker of physiological condition status, is not sensitive enough to detect the adverse effects of exposure to diluted petroleum products. Besides, in applying this biomarker, it is important to pay attention to the sex ratio, as some studies have shown differences in the Brix index values according to the sex of lobsters. Moisan et al. [40] observed lower Brix values in females than males under natural conditions without external contamination, while Battison [41] observed higher Brix values in females than males. In our study, as observed by Moisan et al. [40], the values were higher in males than females (approx. 10 mg/mL more in males). Although the Brix index was used during contamination and depuration monitoring experiments, we demonstrated that the implementation of other biomarkers is needed to support the industry in monitoring the health status of their catchments in case of dilbit or marine diesel spills. Our three selected biomarkers showed responses to contamination by petroleum products. However, only two had the appropriate sensitivity: Lysosomal stability (neutral red) and enzymatic activity (EROD). The results of our experiments showed that these can be used to characterize the impact of hydrocarbon exposure.
As hemolymph punctures are routinely performed in the industry to assess the health status and commercial value of lobsters via the Brix index, these biomarkers can be measured from the same samples. This does, however, require either sending frozen samples (−80 °C) to a laboratory, or investing in a microscope, chemical reagents and training to analyze the results. The advantage of these biomarkers is that the results can be acquired quickly. However, despite a return to the baseline values of our biomarkers, the PAH concentrations in the edible parts after 3 months in clean water were still higher than those in control lobsters.

4.2. Impact of Hydrocarbon Exposure

This study allows us to observe some of the sub-lethal biological effects of 96 h exposure to physically dispersed oils in lobsters under post-wintering conditions (i.e., 4 °C average temperature in May in the Îles-de-la-Madeleine). Two petroleum products were tested, dilbit (originating from Cold Lake Blend; denoted CLB) and classical marine diesel using the water accommodated fraction (WAF) technique. Basically, no short-term impact was observed, in terms of both survival and hemolymph protein levels, at the tested concentrations (WAF 60%). Nevertheless, the membrane stability of hemocyte lysosomes (organelles necessary for defense against xenobiotics) was strongly impacted by oil exposure. The percentage of dead cells and cells with impacted lysosomes increased drastically after 96 h of exposure to dilbit CLB and both CLB and marine diesel, respectively. Even though the Brix index indicated that lobsters were healthy before and after exposure, the complementary biomarkers clearly emphasized the detrimental impacts of CLB and marine diesel exposure at the cellular level. Despite WAF-CLB having lower concentrations of dissolved aromatic hydrocarbons compared with WAF-Diesel, the measured adverse impacts were slightly more pronounced in lobsters exposed to WAF-CLB than to WAF-Diesel, illustrating that, for identical spilled concentrations, a diluted bitumen spill would appear to be more damaging for lobsters than a marine diesel spill. It can be assumed that additional toxic compounds were present in WAF-CLB than in WAF-Diesel. However, the level of the EROD activity after 96 h of exposure is encouraging in terms of indicating effective recovery in lobsters. Furthermore, the temperature increases for the B series showed a potential to accelerate recovery during the second period of the experiment.
The effects measured on lobsters were obtained in a controlled environment, without food or sediment, and the only contamination route was from intake water. Indeed, benthic invertebrates can uptake hydrocarbons from water or sediments [11,12] or through the consumption of contaminated prey [67,68].
It is important to consider the long-term impacts of such a spill on American lobsters. Organisms contaminated by hydrocarbons produce reactive oxygen species (ROS), which results in DNA damage [69]. In seabob shrimp, it has been shown that EROD activity and DNA damage are significantly correlated as well as with benzo-[a]-pyrene (B[a]P) tissue concentrations [43]. After 96 h of exposure to 200 µg∙L−1 B[a]P, da Silva Rocha et al. [43] measured an index of DNA damage of 350 in seabob shrimps and 4 pmol min−1 mg protein−1 for activity of hepatopancreas EROD for a B[a]P tissue content of 25.6 µg∙g−1. In our study, even after three months of holding in clean water, lobsters exposed to petroleum products (CLB or marine diesel) still contained B[a]P in their hepatopancreas (respective concentrations of 230 and 231 µg/kg) at significantly higher rates than in the Control. We can, therefore, expect that the lobsters of our study may have suffered from significant DNA damage, which could cause long-term impacts.
Furthermore, the PAH concentrations measured in the WAF-Diesel lobster eggs could be of concern for the next generation, and therefore, for the long-term lobster stock. Indeed, several studies have already highlighted the genotoxicity of PAHs [43,70,71,72], which can lead to egg malformations [73] and impaired growth [72]. At the larval stage, PAH contamination can lead to early mortality [74] or malformations [73]. Fulford et al. [74] found that a concentration of 1 mg∙L−1 PAH was lethal for the first stage (zoea) of blue crab after 96 h exposure. Schmutz et al. [73] observed a delayed effect of diluted bitumen exposure on blue mussels, with major malformations for larvae exposed to unconventional oils, including Cold Lake Blend.

4.3. Recovery Capacity in Case of Hydrocarbon Exposure

Most invertebrates can depurate hydrocarbons when the concentrations in water and sediment are restored to background level or if they are placed in a clean environment [11]. Globally, according to our biomarkers, the lobsters returned to a healthy status when applying a recovery period between 1 and 2-weeks after a 96 h of exposure to petroleum products (diluted bitumen or marine diesel).
Based on our biomarker assessment, we cannot strictly conclude whether an increase in temperature improved lobsters’ recovery. In fact, we note that the percentage of non-viable cells continued to increase in the beginning of the recovery period, when submitted to a growing temperature, such as in spring conditions (series B; from 4 to 9 °C over 3 weeks). Additionally, the protein content decreased more strongly in lobsters exposed to WAF-Diesel when depurating in such conditions, thus indicating that a short exposure to marine diesel could affect the protein levels during spring. Conversely, the values for lysosomal membrane destabilization reached control values less rapidly when submitted to constant thermal conditions (4 °C), similarly to the trend of the induction of the EROD enzyme. The latter suggests a longer need for lobsters to activate biotransformation. In addition, the activation of EROD activity in our study corroborated that organisms exposed to hydrocarbons exhibit enzyme activation resulting from the production of reactive oxygen species (ROS) [69]. Phase 1 of detoxification (EROD activity) was therefore, active in all our tested conditions.

4.4. Consumption After an Oil Spill

After three months of live holding at 2 °C following a 96 h exposure to physically dispersed oil (CLB or marine diesel) and a 3 -weeks recovery period, the lobsters remained inedible. The first element was related to the lingering odor, especially in lobsters exposed to marine diesel, thus corroborating the study by Reilly and York [63], who demonstrated that even if crustaceans fished in a spill area satisfy PAH levels within the limits allowed by the human health risk assessment, the flavor or odor may still be affected. This inconvenience still persisted after cooking (boiling). Concerning lobsters exposed to dilbit CLB, no olfactory differences were noted, as in Williams et al. [75]. However, although boiling likely mitigated color variation already occurring in meat of unexposed individuals, this process seemed to reveal a distinctive smell of lobsters exposed to dilbit CLB. These results are consistent with those found in the literature. As an example, following the Amoco Cadiz spill, Michel and Abarnou [30] carried out experimental fisheries and showed that several spider crabs (Maïa eguinadci) and crabs (Cancer pagurus) had a distinct hydrocarbon taste.
During laboratory exposure to light oils (North Sea or Arabian crude oil), studies have reported minimum oil compound concentrations in fish tissues that were determined to be tainted by sensory testing as 5 to 100 ppm [76,77,78]. After the Braer spill (spilling 85,000 t of Norwegian Gullfaks light crude oil), taint was readily perceived in caged salmon if the PAH concentration in the flesh was 1 ppm or greater [78]. In our study, the concentration of ∑16 PAHs-EPA in WAF-Diesel lobsters was 0.3 ± 0.1 ppm in the abdomen and 0.2 ± 0.06 ppm in the claws. Regarding WAF-CLB lobsters, despite having higher ∑16 PAHs-EPA concentrations in the abdomen and claws than WAF-Diesel lobsters, they did not exhibit an odor until being cooked.
The second aspect concerns the high levels of PAHs remaining in lobster tissues, including in the hepatopancreas, abdomen, and eggs, even after 3 months of live holding. Indeed, during consumption, PAHs can participate actively in metabolic activation in mammalian cells. Diol epoxies adhere to genetic material and tissues, causing mutations [79]. PAHs in foods are suggested to be one of the major contributors to skin and lung cancers [80,81,82,83]. In Canada, there is no contamination threshold for seafood, including lobster [84]. However, in France, a guide value for ∑16 PAHs-EPA is 100 µg/kg of dry weight in crustaceans as a guideline contamination value. The exclusion thresholds are 2 to 5 times greater than the guide value. During the Erika oil spill in 1999 and the Prestige spill at the end of 2002, the exclusion thresholds for crustaceans were 500 µg/kg for ∑16 PAHs-EPA [85]. In the present study, even with low statistical power, our exploratory chemical results showed a difference between contaminated lobsters and controls. The abdomen of lobsters contaminated by dilbit CLB and marine diesel were, respectively 5 and 3 times greater than the control values, and superior than the lowest exclusion threshold proposed by France (200 µg/kg), despite 3 months of holding in clean water. These data indicate the need for further research on the concentrations found in lobster tissue following a dilbit or diesel spill.

5. Conclusions

The objective of the study was to monitor four biomarkers on lobster hemolymph to assess impact and recovery capacity to diluted bitumen (CLB) and marine diesel. Our results show that the Brix index used by the lobster fishery is not relevant in the case of CLB or marine diesel exposure, so it is necessary to work with other biomarkers. Selected biomarkers tested in complement to the measurement of the Brix index allowed for monitoring the health status of hemocytes as a proxy to visualize the impacts of CLB and marine diesel exposure on the American lobster, as well as to follow the recovery efficiency. Despite a higher measured PTSA equivalent concentration in WAF-Diesel compared to WAF-CLB, the biomarkers did not show any difference between the two petroleum products, except in terms of cell viability, which was more impacted by CLB. However, the persistent odor and the PAH levels induced by a marine diesel exposure would be more damageable for the fisheries than lobsters exposed to CLB.
Lobster recovery following WAF exposure (to CLB and marine diesel) was observed over 3 weeks using 2 biomarkers—NRR and EROD—for assessment as well as one more for CLB exposure—cellular viability. According to these biomarkers, lobsters were able to recover in less than 3 weeks in clean water. However, even after 3 months of contention, lobsters still had high concentrations of PAHs, especially for those exposed to marine diesel. The effectiveness of an increase in temperature in improving recovery could not be confirmed by our study. Indeed, the NRR values reached the Control values more quickly with an increase in temperature, while the reverse was observed for the cellular viability.
In order to improve the monitoring of PAH concentrations in lobsters, it would be interesting to attempt to quantify these contaminants directly in the hemolymph, as proposed in the study of Turnbull [67] for paralytic shellfish toxins. Furthermore, monitoring of PAHs in lobsters in parallel with the biomarkers may represent a better strategy for monitoring recovery efficiency.
Further, to better assess the long-term impacts of a spill, it would be interesting to measure DNA damage; for example, by comet assay [86]. Finally, the PAH concentrations observed in lobster eggs suggest serious potential transgenerational effects which could severely impair the health of subsequent generations.

Author Contributions

Conceptualization, C.B., M.-H.B.-D., J.-F.L., N.L., N.T., and R.S.-L.; methodology, C.B., M.-H.B.-D., J.-F.L., N.L., N.T., and R.S.-L.; validation, N.T., and R.S.-L.; formal analysis, C.B., N.T., and R.S.-L.; investigation, C.B.; resources, C.B., M.N., N.T., and R.S.-L.; data curation, C.B., N.T., and R.S.-L.; writing—original draft preparation, C.B.; writing—review and editing, C.B., J.-F.L., N.L., M.N., N.T., G.T.-B., and R.S.-L.; visualization, C.B.; supervision, J.-F.L., N.T., G.T.-B., and R.S.-L.; project administration, C.B., N.T., and R.S.-L.; funding acquisition, C.B., N.L, N.T., and R.S.-L.; All authors have read and agreed to the published version of the manuscript.

Funding

This research was funded by Mitacs Accelerate and Fonds d’amorçage de partenariat (FAP) UQAR-Merinov and by Centre d’expertise en gestion des risques d’incidents maritimes (CEGRIM). This is a contribution to the research programs of EcotoQ.

Institutional Review Board Statement

According to the Canadian Council on Animal Care guidelines [http://www.ccac.ca], accessed on 1 July 2020, the Animal Care Committee of the University does not require an approved animal care protocol or certificate for research involving invertebrates, except Cephalopods.

Informed Consent Statement

Not applicable.

Acknowledgments

We thank the staff of Merinov particularly the technical staff for their help in the experiments: Francine Aucoin, Stephanie Arnold, Yvon Chevarie, Michelle Langford, Claude Poirier and Valerie Poirier. We thank Amy McMackin for the tissue chemical analysis.

Conflicts of Interest

The authors declare no conflict of interest. The funders had no role in the design of the study; in the collection, analyses, or interpretation of data; in the writing of the manuscript, or in the decision to publish the results.

References

  1. Department of Fisheries and Oceans. Seafisheries Landed Quantity by Region. 2017. Available online: https://www.dfo-mpo.gc.ca/stats/commercial/land-debarq/sea-maritimes/s2017aq-eng.htm (accessed on 1 September 2020).
  2. Fishwatch, U.S. American Lobster Homarus Americanus. Available online: https://www.fishwatch.gov/profiles/american-lobster (accessed on 1 September 2020).
  3. Department of Fisheries and Oceans. Seafisheries Landed Value by Region. 2018. Available online: http://dfo-mpo.gc.ca/stats/commercial/land-debarq/sea-maritimes/s2018av-eng.htm (accessed on 1 September 2020).
  4. Natural Resources Canada. Crude Oil Facts. Available online: https://www.nrcan.gc.ca/science-data/data-analysis/energy-data-analysis/energy-facts/crude-oil-facts/20064 (accessed on 1 September 2020).
  5. Natural Resources Canada. Petroleum Products Facts. Available online: https://www.nrcan.gc.ca/science-data/data-analysis/energy-data-analysis/energy-facts/petroleum-products-facts/20065 (accessed on 1 September 2020).
  6. U.S. Energy Information Administration (EIA). Annual Energy Outlook 2012: With Projections to 2035; EIA-US, Government Printing Office: Washington, DC, USA, 2012.
  7. Lee, K.; Boufadel, M.; Chen, B.; Foght, J.; Hodson, P.; Swanson, S.; Venosa, A. Expert Panel Report on the Behaviour and Environmental Impacts of Crude Oil Released into Aqueous Environments; Royal Society of Canada: Ottawa, ON, Canada, 2015; ISBN 978-1-928140-02-3. [Google Scholar]
  8. Marty, J.; Potter, S. Risk Assessment for Marine Spills in Canadian Waters, Phase 1: Oil Spills South of the 60th Parallel; WSP: Montreal, QC, Canada, 2014; p. 172. [Google Scholar]
  9. O’Sullivan, A. The Amoco Cadiz oil spill. Mar. Pollut. Bull. 1978, 9, 123–128. [Google Scholar] [CrossRef]
  10. Liu, Z.; Liu, J.; Zhu, Q.; Wu, W. The weathering of oil after the Deepwater Horizon oil spill: Insights from the chemical composition of the oil from the sea surface, salt marshes and sediments. Environ. Res. Lett. 2012, 7, 035302. [Google Scholar] [CrossRef] [Green Version]
  11. Michel, J.; Fingas, M. Oil Spills: Causes, Consequences, Prevention, and Countermeasures. In Fossil Fuels; World Scientific Series in Current Energy Issues; Gerard M Crawley, Marcus Enterprise LLC, USA & University of South Carolina: Columbia, SC, USA, 2016; Volume 1, pp. 159–201. [Google Scholar]
  12. Rumney, H.S.; Laruelle, F.; Potter, K.; Mellor, P.K.; Law, R.J. Polycyclic aromatic hydrocarbons in commercial fish and lobsters from the coastal waters of Madagascar following an oil spill in August 2009. Mar. Pollut. Bull. 2011, 62, 2859–2862. [Google Scholar] [CrossRef] [PubMed]
  13. Kingston, P. Recovery of the marine environment following the Braer spill, Shetland. In Proceedings of the International Oil Spill Conference, Seattle, WA, USA, 8–11 March 1999; pp. 103–109. [Google Scholar]
  14. Law, R.J.; Kelly, C.; Baker, K.; Jones, J.; McIntosh, A.D.; Moffat, C.F. Toxic equivalency factors for PAH and their applicability in shellfish pollution monitoring studies. J. Environ. Monit. 2002, 4, 383–388. [Google Scholar] [CrossRef] [PubMed]
  15. Williams, U.P.; Kiceniuk, J.W.; Fancey, L.L.; Botta, J.R. Tainting and Depuration of Taint by Lobsters (Homarus americanus) Exposed to water Contaminated with a No. 2 Fuel Oil: Relationship with Aromatic Hydrocarbon Content in Tissue. J. Food Sci. 1989, 54, 240–243. [Google Scholar] [CrossRef]
  16. Sánchez, F.; Velasco, F.; Cartes, J.; Olaso, I.; Preciado, I.; Fanelli, E.; Serrano, A.; Gutierrez-Zabala, J. Monitoring the Prestige oil spill impacts on some key species of the Northern Iberian shelf. Mar. Pollut. Bull. 2006, 53, 332–349. [Google Scholar] [CrossRef] [PubMed]
  17. Spaulding, M.L. Recent spill experiences: The North Cape spill. Presented at the Arctic and Marine Oil Spill Program Technical Seminar (AMOP), Calgary, AB, Canada, 12–14 June 1996. [Google Scholar]
  18. Cobb, J.S.; Clancy, M. North Cape Oil Spill: An Assessment of the Impact on Lobster Populations; University of Rhode Island: Kingston, RI, USA, 5 January 1998; p. 205. [Google Scholar]
  19. Cobb, J.S.; Clancy, M.; Wähle, R.A. Habitat-based assessment of lobster abundance: A case study of an oil spill. Am. Fish. Soc. 1999, 22, 285–298. [Google Scholar]
  20. French, D.P. North Cape Oil Spill: Synthesis of Injury Quantification and Restoration Scaling for Lobsters; Report to NOAA Damage Assessment Center: Silver Spring, MD, USA, 1999; p. 21. [Google Scholar]
  21. Gibson, M.R.; Angell, T.E.; Lazar, N.B. Estimation of Lobster Strandings Following the North Cape Oil Spill in Block Island Sound. Research Reference Document 97/1. Available online: https://www.ser-rrc.org/project/usa-rhode-island-the-north-cape-american-lobster-homarus-americanus-restoration-project-block-island-sound/ (accessed on 1 July 2020).
  22. Felder, D.L.; Thoma, B.P.; Schmidt, W.E.; Sauvage, T.; Self-Krayesky, S.L.; Chistoserdov, A.; Bracken-Grissom, H.D.; Fredericq, S. Seaweeds and Decapod Crustaceans on Gulf Deep Banks after the Macondo Oil Spill. Bioscience 2014, 64, 808–819. [Google Scholar] [CrossRef] [Green Version]
  23. Atema, J.; Stein, L. Sublethal Effects of Crude Oil on Lobster (Homarus Americanus) Behavior; Tech. Rep. WHOI-72-74; Oceanographic Institution: Woods Hole, MA, USA, 1972; 81p. [Google Scholar]
  24. Atema, J.; Stein, L.S. Effects of crude oil on the feeding behaviour of the lobster Homarus Americanus. Environ. Pollut. (1970) 1974, 6, 77–86. [Google Scholar] [CrossRef]
  25. Biedron, I.; Evans, S. Time for Action: Six Years after Deepwater Horizon; OCEANA: Washington, DC, USA, 2016; Available online: https://usa.oceana.org/publications/reports/time-action-six-years-after-deepwater-horizon (accessed on 1 September 2020).
  26. Blumer, M.; Hunt, J.M.; Atema, J.; Stein, L. Interaction between Marine Organisms and Oil Pollution; USEPA Ecological Research Series R3-73-042; United States Environmental Protection Agency: Washington, DC, USA, May 1973.
  27. Richardson, C. Effects of drilling cuttings on the behaviour of the Norway lobster Nephrops norvegicus. Mar. Pollut. Bull. 1984, 15, 170–174. [Google Scholar] [CrossRef]
  28. Webby, A.; Ling, N. Acute sublethal toxicity of MV Rena contaminants (heavy fuel oil, oil dispersant and cryolite) to finfish and rock lobster. N. Z. J. Mar. Freshw. Res. 2016, 50, 144–158. [Google Scholar] [CrossRef]
  29. Payne, J.F.; Kiceniuk, J.; Misra, R.; Fletcher, G.; Thompson, R. Sublethal effects of petroleum hydrocarbons on adult American lobsters (Homarus americanus). Can. J. Fish. Aquat. Sci. 1983, 40, 705–717. [Google Scholar] [CrossRef]
  30. Michel, P.; Abarnou, J.L. Amoco Cadiz: Informations sur la Contamination des Espèces Exploitées; Centre National pour l’Exploitation des Oceans (CNEXO). Serie: Actes de Colloques, n°6. 1978, pp. 143–150. Available online: https://archimer.ifremer.fr/doc/00306/41724/ (accessed on 1 September 2020).
  31. Lagadic, L.; Caquet, T.; Amiard, J.C.; Ramade, F. Biomarqueurs en Écotoxicologie: Principes et définitions. In Biomarqueurs en Écotoxicologie: Aspects Fondamentaux; Elsevier Masson: Paris, France, 1997; pp. 1–9. [Google Scholar]
  32. McDonald, S.J.; Willett, K.L.; Thomsen, J.; Beatty, K.B.; Connor, K.; Narasimhan, T.R.; Erickson, C.M.; Safe, S.H. Sublethal detoxification responses to contaminant exposure associated with offshore production platforms. Can. J. Fish. Aquat. Sci. 1996, 53, 2606–2617. [Google Scholar] [CrossRef]
  33. Fournier, M.; Brousseau, P.; Tryphonas, S.; Cyr, D. Biomarkers of immunotoxicity: An evolutionary perspective. In Environmental Endocrine Disruptors: An Evolutionary Perspective; Taylor & Francis Group: Abingdon, UK, 2000; pp. 182–216. [Google Scholar]
  34. Callaway, R.; Shinn, A.P.; Grenfell, S.E.; Bron, J.E.; Burnell, G.; Cook, E.J.; Crumlish, M.; Culloty, S.; Davidson, K.; Ellis, R.P.; et al. Review of climate change impacts on marine aquaculture in the UK and Ireland. Aquat. Conserv. Mar. Freshw. Ecosyst. 2012, 22, 389–421. [Google Scholar] [CrossRef]
  35. Simon, C.J.; FitzGibbon, Q.P.; Battison, A.; Carter, C.G.; Battaglene, S.C. Bioenergetics of Nutrient Reserves and Metabolism in Spiny Lobster Juveniles Sagmariasus verreauxi: Predicting Nutritional Condition from Hemolymph Biochemistry. Physiol. Biochem. Zool. 2015, 88, 266–283. [Google Scholar] [CrossRef] [PubMed]
  36. Mendo, T.; Simon, C.; Green, B.; Gardner, C. Spatial Variability in Condition of Southern Rock Lobsters (Jasus edwardsii) at the Start of the Tasmanian Fishing Season. PLoS ONE 2016, 11. [Google Scholar] [CrossRef] [PubMed]
  37. Ozbay, G.; Riley, J.G. An analysis of refractometry as a method of determining blood total protein concentration in the American lobster Homarus americanus (Milne Edwards). Aquac. Res. 2002, 33, 557–562. [Google Scholar] [CrossRef]
  38. Paterson, B.D.; Davidson, G.W.; Spanoghe, P.T. Measuring total protein concentration in the blood of the western rock lobster (Panulirus cygnus George) by refractometry. In Proceedings of the International Symposium on Lobster Health Management, Adelaide, Australia, 19–21 September 1999. [Google Scholar]
  39. Lorenzon, S.; Giulianini, P.G.; Martinis, M.; Ferrero, E.A. Stress effect of different temperatures and air exposure during transport on physiological profiles in the American lobster Homarus americanus. Comp. Biochem. Physiol. Part A Mol. Integr. Physiol. 2007, 147, 94–102. [Google Scholar] [CrossRef]
  40. Moisan, N.; Cauvier, C.; Coulombe, F. Conservation Prolongée du Homard. MAPAQ, DIT. Rapport de R-D, n°171. 2008, p. 8. Available online: http://www.mapaq.gouv.qc.ca/Fr/Peche/md/Publications/ (accessed on 1 September 2020).
  41. Battison, A.L. Use of the Brix value with cuticle indices to describe haemolymph biochemistry parameters in Homarus americanus H. Milne Edwards, 1837 (Decapoda: Malacostraca: Nephropidae). J. Crustac. Biol. 2018, 38, 625–634. [Google Scholar] [CrossRef]
  42. Martínez-Gómez, C.; Bignell, J.; Lowe, D. Lysosomal Membrane Stability in Mussels; ICES Techniques in Marine Environmental Sciences; International Council for the Exploration of the Sea (ICES): Copenhagen, Denmark, 2015; pp. 1–41. ISBN 9788774821. [Google Scholar]
  43. Rocha, A.J.D.S.; Gomes, V.; Passos, M.J.D.A.C.R.; Hasue, F.M.; Santos, T.D.C.A.D.; Bícego, M.C.; Taniguchi, S.; Van Ngan, P. EROD activity and genotoxicity in the seabob shrimp Xiphopenaeus kroyeri exposed to benzo[a]pyrene (BaP) concentrations. Environ. Toxicol. Pharmacol. 2012, 34, 995–1003. [Google Scholar] [CrossRef] [PubMed]
  44. Centre d’Expertise en Analyse Environnementale du Québec. Impact Chronique Associé aux Activités Régulières d’une Plate-Forme Pétrolière Pour les Écosystèmes Aquatiques du Golfe du Saint-Laurent, Étude GENV25, Évaluation Environnementale Stratégique Globale sur les Hydrocarbures; Ministère du Développement Durable, de l’Environnement et de la Lutte Contre les Changements Climatiques: Québec, QC, Canada, 2015; p. 75. [Google Scholar]
  45. Rewitz, K.F.; Styrishave, B.; Løbner-Olesen, A.; Andersen, O. Marine invertebrate cytochrome P450: Emerging insights from vertebrate and insect analogies. Comp. Biochem. Physiol. Part C Toxicol. Pharmacol. 2006, 143, 363–381. [Google Scholar] [CrossRef] [PubMed]
  46. Livingstone, D. The fate of organic xenobiotics in aquatic ecosystems: Quantitative and qualitative differences in biotransformation by invertebrates and fish. Comp. Biochem. Physiol. Part A Mol. Integr. Physiol. 1998, 120, 43–49. [Google Scholar] [CrossRef]
  47. Rewitz, K.; Styrishave, B.; Andersen, O. CYP330A1 and CYP4C39 enzymes in the shore crab Carcinus maenas: Sequence and expression regulation by ecdysteroids and xenobiotics. Biochem. Biophys. Res. Commun. 2003, 310, 252–260. [Google Scholar] [CrossRef] [PubMed]
  48. Monari, M.; Foschi, J.; Matozzo, V.; Marin, M.; Fabbri, M.; Rosmini, R.; Serrazanetti, G. Investigation of EROD, CYP1A immunopositive proteins and SOD in haemocytes of Chamelea gallina and their role in response to B[a]P. Comp. Biochem. Physiol. Part C Toxicol. Pharmacol. 2009, 149, 382–392. [Google Scholar] [CrossRef]
  49. Little, P.J.; James, M.O.; Pritchard, J.B.; Bend, J.R. Temperature-dependent disposition of [14C]benzo(a)pyrene in the spiny lobster, Panulirus argus. Toxicol. Appl. Pharmacol. 1985, 77, 325–333. [Google Scholar] [CrossRef]
  50. Crude Monitor. Cold Lake. Available online: https://www.crudemonitor.ca/crudes/index.php?acr=CL&PHPSESSID=32b25d47a44bfecd3f6c8c5b9ff (accessed on 1 November 2020).
  51. Singer, M.; Aurand, D.; Bragin, G.; Clark, J.; Coelho, G.; Sowby, M.; Tjeerdema, R. Standardization of the Preparation and Quantitation of Water-accommodated Fractions of Petroleum for Toxicity Testing. Mar. Pollut. Bull. 2000, 40, 1007–1016. [Google Scholar] [CrossRef]
  52. Barron, M.G.; Ka’Aihue, L. Critical evaluation of CROSERF test methods for oil dispersant toxicity testing under subarctic conditions. Mar. Pollut. Bull. 2003, 46, 1191–1199. [Google Scholar] [CrossRef]
  53. Payne, S.J.; King, C.K.; Zamora, L.M.; Virtue, P. Temporal changes in the sensitivity of coastal Antarctic zooplankton communities to diesel fuel: A comparison between single- and multi-species toxicity tests. Environ. Toxicol. Chem. 2014, 33, 882–890. [Google Scholar] [CrossRef]
  54. Conmy, R.N.; Coble, P.G.; Farr, J.; Wood, A.M.; Lee, K.; Pegau, W.S.; Walsh, I.D.; Koch, C.R.; Abercrombie, M.I.; Miles, M.S.; et al. Submersible Optical Sensors Exposed to Chemically Dispersed Crude Oil: Wave Tank Simulations for Improved Oil Spill Monitoring. Environ. Sci. Technol. 2014, 48, 1803–1810. [Google Scholar] [CrossRef] [PubMed]
  55. Hwang, J.; Bose, N.; Robinson, B.; Nguyen, H.D. Assessing hydrocarbon presence in the waters of port au port bay, newfoundland and labrador, for AUV oil spill delineation tests. J. Ocean Technol. 2020, 15, 102–112. [Google Scholar]
  56. Young-Lai, W.W.; Charmantier-Daures, M.; Charmantier, G. Effect of ammonia on survival and osmoregulation in different life stages of the lobsterHomarus americanus. Mar. Biol. 1991, 110, 293–300. [Google Scholar] [CrossRef]
  57. Leavitt, D.F.; Bayer, R.C. A refractometric method of determining serum protein concentration in the American lobster. Aquaculture 1977, 12, 169–171. [Google Scholar] [CrossRef]
  58. Song, L.; Li, X.; Clarke, S.; Wang, T.; Bott, K. The application of neutral red retention assay to evaluate the differences in stress responses to sexual maturation and spawning between different sizes of Pacific oyster, Crassostrea gigas (Thunberg). J. Shellfish Res. 2007, 26, 493–499. [Google Scholar] [CrossRef]
  59. Small, H.; Shields, J.; Neil, D.; Taylor, A.; Coombs, G. Differences in enzyme activities between two species of Hematodinium, parasitic dinoflagellates of crustaceans. J. Invertebr. Pathol. 2007, 94, 175–183. [Google Scholar] [CrossRef] [PubMed]
  60. Burgeot, T.; Ménard, D. Mesure de L’activité Enzymatique: Éthoxyresorutine-o-Dééthylase (EROD) chez les Poissons Marins; Quae: Versailles, France, 2004. [Google Scholar]
  61. Bradford, M.M. A rapid and sensitive method for the quantitation of microgram quantities of protein utilizing the principle of protein-dye binding. Anal. Biochem. 1976, 72, 248–254. [Google Scholar] [CrossRef]
  62. International Standards Organization. ISO5492:1992 Sensory Analysis–Vocabulary; International Organization for Standardization: Geneva, Switzerland, 1992. [Google Scholar]
  63. Reilly, T.; York, R.K. Guidance on Sensory Testing and Monitoring of Seafood for Presence of Petroleum Taint Following an Oil Spill. In Proceedings of the International Research Workshop on the Occurrence, Effects, and Fate of Microplastic Marine Debris; N.O.A.A.; Technical Memorandum NOS OR&R 9; National Oceanic and Atmospheric Administration: Seattle, WA, USA, August 2001. [Google Scholar]
  64. United States Environmental Protection Agency (US-EPA). Polynuclear Hydrocarbons; US-EPA: Washington, DC, USA, 1984; Volume 10.
  65. R Core Development Team. A Language and Environment for Statistical Computing. Available online: http://www.R-project.org (accessed on 6 January 2020).
  66. McCay, D.F. Development and application of damage assessment modeling: Example assessment for the North Cape oil spill. Mar. Pollut. Bull. 2003, 47, 341–359. [Google Scholar] [CrossRef]
  67. Turnbull, A.; Malhi, N.; Seger, A.; Harwood, T.; Jolley, J.; Fitzgibbon, Q.; Hallegraeff, G. Paralytic shellfish toxin uptake, tissue distribution, and depuration in the Southern Rock Lobster Jasus edwardsii Hutton. Harmful Algae 2020, 95, 101818. [Google Scholar] [CrossRef]
  68. Yender, R.; Michel, J.; Lord, C. Managing Seafood Safety after an Oil Spill; Hazardous Materials Response Division, Office of Response and Restoration, National Oceanic and Atmospheric Administration: Seattle, WA, USA, 2010; p. 72. [Google Scholar]
  69. Ross, D. Antioxidant defence systems and oxydative stress. In Membrane Lipid Oxidation 2; CRC Press: Abingdon, UK, 1991; pp. 151–170. [Google Scholar]
  70. Barron, M.G.; Conmy, R.N.; Holder, E.L.; Meyer, P.; Wilson, G.J.; Principe, V.E.; Willming, M.M. Toxicity of Cold Lake Blend and Western Canadian Select dilbits to standard aquatic test species. Chemosphere 2018, 191, 1–6. [Google Scholar] [CrossRef] [PubMed]
  71. Rocha, A.J.D.S.; Santos, T.C.A.; Gomes, V.; Bícego, M.C.; Barbosa, A.C.R.D.A.; Passos, M.J.D.A.C.R.; Hasue, F.M.; Van Ngan, P. Assessment of trophic transfer of benzo(a)pyrene genotoxicity from the post-larval pink shrimp F. brasiliensis to the juvenile Florida pompano T. carolinus. Environ. Toxicol. Pharmacol. 2012, 34, 969–976. [Google Scholar] [CrossRef] [PubMed]
  72. Yazdani, M. Comparative toxicity of selected PAHs in rainbow trout hepatocytes: Genotoxicity, oxidative stress and cytotoxicity. Drug Chem. Toxicol. 2018, 43, 71–78. [Google Scholar] [CrossRef] [PubMed]
  73. Schmutz, A.; Tremblay, R.; Audet, C.; Gagné, J.-P.; Pelletier, É.; St-Louis, R. Under ice spills of conventional crude oil and diluted bitumen: Physiological resilience of the blue mussel and transgenerational effects. Sci. Total Environ. 2021, 779, 146316. [Google Scholar] [CrossRef]
  74. Fulford, R.S.; Griffit, R.J.; Brown-Peterson, N.J.; Perry, H.; Sanchez-Rubio, G. Impacts of the Deepwater Horizon oil spill on blue crab, Callinectes sapidus, larval settlement in Mississippi. In Impacts of Oil Spill Disasters on Marine Habitats and Fisheries in North America; Brian Alford, M.S.P.J., Christopher, C.G., Eds.; CRC Press: Abingdon, UK, 2014; p. 253. [Google Scholar]
  75. Williams, U.P.; Kiceniuk, J.W.; Ryder, J.E.; Botta, J.R. Effects of an Oil Spill on American Lobster Homarus Americanus from Placentia Bay, Newfoundland. Available online: https://antoanmoitruong.com/wp-content/uploads/2018/03/Effects-of-an-oil-spill-on-American-lobster-Homarus-americanus-from-Placentia-Bay-Newfoundland.pdf (accessed on 1 October 2020).
  76. Heras, H.; Zhou, S.; Ackman, R.G. Uptake and Depuration of Petroleum Hydrocarbons by Atlantic Salmon: Effect of Different Lipid Levels. In Proceedings of the Sixteenth Arctic and Marine Oil Spill Program (AMOP) Technical Seminar, Calgary, Alberta, 1 October 1997; pp. 343–351. [Google Scholar]
  77. Howgate, P.; Mackie, P.; Whittle, K.; Farmer, J. Petroleum tainting in fish. In Rapports et Procès-Verbaux des Réunions; International Council for the Exploration of the Sea: Copenhagen, Denmark, 1977; pp. 143–146. [Google Scholar]
  78. Motohiro, T.; Iseya, Z. Effects of water polluted by oil on aquatic organisms. II. n-paraffins, aromatic hydrocarbons and crude oil concentration on taint in scallop (Pecten yessoensis). Bull. Fish. Sci. Hokkaido Univ. 1976, 26, 367–371. [Google Scholar]
  79. Phillips, D.H. Polycyclic aromatic hydrocarbons in the diet. Mutat. Res. Toxicol. Environ. Mutagen. 1999, 443, 139–147. [Google Scholar] [CrossRef]
  80. Kameda, Y.; Shirai, J.; Komai, T.; Nakanishi, J.; Masunaga, S. Atmospheric polycyclic aromatic hydrocarbons: Size distribution, estimation of their risk and their depositions to the human respiratory tract. Sci. Total Environ. 2005, 340, 71–80. [Google Scholar] [CrossRef] [PubMed]
  81. Lee, B.M.; Shim, G.A. Dietary Exposure Estimation of Benzo[a]pyrene and Cancer Risk Assessment. J. Toxicol. Environ. Health Part A 2007, 70, 1391–1394. [Google Scholar] [CrossRef] [PubMed]
  82. Yoon, E.; Park, K.; Lee, H.; Yang, J.-H.; Lee, C. Estimation of Excess Cancer Risk on Time-Weighted Lifetime Average Daily Intake of PAHs from Food Ingestion. Hum. Ecol. Risk Assess. Int. J. 2007, 13, 669–680. [Google Scholar] [CrossRef]
  83. Zhang, Y.; Tao, S.; Shen, H.; Ma, J. Inhalation exposure to ambient polycyclic aromatic hydrocarbons and lung cancer risk of Chinese population. Proc. Natl. Acad. Sci. USA 2009, 106, 21063–21067. [Google Scholar] [CrossRef] [Green Version]
  84. Government of Canada. Health Canada’s Maximum Levels for Chemical Contaminants in Foods. Available online: https://www.canada.ca/en/health-canada/services/food-nutrition/food-safety/chemical-contaminants/maximum-levels-chemical-contaminants-foods.html#shr-pg0 (accessed on 1 December 2020).
  85. Agence Française de Sécurité Sanitaire des Aliments (AFSSA). Avis de l’Agence Française de Sécurité Sanitaire des Aliments Relatif à L’évaluation des Risques Sanitaires qui Pourraient Résulter de la Contamination des Produits de la mer Destinés à la Consommation Humaine, Suite au Naufrage du Pétrolier Prestige. n° 2003-SA-0007. 2003, pp. 1–6. Available online: https://www.com/DOCS/DOC79.pdf (accessed on 1 September 2020).
  86. Chao, C.; Engelward, B.P. Applications of CometChip for Environmental Health Studies. Chem. Res. Toxicol. 2020, 33, 1528–1538. [Google Scholar] [CrossRef] [PubMed]
Figure 1. Scheme of 15-liters exposure tank.
Jmse 09 00370 g001
Figure 2. Hydrocarbon concentrations in each treatment (Control, WAF-CLB, and WAF-Diesel), measured by fluorescence (Cyclops-7) and expressed in PTSA equivalent (µg/L) before (0 h) and after 96 h of exposure. Series A and B are combined. Mean ± SE; n = 6. The letter symbols indicate a significant (p < 0.05) effect between time and treatment.
Jmse 09 00370 g002
Figure 3. Total protein content (TP; mg/mL) in hemolymph, as calculated from measurements of the Brix index, of lobsters for each treatment (Control, WAF-CLB, and WAF-Diesel) before (0 h) and after 96 h of exposure. Series A and B are combined. Mean ± SE; n = 6.
Jmse 09 00370 g003
Figure 4. Fractions of nonviable lobster’ hemocyte cells for each treatment (Control, WAF-CLB, and WAF-Diesel) before (0 h) and after 96 h of exposure. Series A and B are combined; Mean ± SE; n = 6. The letter symbols indicate a significant (p < 0.05) effect between time and treatment.
Jmse 09 00370 g004
Figure 5. Fraction of lysosomal membrane destabilization (LDI) in lobster’ hemocyte cells for each Table 2 0 h of exposure. Series A and B are combined; Mean ± SE; n = 6. The letter symbols indicate a significant (p < 0.05) effect between time and treatment.
Jmse 09 00370 g005
Figure 6. Total protein content (TP; mg/mL) in hemolymph, as calculated from measurements of the Brix index, of lobsters exposed to WAF-CLB and WAF-Diesel during the recovery period in series A and B. Mean ± SE; n = 3. The letter symbols indicate a significant (p < 0.05) effect between time and series.
Jmse 09 00370 g006
Figure 7. Fractions of nonviable lobster’ hemocyte cells for WAF-CLB treatment during the recovery period in series A and B. Mean ± SE; n = 3. The letter symbols indicate a significant (p < 0.05) effect between time and series.
Jmse 09 00370 g007
Figure 8. Fraction of lysosomal membrane destabilization (LDI) in lobster’ hemocyte cells for WAF-CLB and WAF-Diesel treatments during the recovery period in series A and B. Mean ± SE; n = 3. The letter symbols indicate a significant (p < 0.05) effect between time and series.
Jmse 09 00370 g008
Figure 9. EROD activity in lobster hemolymph for WAF-CLB and WAF-Diesel treatments during the recovery period in series A and B. Mean ± SE; n = 3. The letter symbols indicate a significant (p < 0.05) effect between time and series.
Jmse 09 00370 g009
Figure 10. Dorsal view of abdomen muscle after cooking of (a) Control during series A; (b) Control during series B; (c) WAF-CLB during series A; (d) WAF-CLB during series B; (e) WAF-Diesel during series A; and (f) WAF-Diesel during series B.
Jmse 09 00370 g010
Figure 11.16PAHs-EPA and ∑19Alkylated-PAHs measured in claw and abdomen (a,c, respectively) and hepatopancreas and eggs (b,d, respectively) for each treatment. Mean ± SE; n = 2, except for eggs in Control (n = 1) and WAF-CLB (n = 0).
Jmse 09 00370 g011
Figure 12.35Total-PAHs (µg/kg) measured in (a) hepatopancreas and (b) eggs of lobsters under each treatment (Control, WAF-CLB, and WAF-Diesel). ∑16PAHs-EPA: N: Naphthalene; A: Acenaphthylene; Ac: Acenaphthene; F: Fluorene; Ph: Phenanthrene; An: Anthracene; Fl: Fluoranthene; P: Pyrene; B[a]A: Benzo[a]anthracene; C: Chrysene; B[b]Fl: Benzo[b]fluoranthene; B[k]Fl: Benzo[k]fluoranthene; B[a]P: Benzo[a]pyrene; I[1,2,3-cd]P: Indeno[1,2,3-cd]pyrene; Di[ah]An: Dibenzo[ah]anthracene; B[hgi]Pe: Benzo[ghi]perylene. ∑19Alkylated-PAHs: 1-MN: 1-Methylnaphthalene; 2-MN: 2-Methylnaphthalene; 2,6-dMN: 2,6-Dimethylnaphthalene; dMN-B: Dimethylnaphthalene B; dMN-C: Dimethylnaphthalene C; 2,3,5-tMN: 2,3,5-Trimethylnaphthalene; tMN-B: Trimethylnaphthalene B; 1-MPh: 1-Methylphenanthrene; 2-MPh: 2-Methylphenanthrene; 3-MPh: 3-Methylphenanthrene; 9-MPh: 9-Methylphenanthrene; 3,6-dMPh: 3,6-Dimethylphenanthrene; dMPh-B: Dimethylphenanthrene B; dMPh-C: Dimethylphenanthrene C; dMPh-D: Dimethylphenanthrene D; dMPh-E: Dimethylphenanthrene E; dMPh-F: Dimethylphenanthrene F; dMPh-G: Dimethylphenanthrene G; 9,10-dMAn: 9,10-Dimethylanthracene.
Jmse 09 00370 g012
Table 1. Properties of Cold Lake Blend and marine diesel used in the assays. Data from [50].
Cold Lake Blend (CLB)Marine Diesel
OriginAlbertaNew Brunswick
API (degree API)20.935
Density at 15 °C (g/mL)0.92490.84
Viscosity at 15 °C (c P)2852
Nickel (ppm)65N/A
Vanadium (ppm)168N/A
Saturated hydrocarbons (%)4565–95
Aromatic hydrocarbons (%)305–25
Table 2. EROD activity in lobster hemolymph and associated induction rates for each treatment (Control, WAF-CLB, and WAF-Diesel) before (0 h) and after 96 h of exposure. Series A and B are combined. Mean ± SE; n = 6.
TreatmentEROD ActivityInduction Rate
0 h96 h
Control5.8 ± 0.3 b5.5 ± 0.3 b0
WAF-CLB6.2 ± 0.6 b12.3 ± 1.1 a2
WAF-Diesel5.9 ± 0.2 b14.0 ± 0.9 a2.4
The letter symbols indicate a significant (p < 0.05) effect between time and treatment.
Table 3. Total protein content (mg/mL) in hemolymph, as calculated from measurements of the Brix index, of lobsters for each treatment (Control, WAF-CLB, and WAF-Diesel) during the recovery period in series A and B. Mean ± SE; n = 3.
TreatmentEnd of ExposureRecovery Period
96 h24 h72 h168 h336 h504 h
Series A
Control41.2 ± 2.539.4 ± 2.937.7 ± 2.235.7 ± 2.831.8 ± 3.329.7 ± 2.3
WAF-CLB47.5 ± 3.347.4 ± 2.742.3 ± 2.139.1 ± 1.637.1 ± 2.637.2 ± 1.9
WAF-Diesel42.4 ± 2.241.8 ± 2.037.1 ± 2.737.7 ± 1.732.3 ± 1.830.0 ± 1.4
Series B
Control42.1 ± 4.744.3 ± 4.844.1 ± 4.643.8 ± 4.338.6 ± 4.137.1 ± 4.7
WAF-CLB46.2 ± 6.243.5 ± 6.144.4 ± 5.345.3 ± 5.336.4 ± 5.038.9 ± 5.4
WAF-Diesel45.7 ± 6.338.4 ± 5.041.0 ± 4.640.6 ± 4.332.1 ± 4.126.2 ± 3.1
Table 4. Fraction of nonviable lobster’ hemocyte cells for each treatment (Control, WAF-CLB, and WAF-Diesel) during the recovery period in series A and B. Mean ± SE; n = 3.
TreatmentEnd of ExposureRecovery Period
96 h24 h72 h168 h336 h504 h
Series A
Control9.8 ± 1.28.7 ± 1.88.3 ± 1.27.8 ± 1.48.8 ± 1.59.8 ± 1.2
WAF-CLB18.3 ± 3.5 *9.6 ± 2.69.1 ± 0.88.0 ± 1.68.2 ± 1.010.0 ± 1.6
WAF-Diesel10.4 ± 1.09.1 ± 0.79.7 ± 1.310.0 ± 2.89.0 ± 0.99.6 ± 1.3
Series B
Control7.2 ± 1.112.2 ± 1.211.8 ± 2.112.4 ± 1.65.8 ± 0.75.6 ± 1.2
WAF-CLB21.6 ± 5.2 *19.6 ± 3.2 *14.2 ± 1.67.3 ± 0.98.7 ± 2.16.7 ± 1.4
WAF-Diesel8.4 ± 1.48.7 ± 1.715.6 ± 3.18.2 ± 1.35.9 ± 0.95.4 ± 1.2
The * symbols indicate a significant (p < 0.05) effect of treatment for the considered time.
Table 5. Fraction of lysosomal membrane destabilization (LDI) in lobster’ hemocyte cells for each treatment (Control, WAF-CLB, and WAF-Diesel) during the recovery period in series A and B. Mean ± SE; n = 3.
TreatmentEnd of ExposureRecovery Phase
96 h24 h72 h168 h336 h504 h
Series A
Control12.8 ± 1.617.8 ± 0.717.6 ± 0.714.9 ± 1.013.1 ± 1.310.2 ± 1.8
WAF-CLB46.0 ± 3.1 *40.7 ± 3.8 *39.3 ± 2.6 *26.7 ± 2.7 *16.9 ± 0.711.1 ± 1.5
WAF-Diesel40.2 ± 2.6 *38.6 ± 2.1 *45.9 ± 1.8 *32.8 ± 4.0 *18.7 ± 1.811.8 ± 1.6
Series B
Control18.4 ± 2.818.9 ± 1.219.6 ± 0.914.7 ± 2.211.8 ± 1.411.3 ± 1.7
WAF-CLB44.9 ± 1.9 *32.2 ± 6.3 *25.3 ± 2.124.0 ± 1.711.8 ± 1.910.0 ± 1.9
WAF-Diesel40.2 ± 3.5 *40.9 ± 4.9 *34.7 ± 4.2 *18.7 ± 2.013.0 ± 1.513.7 ± 0.6
The * symbols indicate a significant (p < 0.05) effect of treatment for the considered time.
Table 6. EROD activity in lobster hemolymph for each treatment (Control, WAF-CLB, and WAF-Diesel) during the recovery period in series A and B. Mean ± SE; n = 3.
TreatmentEnd of ExposureRecovery Phase
96 h24 h72 h168 h336 h504 h
Series A
Control5.8 ± 0.45.6 ± 0.46.0 ± 0.85.0 ± 0.45.7 ± 0.55.6 ± 0.8
WAF-CLB10.6 ± 0.5 *10.6 ± 0.8 *8.9 ± 0.76.7 ± 0.65.7 ± 0.34.8 ± 0.2
WAF-Diesel11.5 ± 0.7 *10.8 ± 0.6 *9.1 ± 0.76.3 ± 0.96.0 ± 0.55.3 ± 0.2
Series B
Control5.5 ± 0.45.9 ± 0.56.2 ± 0.76.1 ± 0.45.7 ± 0.46.1 ± 0.3
WAF-CLB13.6 ± 2.1 *9.4 ± 0.68.3 ± 0.67.8 ± 0.37.0 ± 0.76.7 ± 0.4
WAF-Diesel16.4 ± 1.2 *14.2 ± 1.4 *9.6 ± 0.67.4 ± 0.57.0 ± 0.55.8 ± 0.2
The * symbols indicate a significant (p < 0.05) effect of treatment for the considered time.
Publisher’s Note: MDPI stays neutral with regard to jurisdictional claims in published maps and institutional affiliations.

