Abstract
Underwater sound mapping is increasingly being used as a tool for monitoring and managing noise pollution from shipping in the marine environment. Sound maps typically rely on tracking data from the Automated Information System (AIS), but information available from AIS is limited and not easily related to vessel noise emissions. Thus, robust sound mapping tools not only require accurate models for estimating source levels for large numbers of marine vessels, but also an objective assessment of their uncertainties. As part of the Joint Monitoring Programme for Ambient Noise in the North Sea (JOMOPANS) project, a widely used reference spectrum model (RANDI 3.1) was validated against statistics of monopole ship source level measurements from the Vancouver Fraser Port Authority-led Enhancing Cetacean Habitat and Observation (ECHO) Program. These validation comparisons resulted in a new reference spectrum model (the JOMOPANS-ECHO source level model) that retains the power-law dependence on speed and length but incorporates class-specific reference speeds and new spectrum coefficients. The new reference spectrum model calculates the ship source level spectrum, in decidecade bands, as a function of frequency, speed, length, and AIS ship type. The statistical uncertainty (standard deviation of the deviation between model and measurement) in the predicted source level spectra of the new model is estimated to be 6 dB.
1. Introduction
Underwater sound mapping is becoming an important tool in support of marine spatial planning of human activities at sea while protecting the marine environment [1]. Though the relationship between the environmental pressure caused by ambient noise and the state of the ecosystem is not yet fully understood, the European Union (EU) advises its Member States using underwater sound maps, combined with measurements, to quantify levels and trends of ambient noise for the implementation of its Marine Strategy Framework Directive [2]. European North Sea countries are jointly developing a framework for monitoring ambient noise in the North Sea in the Interreg Joint Monitoring Programme for Ambient Noise North Sea (JOMOPANS; https://northsearegion.eu/jomopans/; accessed on 26 March 2021). A key task in the project is to develop and demonstrate verified and validated modelling methods applicable for generating maps of ambient noise in the North Sea, with a focus on ships and wind as the dominant sources of sound. Noise from shipping is a dominant contributor to the global marine soundscape, and can adversely impact aquatic life via several effects pathways, including behavioral disturbance, stress, and masking [3,4]. The issue of underwater noise has also been recognized by the International Maritime Organization (IMO), which has published guidelines aimed at reducing vessel noise emissions from commercial shipping [5].
Various previous efforts have demonstrated that the approach for modelling shipping noise based on density and distribution of ship traffic is feasible [6,7,8,9,10]. However, large uncertainties remain. The diversity of ship characteristics and the various noise source mechanisms at different operational conditions make it impossible to include an exact prediction of the underwater radiated noise of individual vessels in the calculation of shipping sound maps. Moreover, information available from the vessel tracking data from Automated Identification System (AIS) is limited and not easily related to vessel noise emissions. In an international workshop [1], it was concluded that the speed variance remains a fundamental uncertainty in estimating source levels from AIS information: “AIS can provide information about the presence of ships (GT > 300) or shipping densities, but the Wales and Heitmeyer [11] model that is often used to estimate source levels for this traffic data does not include ship speed dependence as earlier models (e.g., the RANDI model [12]) had. For regulation purposes and for noise mapping, a new model that includes speed dependence and associated uncertainty is required. This requires coherent empirical measurements to inform model development”. The need for more coherent underwater radiated noise measurements on commercial vessels, to support the development of statistical ship source level models, was also concluded in two large European research programs, SONIC [13] and AQUO [8].
One such data set, consisting of a large collection of systematic source level measurements for a wide variety of vessels, was collected during the Vancouver Fraser Port Authority-led Enhancing Cetacean Habitat and Observation (ECHO) Program’s 2017 vessel slowdown trial in Haro Strait [14]. During 2017, the ECHO Program carried out their first voluntarily slow down trial to reduce underwater noise from marine shipping within the critical habitat of the endangered southern resident killer whale population [15]. To support underwater noise studies associated with the trial, JASCO Applied Sciences collected a total of 1862 monopole source level measurements, over a four-month period, on three different hydrophone systems [16]. This data set was used to establish speed scaling relationships for source levels of several different categories of vessels [17]. This data set is unique, not only because it provides a large collection of source levels for many different types of vessels, but also because the voluntary slow down protocol provided a strong experimental control for determining the effects of vessel speed on noise emissions. As such, the ECHO data set provided an ideal validation data set for testing speed dependence in statistical source level models.
In this study, we have applied the ECHO data set to test the validity of previously published statistical models for estimating ship source level from AIS data. In this comparison we observed systematic differences between the model predictions for different vessel classes. Therefore, we propose an updated reference spectrum model that incorporates ship type as well as speed and length. The parameters of this model are fitted to the ECHO data. In this paper, we describe the various source level models and the comparison of the model predictions with measured source levels from the ECHO data set.
2. Methods
2.1. Source Level Data and Validation
A large collection of 1862 source level measurements from ships of opportunity, collected near Vancouver (Canada), were used for validating source level models in JOMOPANS. This data set was collected by JASCO Applied Sciences, in partnership with the ECHO Program, and included source level measurements collected in Haro Strait and Strait of Georgia during the 2017 ECHO Program voluntary slowdown trial [16,17]. Measurements were collected on calibrated hydrophones (Geospectrum M36, −165 ± 3 dB re 1 V/µPa sensitivity), using JASCO AMAR-G3 (Autonomous Multichannel Acoustic Recorder, Generation 3) recorders, at three locations, situated adjacent to the international shipping lanes in the Salish Sea. Hydrophones were deployed near the seabed in water depths ranging from 173 to 250 m. The mean closest point of approach (CPA) distance of vessels in the data set was 361 m and the maximum CPA distance was 1 km. The acoustic data were collected with 24-bit resolution at a minimum sampling frequency of 64 kHz. The location, speed, draft, and identifying details of vessels near the hydrophones were recorded using an automated identification system (AIS) receiver. Vessel classification and design details were obtained from the MarineTraffic.com web service [18], based on the maritime mobile service identity (MMSI) number. Additional details regarding the data set employed in the source level validation are provided in [17].
The acoustic data were analyzed using JASCO’s ShipSound system, which analyzes hydrophone data and AIS broadcasts from passing vessels to calculate vessel source levels in terms of monopole source level (SL). For time periods when a passing vessel was detected on AIS, the system processes hydrophone data to obtain standard decidecade (i.e., 1/3-octave) band sound pressure level (SPL) inside a data window encompassing ±30° of the vessel’s CPA to the hydrophone, according to the methods specified in the ANSI ship noise measurement standard (S12.64, 2009). SL was calculated in 36 decidecade bands (with nominal centre frequencies 10 Hz to 31.5 kHz), using a frequency-dependent propagation loss (PL) model, based on numerical solution of the acoustic wave equation, which accounts for the effect of the environment on sound transmission. Following a similar methodology to [11], the source depth in the PL model was represented as normally distributed random variable, where the mean source depth was assumed to 50% of the static vessel draft as broadcast over AIS at the time of measurement and the distribution parameter was taken to be . Additional details regarding the source level analysis methodology employed in ShipSound are given in [17,19]. Source level measurements were anonymized and assigned to one of twelve different categories (discussed below).
To correct the comparison of the ECHO data set to the RANDI 3.1 source level model (Section 2.2.1), an adjustment of the ECHO source levels to a standard depth of 6 m has been made, according to the procedure described in Appendix A. For the JOMOPANS noise mapping, the selection of a fixed 6 m reference source depth for all vessels has the advantage that it offers the possibility to decrease the complexity of the propagation loss model calculations.
Ship source level models were validated against the ECHO data set by comparing model predictions to measured SL values, in each of the 36 decidecade frequency bands. Residual differences, in decibels, between predicted and observed source levels were calculated as:
where is the residual difference between predicted and observed source level spectral density () for measurement k at frequency f and, depending on the model, the predicted spectrum level could be a function of vessel length, l, speed, V, and class, C. The observed source level spectral density () was calculated from the measured SL () in decidecade bands by subtracting the bandwidth (in dB re Hz):
where the centre frequencies of the standard decidecade bands were calculated according to the IEC 61260-1 formula:
and the band number, i, is an integer in the range –20 to 15.
2.2. Source Level Models
2.2.1. RANDI
The Research Ambient Noise Directionality noise model (RANDI 3.1) is a naval ambient noise model, designed to support prediction of the performance of low- to mid-frequency sonar receivers [12]. RANDI 3.1 includes a semi-empirical ship SL model consisting of a baseline spectrum of an “average ship” (with reference speed and length ), modified by a dependence on ship length and speed. The source level spectral density as a function of frequency (Hz), speed (kn) and length (ft) is:
with reference spectrum:
where and , with , and
The dependence of the RANDI 3.1 SL model on ship speed and length is based on empirical relations derived from World War II acoustic data and theoretical considerations related with propeller cavitation noise [20]. The original measurements on which this model is based are no longer available. Most of these measurements were made in shallow-water sheltered environments. The propagation loss was determined from the slant range assuming spherical spreading. Hence, the spectra were not corrected for the actual propagation loss in the environment in which the measurements were taken, and therefore represent a radiated noise level (as defined in ISO 17208-1) and not a source level in the sense of ISO 18405. The source depth associated with the SL model was not reported in [12], but the RANDI 3.1 user’s guide suggests a source depth of 6 m (“the average propeller depth of a merchant ship”). The statistical uncertainty of the RANDI 3.1 model predictions is not reported.
2.2.2. Wales and Heitmeyer (WH02)
Wales and Heitmeyer [11] concluded from an analysis of 54 merchant ship source spectra, measured by sonobuoys in the Mediterranean Sea and the Eastern Atlantic Ocean, that the correlation between the source level and the ship speed and length is negligible. Due to the relatively small sample of ships, probably all sailing at their optimum transit speed, it is unclear to what extent this conclusion can be generalized. They proposed an alternative ensemble source spectra model for merchant ship-radiated noise, with source spectral density level (in the frequency range between 30 Hz and 1200 Hz):
Wales and Heitmeyer applied a Gaussian source distribution across the upper quadrant of the region swept out by the propeller to determine the ship source level from the measurements, but did not report the range of source depths for which the proposed model is valid.
The ship source levels observed by Wales and Heitmeyer are normally distributed around the source spectra model, with an associated standard deviation [21]:
2.2.3. Updated Reference Spectrum Model (JOMOPANS-ECHO)
The observed discrepancy between the predictions by the RANDI and WH02 models with the measured source levels from the ECHO data set (Section 3.1) triggered the development of an updated reference spectrum model. As the data [17] confirm that there is a correlation between the source level and the ship speed and length, and because these two parameters are readily available from ship traffic systems such as AIS, we decided to maintain the speed and length dependencies from the RANDI 3.1 model:
To reduce the ship class dependent deviation between measured and modelled source levels, the RANDI 3.1 model was adapted, by replacing the generic reference speed by a reference speed per vessel class (). This new reference speed was obtained from minimizing the mean model-data residuals (Equation (1)) for broadband source level per vessel class. Next, an updated baseline spectrum per vessel class was developed, from minimizing the model-data residuals for the mean spectrum in each category per decidecade band:
with , , and , and , for all classes, except .
For the cargo vessels (container ships, vehicle carriers, bulkers, tankers) the updated model includes an additional peak in the baseline spectrum below 100 Hz:
with and and for container ships and bulkers) or for vehicle carriers and tankers. The above model expressions are for source spectral density level. In the final modelling these are converted to source level in decidecade frequency bands by adding .
A source level model for dredgers was added, based on data from measurements by TNO in a project during the construction of Maasvlakte 2 (Rotterdam port extension; [22]). While dredging, the source level is much higher than would be predicted based on the speed, due to the propeller loading associated with the dredging. Based on the measurement results, the JOMOPANS-ECHO model prediction of the dredger source level at a sailing speed of 14 knots is applied as an estimation of the source level when the dredger is dredging (independent of the actual dredging speed). The AIS data available to JOMOPANS do not provide an indication when dredger is dredging. Based on the speeds observed during dredging for Maasvlakte 2 [22], it is tentatively assumed that a dredger is dredging when its speed is lower than 3 knots.
The measured vessel source level spectra in the ECHO data set are approximately normally distributed around the source spectra model, with an associated standard deviation of about 6 dB (Section 3.2).
3. Results
3.1. Source Level Validation
Statistics of the residual differences between the RANDI and WH02 model predictions and the ECHO data set were calculated for decidecade bands ranging from 10 Hz to 31.5 kHz (Figure 1). For this comparison we have extended the WH02 model beyond the frequency range for which it was developed, by applying Equation (7) between 1.2 kHz and 20 kHz and by assuming a constant SL spectral density at 30 Hz and below [23]. This analysis showed that both models overestimated observed source levels below 250 Hz and underestimated observed source levels at 250 Hz and above. While the mean residual differences for the two models were very similar, the RANDI model had significantly greater standard deviation of the residual differences than the WH02 model, particularly at higher frequencies. While the prediction error of the RANDI model was undoubtedly larger, scatter plots of the data nonetheless showed that the speed and length terms in the RANDI model more accurately reproduced trends evident in the ECHO source level measurements (Figure 2). Furthermore, it was evident that source levels for different types of vessels exhibited systematic offsets when compared to the RANDI model. The results of the validation therefore suggest that an improved reference spectrum model could be devised via straightforward modifications to the basic RANDI formulae.
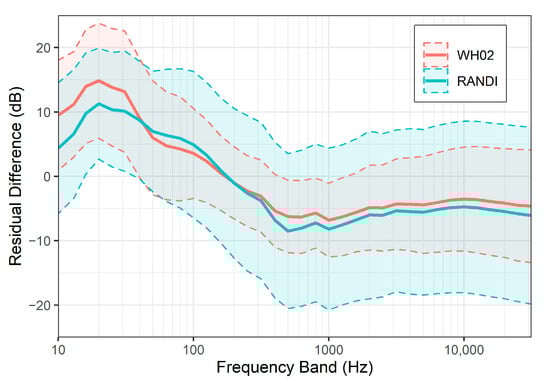
Figure 1.
Mean residual differences (solid lines RANDI and WH02) versus frequency between the source level models and the ECHO data set. The dashed lines show the standard deviation of the residual differences about the mean.
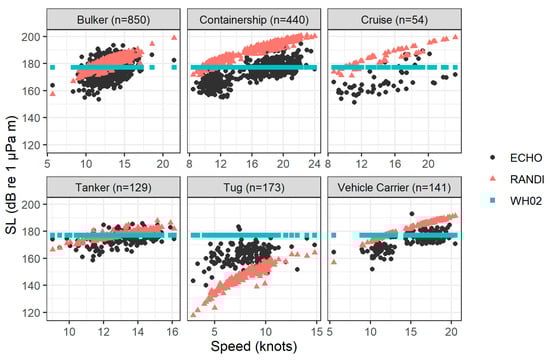
Figure 2.
Scatter plots of predicted and observed (ECHO) source levels versus speed, in the 63 Hz decidecade band (one of the two MSFD indicator bands [2]), for the RANDI and WH02 models, for six vessel types. The n value in each panel indicates the number of measurements for the specified vessel type. Predictions of the WH02 model do not vary with vessel speed and length, whereas predictions of the RANDI model vary with vessel speed and length according to power law functions, see Equation (4).
3.2. JOMOPANS-ECHO Model
As described in Section 2.2.3, a modified source level model was devised that preserves the speed and length dependencies of the RANDI model but introduces a modified reference spectrum and category-specific reference speeds to achieve a better fit to the validation data set. Source level measurements were available for 12 different classes of vessels, representing a wide range of vessel sizes, speeds, and roles. Table 1 provides the applied conversion between the ship type identification (ID) in the AIS data set and vessel class. The AIS types ‘Passenger’ (ID = 60–69) and ‘Cargo’ (I = 70–79) do not provide a clear identification of larger and faster vessels such as containerships and cruise vessels. Without access to additional ship information, these vessel classes are tentatively identified by ship length, observed mean speed and AIS hazard class (see Table 1). Coefficients of a modified reference spectrum (Equations (10) and (11)) were chosen to match as closely as possible the mean source level versus frequency data for the different vessel types. Each vessel class was assigned an appropriate reference speed (, so chosen to minimize the residual differences between the new model and the validation data set, in decidecade bands (fi ≥ 20 Hz) (Figure 3). Each vessel class was furthermore associated with specific AIS ship type ID codes, with additional speed and length criteria to disambiguate between sub-types of vessels that could not be identified based purely on the AIS ID (Table 1). A reference implementation of the JOMOPANS-ECHO source level formulae is provided in an Excel spreadsheet (File S1).

Table 1.
The vessel class (C) is obtained from the AIS ‘ship type’ parameter, according to the following table, which also presents the reference speed ( ) per vessel class, the number of unique vessels, the number of measurements (n), and the mean length ( ) per vessel type of the measured ships in the ECHO data set and the dredgers from [22] used for the present model development. Many vessels in the data set were measured more than once.
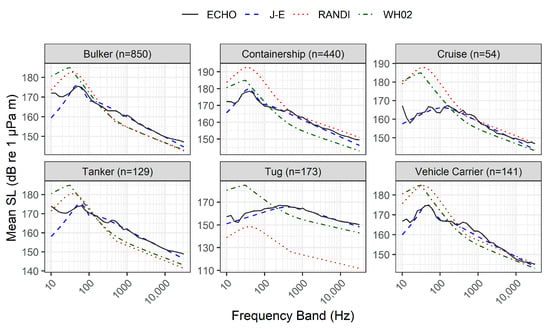
Figure 3.
Comparison of the mean source level versus frequency predictions of the WH02, RANDI and JOMOPANS-ECHO (J-E) models with mean measured source levels from ECHO data set (black). The n value in each panel indicates the number of measurements that were averaged for the specified vessel type.
Over the 20 Hz to 20 kHz decidecade bands, the maximum absolute value of the mean residual difference (in decidecade bands, averaged over all vessels) between the new model and the ECHO data is 2 dB, and the mean standard deviation of the residual differences per decidecade band is 6 dB (Figure 4). The larger deviations observed in the decidecade bands below 20 Hz is likely due to tonal noise at propeller blade rates and harmonics which are not represented in the statistical source level models. The speed and length trends in the original RANDI model appear to follow the trends observed the ECHO data set and so these coefficients were not modified in the new model (Figure 5 and Figure 6). The new model was found to provide a significantly better match to the ECHO data, when compared with the RANDI and WH02 models (compare Figure 4 with Figure 1 and Figure 5 with Figure 2).
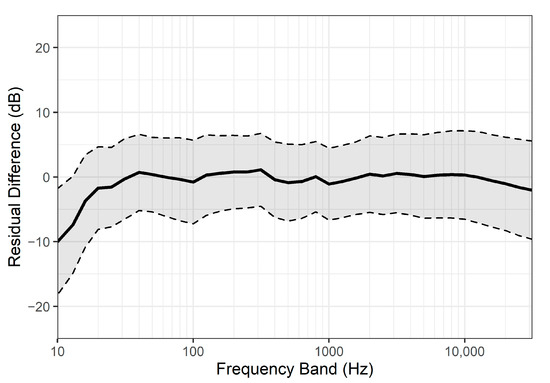
Figure 4.
Mean residual differences (solid line) versus frequency between JOMOPANS-ECHO model and the ECHO data set. The dashed lines show one standard deviation of the residual differences about the mean. The mean standard deviation of the residual differences is 6 dB over the frequency range 20 Hz to 20 kHz. Over the same frequency range, the mean absolute value and interquartile range of the residual differences are 5 dB and 8 dB, respectively.
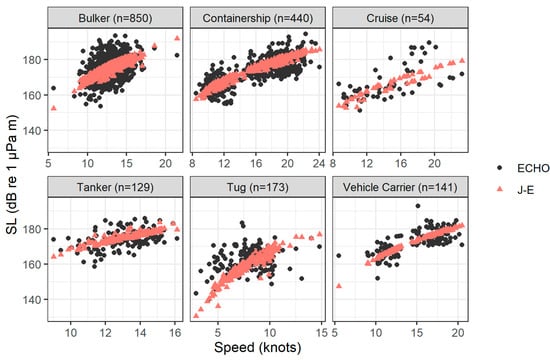
Figure 5.
Scatter plots of predicted and observed (ECHO) source levels versus speed, in the 63 Hz decidecade band, for the JOMOPANS-ECHO (J-E) model, for six vessel types. The n value in each panel indicates the number of measurements for the specified vessel type.
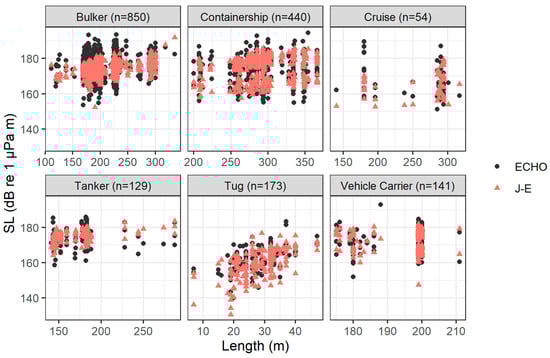
Figure 6.
Scatter plots of predicted and observed (ECHO) source levels versus length, in the 63 Hz decidecade band, for the JOMOPANS-ECHO (J-E) model, for six vessel types. The n value in each panel indicates the number of measurements for the specified vessel type.
4. Discussion and Conclusions
4.1. Comparison with Other SL Models
Since the RANDI and WH02 models were originally published, the widespread availability of high-quality AIS data and advanced digital hydrophone recorders have allowed for the collection of newer, more extensive source level data sets for ships of opportunity [24,25,26,27,28,29]. Using these newer data sets, other recent studies have sought to develop improved reference spectrum models for marine vessels, many of which are summarized in a recent review article [30]. While it is not possible to provide an exhaustive review here, several notable examples are discussed below, and their details are compared to the present work.
Chion et al. [31] used source levels from 11 merchant vessels, measured in the St. Lawrence Estuary, to develop a modified version of the RANDI model that included an updated reference spectrum and modified speed dependence. Chion et al. reported that the original RANDI model overestimated their measurements, so they introduced a speed-dependent correction parameter (K0) that minimized the residuals between their data and the corrected model. They retained the common 12-knot reference speed for all vessels. The modified Chion et al. model has a much weaker speed dependence than the original RANDI model, predicting an SL increase of only 1.7 dB when speed is doubled from 10 to 20 knots (Equation (4) predicts an increase of 18 dB over the same speed range). Chion et al. did not report whether they assumed a specific source depth in their modified RANDI model, but their use of geometrical propagation loss suggests that their model employed a dipole source representation (i.e., neglecting the influence of the sea surface on predicted source levels).
Simard et al. [26] tested several source-spectrum models, including RANDI and WH02, using source levels from 255 merchant vessels measured in the St. Lawrence Estuary. Their validation data employed a monopole source representation, with propagation loss computed using the wavenumber integration method. The assumed source depth was not reported. Simard et al. reported that both the RANDI and WH02 models generally underestimated their measurements, so they fit several polynomial models, involving length, breadth, draft, and speed to their data, discarding insignificant terms. Simard et al. presented three possible models that were consistent with their data, although the length and speed dependencies in these models (if present) were weaker than the 20 × log10(l) and 60 × log10(V) trends in RANDI. Their simplest model, denoted as AS4, which depends only on frequency in a similar manner to WH02, explained 72% of their data variance. For comparison, the JOMOPANS-ECHO model explains 64% of the ECHO data variance. However, based on the statistics reported in their paper, the spread of their measured source levels around the AS4 model predictions appears to be approximately the same as the spread observed in the JOMOPANS-ECHO model-data comparison (interquartile range of the residuals for both models is 8 dB).
Most recently, Jiang et al. [27] used source levels from 27 merchant vessels, measured near the port of Qingdao in the Yellow Sea, to develop a modified version of the RANDI model that included updated reference spectra and modified speed and length dependencies. Jiang et al. employed a monopole source representation, having calculated propagation loss using a wavenumber integration model, with a Gaussian source distribution, as in [11], and the source in the upper quadrant of the propeller, as in [32]. Jiang et al. reported that the original RANDI model overestimated their data for vessels over 200 m (category I, mostly container ships), but gave a good fit to their data for vessels under 200 m (category II, mostly bulkers and tankers). Thus, they developed two new sets of formulae, that provided a better fit to their data for these two categories of vessels. Jiang et al. reported a strong correlation between vessel speed and source level, with best-fit speed coefficients similar to the original RANDI value (43.5 × log10(V) and 65 × log10(V) for categories I and II, respectively), whereas they reported a weak correlation between length and source level—particularly for category I—with best-fit length coefficients less than the original RANDI value (14 × log10(l) and −2.7 × log10(l) for categories I and II, respectively). In comparing their modified model with their data, Jiang et al. reported a mean absolute error of 4 dB, which was slightly less than the mean absolute error of the JOMOPANS-ECHO model, which was 5 dB.
Figure 7 illustrates that the difference between the source level spectra predicted by these models exceeds the statistical uncertainty reported for the models. This comparison is limited to merchant vessels over 100 m in length because that is, to our understanding, the range of ships for which the Chion et al., Simard et al. and Jiang et al. models are applicable.
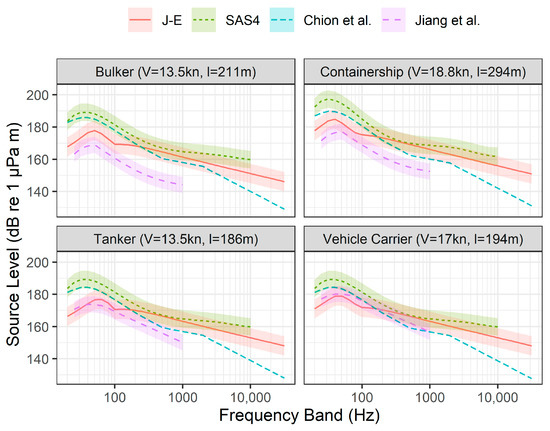
Figure 7.
Decidecade band source levels predicted by the JOMOPANS-ECHO model (J-E) compared with three other recent source level models. Predictions are shown for four representative merchant vessels, with mean length (l) and speed (V) from the ECHO data set. Lines correspond to different models as follows: J-E is the model from this work, SAS4 is the simple AS4 model from ref [26], Chion et al. is the model from ref [31], and Jiang et al. is the model from ref [27]. Color-shaded areas indicate the model uncertainties, where reported (± one estimated standard deviation, assuming normal distribution of errors).
The four models compared in Figure 7 are all semi-empirical, with fitted parameters based on source level data for ships of opportunity. These data sets were collected at different locations, for different ship populations, using different measurement and analysis procedures. Differences between source level data sets, due to a combination of these factors, are thus most likely responsible for differences between the model predictions. For example, obtaining accurate source levels is more difficult in shallow water than in deep water, particularly at frequencies below 100 Hz, due to the influence of the seabed. Furthermore, calculated source levels are sensitive to the estimated propagation loss, and so differences in the methods used to estimate propagation loss can introduce systematic differences into the source level estimates. The Chion et al. and Simard et al. studies both measured source levels in relatively deep water, similar to the ECHO Program’s study (~200–300 m), whereas the Jiang et al. study measured source levels in much shallower water (~30 m). On the other hand, the propagation loss method employed by the Jiang et al. study was most similar to that of the ECHO Program’s study, whereas the propagation loss methods employed by Chion et al. and Simard et al. studies were quite different. Karasalo et al. [28] estimated the source level spectra of over 900 ships from measurements of 2088 ship passages along a hydrophone deployed near a major shipping lane in the Baltic Sea. Propagation loss for the shallow water environment (water depth ~41 m) was calculated using acoustic seabed parameters obtained from geo-acoustic inversion of data from a propagation loss trial. In the frequency range between 100 Hz and 1000 Hz, to which the source level estimations in [28] are limited, the JOMOPANS-ECHO model predicts the median source levels of cargo vessels and tankers in [28] within the model uncertainty (~6 dB). For tugs and passenger vessels, which are less well represented in the data sets, the differences are greater.
Uncertainties about certain assumptions involved in the models (e.g., Chion et al. and Simard et al. do not report the assumed source depths) also make comparisons more difficult. A recent meta-analysis found differences in source level of as much as 30 dB between published data sets for similar vessels operating under similar conditions [30]. We rely upon the ECHO data set for this work because it includes a significantly larger number of measurements, and we have a detailed understanding of the underlying calculation methods. It is hoped that ongoing efforts toward standardization of source level estimation procedures (e.g., by the ISO subcommittee on underwater acoustics, ISO/TC 43/SC3) will improve the consistency of different data sets in future [33].
The new JOMOPANS-ECHO source level model addresses several key requirements for marine sound mapping that were identified during the JOMOPANS project and which were not fulfilled by pre-existing models:
- The new model provides an explicit relationship between AIS ship type and source level spectrum (i.e., as described in Table 1), to facilitate making reproducible sound maps. The incorporation of class-dependent reference speeds and reference spectra in the model is consistent with prior studies which have established that ship class is a strong predictor of vessel source levels [24,25].
- The new model retains an explicit dependence of source level on vessel speed, which allows for the ability to consider, e.g., slow down mitigation scenarios in marine spatial planning. The speed dependence follows an established power-law trend for cavitation noise [34] which is strongly supported by experimental evidence [17].
- The new model employs a monopole source representation with a consistently specified reference source depth (zs = 6 m). Ambiguities surrounding monopole and dipole source level representations have been identified as a key source of inconsistencies between prior vessel noise studies [30].
- The new model includes an estimate of statistical uncertainty (±6 dB rms error in the range 0.02–20 kHz), which has been calculated from a large validation data set. This permits a robust analysis of statistical uncertainties associated with the inherent variability in source levels of marine vessels.
4.2. Sources of Uncertainty
There are several sources of uncertainty that need to be considered, when applying the proposed model for estimating sound levels from marine shipping. Information gleaned from AIS data provides an imperfect means of identifying vessel class and estimating source levels. For example, using AIS alone, container ships and cruise ships cannot be identified with certainty, and vehicle carriers seemingly cannot be distinguished from other types of cargo vessels (see Table 1). AIS broadcasts often contain errors in vessel length, ship type ID, and speed, and many smaller vessels (typically under 300 gross tonnes) do not broadcast on AIS at all [35,36].
Furthermore, most of the vessel design details that truly relate to noise emissions are entirely absent from AIS data. Models that calculate individual contributions of propeller and machinery noise to the source level, as proposed by Wittekind [37], by the AQUO project [8] and by Jalkanen et al. [38] have the potential to reduce part of the uncertainty in the source level predictions, but require more information than available from AIS and cannot address the fundamental uncertainty associated with the influence of details such as vessel maintenance condition and the effect of environmental conditions on propeller cavitation. Moreover, complex detailed source level models based on many parameters are impractical for large scale sound mapping.
Other sources of uncertainty in the proposed model relate to the simplifying assumptions in the predicted source level model itself. The proposed model assumes isotropic sound radiation, but real vessels can exhibit strong directivity (both fore-aft and port-starboard) in their noise emissions [39,40]. The proposed model also assumes a point-like sound source, but noise sources on real vessels (e.g., the engine room and propeller) originate from different positions along the hull and at different depths [41]. Hence, the underwater radiated noise in the vicinity of a real vessel deviates from the assumed radiation from a monopole source at a depth of 6 m below the water surface. Various data sets indicate that there is a significant, seemingly random, component to vessel source level measurements that ultimately limit the precision with which noise emissions from any particular vessel can be estimated.
Comparisons between empirical vessel noise models (see Figure 7) suggest the need for independent validation against different source level data sets. Such validation efforts are hampered, at present, by the lack of an agreed-upon standard for measurement of source levels for ships of opportunity. Existing standards (e.g., ISO 17208) were developed for acoustic ranging of co-operating vessels under controlled test conditions. As such, they can only be approximately adhered to for ships of opportunity under the best of circumstances. As a result, past studies that collected large numbers of measurements for ships of opportunity employed widely varying methodologies, often yielding very different results [30]. The present work has attempted to address such uncertainties by employing a large, statistically robust source level data set, collected according to a well-defined measurement protocol. Nonetheless, it is clear that more work is needed to address sources of error between vessel noise data sets and source level models. This is especially important for marine sound mapping applications because source level models are a key source of uncertainty in ambient noise prediction.
Supplementary Materials
The following are available online at https://www.mdpi.com/article/10.3390/jmse9040369/s1, File S1: JOMOPANS-ECHO vessel source level calculator (Excel format).
Author Contributions
A.M. and C.d.J. contributed equally to the preparation of this paper. A.M. was responsible for the data analysis and optimization of model-data residuals. C.d.J. was responsible for formulation and implementation of the reference spectrum model for JOMOPANS. Both authors have read and agreed to the published version of the manuscript.
Funding
This research was funded under the Joint Monitoring Programme for Ambient Noise in the North Sea (JOMOPANS) by the North Sea Programme of the European Regional Development Fund (InterReg) of the European Union and several national funding bodies. See https://northsearegion.eu/jomopans/ (Accessed on 26 March 2021).
Institutional Review Board Statement
Not applicable.
Informed Consent Statement
Not applicable.
Data Availability Statement
Restrictions apply to the availability of these data. Data was obtained from the Enhancing Cetacean Habitat and Observation (ECHO) Program and are available from the authors with permission from the ECHO Program.
Acknowledgments
The anonymized vessel noise data set used in this research was collected by the Vancouver Fraser Port Authority-led Enhancing Cetacean Habitat and Observation (ECHO) Program.
Conflicts of Interest
The authors declare no conflict of interest.
Appendix A. Source Depth Conversion
International standard ISO DIS 17208-2 summarizes the theory for conversion between deep water Radiated Noise Level () and Source Level (:
A simple approximation, valid when is:
This may be approximated by:
Here, is the acoustic wavenumber, the source depth and the vertical observation angle.
The ECHO data set contains source levels for an assumed Gaussian source depth distribution, with mean value and standard deviation , limited to interval [1 m, 24 m]. For the purpose of the present modelling, the source levels have been adjusted to be applicable for a single fixed source depth of 6 m. Conversion of the SL reported for one (mean) source depth to another source depth can be done by applying the correction
For a small vessel, e.g., a tug with an assumed mean source depth , this leads to a correction that is approximately equal to 8 dB in the lowest frequency bands, where .
References
- International Whaling Commission (IWC); IQOE; US NOAA & ONRG; Netherlands TNO & Ministry of Infrastructure and The Environment. Joint Workshop Report: Predicting Sound Fields—Global Soundscape Modelling to Inform Management of Cetaceans and Anthropogenic Noise. In Joint Workshop Sponsored By the IWC, IQOE, US NOAA & ONRG, and Netherlands TNO & Ministry of Infrastructure and The Environment; NOAA Fisheries: Leiden, The Netherlands, 2014. [Google Scholar]
- Dekeling, R.; Tasker, M.; Van Der Graaf, S.; Ainslie, M.; Andersson, M.; André, M.; Borsani, J.F.; Brensing, K.; Castellote, M.; Cronin, D.; et al. Monitoring Guidance for Underwater Noise in European Seas, Part II: Monitoring Guidance Specifications; JRC Scientific and Policy Report EUR 26557 EN; Publications Office of the European Union: Luxembourg, 2014. [Google Scholar]
- Erbe, C.; Marley, S.A.; Schoeman, R.P.; Smith, J.N.; Trigg, L.E.; Embling, C.B. The Effects of Ship Noise on Marine Mammals—A Review. Front. Mar. Sci. 2019, 6, 606. [Google Scholar] [CrossRef]
- Richardson, W.J.; Greene, C.R.; Malme, C.I.; Thomson, D.H. Marine Mammals and Noise; Academic Press: San Diego, CA, USA, 1995; p. 576. [Google Scholar]
- International Maritime Organization (IMO). MEPC.1/Circ.833. Guidelines for the Reduction of Underwater Noise from Commercial Shipping to Address Adverse Impacts on Marine Life; IMO: London, UK, 2014; 8p. [Google Scholar]
- Erbe, C.; MacGillivray, A.O.; Williams, R. Mapping Cumulative Noise from Shipping to Inform Marine Spatial Planning. J. Acoust. Soc. Am. 2012, 132, EL423–EL428. [Google Scholar] [CrossRef]
- Aulanier, F.; Simard, Y.; Roy, N.; Gervaise, C.; Bandet, M. Effects of shipping on marine acoustic habitats in Canadian Arctic estimated via probabilistic modeling and mapping. Mar. Pollut. Bull. 2017, 125, 115–131. [Google Scholar] [CrossRef] [PubMed]
- Audoly, C.; Rizzuto, E. Ship Underwater Radiated Noise Patterns; Technical Report AQUO European Collaborative Project Deliverable D2.1; AQUO Project Consortium: Val-de-Reuil, France, 2015. [Google Scholar]
- Joy, R.; Tollit, D.; Wood, J.; MacGillivray, A.; Li, Z.; Trounce, K.; Robinson, O. Potential Benefits of Vessel Slowdowns on Endangered Southern Resident Killer Whales. Front. Mar. Sci. 2019, 6, 34. [Google Scholar] [CrossRef]
- Farcas, A.; Powell, C.F.; Brookes, K.L.; Merchant, N.D. Validated shipping noise maps of the Northeast Atlantic. Sci. Total Environ. 2020, 735, 139509. [Google Scholar] [CrossRef] [PubMed]
- Wales, S.C.; Heitmeyer, R.M. An ensemble source spectra model for merchant ship-radiated noise. J. Acoust. Soc. Am. 2002, 111, 1211–1231. [Google Scholar] [CrossRef]
- Breeding, J.E.; Pelug, L.A. Research Ambient Noise Directionality (RANDI) 3.1 Physics Description; NRL/FS/7176--95-9628; Naval Research Laboratory: Stennis Space Center, MS, USA, 1996. [Google Scholar]
- Brooker, A.G.; Humphrey, V.F. Noise Model for Radiated Noise/Source Level (Intermediate); Document Number FP7-314394-SONIC, Deliverable 2.3. Tech. Rep.; SONIC, Suppression of Underwater Noise Induced by Cavitation Consortium: The Amsterdam, The Netherlands, 2015. [Google Scholar]
- Siceloff, L.; Howell, W.H. Fine-scale temporal and spatial distributions of Atlantic cod (Gadus morhua) on a western Gulf of Maine spawning ground. Fish. Res. 2013, 141, 31–43. [Google Scholar] [CrossRef]
- Trounce, K.; Robinson, O.; MacGillivray, A.; Hannay, D.; Wood, J.; Tollit, D.; Joy, R. The Effects of Vessel Slowdowns on Foraging Habitat of the Southern Resident Killer Whales. In Proceedings of the 2019 International Congress on Ultrasonics, Bruges, Belgium, 3–6 September 2019; Volume 37. [Google Scholar]
- MacGillivray, A.O.; Li, Z. Appendix A. Vessel Noise Measurements from the ECHO Slowdown Trial, in Voluntary Vessel Slowdown Trial Summary Findings; Trouce, K., Ed.; Vancouver Fraser Port Authority: Vancouver, BC, Canada, 2018. [Google Scholar]
- MacGillivray, A.O.; Li, Z.; Hannay, D.E.; Trounce, K.B.; Robinson, O.M. Slowing deep-sea commercial vessels reduces underwater radiated noise. J. Acoust. Soc. Am. 2019, 146, 340–351. [Google Scholar] [CrossRef]
- Marine Traffic. Marine Traffic: Global Ship Tracking Intelligence. Available online: https://www.marinetraffic.com/ (accessed on 19 February 2020).
- Hannay, D.E.; Mouy, X.; Li, Z. An Automated Real-Time Vessel Sound Measurement System for Calculating Monopole Source Levels Using a Modified Version of ANSI/ASA S12.64-2009. Can. Acoust. 2016, 44, 166–167. [Google Scholar]
- Ross, D. Mechanics of Underwater Noise; Pergamon Press: New York, NY, USA, 1987. [Google Scholar]
- Ainslie, M.A.; de Jong, C.A.F.; MacGillivray, A.O. Quantitative Source Descriptions for Soundscape Modeling; Technical Memorandum by TNO and JASCO Applied Sciences, Version 1.0; Atlantic Deepwater Ecosystem Observatory Network, University of New Hampshire: Hampshire, UK, 2018; 29p. [Google Scholar]
- De Jong, C.A.F.; Ainslie, M.; Dreschler, J.; Jansen, E.; Heemskerk, E.; Groen, W. Underwater Noise of Trailing Suction Hopper Dredgers at Maasvlakte 2: Analysis of Source Levels and Background Noise; Document Number TNO-DV 2010 C335; TNO: The Hague, The Netherlands, 2010. [Google Scholar]
- Colin, M.E.G.D.; Ainslie, M.A.; Binnerts, B.; De Jong, C.A.; Karasalo, I.; Östberg, M.; Sertlek, H.O.; Folegot, T.; Clorennec, D. Definition and Results of Test Cases for Shipping Sound Maps, in OCEANS 2015—Genova; IEEE: Genoa, Italy, 2015; pp. 1–9. [Google Scholar]
- McKenna, M.F.; Ross, D.; Wiggins, S.M.; Hildebrand, J.A. Underwater Radiated Noise from Modern Commercial Ships. J. Acoust. Soc. Am. 2012, 131, 92–103. [Google Scholar] [CrossRef]
- Veirs, S.; Veirs, V.; Wood, J.D. Ship noise extends to frequencies used for echolocation by endangered killer whales. PeerJ 2016, 4, e1657. [Google Scholar] [CrossRef]
- Simard, Y.; Roy, N.; Gervaise, C.; Giard, S. Analysis and modeling of 255 source levels of merchant ships from an acoustic observatory along St. Lawrence Seaway. J. Acoust. Soc. Am. 2016, 140, 2002–2018. [Google Scholar] [CrossRef] [PubMed]
- Jiang, P.; Lin, J.; Sun, J.; Yi, X.; Shan, Y. Source spectrum model for merchant ship radiated noise in the Yellow Sea of China. Ocean Eng. 2020, 216, 107607. [Google Scholar] [CrossRef]
- Karasalo, I.; Östberg, M.; Sigray, P.; Jalkanen, J.-P.; Johansson, L.; Liefvendahl, M.; Bensow, R. Estimates of Source Spectra of Ships from Long Term Recordings in the Baltic Sea. Front. Mar. Sci. 2017, 4, 164. [Google Scholar] [CrossRef]
- Jansen, E.; de Jong, C.A.F. Experimental Assessment of Underwater Acoustic Source Levels of Different Ship Types. IEEE J. Ocean. Eng. 2017, 42, 439–448. [Google Scholar] [CrossRef]
- Chion, C.; Lagrois, D.; Dupras, J. A Meta-Analysis to Understand the Variability in Reported Source Levels of Noise Radiated by Ships from Opportunistic Studies. Front. Mar. Sci. 2019, 6, 714. [Google Scholar] [CrossRef]
- Chion, C.; Lagrois, D.; Dupras, J.; Turgeon, S.; McQuinn, I.H.; Michaud, R.; Ménard, N.; Parrott, L. Underwater acoustic impacts of shipping management measures: Results from a social-ecological model of boat and whale movements in the St. Lawrence River Estuary (Canada). Ecol. Model. 2017, 354, 72–87. [Google Scholar] [CrossRef]
- Gray, L.M.; Greeley, D.S. Source level model for propeller blade rate radiation for the world’s merchant fleet. J. Acoust. Soc. Am. 1980, 67, 516–522. [Google Scholar] [CrossRef]
- Audoly, C. Standardization in Underwater Acoustics with Focus on Ship Radiated Measurement—An Update. In Proceedings of the WESPAC, New Delhi, India, 1–18 November 2018. [Google Scholar]
- Ross, D.; Alvarez, F.F. Radiated underwater noise of surface ships. U.S. Navy J. Underw. Acoust. 1964, 14, 331. [Google Scholar]
- Sotirov, S.; Alexandrov, C. Improving AIS Data Reliability. In Proceedings of the International Association of Maritime Universities Conference (IAMUC), Varna, Bulgaria, 11–15 October 2017. [Google Scholar]
- Iphar, C.; Napoli, A.; Ray, C. Detection of False AIS Messages for the Improvement of Maritime Situational Awareness. In Proceedings of the Oceans 2015-MTS/IEEE, Washington, DC, USA, 19–22 October 2015. [Google Scholar]
- Wittekind, D.K. A simple model for the underwater noise source level of ships. J. Ship Prod. Des. 2014, 30, 7–14. [Google Scholar] [CrossRef]
- Jalkanen, J.-P.; Johansson, L.; Liefvendahl, M.; Bensow, R.; Sigray, P.; Östberg, M.; Karasalo, I.; Andersson, M.; Peltonen, H.; Pajala, J. Modelling of ships as a source of underwater noise. Ocean Sci. 2018, 14, 1373–1383. [Google Scholar] [CrossRef]
- Arveson, P.T.; Vendittis, D.J. Radiated noise characteristics of a modern cargo ship. J. Acoust. Soc. Am. 2000, 107, 118–129. [Google Scholar] [CrossRef]
- Gassmann, M.; Wiggins, S.M.; Hildebrand, J.A. Deep-water measurements of container ship radiated noise signatures and directionality. J. Acoust. Soc. Am. 2017, 142, 1563–1574. [Google Scholar] [CrossRef] [PubMed]
- Tollefsen, D.; Dosso, S.E. Ship source level estimation and uncertainty quantification in shallow water via Bayesian marginalization. J. Acoust. Soc. Am. 2020, 147, EL339–EL344. [Google Scholar] [CrossRef] [PubMed]


Publisher’s Note: MDPI stays neutral with regard to jurisdictional claims in published maps and institutional affiliations. |
© 2021 by the authors. Licensee MDPI, Basel, Switzerland. This article is an open access article distributed under the terms and conditions of the Creative Commons Attribution (CC BY) license (https://creativecommons.org/licenses/by/4.0/).