
Spatial Distributions of Surface Sedimentary Organics and Sediment Profile Image Characteristics in a High-Energy Temperate Marine RiOMar: The West Gironde Mud Patch

 ,
,  , ,
, ,  , , , ,
  , and
, and 
Abstract
1. Introduction
2. Materials and Methods
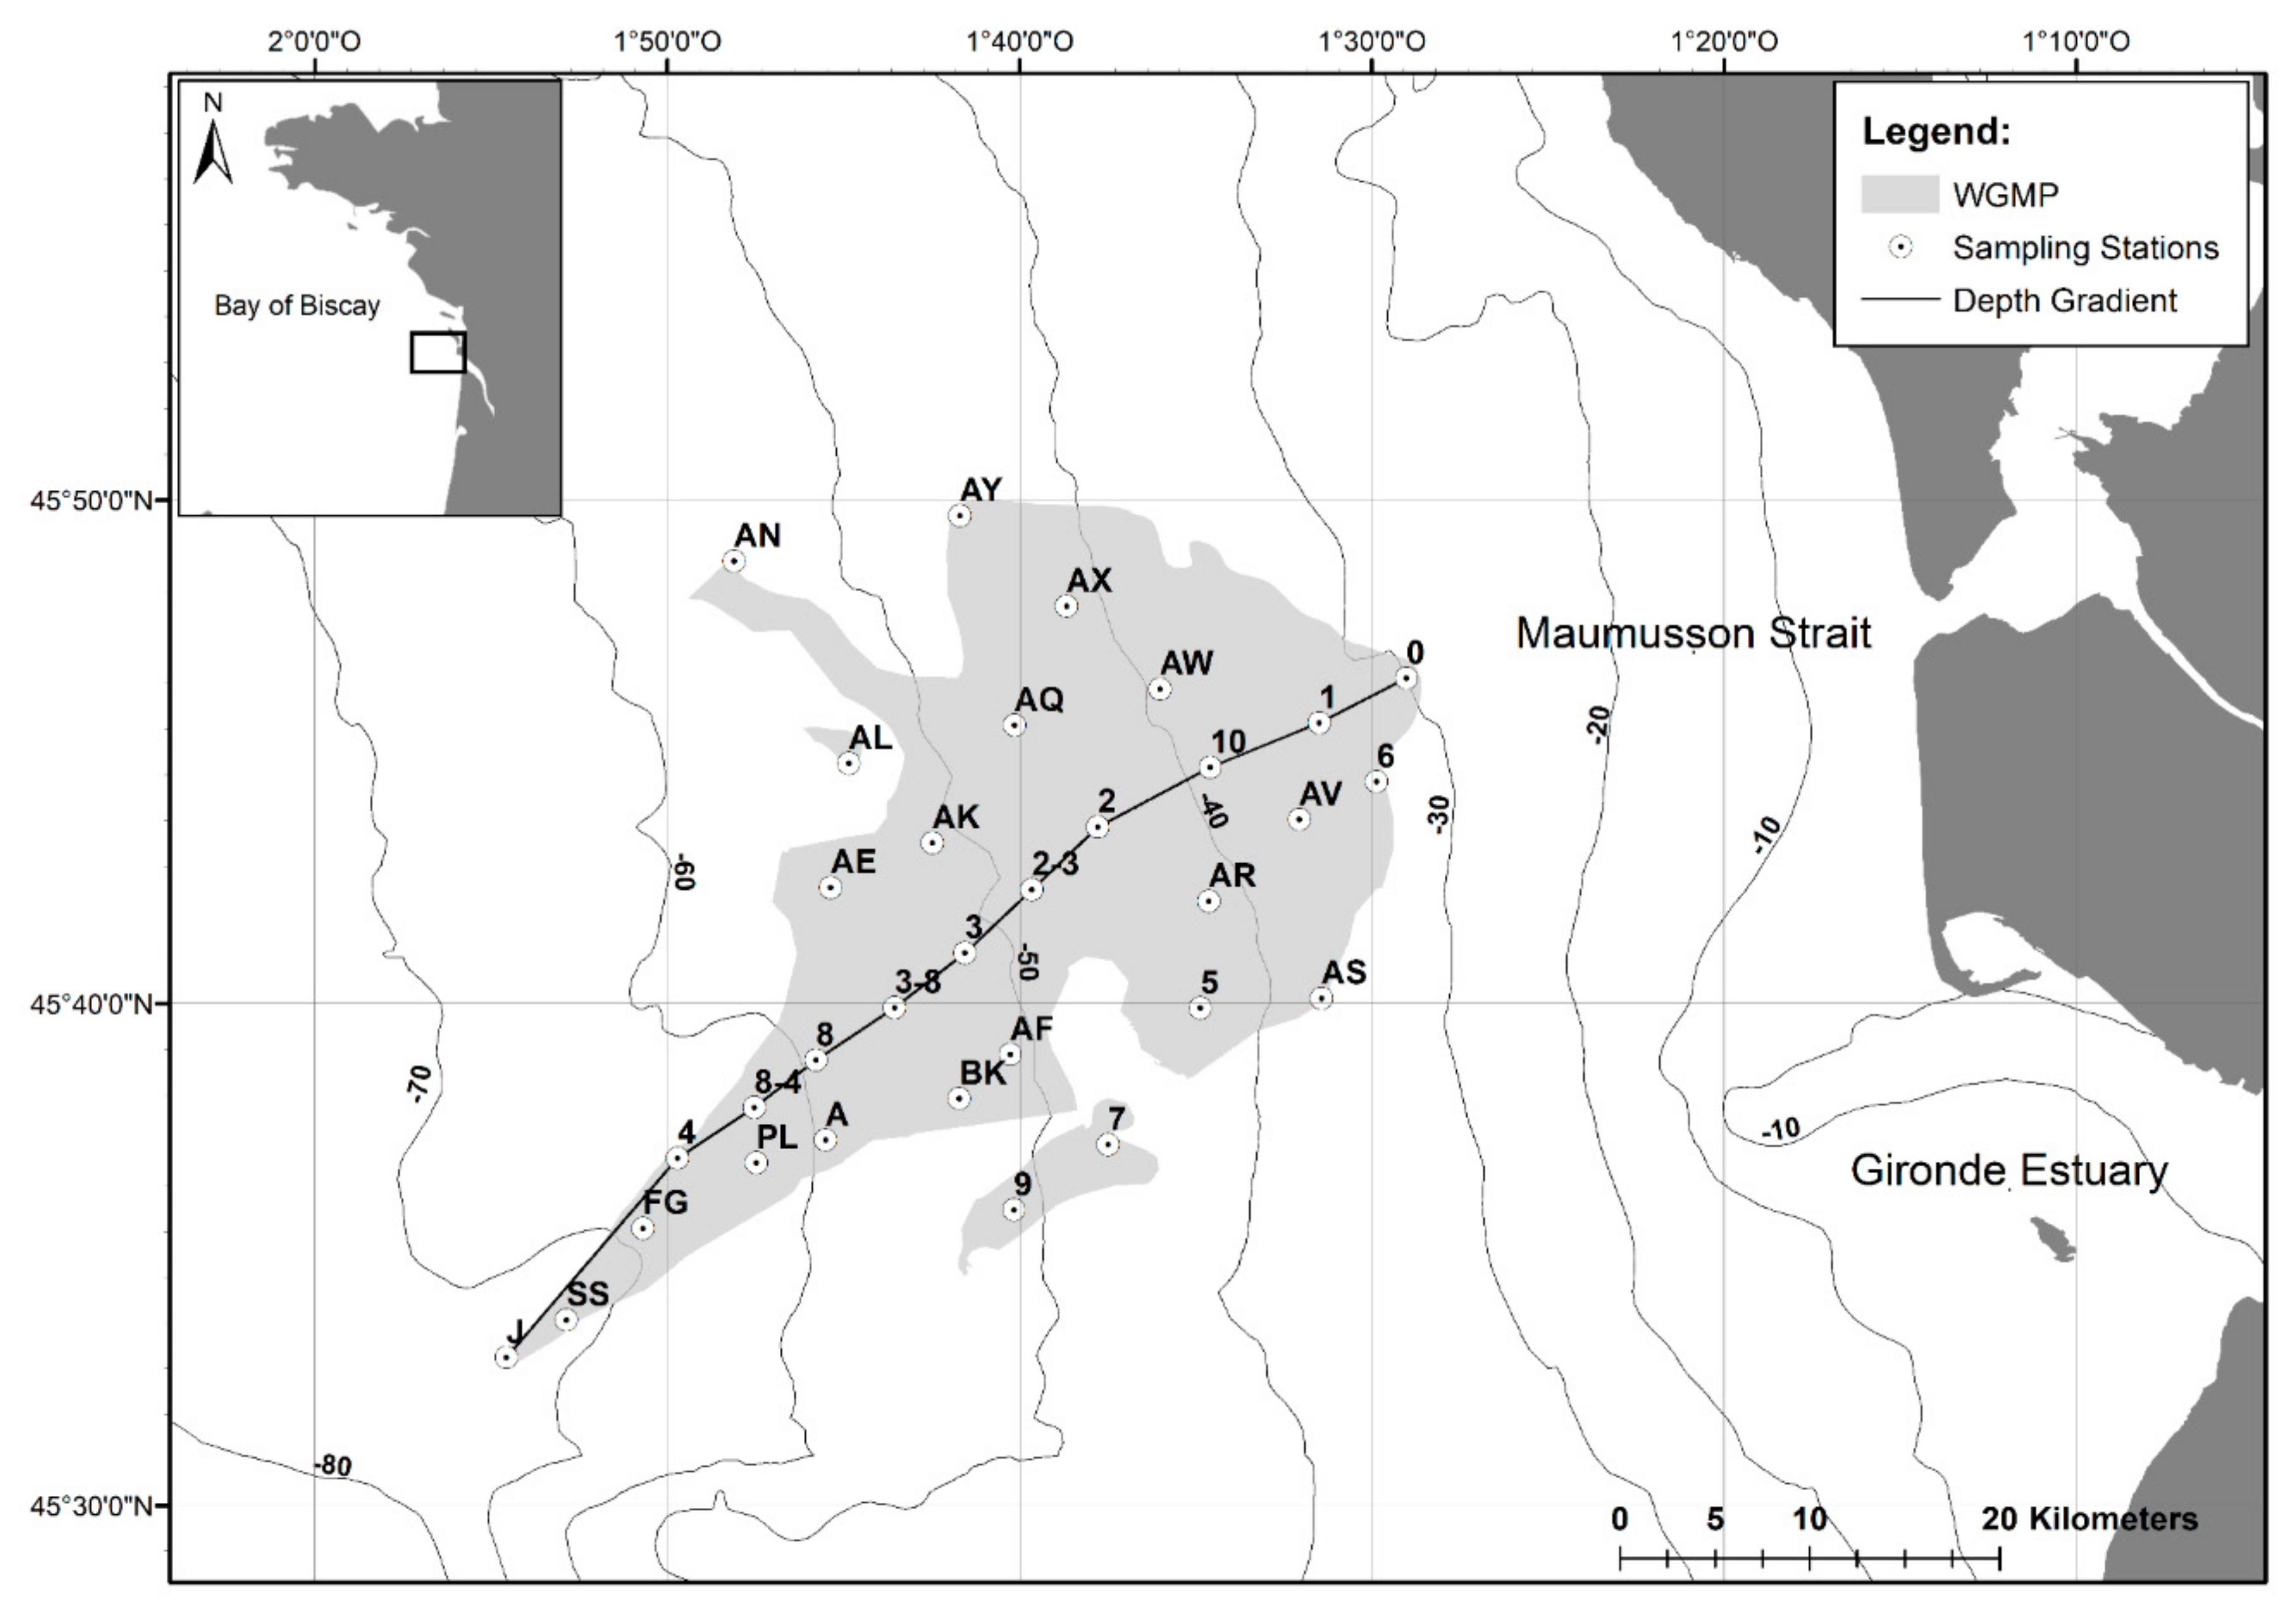
2.1. The West Gironde Mud Patch
2.2. Sampling of Surface Sediment and Sediment Profile Images
2.3. Analysis of Surface Sediment Characteristics
2.4. Analysis of Sediment Profile Images
2.5. Spatial Distribution of Bottom Shear Stress and Trawling Effort
2.6. Analysis of WGMP Data
2.6.1. Sediment Characteristics and Sediment Profile Images
2.6.2. Bottom Shear Stress and Trawling Effort
2.7. Comparisons with the Rhône River Prodelta
3. Results
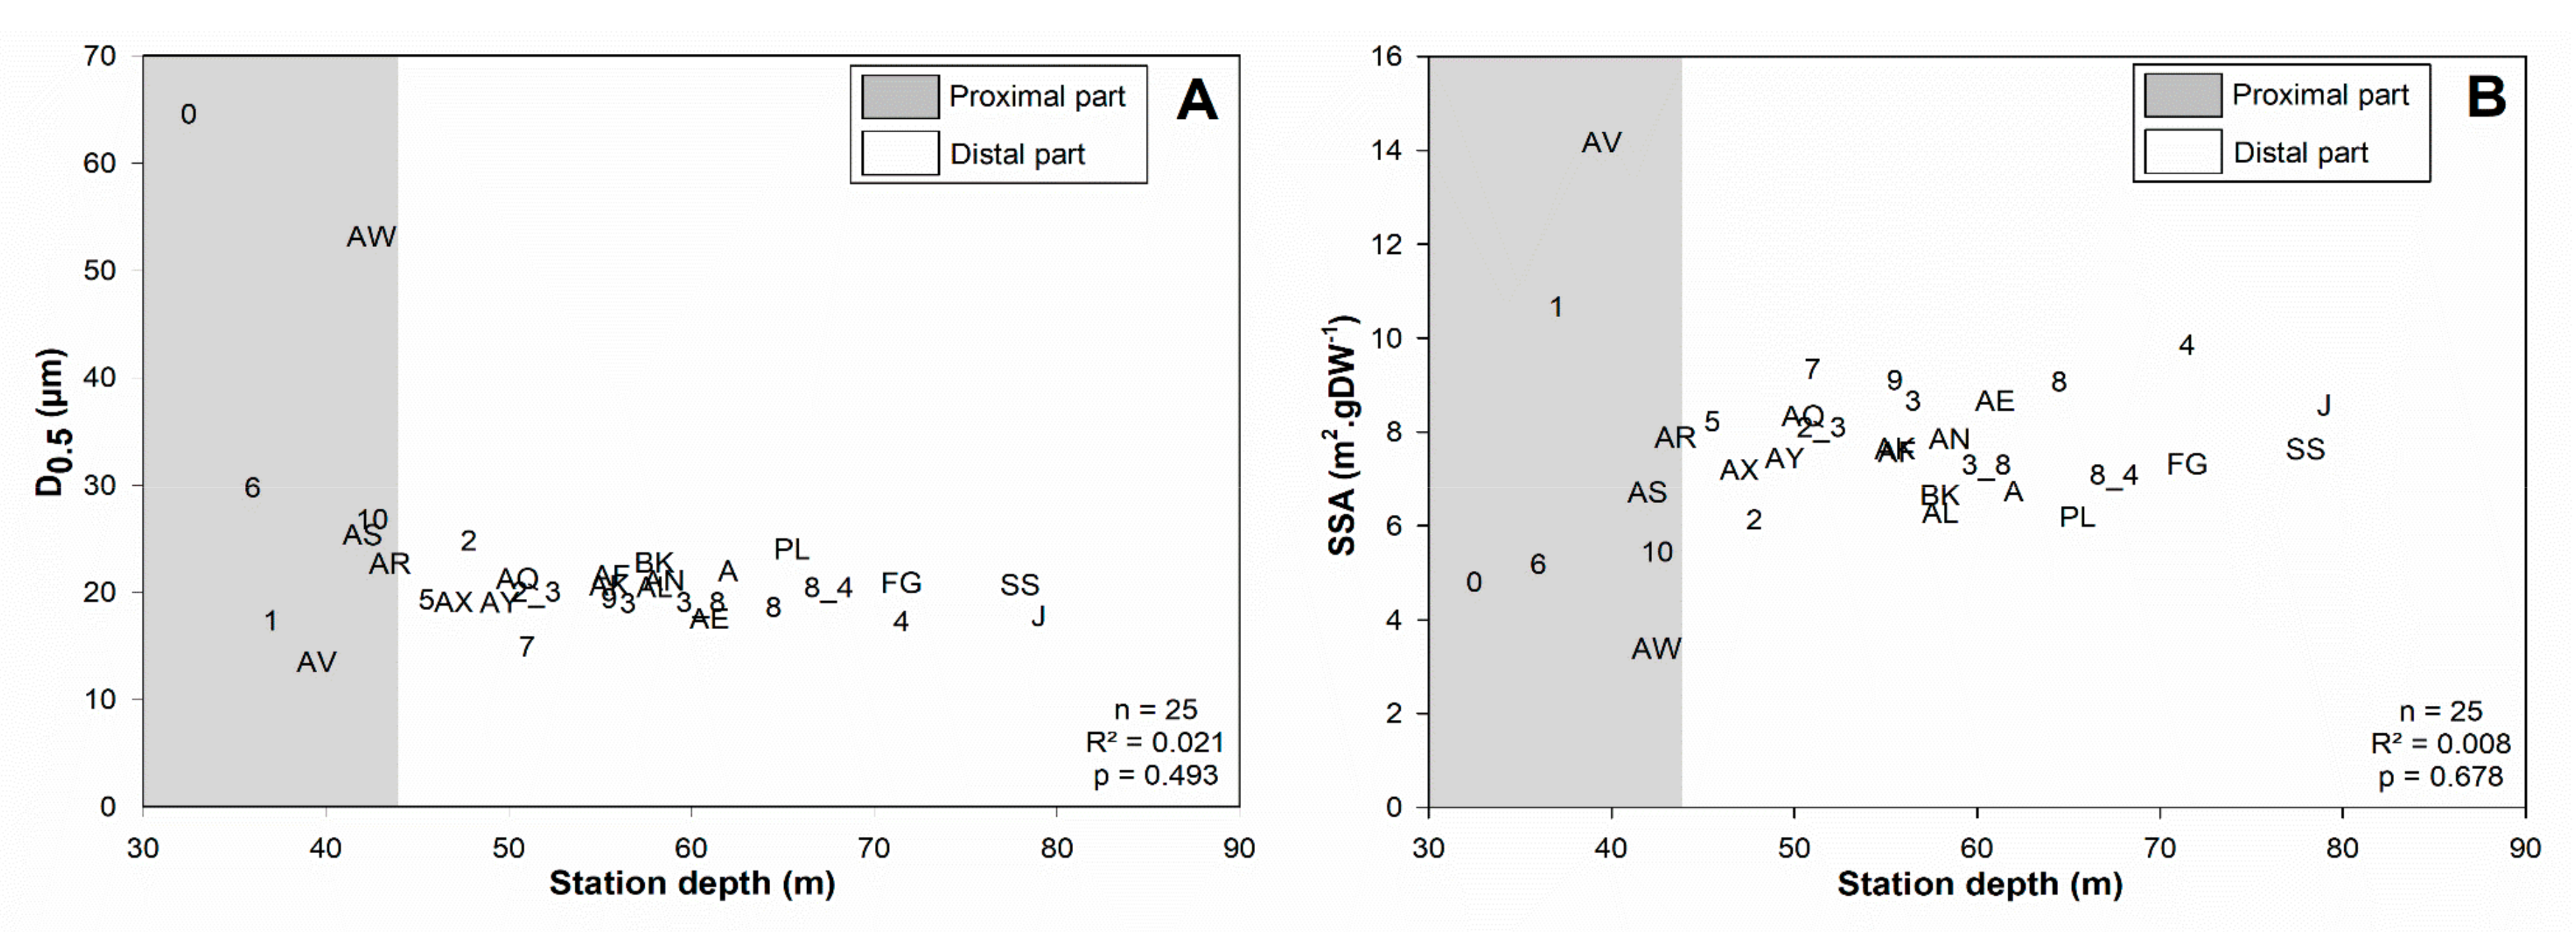
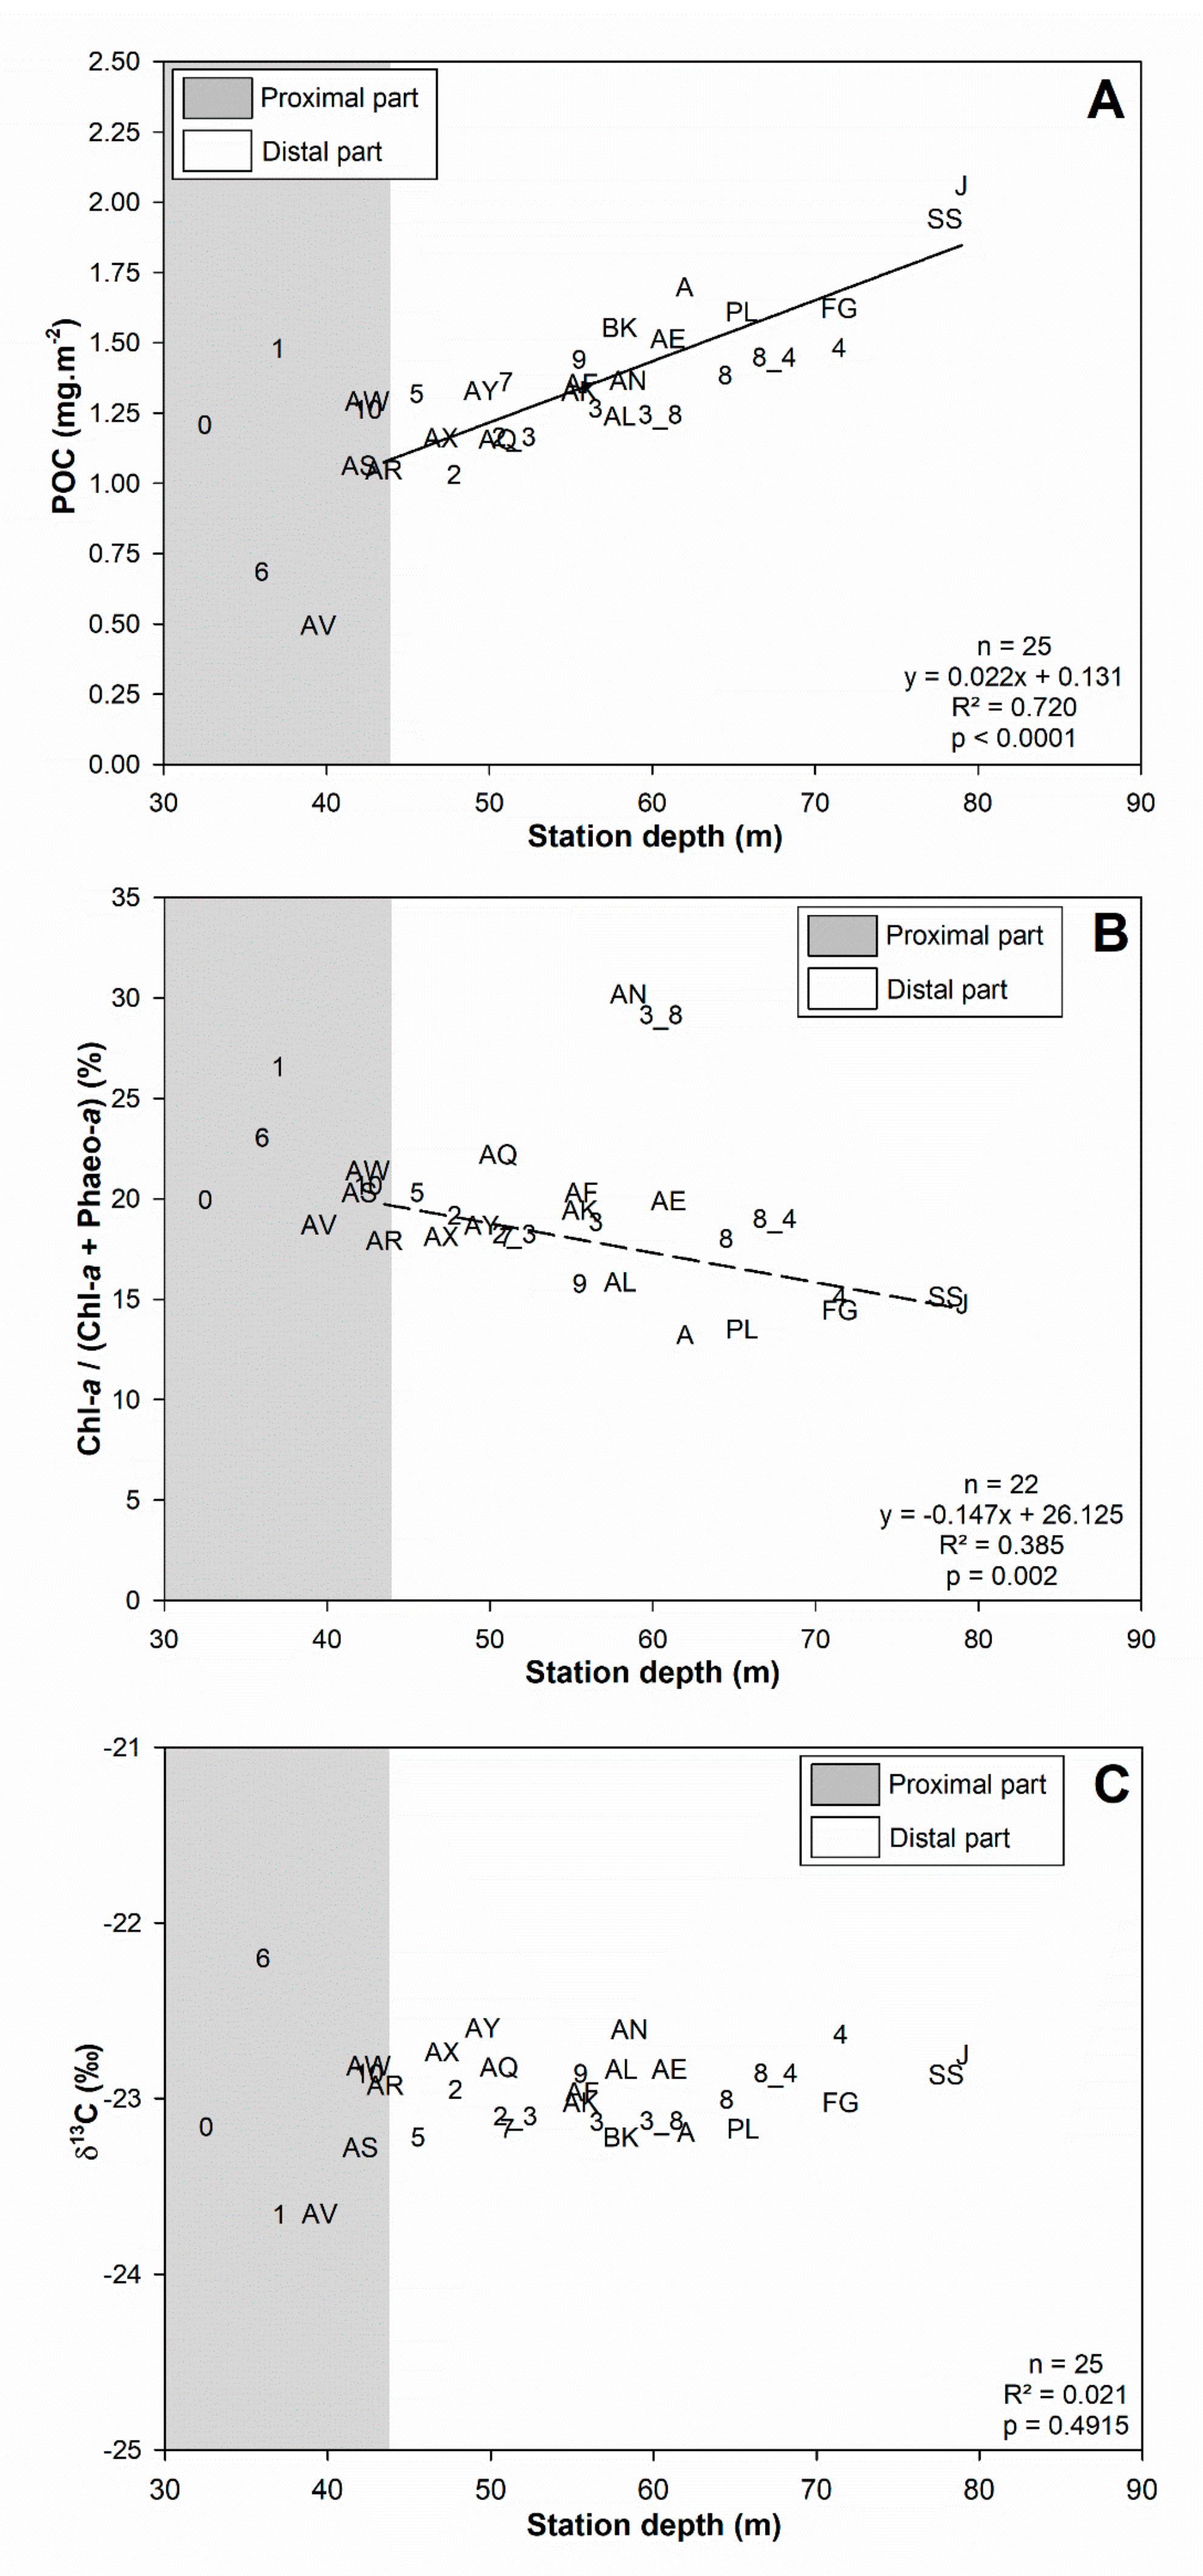
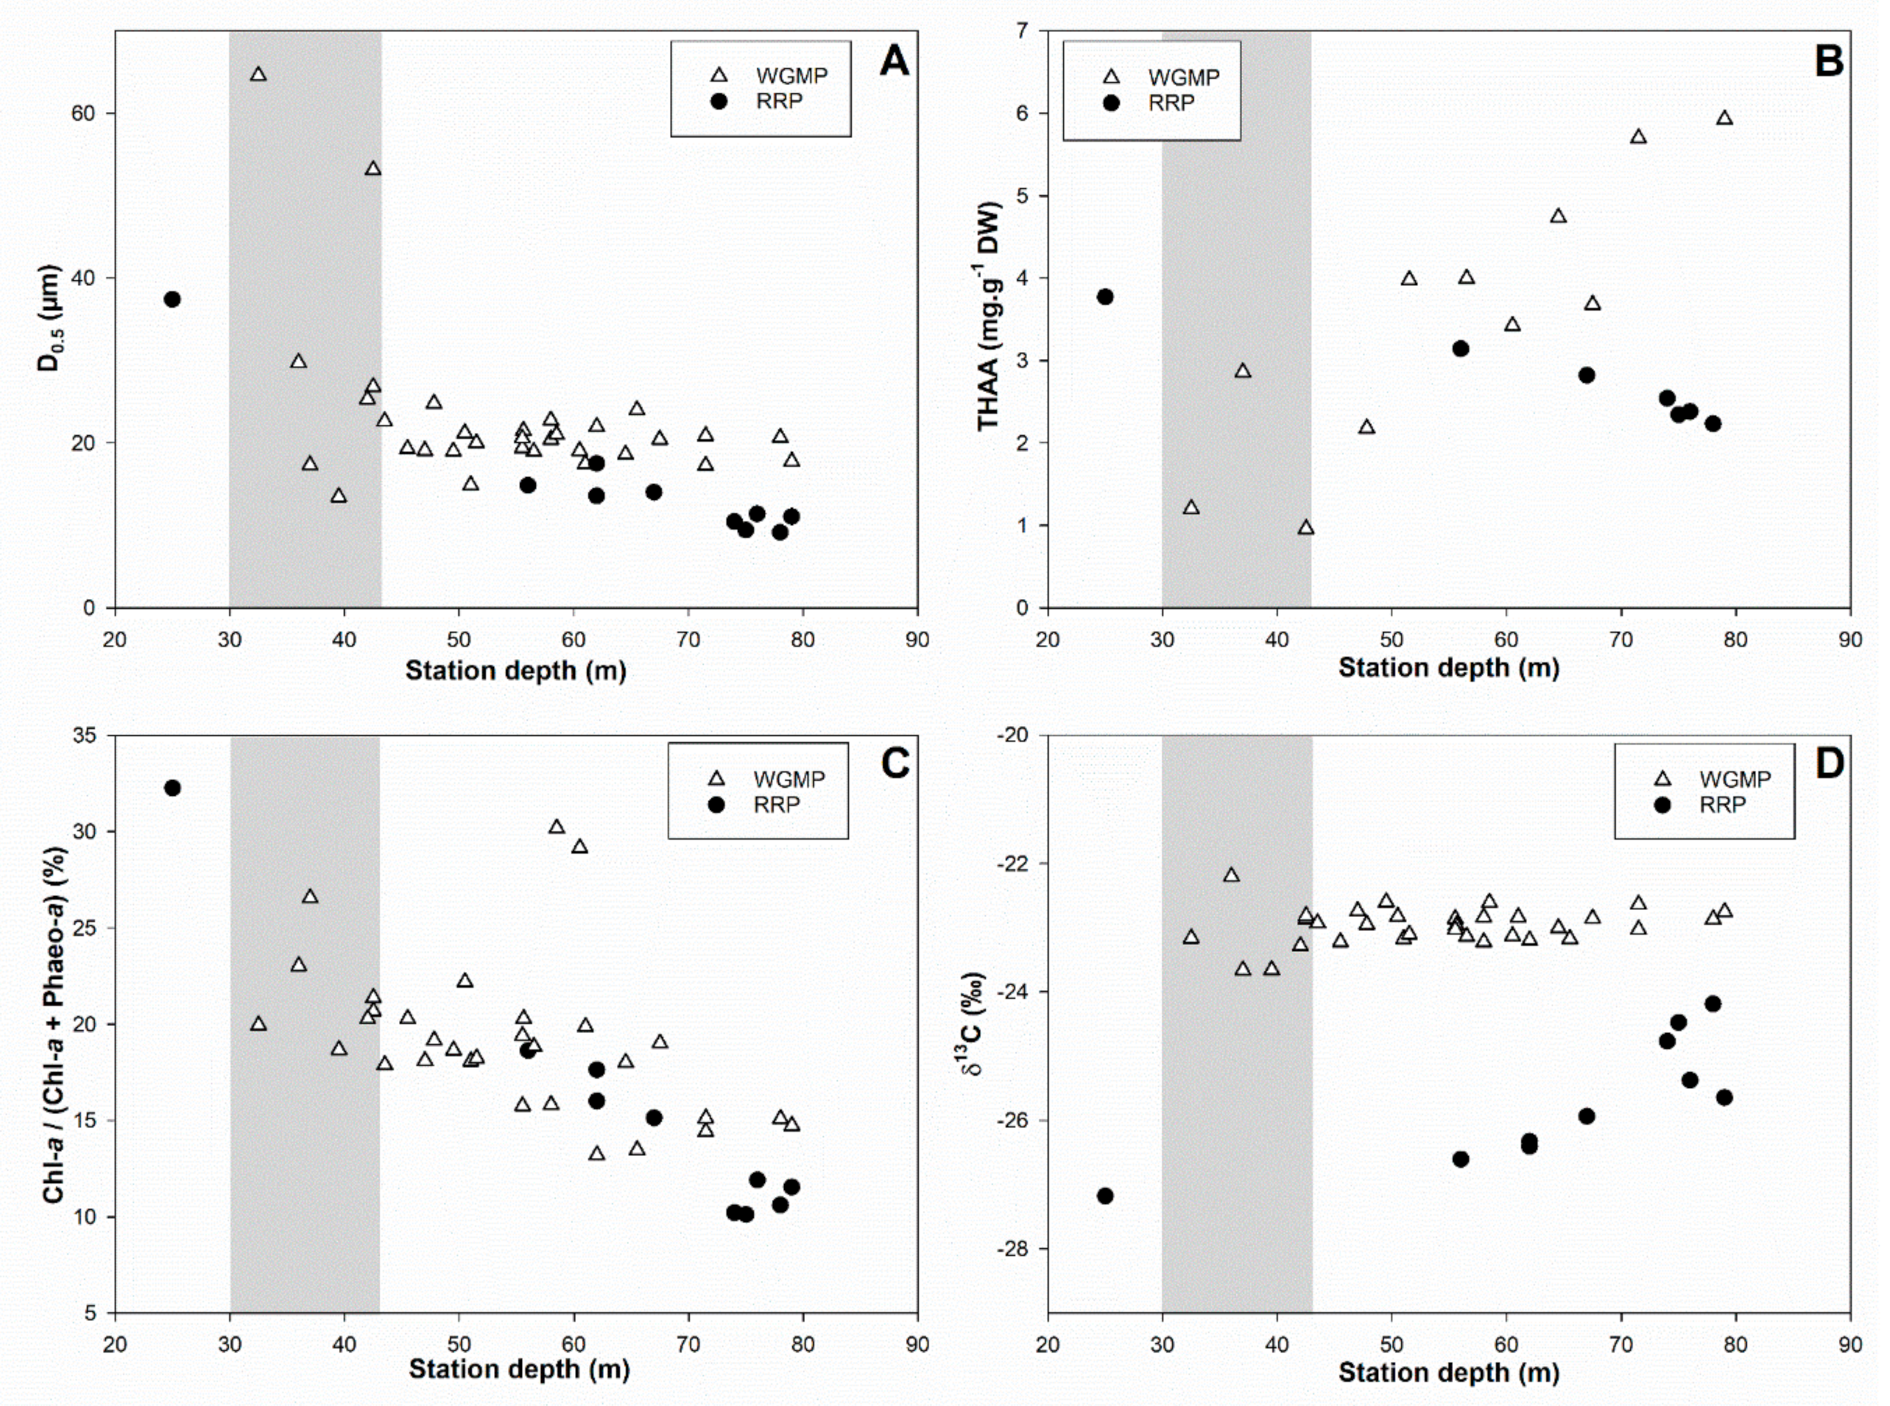
3.1. Surface Sediment Characteristics
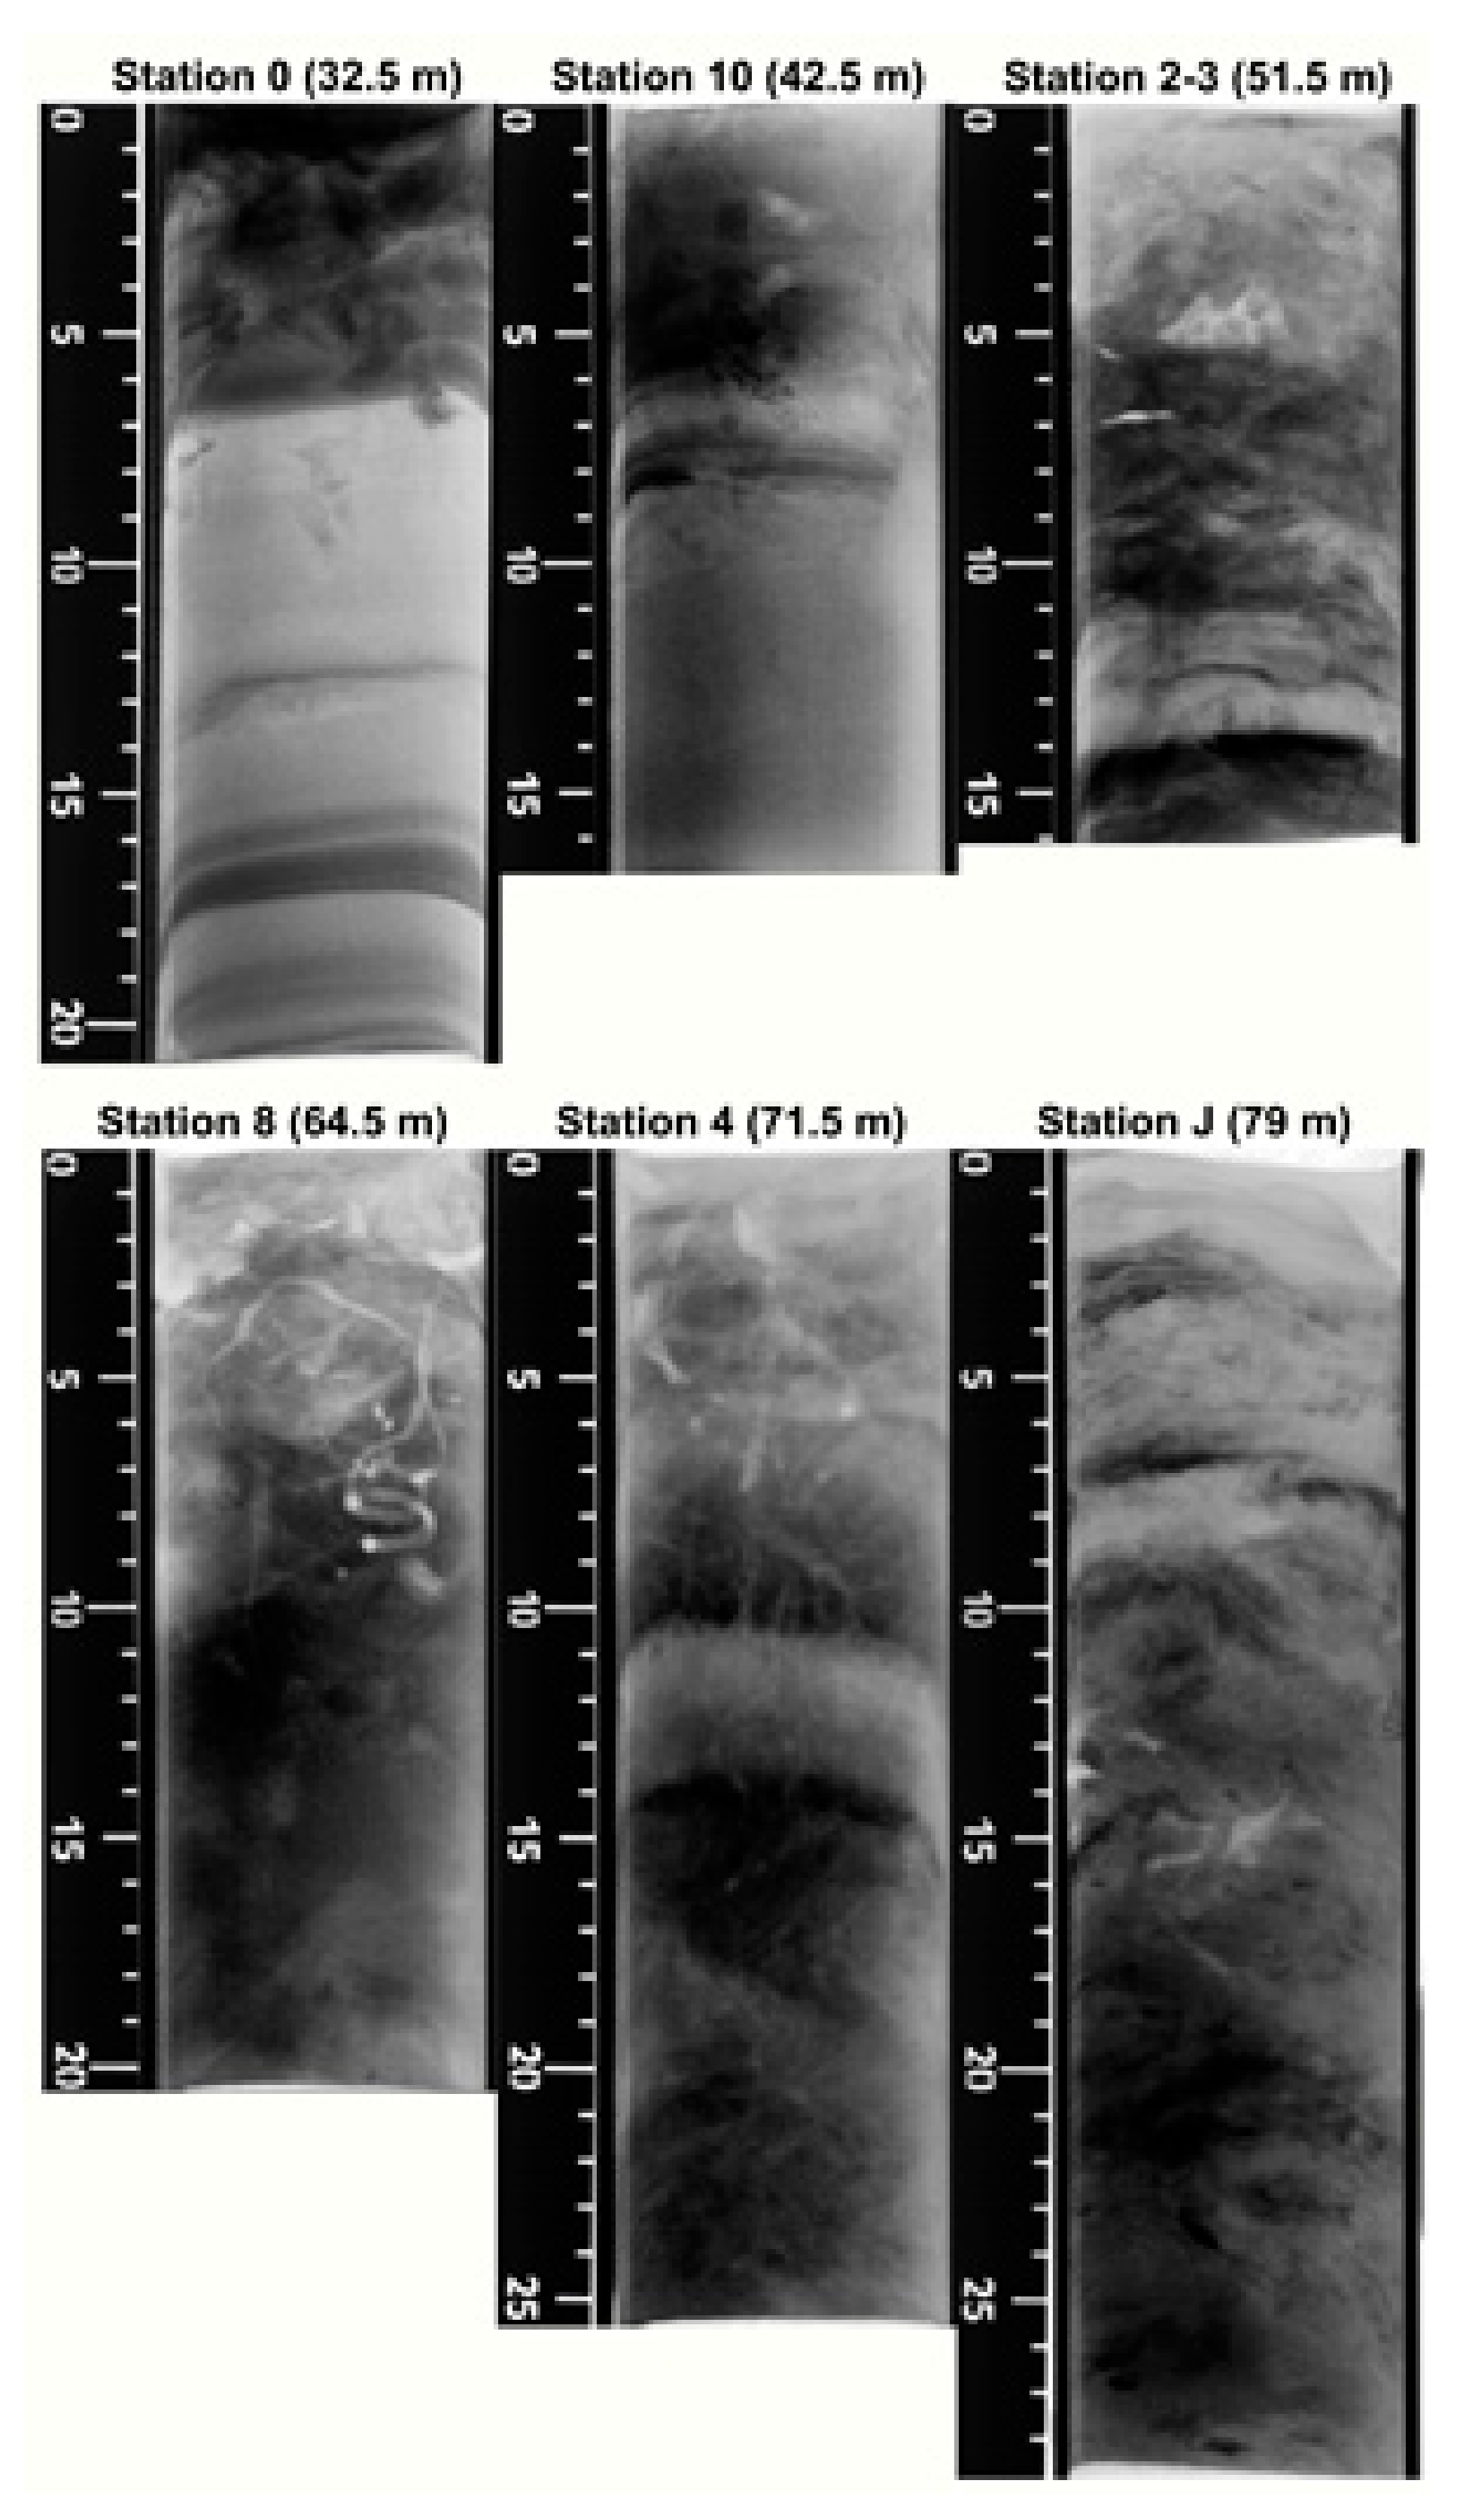
3.2. X-rays Radiographies
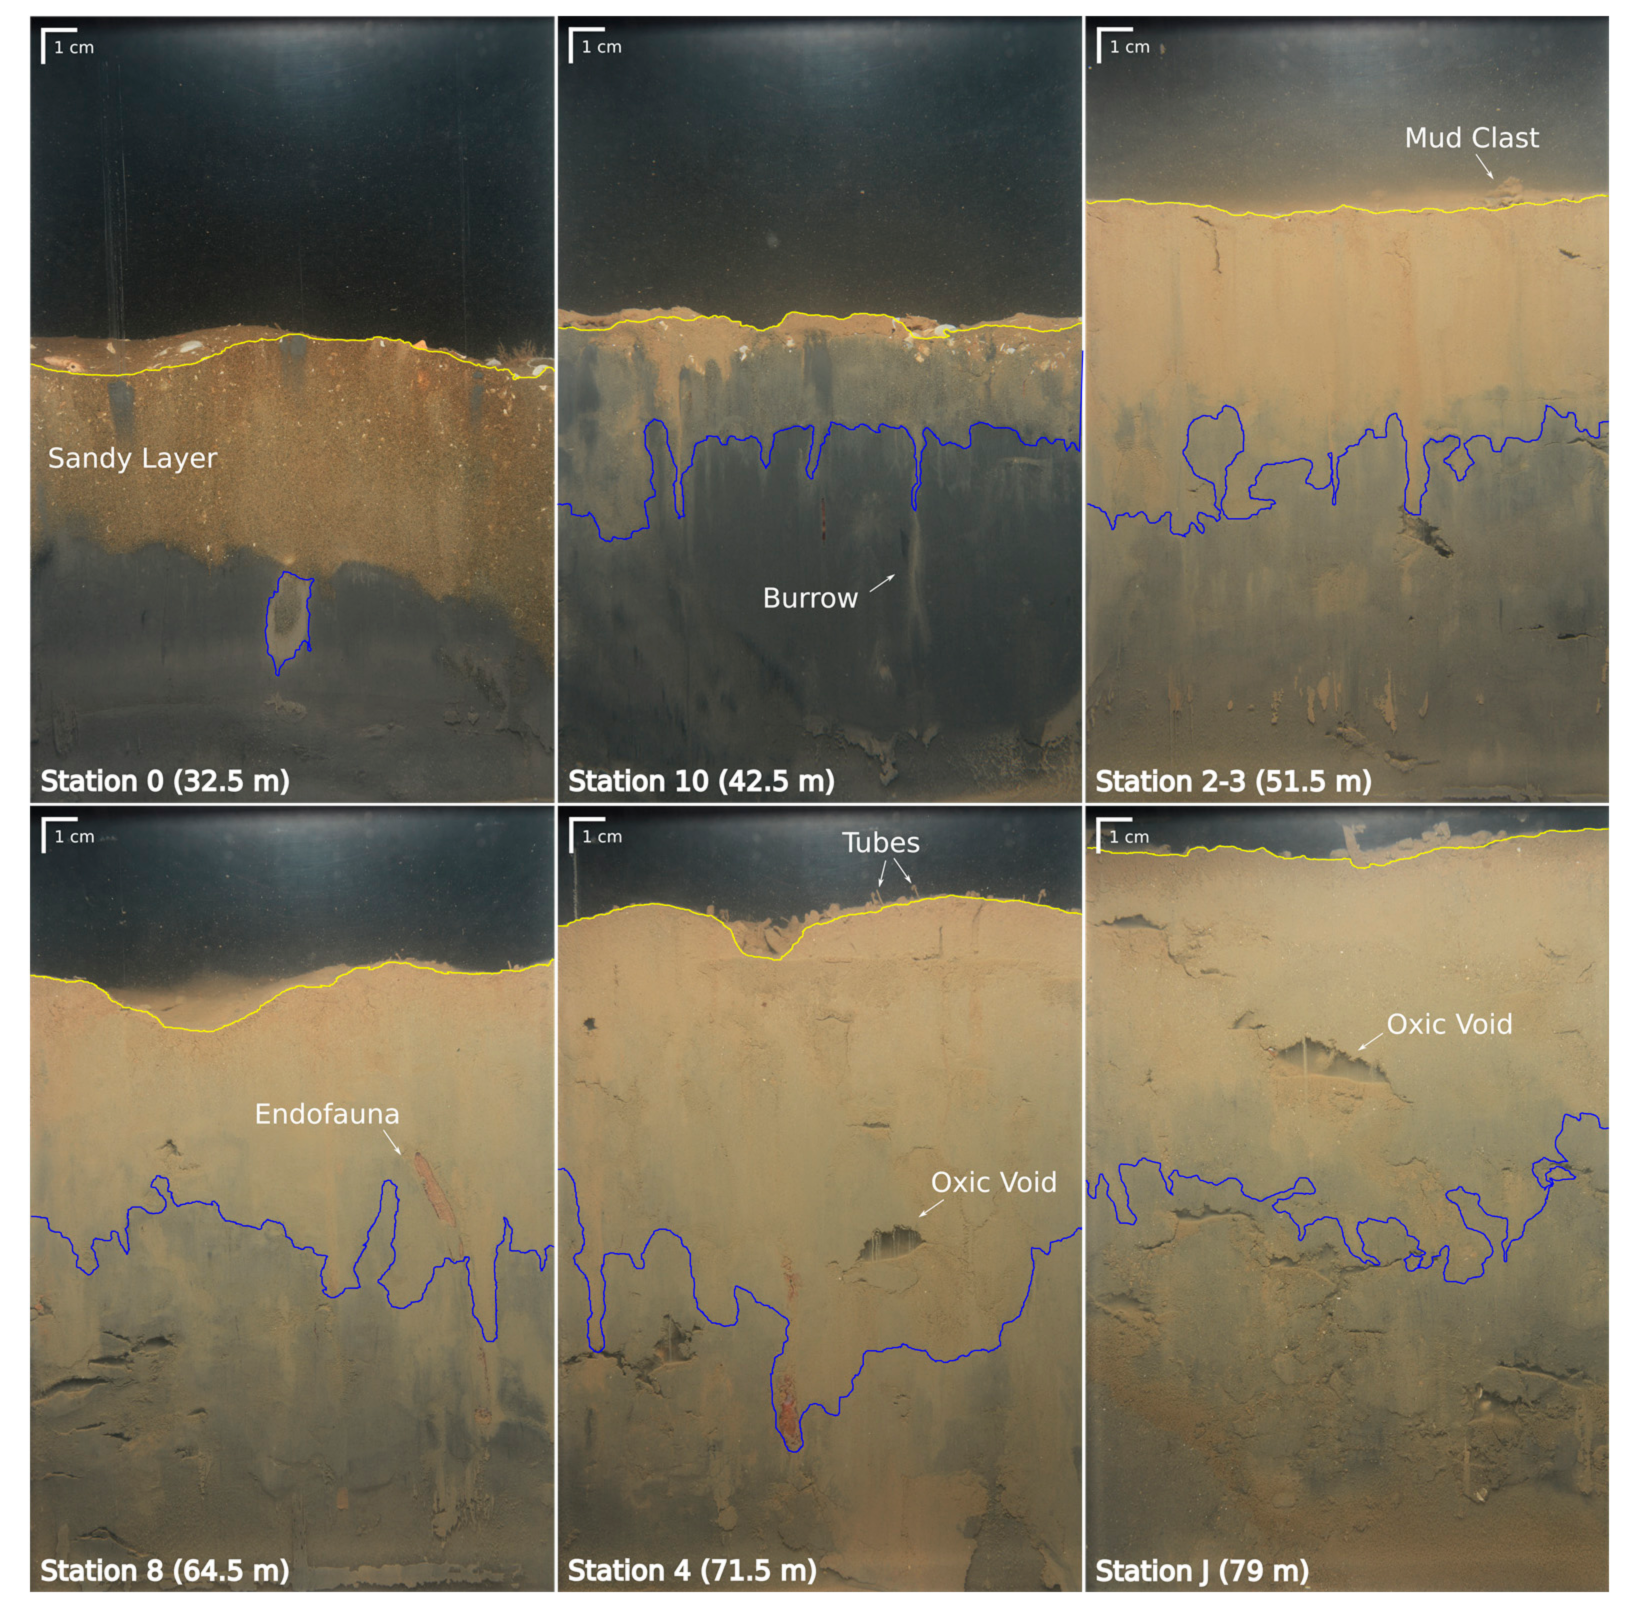
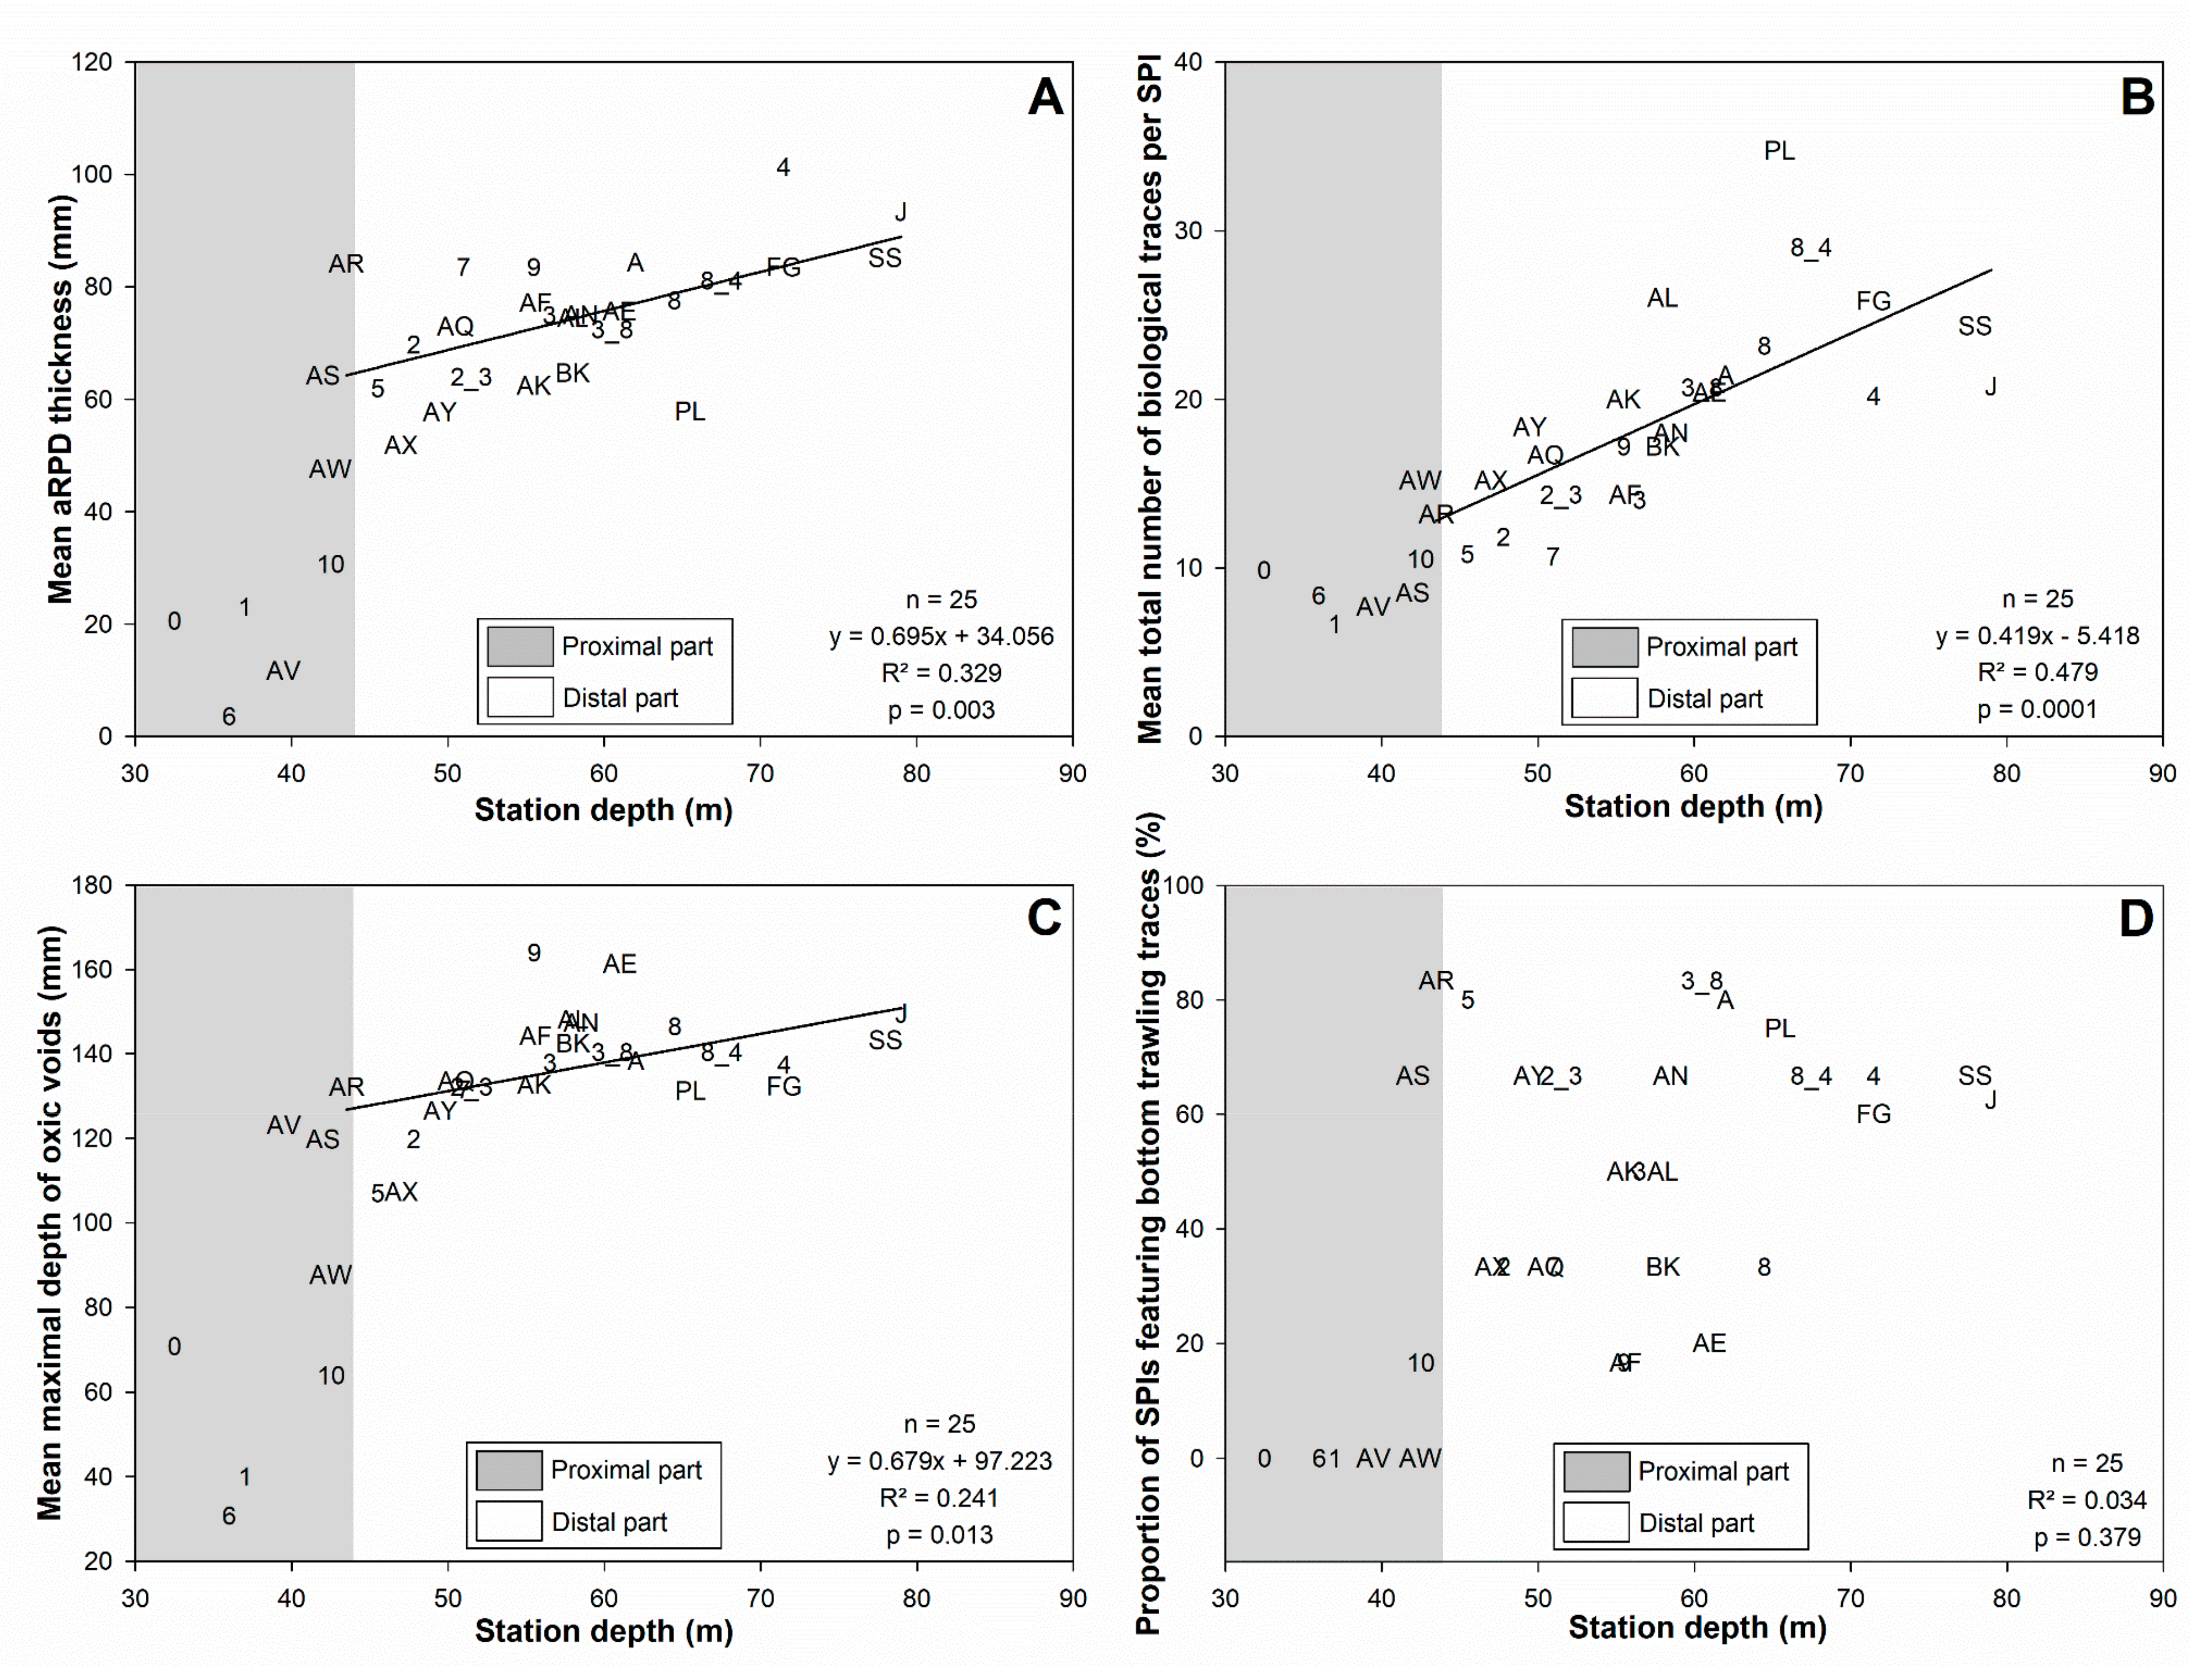
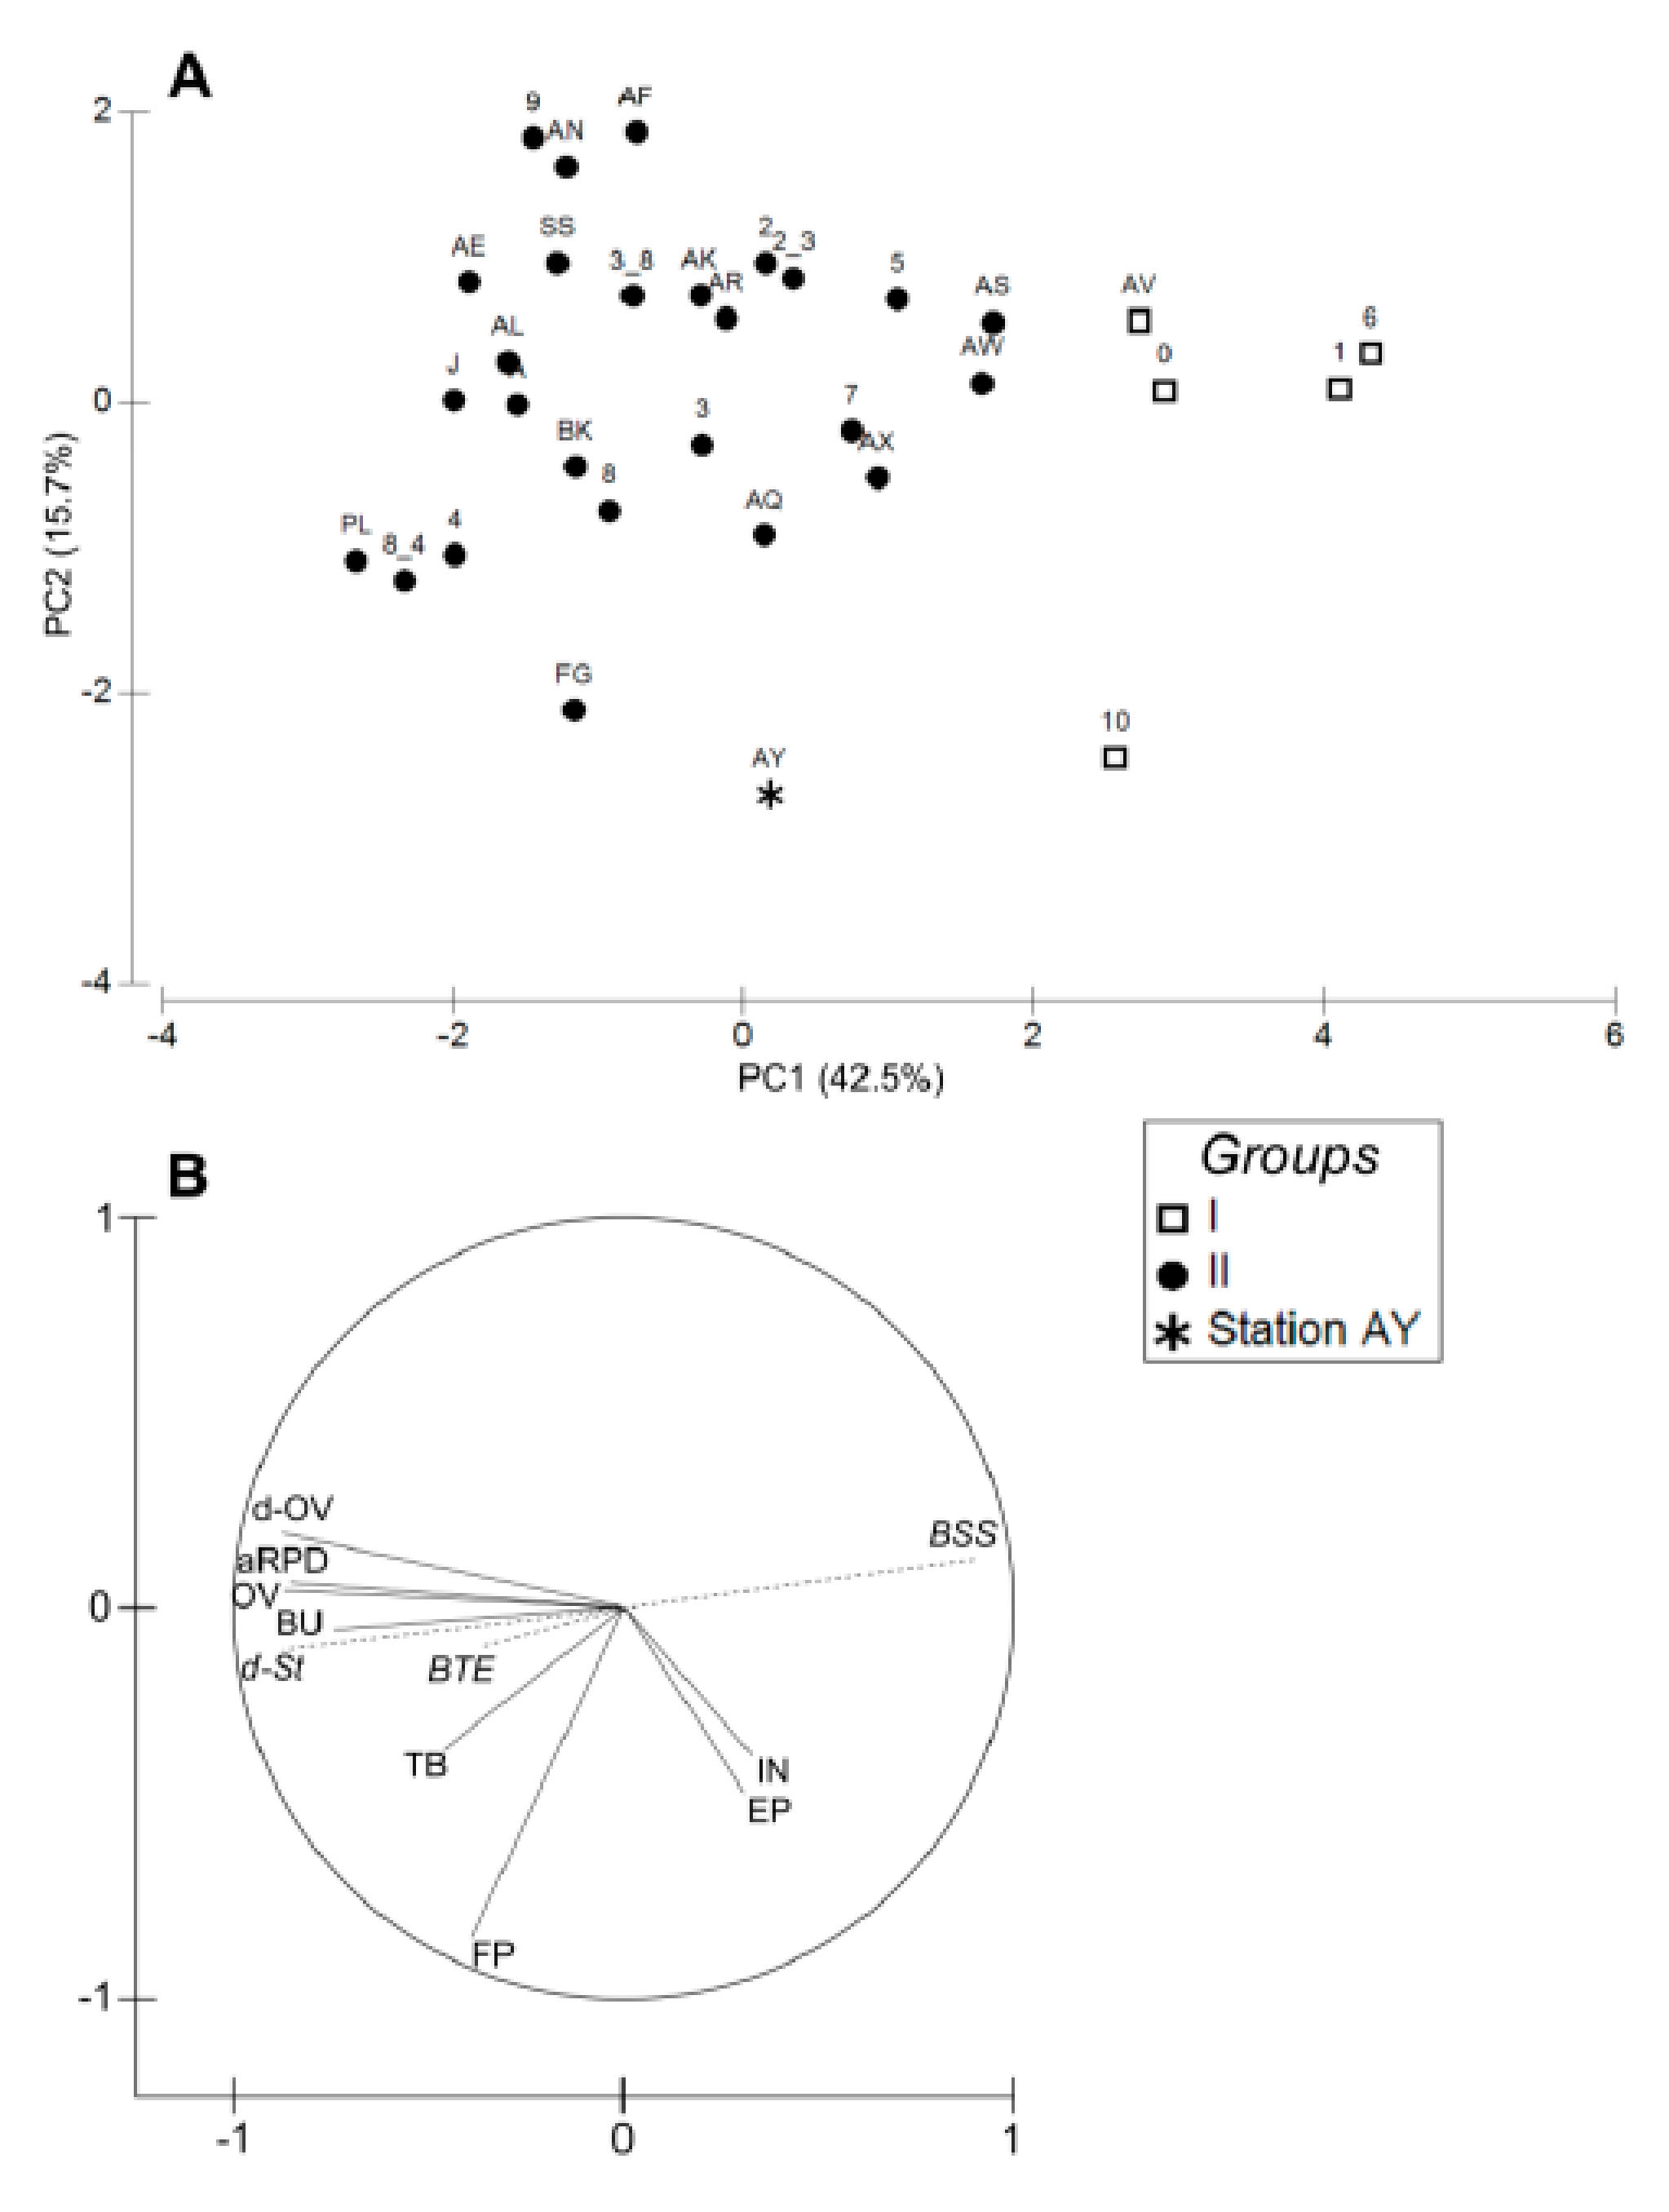
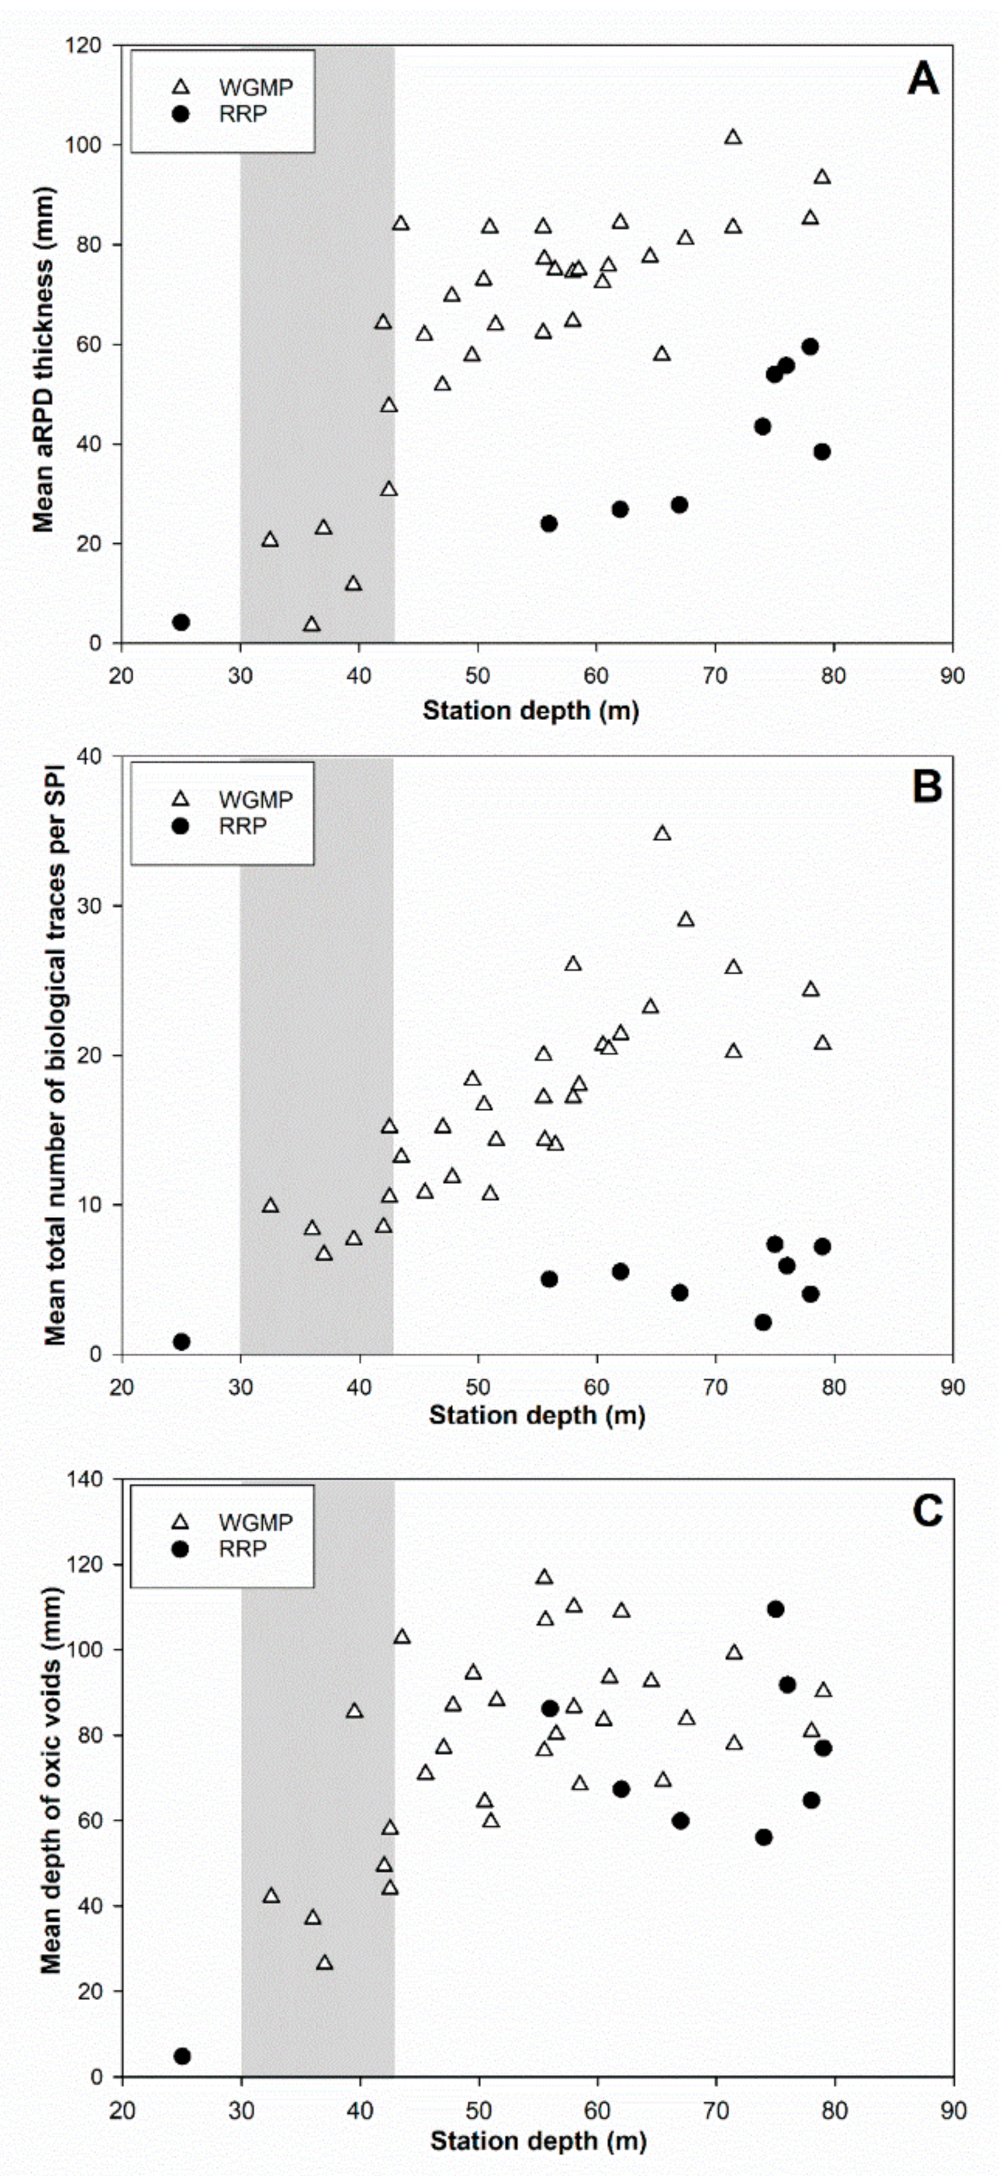
3.3. Sediment Profile Images
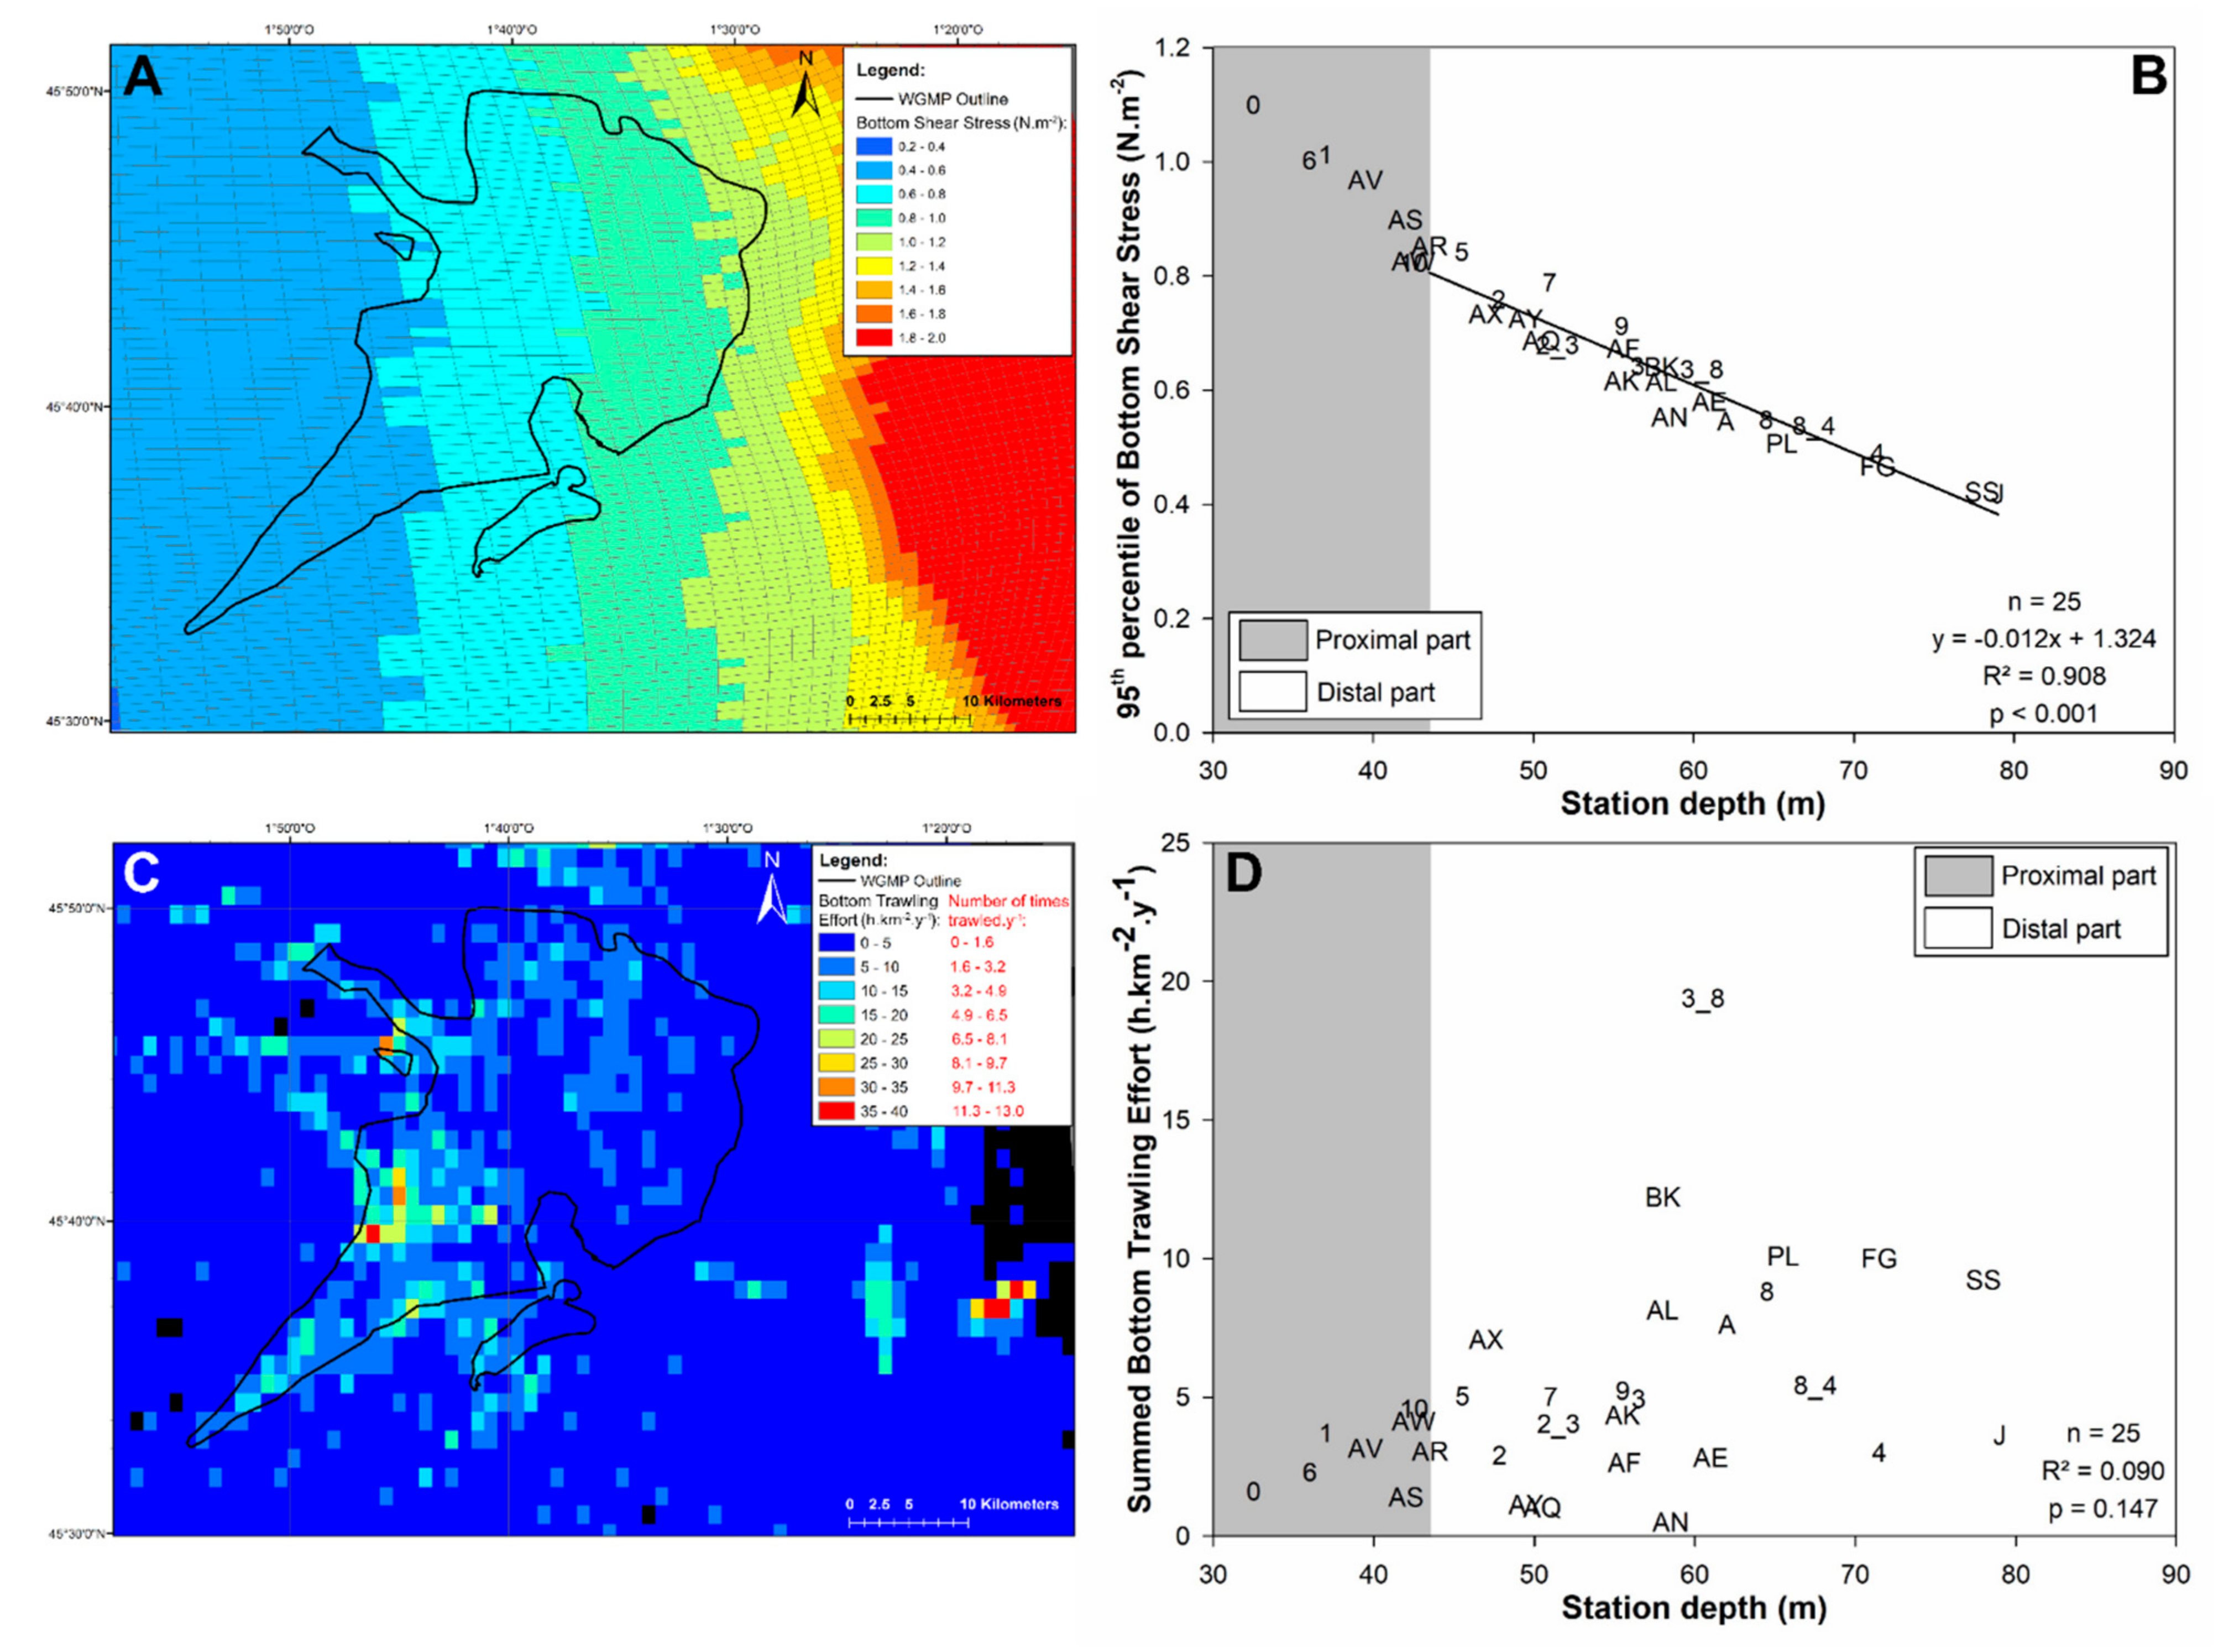
3.4. Bottom Shear Stress and Bottom Trawling Effort
3.5. Comparison with the Rhône River Prodelta
4. Discussion
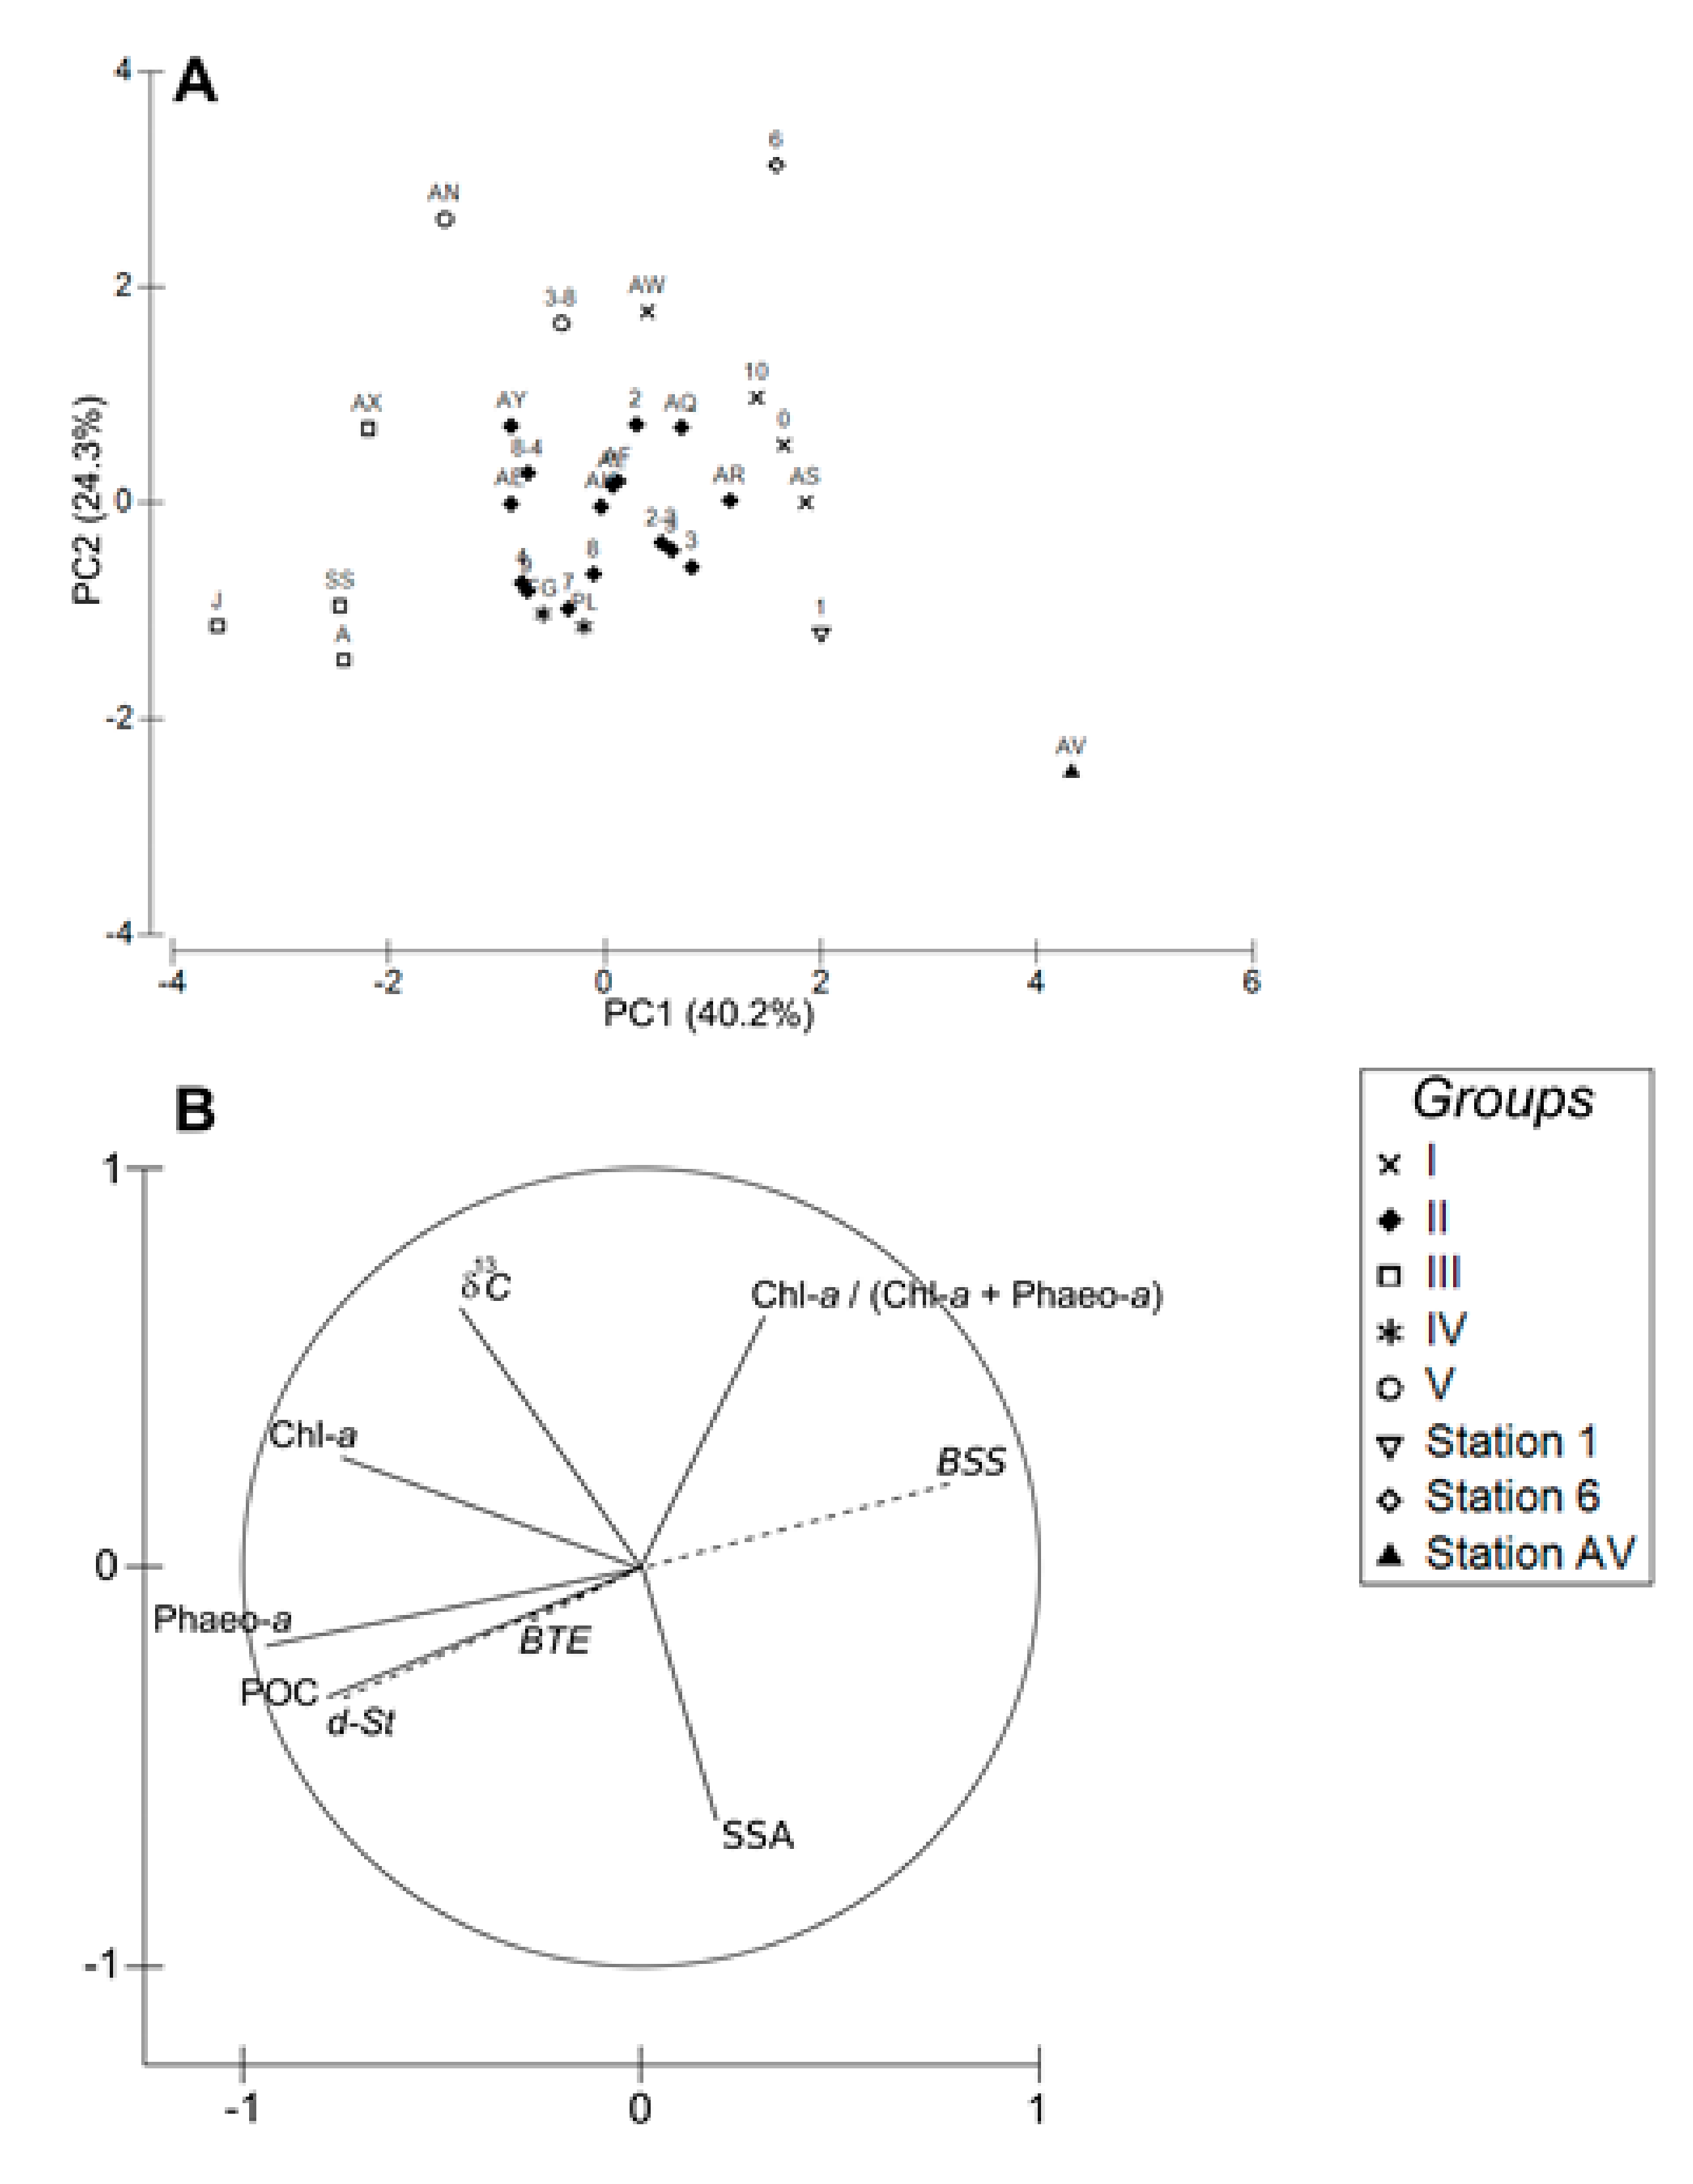
4.1. Spatial Structuration
4.1.1. Subdivision between Proximal and Distal Parts
4.1.2. Spatial Structuration of the Distal Part
4.1.3. Overall Conclusion
4.2. Disentangling the Potential Effects of Hydrodynamics and Bottom Trawling
4.3. Comparison with the Rhône River Prodelta
4.3.1. Surface Sediment Characteristics
4.3.2. Bioturbation
5. Conclusions
Author Contributions
Funding
Data Availability Statement
Acknowledgments
Conflicts of Interest
Appendix A


Appendix B

Appendix C

References
- Aller, R.C. Mobile deltaic and continental shelf muds as suboxic, fluidized bed reactors. Mar. Chem. 1998, 61, 143–155. [Google Scholar] [CrossRef]
- Burdige, D.J. Burial of terrestrial organic matter in marine sediments: A re-assessment. Glob. Biogeochem. Cycles 2005, 19, 1–7. [Google Scholar] [CrossRef]
- Blair, N.E.; Aller, R.C. The fate of terrestrial organic carbon in the marine environment. Ann. Rev. Mar. Sci. 2012, 4, 401–423. [Google Scholar] [CrossRef]
- Meade, R.H. River-sediment inputs to major deltas. In Sea Level-Rise and Coastal Subsidence. Coastal Systems and Continental Margins; Miliman, J.D., Haq, B.U., Eds.; Springer: Dordrecht, The Netherlands, 1996; Volume 2, pp. 63–85. [Google Scholar] [CrossRef]
- McKee, B.A.; Aller, R.C.; Allison, M.A.; Bianchi, T.S.; Kineke, G.C. Transport and transformation of dissolved and particulate materials on continental margins influenced by major rivers: Benthic boundary layer and seabed processes. Cont. Shelf Res. 2004, 24, 899–926. [Google Scholar] [CrossRef]
- Hedges, J.I.; Keil, R.G. Sedimentary organic matter preservation: An assessment and speculative synthesis. Mar. Chem. 1995, 49, 81–115. [Google Scholar] [CrossRef]
- Burdige, D.J. Estuarine and coastal sediments—Coupled biogeochemical cycling. In Treatise on Estuarine and Coastal Science; Wolanski, E., McLusky, D., Eds.; Academic Press: Cambridge, MA, USA, 2012; Volume 5, pp. 279–316. [Google Scholar] [CrossRef]
- Kristensen, E.; Penha-Lopes, G.; Delefosse, M.; Valdemarsen, T.; Quintana, C.O.; Banta, G.T. What is bioturbation? The need for a precise definition for fauna in aquatic sciences. Mar. Ecol. Prog. Ser. 2012, 446, 285–302. [Google Scholar] [CrossRef]
- Aller, R.C. The effects of macrobenthos on chemical properties of marine sediment and overlying water. In Animal-Sediment Relations; McCall, P.L., Tevesz, M.J.S., Eds.; Springer: Boston, MA, USA, 1982; Volume 100, pp. 53–102. [Google Scholar] [CrossRef]
- Kristensen, E. Organic matter diagenesis at the oxic/anoxic interface in coastal marine sediments, with emphasis on the role of burrowing animals. Hydrobiologia 2000, 426, 1–24. [Google Scholar] [CrossRef]
- Kristensen, E.; Kostka, J.E. Macrofaunal burrows and irrigation in marine sediment: Microbiological and biogeochemical interactions. In Interactions Between Macro- and Microorganisms in Marine Sediments; Kristensen, E., Haese, R.R., Kostka, J.E., Eds.; American Geophysical Union: Washington, DC, USA, 2013; pp. 125–157. [Google Scholar] [CrossRef]
- Rhoads, D.C.; Boesch, D.F.; Zhican, T.; Fengshan, X.; Liqiang, H.; Nilsen, K.J. Macrobenthos and sedimentary facies on the Changjiang delta platform and adjacent continental shelf, East China Sea. Cont. Shelf Res. 1985, 4, 189–213. [Google Scholar] [CrossRef]
- Watling, L.; Norse, E.A. Disturbance of the seabed by mobile fishing gear: A comparison to forest clearcutting. Conserv. Biol. 1998, 12, 1180–1197. [Google Scholar] [CrossRef]
- Durrieu De Madron, X.; Ferré, B.; Le Corre, G.; Grenz, C.; Conan, P.; Pujo-Pay, M.; Buscail, R.; Bodiot, O. Trawling-induced resuspension and dispersal of muddy sediments and dissolved elements in the Gulf of Lion (NW Mediterranean). Cont. Shelf Res. 2005, 25, 2387–2409. [Google Scholar] [CrossRef]
- Ferré, B.; Durrieu de Madron, X.; Estournel, C.; Ulses, C.; Le Corre, G. Impact of natural (waves and currents) and anthropogenic (trawl) resuspension on the export of particulate matter to the open ocean. Application to the Gulf of Lion (NW Mediterranean). Cont. Shelf Res. 2008, 28, 2071–2091. [Google Scholar] [CrossRef]
- Palanques, A.; Guillén, J.; Puig, P. Impact of bottom trawling on water turbidity and muddy sediment of an unfished continental shelf. Limnol. Oceanogr. 2001, 46, 1100–1110. [Google Scholar] [CrossRef]
- Palanques, A.; Puig, P.; Guillén, J.; Demestre, M.; Martín, J. Effects of bottom trawling on the Ebro continental shelf sedimentary system (NW Mediterranean). Cont. Shelf Res. 2014, 72, 83–98. [Google Scholar] [CrossRef]
- Oberle, F.K.J.; Storlazzi, C.D.; Hanebuth, T.J.J. What a drag: Quantifying the global impact of chronic bottom trawling on continental shelf sediment. J. Mar. Syst. 2016, 159, 109–119. [Google Scholar] [CrossRef]
- Mengual, B.; Cayocca, F.; Le Hir, P.; Draye, R.; Laffargue, P.; Vincent, B.; Garlan, T. Influence of bottom trawling on sediment resuspension in the ‘Grande-Vasière’ area (Bay of Biscay, France). Ocean Dyn. 2016, 66, 1181–1207. [Google Scholar] [CrossRef]
- Mengual, B.; Le Hir, P.; Cayocca, F.; Garlan, T. Bottom trawling contribution to the spatio-temporal variability of sediment fluxes on the continental shelf of the Bay of Biscay (France). Mar. Geol. 2019, 414, 77–91. [Google Scholar] [CrossRef]
- Thrush, S.F.; Dayton, P.K. Disturbance to marine benthic habitats by trawling and dredging: Implications for marine biodiversity. Annu. Rev. Ecol. Syst. 2002, 33, 449–473. [Google Scholar] [CrossRef]
- Thrush, S.F.; Gray, J.S.; Hewitt, J.E.; Ugland, K.I. Predicting the effects of habitat homogenization on marine biodiversity. Ecol. Appl. 2006, 16, 1636–1642. [Google Scholar] [CrossRef]
- Kaiser, M.J.; Collie, J.S.; Hall, S.J.; Jennings, S.; Poiner, I.R. Modification of marine habitats by trawling activities: Prognosis and solutions. Fish Fish. 2002, 3, 114–136. [Google Scholar] [CrossRef]
- Queirós, A.M.; Hiddink, J.G.; Kaiser, M.J.; Hinz, H. Effects of chronic bottom trawling disturbance on benthic biomass, production and size spectra in different habitats. J. Exp. Mar. Biol. Ecol. 2006, 335, 91–103. [Google Scholar] [CrossRef]
- Lesueur, P.; Jouanneau, J.M.; Boust, D.; Tastet, J.P.; Weber, O. Sedimentation rates and fluxes in the continental shelf mud fields in the Bay of Biscay (France). Cont. Shelf Res. 2001, 21, 1383–1401. [Google Scholar] [CrossRef]
- Lesueur, P.; Tastet, J.P.; Weber, O. Origin and morphosedimentary evolution of fine-grained modern continental shelf deposits: The Gironde mud fields (Bay of Biscay, France). Sedimentology 2002, 49, 1299–1320. [Google Scholar] [CrossRef]
- Doxaran, D.; Froidefond, J.M.; Castaing, P.; Babin, M. Dynamics of the turbidity maximum zone in a macrotidal estuary (the Gironde, France): Observations from field and MODIS satellite data. Estuar. Coast. Shelf Sci. 2009, 81, 321–332. [Google Scholar] [CrossRef]
- Constantin, S.; Doxaran, D.; Derkacheva, A.; Novoa, S.; Lavigne, H. Multi-temporal dynamics of suspended particulate matter in a macro-tidal river Plume (the Gironde) as observed by satellite data. Estuar. Coast. Shelf Sci. 2018, 202, 172–184. [Google Scholar] [CrossRef]
- Etcheber, H.; Schmidt, S.; Sottolichio, A.; Maneux, E.; Chabaux, G.; Escalier, J.M.; Wennekes, H.; Derriennic, H.; Schmeltz, M.; Quéméner, L.; et al. Monitoring water quality in estuarine environments: Lessons from the MAGEST monitoring program in the Gironde fluvial-estuarine system. Hydrol. Earth Syst. Sci. 2011, 15, 831–840. [Google Scholar] [CrossRef]
- Cirac, P.; Berne, S.; Castaing, P.; Weber, O. Processus de mise en place et d’évolution de la couverture sédimentaire superficielle de la plate-forme nord-aquitaine. Oceanol. Acta 2000, 23, 663–686. [Google Scholar] [CrossRef]
- Castaing, P.; Allen, G.P. Mechanisms controlling seaward escape of suspended sediment from the Gironde: A macrotidal estuary in France. Mar. Geol. 1981, 40, 101–118. [Google Scholar] [CrossRef]
- Castaing, P.; Allen, G.; Houdart, M.; Moign, Y. Étude par télédétection de la dispersion en mer des eaux estuariennes issues de la Gironde et du Pertuis de Maumusson. Oceanol. Acta 1979, 2, 459–469. [Google Scholar]
- Castaing, P.; Philipps, I.; Weber, O. Répartition et dispersion des suspensions dans les eaux du plateau continental aquitain. Oceanol. Acta 1982, 5, 85–96. [Google Scholar]
- Longère, P.; Dorel, D. Etude des sédiments meubles de la vasière de la Gironde et des régions avoisinantes. Rev. des Trav. l’Institut des Pêches Marit. 1970, 34, 233–256. [Google Scholar]
- Jouanneau, J.M.; Weber, O.; Latouche, C.; Vernet, J.P.; Dominik, J. Erosion, non-deposition and sedimentary processes through a sedimentological and radioisotopic study of surficial deposits from the “Ouest-Gironde vasière” (Bay of Biscay). Cont. Shelf Res. 1989, 9, 325–342. [Google Scholar] [CrossRef]
- Weber, O.; Jouanneau, J.M.; Ruch, P.; Mirmand, M. Grain-size relationship between suspended matter originating in the Gironde estuary and shelf mud-patch deposits. Mar. Geol. 1991, 96, 159–165. [Google Scholar] [CrossRef]
- Lesueur, P.; Tastet, J.P. Les Vasières de plate-forme du Golfe de Gascogne (France). Actes du IIIe Colloque International « Océanographie du Golfe de Gascogne » 1993, 181–184. [Google Scholar]
- Lesueur, P.; Tastet, J.P. Facies, internal structures and sequences of modern Gironde-derived muds on the Aquitaine inner shelf, France. Mar. Geol. 1994, 120, 267–290. [Google Scholar] [CrossRef]
- Gadel, F.; Jouanneau, J.M.; Weber, O.; Serve, L.; Comellas, L. Traceurs organiques dans les dépôts de la vasière Ouest-Gironde (Golfe de Gascogne). Oceanol. Acta 1997, 20, 687–695. [Google Scholar]
- Parra, M.; Castaing, P.; Jouanneau, J.M.; Grousset, F.; Latouche, C. Nd-Sr isotopic composition of present-day sediments from the Gironde Estuary, its draining basins and the WestGironde mud patch (SW France). Cont. Shelf Res. 1998, 19, 135–150. [Google Scholar] [CrossRef]
- Lesueur, P.; Weber, O.; Marambat, L.; Tastet, J.P.; Jouanneau, J.M.; Turon, J.L. Datation d’une vasière de plateforme atlantique au débouché d’un estuaire: La vasière à l’ouest de la Gironde (France) est d’âge historique (VIème siècle à nos jours). Comptes rendus l’Académie des Sci. Série 2 1989, 308, 935–940. [Google Scholar]
- Lesueur, P.; Tastet, J.P.; Weber, O.; Sinko, J.A. Modèle faciologique d’un corps sédimentaire pélitique de plate-forme la vasière Ouest-Gironde (France). Oceanol. Acta 1991, 11, 143–153. [Google Scholar]
- Lesueur, P.; Tastet, J.P.; Marambat, L. Shelf mud fields formation within historical times: Examples from offshore the Gironde estuary, France. Cont. Shelf Res. 1996, 16, 1849–1870. [Google Scholar] [CrossRef]
- Relexans, J.C.; Lin, R.G.; Castel, J.; Etcheber, H.; Laborde, P. Response of biota to sedimentary organic matter quality of the west Gironde mud patch, Bay of Biscay (France). Oceanol. Acta 1992, 15, 639–649. [Google Scholar]
- Massé, C.; Meisterhans, G.; Deflandre, B.; Bachelet, G.; Bourasseau, L.; Bichon, S.; Ciutat, A.; Jude-Lemeilleur, F.; Lavesque, N.; Raymond, N.; et al. Bacterial and macrofaunal communities in the sediments of the West Gironde Mud Patch, Bay of Biscay (France). Estuar. Coast. Shelf Sci. 2016, 179, 189–200. [Google Scholar] [CrossRef]
- Système d’Informations Halieutiques Ifremer. In Activité des navires de pêche région Nouvelle-Aquitaine; Ifremer: Paris, France, 2017.
- Lesueur, P. Les Vasières de la Plate-Forme Ouest Gironde (France): Modèle Faciologique Et Archive Sédimentaire Des Flux Côtiers. Ph.D. Thesis, Université Bordeaux 1, Talence, France, 19 October 1992. [Google Scholar]
- Gillet, H.; Deflandre, B. JERICOBENT-5-TH cruise, RV Thalia; Université de Bordeaux: Bordeaux, France, 2018. [Google Scholar] [CrossRef]
- Schmidt, S.; Deflandre, B. JERICOBENT-5 cruise, RV Côtes De La Manche; Université de Bordeaux: Bordeaux, France, 2018. [Google Scholar] [CrossRef]
- Mayer, L.M. Surface area control of organic carbon accumulation in continental shelf sediments. Geochim. Cosmochim. Acta 1994, 58, 1271–1284. [Google Scholar] [CrossRef]
- Migeon, S.; Weber, O.; Faugeres, J.C.; Saint-Paul, J. SCOPIX: A new X-ray imaging system for core analysis. Geo-Mar. Lett. 1999, 18, 251–255. [Google Scholar] [CrossRef]
- Rhoads, D.C.; Germano, J.D. Characterization of organism-sediment relations using sediment profile imaging: An efficient method of remote ecological monitoring of the seafloor (Remots System). Mar. Ecol. Prog. Ser. 1982, 8, 115–128. [Google Scholar] [CrossRef]
- Etcheber, H.; Relexans, J.C.; Beliard, M.; Weber, O.; Buscail, R.; Heussner, S. Distribution and quality of sedimentary organic matter on the Aquitanian margin (Bay of Biscay). Deep. Res. Part II 1999, 46, 2249–2288. [Google Scholar] [CrossRef]
- Mayer, L.M.; Schick, L.L.; Sawyer, T.; Plante, C.J.; Jumars, P.A.; Self, R.L. Bioavailable amino acids in sediments: A biomimetic, kinetics based approach. Limnol. Oceanogr. 1995, 40, 511–520. [Google Scholar] [CrossRef]
- Pastor, L.; Deflandre, B.; Viollier, E.; Cathalot, C.; Metzger, E.; Rabouille, C.; Escoubeyrou, K.; Lloret, E.; Pruski, A.M.; Vétion, G.; et al. Influence of the organic matter composition on benthic oxygen demand in the Rhône River prodelta (NW Mediterranean Sea). Cont. Shelf Res. 2011, 31, 1008–1019. [Google Scholar] [CrossRef]
- Bonifácio, P.; Bourgeois, S.; Labrune, C.; Amouroux, J.M.; Escoubeyrou, K.; Buscail, R.; Romero-Ramirez, A.; Lantoine, F.; Vétion, G.; Bichon, S.; et al. Spatiotemporal changes in surface sediment characteristics and benthic macrofauna composition off the Rhône River in relation to its hydrological regime. Estuar. Coast. Shelf Sci. 2014, 151, 196–209. [Google Scholar] [CrossRef]
- Wakeham, S.G.; Lee, C.; Hedges, J.I.; Hernes, P.J.; Peterson, M.L. Molecular indicators of diagenetic status in marine organic matter. Geochim. Cosmochim. Acta 1997, 61, 5363–5369. [Google Scholar] [CrossRef]
- Neveux, J.; Lantoine, F. Spectrofluorometric assay of chlorophylls and phaeopigments using the least squares approximation technique. Deep. Res. Part I 1993, 40, 1747–1765. [Google Scholar] [CrossRef]
- Coplen, T.B. Guidelines and recommended terms for expression of stable- isotope-ratio and gas-ratio measurement results. Rapid Commun. Mass Spectrom 2011, 25, 2538–2560. [Google Scholar] [CrossRef] [PubMed]
- Romero-Ramirez, A.; Grémare, A.; Desmalades, M.; Duchêne, J.C. Semi-automatic analysis and interpretation of sediment profile images. Environ. Model. Softw. 2013, 47, 42–54. [Google Scholar] [CrossRef]
- Rosenberg, R.; Grémare, A.; Amouroux, J.M.; Nilsson, H.C. Benthic habitats in the northwest Mediterranean characterised by sedimentary organics, benthic macrofauna and sediment profile images. Estuar. Coast. Shelf Sci. 2003, 57, 297–311. [Google Scholar] [CrossRef]
- Rosenberg, R.; Nilsson, H.C.; Grémare, A.; Amouroux, J.M. Effects of demersal trawling on marine sedimentary habitats analysed by sediment profile imagery. J. Exp. Mar. Biol. Ecol. 2003, 285–286, 465–477. [Google Scholar] [CrossRef]
- Germano, J.D.; Rhoads, D.C.; Valente, R.M.; Carey, D.A.; Solan, M. The use of sediment profile imaging (SPI) for environmental impact assessments and monitoring studies: Lessons learned from the past four decades. Oceanogr. Mar. Biol. Annu. Rev. 2011, 49, 235–298. [Google Scholar] [CrossRef]
- Diaz, M.; Grasso, F.; Le Hir, P.; Sottolichio, A.; Caillaud, M.; Thouvenin, B. Modeling mud and sand transfers between a macrotidal estuary and the continental shelf: Influence of the sediment transport parameterization. J. Geophys. Res. Oceans 2020, 125, e2019JC015643. [Google Scholar] [CrossRef]
- Lazure, P.; Dumas, F. An external-internal mode coupling for a 3D hydrodynamical model for applications at regional scale (MARS). Adv. Water Resour. 2008, 31, 233–250. [Google Scholar] [CrossRef]
- Roland, A.; Ardhuin, F. On the developments of spectral wave models: Numerics and parameterizations for the coastal ocean. Ocean Dyn. 2014, 64, 833–846. [Google Scholar] [CrossRef]
- Soulsby, R. Dynamics of Marine Sands: A Manual for Practical Applications; Inst of Civil Engineers Pub: London, UK, 1997. [Google Scholar]
- Grasso, F.; Verney, R.; Le Hir, P.; Thouvenin, B.; Schulz, E.; Kervella, Y.; Khojasteh Pour Fard, I.; Lemoine, J.P.; Dumas, F.; Garnier, V. Suspended sediment dynamics in the macrotidal seine estuary (France)—Part 1: Numerical modeling of turbidity maximum dynamics. J. Geophys. Res. Oceans 2008, 123, 558–577. [Google Scholar] [CrossRef]
- Global Fishing Watch. Available online: https://globalfishingwatch.org (accessed on 13 March 2019).
- Kroodsma, D.A.; Mayorga, J.; Hochberg, T.; Miller, N.A.; Boerder, K.; Ferretti, F.; Wilson, A.; Bergman, B.; White, T.D.; Block, B.A.; et al. Tracking the global footprint of fisheries. Science 2018, 359, 904–908. [Google Scholar] [CrossRef]
- Clarke, K.R.; Somerfield, P.J.; Gorley, R.N. Testing of null hypotheses in exploratory community analyses: Similarity profiles and biota-environment linkage. J. Exp. Mar. Biol. Ecol. 2008, 366, 56–69. [Google Scholar] [CrossRef]
- Clarke, K.R. Non-parametric multivariate analyses of changes in community structure. Aust. J. Ecol. 1993, 18, 117–143. [Google Scholar] [CrossRef]
- Clarke, K.R.; Warwick, R.M. Change in Marine Communities: An Approach to Statistical Analysis and Interpretation, 2nd ed.; PRIMER-E: Plymouth, UK, 2001. [Google Scholar]
- Lansard, B.; Rabouille, C.; Denis, L.; Grenz, C. Benthic remineralization at the land-ocean interface: A case study of the Rhône River (NW Mediterranean Sea). Estuar. Coast. Shelf Sci. 2009, 81, 544–554. [Google Scholar] [CrossRef]
- Antonelli, C.; Eyrolle, F.; Rolland, B.; Provansal, M.; Sabatier, F. Suspended sediment and 137Cs fluxes during the exceptional December 2003 flood in the Rhone River, southeast France. Geomorphology 2008, 95, 350–360. [Google Scholar] [CrossRef]
- Touzani, A.; Giresse, P. The Rhone River prodelta: Short-term (100–103 year) sedimentation patterns and human impact. J. Coast. Res. 2002, 18, 102–117. [Google Scholar]
- Marion, C.; Dufois, F.; Arnaud, M.; Vella, C. In situ record of sedimentary processes near the Rhône River mouth during winter events (Gulf of Lions, Mediterranean Sea). Cont. Shelf Res. 2010, 30, 1095–1107. [Google Scholar] [CrossRef]
- Dufois, F.; Verney, R.; Le Hir, P.; Dumas, F.; Charmasson, S. Impact of winter storms on sediment erosion in the Rhone River prodelta and fate of sediment in the Gulf of Lions (North Western Mediterranean Sea). Cont. Shelf Res. 2014, 72, 57–72. [Google Scholar] [CrossRef]
- Calmet, D.; Fernandez, J. Caesium distribution in northwest Mediterranean seawater, suspended particles and sediments. Cont. Shelf Res. 1990, 10, 895–913. [Google Scholar] [CrossRef]
- Charmasson, S.; Radakovitch, O.; Arnaud, M.; Bouisset, P.; Pruchon, A.S. Long-core profiles of 137Cs, 134Cs, 60Co and 210Pb in sediment near the Rhone River (northwestern Meiterranean Sea). Estuaries 1998, 21, 367–378. [Google Scholar] [CrossRef]
- Bourgeois, S.; Pruski, A.M.; Sun, M.Y.; Buscail, R.; Lantoine, F.; Kerhervé, P.; Vétion, G.; Rivière, B.; Charles, F. Distribution and lability of land-derived organic matter in the surface sediments of the Rhône prodelta and the adjacent shelf (Mediterranean Sea, France): A multi proxy study. Biogeosciences 2011, 8, 3107–3125. [Google Scholar] [CrossRef]
- Labrune, C.; Romero-Ramirez, A.; Amouroux, J.M.; Duchêne, J.C.; Desmalades, M.; Escoubeyrou, K.; Buscail, R.; Grémare, A. Comparison of ecological quality indices based on benthic macrofauna and sediment profile images: A case study along an organic enrichment gradient off the Rhône River. Ecol. Indic. 2012, 12, 133–142. [Google Scholar] [CrossRef]
- Kaiser, M.J.; Clarke, K.R.; Hinz, H.; Austen, M.C.V.; Somerfield, P.J.; Karakassis, I. Global analysis of response and recovery of benthic biota to fishing. Mar. Ecol. Prog. Ser. 2006, 311, 1–14. [Google Scholar] [CrossRef]
- Sciberras, M.; Geert, J.; Simon, H.; Szostek, C.L.; Hughes, K.M.; Kneafsey, B.; Clarke, L.J.; Ellis, N.; Rijnsdorp, A.D.; McConnaughey, R.A.; et al. Response of benthic fauna to experimental bottom fishing: A global meta-analysis. Fish Fish. 2018, 19, 698–715. [Google Scholar] [CrossRef]
- Dufois, F.; Garreau, P.; Le Hir, P.; Forget, P. Wave-and current-induced bottom shear stress distribution in the Gulf of Lions. Cont. Shelf Res. 2008, 28, 1920–1934. [Google Scholar] [CrossRef][Green Version]
- Kaiser, M.J.; Spencer, B.E. The effects of beam-trawl disturbance on infaunal communities in different habitats. J. Anim. Ecol. 1996, 65, 348–358. [Google Scholar] [CrossRef]
- Smith, C.J.; Banks, A.C.; Papadopoulou, K.N. Improving the quantitative estimation of trawling impacts from sidescan-sonar and underwater-video imagery. ICES J. Mar. Sci. 2007, 64, 1692–1701. [Google Scholar] [CrossRef]
- Olsgard, F.; Schaanning, M.T.; Widdicombe, S.; Kendall, M.A.; Austen, M.C. Effects of bottom trawling on ecosystem functioning. J. Exp. Mar. Biol. Ecol. 2008, 366, 123–133. [Google Scholar] [CrossRef]
- De Juan, S.; Demestre, M.; Sánchez, P. Exploring the degree of trawling disturbance by the analysis of benthic communities ranging from a heavily exploited fishing ground to an undisturbed area in the NW Mediterranean. Sci. Mar. 2011, 75, 507–516. [Google Scholar] [CrossRef]
- Widdicombe, S.; Austen, M.C. The interaction between physical disturbance and organic enrichment: An important element in structuring benthic communities. Limnol. Oceanogr. 2001, 46, 1720–1733. [Google Scholar] [CrossRef]
- Selby, I.; Evans, N.C. Origins of mud clasts and suspensions on the seabed in Hong Kong. Cont. Shelf Res. 1997, 17, 57–78. [Google Scholar] [CrossRef]
- Fettweis, M.; Du Four, I.; Zeelmaekers, E.; Baeteman, C.; Francken, F.; Houziaux, J.-S.; Mathys, M.; Nechad, B.; Pison, V.; Vandenberghe, N.; et al. Mud Origin, Characterisation and Human Activities (MOCHA): Final Report; Belgian Science Policy Office: Brussels, Belgium, 2007.
- Grémare, A.; (Université de Bordeaux, Talence, France). Personal communication, 2020.
- Nilsson, H.C.; Rosenberg, R. Effects on marine sedimentary habitats of experimental trawling analysed by sediment profile imagery. J. Exp. Mar. Biol. Ecol. 2003, 285–286, 453–463. [Google Scholar] [CrossRef]
- Smith, C.J.; Rumohr, H.; Karakassis, I.; Papadopoulou, K.N. Analysing the impact of bottom trawls on sedimentary seabeds with sediment profile imagery. J. Exp. Mar. Biol. Ecol. 2003, 285–286, 479–496. [Google Scholar] [CrossRef]
- Tiano, J.C.; Van Der Reijden, K.J.; O’Flynn, S.; Beauchard, O.; Van Der Ree, S.; Van Der Wees, J.; Ysebaert, T.; Soetaert, K. Experimental bottom trawling finds resilience in large-bodied infauna but vulnerability for epifauna and juveniles in the Frisian Front. Mar. Environ. Res. 2020, 159, 104964. [Google Scholar] [CrossRef]
- Darnaude, A.M.; Salen-Picard, C.; Harmelin-Vivien, M.L. Depth variation in terrestrial particulate organic matter exploitation by marine coastal benthic communities off the Rhone River delta (NW Mediterranean). Mar. Ecol. Prog. Ser. 2004, 275, 47–57. [Google Scholar] [CrossRef][Green Version]
- Tesi, T.; Miserocchi, S.; Goñi, M.A.; Langone, L. Source, transport and fate of terrestrial organic carbon on the western Mediterranean Sea, Gulf of Lions, France. Mar. Chem. 2007, 105, 101–117. [Google Scholar] [CrossRef]
- Cathalot, C.; Rabouille, C.; Tisnérat-Laborde, N.; Toussaint, F.; Kerhervé, P.; Buscail, R.; Loftis, K.; Sun, M.Y.; Tronczynski, J.; Azoury, S.; et al. The fate of river organic carbon in coastal areas: A study in the Rhône River delta using multiple isotopic (δ13C, δ14C) and organic tracers. Geochim. Cosmochim. Acta 2013, 118, 33–55. [Google Scholar] [CrossRef]
- Fontugne, M.R.; Jouanneau, J.M. Modulation of the particulate organic carbon flux to the ocean by a macrotidal estuary: Evidence from measurements of carbon isotopes in organic matter from the Gironde system. Estuar. Coast. Shelf Sci. 1987, 24, 377–387. [Google Scholar] [CrossRef]
- Middelburg, J.J.; Herman, P.M.J. Organic matter processing in tidal estuaries. Mar. Chem. 2007, 106, 127–147. [Google Scholar] [CrossRef]
- Savoye, N.; David, V.; Morisseau, F.; Etcheber, H.; Abril, G.; Billy, I.; Charlier, K.; Oggian, G.; Derriennic, H.; Sautour, B. Origin and composition of particulate organic matter in a macrotidal turbid estuary: The Gironde Estuary, France. Estuar. Coast. Shelf Sci. 2012, 108, 16–28. [Google Scholar] [CrossRef]
- Sottolichio, A.; Castaing, P. A synthesis on seasonal dynamics of highly-concentrated structures in the Gironde estuary. Earth Planet. Sci. 1999, 329, 795–800. [Google Scholar] [CrossRef]
- Jouanneau, J.M.; Latouche, C. The Gironde Estuary; Schweizerbart Science Publishers: Stuttgart, Germany, 1981. [Google Scholar]
- Etcheber, H.; Taillez, A.; Abril, G.; Garnier, J.; Servais, P.; Moatar, F.; Commarieu, M.V. Particulate organic carbon in the estuarine turbidity maxima of the Gironde, Loire and Seine estuaries: Origin and lability. Hydrobiologia 2007, 588, 245–259. [Google Scholar] [CrossRef]
- Ulses, C.; Estournel, C.; Durrieu de Madron, X.; Palanques, A. Suspended sediment transport in the Gulf of Lions (NW Mediterranean): Impact of extreme storms and floods. Cont. Shelf Res. 2008, 28, 2048–2070. [Google Scholar] [CrossRef]
- Mayer, L.M.; Jumars, P.A.; Taghon, G.L.; Macko, S.A.; Trumbore, S. Low-density particles as potential nitrogenous foods for benthos. J. Mar. Res. 1993, 51, 373–389. [Google Scholar] [CrossRef][Green Version]
- Abril, G.; Etcheber, H.; Le Hir, P.; Bassoullet, P.; Boutier, B.; Frankignoulle, M. Oxic/anoxic oscillations and organic carbon mineralization in an estuarine maximum turbidity zone (The Gironde, France). Limnol. Oceanogr. 1999, 44, 1304–1315. [Google Scholar] [CrossRef]
- Abril, G.; Nogueira, M.; Etcheber, H.; Cabeçadas, G.; Lemaire, E.; Brogueira, M.J. Behaviour of organic carbon in nine contrasting European estuaries. Estuar. Coast. Shelf Sci. 2002, 54, 241–262. [Google Scholar] [CrossRef]
- Lemaire, E.; Abril, G.; De Wit, R.; Etcheber, H. Effect of turbidity on phytoplanktonic pigments degradation in the Gironde Estuary. Comptes Rendus Geosci. 2002, 334, 251–258. [Google Scholar] [CrossRef]
- Pearson, T.H.; Rosenberg, R. Macrobenthos succession in relation to organic enrichment and pollution of the marine environment. Oceanogr. Mar. Biol. Annu. Rev. 1978, 16, 229–331. [Google Scholar]
- Miralles, J.; Arnaud, M.; Radakovitch, O.; Marion, C.; Cagnat, X. Radionuclide deposition in the Rhône River Prodelta (NW Mediterranean sea) in response to the December 2003 extreme flood. Mar. Geol. 2006, 234, 179–189. [Google Scholar] [CrossRef][Green Version]
- Salen-Picard, C.; Darnaude, A.M.; Arlhac, D.; Harmelin-Vivien, M.L. Fluctuations of macrobenthic populations: A link between climate-driven river run-off and sole fishery yields in the Gulf of Lions. Oecologia 2002, 133, 380–388. [Google Scholar] [CrossRef]
- Miralles, J.; Radakovitch, O.; Aloisi, J.C. 210Pb sedimentation rates from the Northwestern Mediterranean margin. Mar. Geol. 2005, 216, 155–167. [Google Scholar] [CrossRef]
- Zuo, Z.; Eisma, D.; Berger, G.W. Determination of sediment accumulation and mixing rates in the Gulf of Lions, Mediterranean Sea. Oceanol. Acta 1991, 14, 253–262. [Google Scholar]
- Dorgan, K.M.; Jumars, P.A.; Johnson, B.D.; Boudreau, B.P. Macrofaunal burrowing: The medium is the message. Oceanogr. Mar. Biol. 2006, 44, 85–121. [Google Scholar]
- Lamarque, B.; Deflandre, B.; Galindo Dalto, A.; Schmidt, S.; Romero-Ramirez, A.; Garabetian, F.; Dubosq, N.; Diaz, M.; Grasso, F.; Sottolichio, A.; et al. Spatial Distributions of Surface Sedimentary Organics and Sediment Profile Image Characteristics in a High-Energy Temperate Marine RiOMar: The West Gironde Mud Patch; SEANOE. 2021. Available online: http://b2find.eudat.eu/dataset/e591e5d7-3dbc-57bc-9588-532deed0a3c2 (accessed on 1 February 2021).


Publisher’s Note: MDPI stays neutral with regard to jurisdictional claims in published maps and institutional affiliations. |
© 2021 by the authors. Licensee MDPI, Basel, Switzerland. This article is an open access article distributed under the terms and conditions of the Creative Commons Attribution (CC BY) license (http://creativecommons.org/licenses/by/4.0/).
Share and Cite
Lamarque, B.; Deflandre, B.; Galindo Dalto, A.; Schmidt, S.; Romero-Ramirez, A.; Garabetian, F.; Dubosq, N.; Diaz, M.; Grasso, F.; Sottolichio, A.; et al. Spatial Distributions of Surface Sedimentary Organics and Sediment Profile Image Characteristics in a High-Energy Temperate Marine RiOMar: The West Gironde Mud Patch. J. Mar. Sci. Eng. 2021, 9, 242. https://doi.org/10.3390/jmse9030242
Lamarque B, Deflandre B, Galindo Dalto A, Schmidt S, Romero-Ramirez A, Garabetian F, Dubosq N, Diaz M, Grasso F, Sottolichio A, et al. Spatial Distributions of Surface Sedimentary Organics and Sediment Profile Image Characteristics in a High-Energy Temperate Marine RiOMar: The West Gironde Mud Patch. Journal of Marine Science and Engineering. 2021; 9(3):242. https://doi.org/10.3390/jmse9030242
Chicago/Turabian StyleLamarque, Bastien, Bruno Deflandre, Adriana Galindo Dalto, Sabine Schmidt, Alicia Romero-Ramirez, Frédéric Garabetian, Nicolas Dubosq, Mélanie Diaz, Florent Grasso, Aldo Sottolichio, and et al. 2021. "Spatial Distributions of Surface Sedimentary Organics and Sediment Profile Image Characteristics in a High-Energy Temperate Marine RiOMar: The West Gironde Mud Patch" Journal of Marine Science and Engineering 9, no. 3: 242. https://doi.org/10.3390/jmse9030242
APA StyleLamarque, B., Deflandre, B., Galindo Dalto, A., Schmidt, S., Romero-Ramirez, A., Garabetian, F., Dubosq, N., Diaz, M., Grasso, F., Sottolichio, A., Bernard, G., Gillet, H., Cordier, M.-A., Poirier, D., Lebleu, P., Derriennic, H., Danilo, M., Murilo Barboza Tenório, M., & Grémare, A. (2021). Spatial Distributions of Surface Sedimentary Organics and Sediment Profile Image Characteristics in a High-Energy Temperate Marine RiOMar: The West Gironde Mud Patch. Journal of Marine Science and Engineering, 9(3), 242. https://doi.org/10.3390/jmse9030242