Article

DOM Biological Lability in an Estuarine System in Two Contrasting Periods

by
Simona Retelletti Brogi
1,
Raffaella Casotti
2,
Benjamin Misson
3,
Cecilia Balestra
2,4,
Margherita Gonnelli
1,
Stefano Vestri
1 and
Chiara Santinelli
1,*
1
CNR—Institute of Biophysics, 56124 Pisa, Italy
2
Stazione Zoologica Anton Dohrn, 80121 Napoli, Italy
3
Université de Toulon, Aix Marseille Université, CNRS, IRD, MIO, 83130 Toulon, France
4
Istituto Nazionale di Oceanografia e Geofisica Sperimentale (OGS), 34010 Trieste, Italy
*
Author to whom correspondence should be addressed.
J. Mar. Sci. Eng. 2021, 9(2), 172; https://doi.org/10.3390/jmse9020172
Submission received: 31 December 2020 / Revised: 26 January 2021 / Accepted: 5 February 2021 / Published: 8 February 2021
(This article belongs to the Special Issue Advances in Marine Dissolved Organic Matter Dynamics)

Abstract

:
Estuarine processes play a key role in determining the amount and quality of land-derived dissolved organic matter (DOM) reaching the oceans. Microbial-mediated reactions can affect the concentration, quality, and bioavailability of DOM within an estuary. In this study, we investigated biological DOM removal in a small estuary and its variability in two contrasting seasons (spring and autumn) characterized by natural differences in the concentration and quality of the riverine DOM. Two incubation experiments were carried out using natural DOM and heterotrophic prokaryotes community collected at the estuary in March and September. Dissolved organic carbon (DOC) concentration, DOM fluorescence, and the heterotrophic prokaryotes abundance (HPA) showed marked differences between the two seasons. These parameters were followed through time for up to two months. Despite the marked differences in the initial conditions, the DOC removal rates were surprisingly similar in the two periods (16 µM DOC month−1 in March and 18 µM DOC month−1 in September), with the biggest removal in the first 48 h. The trend of fluorescent DOM (FDOM) during the incubation showed marked differences between the two periods. In March, the net removal of all the FDOM components was observed consistently with the decrease in DOC; whereas, in September, the net production of humic-like substances was observed.

1. Introduction

A large amount of dissolved organic matter (DOM) is continuously exported from the land to the oceans through rivers and estuaries. It has been estimated that 250 Tg of dissolved organic carbon (DOC) are delivered yearly to the ocean from the rivers [1], even if recent studies suggest that this amount might have been underestimated [2]. Estuaries represent only the 0.3% of the Earth’s ocean-covered surface and they are a direct link between fresh and saline waters. The delivery of organic matter from rivers to the coastal ocean via estuaries is recognized as an important component of the global C budget [3,4,5,6]. Within the estuaries, a variety of biogeochemical reactions determine the quantity and quality of DOM reaching the oceans. These reactions include flocculation, adsorption on suspended matter, photochemical and microbial processes [2,7,8,9], and can affect both the concentration and quality of the DOM transported to the coastal area [10].
In estuaries, microbial communities are exposed to quick changes in the environmental conditions. Mixing of seawater and freshwater, transportation of dissolved or suspended organic and inorganic material, as well as hydrological modifications due to climatic conditions or to human actions affect the estuarine biogeochemical properties, inducing specific patterns of microbial abundance, diversity, and activity in these areas [11,12]. Changing salinity is a considerable physiological stress factor for freshwater organisms and affects the performance and functioning of microbial communities [13]. Differences in microbial abundances have been therefore observed along salinity gradient at various sites, such as the Rhone [14], Columbia [15], and Adour estuaries [16]. The use of DOM by the estuarine microbial community can be affected by several environmental parameters other than salinity, such as temperature, discharge (changing the residence time of the water), nutrient availability, and the amount and quality of the riverine DOM transported to the estuary. Apple et al. [17] suggested that bacterial carbon metabolism can be strongly affected by local environmental conditions, and seasonal differences in estuarine DOC uptake has been observed [17,18,19].
With this study we aim at investigating the biological removal and transformation of riverine DOM in different seasons in an estuarine system. The Arno River estuary (Italy) was chosen for this study because its DOM temporal dynamic is well known and it has a clear seasonal cycle of DOM, both in terms of concentration and quality, and of heterotrophic prokaryotes abundance (HPA) [20]. Two incubation experiments were carried out using natural DOM and heterotrophic prokaryotes community collected at the estuary in two contrasting seasons, spring (March) and autumn (September). In spring, according to the predominance of terrestrial DOM and the lower DOC concentration observed in the river [20], we expect a lower percentage of labile DOM, which combined with a lower temperature might lead to lower removal rates than in autumn. To test this hypothesis, the concentration of DOC and the HPA were followed through time in order to investigate the DOM removal rates and heterotrophic prokaryotes growth efficiencies. Changes in DOM quality were evaluated by measuring its fluorescence (FDOM), which gives indication about the main groups of fluorophores present in its pool.

2. Materials and Methods

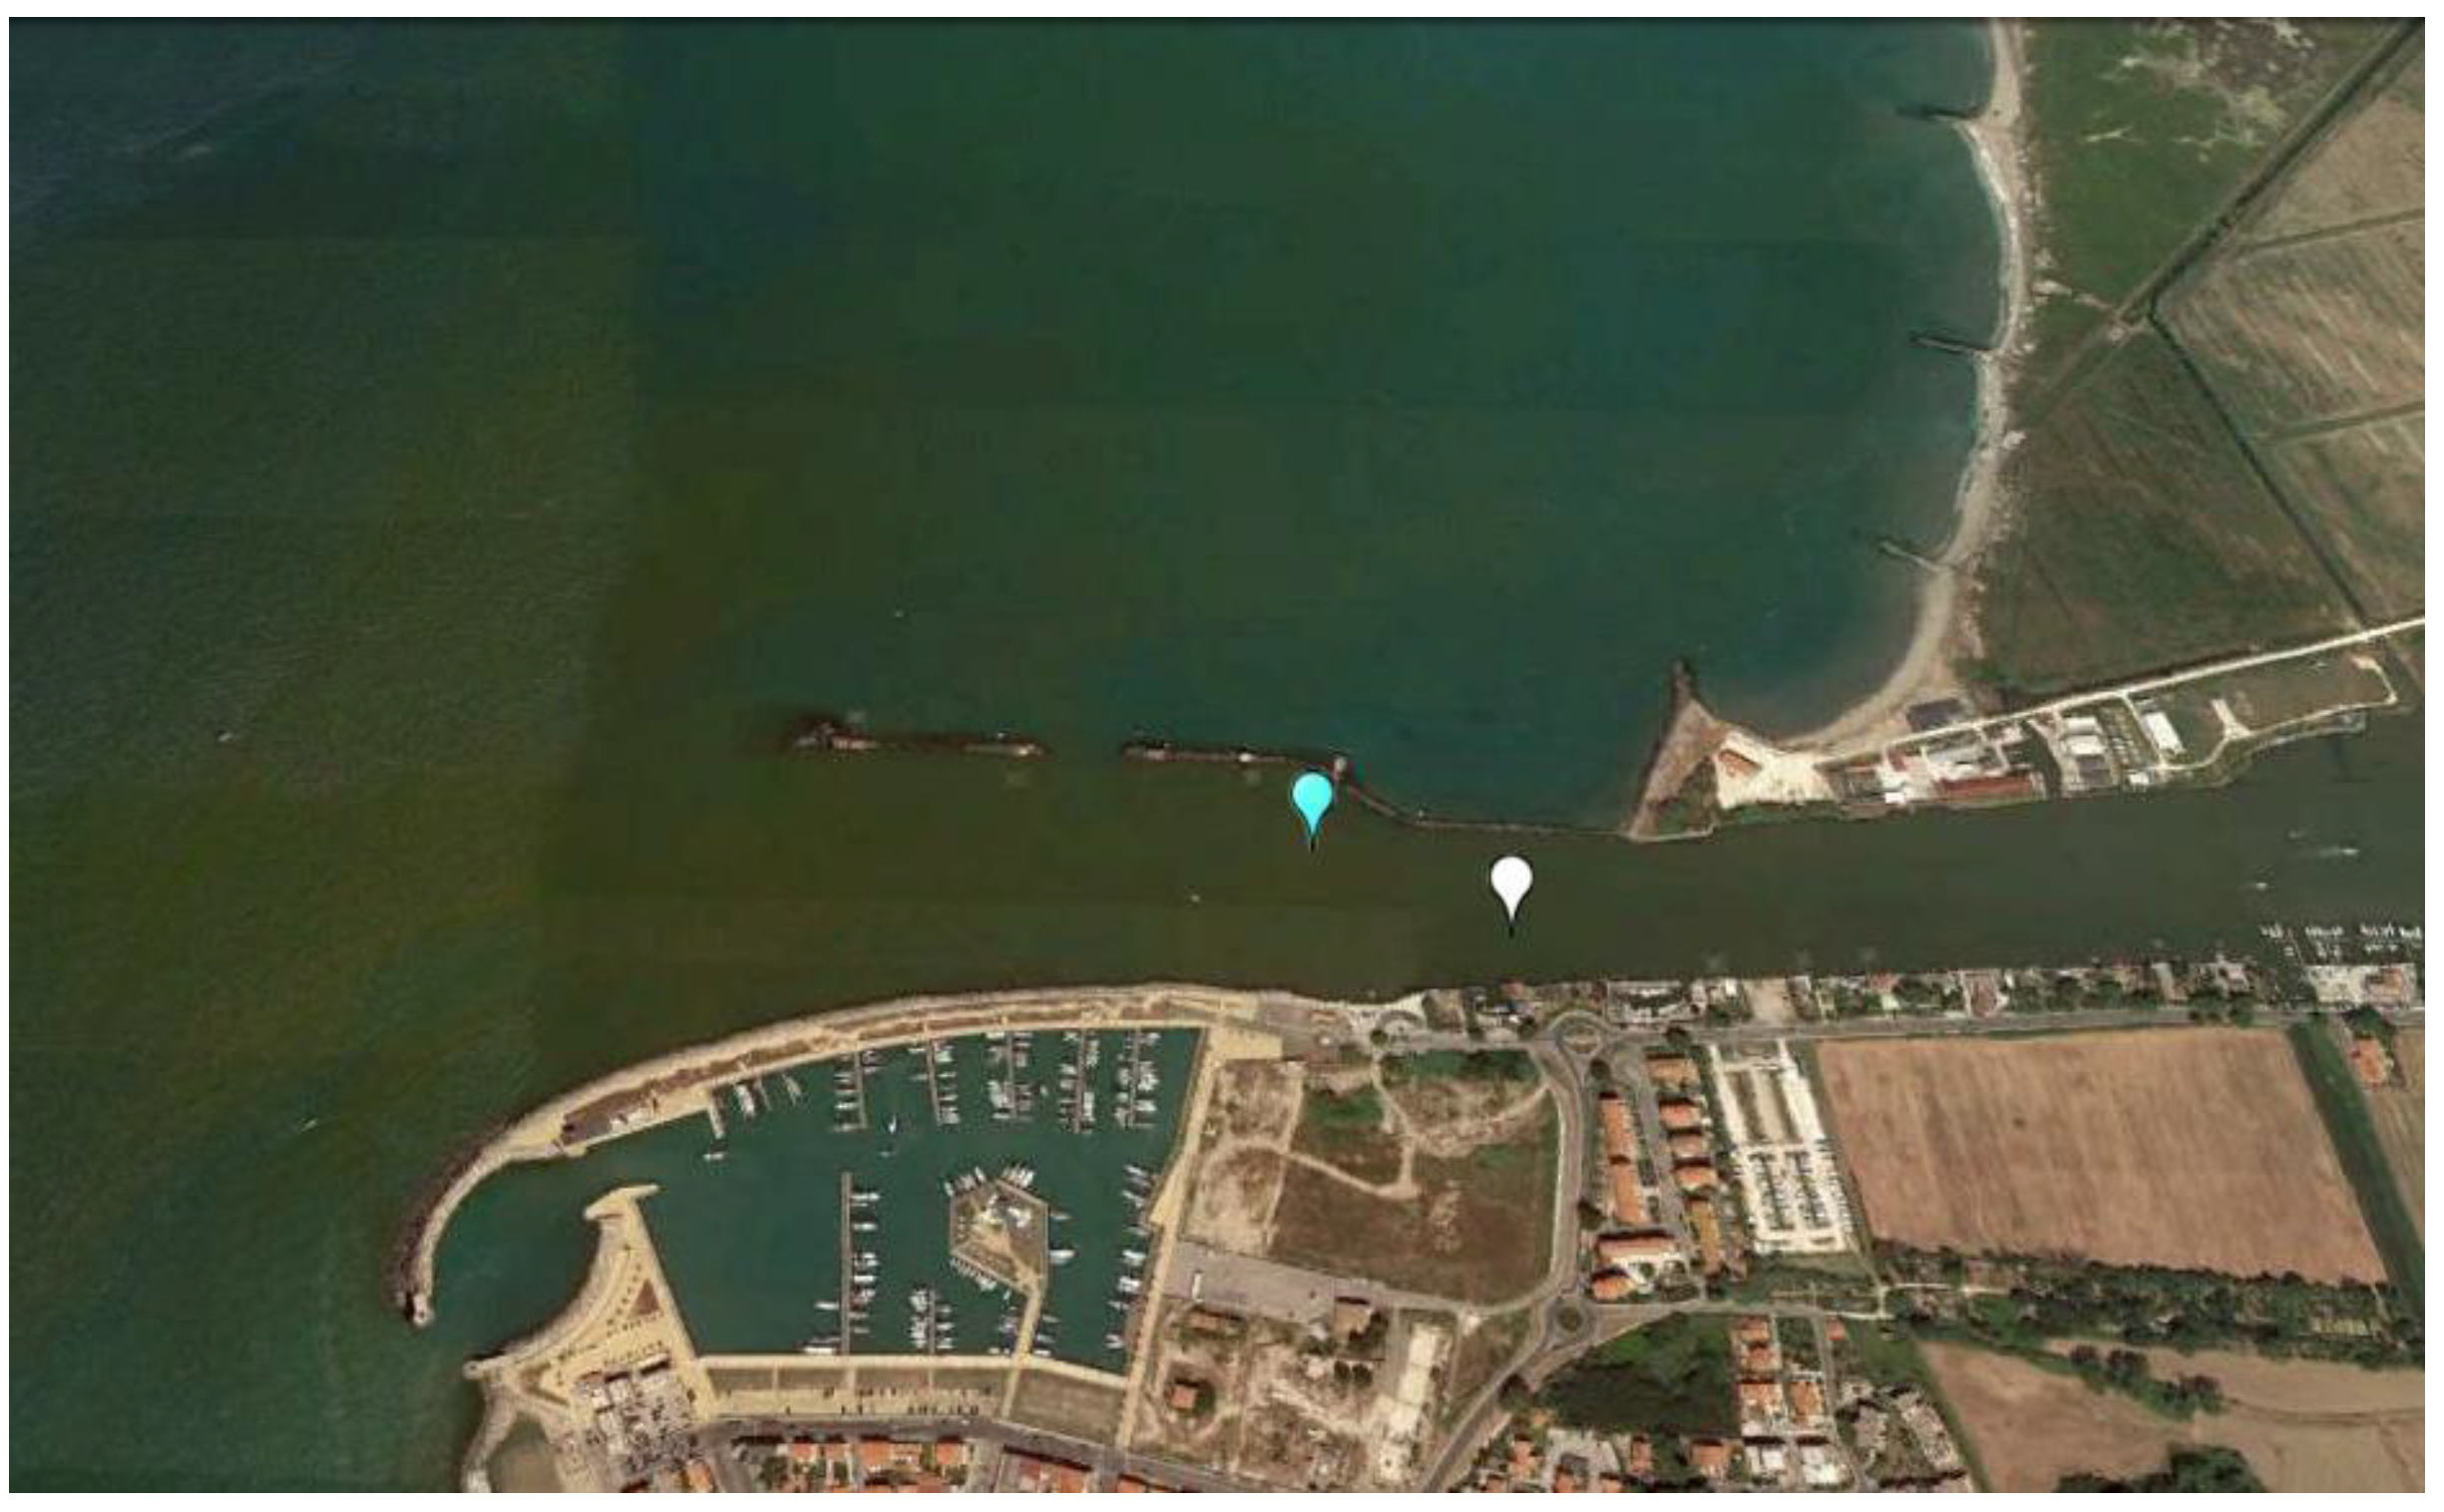
2.1. Samples Collection and Incubation Experiment Setup

Surface water samples were collected in the Arno River estuary in March and September 2015 at intermediate salinities (Figure 1, Table 1) into 10 L, acid washed, polycarbonate bottles (Nalgene). Temperature and salinity were measured in situ by using a portable Hanna 9033 probe (Hanna Instruments Inc., Woonsocket, RI, USA).
The incubation experiments were carried out in 2 L, acid washed, polycarbonate bottles (Nalgene) in triplicates. For each replicate, 1.8 L of the estuarine water was filtered through a 0.2 µm pore size filter (Whatman Polycap, 6705–3602 capsules) and inoculated with 0.2 L of the same water, filtered through a 1.2 µm pore size filter (Sartorius, 17,593 K), in order to add the local microbial community. Both filters were extensively rinsed with Milli-Q water prior to their use to avoid DOM contamination. The 1.2 µm filter was chosen because this pore size allows the majority of the heterotrophic prokaryotes to remain in the water used for the inoculum, whereas it should retain most of the autotrophic organisms and the bacterivores [21]. In order to simulate as closely as possible the natural conditions, the incubations were carried out at the in situ temperature (Table 1), and the bottles were kept in the dark to avoid any autotrophic activity not removed by filtration. A headspace of ≈15% of the volume was left empty to keep enough oxygen in the system.
Subsamples for analyses were collected immediately after the inoculum (T0), and at different times during the incubation up to 2 months. The 2 L bottles were open and mixed before each subsampling, which was carried out in sterile conditions to avoid any contamination from ambient microbes.

2.2. Analytical Procedures for DOM and Heterotrophic Prokaryotes Abundance

Heterotrophic prokaryotes (HP) were enumerated by flow cytometry. Samples fixed with either glutaraldhyde alone or a mix of paraformaldehyde (PF, 1%) and glutaraldehyde (GL, 0.05%), were stained with SYBR Green (Invitrogen Milan, Italy) and analyzed with an Accuri C6 or a FACSVerse flow cytometer (both from BD BioSciences) equipped with standard laser and filter sets. HP were discriminated from other particles and background by their high green fluorescence, small size, low light scatter, and low red fluorescence, as previously described [22,23].
The samples for DOM analyses were collected into 60 mL, acid washed, polycarbonate bottles (Nalgene) and measured immediately. Total organic carbon (TOC) concentration was measured by high temperature catalytic oxidation using a Shimadzu TOC-Vcsn analyzer following the method reported by Santinelli et al. [24]. From 3 to 5 replicate injections were performed until the analytical precision was lower than 1 µM, and the measurement reliability was assessed twice daily by comparison of data with DOC consensus reference material [25] (CRM Batch #13 Lot 05-13, nominal concentration: 41–44 μM; measured concentration: 42.3 ± 0.9 μM).
To avoid any contamination, subsamples were not filtered; DOC concentration was therefore calculated by subtracting HP carbon biomass from TOC concentration. The HP biomass was calculated assuming a conversion factor of 20 fg C cell−1 [26] and ranged between 0.11 and 1.94 µM C with values <1 µM C in 80% of the samples.
The variation in biomass and in carbon concentration were used to estimate the heterotrophic prokaryotes growth efficiency (HPGE) as follows:
HPGE =   Δ   Biomass Δ   DOC
Fluorescence excitation–emission matrices (EEMs) were measured using the Aqualog spectrofluorometer (Horiba) following the method reported by Retelletti Brogi et al. [27]. By using the drEEM toolbox [28], the EEMs were elaborated in order to remove and interpolate the Rayleigh and Raman scatter peaks, normalize the fluorescence intensities to Raman units, and carry out parallel factor analysis (PARAFAC). The model was validated by visual inspection of the residuals, split-half analysis (Supplementary Materials Figure S1), and percentage of explained variance (99.5%).

2.3. Statistics

The Kruskal–Wallis test (R software) was used in order to test if the variations in the parameters during the incubations were statistically significant. This test was chosen since is a nonparametric test and does not need any distributional assumption [29]. Differences were considered significant for p < 0.005.

3. Results and Discussion

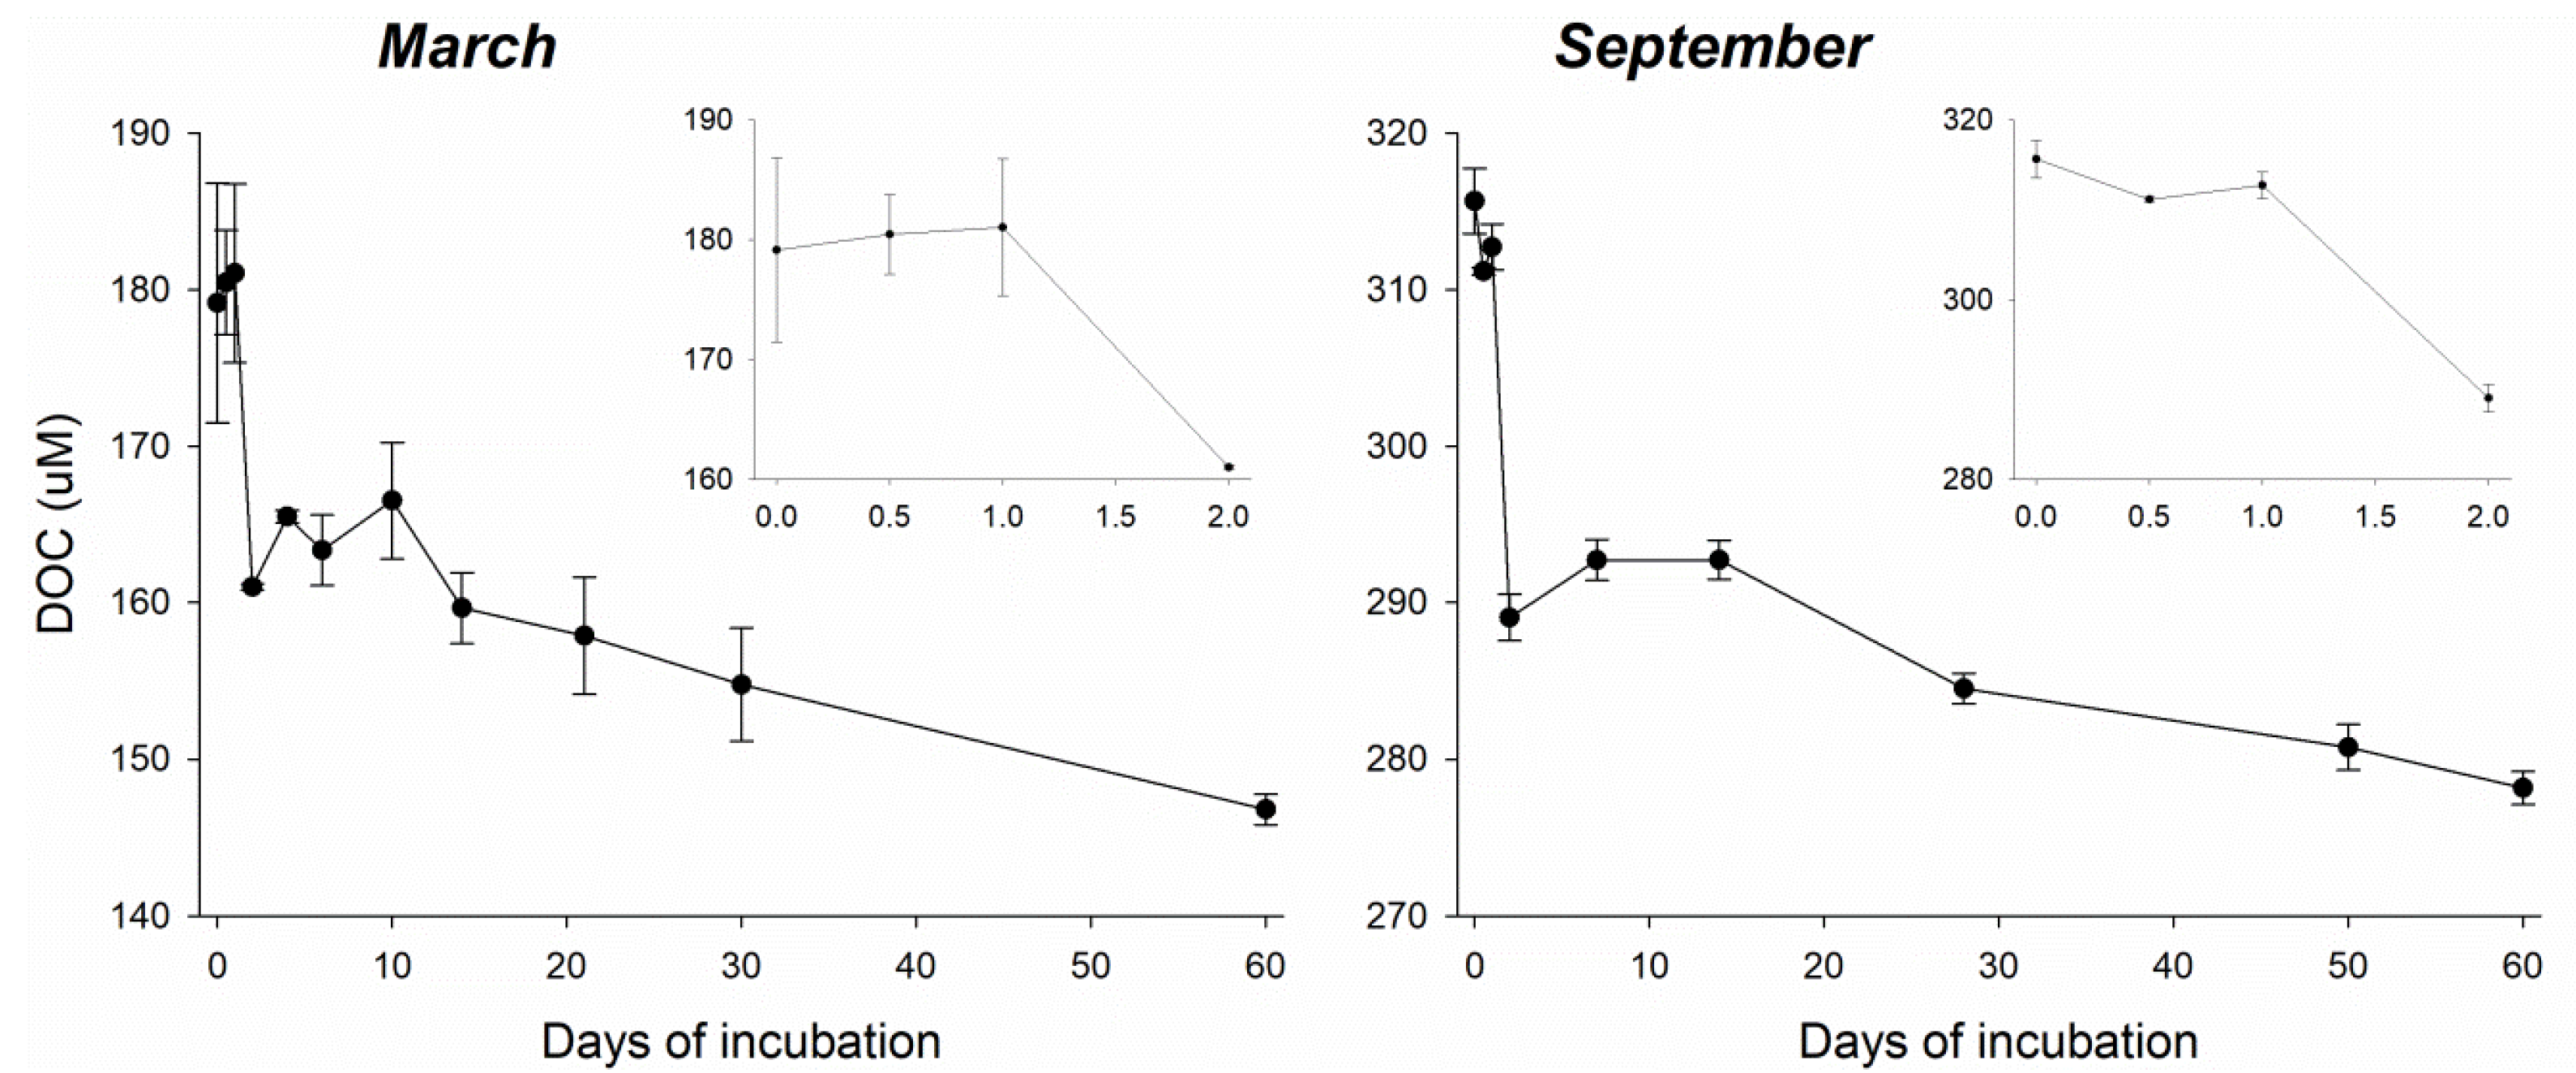
3.1. Biological Removal of DOC

As expected, the initial conditions of the two experiments were biologically, chemically, and physically different (Table 1).
It is noteworthy that in September, DOC concentration was ≈1.7 times higher than in March, whereas HPA was ≈2 times lower. These results are in good agreement with the DOM and HPA annual cycle in the Arno River [20]. The accumulation of DOM and the low HPA can be attributed to the presence of recalcitrant DOM, which cannot be consumed by the HP on the short temporal scale. The top-down control (viral lysis or grazing) would also reduce the HPA, leading to DOM accumulation. With this experiment, we investigated if the biological lability of DOM was different in the two periods and if the DOM removed was used for biomass synthesis with the same efficiency. DOC concentration showed an exponential decrease during the two months in both incubations (Figure 2). It decreased from 179 ± 7 to 147 ± 1 µM in March and from 316 ± 2 to 279 ± 1 µM in September, suggesting an overall DOC removal rate of 16.0 µM month−1 (0.5 µM day−1) in March and 18.5 µM month−1 (0.6 µM day−1) in September. The removal rates were very similar, despite the difference in the initial DOC concentrations, HPA, and temperature (Table 1), and similar to those reported in a previous study carried out at the Arno River estuary in October 2012 (20 µM month−1, [30]).
Both in March and in September, the greatest decrease in DOC concentration (≈17 µM in March and ≈25 µM in September) was observed between 24 and 48 h (Figure 2). Taking into account only the first 48 h, a removal rate of 9 µM day−1 in March and 13 µM day−1 in September can be estimated. Between 1 week and 1 month, DOC removal rates ware markedly lower (0.3 µM day−1 in March and 0.4 µM day−1 in September) than in the first two days.
Even though the amount of DOC removed in 48 h is different in the two periods, it is interesting to notice that its percentage, with respect to the initial concentration, is very similar (9% in March and 8% in September). These results indicate that ≈8–9% of DOC was labile on a 48 h temporal scale during both periods. In contrast, considering the whole incubations (i.e., two months), the percentage of the removed DOC was slightly different; 18% of the initial DOC was removed in March and 12% in September.
Our results are in good agreement with incubation experiments carried out in other estuaries [18,31,32]. Raymond and Bauer [18] observed no variation in DOC concentration in the first 24 h and no seasonal variability during incubation experiments, carried out with water from the York River estuary in different seasons; they also found 10% removal of the initial DOC concentration within five days of experiment. Avery et al. [31] reported the results of incubation experiments with water from the Cape Fear River estuary in three different seasons (February, April, and July) and observed similar results in the three periods with 9 ± 4.5% DOC removal during three months. Similar results were also reported by Moran and Sheldon [32] for incubation experiments carried out in five estuaries in the southeastern USA, where 3–12% of DOC was removed in 1–2 months. The environmental conditions can be totally different between estuaries and seasons and it is not easy to explain this general agreement among different studies around the globe. We can hypothesize that this 8–9% is the measurable LDOC, and that there is a fraction which is labile on a shorter temporal scale and therefore not measurable. This highly labile fraction can have different concentration among environments and seasons. However, it is not possible to exclude that the results might be also affected by the experimental conditions, which were similar between our experiment and the ones cited.
HPA showed a similar trend in both March and September: after a lag phase of 24 h, it rapidly increased to reach a maximum after 48 h (Figure 3), in correspondence with the largest DOC decrease. After reaching the maximum of abundance, HPA decreased to reach a minimum at day 10 (March) and day 7 (September). Then, it started to increase again and reached a second maximum after one month in March and 15 days in September, and then it slowly decreased (Figure 3). The marked decrease in HPA observed between 2 and 7 days can be attributed to the inability of the initial HP community to use the DOC that was left. However, we cannot exclude other factors like viral lysis [33] or an incomplete removal of grazers. The increase in abundance observed afterward may suggest the growth of a second community not dominant in the first week, which was able to grow on the remaining DOC or which was less sensitive to grazing and viral lysis.
These results were surprising because a higher DOC removal was expected in September when initial DOC concentration and temperature were higher. In March, the lower temperature and DOC concentration were expected to reduce the HP growth.

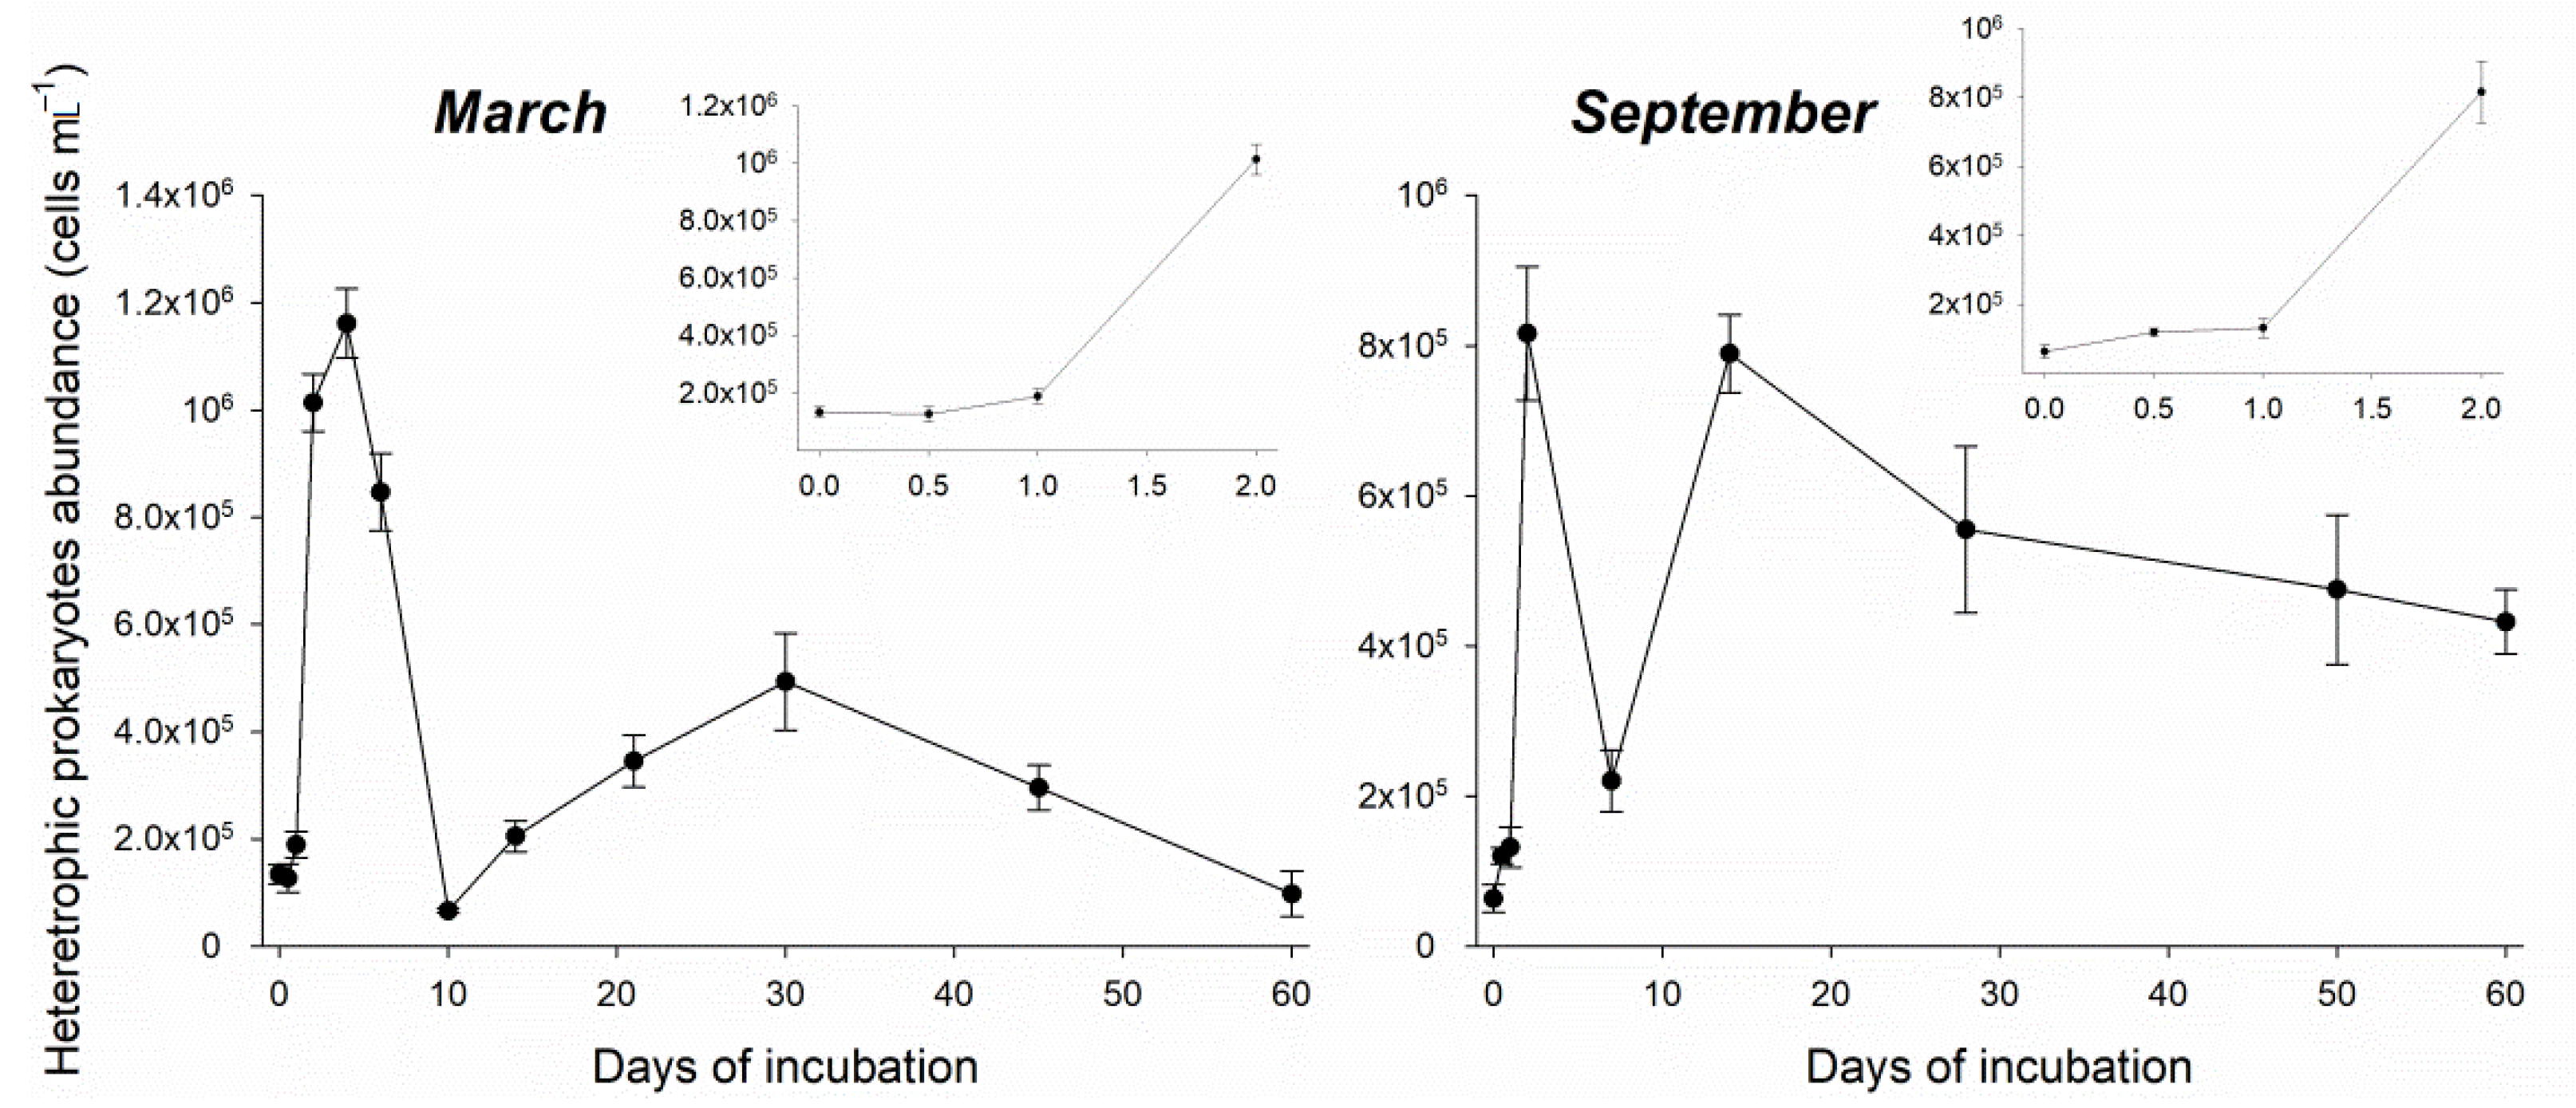
3.2. Heterotrophic Prokaryotes Growth Efficiency and CO2 Production Estimates

Comparing DOC removal rates and the variations in HPA, both experiments can be divided in two periods that seemed to be characterized by different HP communities: in the first period (0–48 h) HP grew fast on the labile DOC (LDOC, removal rates of 9–13 µM day−1) while after about 1 week they grew slower on the semilabile DOC (SLDOC, mineralization rates of 0.3–0.4 µM day−1).
The DOC removed by HP can follow 3 metabolic pathways: it can be (1) incorporated into biomass, (2) mineralized into CO2 through respiration, or (3) released as DOC in a different form. HPGE gives an estimate of the percentage of the removed DOC transformed in biomass.
The HPGE estimated in the first period (0–48 h) was 10 ± 0.21% in March and 5 ± 0.10% in September, whereas in the second period (7–10 days to 1 month), it was 7 ± 0.15% in March and 8 ± 0.12% in September. The lower HPGE within the first 48 h in September suggests that the HP community was less efficient in transforming DOC into biomass, and most of the DOC removed (~95%) was respired to CO2 even with warmer conditions (T~22 °C) than in April. Although these results might seem surprising, they are in agreement with the results of Apple et al. [17], who investigated the temperature dependency of bacterioplankton carbon metabolism and showed an inverse relationship between the temperature and HPGE.
Assuming negligible the DOC released by the HP, the amount of CO2 produced by respiration was estimated as follows:
CO2 produced = ∆DOC · (1 − HPGE)
This calculation suggests that 14.4 to 24.5 µM of CO2 were released in 48 h by the consumption of LDOC from heterotrophic prokaryotes, leading to the production of 7–12 µM of CO2 per day. These calculations may, however, be affected by the experimental conditions.

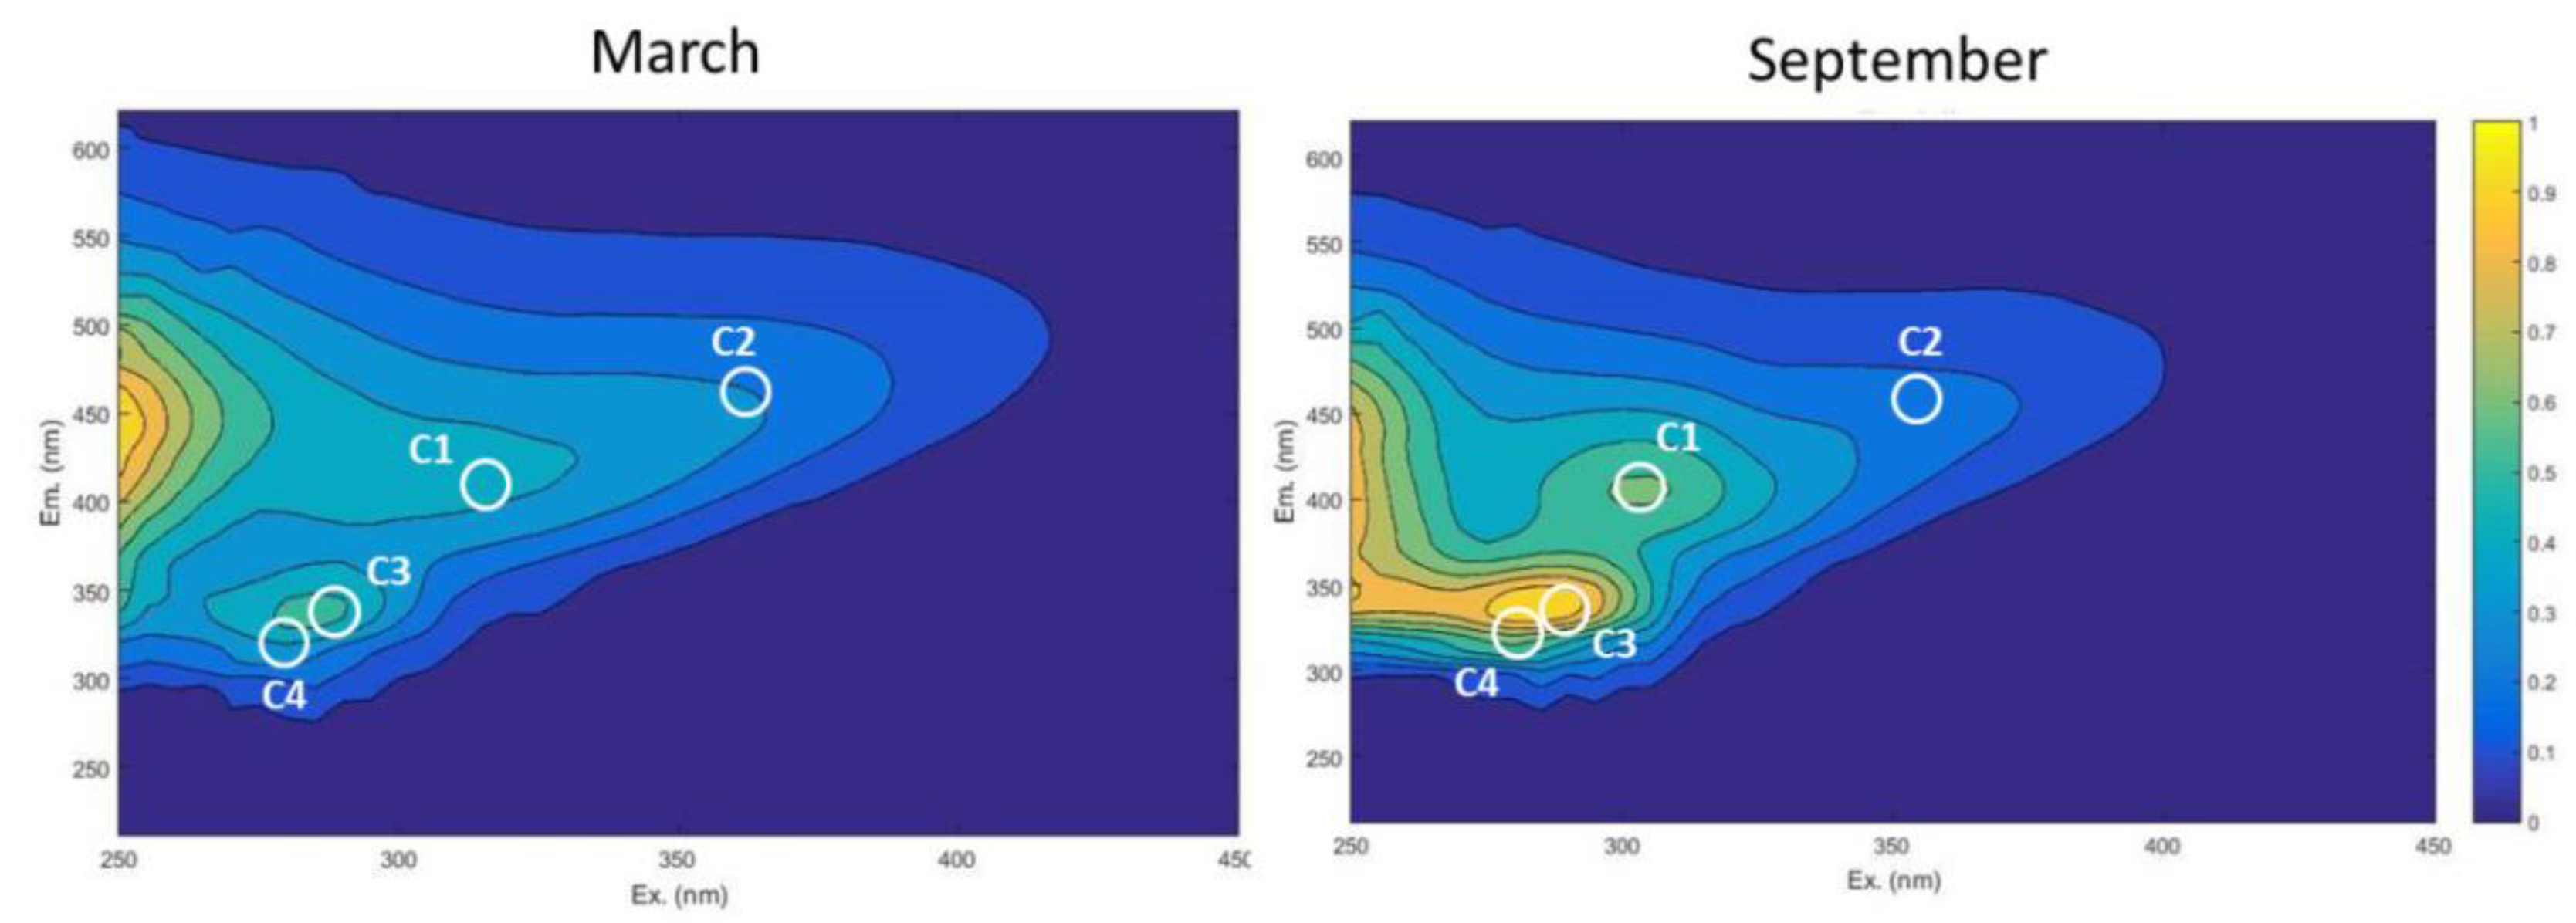
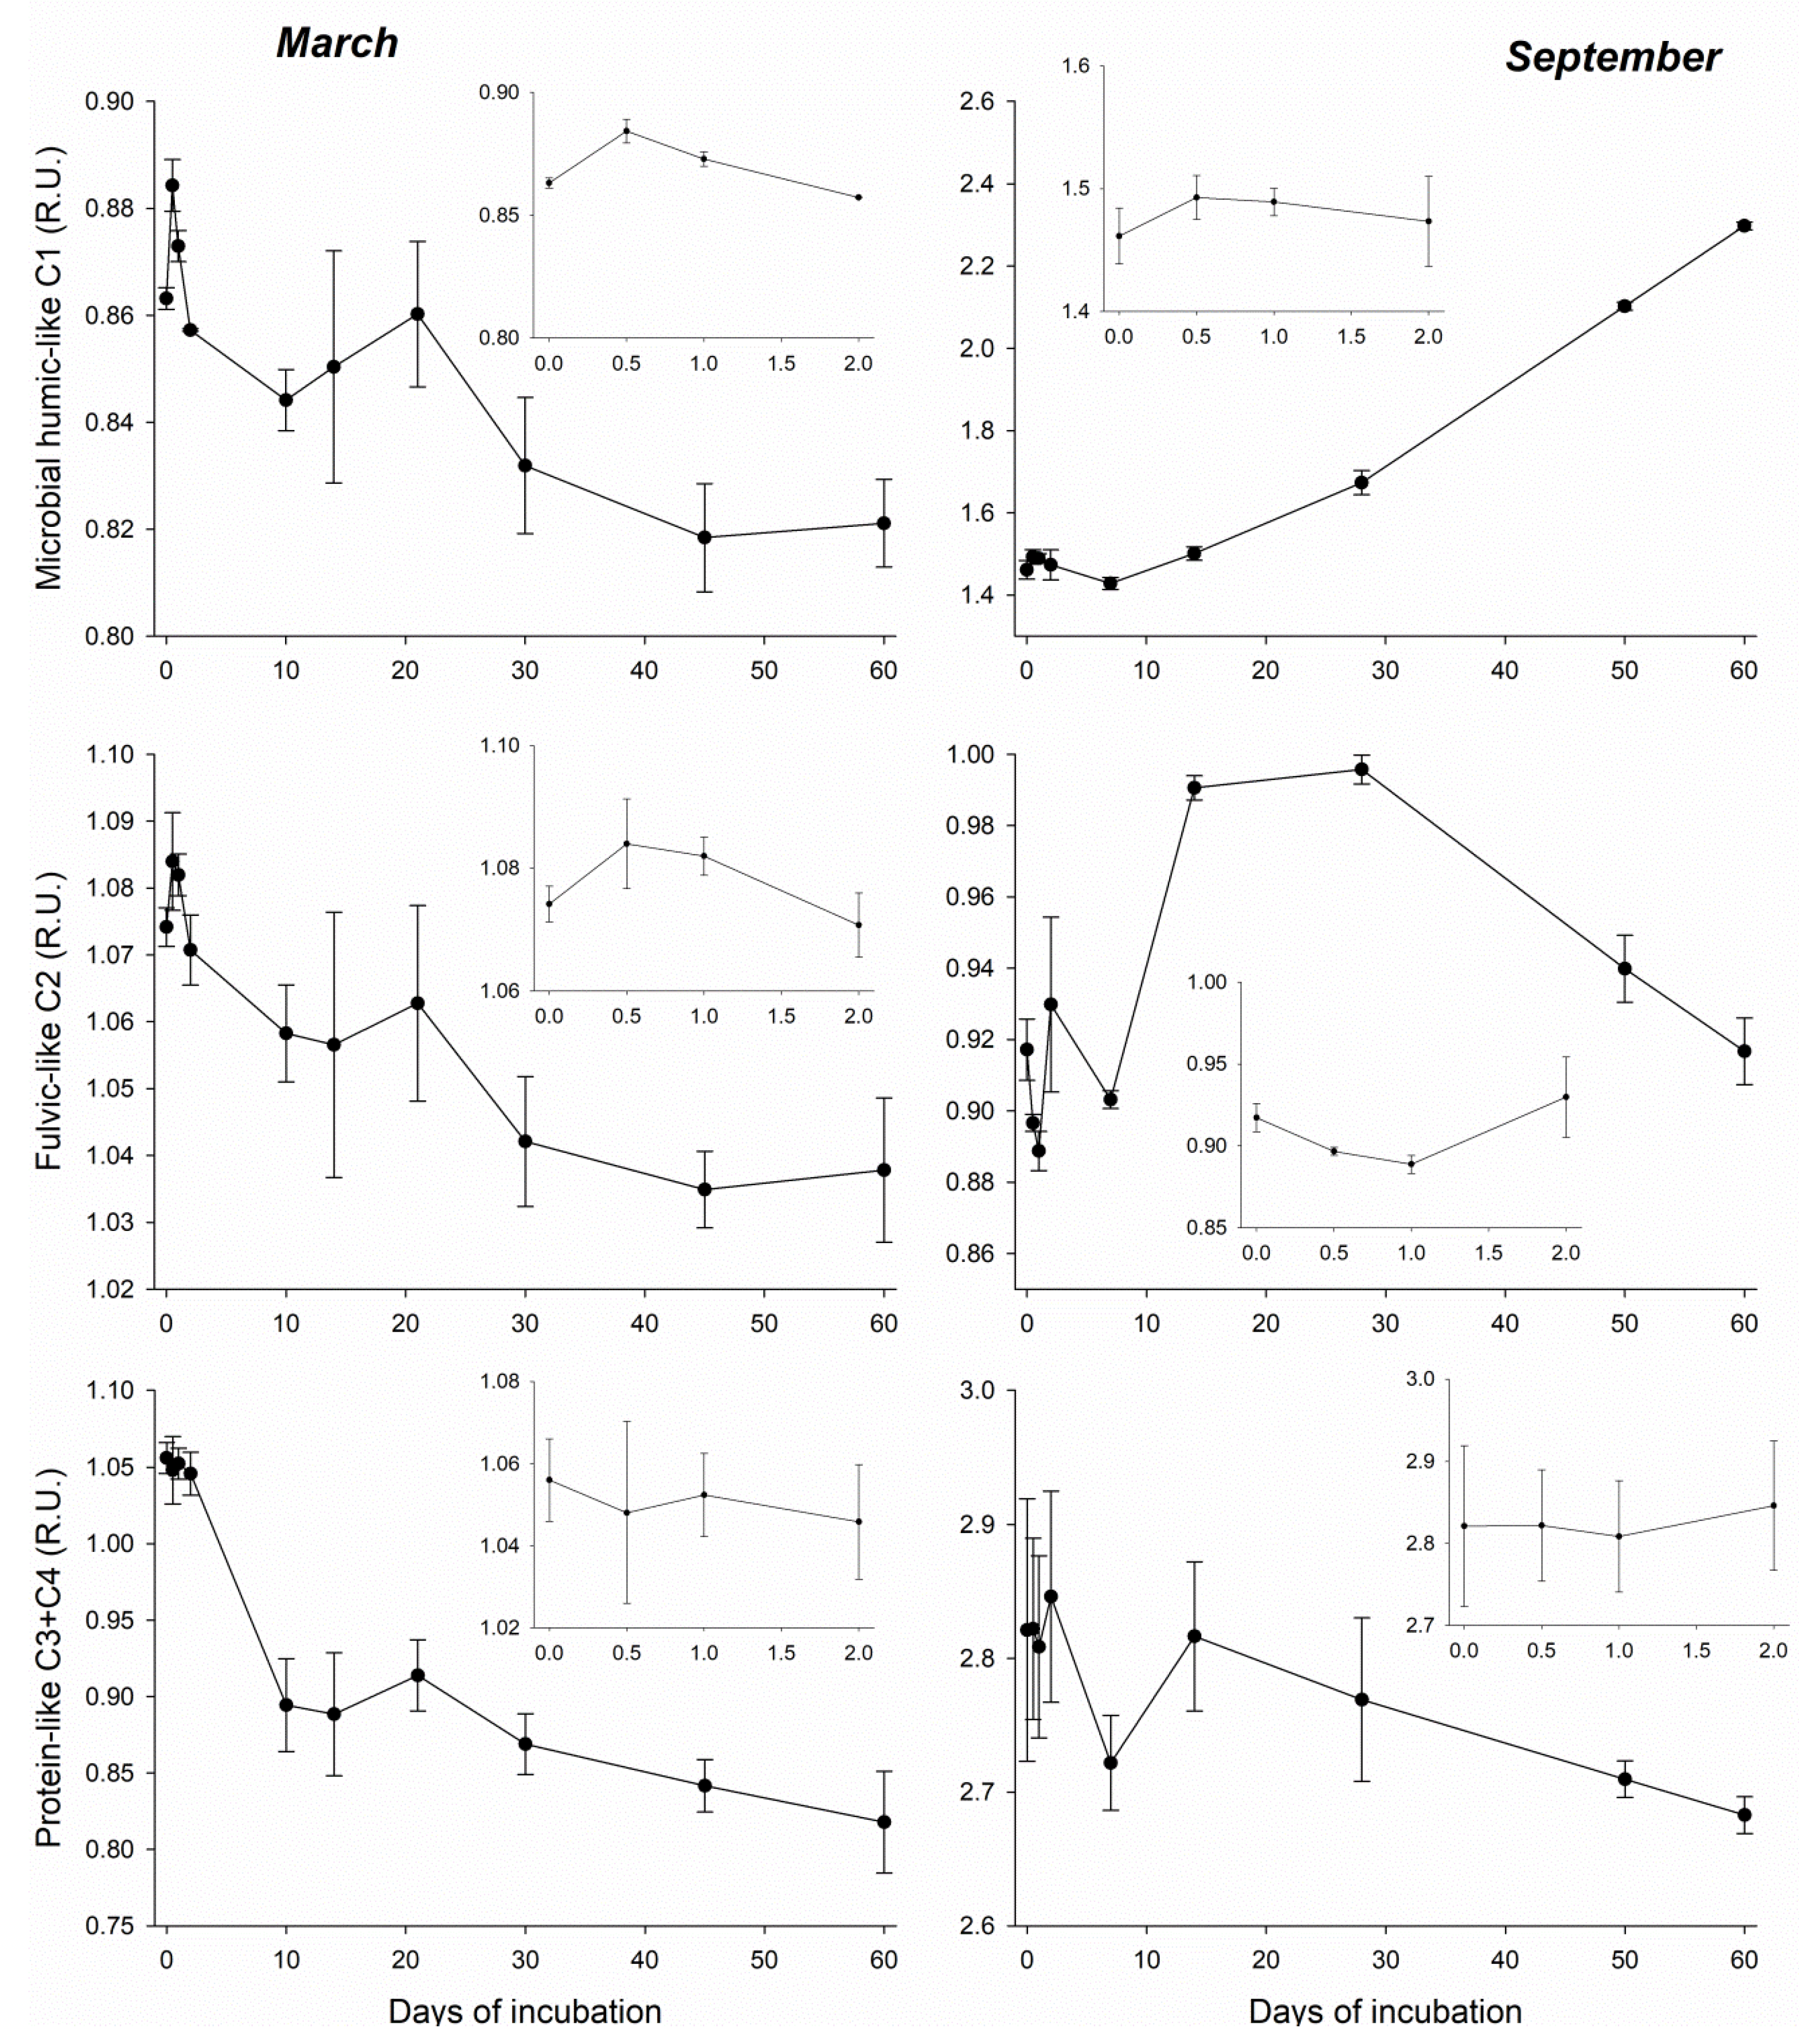
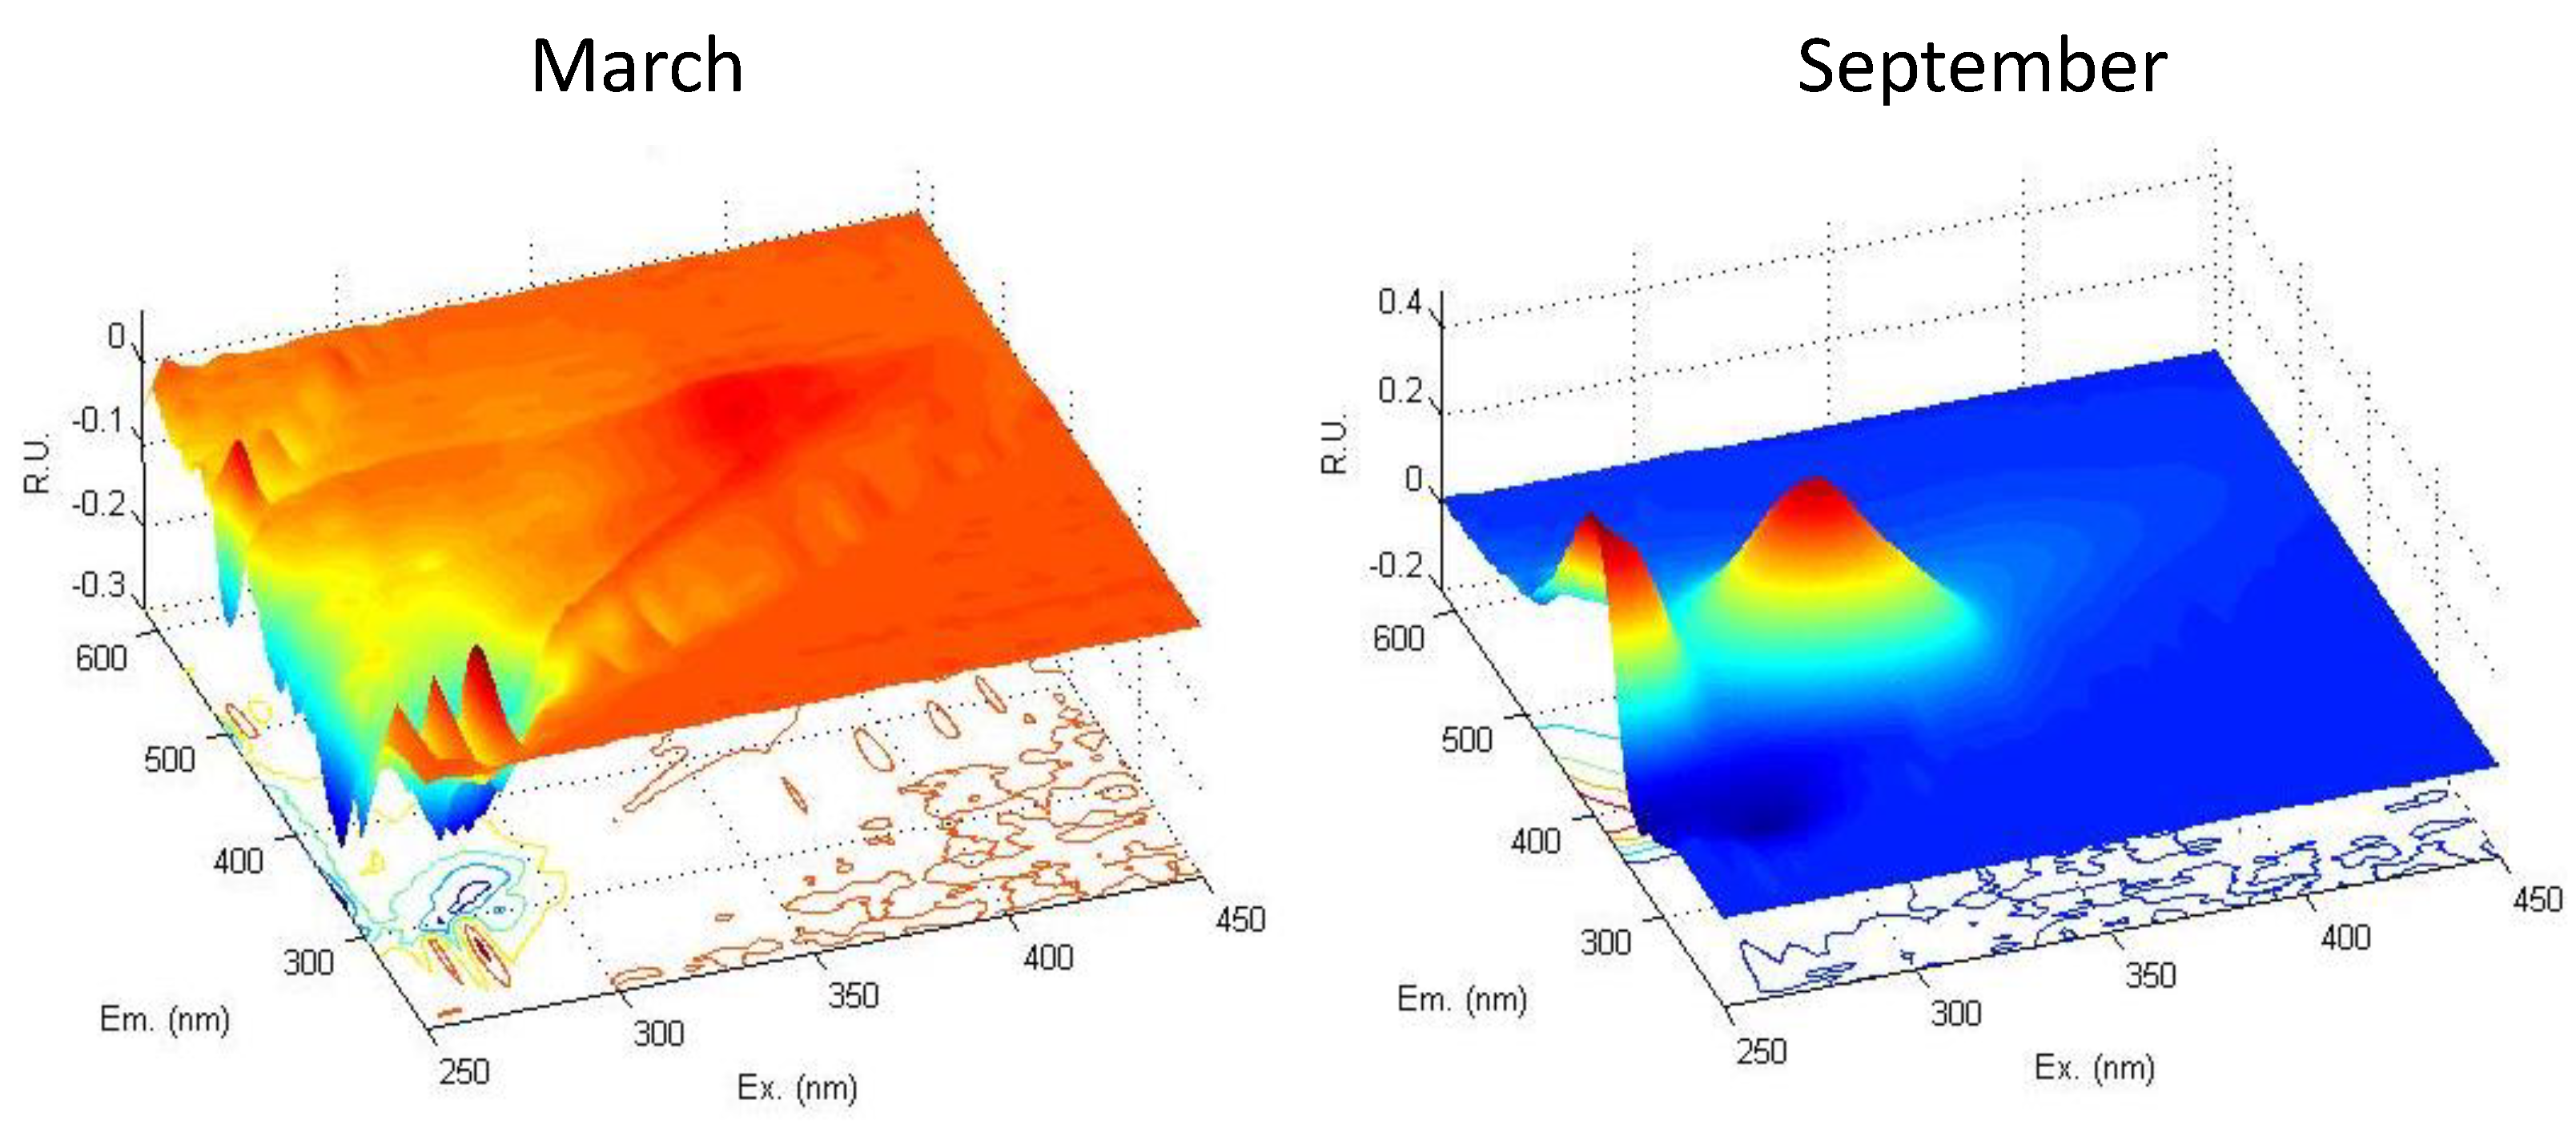
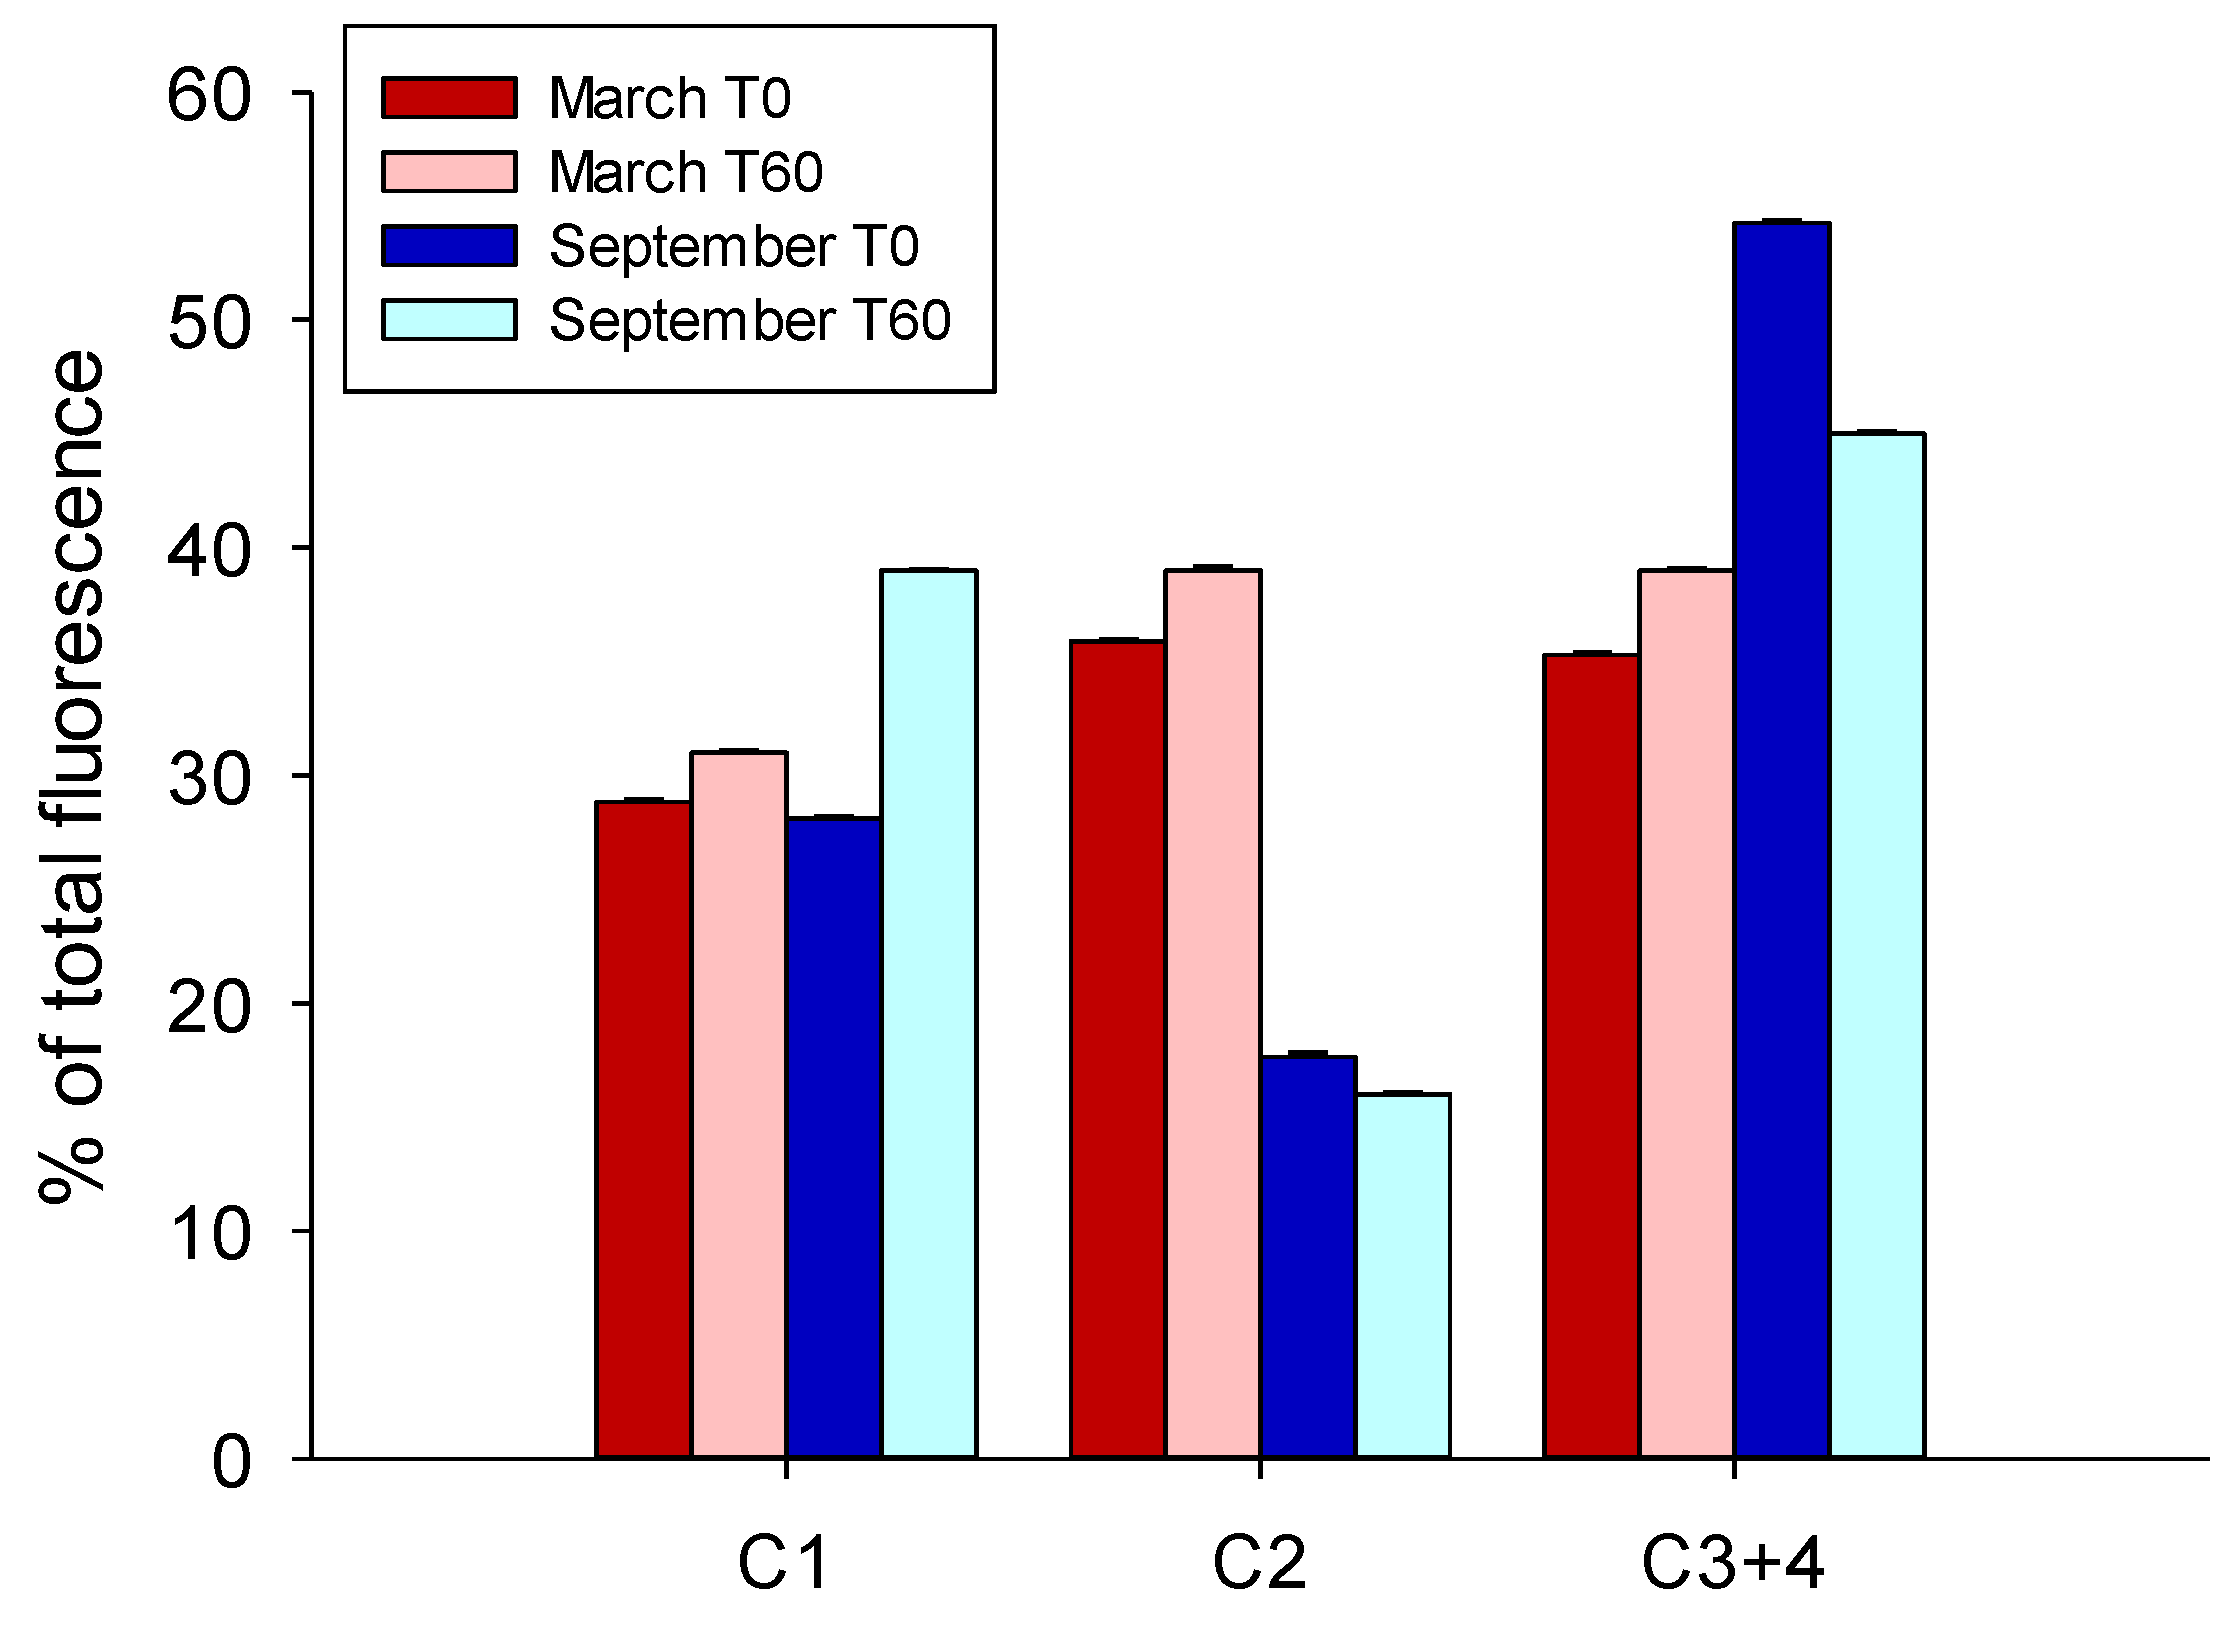
3.3. DOM Quality Affects Its Mineralization and Vice Versa

The PARAFAC analysis of the EEMs validated a four component model (Figures S1 and S2). According to their excitation and emission maxima and to the comparison with similar components within the OpenFluor database [34], these components were attributed to different groups of fluorophores. C1 showed the excitation and emission maxima at 310 and 410 nm, respectively, and its signal was attributed to microbial humic-like compounds [20,35,36,37]. C2 showed the excitation peak at 360 nm, and the emission maximum at 460 and its signal can be attributed to fulvic-like fluorescence [20,38]. The excitation and emission maxima of C3 and C4 were 290/340 and 280/330 nm, which are typical of protein-like compounds fluorescence [20,35,37]. Because both C3 and C4 represent protein-like compounds, hereinafter they are reported together as C3 + C4 in order to show the overall changes in protein-like fluorescence during the incubations.
In order to evaluate the differences in DOM quality between the two periods, the EEMs were compared for the two experiments at T0 (Figure 4).
About 30% of the fluorescence intensity was due to the microbial humic-like component in both experiments (29 ± 0.1% and 28 ± 0.1% in March and September, respectively). The percentage of fulvic-like component in March (36 ± 0.1%) was twice that in September (18 ± 0.2%), whereas the percentage of protein-like fluorescence was markedly higher in September (54 ± 0.1%) than in March (35 ± 0.1%). These results agree well with those reported within the river [20].
Fluorescence and DOC data clearly indicate a marked difference in the DOM in the two periods; in March, DOM has a low concentration and a similar percentage of humic, fulvic, and protein-like FDOM, although the microbial humic FDOM was slightly reduced with respect to the other components. In September, DOM concentration is twice than in March, and protein-like substances dominated the fluorescence signal. It is possible that changes in DOM pool, together with the different environmental conditions (i.e., winter vs. autumn), can favor HP communities with different growth efficiencies or that according to the type of DOM, the HP community can use the available DOM mainly for biomass synthesis (March) or respiration (September).
The fluorescence intensities of the components were followed during the incubations in order to investigate changes in DOM quality due to HP activity (Figure 5). All of the fluorescence components showed no significant variations in the first 48 h of the experiment, suggesting that the DOC removed in this time frame was not fluorescent. In contrast, large changes in fluorescence were observed afterwards.
In both experiments, between 2 and 7/10 days all of the components showed a decrease in intensity, in correspondence with the decrease in HP abundance. From day 7/10 to the end of the experiments, FDOM showed a different trend in the two incubations (Figure 5). In March, all of the components showed a significant decrease until the end of the experiment; in September, the microbial humic-like component (C1) markedly increased, reaching a fluorescence intensity >1.5 times that measured at T0; the fulvic-like component (C2) followed a trend similar to that of the HPA, increasing between 7 and 15 days and then decreasing again; the protein-like components (C3 + C4) slowly decreased towards the end of the experiment.
The overall effect of the HP community on FDOM during the experiments can be seen by the subtraction of the EEMs measured after two months from the EEMs measured at T0 (Figure 6). In March, the HP reduced all of the FDOM components, whereas in September they mainly released microbial humic-like compounds and removed protein-like substances (Figure 6).
The percentage of each component on the total fluorescence was calculated at the end of the experiment and compared with that calculated at T0 (Figure 7). This calculation showed that, in March, the relative weight of the components on the composition of FDOM did not change over the course of the incubation, meaning that all of the components were proportionally removed. After two months of incubation, the percentage of the components were 31 ± 0.1%, 39 ± 0.2%, and 31 ± 0.1% for C1, C2 and C3 + C4, respectively, which are indeed not significantly different from those calculated at T0. In September, a change in the relative FDOM composition was observed between the beginning and the end of the experiment. After two months, the microbial humic-like component (C1) increased from 28 ± 0.1% to 39 ± 0.05%. The protein-like fraction (C3 + C4) decreased from 54 ± 0.1% to 45 ± 0.1%, whereas the fulvic-like component (C2) remained unchanged (16 ± 0.1% after two months).
The increase in humic-like fluorescence due to the HP activity is well documented in the literature [39,40,41,42,43], and supports that humic-like substances do not represent only terrestrial DOM.
The different FDOM trends observed in the two incubations can be attributed to (i) a different composition of the microbial community, (ii) differences in the quality of DOM, or, most probably, by a combination of these two factors. It was reported that biological degradation of DOM is carried out by phylogenetically diverse communities, whose composition has been shown to be affected by the quality and quantity of the available DOM [44,45]. Different groups of bacteria have different capability to use different size-fractions of DOM. Low molecular weight compounds (LMW < 600 Da) can be taken up easily across the cell membrane [46], whereas molecules bigger than 600 Da require extracellular enzymes that not all of the bacterial taxa can produce, as observed by Berlemont and Martiny [47]. It is known that microbial communities can also release FDOM [48]. Goto et al. [41] observed the production of refractory humic-like FDOM by three strains of marine bacteria growing on a labile substrate (glucose). According to their results, the three strains produced different DOM with different efficiency, and proposed specific mechanisms of humic-like FDOM production according to the strain. A recent study highlighted how the microbial community can release humic-like refractory DOM when growing on phytoplankton-derived DOM [40]. This observation supports the results of this study since the increase in humic-like fluorescence was observed in September, after the spring/summer phytoplankton blooms, when indeed a much higher percentage of protein-like fluorescence was present than in March, suggesting a higher abundance of autotrophic DOM. The similar DOC removal rates in September with respect to March, despite the much higher DOC concentration, can be explained by the HP producing refractory humic-like compounds as shown by both Kinsey et al. [40] and Goto et al. [41]. Some studies, combining PARAFAC results with more detailed molecular analysis (FT–ICR–MS) showed that FDOM is a good tracer for the bulk DOM pool [49]. However, FDOM still represents only a fraction of the DOM and a more detailed molecular characterization of all the compounds, including the nonfluorescent ones, could give more insight into its changes and its biologically labile fraction [50].

4. Summary and Conclusions

The results of this study show similar DOC removal rates in the Arno River estuary in spring and autumn, despite the marked difference in DOC initial concentration, HPA, and environmental conditions (i.e., temperature). In both seasons, 8–9% of the initial DOC was removed after 48 h, suggesting that it is labile on the short temporal scale. The estimate of the HPGE growth efficiency highlighted that the HP community can use the removed DOC differently (i.e., growth vs. respiration). A higher percentage of DOC was used for biomass synthesis in March than in September. Fluorescence data suggest a different quality of the initial DOM, with a higher percentage of protein-like compounds and a lower percentage of terrestrial fulvic-like compounds in September than in March. These differences might stimulate the growth of different HP communities with different growth efficiencies. In turn, the HP community affects the FDOM differently during the incubations. In September, the HP removed the protein-like compounds and released a large amount of humic-like compounds that may inhibit a further DOM uptake. These results show that, in absence of grazers the HP community is able to remove protein-like DOM, while the accumulation of protein-rich DOM coincident with a low HPA might be attributed to a top-down control of HP by grazers or by viruses. In March, the HP removed all of the FDOM components consistently with the DOC decrease without apparently altering the relative fluorescence intensity of the components in the DOM pool. The results of this study point to a high complexity of estuarine systems that needs to be investigated further. The similar DOC removal rates, together with the low growth efficiency of September’s HP community, despite DOM being more concentrated and enriched in protein, and despite the higher temperature, was an unexpected result and raises intriguing questions about the cross influences of microbial diversity, physical constrains, and DOM properties. A detailed study on the composition of the HP community at different time of the year, together with more detailed incubation experiments covering all seasons, is needed to get more insights into these processes. Moreover, a molecular characterization of the DOM during the experiments would help in the interpretation of these results and on predicting the biological lability of DOM in different conditions.

Supplementary Materials

The following are available online at https://www.mdpi.com/2077-1312/9/2/172/s1, Figure S1: Results from the PARAFAC split-validation test made by using drEEM 4.0 Matlab toolbox, Figure S2: Contour plots of the 4 components validated by PARAFAC. The figure was made within the drEEM 4.0 Matlab toolbox.

Author Contributions

Conceptualization, C.S., S.R.B., M.G., B.M., and R.C.; methodology, C.S., B.M., and R.C.; formal analysis, S.R.B., C.B., S.V., and B.M.; investigation, C.S., S.R.B., M.G., B.M., and R.C.; data curation, S.R.B., C.B., S.V.; writing—original draft preparation, S.R.B.; writing—review and editing, all authors; funding acquisition, C.S. and B.M. All authors have read and agreed to the published version of the manuscript.

Funding

This research was funded by the COMECOM project as a part of the “MerMex-WP3-C3A” project, by the Italian Flagship project RITMARE funded by the Italian Ministry of Research and University, and by CARTT of the Institut Universitaire Technologique from Toulon University.

Institutional Review Board Statement

Not applicable.

Informed Consent Statement

Not applicable.

Data Availability Statement

The data presented in this study are available on request from the corresponding author.

Conflicts of Interest

The authors declare no conflict of interest. The funders had no role in the design of the study; in the collection, analyses, or interpretation of data; in the writing of the manuscript, or in the decision to publish the results.

References

  1. Hedges, J.I.; Keil, R.G.; Benner, R. What happens to terrestrial organic matter in the ocean? Org. Geochem. 1997, 27, 195–212. [Google Scholar] [CrossRef]
  2. Raymond, P.A.; Spencer, R.G.M. Riverine DOM. In Biogeochemistry of Marine Dissolved Organic Matter, 2nd ed.; Academic Press: Cambridge, MA, USA, 2015; pp. 509–533. ISBN 9780124059405. [Google Scholar]
  3. Bauer, J.E.; Cai, W.-J.; Raymond, P.A.; Bianchi, T.S.; Hopkinson, C.S.; Regnier, P.A.G. The changing carbon cycle of the coastal ocean. Nature 2013, 504, 61–70. [Google Scholar] [CrossRef] [PubMed]
  4. Benner, R. What happens to terrestrial organic matter in the ocean? Mar. Chem. 2004, 92, 307–310. [Google Scholar] [CrossRef]
  5. Richey, J.E. Pathways of Atmospheric CO2 through Fluvial Systems. In The Global Carbon Cycle: Integrating Humans, Climate and the Natural World; Island Press: Washington, DC, USA, 2004; pp. 329–340. [Google Scholar]
  6. Sabine, C.L.; Feely, R.A.; Gruber, N.; Key, R.M.; Lee, K.; Bullister, J.L.; Wanninkhof, R.; Wong, C.S.; Wallace, D.W.R.; Tilbrook, B.; et al. The oceanic sink for anthropogenic CO2. Science 2004, 305, 367–371. [Google Scholar] [CrossRef] [PubMed] [Green Version]
  7. Hernes, P.J.; Benner, R. Photochemical and microbial degradation of dissolved lignin phenols: Implications for the fate of terrigenous dissolved organic matter in marine environments. J. Geophys. Res. Ocean. 2003, 108, 1421. [Google Scholar] [CrossRef]
  8. Shank, G.C.; Zepp, R.G.; Whitehead, R.F.; Moran, M.A. Variations in the spectral properties of freshwater and estuarine CDOM caused by partitioning onto river and estuarine sediments. Estuar. Coast. Shelf Sci. 2005, 65, 289–301. [Google Scholar] [CrossRef]
  9. Uher, G.; Hughes, C.; Henry, G.; Upstill-Goddard, R.C. Non-conservative mixing behavior of colored dissolved organic matter in a humic-rich, turbid estuary. Geophys. Res. Lett. 2001, 28, 3309–3312. [Google Scholar] [CrossRef]
  10. Riedel, T.; Zark, M.; Vähätalo, A.V.; Niggemann, J.; Spencer, R.G.M.; Hernes, P.J.; Dittmar, T. Molecular signatures of biogeochemical transformations in dissolved organic matter from ten world rivers. Front. Earth Sci. 2016, 4, 85. [Google Scholar] [CrossRef] [Green Version]
  11. Paerl, H.W. Assessing and managing nutrient-enhanced eutrophication in estuarine and coastal waters: Interactive effects of human and climatic perturbations. Ecol. Eng. 2006, 26, 40–54. [Google Scholar] [CrossRef]
  12. Crump, B.C.; Hopkinson, C.S.; Sogin, M.L.; Hobbie, J.E. Microbial Biogeography along an Estuarine Salinity Gradient: Combined Influences of Bacterial Growth and Residence Time. Appl. Environ. Microbiol. 2004, 70, 1494–1505. [Google Scholar] [CrossRef] [PubMed] [Green Version]
  13. Lozupone, C.A.; Knight, R. Global patterns in bacterial diversity. Proc. Natl. Acad. Sci. USA 2007, 104, 11436–11440. [Google Scholar] [CrossRef] [Green Version]
  14. Troussellier, M.; Schäfer, H.; Batailler, N.; Bernard, L.; Courties, C.; Lebaron, P.; Muyzer, G.; Servais, P.; Vives-Rego, J. Bacterial activity and genetic richness along an estuarine gradient (Rhone River plume, France). Aquat. Microb. Ecol. 2002, 28, 028013. [Google Scholar] [CrossRef]
  15. Crump, B.C.; Armbrust, E.V.; Baross, J.A. Phylogenetic analysis of particle-attached and free-living bacterial communities in the Columbia River, its estuary, and the adjacent coastal ocean. Appl. Environ. Microbiol. 1999, 65, 3192–3204. [Google Scholar] [CrossRef] [Green Version]
  16. Goñi-Urriza, M.S.; Point, D.; Amouroux, D.; Guyoneaud, R.; Donard, O.F.X.; Caumette, P.; Duran, R. Bacterial community structure along the Adour estuary (French Atlantic coast): Influence of salinity gradient versus metal contamination. Aquat. Microb. Ecol. 2007, 49, 47–56. [Google Scholar] [CrossRef] [Green Version]
  17. Apple, J.K.; del Giorgio, P.A.; Kemp, W.M. Temperature regulation of bacterial production, respiration, and growth efficiency in a temperate salt-marsh estuary. Aquat. Microb. Ecol. 2006, 43, 243–254. [Google Scholar] [CrossRef]
  18. Raymond, P.; Bauer, J. Bacterial consumption of DOC during transport through a temperate estuary. Aquat. Microb. Ecol. 2000, 22, 1–12. [Google Scholar] [CrossRef] [Green Version]
  19. Ram, A.S.P.; Nair, S.; Chandramohan, D. Bacterial growth efficiency in a tropical estuary: Seasonal variability subsidized by allochthonous carbon. Microb. Ecol. 2007, 53, 591–599. [Google Scholar] [CrossRef] [Green Version]
  20. Brogi, S.R.; Balestra, C.; Casotti, R.; Cossarini, G.; Galletti, Y.; Gonnelli, M.; Vestri, S.; Santinelli, C. Time resolved data unveils the complex DOM dynamics in a Mediterranean river. Sci. Total Environ. 2020, 733, 139212. [Google Scholar] [CrossRef] [PubMed]
  21. Sherr, E.; Sherr, B. Understanding Roles of Microbes in Marine Pelagic Food Webs: A Brief History. In Microbial Ecology of the Oceans, 2nd ed.; John Wiley & Sons, Inc.: Hoboken, NJ, USA, 2008; ISBN 9780470043448. [Google Scholar]
  22. Gasol, J.M.; Zweifel, U.L.; Peters, F.; Fuhrman, J.A.; Hagström, Å. Significance of size and nucleic acid content heterogeneity as measured by flow cytometry in natural planktonic bacteria. Appl. Environ. Microbiol. 1999, 65, 4475–4483. [Google Scholar] [CrossRef] [Green Version]
  23. Grégori, G.; Citterio, S.; Ghiani, A.; Labra, M.; Sgorbati, S.; Brown, S.; Denis, M. Resolution of Viable and Membrane-Compromised Bacteria in Freshwater and Marine Waters Based on Analytical Flow Cytometry and Nucleic Acid Double Staining. Appl. Environ. Microbiol. 2001, 67, 4662–4670. [Google Scholar] [CrossRef] [PubMed] [Green Version]
  24. Santinelli, C.; Follett, C.; Brogi, S.R.; Xu, L.; Repeta, D. Carbon isotope measurements reveal unexpected cycling of dissolved organic matter in the deep Mediterranean Sea. Mar. Chem. 2015, 177, 267–277. [Google Scholar] [CrossRef] [Green Version]
  25. Hansell, D.A. Dissolved Organic Carbon Reference Material Program. Eos Trans. Am. Geophys. Union 2005, 86, 318. [Google Scholar] [CrossRef]
  26. Ducklow, H.W. Bacterial Production and Biomass in the Oceans; John Wiley & Sons, Inc.: Hoboken, NJ, USA, 2000; pp. 85–120. [Google Scholar]
  27. Brogi, S.R.; Charrière, B.; Gonnelli, M.; Vaultier, F.; Sempéré, R.; Vestri, S.; Santinelli, C. Effect of uv and visible radiation on optical properties of chromophoric dissolved organic matter released by emiliania huxleyi. J. Mar. Sci. Eng. 2020, 8, 888. [Google Scholar] [CrossRef]
  28. Murphy, K.R.; Stedmon, C.A.; Graeber, D.; Bro, R. Fluorescence spectroscopy and multi-way techniques. PARAFAC. Anal. Methods 2013, 5, 6557. [Google Scholar] [CrossRef] [Green Version]
  29. Sokal, R.R.; Rohlf, F.J. Biometry: The Principles and Practice of Statistics in Biological Research; W H Freeman & Company: New York, NY, USA, 1995; ISBN 0716724111. [Google Scholar]
  30. Retelletti Brogi, S.; Gonnelli, M.; Vestri, S.; Santinelli, C. Biophysical processes affecting DOM dynamics at the Arno river mouth (Tyrrhenian Sea). Biophys. Chem. 2015, 197, 1–9. [Google Scholar] [CrossRef]
  31. Avery, G.B.; Willey, J.D.; Kieber, R.J.; Shank, G.C.; Whitehead, R.F. Flux and bioavailability of Cape Fear River and rainwater dissolved organic carbon to Long Bay, southeastern United States. Glob. Biogeochem. Cycles 2003, 17, 2229. [Google Scholar] [CrossRef]
  32. Moran, M.A.; Sheldon, J.E. Biodegradation of Riverine Dissolved Estuaries of the Southeastern United Organic States Carbon in Five. Estuaries 1999, 22, 55–64. [Google Scholar] [CrossRef]
  33. Riemann, L.; Middelboe, M. Viral lysis of marine bacterioplankton: Implications for organic matter cycling and bacterial clonal composition. Ophelia 2002, 10409490. [Google Scholar] [CrossRef]
  34. Murphy, K.R.; Stedmon, C.A.; Wenig, P.; Bro, R. OpenFluor—An online spectral library of auto-fluorescence by organic compounds in the environment. Anal. Methods 2014, 6, 658–661. [Google Scholar] [CrossRef] [Green Version]
  35. Lambert, T.; Teodoru, C.R.; Nyoni, F.C.; Bouillon, S.; Darchambeau, F.F.; Massicotte, P.; Borges, A.V. Along-stream transport and transformation of dissolved organic matter in a large tropical river. Biogeosciences 2016, 13, 2727–2741. [Google Scholar] [CrossRef] [Green Version]
  36. Maie, N.; Sekiguchi, S.; Watanabe, A.; Tsutsuki, K.; Yamashita, Y.; Melling, L.; Cawley, K.M.; Shima, E.; Jaffé, R. Dissolved organic matter dynamics in the oligo/meso-haline zone of wetland-influenced coastal rivers. J. Sea Res. 2014, 91, 58–69. [Google Scholar] [CrossRef] [Green Version]
  37. Meng, F.; Huang, G.; Yang, X.; Li, Z.; Li, J.; Cao, J.; Wang, Z.; Sun, L. Identifying the sources and fate of anthropogenically impacted dissolved organic matter (DOM) in urbanized rivers. Water Res. 2013, 47, 5027–5039. [Google Scholar] [CrossRef] [PubMed]
  38. Lapierre, J.F.; del Giorgio, P.A. Partial coupling and differential regulation of biologically and photochemically labile dissolved organic carbon across boreal aquatic networks. Biogeosciences 2014, 11, 5969–5985. [Google Scholar] [CrossRef] [Green Version]
  39. Asmala, E.; Autio, R.; Kaartokallio, H.; Stedmon, C.A.; Thomas, D.N. Processing of humic-rich riverine dissolved organic matter by estuarine bacteria: Effects of predegradation and inorganic nutrients. Aquat. Sci. 2014, 76, 451–463. [Google Scholar] [CrossRef]
  40. Kinsey, J.D.; Corradino, G.; Ziervogel, K.; Schnetzer, A.; Osburn, C.L. Formation of chromophoric dissolved organic matter by bacterial degradation of phytoplankton-derived aggregates. Front. Mar. Sci. 2018, 4, 430. [Google Scholar] [CrossRef]
  41. Goto, S.; Tada, Y.; Suzuki, K.; Yamashita, Y. Evaluation of the Production of Dissolved Organic Matter by Three Marine Bacterial Strains. Front. Microbiol. 2020, 11, 2553. [Google Scholar] [CrossRef] [PubMed]
  42. Lønborg, C.; Álvarez-Salgado, X.A.; Davidson, K.; Miller, A.E.J. Production of bioavailable and refractory dissolved organic matter by coastal heterotrophic microbial populations. Estuar. Coast. Shelf Sci. 2009, 82, 682–688. [Google Scholar] [CrossRef] [Green Version]
  43. Arai, K.; Wada, S.; Shimotori, K.; Omori, Y.; Hama, T. Production and degradation of fluorescent dissolved organic matter derived from bacteria. J. Oceanogr. 2018, 74, 39–52. [Google Scholar] [CrossRef]
  44. Logue, J.B.; Stedmon, C.A.; Kellerman, A.M.; Nielsen, N.J.; Andersson, A.F.; Laudon, H.; Lindström, E.S.; Kritzberg, E.S. Experimental insights into the importance of aquatic bacterial community composition to the degradation of dissolved organic matter. ISME J. 2016, 10, 533–545. [Google Scholar] [CrossRef] [PubMed]
  45. Logue, J.B.; Lindström, E.S. Biogeography of Bacterioplankton in Inland Waters. Freshw. Rev. 2008, 1, 99–114. [Google Scholar] [CrossRef] [Green Version]
  46. Weiss, M.S.; Abele, U.; Weckesser, J.; Welte, W.; Schiltz, E.; Schulz, G.E. Molecular architecture and electrostatic properties of a bacterial porin. Science 1991, 254, 1627–1630. [Google Scholar] [CrossRef] [PubMed]
  47. Berlemont, R.; Martiny, A.C. Phylogenetic distribution of potential cellulases in bacteria. Appl. Environ. Microbiol. 2013, 79, 1545–1554. [Google Scholar] [CrossRef] [PubMed] [Green Version]
  48. Romera-Castillo, C.; Sarmento, H.; Alvarez-Salgado, X.A.; Gasol, J.M.; Marrasé, C. Net production and consumption of fluorescent colored dissolved organic matter by natural bacterial assemblages growing on marine phytoplankton exudates. Appl. Environ. Microbiol. 2011, 77, 7490–7498. [Google Scholar] [CrossRef] [Green Version]
  49. Stubbins, A.; Lapierre, J.-F.F.; Berggren, M.; Prairie, Y.T.; Dittmar, T.; del Giorgio, P.A. What’s in an EEM? Molecular signatures associated with dissolved organic fluorescence in boreal Canada. Environ. Sci. Technol. 2014, 48, 10598–10606. [Google Scholar] [CrossRef] [PubMed]
  50. Osterholz, H.; Kirchman, D.L.; Niggemann, J.; Dittmar, T. Diversity of bacterial communities and dissolved organic matter in a temperate estuary. FEMS Microbiol. Ecol. 2018, 94, fiy119. [Google Scholar] [CrossRef] [Green Version]
Figure 1. Sampling sites (light blue March, white September).
Jmse 09 00172 g001
Figure 2. Dissolved organic carbon (DOC) concentration during the two incubations, and a zoom of the first 48 h (inserts). Error bars refer to the standard deviation among the three replicates. Note the difference in y-axis scale.
Jmse 09 00172 g002
Figure 3. Heterotrophic prokaryotes abundance (HPA) during the two experiments, and a zoom of the first 48 h (inserts). Error bars refer to the standard deviation among the replicates. Note the difference in y-axis scale.
Jmse 09 00172 g003
Figure 4. Excitation–emission matrices (EEMs) of samples measured at T0 in March and September. The four parallel factor analysis (PARAFAC) components are indicated with white circles on both the EEMs. For better visual comparison, the two EEMs were normalized to have a maximum fluorescence intensity of 1.
Jmse 09 00172 g004
Figure 5. Fluorescence intensity of the components during the two experiments, and a zoom in the first 48 h (inserts). Error bars refer to the standard deviation between the replicates.
Jmse 09 00172 g005
Figure 6. Three-dimensional plot of the subtraction between the EEMs at the end of the experiment (60 days) and the EEMs at T0 (T60 EEM–T0 EEM) showing the overall effect of incubation on fluorescent DOM (FDOM).
Jmse 09 00172 g006
Figure 7. Percentages of the fluorescence components on total fluorescence at the beginning (darker colors) and end (lighter colors) of the experiment in March (red) and September (blue).
Jmse 09 00172 g007
Table 1. Initial conditions of the two experiments.
MarchSeptember
Temperature in situ (°C)11.522.2
Salinity12.718.7
DOC (µM)179316
HPA (cells mL−1)1.3 × 1056.3 × 104
Publisher’s Note: MDPI stays neutral with regard to jurisdictional claims in published maps and institutional affiliations.

