Article

Posidonia oceanica as a Source of Chromophoric Dissolved Organic Matter for the Oligotrophic NW Mediterranean Coast

by
Francesca Iuculano
1,
Carlos M. Duarte
2,
Jaime Otero
3,
Xosé Antón Álvarez-Salgado
4,* and
Susana Agustí
2
1
Global Change Research Group, Department of Oceanography and Global Change, CSIC-UIB Instituto Mediterraneo de Estudios Avanzados (IMEDEA), 07190 Esporles, Spain
2
Red Sea Research Centre, King Abdullah University of Science and Technology (KAUST), Thuwal 23955-6900, Saudi Arabia
3
Instituto Español de Oceanografía, Centro Oceanográfico de Vigo, 36390 Vigo, Spain
4
Organic Geochemistry Lab, CSIC Instituto de Investigaciones Marinas, 36208 Vigo, Spain
*
Author to whom correspondence should be addressed.
J. Mar. Sci. Eng. 2020, 8(11), 911; https://doi.org/10.3390/jmse8110911
Submission received: 30 September 2020 / Revised: 29 October 2020 / Accepted: 8 November 2020 / Published: 12 November 2020
(This article belongs to the Special Issue Advances in Marine Dissolved Organic Matter Dynamics)

Abstract

:
Posidonia oceanica is a well-recognized source of dissolved organic matter (DOM) derived from exudation and leaching of seagrass leaves, but little is known about its impact on the chromophoric fraction of DOM (CDOM). In this study, we monitored for two years the optical properties of CDOM in two contrasting sites in the Mallorca Coast (Balearic Islands). One site was a rocky shore free of seagrass meadows, and the second site was characterized by the accumulation of non-living seagrass material in the form of banquettes. On average, the integrated color over the 250–600 nm range was almost 6-fold higher in the beach compared with the rocky shore. Furthermore, the shapes of the CDOM spectra in the two sites were also different. A short incubation experiment suggested that the spectral differences were due to leaching from P. oceanica leaf decomposition. Furthermore, occasionally the spectra of P. oceanica was distorted by a marked absorption increase at wavelength < 265 nm, presumably related to the release of hydrogen sulfide (HS) associated with the anaerobic decomposition of seagrass leaves within the banquettes. Our results provide the first evidence that P. oceanica is a source of CDOM to the surrounding waters.

1. Introduction

Chromophoric dissolved organic matter (CDOM) represents a sub-fraction of the total pool of dissolved organic matter (DOM) that absorbs light over a broad range of the sunlight spectrum, particularly in the UV and blue region [1]. CDOM plays key roles in biogeochemical processes [2,3], determining the underwater light availability [4,5], controlling and mitigating the ultraviolet (UV) light penetration [6], and providing physiological protection to UV radiation (UVR)-sensitive organisms from damage (e.g., phytoplankton, coral reefs, macroalgae). Furthermore, CDOM can be a tracer of ecosystem processes in coastal environments [2,7,8].
In coastal ecosystems, the primary allochthonous sources of CDOM are surface and groundwater continental runoff [2,9,10] with a high content of colored humic materials leached from soils [11]. However, in coastal areas not affected by continental inputs, CDOM originates mainly from autochthonous production associated with phytoplankton [12,13,14] and green, brown, and red macroalgae [15]. Kelp forests [16,17] and senescent kelp wracks [18], mangroves and Sargassum colonies [19], wetlands [20,21], and saltmarshes [22] have also been considered important sources.
In the oligotrophic coastal areas of the Balearic Sea, the seagrass Posidonia oceanica Delile (L.) is the dominant benthic primary producer [23,24] and provides key ecosystem services [25,26]. This seagrass species (Angiospermae) is endemic of the Mediterranean Sea and develops key and highly productive benthic ecosystems [23,27] that affect biological production and biogeochemical processes in the littoral coastal zone [28]. P. oceanica meadows act as important CO2 sinks that bury about 20% of the carbon stored in the global ocean [29,30,31] and are also important carbonate reservoirs [32,33].
During its seasonal cycle, in late summer/beginning of autumn, leaves are shed by the seagrass and detached seagrass material is transported by currents to accumulate as beach-cast material. These accumulations, termed “banquettes” by the French authors [34] are governed by accretion vs. destruction processes [35]. Despite its geomorphodynamic, ecological, and biogeochemical importance, P. oceanica banquettes are often removed for aesthetic reasons to favor the recreational use of beaches [29]. However, its protection and management should be considered by the authorities as its removal has huge implications for the ecosystems functioning, causing loss of nutrients essential to sustain all the trophic web interactions [36].
It is well known that seagrass release dissolved organic carbon (DOC) [8,37,38,39,40,41]. Furthermore, it has already been demonstrated that solar radiation amplifies the exudation and leaching from seagrass leaves [18,42]. Otis et al. [43] hypothesized that seagrass beds on the shallow banks of the Bahamas could be the reason behind the elevated CDOM levels observed there, compared with the adjacent deep waters. However, to the best of our knowledge, only two studies have dealt with the role of seagrass meadows as CDOM sources. Stabenau et al. [44] identified the seagrass Thalassia testudinum as a source of CDOM in the low-latitude coastal shelf region of Florida bay, revealing that seagrass detritus was a more powerful source of CDOM than the living plants. Clark et al. [18] studied the eelgrass Zostera marina in Southern California, observing that the tidal ranges influenced the fluctuations in the absorption coefficient of CDOM at 300 nm (a300) and also performed photodegradation experiments with seagrass and kelp leachates. It is thus clear that more research remains to be carried out to understand the fate of CDOM derived from seagrass litter decomposition, particularly with P. oceanica in oligotrophic coastal Mediterranean ecosystems.
The aim of this work is to test the hypothesis that P. oceanica leaf litter is a source of CDOM for the oligotrophic Mediterranean coast by comparing the CDOM spectra in a seagrass-free rocky shore and a beach occupied with banquettes through several years. To the best of our knowledge, this is the first study identifying P. oceanica leaf litter as an autochthonous source of CDOM production.

2. Materials and Methods

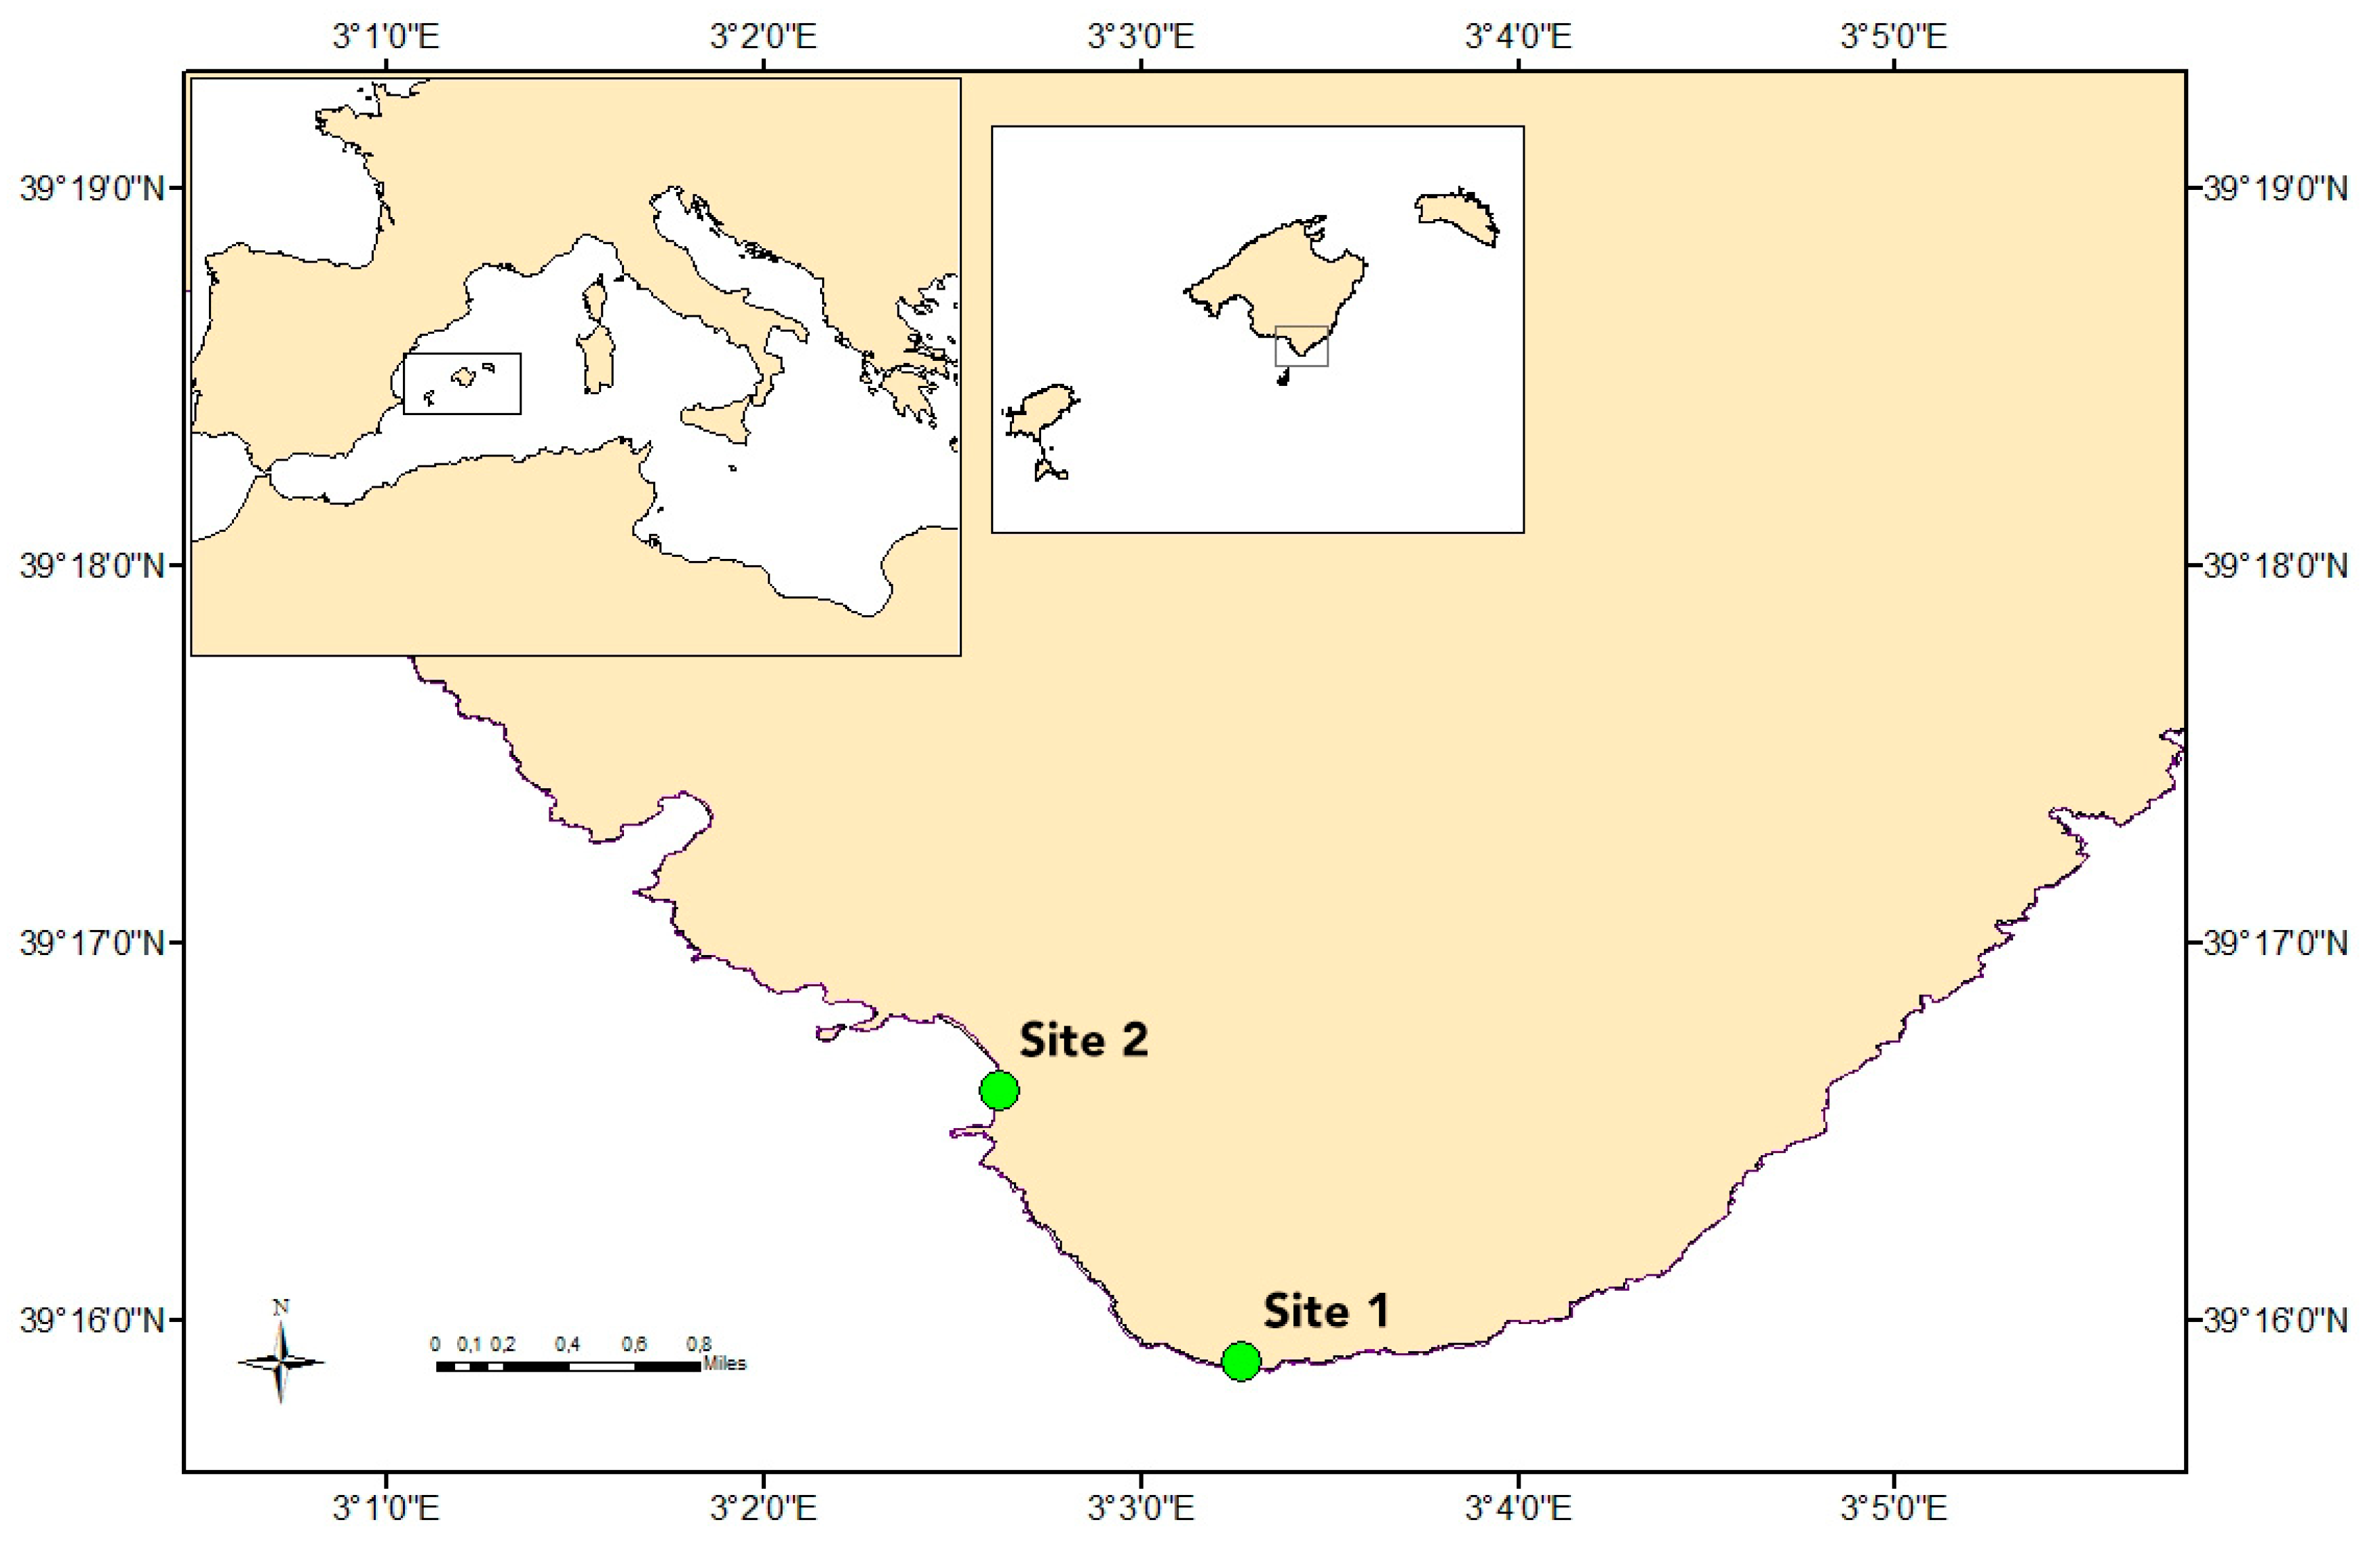
2.1. Sampling Strategy

Seawater samples were collected at two sites in the coast of Mallorca (Balearic Island, NW Mediterranean Sea): Cap Ses Salines and Es Caragol Beach (Figure 1). Site 1, the Cap Ses Salines lighthouse experimental field station (latitude 39.264724 N; longitude 3.054446 E), is a relatively pristine and oligotrophic rocky shore ecosystem, with an extensive seagrass of P. oceanica meadow extended around 500 m offshore [45] and flushed with open waters; and site 2, Es Caragol Beach (latitude 39.276784 N; longitude 3.043779 E), is a natural sandy beach in a site of community relevance (EU directive-Red Natura 2000) where abundant seagrass detritus accumulates in the shore.
Site 1 was visited 76 times from 9 January 2012 to 23 March 2015 with a fortnight to monthly frequency. Additionally, site 2 was visited 40 times from17 August 2012 to 24 September 2014. On 35 occasions, both sites were sampled on the same dates and were selected for comparative purposes. Samples were collected at the surface (about 1-m depth) in site 1, and at the beach shoreline, about 0.5 m off the banquette, in site 2.

2.2. Physical and Biogeochemical Variables

Air temperature, wind velocity, and total solar radiation were recorded with an Aanderaa Automatic Meteorological Weather Station 2700 equipped with a data logger 3660, installed at Cap Ses Salines. UV radiation values were obtained from a Kipp and Zonen Ultraviolet (UV) A-B (UVA-B) radiometer, which measures both UVA and UVB irradiance. Sea-surface temperature was measured using a high- precision calibrated thermometer (ACCD650P Handheld Pt100 Thermometer) [46]. Sea surface salinity was not recorded because it has been demonstrated there is no significant variability in Cap Ses Salines, where annual mean values are around 38.05 [47].
Chlorophyll a concentration was determined at Cap Ses Salines, as described in [46]. One hundred and fifty milliliters of seawater was filtered through a Whatman GF/F filter (nominal pore size of 0.7 µm) and stored at −20 °C. Filters were then extracted in 6 mL of 90% acetone for 24 h and Chl a concentrations (mg Chl a m−3) were derived from the fluorescence of the extracts measured in a Trilogy Fluorometer (Turner Design, Sunnyvale, CA, USA). The fluorometer was previously calibrated with pure Chl a (Sigma), following Parsons et al. [48].
Dissolved organic carbon (DOC) samples were collected at Cap Ses Salines (and in duplicate at Es Caragol), filtered through pre-combusted Whatman GF/F filters (450 °C, 4 h), and collected in 10 mL pre-combusted (450 °C, 12 h) glass ampoules, acidified with 20 µL of phosphoric acid H3PO4 (final pH < 2), heat-sealed, and stored in the dark at 4 °C until analysis. DOC concentrations were determined by high-temperature catalytic oxidation on a Shimadzu Total Carbon Analyzer TOC-V. The analyzer was standardized daily with potassium hydrogen phthalate. Each ampoule was injected 3 to 5 times and the average area of the 3 replicates that yielded a standard deviation <1% was chosen to calculate the average DOC concentration of each sample, after subtraction of the average area of the milli-Q water used as a blank. Reference materials provided by Prof. D. Hansell (University of Miami) were used to test the good performance of the analyzer.

2.3. CDOM Measurements

Seawater samples were collected in 125 mL acid-washed glass flasks to record their absorption coefficient spectra of CDOM. They were covered with aluminum foil to prevent sunlight effects and stored at room temperature until measurement within 2–3 h of collection. Aliquots of 50 mL were gently filtered through a 0.2 µm-pore size Millex filter (PTFE membrane), in order to remove cells and suspended particles, by means of a syringe, avoiding the development of bubbles. The initial 20 mL were used to flush the syringe and the filter, and the remaining 30 mL to fill the quartz cuvette. Absorption measurements were performed immediately after filtration.
The UV-visible absorption spectra of CDOM were recorded between 250 and 750 nm at 1 nm intervals in 10 cm path length quartz cuvettes in a double beam Thermo Scientific Evolution 300 spectrophotometer (Thermo VisionPRO software). Fresh UV-milli-Q water was used as a blank. The mean absorbance from 600 to 750 nm was subtracted from all absorbance measurements to correct the residual scattering caused by micro-air bubbles or colloidal material present in the sample, refractive index differences between the sample and the reference, or light attenuation that was not related to organic matter. The estimated detection limit of the spectrophotometer is 0.001 absorbance units or 0.02 m−1. The absorbance at any wavelength was converted into Napierian absorption coefficient aλ (in m−1) using the equation:
a λ = 2.303     [ ABS λ ABS 600 750 ] l  
where ABSλ is the absorbance at a wavelength λ, ABS600–750 is the average absorbance between 600 and 750 nm, l is the path length of the cuvette (0.1 m), and 2.303 is the factor that converts from decadic to natural logarithms. Given that the detection limit of the instrument in Napierian absorption coefficient units is 0.02 m−1, we took as reliable aλ measurements those above 0.05 m−1, i.e., 2.5 times the detection limit. Absorption coefficient measurements were above 0.05 m−1 over the whole wavelength range in site 2 and at wavelengths > 400 nm in site 1.
The individual absorption spectra were used to obtain a series of optical parameters that have been proven to be useful proxies to the amount and molecular structure of CDOM. The absorption coefficient at 254 nm (a254) frequently exhibited a positive linear relationship with the bulk dissolved organic carbon (DOC) concentration [49] since conjugated double bonds are one of the most abundant forms of carbon in the DOM pool. This linear relationship has been observed in coastal waters influenced by river plumes [50,51] or by continental runoff [52], and also in open ocean waters [53,54]. Closely related to a254 is the carbon-specific UV absorption coefficient at 254 nm, (SUVA254) [49] that was calculated dividing the decadic absorption coefficient at 254 nm by the DOC concentration and expressed in m−1 L mg C−1. Given that very few solar photons of wavelength < 295 nm reach the Earth’s surface [55], a254 should not be highly sensitive to the incident solar UVR [56]. Conversely, the absorption coefficient at 325 nm (a325) does respond to the absorption of the solar UVA radiation and, therefore, it represents the balance of microbial production and photochemical degradation of the aromatic fraction of CDOM [57]. The absorption coefficient ratio at 254 to 365 nm (a254/365) is commonly applied as a proxy for the average molecular weight (MW) of CDOM [58,59]. Higher values of a254/365 indicate lower average MW compounds of CDOM [60]. The spectral slope over the wavelength range 275–295 nm (S275–295), calculated from linear regression of the natural log-transformed aλ spectra, also appears to be particularly sensitive to shifts in molecular weight or DOM origin [61]. Thus, together with the CDOM spectral slope over 350–400 nm (S350–400), it is commonly applied as a tool for the structural characterization of CDOM. Steeper slopes indicate a faster decrease in absorption with increasing wavelength, which are inversely correlated to the molecular weight and directly correlated to photobleaching of CDOM. Helms et al. [61] also proposed a dimensionless parameter, the slope ratio (SR), which is the ratio between S275–295 and S350–400. Low values of SR are inversely related to the molecular weight and its degree of aromaticity and origin.
Furthermore, we also propose the following indices, which are specific for the objectives of this work: (i) The integrated absorption spectra, Σaλ, to obtain an overall absorption value embracing all the variability of the individual spectra (it was calculated by summing up the absorption coefficients from 250 to 600 nm and expressed in m−1 nm); (ii) the difference of CDOM absorption between Es Caragol and Cap Ses Salines, ∆aλ, which was calculated by subtracting aλ at Es Caragol minus aλ at Cap Ses Salines for each individual sampling date; and (iii) the normalized ∆aλ spectra, n∆aλ, to compare the shapes of the ∆aλ spectra among sampling dates, which was calculated as follows:
n∆aλ = ∆aλ/Σ∆aλ · 100

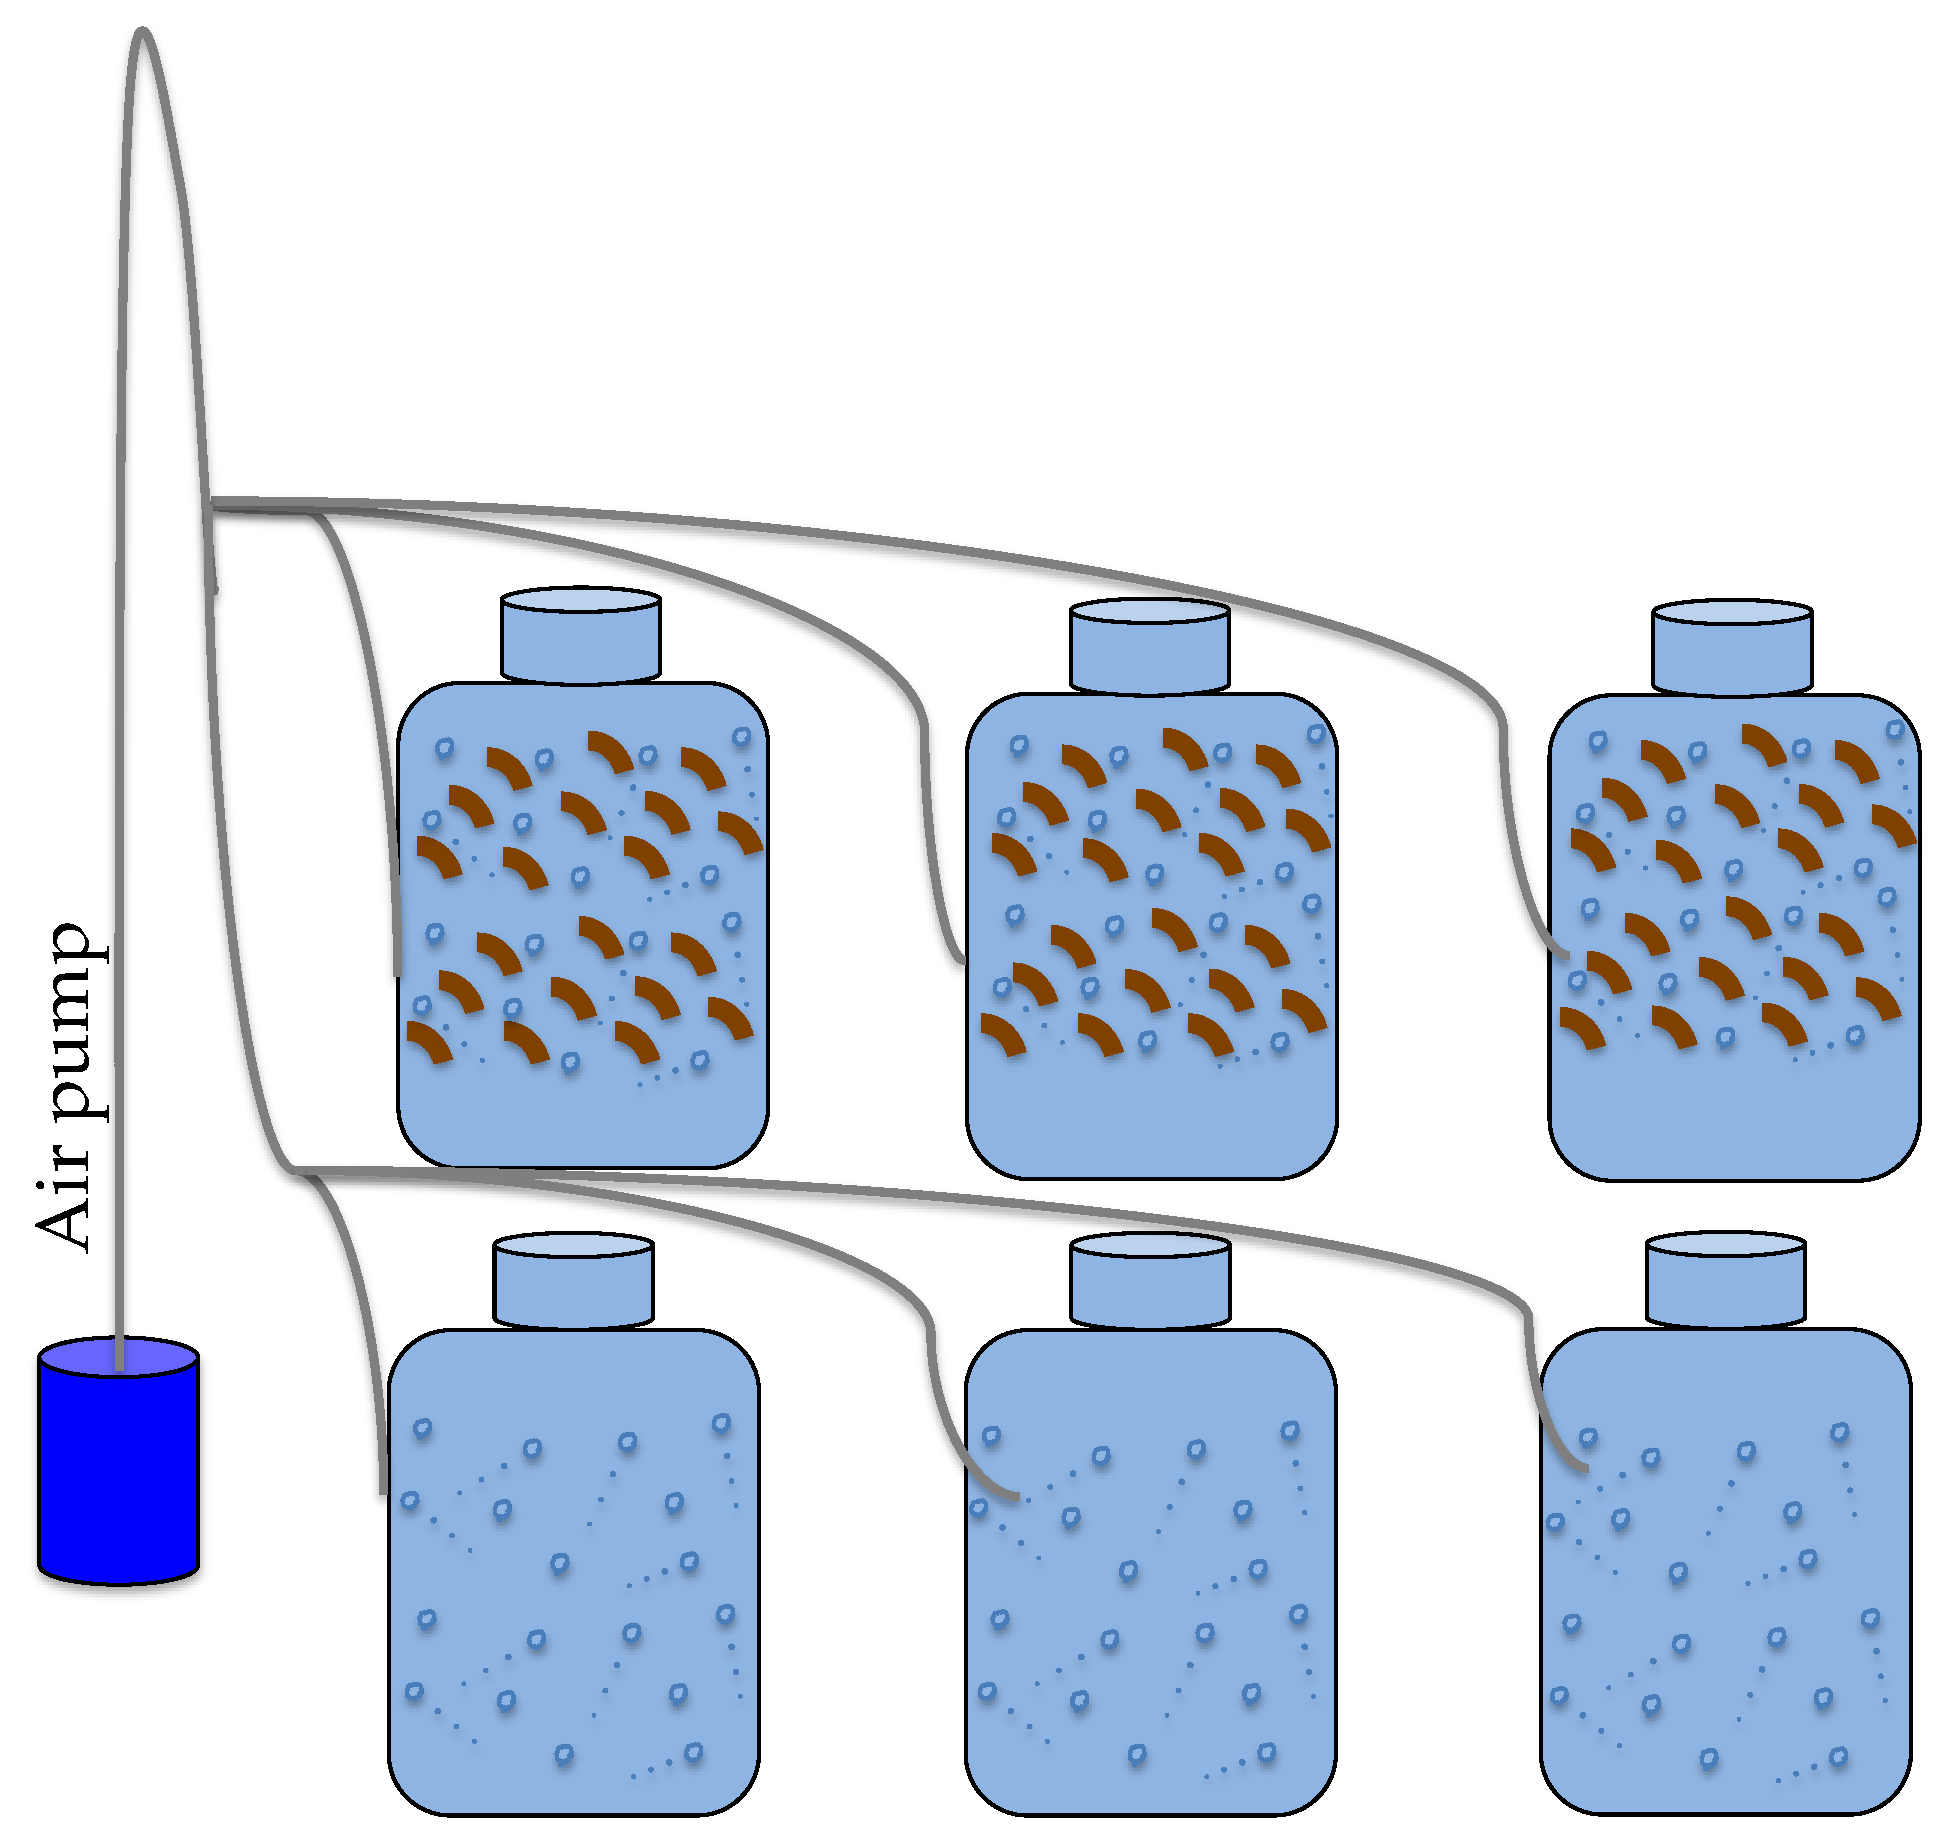
2.4. Experimental Assessment of CDOM Release by P. oceanica Leaf Litter

P. oceanica leaf litter was collected on 8 September 2014 from the beach shoreline of site 2 and stored at 4 °C until performing a laboratory incubation experiment on 24 September 2014, in order to corroborate our field observations. Following the procedure of Iuculano et al. [62], about 16.6 mg of fresh weight L−1 of P. oceanica leaf litter were cut, added to a 250-mL glass flask filled with fresh seawater sampled at Cap Ses Salines, filtered through 0.2 μm, and incubated at the in situ temperature (26 °C) and a light:dark cycle (14:10 h) in a laboratory chamber (Figure 2). The amount of leaf litter added was calculated to obtain a final concentration similar to that measured in near shore waters at Es Caragol Beach, as described in [62]. Another 250-mL glass flask without any leaf litter was incubated in parallel, serving as a control. Both the treatment and control were incubated in triplicate. CDOM absorption coefficient spectra were measured at the initial time, after 24 h, and after 48 h, processed, and then normalized as described above.

2.5. Statistical Analysis

A Pearson correlation matrix to test for the correlation between the environmental variables (air and water temperature; UVA, UVB, and photosynthetically active radiation (PAR); wind components; and Chl a) was produced. Correlation matrices for DOC and the CDOM variables (a254, a325, a254/365, S275–295, and SR) at Cap Ses Salines and Es Caragol Beach were also created.
Seasonal cycles were described using generalized additive models (GAMs) [63]. A GAM is a non-parametric regression technique that allows for the inspection of the relationship between a response variable and one (or more) explanatory variable(s) without the need to choose a particular parametric form for describing the shape of the relationship(s). In this work, we studied the seasonal cycle for the measured variables in both sites using the day of the year (DoY) as the explanatory variable. GAMs were formulated as follows: Yi = α + g (DoYi) + εi, where Y is the variable of interest measured at a day i, α is the intercept, and εi is the error term assumed to be normally distributed. g is the non-parametric smoothing function specifying the effect of DoY on the response variable Y. The smoothing function g was fit by penalized cyclic cubic regression spline and the number of knots was restricted to a maximum of six.
The relationship between selected CDOM indices and environmental variables (covariates) between sites (factor) was evaluated using an analysis of covariance (ANCOVA). In particular, the CDOM indices we tested were a325 as a proxy to the quantity and a254/365 as a proxy to the quality of DOM and the environmental covariates were air and water temperature, UV and PAR radiations, and wind velocity.

3. Results

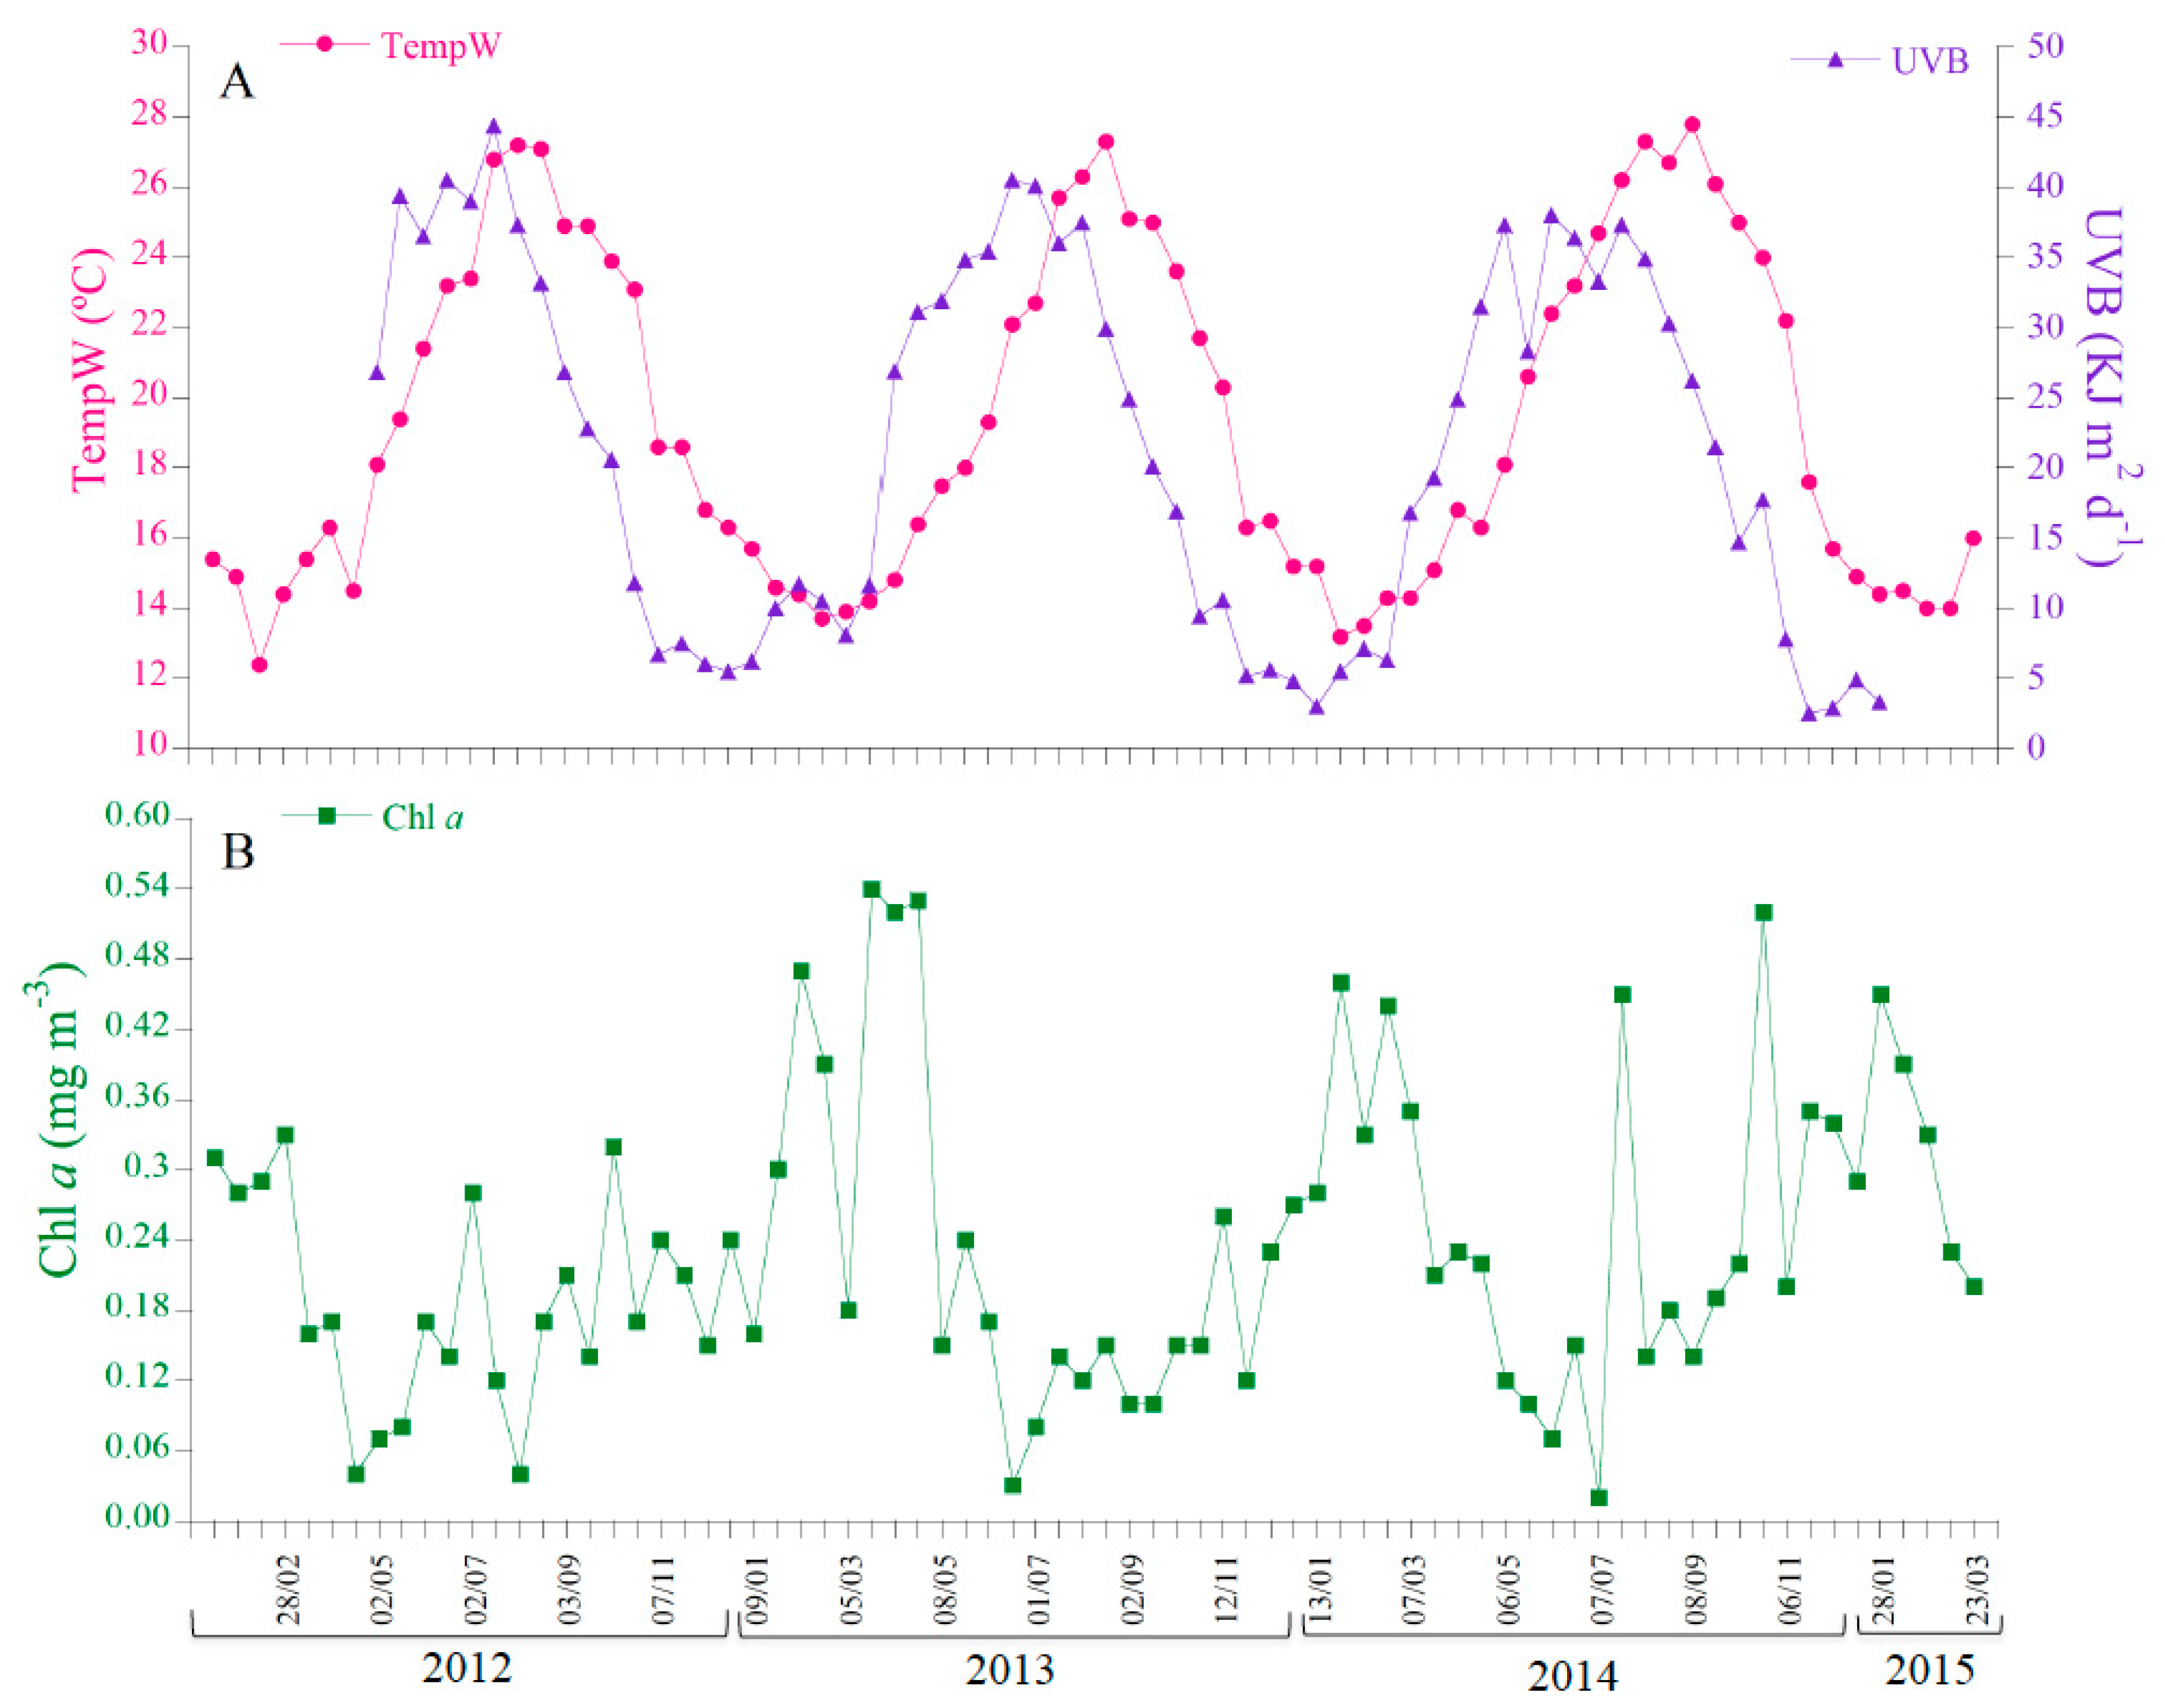
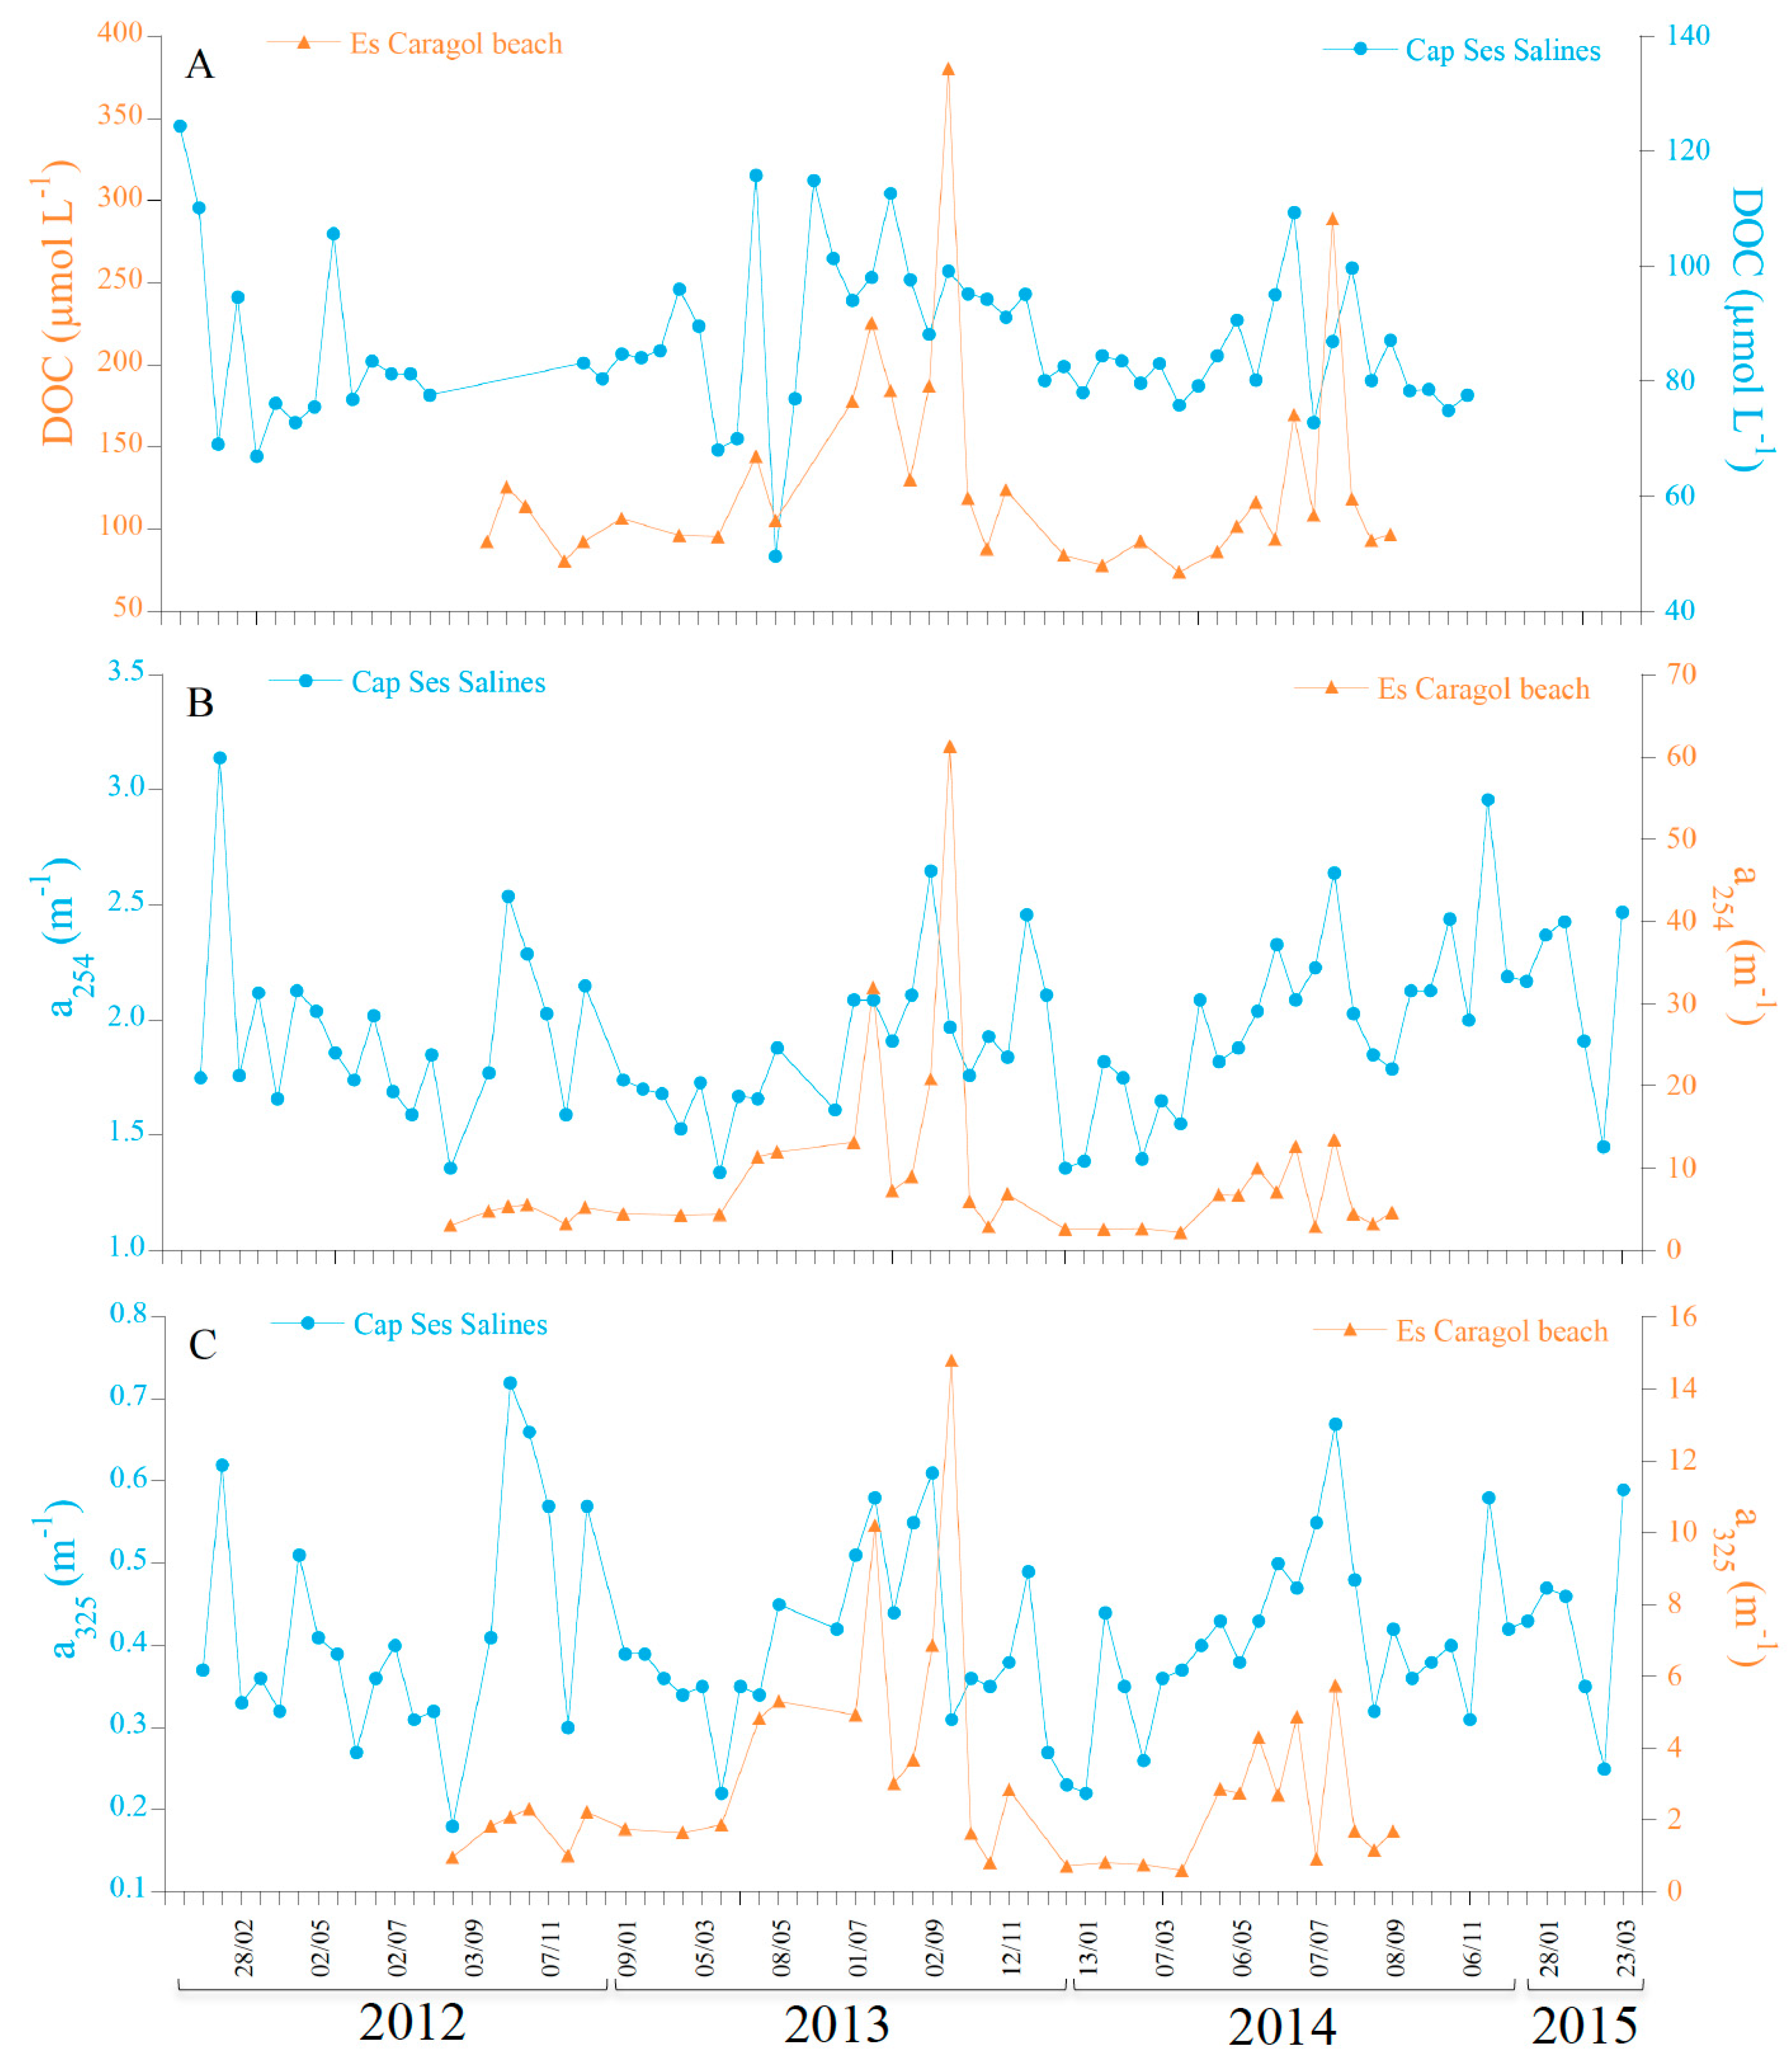
3.1. Time-Series at Cap Ses Salines and Es Caragol Beach

The Pearson correlation matrix of the environmental variables indicated that air and seawater temperature were strongly correlated among them (r = 0.94; Figure S1A). The same occurred with UVA, UVB, and PAR (r > 0.93; Figure S1A). For this reason, we chose to report and model only the sea surface temperature (TempW) and UVB radiation. TempW (Figure 3A) followed a well-defined seasonal cycle that explained >90% of the total variability of the time-series (Figure S2, Table S1). The average seasonal minimum TempW of 14.1 °C was recorded by mid-February and average seasonal maximum value of 26.7 °C in late August. The minimum and maximum measured values over the period when both sites were sampled simultaneously (13.2 and 27.8 °C) were found during January and August of 2014, respectively (Figure 3A, Table 1).
UVB radiation (Figure 3A) also described a seasonal cycle that explained 95% of the total variability of the time-series (Figure S2, Table S1), with an average seasonal maximum value of 38.5 by late June and minimum of 4.7 KJ m2 d−1 by mid-December. The minimum measured UVB value of 4.8 KJ m2 d−1 was recorded by mid-December 2013 and the maximum of 40.5 KJ m2 d−1 by June 2013 (Figure 3A, Table 1). For a detailed analysis of the UVB radiation at Cap Ses Salines, see [64,65].
Chl a (Figure 3B) also followed a significant (p < 0.001) seasonal pattern which explains 33% of the total variability (Figure S2, Table S1), with blooms usually occurring by mid-February (average seasonal maximum, 0.32 mg m−3) and minimum values by early July (average seasonal minimum, 0.13 mg m−3), although the measured concentrations ranged from 0.02 to 0.54 mg m−3 in July 2013 and March 2014, respectively (Figure 3B, Table 1).
DOC concentrations at Cap Ses Salines (Figure 4A) did not follow a significant (p = 0.267) seasonal cycle (Figure S2, Table S1). Observed values ranged from the minimum of 68.1 µmol L−1 recorded in March 2013 to the maximum of 115.8 µmol L−1 in April 2013 (Figure 4A, Table 1). Conversely, the concentrations of DOC were about 40% higher at Es Caragol Beach and described a significant (p < 0.01) seasonal pattern that explained 24% of the total variability of the time series (Figure S3, Table S2). The average seasonal maximum (156.9) and minimum (90.83 µmol L−1) occurred in August and February in Es Caragol Beach, while the lowest DOC concentrations of 74.0 and the highest of 380.4 µmol L−1 were recorded during mid-March 2014 and mid-September 2013, respectively (Figure 4A, Table 1).
Whereas the CDOM spectra at Cap Ses Salines followed the characteristic exponential decline with increasing wavelength of seawater samples not affected by continental runoff (e.g., [66], Figure 5A), the spectra of Es Caragol Beach were different in shape and absorption intensity (Figure 5B). This difference was reflected in the time course of the absorption coefficients, ratios, and slopes used to characterize CDOM absorption.
The correlation matrix of DOC and CDOM indices at Cap Ses Salines (Figure S1B) indicate that only a254 showed a relatively high correlation (r = 0.75–0.79) with a325 and SUVA254 and a325 with S275–295. Conversely, at Es Caragol Beach, the correlations were much higher (r = 0.86–0.99) and involved DOC, a254, a325, and SUVA254 (Figure S1C).
At both Cap Ses Salines and Es Caragol Beach, a254 did not follow statistically significant (p > 0.175) seasonal patterns (Figures S2 and S3, Tables S1 and S2). At Cap Ses Salines, a254 ranged from 1.34 (20 March 2013) to 2.65 m−1 (2 September 2014) (Figure 4B, Table 1). In contrast, the values of a254 at Es Caragol Beach were about 400% higher than at Cap Ses Salines, ranging from a minimum of 2.21 on 19 March 2014 to a maximum of 61.29 m−1 on 16 September 2013 (Figure 4B, Table 1).
The optical variables directly influenced by the solar UV radiation such as a325 (Figure 4C), the a254/365 ratio (Figure 6A), the spectral slope S275–295 (Figure 6B), and the slope ratio SR (Figure 6C) did not follow significant seasonal cycles either in Cap Ses Salines or at Es Caragol Beach, but a254/365 at the cape (Figure S2) and SR at the beach (Figure S3). In fact, the GAM analysis revealed that the seasonal cycle for a254/365 at Cap Ses Salines explained 11.7% of the variability with a p < 0.01 (Table S1) and for SR at Es Caragol Beach explaining 17.3% of the total variability with a p < 0.05 (Table S2). At Cap Ses Salines, the lowest a325 of 0.18 m−1 was recorded on17 August 2012, while the highest values of 0.72 m−1 occurred on 3 October 2012 (Figure 4C, Table 1). a325 at Es Caragol Beach was 7-fold than at the cape, exhibiting its respective minimum and maximum on the 19 March 2014 and16 September 2013, respectively. Concerning the ratios a254/365, S275–295, and SR (Figure 6C), it is remarkable that the values at the beach site occupied with banquettes are lower, about 3/5, compared to the values in the seagrass-free rocky shore of the cape, suggesting the presence of a CDOM material of coastal origin and higher average molecular weight at the beach.
At both sites, SUVA254 did not follow a significant seasonal cycle (Figures S2 and S3, Tables S1 and S2), showing values ranging from 0.52 (17 April 2013) to 1.38 m−1 L mg C−1 (8 May 2013) at Cap Ses Salines, and from 0.97 (7 July 2014) and 5.83 m−1 L mg C−1 (16 September 2013) at Es Caragol Beach (Figure 6D, Table 1). Our SUVA254 results also indicate that the CDOM at Es Caragol Beach had conjugated carbon double bonds about 3-fold higher than those of the CDOM at Cap Ses Salines (average of 2.19 ± 1.18 at site 2 vs. 0.79 ± 0.18 m−1 L mg C−1 at site 1).
Finally, to test for the influence of the environmental drivers (air and water temperature, UVA, UVB, and PAR radiation; and wind components) on the variability of the CDOM indices, we conducted an ANCOVA. We chose a325 and a254/365 as representative indices for CDOM quality and quantity as indicated by the correlation matrices (Figure S1). We found that water temperature and wind components affected the variability of a325 and a254/365 differently depending on the site (Table S3). In particular, a325 increased with water temperature and decreased with the northerly wind component (wind_Y) in the Es Caragol site; while in Cap Ses Salines, the site without banquettes, a325 was not affected by any of the environmental variables tested (Figure S4, Table S3). On the other hand, a254/365 decreased with water temperature and increased the easterly wind component (wind_X) in the Cap Ses Salines site; while in Es Caragol, it remained invariable along the range of variation of the environmental variables that we tested (Figure S5, Table S3).

3.2. Comparison of In Situ and Laboratory P. oceanica Leaf Litter Absorption Spectra

In order to facilitate the analysis of the atypical spectra of Es Caragol Beach, we first subtracted the spectra of the cape from the spectra of the beach (∆aλ) and then we normalized them (n∆aλ) in the 35 dates on which both sites were sampled simultaneously (Figure 7), as explained in the Materials and Methods. n∆aλ allowed us to focus on the shape of the spectra. Each spectrum was accompanied by its respective integrated absorption spectra value (Σ∆aλ) to account for quantitative differences. The highest Σ∆aλ of 3156 m−1 · nm occurred during September 2013 and the lowest of 49 m−1 · nm in March 2014 (Figure 7).
This normalization approach helped us to detect two different shapes of the ∆aλ spectra, identified with blue and orange lines in Figure 7 and summarized in Figure 8 as type 1 (n = 26) and type 2 (n = 9) spectra. The difference occurs at wavelength < 265 nm, with type 1 spectra exhibiting a flat response with decreasing wavelength and type 2 increasing steeply with decreasing wavelength. The occurrence of type 2 spectra was not related to water temperature, radiation, nor wind intensity or direction as revealed from fitting a binomial model (data not shown).
The normalized absorption spectra obtained in the incubation experiment with P. oceanica leaf litter derived from the leaching experiment (Figure 8A, pink) coincided with the type 1 spectra found in situ at Cap Ses Salines (Figure 8A, light blue). Therefore, this laboratory experiment corroborated our field observations, demonstrating the production of CDOM from P. oceanica leaf litter.

4. Discussion

Local particularities aside, the surface waters of Cap Ses Salines can be compared with other Mediterranean coastal areas such as the Bay of Blanes [68,69], the coastal marine waters off Barcelona [70], on the Catalan coast, or the Bay of Banyuls-sur-Mer, on the Gulf of Lions [71]. Our Chl a range (0.02 to 0.54 mg m−3; Table 1) was in agreement with the values expected in oligotrophic coastal and open ocean waters [72,73]. Note that the average Chl a concentration in the oligotrophic Bay of Blanes, 0.63 mg m−3 [69], was 3-fold the average concentration at Cap Ses Salines. Furthermore, maximum Chl a concentrations were much higher off Barcelona (3.6 mg m−3 [70] or in the Bay of Banyuls (4.4 mg m−3 [71]. Conversely, DOC (68 to 116 μmol L−1) and a254 (1.34 to 2.65 m−1) ranges were slightly higher than those found in the Bay of Blanes, but similar to those found off Barcelona and Gulf of Lions.
On the contrary, the DOC and CDOM spectral characteristics of Es Caragol Beach (Figure 4B) were not comparable with the clear waters of Cap Ses Salines (Figure 4A), Bay of Blanes, the coast of Barcelona, Bay of Banyuls-sur-Mer, or the open waters of the Mediterranean Sea [54,74]. Whereas the Cap Ses Salines is a rocky shore directly exposed to open Mediterranean water, the Es Caragol Beach is a sheltered bay with remarkable accumulations of P. oceanica litter. This study suggests that the degradation of P. oceanica banquettes via leaching processes produces a marked alteration of the typical CDOM spectrum in the surrounding seawater, dominated by the seagrass leachate (type 1 spectrum, Figure 8A, light blue), which coincide with the spectrum obtained in the laboratory leachate experiment (Figure 8A, pink). Differential absorption spectra of the exudates or leaf leachates of other seagrass (Zostera marina) [75] and macroalgae (a dozen of species [15,76] have been observed too. The average values of the slope ratio SR for Z. marina [75] and Ecklonia Cava [76] were around 1.4, the same value that we obtained for P. oceanica (Table 1). These ratios, characteristic of coastal areas (Helms et al., 2008), were low compared with those obtained in other sites of the Mediterranean Sea: 2.4 at Cap Ses Salines (Table 1), 2.0 at the Bay of Blanes [69], or 2.6 in the surface Mediterranean [54]. In this regard, based on the fluorescent properties of Z. marina CDOM leachates, Clark et al. [18] observed that this species produces CDOM with characteristics of terrestrial and microbially produced humic material. The low values of SR and also of a254/365, together with the high values of SUVA254 are indicators of the high molecular weight, double-bond conjugation, and aromaticity of the CDOM released by P. oceanica leaf litter [49,58,59,60,61]. The SR of Z. marina increased from 1.38 to 1.74 after exposure to solar radiation [75]. In the case of E. cava, SR increased from 1.2 to 1.6, also suggesting the degradation of macroalgal DOM into smaller molecules, as a consequence of solar radiation exposition [76]. In our case, the average SR at Es Caragol Beach was 1.34 (Table 1) and the seasonal cycle ranged from a seasonal minimum of 1.24 in late April to 1.47 in November (Figure S3, Table S2). Therefore, it also suggested increasing photochemical degradation through the summer and early autumn.
Apart from seagrass leaching, an additional unknown source of CDOM was identified in the CDOM spectra of Es Caragol Beach, characterized by a noticeable absorption peak detectable at wavelengths < 265 nm (type 2 spectrum, Figure 8B). We hypothesize that this peak is due to hydrogen sulfide (HS), whose spectrum (Figure 8D) [67] superimposes on type 2 spectra, which would be produced during the anaerobic decomposition of seagrass leaf litter at the banquettes. In this regard, the characteristic smell of hydrogen sulfide was detected when sampling the water close to the banquettes.
Southerly winds and high water temperatures favor the accumulation of CDOM in Es Caragol Beach. Given the position and orientation of this beach, in the southern tip of Mallorca Island, it is expected that southerly winds favor the accumulation of leaf litter in the beach shoreline [77] and higher temperatures favor leaching [44,78,79].
Our results clearly suggest that the presence of P. oceanica meadows in the coastal pristine waters of Mallorca Island acts as a relevant source of CDOM. This is in agreement with previous results showing P. oceanica in Mallorca as a source of DOC [37] and transparent exopolymeric particles [62].

5. Conclusions

Although our field data collection at both sites was limited to two years, it can be affirmed robustly that marked differences between the CDOM absorption spectra of Cap Ses Salines and Es Caragol Beach exist and are governed by environmental variables, such as the wind direction, which affects the banquette dynamics, and seawater temperature, which affects leaching rates. Other important drivers that may have also influenced our results include the anthropic pressure (e.g., the banquettes were completely removed from the beach shoreline during May 2014 as shown in Image S1). Our findings also suggest that the role of seagrass P. oceanica in this unique ecosystem is pivotal in controlling the dynamics of CDOM. Future research is needed to confirm or refute the hypothesis about hydrogen sulfide (HS) producing the peak at < 265 nm, and to molecularly characterize the chromophores produced by P. oceanica leaf litter.

Supplementary Materials

The following are available online at https://www.mdpi.com/2077-1312/8/11/911/s1, Figure S1. Correlation matrices of the environmental and CDOM variables used in this work: (A) PAR radiation, UVB and UVA radiation, wind components (Wind_Y, Wind_X), air and seawater temperature (TempA, TempW), and Chl a at Cap Ses Salines; and DOC, Σ∆aλ, a254, a325, a254/365, S275-295, SR at Cap Ses Salines (B) and at Es Caragol beach (C). Figure S2. Generalized additive modeling (GAM) of the seasonal cycles of seawater temperature (TempW) (A), UVB radiation (B), Chl a (C), DOC (D), a254 (E), a325 (F), a254/365 (G), S275-295 (H), SR (I), and SUVA254 (J) at Cap Ses Salines. Figure S3. Generalized additive modeling of the seasonal cycles of seawater temperature (TempW) (A), DOC (B), a254 (C), a325 (D), a254/365 (E), S275-295 (F), SR (G), and SUVA254 (H) at Es Caragol Beach. Figure S4. Analysis of covariance (ANCOVA) models fitted to CDOM quantity (a325) with seawater temperature (A) and Wind_Y component (B) at site 1 (left panels) and site 2 (right panels). Figure S5. Analysis of covariance (ANCOVA) models fitted to CDOM quality (a254/365) with seawater temperature (A) and Wind_X component (B) at site 1 (left panels) and site 2 (right panels). Table S1. Results of the generalized additive models (GAMs) fitted to optical and environmental variables at site 1 Cap Ses Salines. EDF = estimated degrees of freedom. DoY = day of the year. See the main text for the parameters’ names. Table S2. Results of the generalized additive models (GAMs) fitted to optical and environmental variables at site 2 Es Caragol Beach. EDF = estimated degrees of freedom. DoY = day of the year. See the main text for the parameters’ names. Table S3. Coefficients for the analysis of covariance (ANCOVA) models fitted to the indices (A) a325 and (B) a254/365. Image S1. Comparison of Es Caragol Beach geomorphology during the two years monitored: With banquettes on May 2013 (right image) and without (left image) on May 2014.

Author Contributions

C.M.D. and S.A. designed the research. F.I. participated in sample collection. F.I. and X.A.Á.-S. processed the spectra. J.O. performed the statistical analyses. F.I. and X.A.Á.-S. wrote the first draft of the manuscript. All authors read, commented, and improved the draft. All authors approved the final manuscript. All authors have read and agreed to the published version of the manuscript.

Funding

This work is a contribution to the StressX project, funded by the Spanish Ministry of Economy and Innovation (MICINN CTM2012-32603). F.I. was supported by a fellowship from the “Junta para la Ampliación de Estudios” (JAE-preDOC program 2011) from Consejo Superior de Investigaciones Científicas (CSIC).

Acknowledgments

We thank J.C. Martinez, P. Carrillo de Albornoz, and M.J. Pazó for their help with sampling, Chl a, and for DOC measurements, respectively.

Conflicts of Interest

The authors declare no conflict of interest. The funders had no role in the design of the study; in the collection, analyses, or interpretation of data; in the writing of the manuscript; or in the decision to publish the results.

References

  1. Morel, A.; Maritorena, S. Bio-optical properties of oceanic waters: A reappraisal. J. Geophys. Res. 2001, 106, 7163–7180. [Google Scholar] [CrossRef] [Green Version]
  2. Coble, P.G. Marine optical biogeochemistry: The chemistry of ocean color. Chem. Rev. 2007, 107, 402–418. [Google Scholar] [CrossRef] [PubMed]
  3. Mopper, K.; Kieber, D.J.; Stubbins, A. Marine Photochemistry of Organic Matter: Processes and Impacts. In Biogeochemistry of Marine Dissolved Organic Matter; Hansell, D.A., Carlson, C.A., Eds.; Elsevier: Amsterdam, The Netherlands, 2015; pp. 389–450. [Google Scholar] [CrossRef]
  4. Kirk, J.T.O. Light and Photosynthesis in Aquatic Ecosystems; Cambridge University Press: Cambridge, UK, 1994. [Google Scholar]
  5. Siegel, D.A.; Maritorena, S.; Nelson, N.B. Global distribution and dynamics of colored dissolved and detrital organic materials. J. Geophys. Res. 2002, 107. [Google Scholar] [CrossRef]
  6. Zepp, R.G.; Erickson, D.J.; Paul, N.D.; Sulzberger, B. Interactive effects of solar UV radiation and climate change on biogeochemical cycling. Photochem. Photobiol. Sci. 2007, 6, 286–300. [Google Scholar] [CrossRef] [PubMed]
  7. Jaffé, R.; McKnight, D.; Maie, N.; Cory, R.; McDowell, W.H.; Campbell, J.L. Spatial and temporal variations in DOM composition in ecosystems: The importance of long-term monitoring of optical properties. J. Geophys. Res. Biogeosci. 2008, 113, G04032. [Google Scholar] [CrossRef]
  8. Cawley, K.M.; Ding, Y.; Fourqurean, J.; Jaffé, R. Characterising the sources and fate of dissolved organic matter in Shark Bay, Australia: A preliminary study using optical properties and stable carbon isotopes. Mar. Freshw. Res. 2012, 63, 1098–1107. [Google Scholar] [CrossRef] [Green Version]
  9. Stedmon, C.A.; Nelson, N.B. The Optical Properties of DOM in the Ocean. In Biogeochemistry of Marine Dissolved Organic Matter; Hansell, D.A., Carlson, C.A., Eds.; Elsevier: Amsterdam, The Netherlands, 2015; pp. 481–508. [Google Scholar] [CrossRef]
  10. Pain, A.J.; Martin, J.B.; Young, C.R.; Huang, L.; Valle-Levinson, A. Organic matter quantity and quality across salinity gradients in conduit- vs. diffuse flow-dominated subterranean estuaries. Limnol. Oceanogr. 2019, 64, 1386–1402. [Google Scholar] [CrossRef] [Green Version]
  11. Coble, P.G.; Chuanmin, H.; Gould, R.W.; Chang, G.; Wood, A.M. Colored Dissolved Organic in the Coastal Ocean: An optical tool for coastal zone environmental assessment and management. Oceanogr. Coast. Ocean Opt. Dyn. 2004, 17, 50–59. [Google Scholar]
  12. Romera-Castillo, C.; Sarmento, H.; Álvarez-Salgado, X.A.; Gasol, J.M.; Marrasé, C. Production of chromophoric dissolved organic matter by marine phytoplankton. Limnol. Oceanogr. 2010, 55, 446–454. [Google Scholar] [CrossRef]
  13. Chari, N.V.H.K.; Keerthi, S.; Sarma, N.S.; Pandi, R.S.; Chiranjeevulu, G.; Kiran, R.; Koduru, U. Fluorescence and absorption characteristics of dissolved organic matter excreted by phytoplankton species of western Bay of Bengal under axenic laboratory condition. J. Exp. Mar. Bio. Ecol. 2013, 445, 148–155. [Google Scholar] [CrossRef]
  14. Li, G.; Xie, H.; Song, G.; Gosselin, M. Production of Chromophoric Dissolved Organic Matter (CDOM) in Laboratory Cultures od Arctic Sea Ice Algae. Water 2019, 11, 926. [Google Scholar] [CrossRef] [Green Version]
  15. Hulatt, C.J.; Thomas, D.N.; Bowers, D.G.; Norman, L.; Zhang, C. Exudation and decomposition of chromophoric dissolved organic matter (CDOM) from some temperate macroalgae. Estuar. Coast. Shelf Sci. 2009, 84, 147–153. [Google Scholar] [CrossRef]
  16. Swanson, A.K.; Druehl, L.D. Induction, exudation and the UV protective role of kelp phlorotannins. Aquat. Bot. 2002, 73, 241–253. [Google Scholar] [CrossRef]
  17. Henderson, R.K.; Baker, A.; Parsons, S.A.; Jefferson, B. Characterisation of algogenic organic matter extracted from cyanobacteria, green algae and diatoms. Water Res. 2008, 42, 3435–3445. [Google Scholar] [CrossRef]
  18. Clark, C.D.; De Bruyn, W.J.; Aiona, P.D. Temporal variation in optical properties of chromophoric dissolved organic matter (CDOM) in Southern California coastal waters with nearshore kelp and seagrass. Limnol. Oceanogr. 2016, 61, 32–46. [Google Scholar] [CrossRef] [Green Version]
  19. Shank, G.C.; Zepp, R.G.; Vähätalo, A.; Lee, R.; Bartels, E. Photobleaching kinetics of chromophoric dissolved organic matter derived from mangrove leaf litter and floating Sargassum colonies. Mar. Chem. 2010, 119, 162–171. [Google Scholar] [CrossRef]
  20. Maie, N.; Scully, N.M.; Pisani, O.; Jaffé, R. Composition of a protein-like fluorophore of dissolved organic matter in coastal wetland and estuarine ecosystems. Water Res. 2007, 41, 563–570. [Google Scholar] [CrossRef]
  21. Fellman, J.B.; D’Amore, D.V.; Hood, E.; Boone, R.D. Fluorescence characteristics and biodegradability of dissolved organic matter in forest and wetland soils from coastal temperate watersheds in southeast Alaska. Biogeochemistry 2008, 88, 169–184. [Google Scholar] [CrossRef]
  22. Clark, C.D.; Litz, L.P.; Grant, S.B. Salt marshes as a source of chromophoric dissolved organic matter (CDOM) to Southern California coastal waters. Limnol. Oceanogr. 2008, 53, 1923–1933. [Google Scholar] [CrossRef] [Green Version]
  23. Duarte, C.M.; Chiscano, C.L. Seagrass biomass and production: A reassessment. Aquat. Bot. 1999, 65, 159–174. [Google Scholar] [CrossRef]
  24. Gacia, E.; Duarte, C.M.; Middelburg, J.J. Carbon and nutrient deposition in a Mediterranean seagrass Posidonia oceanica meadow. Limnol. Oceanogr. 2002, 47, 23–32. [Google Scholar] [CrossRef]
  25. Marbà, N.; Duarte, C.M.; Holmer, M.; Martínez, R.; Basterretxea, G.; Orfila, A.; Jordi, A.; Tintoré, J. Effectiveness of protection of seagrass Posidonia oceanica populations in Cabrera National Park (Spain). Environ. Conserv. 2002, 29, 509–518. [Google Scholar] [CrossRef] [Green Version]
  26. Coscieme, L. Cultural ecosystem services: The inspirational value of ecosystems in popular music. Ecosyst. Serv. 2015, 16, 121–124. [Google Scholar] [CrossRef]
  27. Hemminga, M.A.; Duarte, C.M. Seagrass Ecology; Cambridge University Press: Cambridge, UK, 2000. [Google Scholar]
  28. Bethoux, J.; Copin-Montégut, G. Biological fixation of atmospheric the Mediterranean Sea. Limnol. Oceanogr. 1986, 31, 1353–1358. [Google Scholar] [CrossRef] [Green Version]
  29. Duarte, C.M.; Middelburg, J.J.; Caraco, N. Major role of marine vegetation on the oceanic carbon cycle. Biogeosci. Discuss 2005, 2, 1–8. [Google Scholar] [CrossRef] [Green Version]
  30. Duarte, C.M.; Marbà, N.; Gacia, E.; Fourqurean, J.W.; Beggins, J.; Barrón, C.; Apostolaki, E.T. Seagrass community metabolism: Assessing the carbon sink capacity of seagrass meadows. Glob. Biogeochem. Cycles 2010, 24, GB4032. [Google Scholar] [CrossRef] [Green Version]
  31. Duarte, C.M.; Kennedy, H.; Marbà, N.; Hendriks, I.E. Assessing the capacity of seagrass meadows for carbon burial: Current limitations and future strategies. Ocean Coast. Manag. 2013, 83, 32–38. [Google Scholar] [CrossRef]
  32. Mazarrasa, I.; Marbà, N.; Lovelock, C.E.; Serrano, O.; Lavery, P.S.; Fourqurean, J.W.; Kennedy, H.; Mateo, M.A.; Krause-Jensen, D.; Steven, A.D.; et al. Seagrass meadows as a globally significant carbonate reservoir. Biogeosciences 2015, 12, 4993–5003. [Google Scholar] [CrossRef] [Green Version]
  33. Macreadie, P.I.; Serrano, O.; Maher, D.T.; Duarte, C.M.; Beardall, J. Addressing calcium carbonate cycling in blue carbon accounting. Limnol. Oceanogr. Lett. 2017, 2, 195–201. [Google Scholar] [CrossRef] [Green Version]
  34. Boudouresque, C.-F.; Meinesz, A. Découverte de l ’herbier de Posidonies. Cah. Parc Natl. Port Cros 1982, 4, 1–79. [Google Scholar]
  35. Mateo, M.Á.; Sánchez-Lizaso, J.L.; Romero, J. Posidonia oceanica “banquettes”: A preliminary assessment of the relevance for meadow carbon and nutrients budget. Estuar. Coast. Shelf Sci. 2003, 56, 85–90. [Google Scholar] [CrossRef]
  36. Boudouresque, C.F.; Pergent, G.; Pergent-Martini, C.; Ruitton, S.; Thibaut, T.; Verlaque, M. The necromass of the Posidonia oceanica seagrass meadow: Fate, role, ecosystem services and vulnerability. Hydrobiologia 2016, 781, 25–42. [Google Scholar] [CrossRef] [Green Version]
  37. Barrón, C.; Duarte, C.M. Dissolved organic matter release in a Posidonia oceanica meadow. Mar. Ecol. Prog. Ser. 2009, 374, 75–84. [Google Scholar] [CrossRef]
  38. Apostolaki, E.T.; Holmer, M.; Marbà, N.; Karakassis, I. Degrading seagrass (Posidonia oceanica) ecosystems: A source of dissolved matter in the Mediterranean. Hydrobiologia 2010, 649, 13–23. [Google Scholar] [CrossRef] [Green Version]
  39. Lavery, P.S.; McMahon, K.; Weyers, J.; Boyce, M.C.; Oldham, C.E. Release of dissolved organic carbon from seagrass wrack and its implications for trophic connectivity. Mar. Ecol. Prog. Ser. 2013, 494, 121–133. [Google Scholar] [CrossRef] [Green Version]
  40. Wang, X.; Chen, R.F.; Cable, J.E.; Cherrier, J. Leaching and microbial degradation of dissolved organic matter from salt marsh plants and seagrasses. Aquat. Sci. 2014, 76, 595–609. [Google Scholar] [CrossRef]
  41. Liu, S.; Jiang, Z.; Zhou, C.; Wu, Y.; Arbi, I.; Zhang, J.; Huang, X.; Trevathan-Tackett, S.M. Leaching of dissolved organic matter from seagrass leaf litter and its biogeochemical implications. Acta Oceanol. Sin. 2018, 37, 84–90. [Google Scholar] [CrossRef]
  42. Ziegler, S.; Benner, R. Effects of solar radiation on dissolved organic matter cycling in a subtropical seagrass meadow. Limnol. Oceanogr. 2000, 45, 257–266. [Google Scholar] [CrossRef]
  43. Otis, D.B.; Carder, K.L.; English, D.C.; Ivey, J.E. CDOM transport from the Bahamas Banks. Coral Reefs 2004, 23, 152–160. [Google Scholar] [CrossRef]
  44. Stabenau, E.; Zepp, R.; Bartels, E.; Zika, R. Role of the seagrass Thalassia testudinum as a source of chromophoric dissolved organic matter in coastal south Florida. Mar. Ecol. Prog. Ser. 2004, 282, 59–72. [Google Scholar] [CrossRef]
  45. Álvarez, E.; Grau, A.M.; Marbà, N.; Carreras, D. Praderas de angiospermas marinas Islas Baleares. In ATLAS de las Praderas Marinas de España; Ruiz, J.M., Guillén, J.E., Segura, A.R., Otero, M.M., Eds.; IEO: Murcia, Spain; IEL: Alicante, Spain; UICN: Málaga, Spain, 2015; pp. 179–220. [Google Scholar]
  46. Agustí, S.; Martínez-Ayala, J.; Regaudie-de-gioux, A.; Duarte, C.M. Oligotrophication and Metabolic Slowing-Down of a NW Mediterranean Coastal Ecosystem. Front. Mar. Sci. 2017, 4, 432. [Google Scholar] [CrossRef] [Green Version]
  47. Tovar-Sánchez, A.; Basterretxea, G.; Rodellas, V.; Sánchez-Quiles, D.; García-Orellana, J.; Masqué, P.; Jordi, A.; López, J.M.; Garcia-Solsona, E. Contribution of groundwater discharge to the coastal dissolved nutrients and trace metal concentrations in Majorca Island: Karstic vs detrital systems. Environ. Sci. Technol. 2014, 48, 11819–11827. [Google Scholar] [CrossRef] [PubMed] [Green Version]
  48. Parsons, T.R.; Maita, Y.; Lalli, C.M. A Manual of Chemical and Biological Methods for Seawater Analysis; Pergamon Press: Oxford, UK, 1984. [Google Scholar]
  49. Weishaar, J.L.; Aiken, G.R.; Bergamaschi, B.A.; Fram, M.S.; Fujii, R.; Mopper, K. Evaluation of specific ultraviolet absorbance as an indicator of the chemical composition and reactivity of dissolved organic carbon. Environ. Sci. Technol. 2003, 37, 4702–4708. [Google Scholar] [CrossRef] [PubMed]
  50. Chen, H.; Zheng, B.; Song, Y.; Qin, Y. Correlation between molecular absorption spectral slope ratios and fluorescence humification indices in characterizing CDOM. Aquat. Sci. 2011, 73, 103–112. [Google Scholar] [CrossRef]
  51. Spencer, R.G.M.; Butler, K.D.; Aiken, G.R. Dissolved organic carbon and chromophoric dissolved organic matter properties of rivers in the USA. J. Geophys. Res. 2012, 117. [Google Scholar] [CrossRef]
  52. Spencer, R.G.M.; Aiken, G.R.; Butler, K.D.; Dornblaser, M.M.; Striegl, R.G.; Hernes, P.J. Utilizing chromophoric dissolved organic matter measurements to derive export and reactivity of dissolved organic carbon exported to the Arctic Ocean: A case study of the Yukon River, Alaska. Geophys. Res. Lett. 2009, 36, L06401. [Google Scholar] [CrossRef]
  53. Lønborg, C.; Álvarez-Salgado, X.A. Tracing dissolved organic matter cycling in the eastern boundary of the temperate North Atlantic using absorption and fluorescence spectroscopy. Deep Res. Part I 2014, 85, 35–46. [Google Scholar] [CrossRef]
  54. Catalá, T.S.; Martínez-Pérez, A.M.; Nieto-Cid, M.; Álvarez, M.; Otero, J.; Emelianov, M.; lReche, I.; Arístegui, J.; Álvarez-Salgado, X.A. Dissolved Organic Matter (DOM) in the open Mediterranean Sea. I. Basin–wide distribution and drivers of chromophoric DOM. Prog. Oceanogr. 2018, 165, 35–51. [Google Scholar] [CrossRef]
  55. Fichot, C.G.; Benner, R. A novel method to estimate DOC concentrations from CDOM absorption coefficients in coastal waters. Geophys. Res. Lett. 2011, 38, L03610. [Google Scholar] [CrossRef]
  56. Del Vecchio, R.; Blough, N.V. Photobleaching of chromophoric dissolved organic matter in natural waters: Kinetics and modeling. Mar. Chem. 2002, 78, 231–253. [Google Scholar] [CrossRef]
  57. Nelson, N.B.; Carlson, C.A.; Steinberg, D.K. Production of chromophoric dissolved organic matter by Sargasso Sea microbes. Mar. Chem. 2004, 89, 273–287. [Google Scholar] [CrossRef]
  58. Dahlen, J.; Bertilsson, S.; Pettersson, C. Effects of UV-A irradiation on dissolved organic matter in humic surface waters. Environ. Int. 1996, 22, 501–506. [Google Scholar] [CrossRef]
  59. Engelhaupt, E.; Bianchi, T.S.; Wetzel, R.G.; Tarr, M.A. Photochemical transformations and bacterial utilization of high-molecular-weight dissolved organic carbon in a southern Louisiana tidal stream (Bayou Trepagnier). Biogeochemistry 2003, 62, 39–58. [Google Scholar] [CrossRef]
  60. Berggren, M.; Laudon, H.; Haei, M.; Ström, L.; Jansson, M. Efficient aquatic bacterial metabolism of dissolved low-molecular-weight compounds from terrestrial sources. ISME J. 2010, 4, 408–416. [Google Scholar] [CrossRef] [Green Version]
  61. Helms, J.R.; Stubbins, A.; Ritchie, J.D.; Minor, E.C.; Kieber, D.J.; Mopper, K. Absorption spectral slopes and slope ratios as indicators of molecular weight, source, and photobleaching of chromophoric dissolved organic matter. Limnol. Oceanogr. 2008, 53, 955–969. [Google Scholar] [CrossRef] [Green Version]
  62. Iuculano, F.; Duarte, C.M.; Marbà, N.; Agustí, S. Seagrass as major source of transparent exopolymer particles in the oligotrophic Mediterranean coast. Biogeosciences 2017, 14, 5069–5075. [Google Scholar] [CrossRef] [Green Version]
  63. Wood, S.N. Generalized Additive Models: An Introduction with R; Chapman and Hall: London, UK, 2008. [Google Scholar] [CrossRef]
  64. Llabrés, M.; Agustí, S.; Alonso-Laita, P.; Herndl, G.J. Synechococcus and Prochlorococcus cell death induced by UV radiation and the penetration of lethal UVR in the Mediterranean Sea. Mar. Ecol. Prog. Ser. 2010, 399, 27–37. [Google Scholar] [CrossRef] [Green Version]
  65. García-Corral, L.S.; Martinez-Ayala, J.; Duarte, C.M.; Agustí, S. Experimental assessment of cumulative temperature and UV-B radiation effects on Mediterranean plankton metabolism. Front. Mar. Sci. 2015, 2. [Google Scholar] [CrossRef] [Green Version]
  66. Nelson, N.B.; Siegel, D.A. The global distribution and dynamics of chromophoric dissolved organic matter. Annu. Rev. Mar. Sci. 2013, 5, 447–476. [Google Scholar] [CrossRef] [Green Version]
  67. Johnson, K.S.; Coletti, L.J. In situ ultraviolet spectrophotometry for high resolution and long-term monitoring of nitrate, bromide and bisulfide in the ocean. Deep Sea Res. Part I 2002, 49, 1291–1305. [Google Scholar] [CrossRef]
  68. Vila-Reixach, G.; Gasol, J.M.; Cardelús, C.; Vidal, M. Seasonal dynamics and net production of dissolved organic carbon in an oligotrophic coastal environment. Mar. Ecol. Prog. Ser. 2012, 456, 7–19. [Google Scholar] [CrossRef] [Green Version]
  69. Romera-Castillo, C.; Álvarez-Salgado, X.A.; Galí, M.; Gasol, J.M.; Marrasé, C. Combined effect of light exposure and microbial activity on distinct dissolved organic matter pools. A seasonal field study in an oligotrophic coastal system (Blanes Bay, NW Mediterranean). Mar. Chem. 2013, 148, 44–51. [Google Scholar] [CrossRef] [Green Version]
  70. Guallar, C.; Flos, J. Linking phytoplankton primary production and chromophoric dissolved organic matter in the sea. Prog. Oceanogr. 2019, 176, 102116. [Google Scholar] [CrossRef]
  71. Sánchez-Pérez, E.D.; Pujo-Pay, M.; Ortega-Retuerta, E.; Conan, P.; Peters, F.; and Marrasé, C. Mismatched dynamics of dissolved organic carbon and chromophoric dissolved organic matter in the coastal NW Mediterranean Sea. Sci. Total Environ. 2020, 746, 141190. [Google Scholar] [CrossRef] [PubMed]
  72. Lavigne, H.; D’Ortenzio, F.; D’Alcalà, M.R.; Claustre, H.; Sauzède, R.; Gacic, M. On the vertical distribution of the chlorophyll a concentration in the Mediterranean Sea: A basin-scale and seasonal approach. Biogeosciences 2015, 12, 5021–5039. [Google Scholar] [CrossRef] [Green Version]
  73. Iuculano, F.; Álvarez-Salgado, X.A.; Otero, J.; Catalá, T.S.; Sobrino, C.; Duarte, C.M.; Agustí, S. Patterns and Drivers of UV Absorbing Chromophoric Dissolved Organic Matter in the Euphotic Layer of the Open Ocean. Front. Mar. Sci. 2019, 6, 320. [Google Scholar] [CrossRef]
  74. Galletti, Y.; Gonnelli, M.; Brogi, S.R.; Vestri, S.; Santinelli, C. DOM dynamics in open waters of the Mediterranean Sea: New insights from optical properties. Deep Sea Res. Part I 2019, 144, 95–114. [Google Scholar] [CrossRef]
  75. Lønborg, C.; Nieto-Cid, M.; Hernando-Morales, V.; Hernández-Ruiz, M.; Teira, E.; Álvarez-Salgado, X.A. Photochemical alteration of dissolved organic matter and the subsequent effects on bacterial carbon cycling and diversity. FEMS Microbiol. Ecol. 2016, 92, fiw048. [Google Scholar] [CrossRef]
  76. Wada, S.; Omori, Y.; Kayamyo, Y.; Tashiro, Y.; Hama, T. Photoreactivity of dissolved organic matter from macroalgae. Reg. Stud. Mar. Sci. 2015, 2, 12–18. [Google Scholar] [CrossRef]
  77. Jiménez, M.A.; Beltran, R.; Traveset, A.; Calleja, M.; Delgado-Huertas, A.; Marbà, N. Aeolian transport of seagrass (Posidonia oceanica) beach-cast to terrestrial systems. Estuar. Coast. Shelf Sci. 2017, 196, 31–44. [Google Scholar] [CrossRef] [Green Version]
  78. Elkalay, K.; Frangoulis, C.; Skliris, N.; Goffart, A.; Gobert, S.; Lepoint, G.; Hecq, J.H. A model of the seasonal dynamics of biomass and production of the seagrass Posidonia oceanica in the Bay of Calvi (Northwestern Mediterranean). Ecol. Modell. 2003, 167, 1–18. [Google Scholar] [CrossRef] [Green Version]
  79. Barrón, C.; Apostolaki, E.T.; Duarte, C.M. Dissolved organic carbon fluxes by seagrass meadows and macroalgal beds. Front. Mar. Sci. 2014, 1, 42. [Google Scholar] [CrossRef] [Green Version]
Figure 1. Study area and location of the two sampling stations monitored along the south coast of Mallorca Island (NW Mediterranean Sea). Green circles represent sampling site 1 (Cap Ses Salines) and site 2 (Es Caragol Beach).
Jmse 08 00911 g001
Figure 2. Experimental set-up for Posidonia oceanica leaf litter leaching experiment.
Jmse 08 00911 g002
Figure 3. Time series for environmental parameters at Cap Ses Salines. (A) Seawater temperature and UVB radiation. (B) Chlorophyll a.
Jmse 08 00911 g003
Figure 4. Time series comparing the two sites monitored for DOC (A) and for the optical quantitative parameters a254 (B) and a325 (C).
Jmse 08 00911 g004
Figure 5. Mean absorption coefficients spectra (m−1) at Cap Ses Salines, in light blue (A), and Es Caragol Beach, in orange (B). Dotted gray curves are the 10% and 90% percentile spectra (n = 35).
Jmse 08 00911 g005
Figure 6. Time series comparing the two sites monitored for the qualitative optical parameters. a254/365 (A), S275–295 (B), SR (C), and SUVA254 (D).
Jmse 08 00911 g006
Figure 7. Normalized difference of the CDOM spectra of Es Caragol minus Cap Ses Salines for each sampling date (n∆aλ). Different colors represent the two types of observed spectra. Σ∆aλ values are also reported on the upper-right side of each panel (in m−1 nm).
Jmse 08 00911 g007
Figure 8. Mean difference of the CDOM spectra of Es Caragol and Cap Salines after normalization. (A) Type 1 spectra (n = 26); light blue spectrum represents the mean of 26 field observations and pink spectrum the signal obtained in the leaching experiment. Dotted curves represent ± SD. (B) Type 2 spectra (n = 9); (C) zoom of types 1 (light blue) and 2 (orange) spectra from 250 to 300 nm. (D) Zoom of the hydrogen sulfide (HS) spectra exhibiting a steep absorption increase at wavelengths < 260 nm (taken from [67]).
Jmse 08 00911 g008
Table 1. Average ± standard deviation (SD), and minimum and maximum values of the environmental and chromophoric dissolved organic matter (CDOM) variables measured simultaneously at the 2 study sites. n = 35 except for dissolved organic carbon (DOC) (and carbon specific UV absorption at 254 nm (SUVA254) n = 33.
Cap Ses SalinesEs Caragol Beach
VariableMean ± SDMinMaxMean ± SDMinMax
TempW (°C)21.2 ± 4.713.227.8
UVB (KJ m2 d−1)23.7 ± 12.24.840.5
Chl a (mg m3)0.21 ± 0.140.020.54
DOC (µmol L−1)90.7 ± 11.368.1115.8129.5 ± 64.974.0380.4
a254 (m−1)1.90 ± 0.341.342.658.79 ± 10.912.2161.29
a325 (m−1)0.43 ± 0.130.180.723.05 ± 2.930.6014.80
Σaλ (m−1 nm)112.5 ± 28.358.0174.7640.5 ± 622.4138.33249.4
a254/3658.7 ± 2.35.114.24.98 ± 0.994.017.33
S275–295 (µm−1)
SR
28.38 ± 4.21
2.39 ± 0.86
22.68
1.23
41.10
5.13
16.66 ± 3.20
1.34 ± 0.25
12.38
0.99
23.37
1.99
SUVA254 (m−1 L mg C−1)0.79 ± 0.180.521.382.19 ± 1.170.975.83
Publisher’s Note: MDPI stays neutral with regard to jurisdictional claims in published maps and institutional affiliations.

