Article

Influence of Impeller Gap Drainage Width on the Performance of Low Specific Speed Centrifugal Pump

1
National Research Center of Pumps, Jiangsu University, Zhenjiang 212013, China
2
Department of Mechanical Engineering, Texas Tech University, Lubbock, TX 79411, USA
3
Jiangsu Shentong Valve Co. Ltd., Nantong 226232, China
*
Author to whom correspondence should be addressed.
J. Mar. Sci. Eng. 2021, 9(2), 106; https://doi.org/10.3390/jmse9020106
Submission received: 22 November 2020 / Revised: 12 January 2021 / Accepted: 18 January 2021 / Published: 20 January 2021

Abstract

:
The centrifugal pump is one of the most important pieces of energy-consuming equipment in various hydraulic engineering applications. This paper takes a low specific speed centrifugal pump as the research object. Based on the research method combining numerical calculation and experimental verification, the influence of the gap drainage structure on the performance of the low specific speed centrifugal pump and its internal flow field distribution were investigated. The flow field inside the low specific speed centrifugal pump impeller under different gap widths was studied. The comparison between the numerical calculation results and the experimental results confirms that the numerical calculations in this paper have high accuracy. It was found that the gap drainage will reduce the head of the low specific speed centrifugal pump, but increase its hydraulic efficiency. Using a smaller gap width could greatly improve the performance of the low specific speed centrifugal pump on the basis of a slight reduction in the head. The high-pressure leakage flow at the gap flows from the blade pressure surface to the suction surface can effectively suppress the low-pressure area at the impeller inlet. The flow rate of the high-pressure leakage flow increases with the gap width. Excessive gap width may cause a low-pressure zone at the inlet of the previous flow passage. These results could serve as a reference for the subsequent gap design to further improve the operating stability of the low specific speed centrifugal pump.

1. Introduction

With the development of modern industry, many actual operating conditions put forward high-head, low-flow performance requirements for centrifugal pumps [1,2,3]. As a result, the performance requirements of low specific speed centrifugal pumps are continuously improved and their scope of use continues to expand. They are widely used in aerospace, petrochemical, water conservancy, and hydropower, among others [4,5,6]. The low specific speed pump is a centrifugal pump with specific speed less than 80, has a small flow coefficient, and requires a small blade outlet angle. The small blade outlet angle causes the head to decrease. In order to increase the head, the impeller diameter must be increased [7,8]. This could cause a larger impeller diameter and a great increase in the friction loss of the impeller disc [9]. Additionally, due to the narrow and long flow passage of the impeller, it causes violent liquid diffusion. Then, there could be complex flow phenomena such as strong secondary flow and flow separation in the flow passage, which could damage the flow stability and cause serious energy loss and further reduce the performance of the low specific speed centrifugal pump [10,11,12,13]. Therefore, how to improve the performance of the low specific speed centrifugal pump and increase its operational stability has become a research hotspot and a difficulty in the field [14,15].
In order to suppress flow separation in the flow passage of the low specific speed centrifugal pump, a new type of gap drainage impeller was proposed and investigated by many researchers. This special impeller was originally mainly used in pneumatic fields such as fans and compressors, which could significantly improve the stability of the flow field. Nie et al. [16] first proposed a method of designing tip gaps in the compressor blades and a way that micro-jets suppress the flow separation of the blades. The rationality of the method is verified through experiments. Culley et al. [17] conducted a systematic study on the compressor blade gap drainage scheme through numerical calculation methods and the research showed that different gap positions would have different effects on compressor performance. Gupta et al. [18] conducted a multi-scheme gap drainage study on turbomachinery and found that gap drainage could improve its performance and reduce its start-up power. As a blade machine, the working principle of the centrifugal pump has many similarities with the above-mentioned rotating machines. Therefore, some scholars have tried to apply this special impeller to the centrifugal pump in recent years. Zhu et al. [19] tried to exploit a gap drainage centrifugal pump impeller and found that the impeller could improve the performance of the pump and broaden its working range. Wang et al. [20] performed multi-factor calculations on various parameters of the centrifugal pump gap based on traditional optimization methods. Under different flow rate conditions, it is found that different gap geometric parameters have different effects on performance.
As a new idea of centrifugal pump impeller design, there are still few related research studies on gap drainage in the field of pumps. Its application in low specific speed centrifugal pumps is not yet found in the literature. This paper used a combination of numerical calculations and experiments to explore the influence of the gap drainage impeller on the hydraulic performance and internal flow field distribution. The performance and flow patterns in different gap widths were studied. This provided a certain theoretical basis for improving the hydraulic performance and stability of low specific speed centrifugal pumps.

2. Geometry and Parameters

This paper selected the ZA20-250 low specific speed centrifugal pump as the research object, which is manufactured by Jiangsu Jiangfeng Pump Industry Co., Ltd., China. The rated design flow rate was Q = 10 m3/h, the rated design rotate speed was n = 2900 r/min, and the rated design single-stage head was H = 80 m. The medium conveyed was water, its density was 998 kg/m3, and its dynamic viscosity was 1.01 × 10⁻³ Pa·s. Therefore, the rated design’s specific speed of the pump was:
n s = 3.65 n Q H 3 / 4 = 21
This pump had a small impeller outlet width and a long flow passage. The impeller only had 3 blades and a larger blade wrap angle to meet the efficiency and head requirements. Figure 1 shows the two-dimensional schematic diagram of the impeller and volute. Table 1 lists the main size parameters of the geometric model and the gap widths in the three models.

3. Numerical Methods and Settings

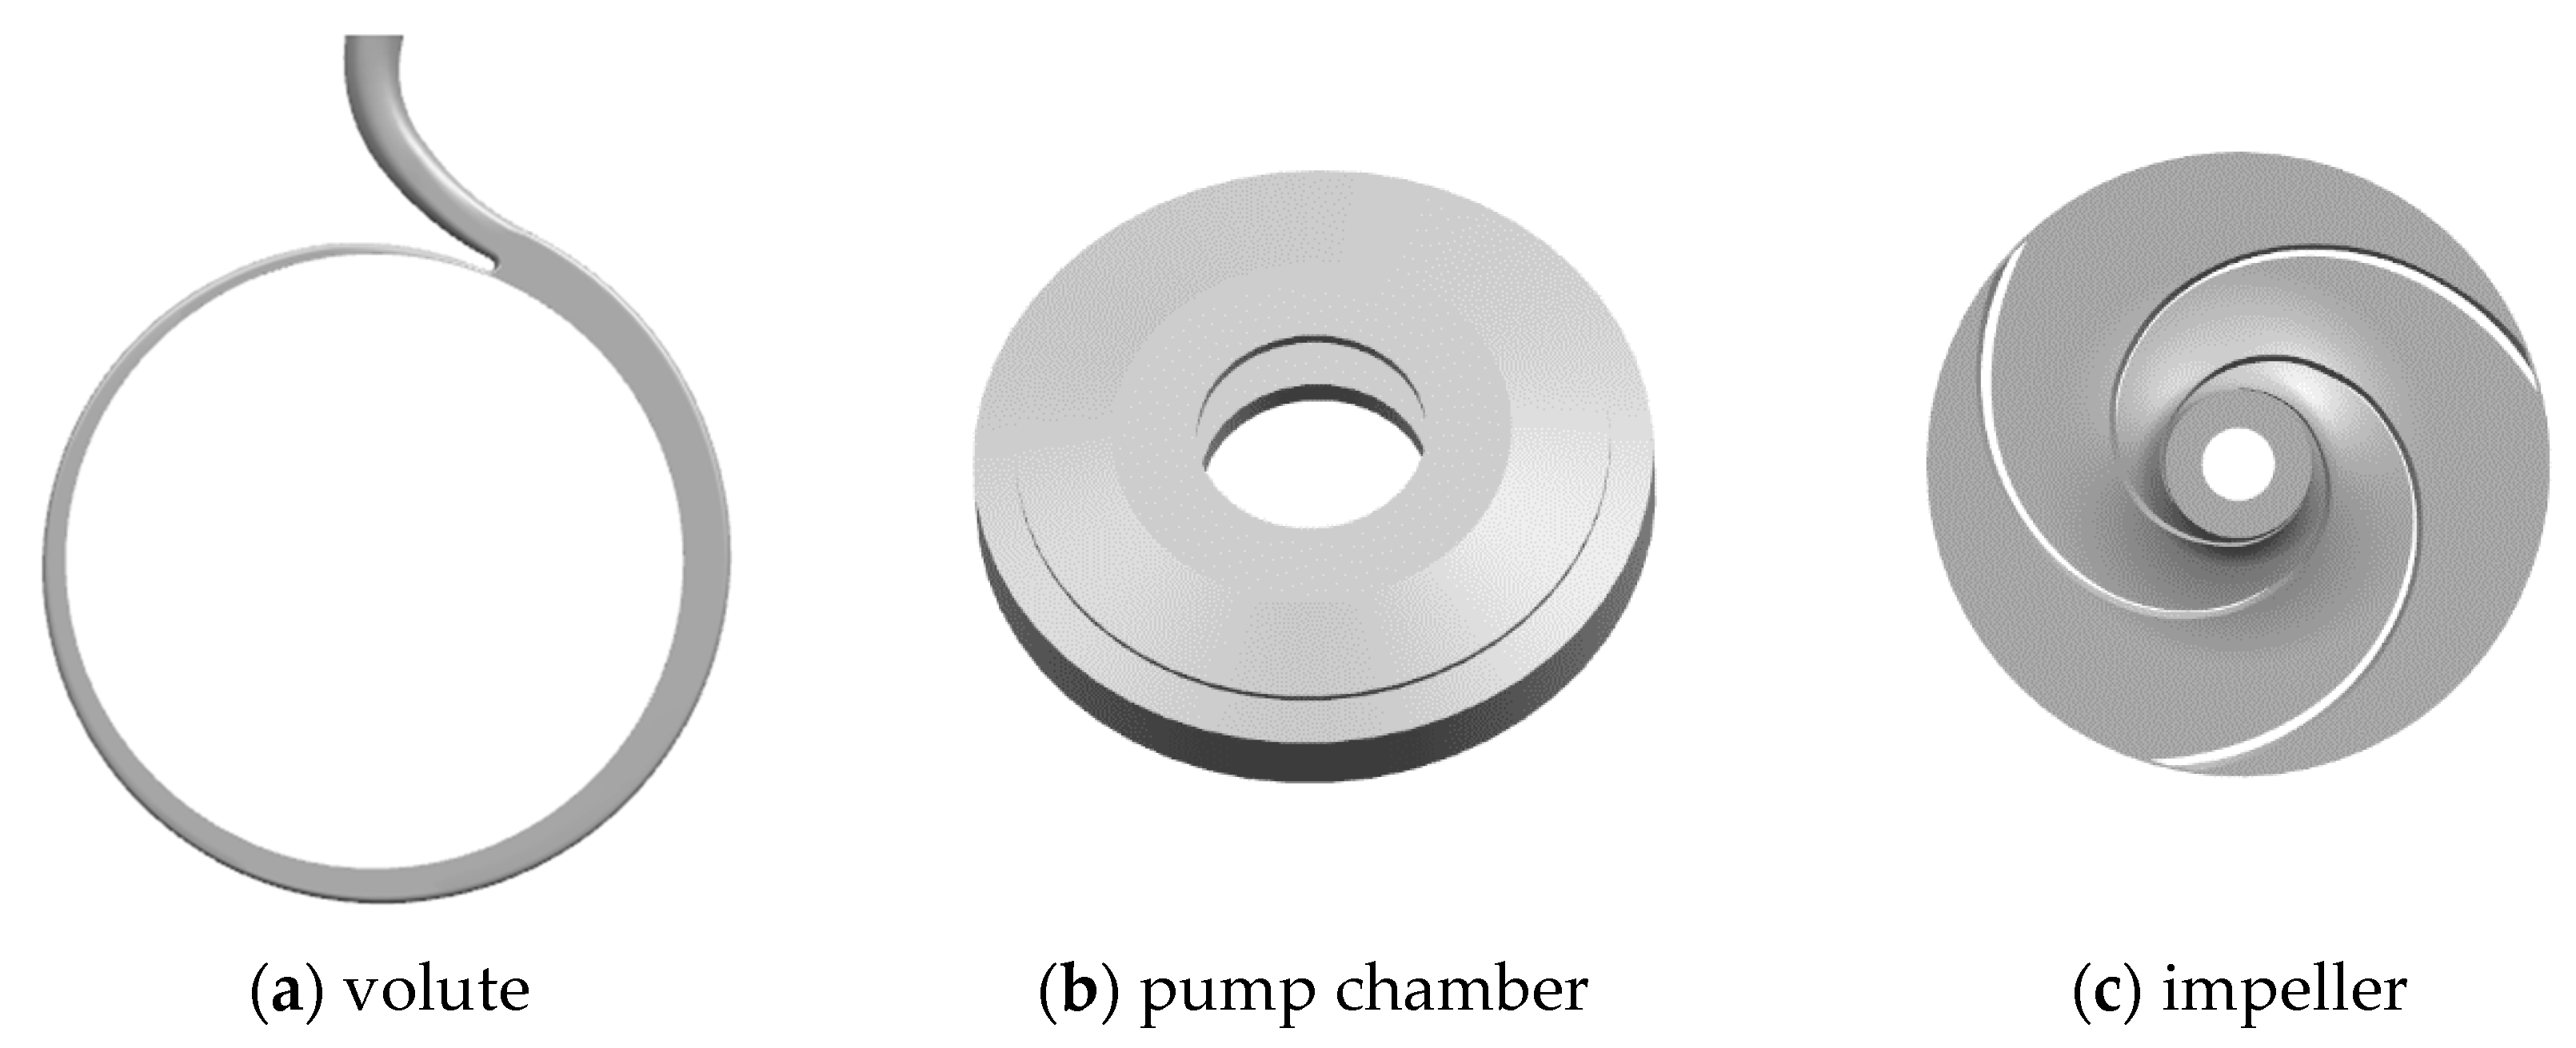
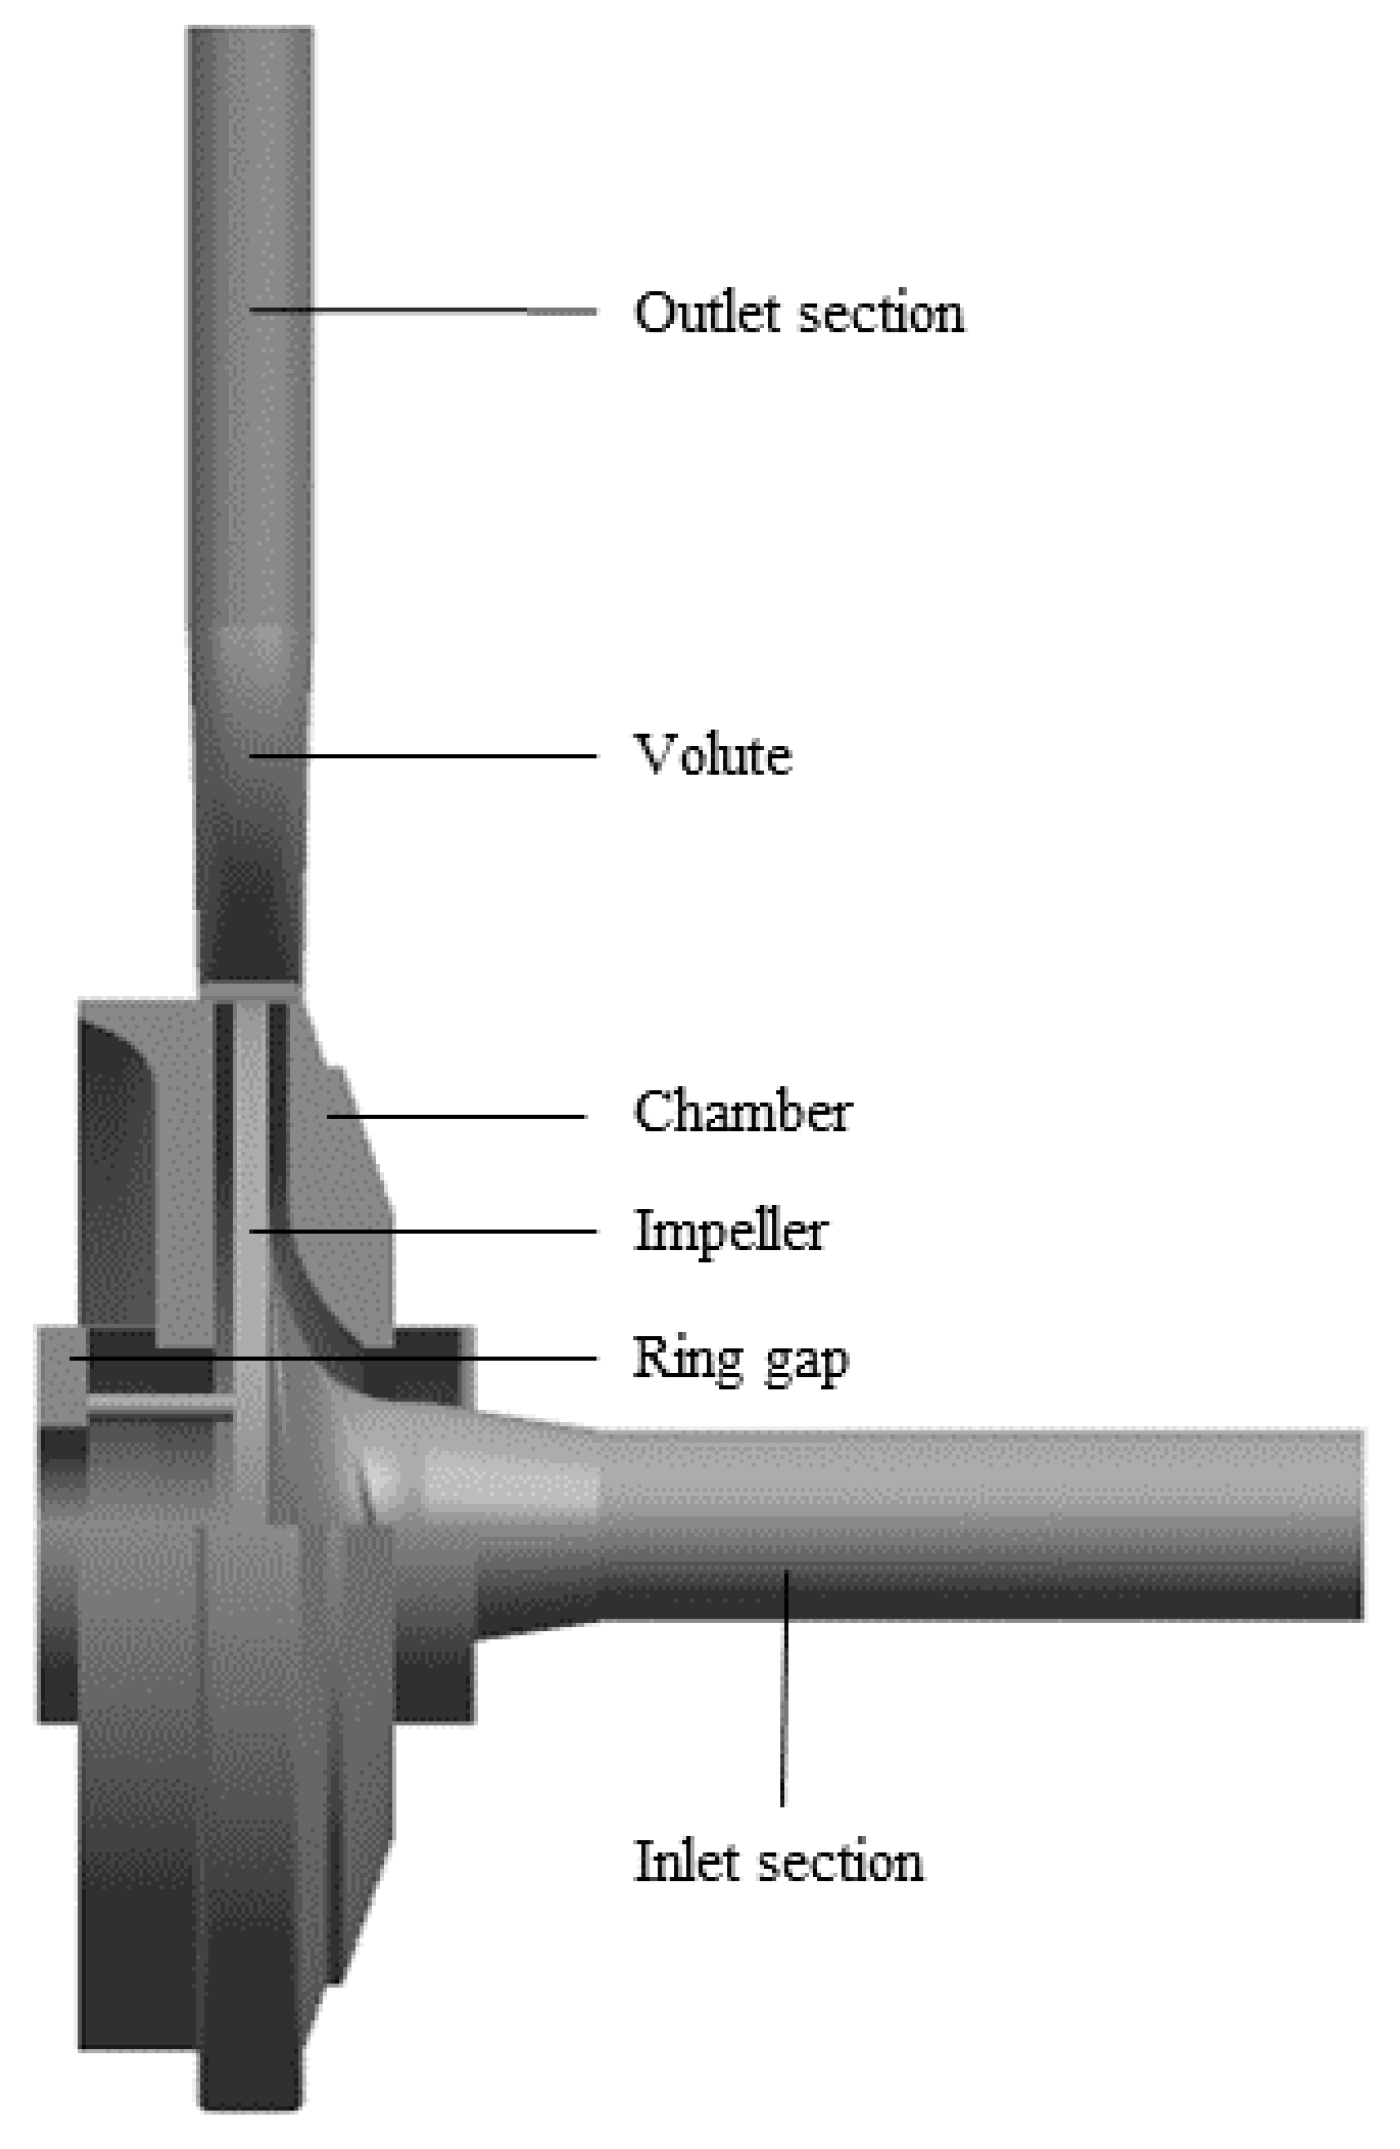
3.1. Computational Model
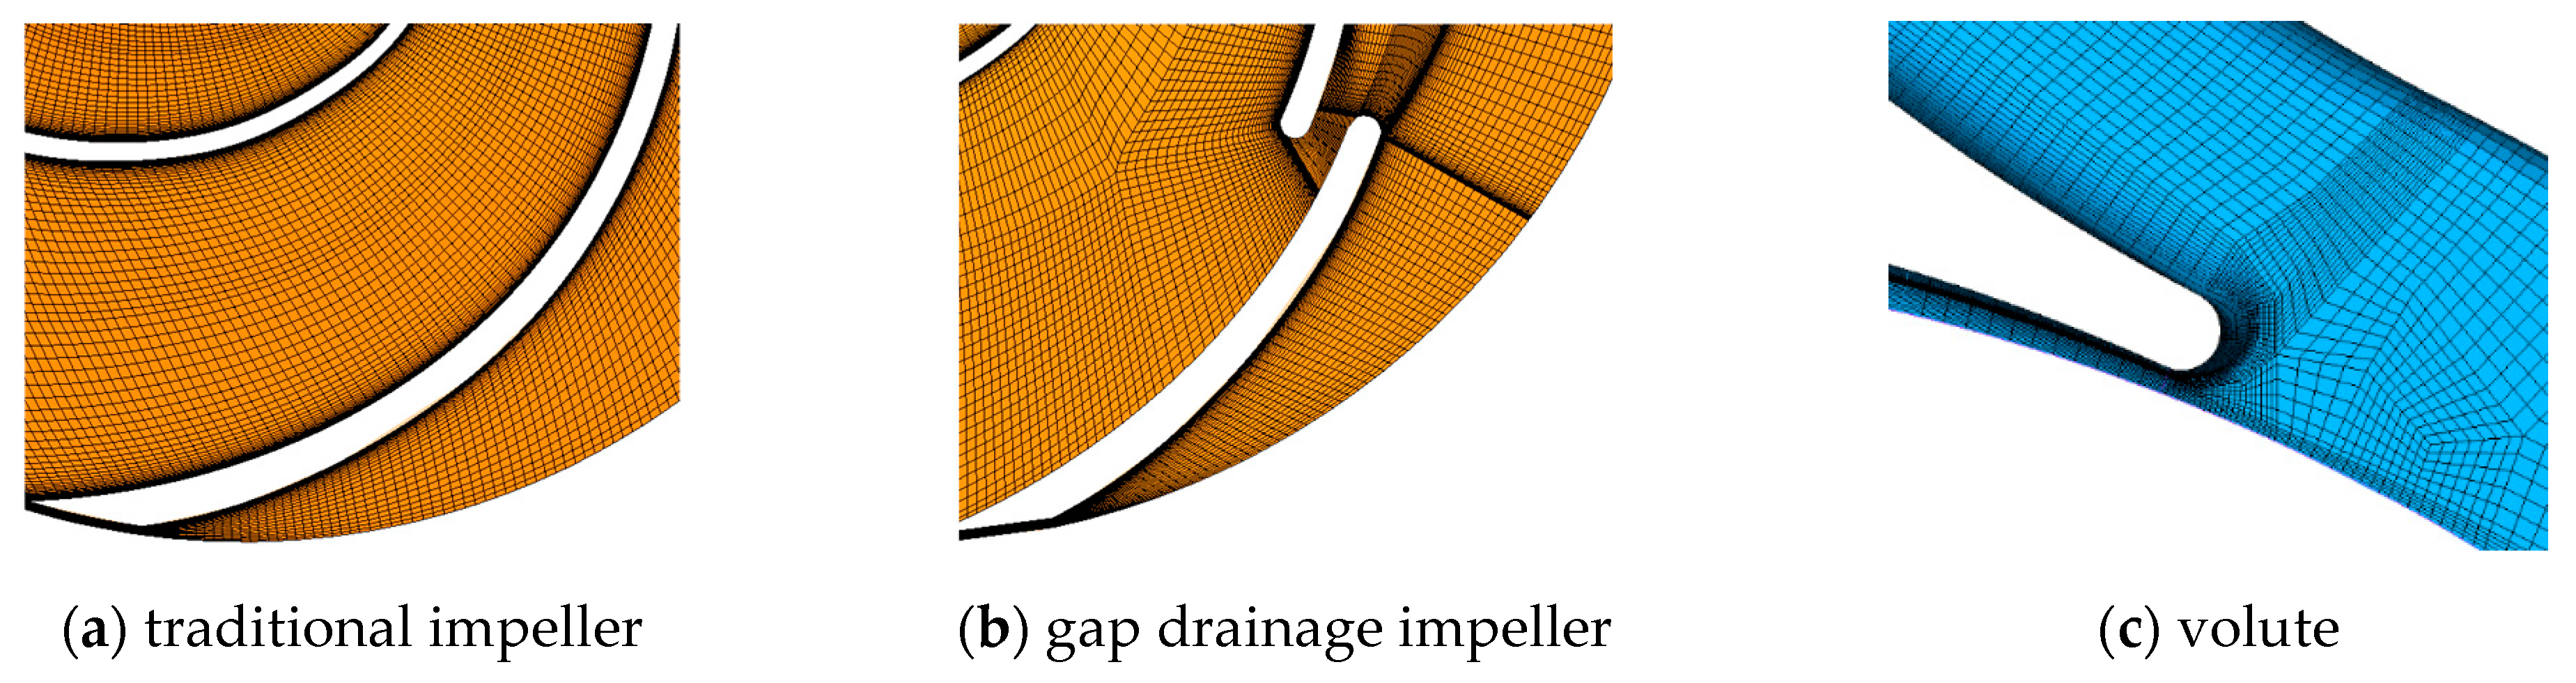
Three-dimensional modeling is the first step in numerical calculation. The accurate restoration for the hydraulic components of the pump could directly affect the validity of the numerical calculation results. In this paper, UG NX10.0 software (2014 version) was used to model the fluid domain of the ZA20-250 low specific speed centrifugal pump [21]. Considering the wear-ring of the impeller gap and the balance hole, the full flow field was modeled. The water body in the calculation domain included six parts: impeller water body, volute water body, pump chamber water body, front and rear wear-ring gap water body, inlet water body, and outlet water body. In order to fully develop the approaching flow, the water body of the inlet and outlet was extended to four times the diameter of the impeller inlet. The three-dimensional models of each water body are shown in Figure 2 and Figure 3.

3.2. Grid

Computational Fluid Dynamics (CFD) technology is a process of using fluid mechanics control equations to solve the pressure, velocity, and other variables of the discrete element to obtain the entire flow field. Discretization of the flow field with meshing is the basis of CFD technology. It is mainly divided into a structured grid and unstructured grid. The unstructured grid uses internal algorithms to automatically divide the grid nodes. The internal grid nodes have no adjacent elements, which are irregular connections. It has the advantage of simple generation and good adaptability to complex structures. However, there are shortcomings such as the large number of grids, the occupation of computing resources, and the difficulty of processing the boundary layers effectively [22].
In a complex rotating machine such as the centrifugal pump, typical flow separation and other phenomena could occur, which affect the accuracy of calculation results. The structural grid topologically divides the flow field [23]. All grid nodes have adjacent elements, which are lines of orthogonal processing points. It has the advantages of simple data structure and easy boundary fitting. It can provide fewer grids, higher calculation accuracy, and full consideration for the influence of fluid viscosity in the high-resolution boundary layer [24]. However, it is more difficult to divide complex structures by manual topology. Figure 4 shows the structural grid schematic diagram of the main hydraulic components such as the impeller and volute.

3.3. Grid Independency Analysis

In this study, ICEM software was used to divide the entire flow field. The number of grids could affect the accuracy of the calculation results and the required computing resources. In order to eliminate the influence of the number of grids on the calculation results as much as possible, five different grid numbers were used to perform numerical calculations under 1.0Qd working conditions. The pump head and efficiency were used as measurement indicators for analysis of mesh independence. Generally speaking, when the head and efficiency no longer changed with the number of grids or fluctuated within 3%, their influence could be ignored. It can be seen from Table 2 that as the number of grids gradually increases, the head and efficiency gradually stabilize. When the number of grids increased to 4.3 million, the head fluctuation range was within 0.3% and the maximum efficiency fluctuation was 0.19%. It could be considered that when the number of grids increased to 4.3 million, the calculation accuracy requirements were met. Therefore, considering the requirements of calculation accuracy and computing resources, the 4,365,848-grid scheme was finally used for subsequent analysis and research.

3.4. Boundary Conditions

In the numerical simulation, the different treatments of the Reynolds stress term cause the turbulence model to not be universal. ANSYS CFX provides a variety of turbulence models [25]. Since different centrifugal pump models have different calculation results, choosing an appropriate turbulence model has a very important impact on the accuracy. This paper selected four common two-equation models, which were used in rotating machinery. There was the standard k-omega model, RNG k-epsilon model, standard k-epsilon model, and the SST model. Numerical calculations were performed on the gapless model under 1.0Qd operating conditions. In the calculation process, all the settings except the turbulence model were kept consistent and the prediction results were compared with the experimental results, as shown in Figure 5.
It can be seen from Figure 5 that the predicted head values are all greater than the experimental values. The standard k-epsilon model and the standard k-omega model were relatively close to the test head and the error within 2.5% was acceptable. For the predicted results of efficiency, the RNG k-epsilon model and the standard k-epsilon model had large errors, which exceeded the acceptable range. The k-omega model showed good agreement with the experimental results. From the above, considering the predicted performance, the k-omega model was finally selected as the turbulence model for numerical calculations in this paper [26].
ANSYS CFX 17.0 software (2014 version) was used to perform all the steady numerical calculations. CFX-Pre was used for assembling the water body of the calculation domain. To ensure the accuracy of the calculation, the convergence precision of the solver was set to 0.0001. The mass flow outlet was used to control the working conditions of different flow rate and the inlet boundary condition was set as the pressure inlet. The initial value was 1 atm. The solid wall was set as a non-slip wall and the reference pressure was set to 1 atm. Except that the impeller was a rotating domain, the rest were all static domains. The interface of the dynamic–static calculation domain adopted a frozen rotor model.

4. Pump Performance Validation

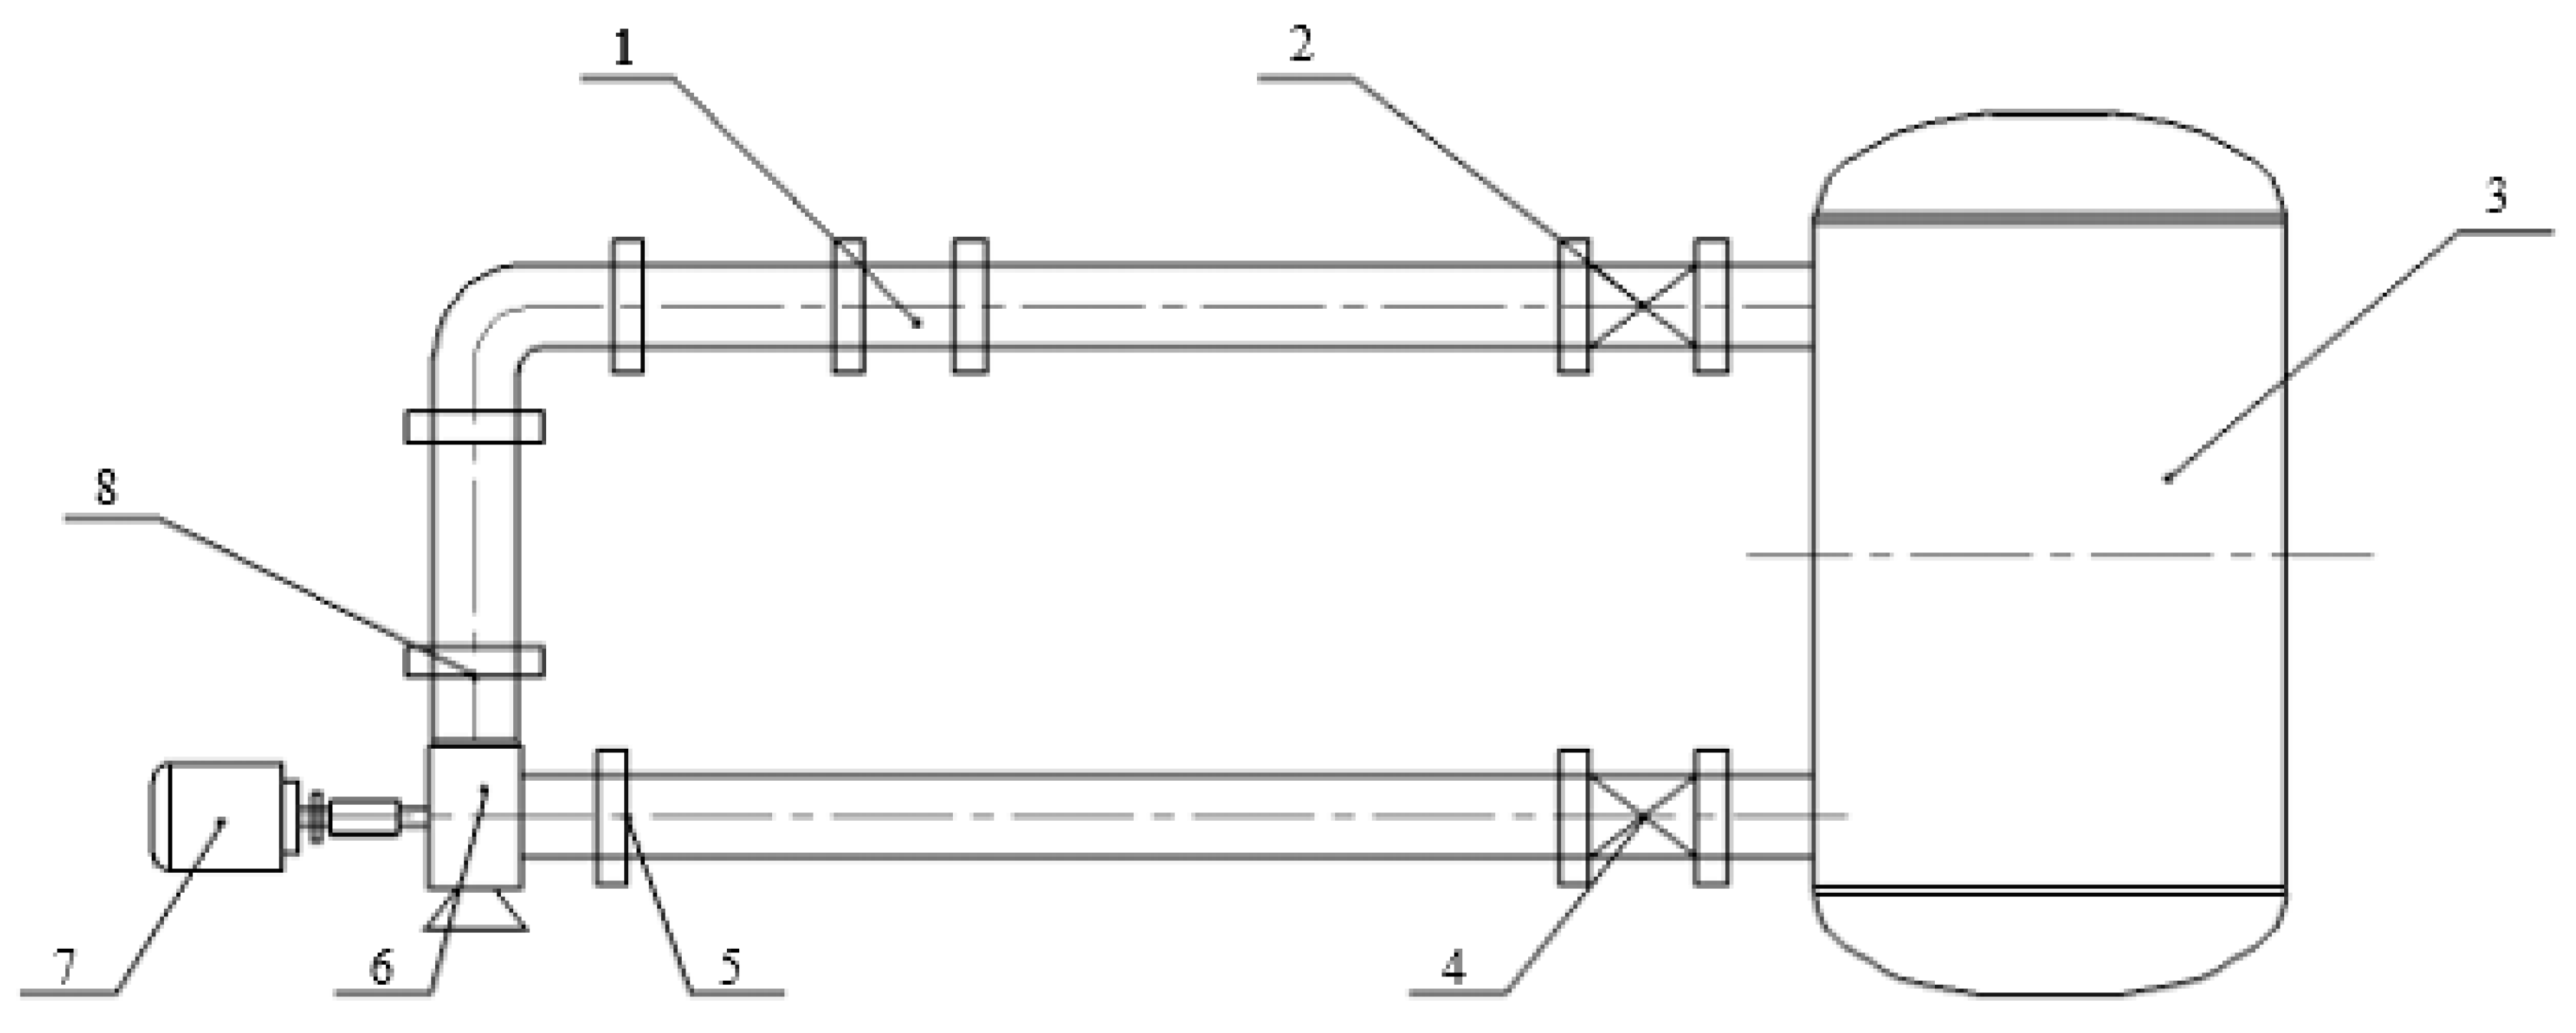
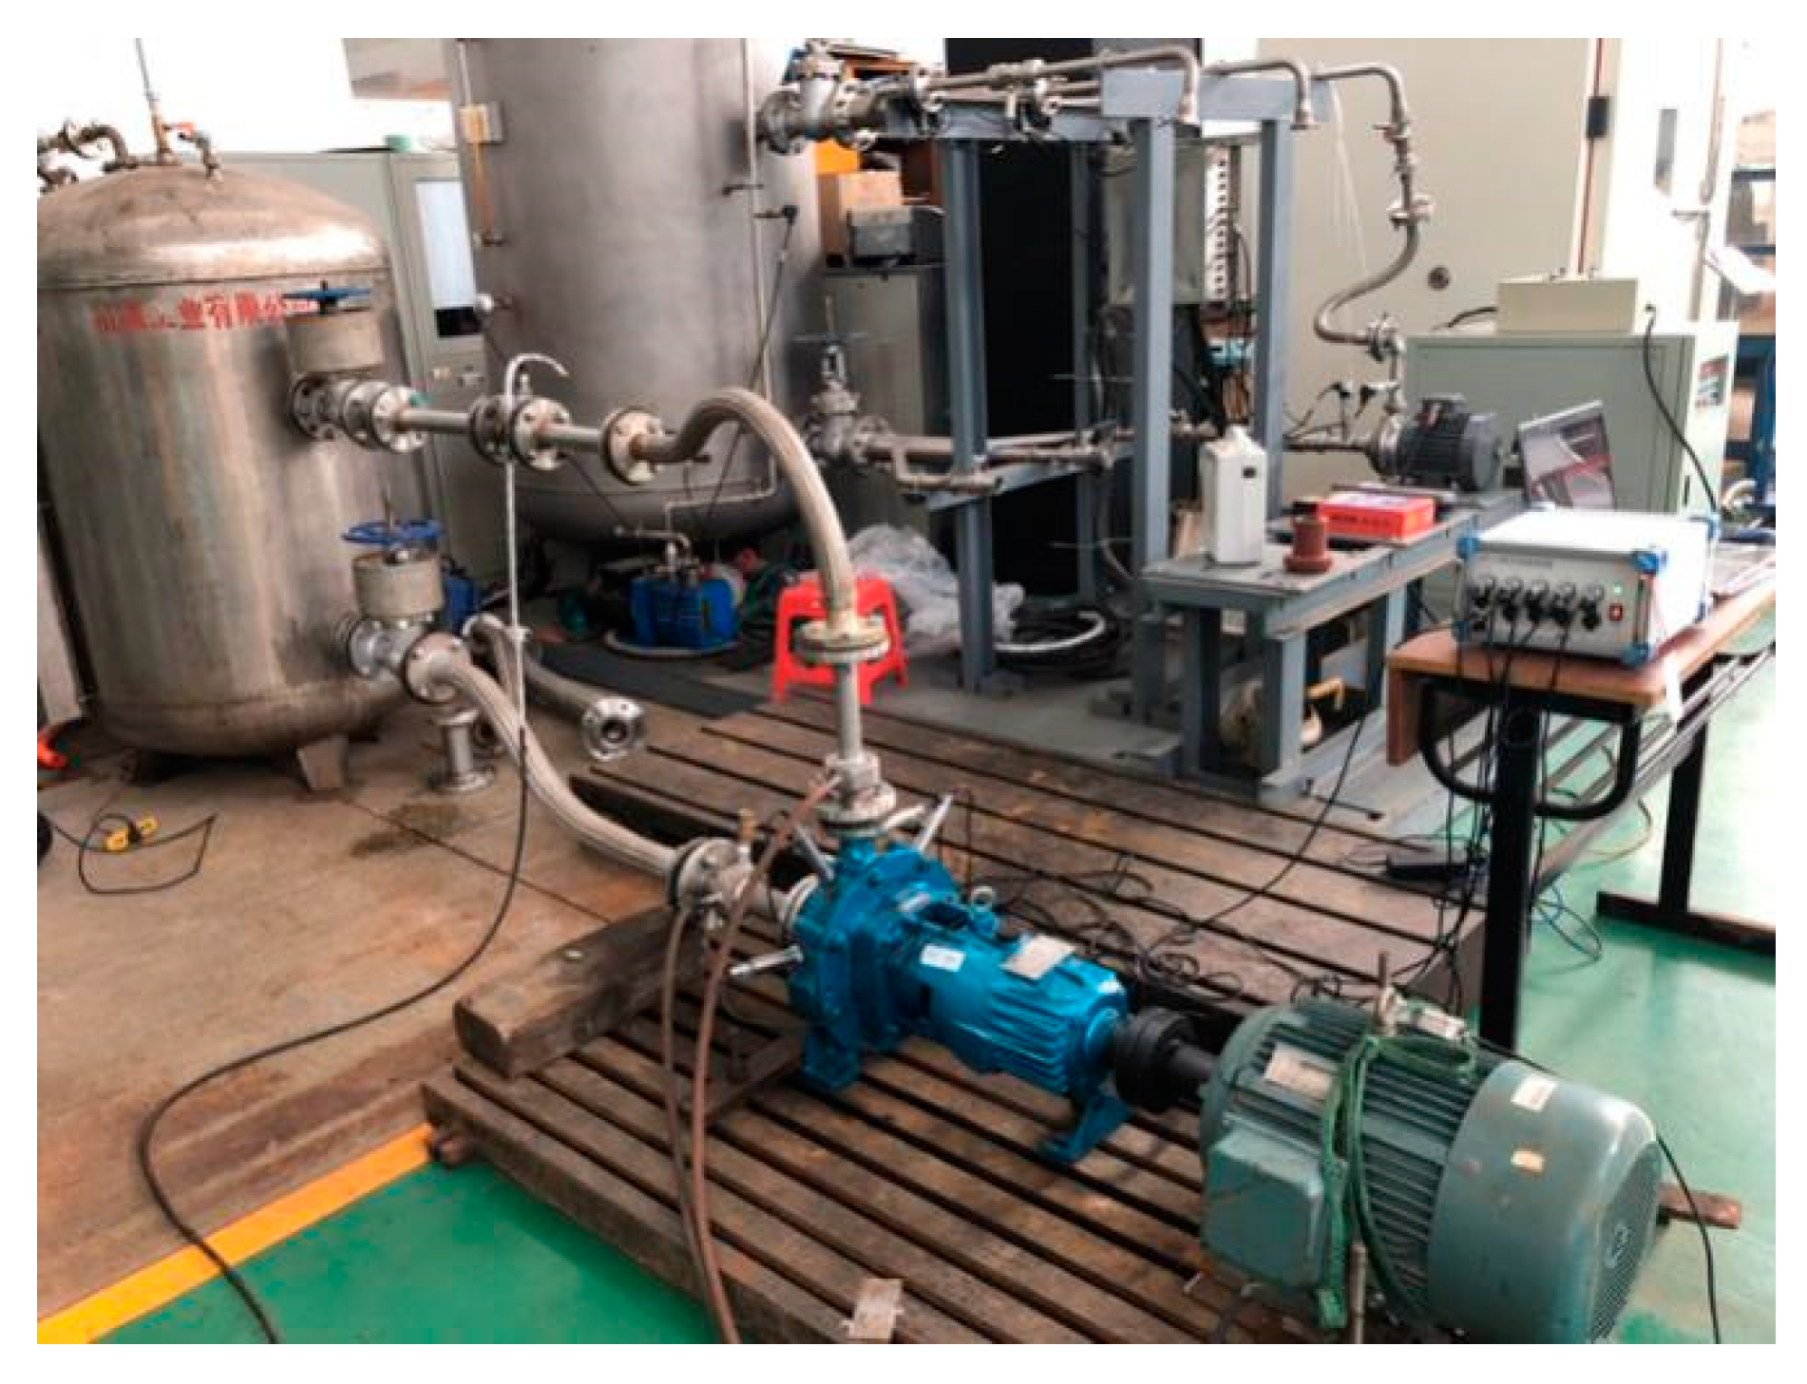
4.1. Testbed and Methods

According to the design requirements of the experiment, a closed testbed was built in the National Research Center of Pumps in Jiangsu University. The schematic diagram of the device is shown in Figure 6. The device system mainly included the following equipment: three-phase asynchronous motor, electromagnetic flowmeter (manufactured by Shanghai No. 9 Automation Instrumentation Factory), inlet and outlet pipeline gate valve, the centrifugal pump, closed water tank, and inlet and outlet pipeline pressure gauge. The experiment system was equipped with an electrical control element to control start and stop during the experiment. The collection and storage of all experiment data was completed by an electronic computer. The physical diagram of the experiment device is shown in Figure 7.
After the test and simulation to obtain the basic data of pump operation, the formula for calculating the pump head is:
H = (p2 − p1)/ρg + (V22 − V12)/2g + (Z2 − Z1)
where p1 and p2 are the pressure of the fluid at the pump inlet and outlet, in Pa. V1 and V2 are the velocity at the inlet and outlet of the pump, in m/s. The diameters of the import and export pipelines are the same, so the import and export flow rates are the same. Z1 and Z2 are the heights of the inlet and outlet, in m. In the test system, the heights of the inlet and outlet are the same. ρ is the density of the fluid, in kg/m3. g is the acceleration of gravity, in m/s2.
The formula for calculating the hydraulic power of the pump is:
P1 = 9800 × Q × H/3600000
where P1 is the hydraulic power of the pump, in kW.
The shaft power obtained in the numerical calculation is:
P2 = n × T/9552
where P2 is the numerical shaft power of the pump, in kW. T is the numerically predicted torque.
The input power of the motor in the test system is:
P3 = U × I
where P3 is the input power of the motor, in kW. U is the voltage of the motor, in V. I is the current of the motor, in A.
Therefore, the hydraulic efficiency in the numerical calculation is:
η1 = P1/P2
where η1 is the numerical predicted hydraulic efficiency of the pump, in %.
The hydraulic efficiency in the test is:
η2 = P1/P3motor
where η2 is the experimental hydraulic efficiency of the pump, in %. ηmotor is the motor efficiency. The motor performance is provided by the manufacturer of the motor.

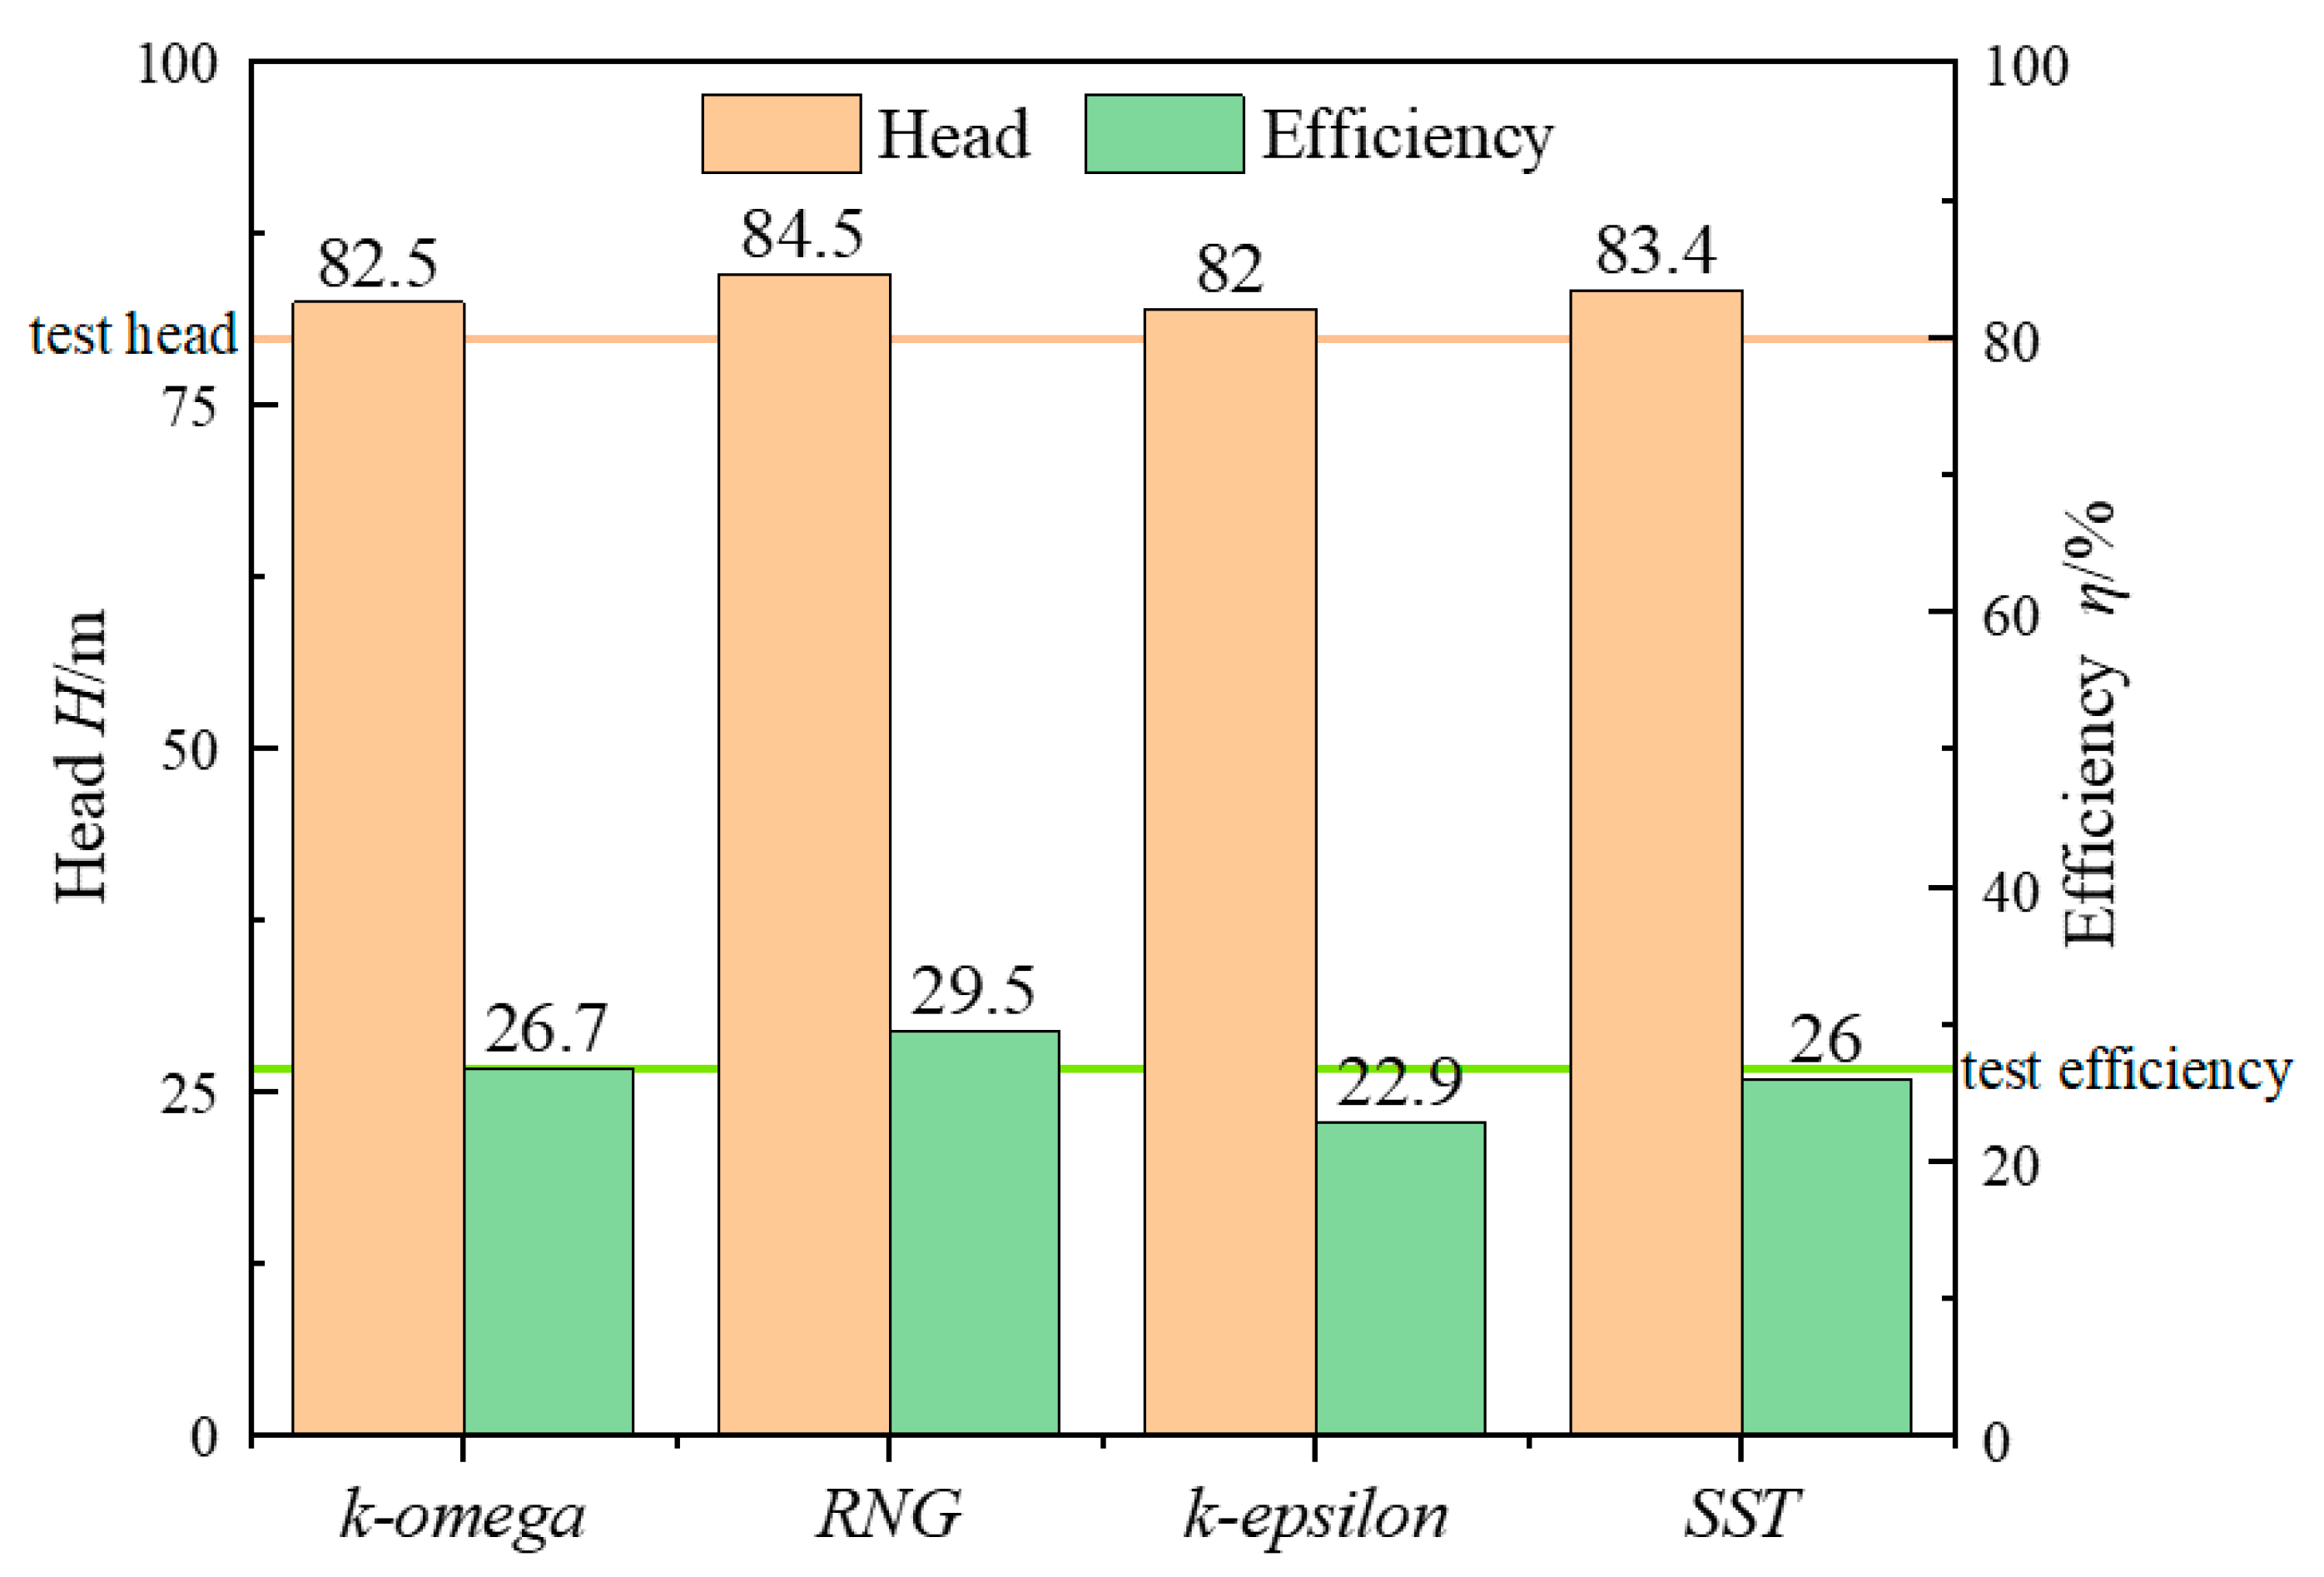
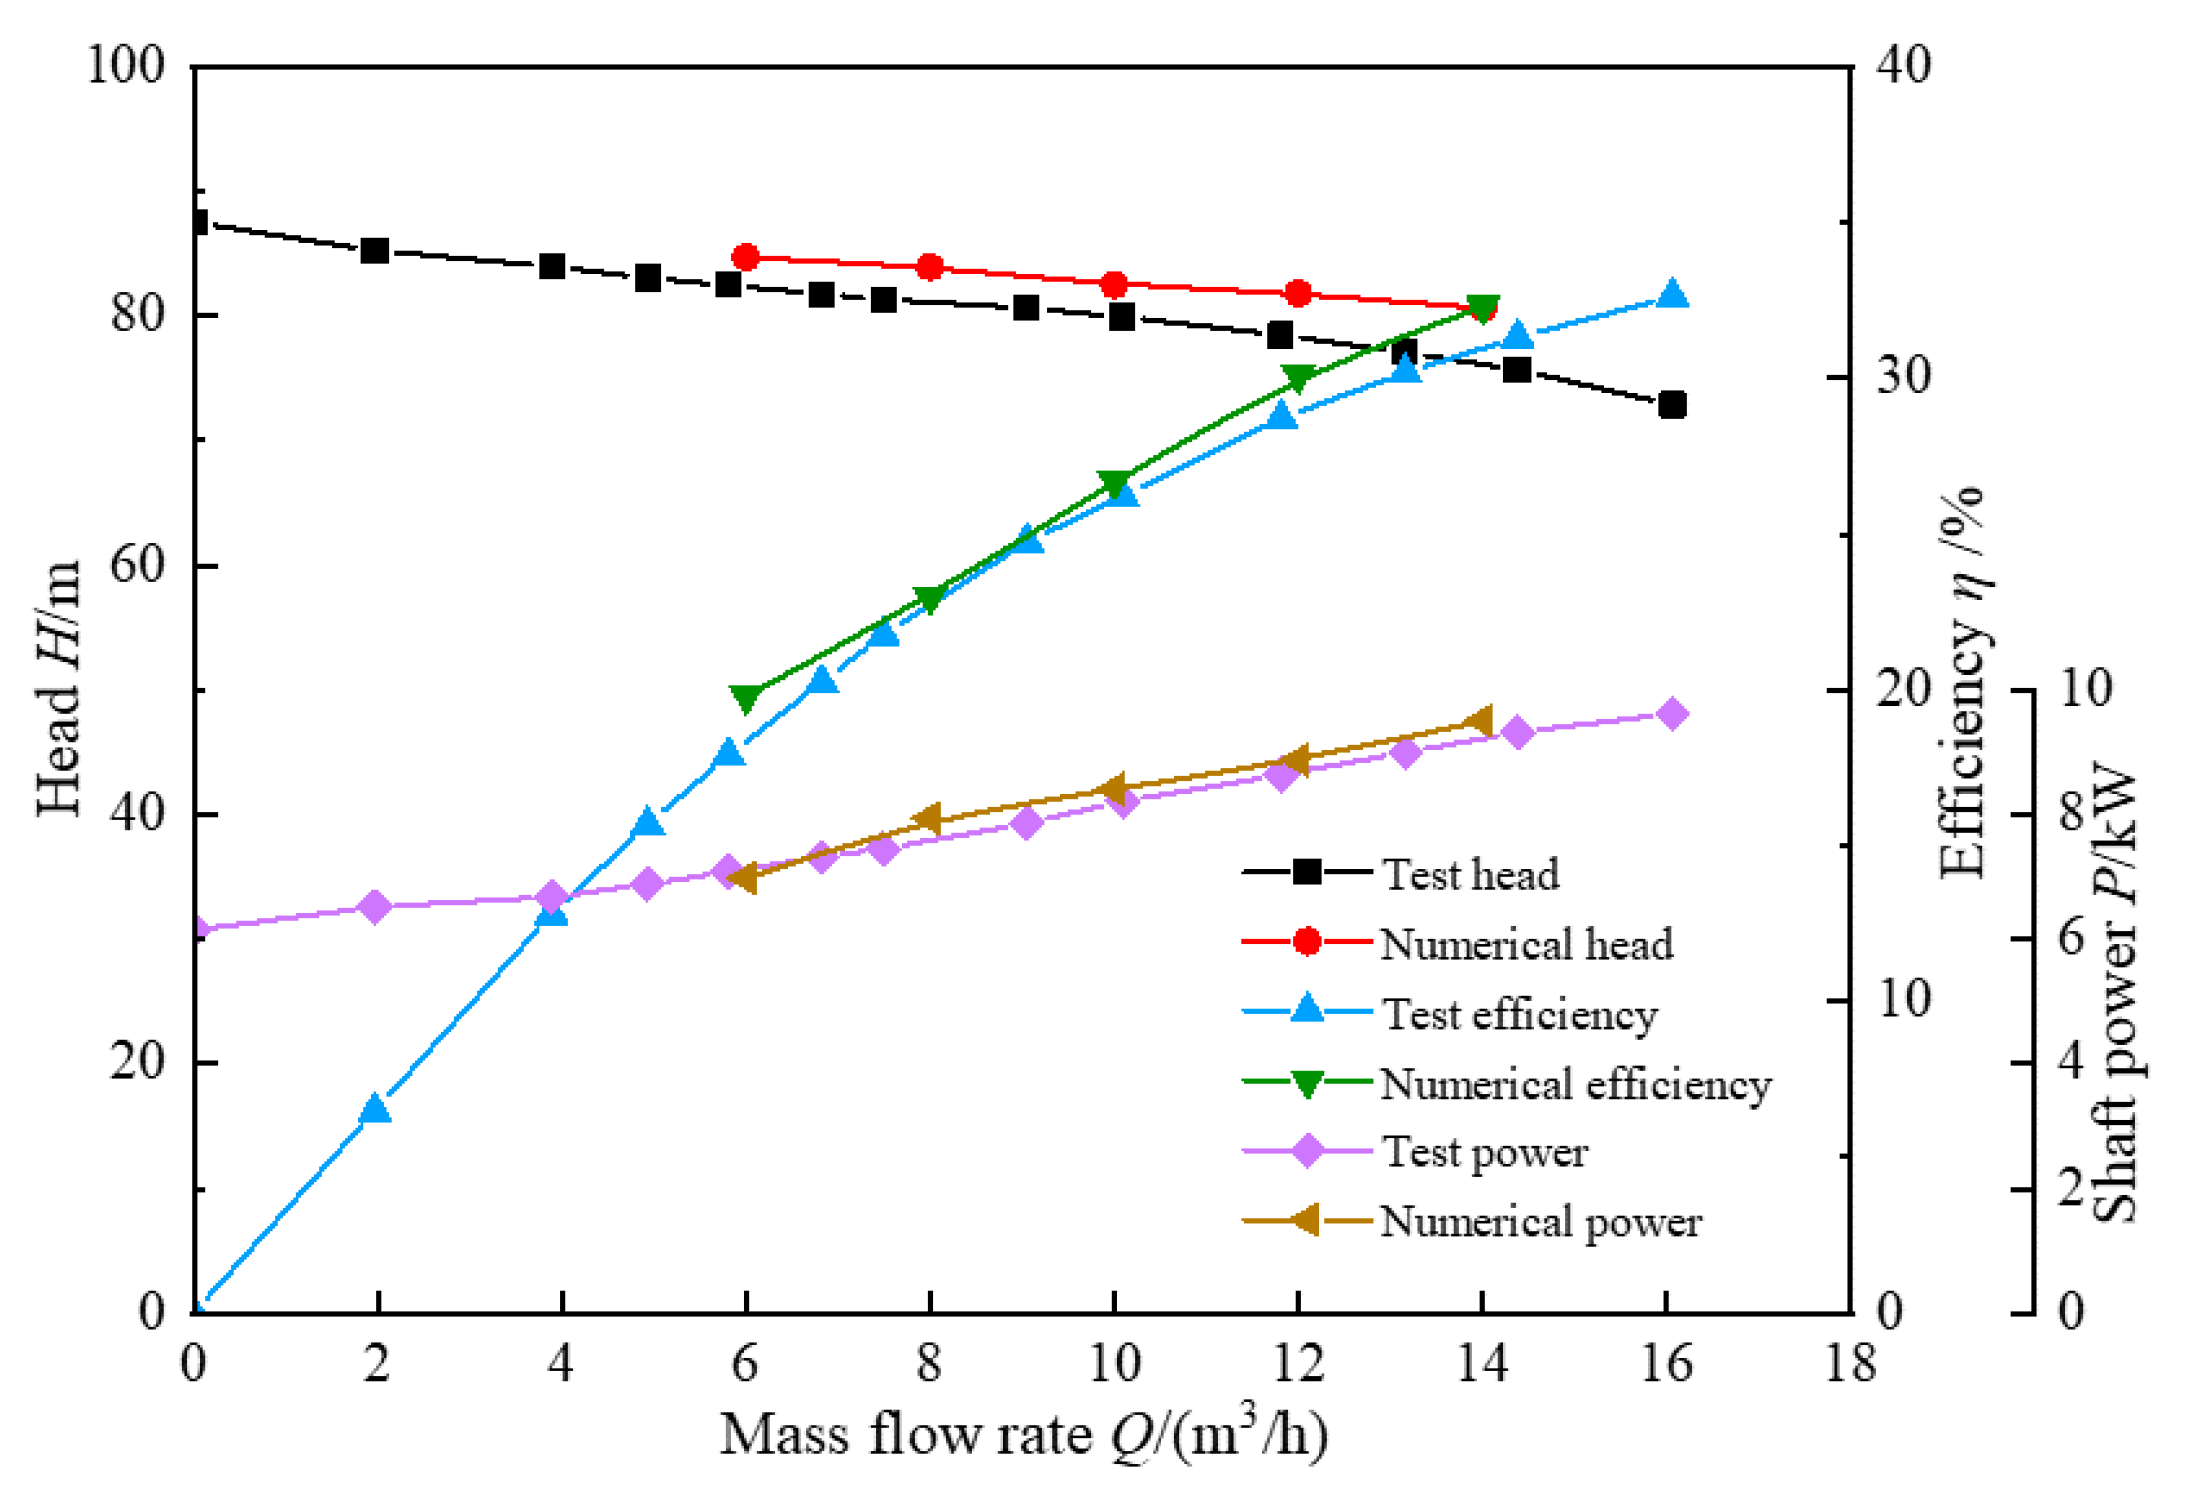
4.2. Model Validation

According to the final selected meshing scheme and turbulence model, the investigated centrifugal pump was numerically calculated in multiple working conditions. Figure 8 shows the comparison between the experimental performance and the predicted performance of the centrifugal pump. It can be seen from Figure 8 that the experiment performance is in good agreement with the predicted performance. The predicted head, efficiency, and shaft power were slightly higher than the experiment values. The flow rate–head, flow rate–efficiency, and flow rate–shaft power curves essentially coincided. In 1.4Qd working conditions, the maximum errors of the head and efficiency both appeared, which were 4.7% and 3.1%, respectively. This showed that the numerical calculation method used in this paper could accurately predict the performance of the ZA20-250 centrifugal pump. Additionally, it can be seen from the Figure 8 that the optimal operating point of the centrifugal pump does not appear at the rated flow rate operating point. The reason is that there is currently no design method specifically for the low specific speed centrifugal pump. Therefore, traditional centrifugal pump design methods were still used. According to the design method of the centrifugal pump, it could be known that the greater the flow rate was, the higher the efficiency was; the greater the specific speed was, the higher the efficiency was. Therefore, the increased flow design method was adopted in the design, which amplified the setting of design flow and specific speed. The centrifugal pump designed with the increased flow rate and specific speed would envelop the efficiency curve of the original design requirement in a certain flow rate range. Thereby, the efficiency at the rated flow operating point was improved and it caused the flow rate in the optimal operating point of the pump to frequently be greater than in the rated operating point flow. Although this method would increase the impact loss to a certain extent, the advantages outweighed the disadvantages for low specific speed centrifugal pumps.

5. Results and Discussion

5.1. The Effect of Gap Width on Pump Performance

The gap width is the main factor that affects the performance of the gap drainage impeller and it has an extremely obvious impact on the performance of the low specific speed centrifugal pump and the internal flow field distribution. Table 3 shows the prediction performance of the numerical calculation of the three models with gap widths of 0, 1.5, and 6 mm at 0.6Qd, 1.0Qd, and 1.4Qd.
Three schemes, i.e., Model 1, Model 2, and Model 3, were arranged, as shown in Table 1. It can be seen from Table 3 that the gap width has different effects on the head and efficiency under different flow rates. At 0.6Qd, the head from large to small was Model 1 > Model 2 > Model 3. Model 2 was 0.21 m lower than Model 1 and Model 3 was 3.46 m lower than Model 1. The efficiency from highest to lowest was Model 2 > Model 3 > Model 1, and Model 2 had an improvement rate of 5.1% compared with Model 1. At 1.0Qd, the head from large to small was Model 1 > Model 2 > Model 3. Model 2 was 0.11 m lower than Model 1 and Model 3 was 2.47 m lower than Model 1, which shows a significant drop. The efficiency from largest to smallest was Model 2 > Model 3 > Model 1; the improvement rate of Model 2 was 7.2% compared with the Model 1. At 1.4Qd, the head from large to small was Model 1 > Model 2 > Model 3. Model 2 was 0.06 m lower than Model 1 and Model 3 was 3.09 m lower than Model 1. The efficiency from large to small was Model 2 > Model 3 > Model 1, and Model 2 had an improvement rate of 6.3% compared with Model 1. When the gap diameter was 90 mm and the gap width was 1.5 mm, the head of the centrifugal pump remained essentially unchanged and the maximum efficiency improvement rate was 7.2%. With an increase in the gap width, the head of the centrifugal pump dropped significantly and the efficiency improved slightly. Therefore, a smaller gap width could improve the performance of the centrifugal pump, and a larger gap width was not suitable.

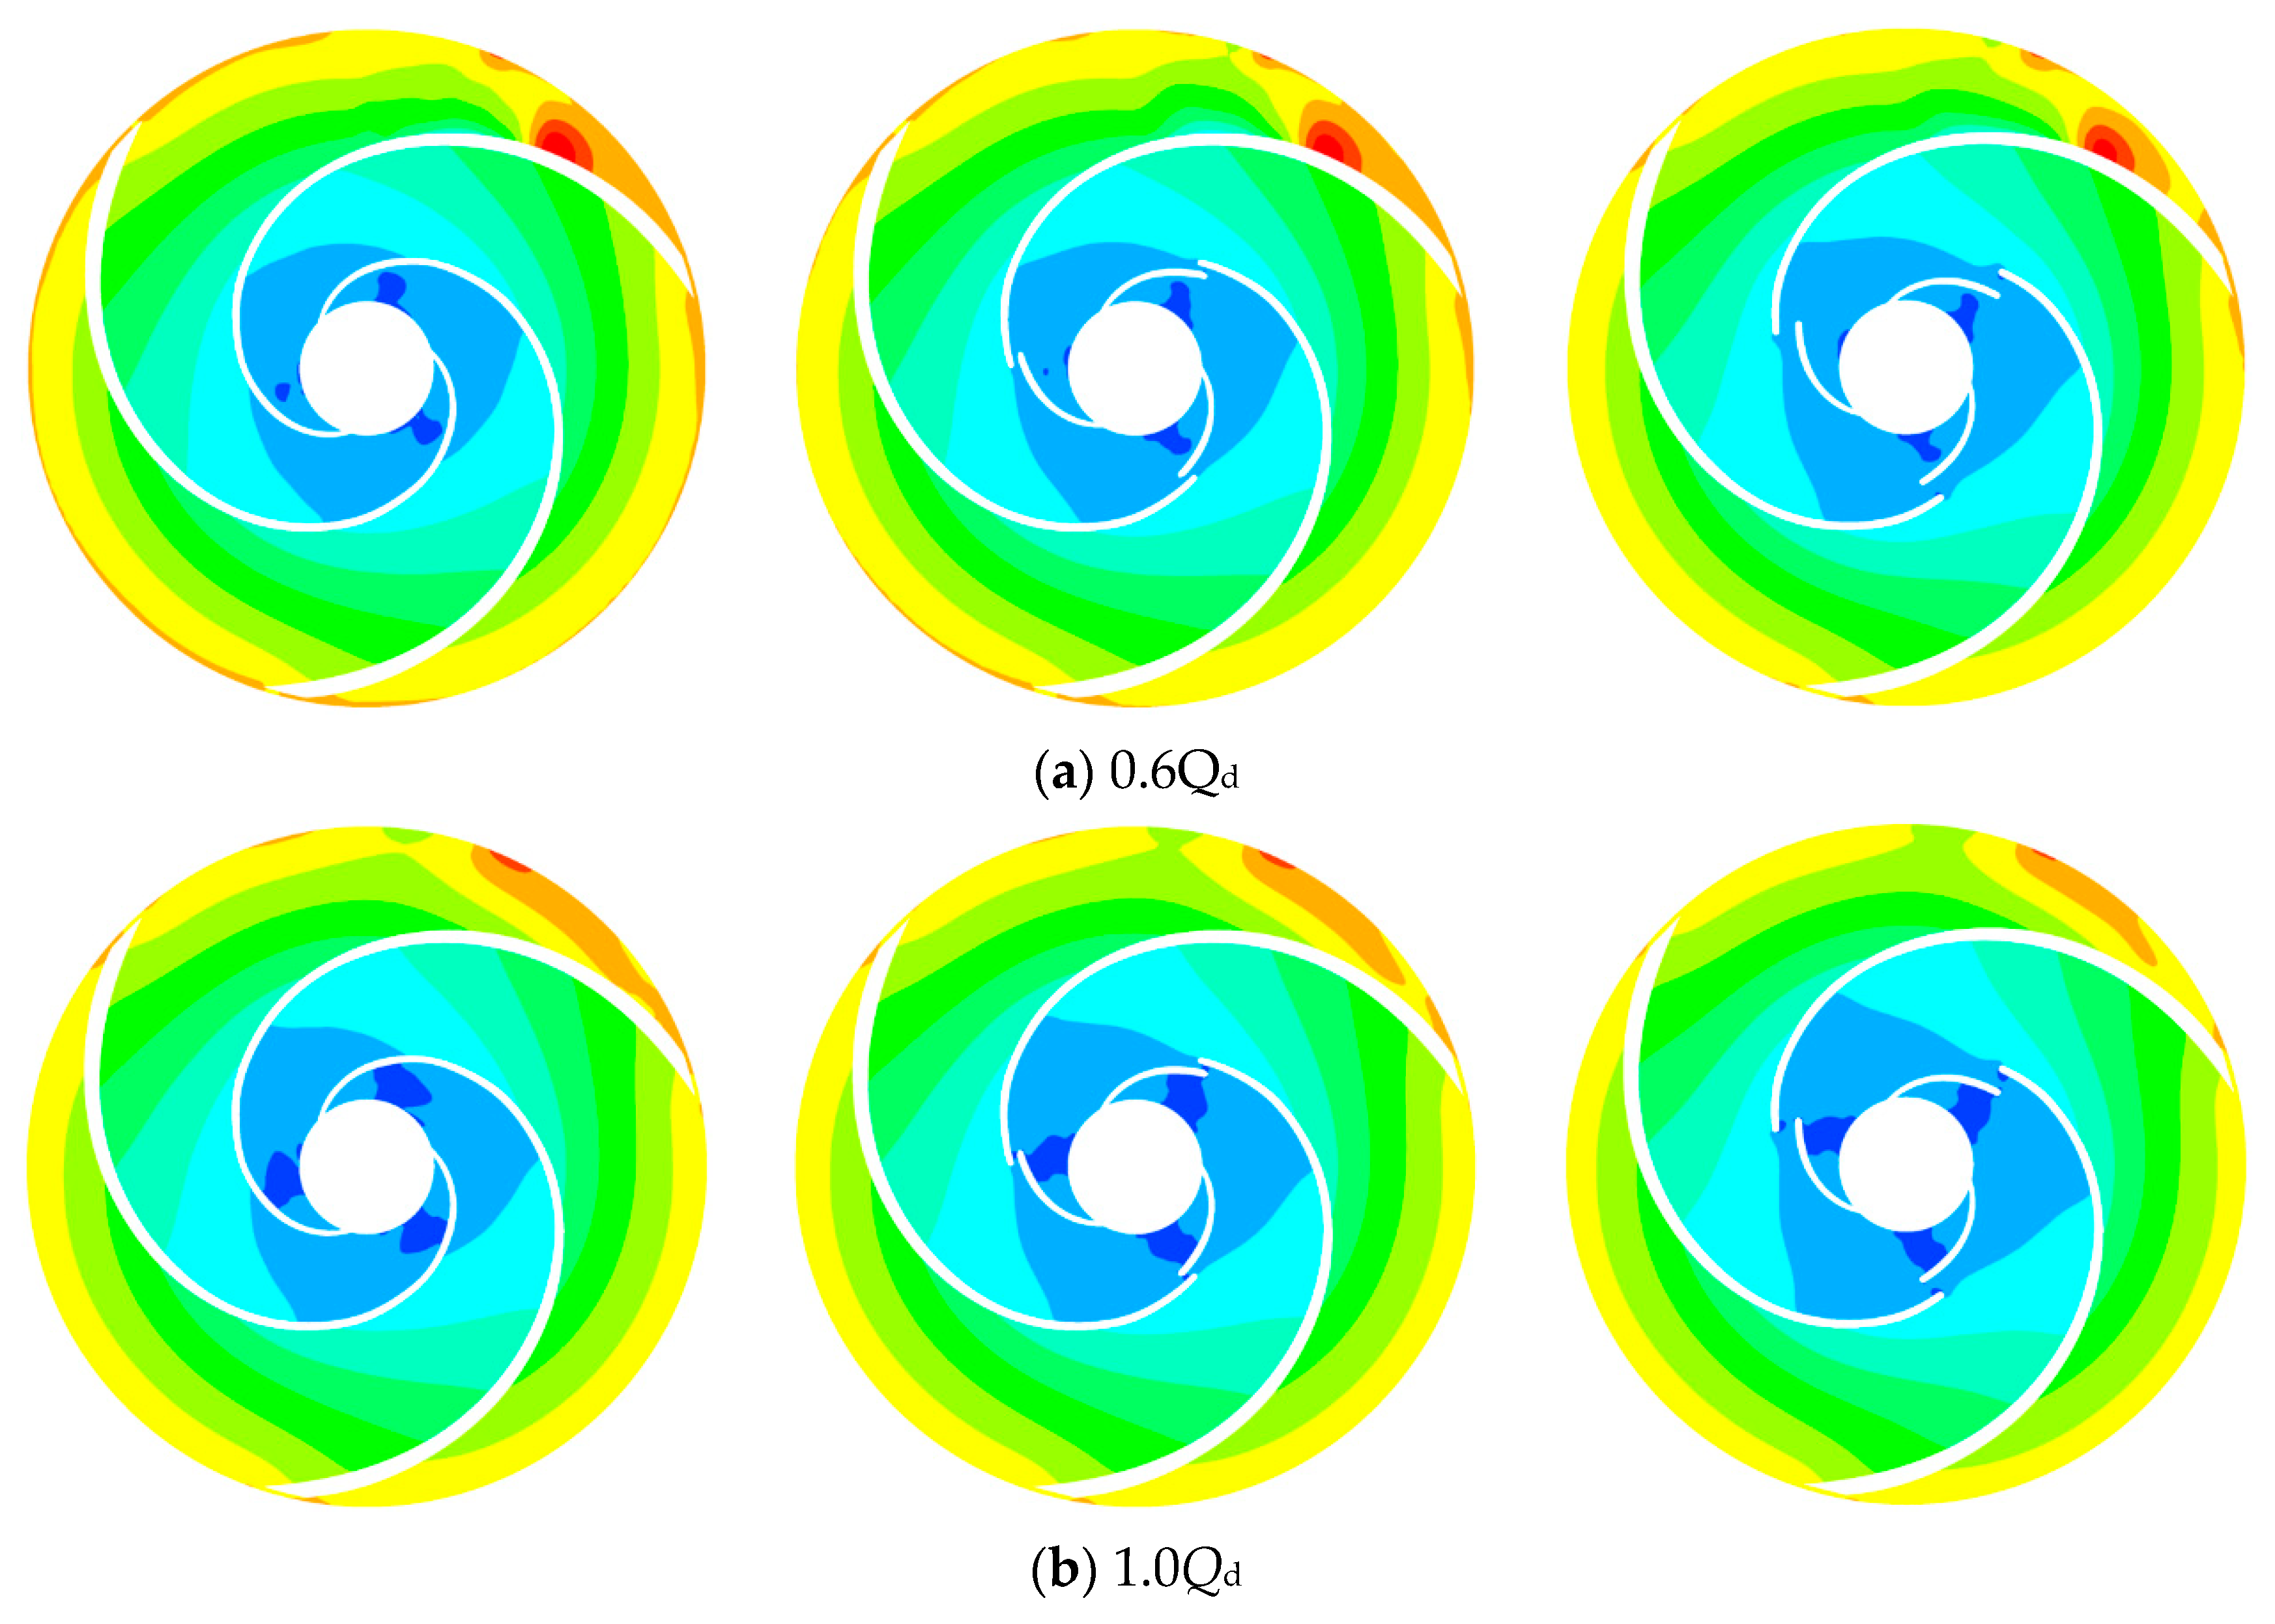
5.2. The Effect of Gap Width on Flow Field

To further explore the internal reasons for the performance difference between the gap drainage impeller and the traditional impeller under different parameters, the internal flow field of each model was analyzed and compared. Due to the influence of the volute, the internal flow of the impeller was asymmetric. Therefore, for the convenience of subsequent analysis, the flow passage near the position of the tongue was marked as flow passage 1, and flow passages 2 and 3 were marked counterclockwise.
Figure 9 shows the pressure distribution in the middle section of the impeller at different flow rates. The pressure distribution in the impeller gradually increased in the radial direction and the pressure on the pressure surface was higher than the pressure on the suction surface. There was a partial high-pressure area at the impeller outlet of flow passage 1 and a partial low-pressure area at the impeller inlet of flow passages 1, 2, and 3. The reason for this phenomenon was that during the rotating of the impeller, the blades worked on the liquid to convert mechanical energy into liquid pressure energy. Therefore, the pressure was gradually increased from the inlet to the outlet of the impeller. The angle of incidence from the incoming flow in the inlet area could not be completely matched with the blade angle. Therefore, under the action of high-speed water flow, a low-pressure area appeared in the impeller inlet area. The reason for the appearance of the high-pressure area on the outlet side of the impeller in flow passage 1 was that the liquid rotated with the impeller to the tongue and the collision with the tongue, which led to the generation of vortex and the partial pressure finally increasing. At 0.6Qd, 1.0Qd, and 1.4Qd, compared with Model 1, the low-pressure area at the impeller inlet of Model 2 was smaller. According to the pump cavitation theory, this helped to enhance the anti-cavitation performance of the pump. Meanwhile, compared with Model 1, the high-pressure area at the outlet of the impeller was reduced to a certain extent in flow passage 1 in Model 2, which indicated that the gap drainage impeller weakened the complex flow at the tongue. Compared to Model 1, the low-pressure area at the impeller inlet was reduced in Model 3, but the suction surface of the deflecting blade at the gap produced a new low-pressure area. In fact, the gap drainage blades and traditional blades could be regarded as a combination of short blades and long blades. The two blades of the traditional blades were closely connected. When the liquid flowed through the gaps draining into two flow passages, the high-pressure liquid through the gap on the pressure surface flowed into the suction surface, and the liquid pressure on the suction surface was increased [27]. Thereby, the development of the low-pressure area was inhibited at the impeller inlet. As the gap width increased, the high-pressure fluid flowing into the adjacent flow passage through the gap increased. The results were a decrease in the outlet pressure of the impeller and a drop in the head.
Figure 10 shows a comparison of the velocity distribution cloud diagram and velocity streamline in the middle section of the impeller under different flow conditions. From an overall point of view, the high-speed area in the impeller was concentrated on the suction surface of the blade. The low-speed area was concentrated on the pressure surface of the blade and the speed was close to zero. At 0.6Qd, there were four significant vortex structures on the blade pressure surface in impeller flow passages 1, 2, and 3 and the trailing edge of the blade in flow passage 1. With the increase in flow rate, the vortex structures of the blade pressure surface and the blade trailing edge were weakened and gradually disappeared at 1.0 and 1.4Qd, which resulted in the better internal flow of the impeller. Due to the flow separation on the pressure surface of the blade, the flow passage was blocked and the liquid in the impeller mainly flowed along the suction surface of the blade [28].
At 0.6Qd, the flow separation appeared at the pressure surface, and the vortex took place at the trailing edge. At the small flow rate, the flow in the flow passage was small, and the pressure of the main flow on the pressure surface was gradually weakened, which caused the enhanced liquid diffusion to intensify the flow separation. The flow separation in the flow passage of Model 1 was severe. Compared with Model 1, the flow separation on the pressure surface of the blade was weakened in Model 2. Observing its streamline, it could be seen that when the liquid flowed through the gap, there was a jet entrainment effect around the gap. This caused the liquid near the gap to flow into the adjacent flow passage. In flow passage 1, the vortex at the trailing edge of the blade aggravated the liquid blockage, and part of the liquid along the wall flowed back to the front area of the flow separation and then flowed out with the main flow, which further weakened the flow separation. With the increase in the width of the gap, the flow rate of liquid through the gap in Model 3 increased, which caused an intensified entrainment effect on the main flow. Part of the main flow in the gap flowed back from the pressure surface of the deflecting blade to the suction surface. Furthermore, the low-velocity fluid of the near-wall region along the wall of the pressure surface generated a laminar flow, which was opposite to the main flow direction and flowed into the adjacent flow passage through the gap. An increase in velocity in the near-wall region could be observed. The following phenomena occurred in the flow separation area of Model 3: the main flow of the suction surface flowing from the impeller inlet to the outlet, the flow separation in the middle of the flow passage, and the stratification of the flow that was opposite to the main flow direction and in the near-wall area. Although it reduced the flow separation, the flow separation moved to the middle of the flow passage.
At 1.0Qd, the vortex on the outlet side of the impeller in flow passage 1 gradually disappeared and the flow separation of the pressure surface was weaker than that at 0.6Qd. Due to the increase in the main flow’s flow rate, there was not obvious entrainment in the gap of Model 2. The low-velocity fluid in the near-wall region of the main blade flowed into the adjacent flow passage through the gap, which reduced the accumulation and thickening of the boundary layer of the deflecting blade and the flow separation to a certain extent. With the increase in gap width, the flow rate of Model 3’s gap increased. Nearly 1/2 of the main flow liquid in the flow passage flowed into the adjacent flow passage through the gap. The main flow’s inhibition of flow separation on the pressure surface was weakened and the development of flow separation in the middle flow passage aggravated the flow passage blockage, which caused the vortex to reappear on the trailing edge of the blade [29]. In addition, the liquid that passed through the gap and forced by the blades formed a humping area in the front of the gap. When the main flow got through the area, the main flow that had not entered the gap generated a certain incidence with the pressure surface of the blade, which intensified the flow separation. At 1.4Qd, due to the increase in flow rate, the main flow’s inhibition of the flow separation enhanced and the flow separation in the flow passage further reduced. The vortex at the trailing edge of the blades disappeared in the flow passage, and the flow separation phenomenon on the blade pressure surface could still be observed in Model 1. In Model 2, there was not obvious flow separation on the blade pressure surface. In Model 3, due to the increase in flow rate, the capacity of the gap drainage was weakened. About 1/3 of the main flow liquid flowed into the adjacent flow channels through the gap, which reduced the humping area and the incidence of the main flow in the near-wall region, but still caused the intensification of the flow separation.
Figure 11 shows the load distribution on the blade surface at 50% blade height under different flow conditions. It could be seen that at 0.6Qd, the vortex of the trailing edge in flow passage 1 resulted in pressure fluctuation on the blade pressure surface at 70% blade length and this disappeared as the flow rate increased. There was no significant difference in the surface load of the main blade in front of the gap. The load of the deflecting blade in Models 1 and 2 decreased, which was intensified with the increase in gap width. It can be seen from Figure 11 that the pressure drop at the gap is the main reason for the reduction in blade load. Model 2 had a small gap width, which had a weak effect on the deflecting blade. Compared with Model 1, the load was not significantly reduced. With the increase in gap width, the pressure drops at the gap increased significantly. The surface load of the deflecting blade of Model 3 dropped seriously. Thus, the pressure drop at the gap was the main reason for the head drop of the gap drainage impeller, and the small gap width had a weaker effect on the blade load.
It was believed that the essence of the fluid was the vortex and the force that caused the fluid to generate the vortex actually referred to the shear force acting on the fluid. The strong shear action occurred between the high-speed main flow in the impeller flow passage and the fluid in the low-speed zone, which further caused the shear deformation of the fluid infinitesimal elements to promote the generation of turbulence. The generation of turbulence was accompanied by the loss of mechanical energy, which increased the fluid resistance or reduced mechanical efficiency.
Figure 12 shows the distribution of shear strain rate on the middle section of the impeller under different flow rates. It could be seen that the high shear strain rate area was concentrated at the impeller inlet and flow passage 1’s impeller outlet. With the increase in flow rate, the high shear strain rate area at the impeller inlet increased. At 0.6, 1.0, and 1.4Qd, the distribution of shear strain rate at the impeller outlet was essentially the same, indicating that the gap diameter of 90 mm had no significant impact on the distribution. However, the distribution of shear strain rate in the impeller inlet was significantly different. Compared with Model 1, the high shear strain rate area on the suction surface of the blade inlet in Model 2 was significantly reduced, indicating that the gap drainage impeller could suppress the generation of turbulent vortex on the suction surface to reduce energy loss. Compared with Model 1, the high shear strain rate area in Model 3 was decreased on the blade suction surface, but the shear strain rate in the middle of the impeller flow passage was increased. Additionally, a high shear strain rate area was generated at the inlet of the deflecting blade.

6. Conclusions

This work carried out experiments and numerical simulations on the influence of gap drainage on performance and flow field patterns within low specific speed centrifugal pumps. The mesh and turbulence models used in the numerical calculations were screened to ensure accuracy. The numerical results were compared with test results to ensure the reliability of subsequent analysis. Most importantly, the effect of gap width on pump performance and internal flow field was investigated. As shown below, the main conclusions can be extracted as follows:
(1)
The head, efficiency, and shaft power based on the numerical prediction were slightly higher than the experimental values and the numerical results had the largest predicted deviation under 1.4 times the rated operating conditions. However, the difference between the predicted results and the experimental values of the head and efficiency was less than 3% under rated flow conditions. Additionally, under full flow conditions, the agreement between the numerical results and the experimental results was relatively high and the two had basically the same trend of change. Therefore, the numerical calculation method used in this article had high accuracy in predicting the performance of low specific speed centrifugal pumps.
(2)
Gap drainage could reduce the head of the low specific speed centrifugal pump, but it could improve hydraulic efficiency. The performance of the three models verified the conclusion that the gap width had a greater influence on the gap drainage effect. The optimal gap for this study is 1.5 mm. A small gap width in the low specific speed centrifugal pump could greatly improve its hydraulic efficiency with small head drop.
(3)
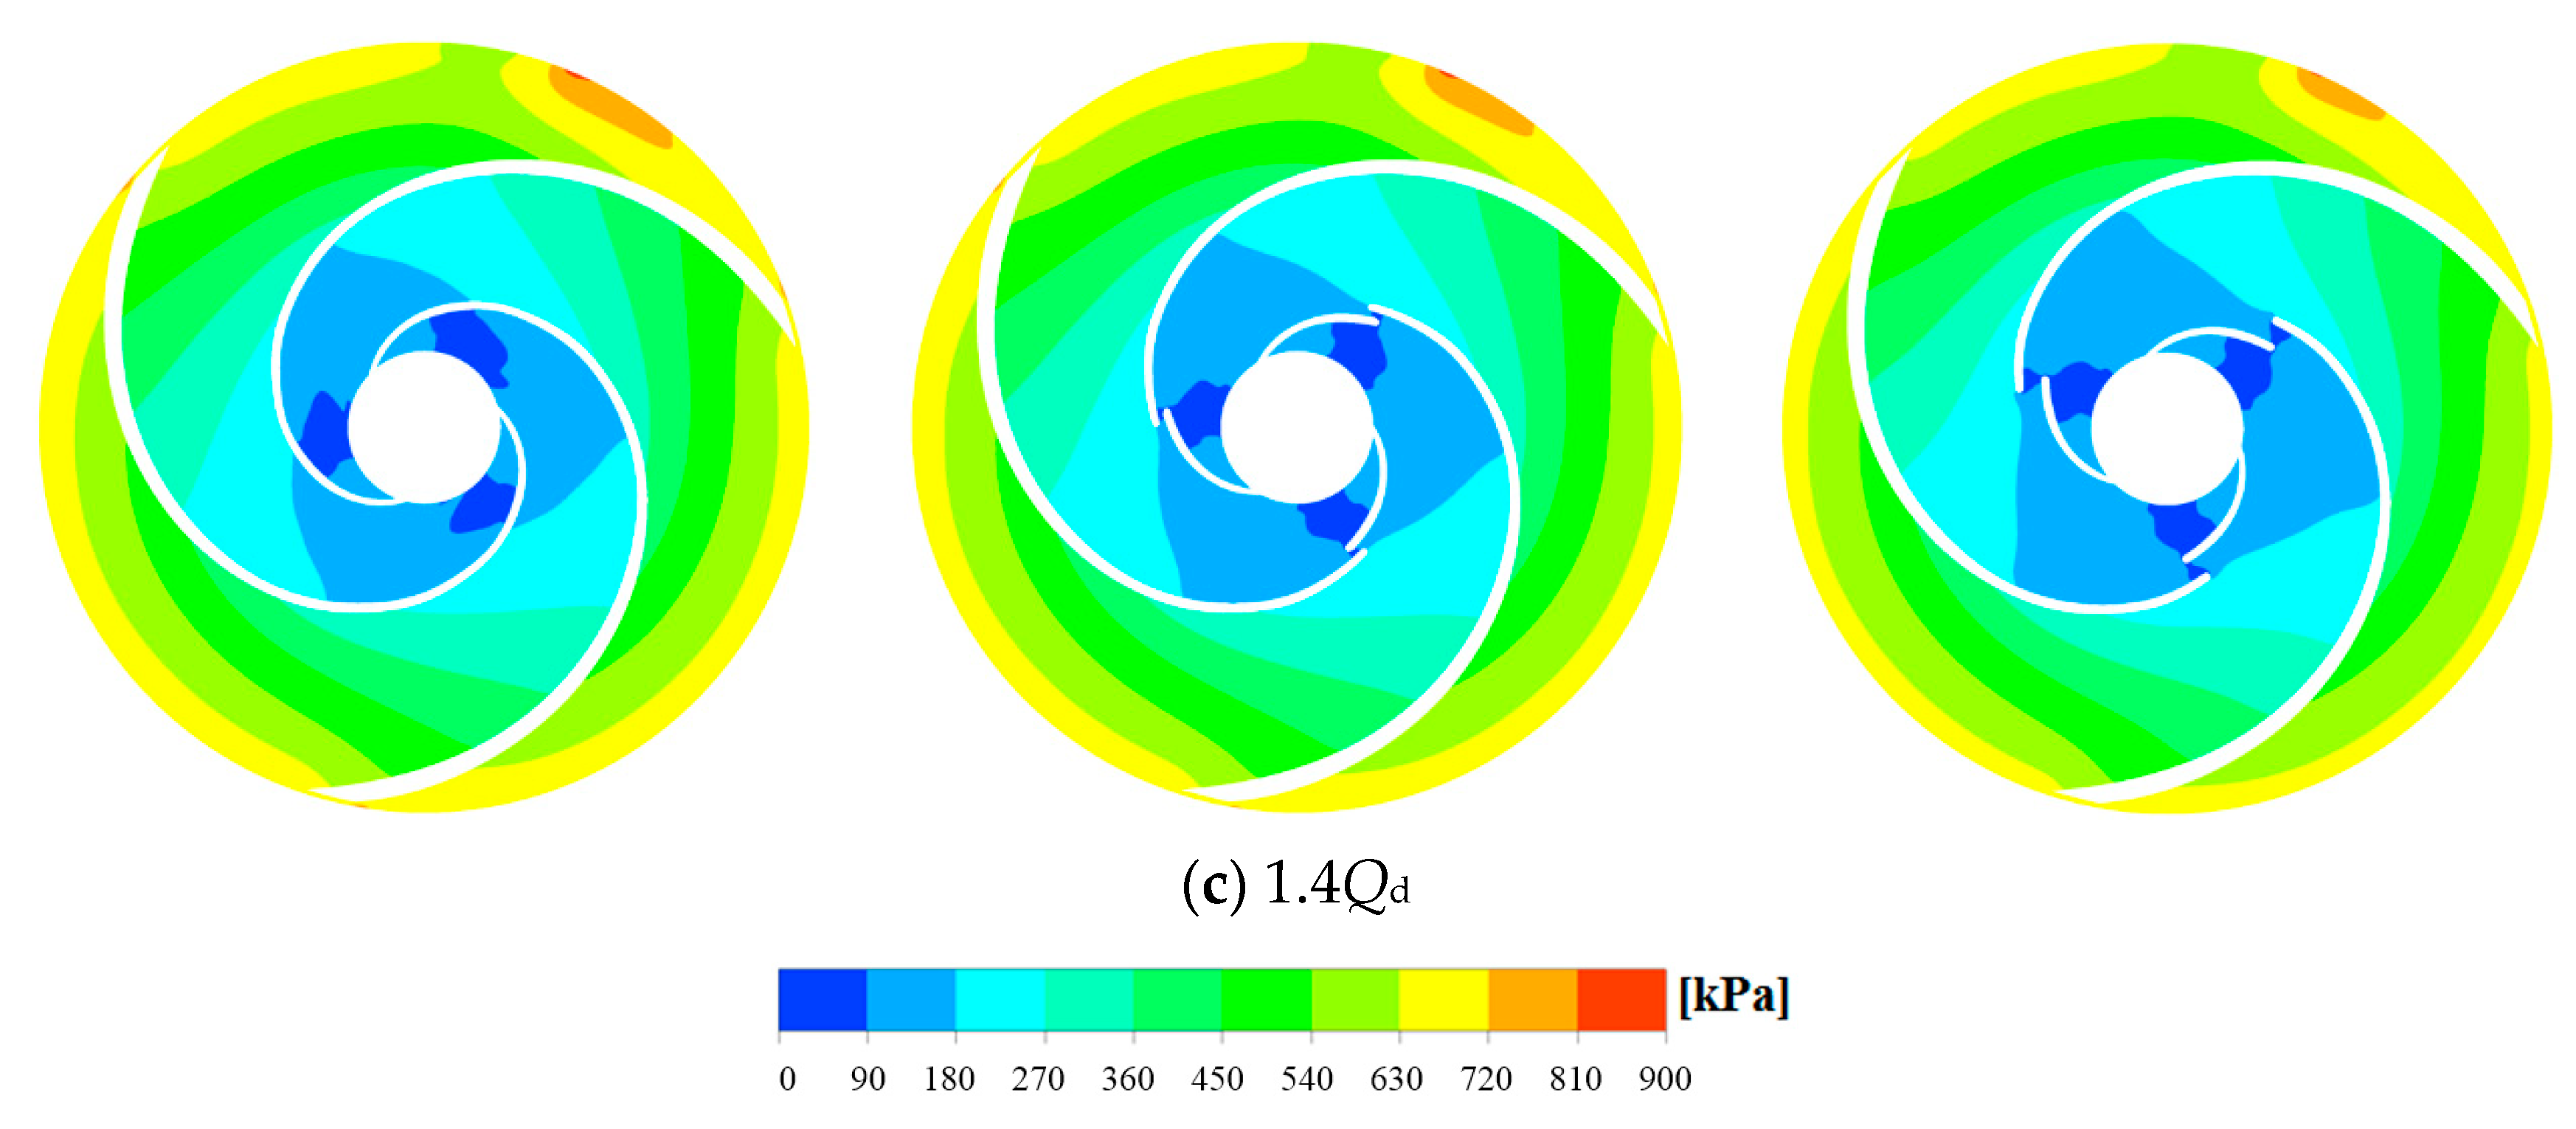
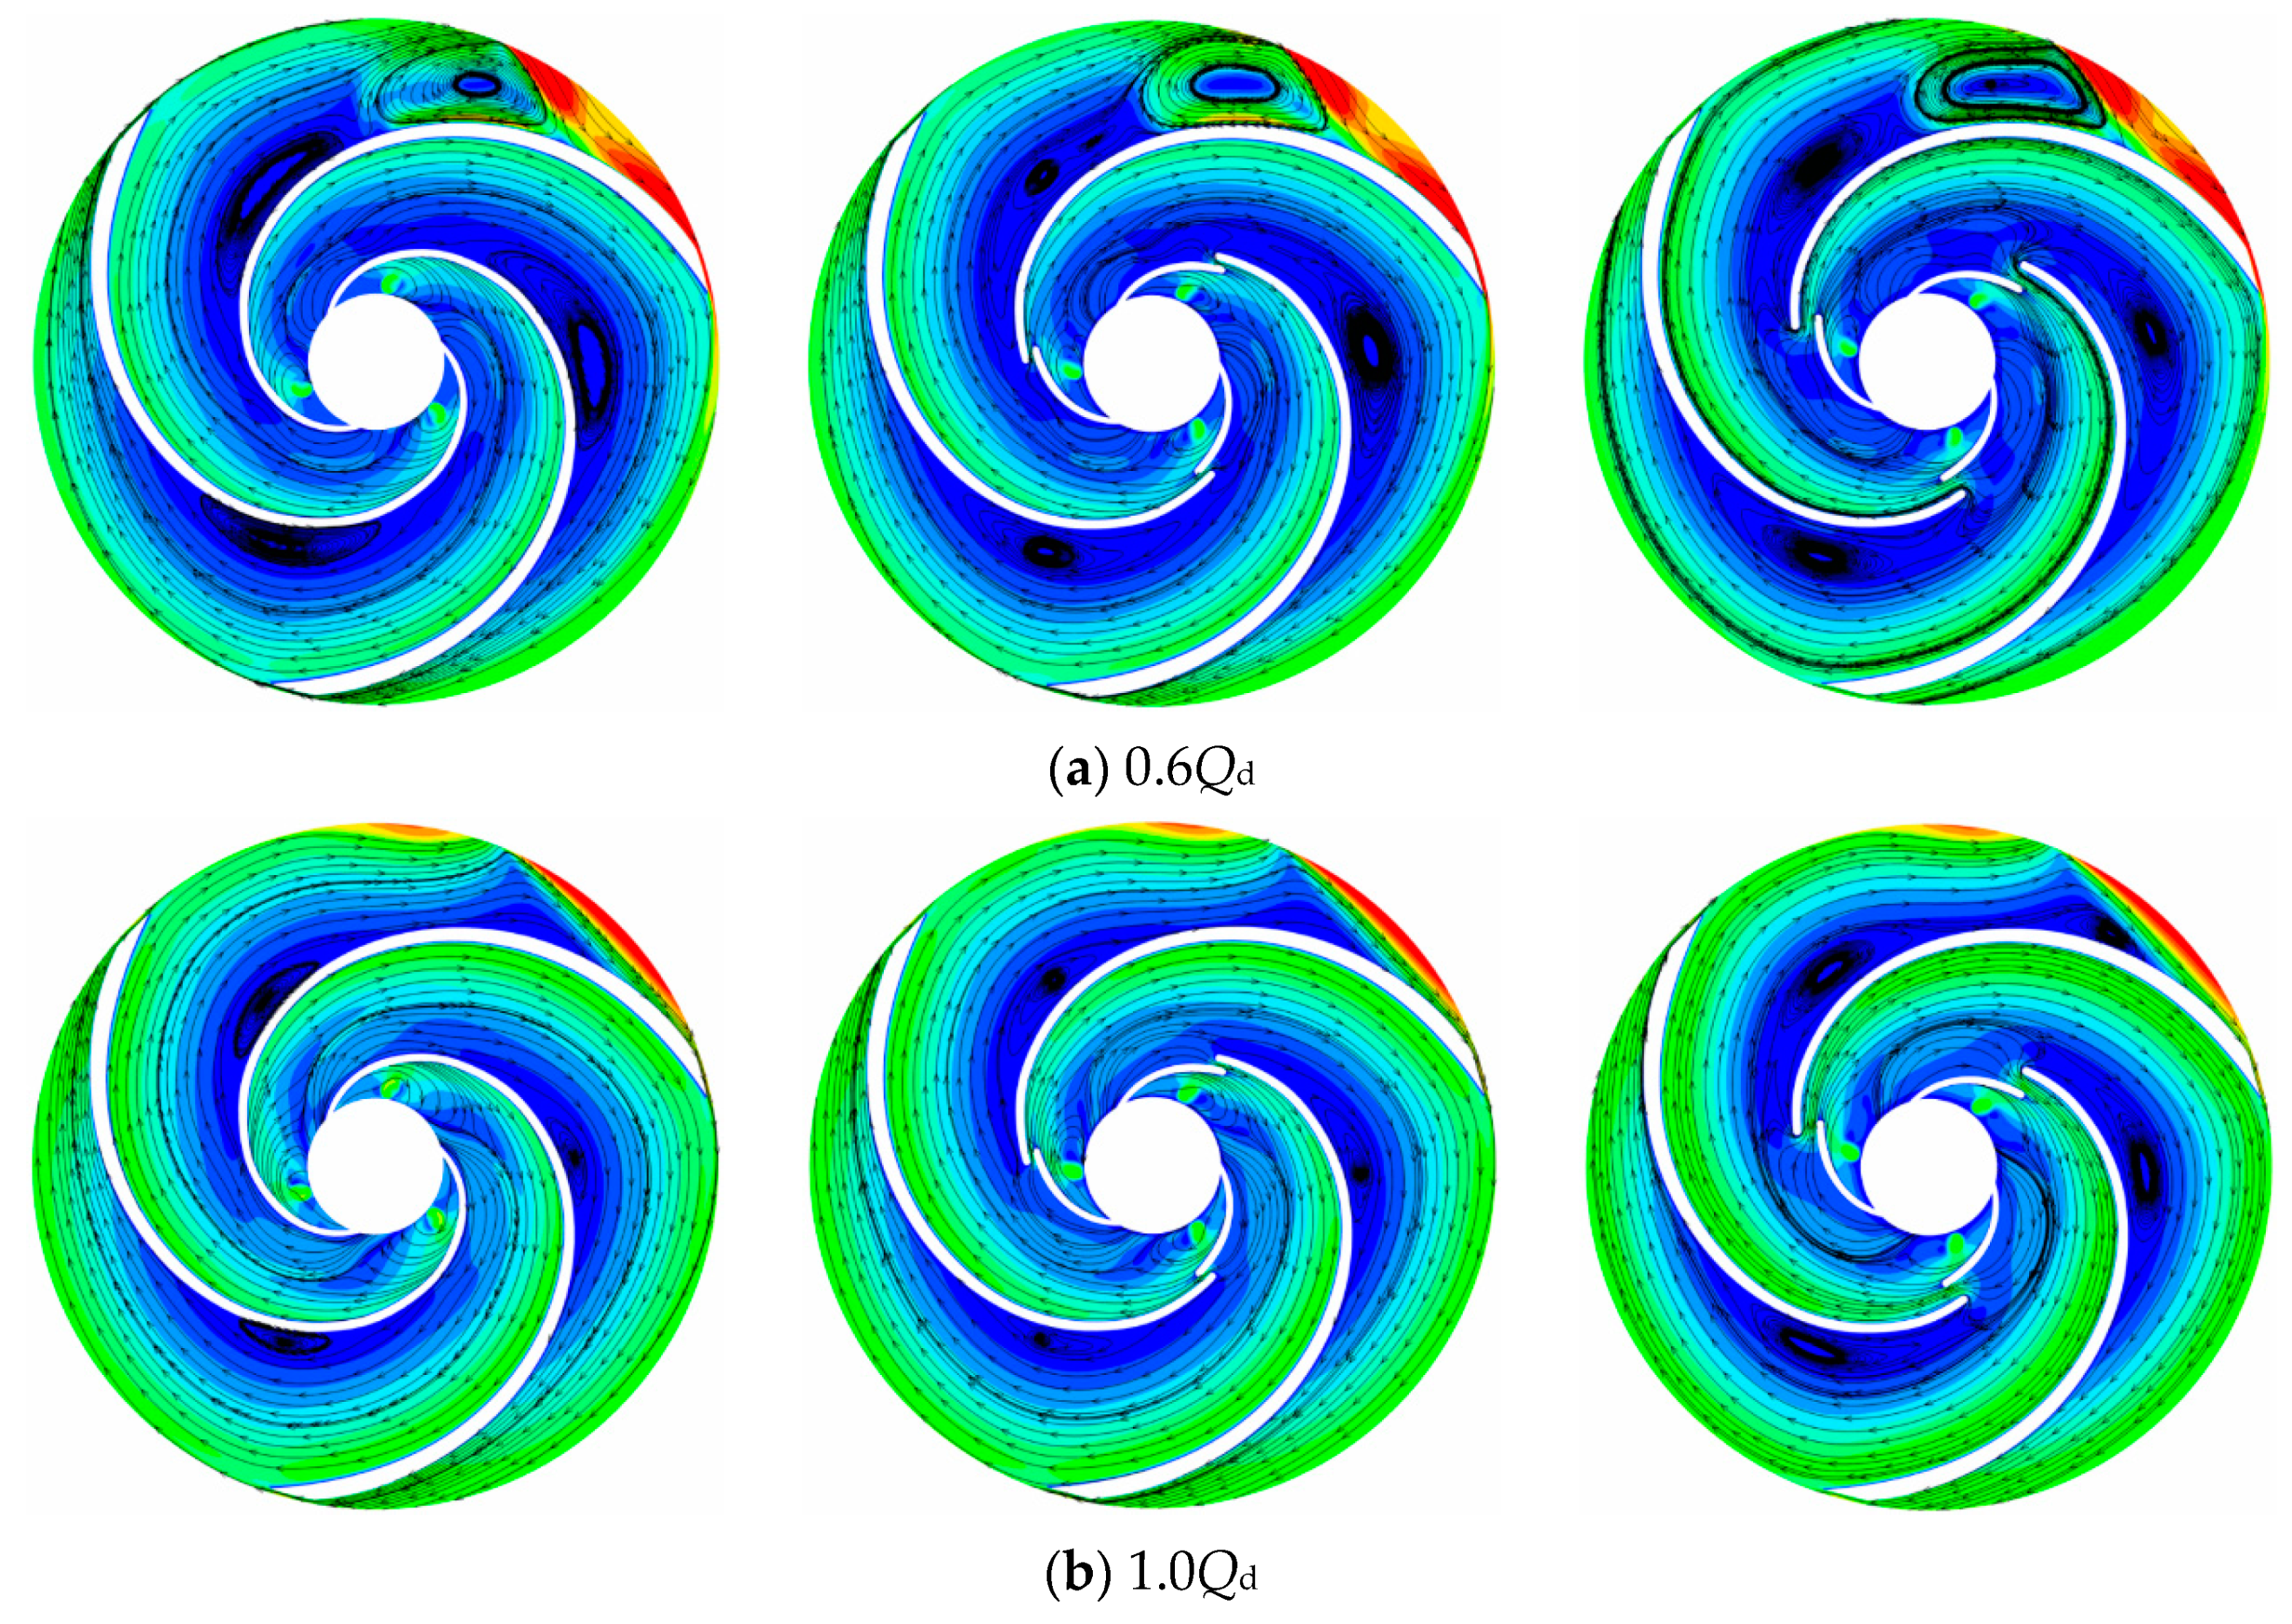
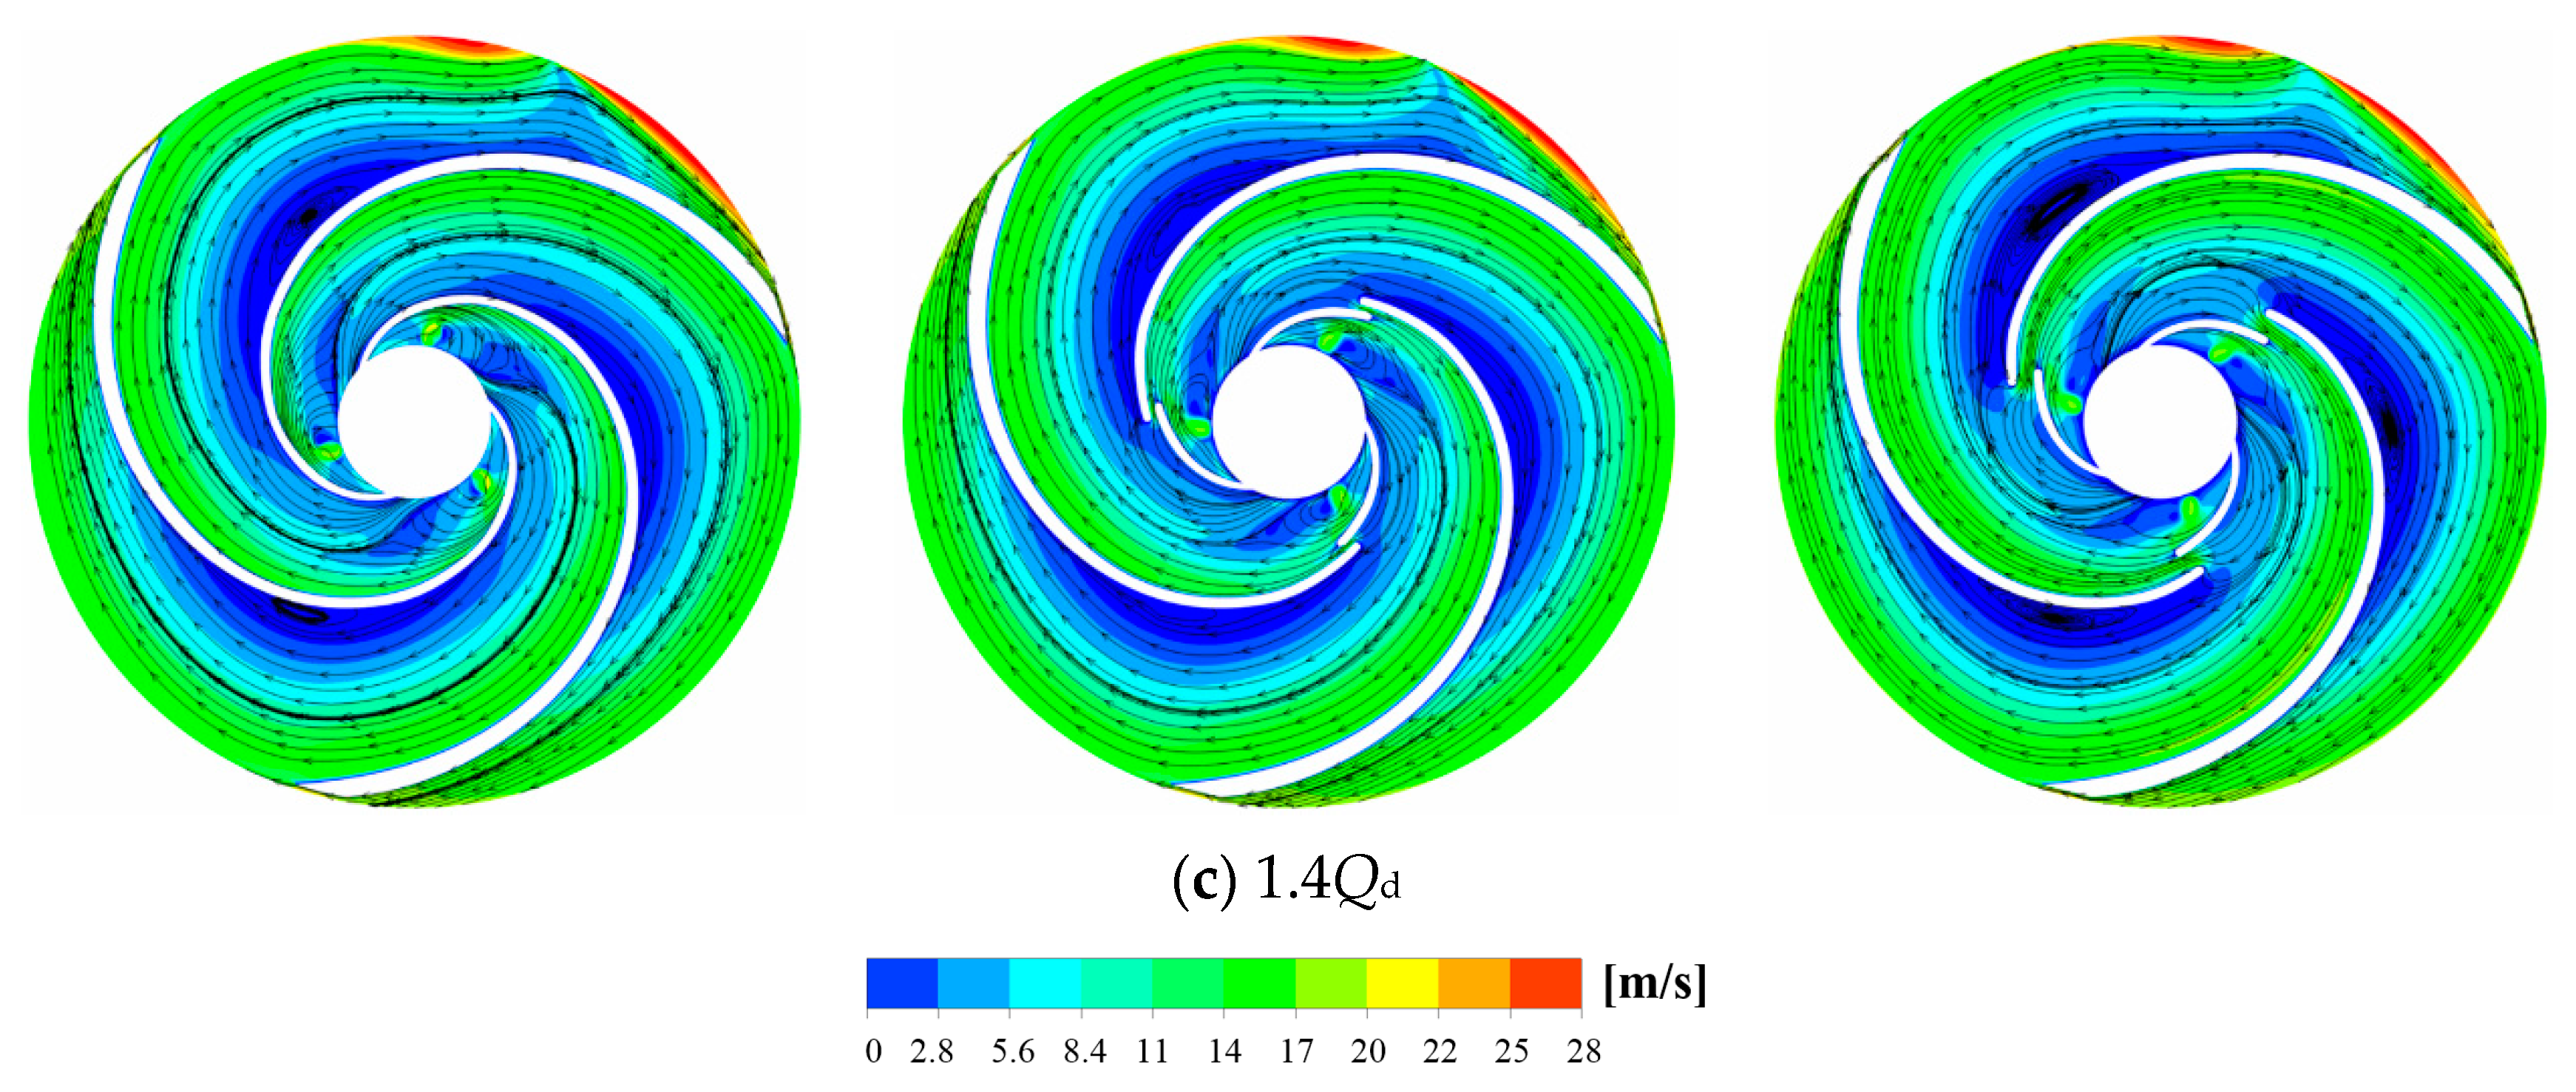
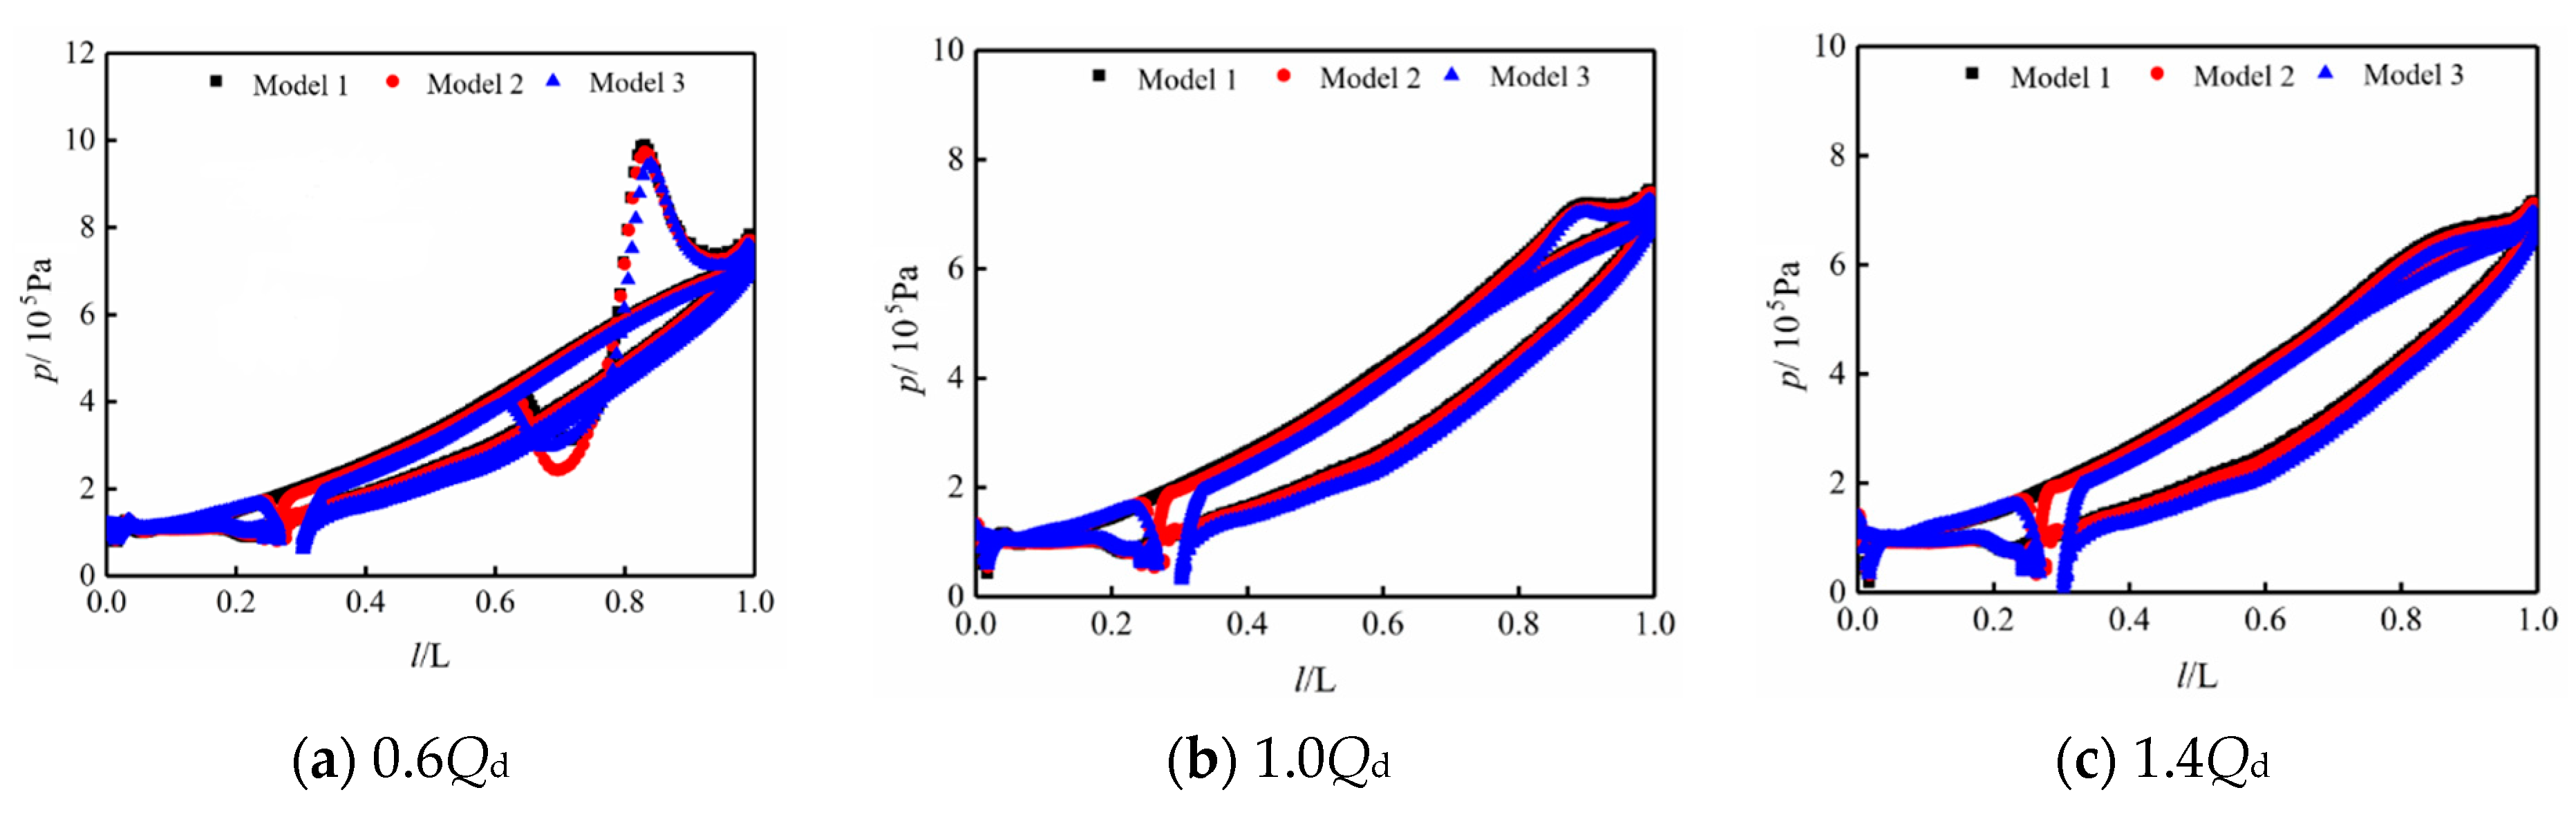
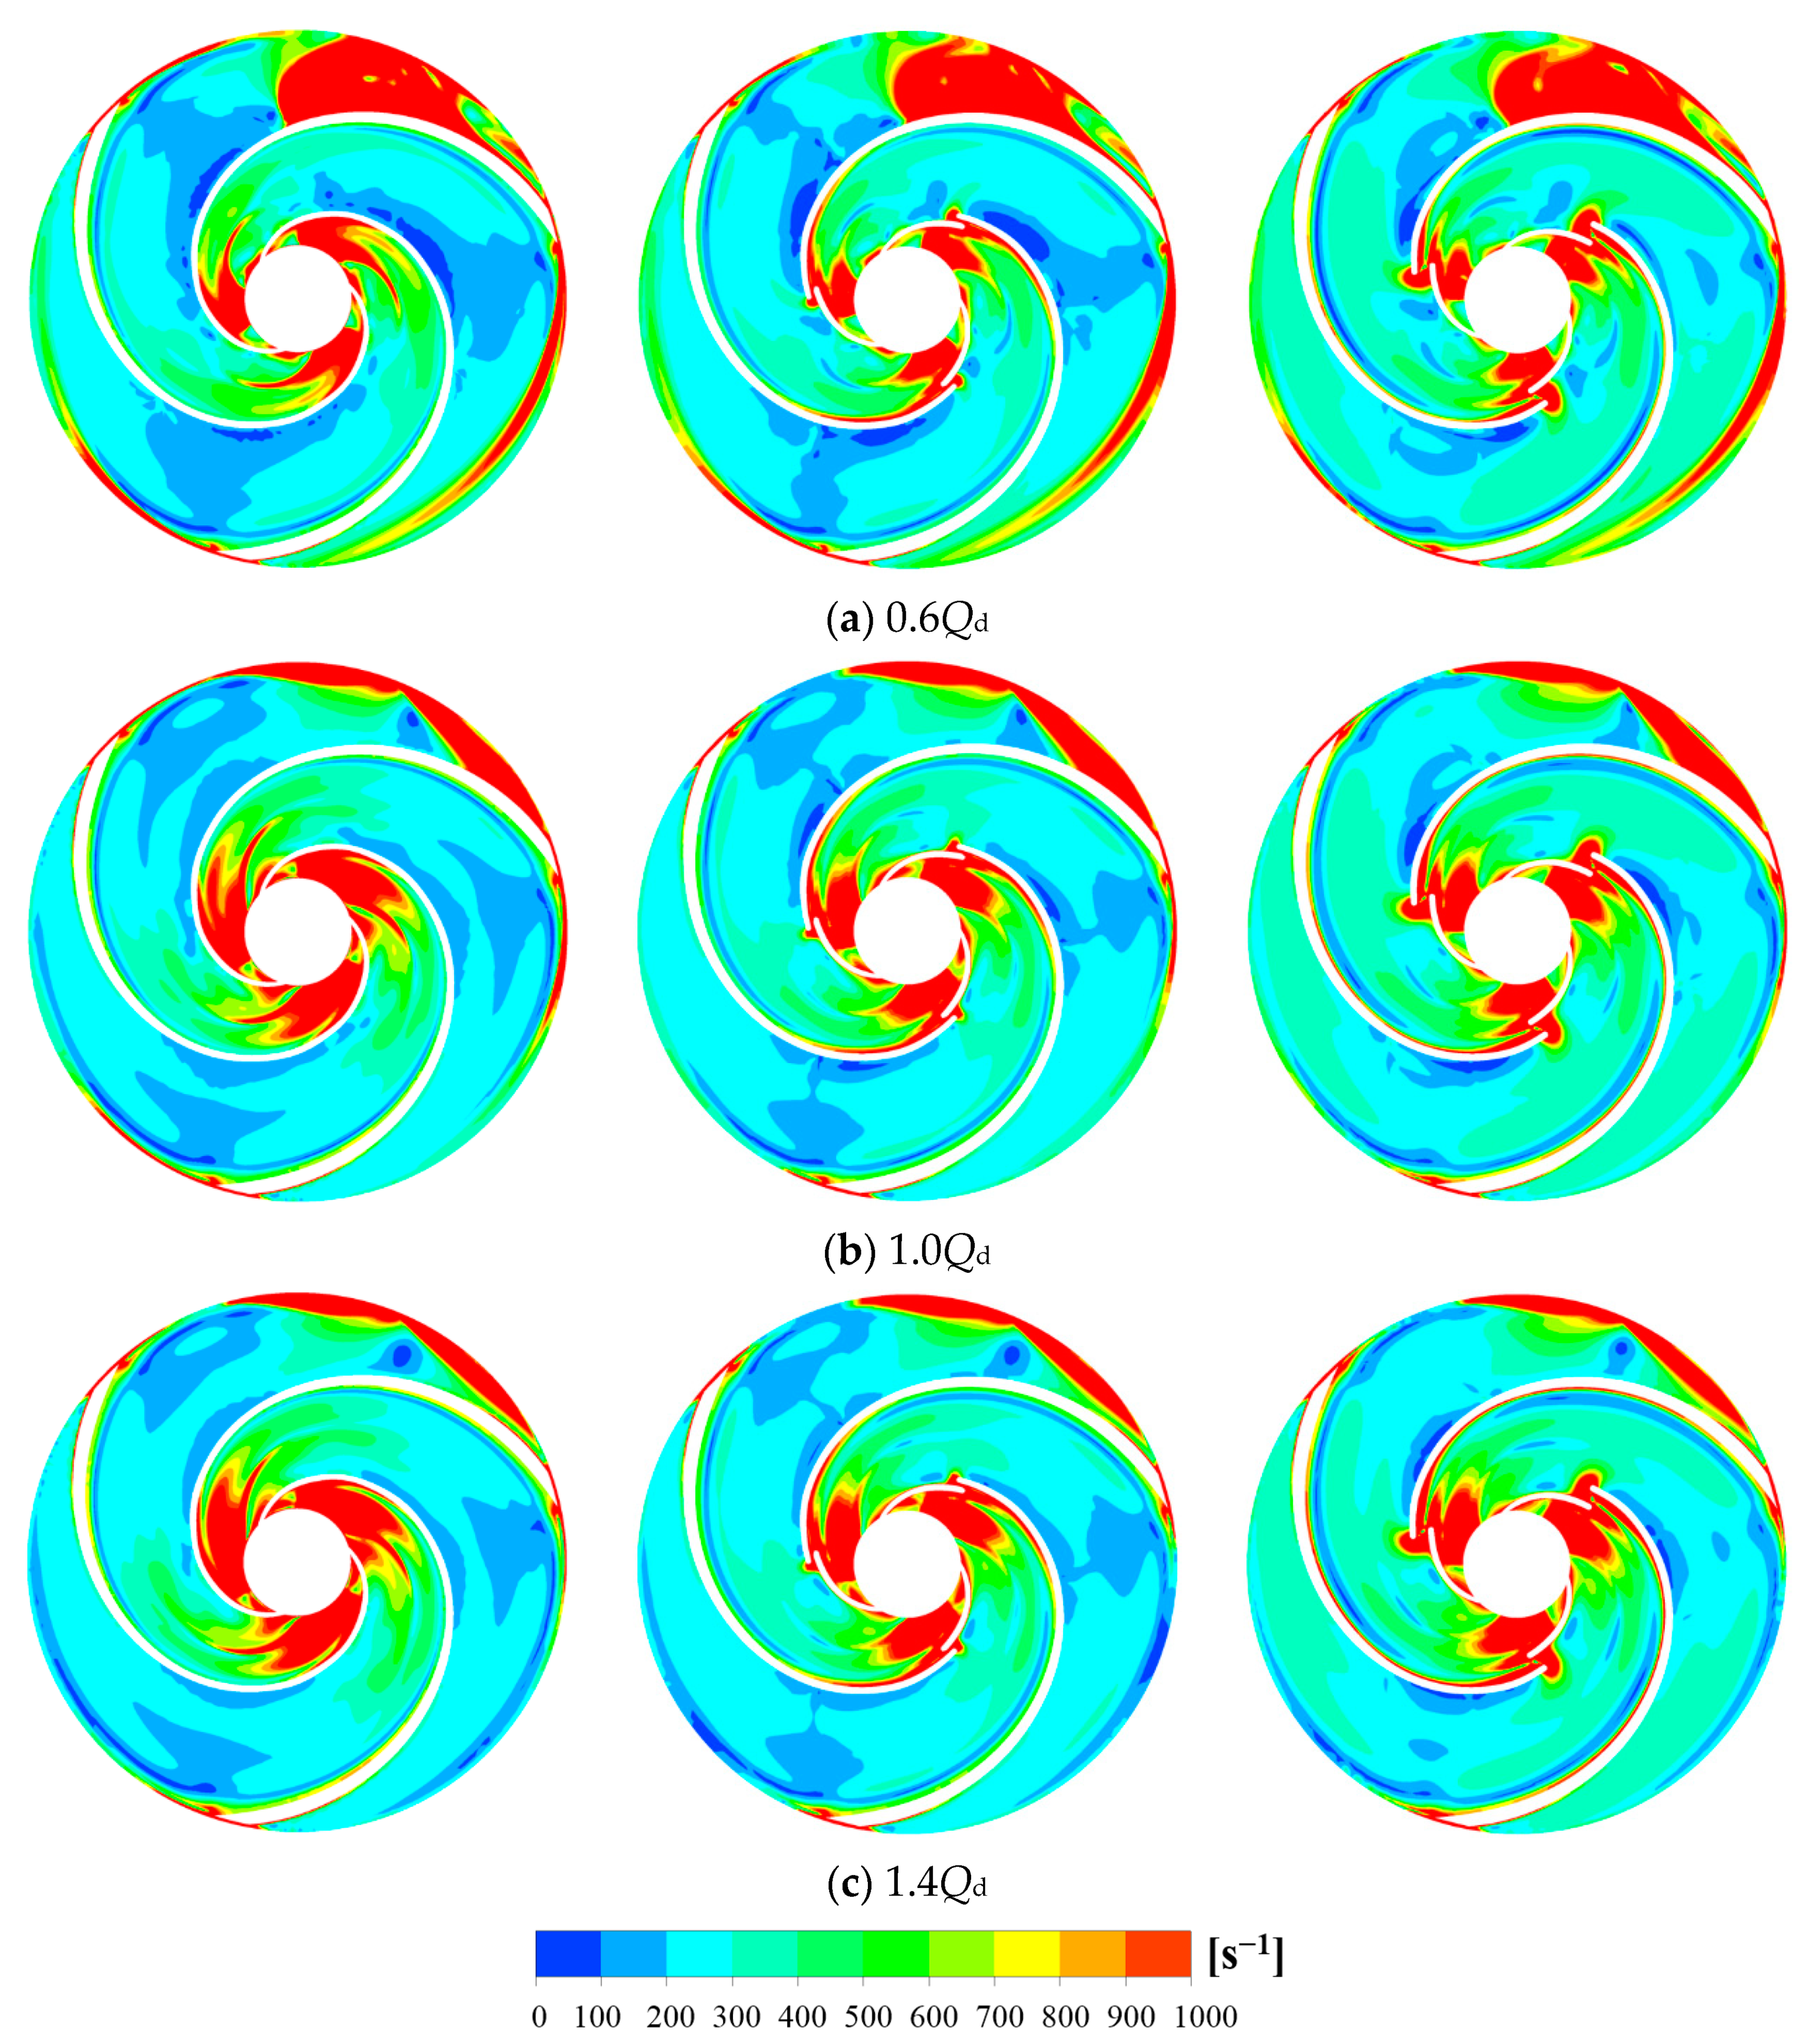
The gap drainage impeller could reduce the occurrence of turbulent vortex in the impeller flow passage and energy loss. Thereby, its hydraulic performance was improved. The gap drainage structure could make the high-pressure liquid on the pressure surface of the blade flow to the suction surface through the gap, which increased the liquid pressure on the suction surface and inhibited the development of the low-pressure area at the impeller inlet. When the gap width was too large, the high-pressure leakage flow rate was too large, which could cause that the impeller outlet pressure and head were decreased.

Author Contributions

Conceptualization, Y.W. and Y.Y.; methodology, L.Z.; software, Y.Y.; validation, Y.W., Y.Y. and G.H.; formal analysis, L.J.; investigation, Y.Y.; resources, G.H.; data curation, L.J.; writing—original draft preparation, Y.W.; writing—review and editing, L.Z. and L.J.; visualization, L.J.; supervision, W.S.; project administration, W.S.; funding acquisition, L.Z. and G.H. All authors have read and agreed to the published version of the manuscript.

Funding

This work was supported by the China Postdoctoral Science Foundation (Grant No. 2020M681520), and Jiangsu Planned Projects for Postdoctoral Research Funds (Grant No. 2020Z031), Jiangsu Province Universities Natural Sciences Foundation (Grant No. 20KJB570002), and the Open Research Subject of Key Laboratory of Fluid and Power Machinery (Xihua University), Ministry of Education (Grant No. LTDL2020-003).

Institutional Review Board Statement

Not applicable.

Informed Consent Statement

Not applicable.

Data Availability Statement

Not applicable.

Conflicts of Interest

The authors declare no conflict of interest.

Nomenclature

Qvolumetric flow rate
Hhead
nrotating speed
nsspecific speed
Nimpeller blade number
φblades wrap angle
dHimpeller hub diameter
dSimpeller shroud diameter
d1impeller diameter
b1impeller outlet width
d2volute inlet diameter
b2volute inlet width
doutvolute outlet diameter
Dgapgap diameter
Lgapblade lap length
Egapgap width
p1pump inlet pressure
p2pump outlet pressure
V1pump inlet velocity
V2pump outlet velocity
Z1pump inlet height
Z2pump outlet height
P1numerical hydraulic power
P2numerical shaft power
P3motor input power
η1numerical hydraulic efficiency
η2experimental hydraulic efficiency
ρmedium density
gacceleration of gravity
Umotor voltage
Imotor current

References

  1. Jafarzadeh, B.; Hajari, A.; Alishahi, M.; Akbari, M. The flow simulation of a low-specific-speed high-speed centrifugal pump. Appl. Math. Model. 2011, 35, 242–249. [Google Scholar] [CrossRef]
  2. Zhou, L.; Wang, W.; Hang, J.; Shi, W.; Yan, H.; Zhu, Y. Numerical investigation of a high-speed electrical submersible pump with different end clearances. Water 2020, 12, 1116. [Google Scholar] [CrossRef] [Green Version]
  3. Yang, Y.; Zhou, L.; Shi, W.; He, Z.; Xiao, Y. Interstage difference of pressure pulsation in a three-stage electrical submersible pump. J. Pet. Sci. Eng. 2020, 196, 107653. [Google Scholar] [CrossRef]
  4. Choi, Y.D.; Kurokawa, J.; Matsui, J. Performance and internal flow characteristics of a very low specific speed centrifugal pump. AMSE J. Fluids Eng. 2006, 128, 341–349. [Google Scholar] [CrossRef]
  5. Veselov, V. Effect of the outlet angle β2 on the characteristics of low specific-speed centrifugal pumps. Hydrotech. Constr. 1982, 16, 267–273. [Google Scholar] [CrossRef]
  6. Liu, Z.; Xu, H.; Lu, W.; Chen, T. Influence of diameter of rear sealing ring on axial force characteristics of centrifugal pump. J. Drain. Irrig. Mach. Eng. 2020, 38, 115–120. [Google Scholar]
  7. Detert, O.; van Der, S.; Kruyt, N.; van Der, Z. Prediction of the effect of impeller trimming on the hydraulic performance of low specific-speed centrifugal pumps. AMSE J. Fluids Eng. 2018, 140, 081202. [Google Scholar] [CrossRef]
  8. Zhou, L.; Shi, W.; Li, W.; Agarwal, R. Numerical and experimental study of axial force and hydraulic performance in a deep-well centrifugal pump with different impeller rear shroud radius. AMSE J. Fluids Eng. 2013, 135, 104501–104508. [Google Scholar] [CrossRef]
  9. Kagawa, S.; Kurokawa, J.; Matsui, J.; Choi, Y. Performance of very low specific speed centrifugal pumps with circular casing. J. Fluid Sci. Technol. 2007, 2, 130–138. [Google Scholar] [CrossRef]
  10. Friedrichs, J.; Kosyna, G. Rotating cavitation in a centrifugal pump impeller of low specific speed. AMSE J. Fluids Eng. 2002, 124, 356–362. [Google Scholar] [CrossRef]
  11. Kelder, J.; Dijkers, R.; Van Esch, B.; Kruyt, B. Experimental and theoretical study of the flow in the volute of a low specific-speed pump. Fluid Dyn. Res. 2001, 28, 267. [Google Scholar] [CrossRef]
  12. Šavar, M.; Kozmar, H.; Sutlović, I. Improving centrifugal pump efficiency by impeller trimming. Desalination 2009, 249, 654–659. [Google Scholar] [CrossRef]
  13. Alemi, H.; Nourbakhsh, S.; Raisee, M.; Najafi, A. Effects of volute curvature on performance of a low specific-speed centrifugal pump at design and off-design conditions. ASME J. Turbomach. 2015, 137, 041009. [Google Scholar] [CrossRef]
  14. Visser, F.; Brouwers, J.; Jonker, J. Fluid flow in a rotating low-specific-speed centrifugal impeller passage. Fluid Dyn. Res. 1999, 24, 275. [Google Scholar] [CrossRef]
  15. Pang, Q.; Jiang, X.; Zhu, J.; Wu, G.; Wang, X.; Wang, L. Influences of radial clearance between impeller and diffuser on flow field in side chambers of multistage centrifugal pump. J. Drain. Irrig. Mach. Eng. 2019, 37, 580–586. [Google Scholar]
  16. Nie, C.; Xu, G.; Cheng, X.; Chen, J. Micro air injection and its unsteady response in a low-speed axial compressor. Turbo Expo Power Land Sea Air 2002, 3610, 343–352. [Google Scholar]
  17. Culley, D.E.; Bright, M.M.; Prahst, P.S.; Strazisar, A. Active flow separation control of a stator vane using embedded injection in a multistage compressor experiment. ASME J. Turbomach. 2004, 126, 24–34. [Google Scholar] [CrossRef]
  18. Gupta, A.; Alsultan, A.; Amano, R.; Kumar, S.; Welsh, A. Design and analysis of wind turbine blades: Winglet, tubercle, and slotted. Turbo Expo: Power for Land, Sea, and Air. Am. Soc. Mech. Eng. 2013, 55294, 1–10. [Google Scholar]
  19. Zhu, B.; Chen, H. Cavitating suppression of low specific speed centrifugal pump with gap drainage blades. J. Hydrodyn. 2012, 24, 729–736. [Google Scholar] [CrossRef]
  20. Wang, H.; Long, B.; Wang, C.; Han, C.; Li, L. Effects of the impeller blade with a slot structure on the centrifugal pump performance. Energies 2020, 13, 1628. [Google Scholar] [CrossRef]
  21. Yang, Y.; Zhou, L.; Hang, J.; Du, D.; Shi, W.; He, Z. Energy characteristics and optimal design of diffuser meridian in an electrical submersible pump. Renew. Energy 2020, 167, 718–727. [Google Scholar] [CrossRef]
  22. Zhou, L.; Han, C.; Bai, L.; Li, W.; El-Emam, M.; Shi, W. CFD-DEM bidirectional coupling simulation and experimental investigation of particle ejections and energy conversion in a spouted bed. Energy 2020, 211, 118672. [Google Scholar] [CrossRef]
  23. Zhou, L.; Deshpande, K.; Zhang, X.; Agarwal, R. Process simulation of chemical looping combustion using ASPEN plus for a mixture of biomass and coal with various oxygen carriers. Energy 2020, 195, 116955. [Google Scholar] [CrossRef]
  24. Peng, G.; Huang, X.; Zhou, L.; Zhou, G.; Zhou, H. Solid-liquid two-phase flow and wear analysis in a large-scale centrifugal slurry pump. Eng. Fail. Anal. 2020, 114, 104602. [Google Scholar] [CrossRef]
  25. Li, W.; Li, E.; Ji, L.; Zhou, L.; Shi, W.; Zhu, Y. Mechanism and propagation characteristics of rotating stall in a mixed-flow pump. Renew. Energy 2020, 153, 74–92. [Google Scholar] [CrossRef]
  26. Zhou, L.; Bai, L.; Li, W.; Shi, W.; Wang, C. PIV validation of different turbulence models used for numerical simulation of a centrifugal pump diffuser. Eng. Comput. 2018, 35, 2–17. [Google Scholar] [CrossRef]
  27. Yan, H.; Su, X.; Zhang, H.; Hang, J.; Zhou, L.; Liu, Z.; Wang, Z. Design approach and hydrodynamic characteristics of a novel bionic airfoil. Ocean Eng. 2020, 216, 108076. [Google Scholar] [CrossRef]
  28. Shi, W.; Hou, Y.; Zhou, L.; Li, Y.; Xue, S. Numerical simulation and test of performance of deep-well centrifugal pumps with different stages. J. Drain. Irrig. Mach. Eng. 2019, 37, 562–567. [Google Scholar]
  29. Bai, L.; Zhou, L.; Jiang, X.; Pang, Q.; Ye, D. Vibration in a multistage centrifugal pump under varied conditions. Shock Vib. 2019, 2057031, 1–9. [Google Scholar] [CrossRef]
Figure 1. Two-dimensional schematic diagram of the impeller and volute.
Jmse 09 00106 g001
Figure 2. 3D model of full channels.
Jmse 09 00106 g002
Figure 3. Assembly diagram of the calculation domain.
Jmse 09 00106 g003
Figure 4. Grid division of the computing domain.
Jmse 09 00106 g004
Figure 5. Comparison of computational fluid dynamics (CFD) results and test results of different turbulence models.
Jmse 09 00106 g005
Figure 6. Schematic diagram of test facility. 1. Electromagnetic flowmeter. 2. Outlet pipeline gate valve. 3. Water tank. 4. Inlet pipeline gate valve. 5. Inlet pipeline pressure gauge. 6. Centrifugal pump. 7. Motor. 8. Outlet pipeline pressure gauge.
Jmse 09 00106 g006
Figure 7. Test bed.
Figure 7. Test bed.
Jmse 09 00106 g007
Figure 8. Comparison between simulation results and test results.
Jmse 09 00106 g008
Figure 9. Pressure distribution diagram of middle section of impeller. From left to right: Model 1, Model 2, and Model 3.
Jmse 09 00106 g009aJmse 09 00106 g009b
Figure 10. Streamline distribution of middle section of impeller. From left to right: Model 1, Model 2, and Model 3.
Jmse 09 00106 g010aJmse 09 00106 g010b
Figure 11. Surface velocity distribution of 50% impeller height.
Jmse 09 00106 g011
Figure 12. Distribution of shear strain rate in the middle section of impeller. From left to right: Model 1, Model 2, and Model 3.
Jmse 09 00106 g012
Table 1. Geometric specifications of the impeller and volute.
Impeller ParametersVolute Parameters
Number of bladesN = 3Inlet diameterd2 = 131.5 mm
Blades wrap angleφ = 190°Inlet widthb2 = 21 mm
Hub diameterdH = 30.7 mmOutlet diameterdout = 25 mm
Suction diameterdS = 50 mmParametersGap
Impeller diameterd1 = 259 mmGap diameterDgap = 90 mm
Outlet widthb1 = 6.5 mmBlade lap lengthLgap = 5 mm
Model 1Model 2Model 3
Gap widthEgap1 = 0 mmEgap2 = 1.5 mmEgap3 = 6 mm
Table 2. Grid independence analysis.
Number of GridsHead/mEfficiency/%
2,169,71383.5125.57
3,251,49383.3425.98
4,365,84882.5326.73
5,246,21482.4926.92
5,941,36382.5126.74
Table 3. Comparison of hydraulic performance of different schemes.
Flow ConditionsGap Width (mm)H/mη/%
0.6Qd084.719.8
1.584.4920.81
681.2419.84
1.0Qd082.526.7
1.582.3928.62
680.0327
1.4Qd080.632.3
1.580.5434.32
677.5133.06
Publisher’s Note: MDPI stays neutral with regard to jurisdictional claims in published maps and institutional affiliations.

