
Potential Effect of the Intrusion of the Kuroshio Current into the South China Sea on Catches of Japanese Eel (Anguilla Japonica) in the South China Sea and Taiwan Strait


Abstract
1. Introduction
- (1)
- Determine the trend in oceanic environment characteristics, including the velocity and direction of the ocean currents, the sea surface temperature (TS), the Pacific Decadal Oscillation (PDO), the ONI, and recruitment from 1967 to 2019 based on secondary data;
- (2)
- Investigate the trend of the KC intrusion into the SCS in the winter of 2014–2015 (i.e., between November 2014 and February 2015), as well as the changes in fishing sites and catches based on primary data acquired by a research test vessel (RTV) and a civilian fishing vessel (CFV) to determine the association between the changes in the oceanic conditions and the number of A. japonica migrating to the SCS–TS region; and
- (3)
- Examine the association between the intrusion of the KC into the SCS and the TS (i.e., the SCS–TS region) and the changes in catches of larval A. japonica in the traditional fishing ground waters of Gaoping near southwestern Taiwan in the SCS–TS region.
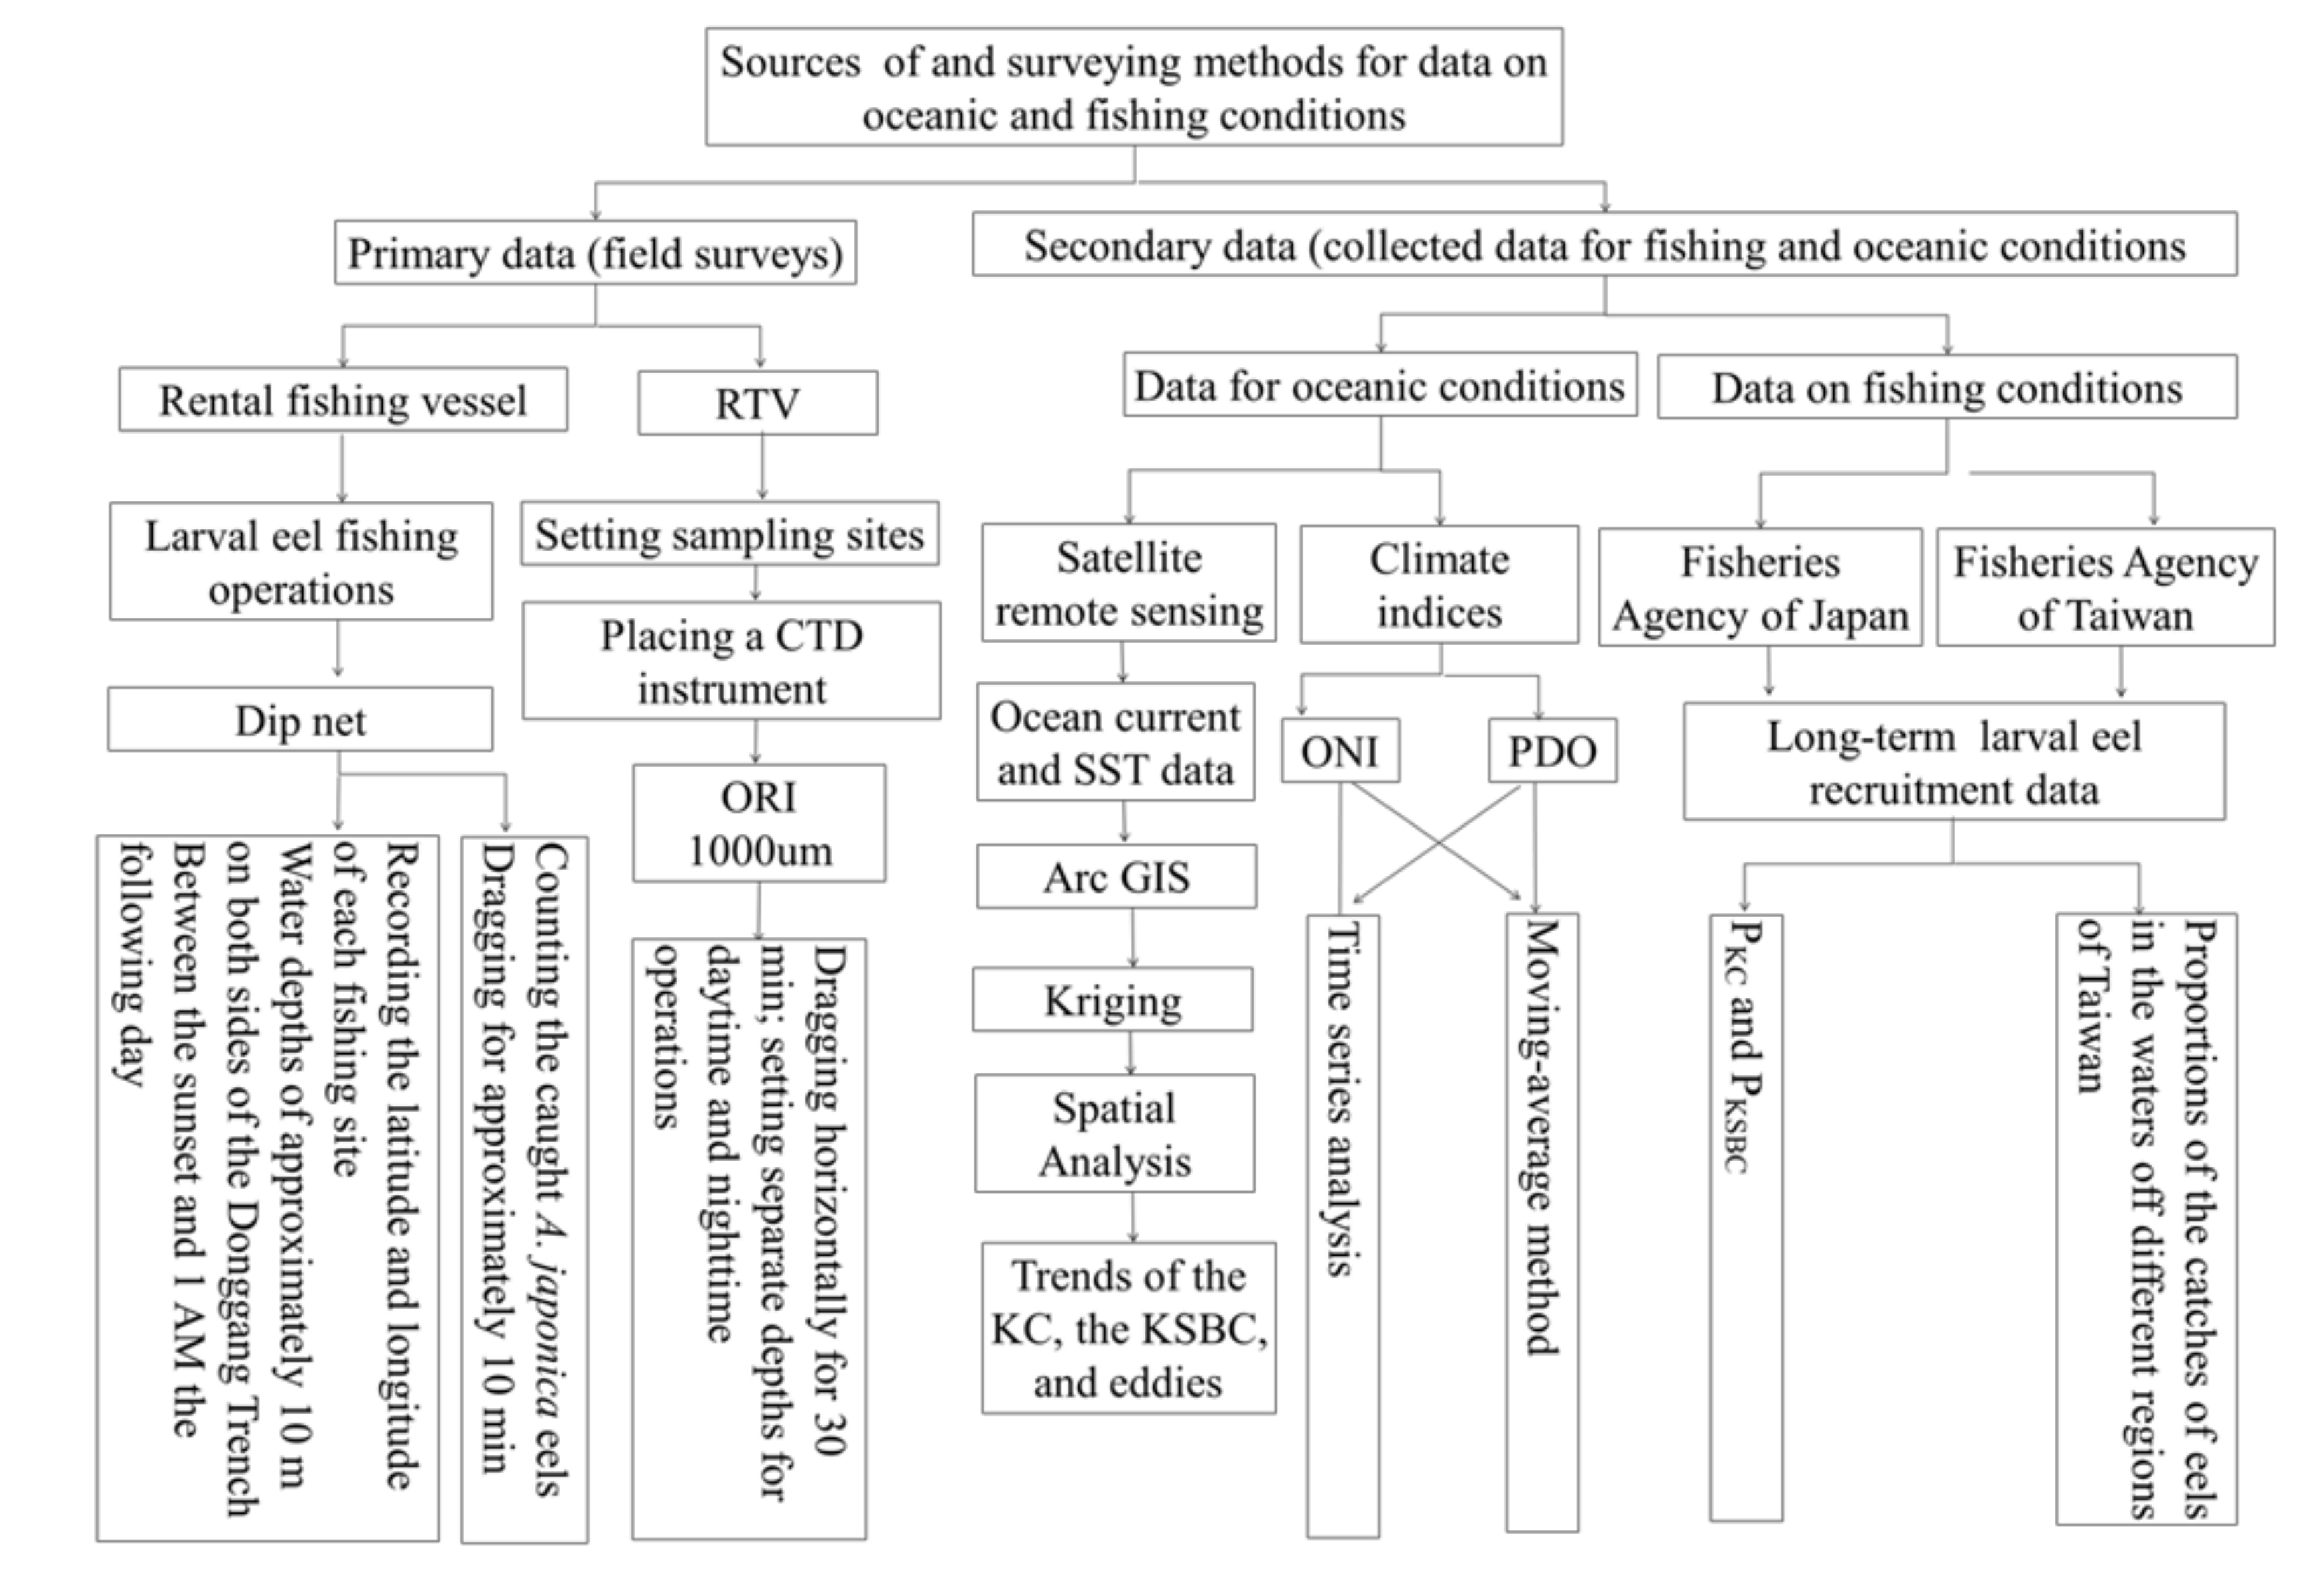
2. Research Methods
2.1. Data for the Oceanic Environment, Fishing, Satellite
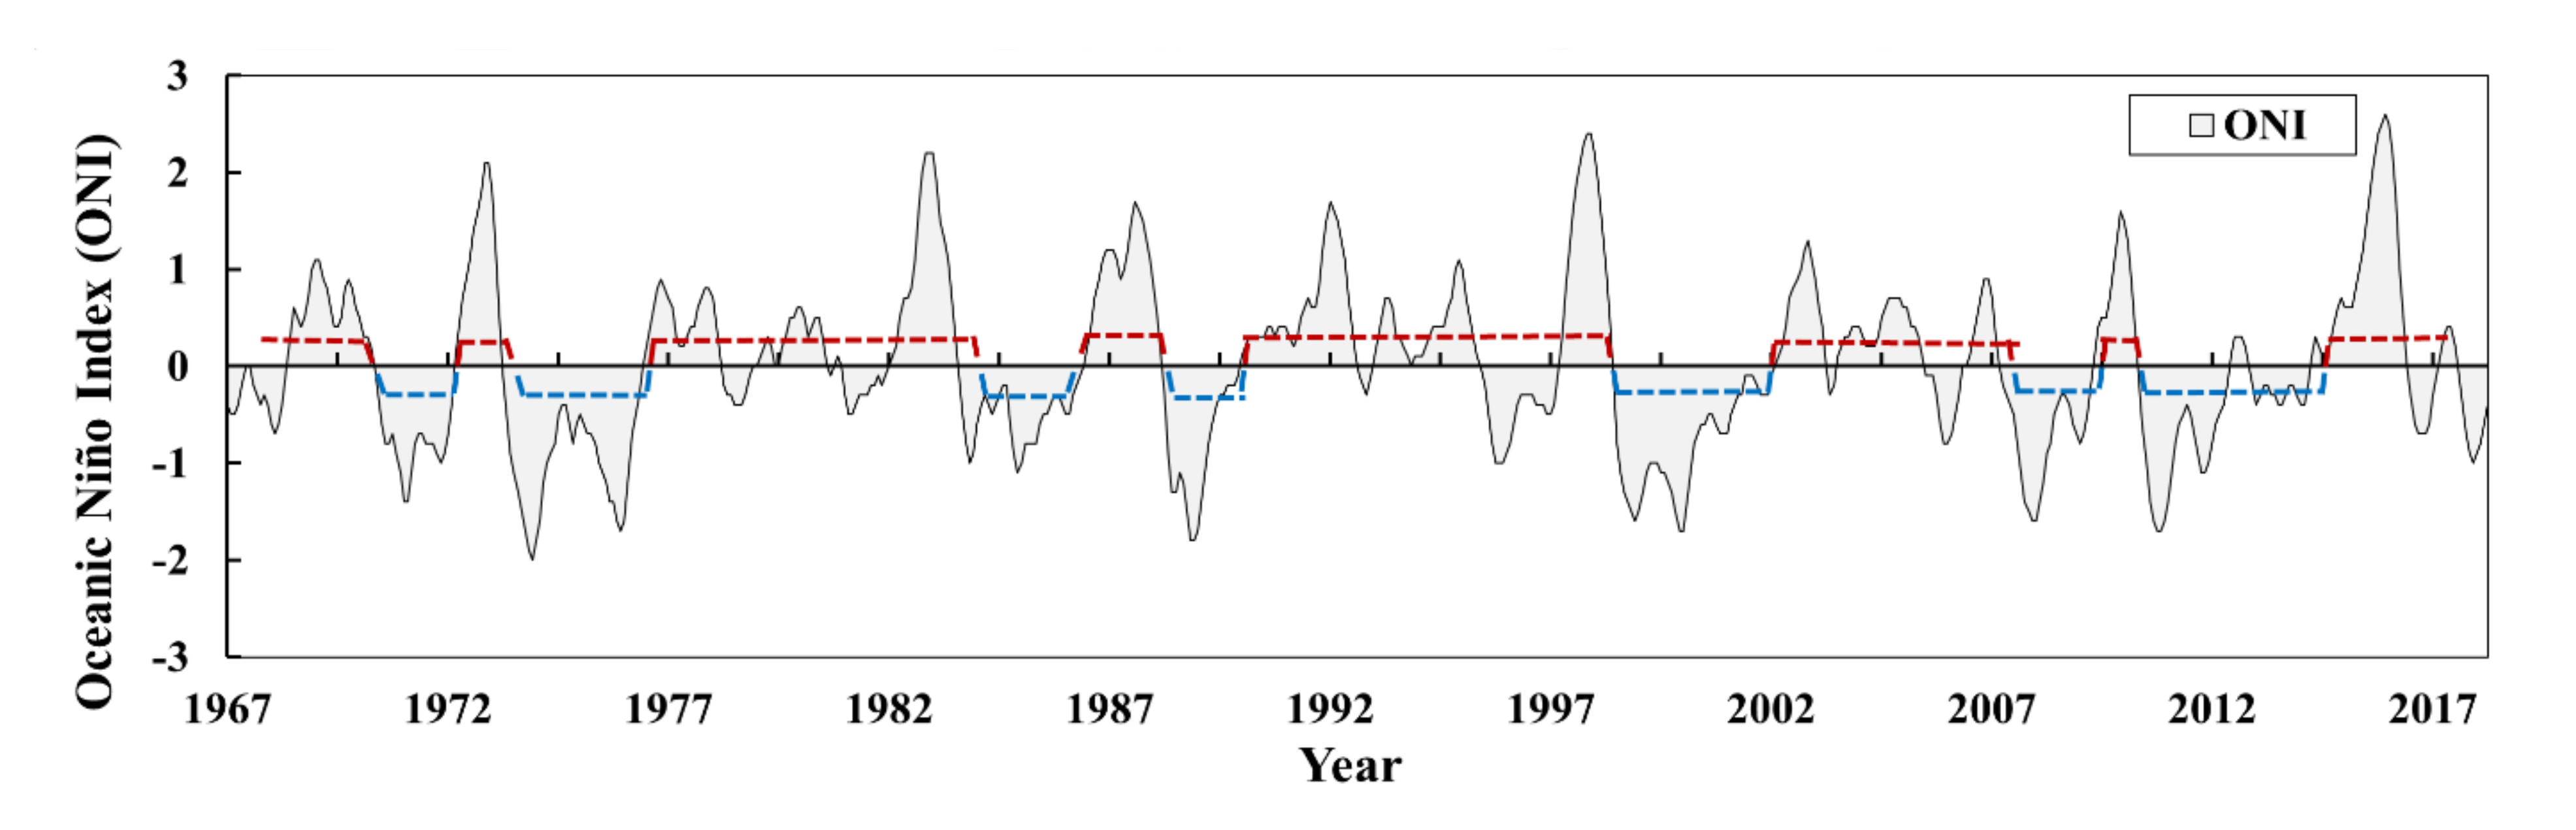
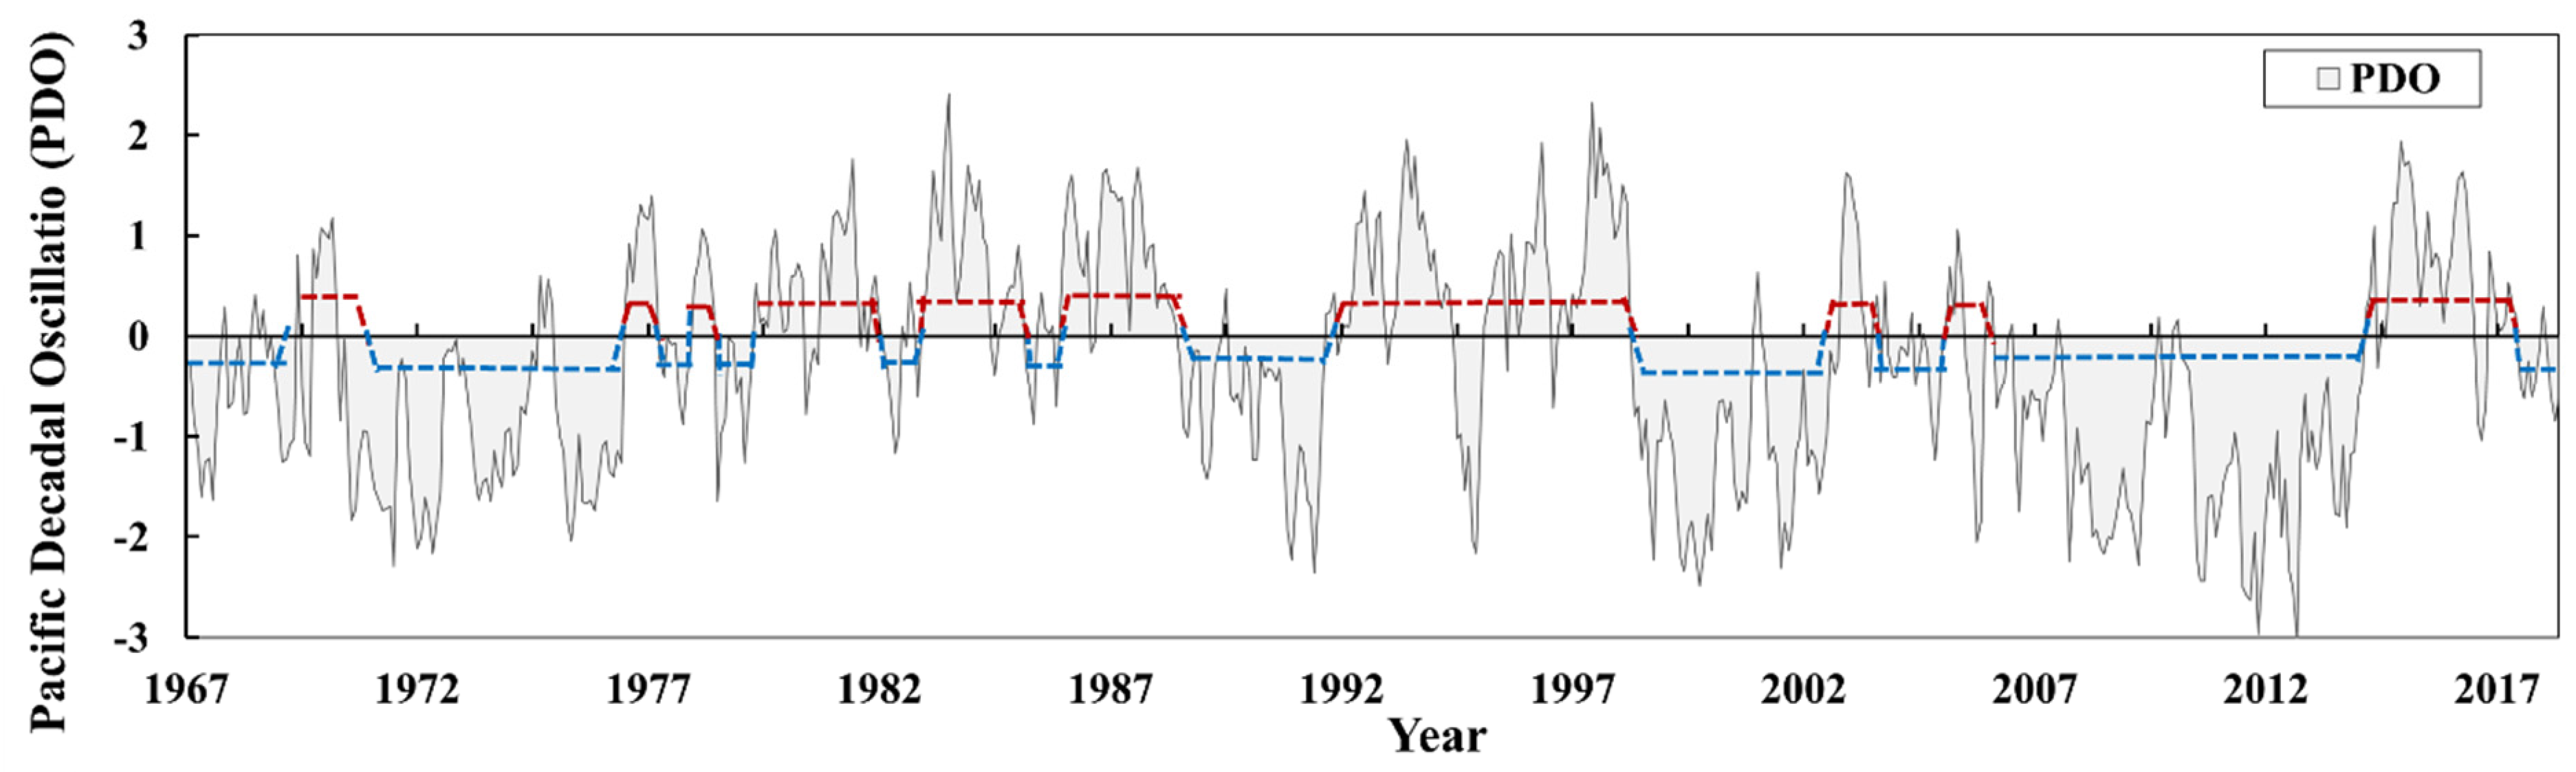
2.1.1. Climate Index Data (ONI and PDO)
2.1.2. Fishing Data
2.1.3. Satellite Data
2.2. Data Analysis Methods
2.2.1. ONI and PDO
2.2.2. Environmental Data
- (1)
- Ocean Currents
- (2)
- SST
2.2.3. Spatial Statistics
2.2.4. Changes in the Catch Ratio between KC and KSBC
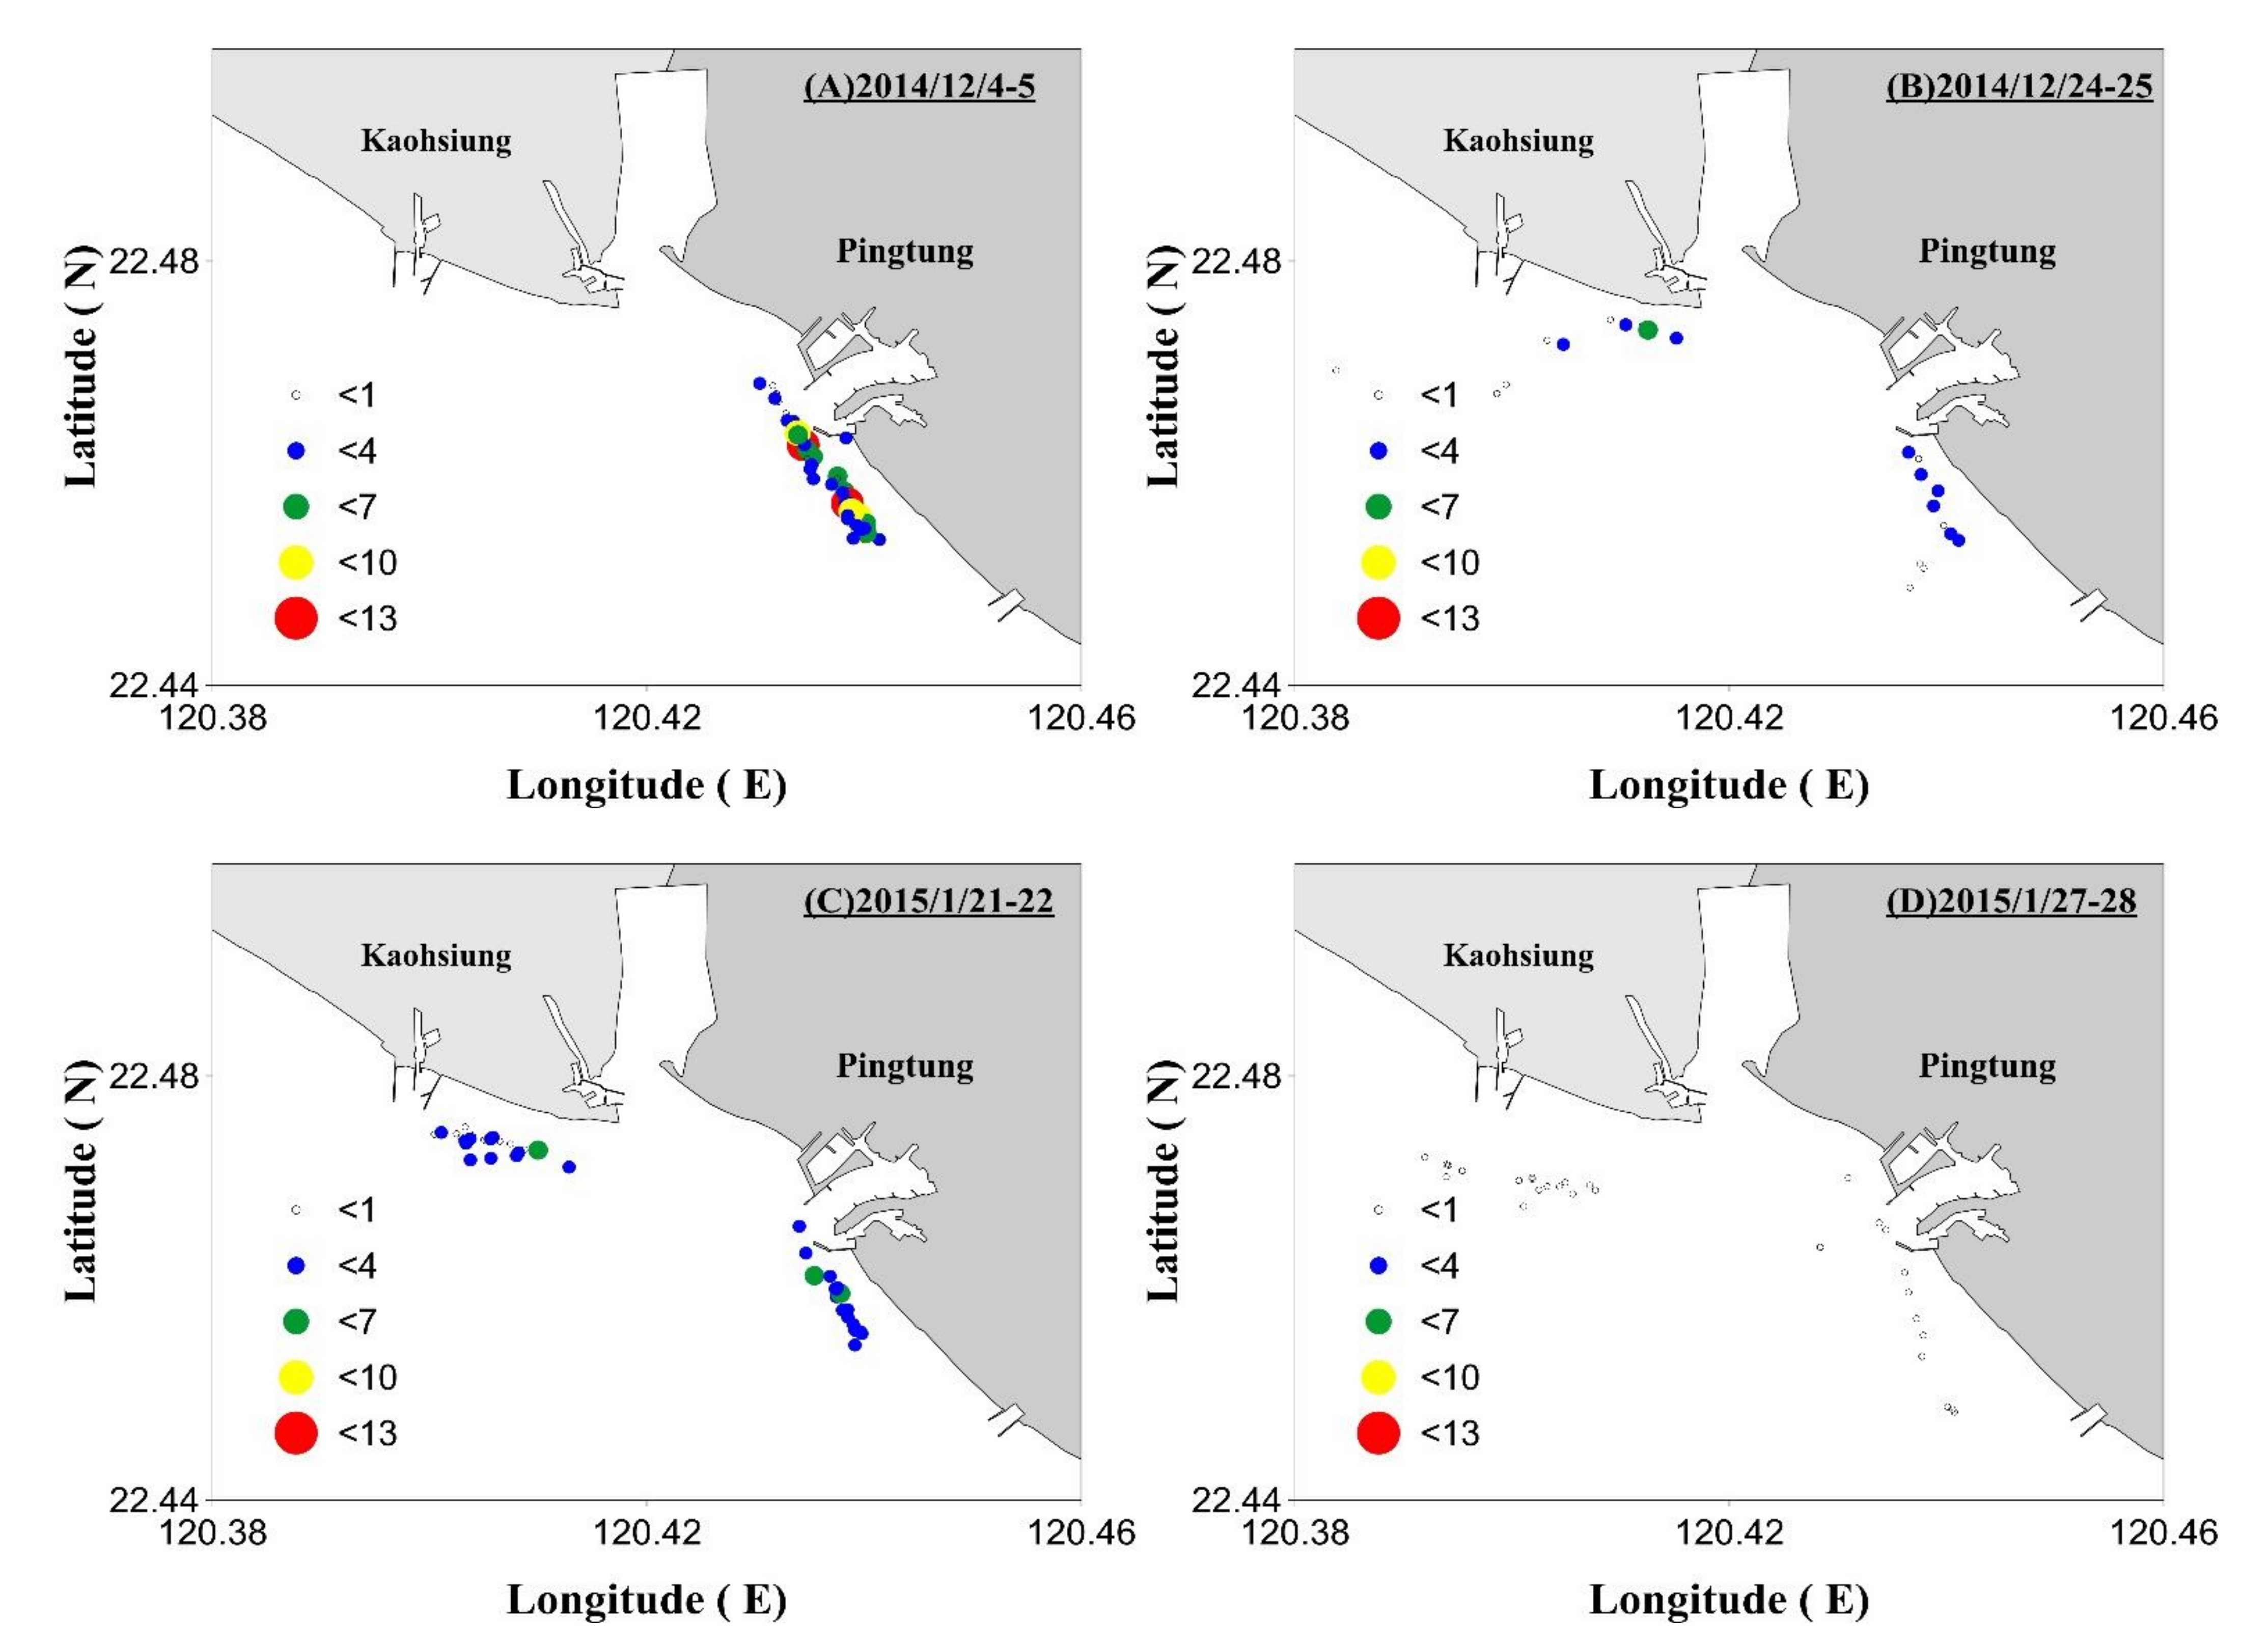
2.2.5. CFV–Borne Field Observations of Fishing Surveys
2.3. Correlation between KBSC Catches and Regional SST, PDO, and ONI
3. Results
3.1. Changes in the Global Climate Regime
3.1.1. Changes in the ONI
3.1.2. Changes in the PDO
3.2. Changes in the Recruitment Proportions of Larval Eels in the Waters through Which the Main KC and KSBC Pass (Main KC Waters and KSBC Waters, Respectively)
3.3. Mesoscale Structural Changes in the Oceanic Environment in the SCS–TS Region
3.3.1. KC Intrusion and Looping Paths
3.3.2. Warm–Core Eddy in the Waters of Southwestern Taiwan
3.4. Field Survey Results
3.4.1. Changes in the Physicochemical Conditions of the Ocean Environment
3.4.2. Changes in the Distribution of the Fishing Sites and A. japonica Catches
3.5. Correlation between Catches and ONI, PDO and Regional SST
4. Discussion and Conclusions
Supplementary Materials
Author Contributions
Funding
Acknowledgments
Conflicts of Interest
Abbreviations
| AFSRT | Annual Fishery Statistics Report of Taiwan | ONI | Oceanic Niño Index |
| CFV | Civilian Fishing Vessel | PDO | Pacific Decadal Oscillation |
| KC | Kuroshio Current | PKC | Proportion of Kuroshio Current |
| KSBC | Kuroshio Branch Current | PKSBC | Proportion of Kuroshio Branch Current |
| LS | Luzon Strait | RTV | Research Test Vessel |
| MODIS | Moderate Resolution Imaging Spectroradiometer | SCS | South China Sea |
| NASA | National Aeronautics and Space Administration | SST | Sea Surface Temperature |
| NEC | North Equatorial Current | SSTA | Sea Surface Temperature Anomaly |
| NOAA | National Oceanic and Atmospheric Administration | TS | Taiwan Strait |
References
- Fisheries, Statistics of Fishery Products in Japan. Available online: http://www.maff.go.jp/j/tokei/kouhyou/kensaku/bunya6.html (accessed on 25 October 2020).
- Annual Fishery Statistics Report of Taiwan. Available online: https://www.fa.gov.tw/cht/PublicationsFishYear/index.aspx (accessed on 25 October 2020).
- ICES. Report of the Joint EIFAAC/ICES Working Group on Eels (WGEEL), 18–22 March 2013 in Sukarietta, Spain, 4–10 September 2013 in Copenhagen, Denmark; ICES: Copenhagen, Denmark, 2013; Volume 18, p. 851. [Google Scholar]
- Chang, Y.-L.; Miyazawa, K.Y.; Miller, M.J.; Tsukamoto, K. Potential impact of ocean circulation on the declining Japanese eel catches. Sci. Rep. 2018, 8, 5496. [Google Scholar] [CrossRef]
- Friedland, K.D.; Miller, M.J.; Knights, B. Oceanic changes in the Sargasso Sea and declines in recruitment of the European eel. ICES J. Mar. Sci. 2007, 64, 519–530. [Google Scholar] [CrossRef]
- Zenimoto, K.; Sasai, Y.; Sasaki, H.; Kimura, S. Estimation of larval duration in Anguilla spp., based on cohort analysis, otolith microstructure, and Lagrangian simulations. Mar. Ecol. Prog. Ser. 2011, 438, 219–228. [Google Scholar] [CrossRef]
- Chang, Y.-L.; Sheng, J.; Ohashi, K.; Béguer-Pon, M.; Miyazawa, Y. Impacts of Interannual Ocean Circulation Variability on Japanese Eel Larval Migration in the Western North Pacific Ocean. PLoS ONE 2015, 10, e0144423. [Google Scholar] [CrossRef]
- Hsu, A.C.; Xue, H.; Chai, F.; Xiu, P.; Han, Y.-S. Variability of the Pacific North Equatorial Current and its implications on Japanese eel (Anguilla japonica) larval migration. Fish. Oceanogr. 2017, 26, 251–267. [Google Scholar] [CrossRef]
- Tsukamoto, K. Oceanic migration and spawning of anguillid eels. J. Fish Biol. 2009, 74, 1833–1852. [Google Scholar] [CrossRef]
- IPCC. Climate Change 2014: Synthesis Report; Contribution of Working Groups I, II and III to the Fifth Assessment Report of the Intergovernmental Panel on Climate Change; IPCC Press: Geneva, Switzerland, 2014; pp. 1–151. ISBN 97892-91691432. [Google Scholar]
- Ho, C.H.; Lu, H.J.; He, J.S.; Lan, K.W.; Chen, J.L. Changes in Patterns of Seasonality Shown by Migratory Fish under Global Warming: Evidence from Catch Data of Taiwan’s Coastal Fisheries. Sustainability 2016, 8, 273. [Google Scholar] [CrossRef]
- Peyser, C.E.; Yin, J.; Landerer, F.W.; Cole, J.E. Pacific Sea level rise patterns and global surface temperature variability. Geophys. Res. Lett. 2016, 43, 8662–8669. [Google Scholar] [CrossRef]
- Wu, C.R.; Wang, Y.L.; Lin, Y.F.; Chao, S.Y. Intrusion of the Kuroshio into the South and East China Seas. Sci. Rep. 2017, 7, 7895. [Google Scholar] [CrossRef]
- Chen, Z.; Wu, L. Long-term change of the Pacific North Equatorial Current bifurcation in SODA. J. Geophys. Res. Ocean. 2012, 117, C6. [Google Scholar] [CrossRef]
- Nan, F.; Xue, H.; Chai, F.; Shi, L.; Shi, M.; Guo, P. Identification of different types of Kuroshio intrusion into the South China Sea. Ocean Dyn. 2011, 61, 1291–1304. [Google Scholar] [CrossRef]
- Nan, F.; Xue, H.; Yu, F. Kuroshio intrusion into the South China Sea: A review. Prog. Oceanogr. 2015, 137, 314–333. [Google Scholar] [CrossRef]
- Caruso, M.J.; Gawarkiewicz, G.G.; Beardsley, R.C. Interannual variability of the Kuroshio intrusion in the South China Sea. J. Oceanogr. 2006, 62, 559–575. [Google Scholar] [CrossRef]
- Han, Y.S.; Lin, Y.F.; Wu, C.R.; Iizuka, Y.; Castillo, T.R.; Yambot, I.U.; Mamalangkap, M.D.; Yambot, A.V. Biogeographic distribution of the eel Anguilla luzonensis: Dependence upon larval duration and oceanic currents. Mar. Ecol. Prog. Ser. 2016, 551, 227–238. [Google Scholar] [CrossRef]
- Baltazar-Soares, M.; Biastoch, A.; Harrod, C.; Hanel, R.; Marohn, L.; Prigge, E.; Evans, D.; Bodles, K.; Behrens, E.; Böning, C.; et al. Recruitment Collapse and Population Structure of the European Eel Shaped by Local Ocean Current Dynamics. Curr. Biol. 2014, 24, 104–108. [Google Scholar] [CrossRef]
- Naisbett-Jones, L.C.; Putman, N.F.; Stephenson, J.F.; Ladak, S.; Young, K.A. A Magnetic Map Leads Juvenile European Eels to the Gulf Stream. Curr. Biol. 2017, 27, 1236–1240. [Google Scholar] [CrossRef]
- Glantz, M.H.; Ramírez, I.J. Reviewing the Oceanic Niño Index (ONI) to Enhance Societal Readiness for El Niño’s Impacts. Int. J. Disaster Risk Sci. 2020, 11, 394–403. [Google Scholar] [CrossRef]
- Mantua, N.J.; Hare, S.R. The pacific decadal oscillation. J. Oceanogr. 2002, 58, 35–44. [Google Scholar] [CrossRef]
- Tian, Y.J.; Kidokoro, H.; Watanabe, T. Long-term changes in the fish community structure from the Tsushima warm current region of the Japan/East Sea with an emphasis on the impacts of fishing and climate regime shift over the last four decades. Prog. Oceanogr. 2006, 68, 217–237. [Google Scholar] [CrossRef]
- Aghajani, M.A.; Dezfoulian, R.S.; Arjroody, A.R.; Rezaei, M. Applying GIS to Identify the Spatial and Temporal Patterns of Road Accidents Using Spatial Statistics (case study: Ilam Province, Iran). Transp. Res. Procedia 2017, 25, 2126–2138. [Google Scholar] [CrossRef]
- Tzeng, W.N.; Cheng, P.W.; Lin, F.Y. Relative abundance, sex ratio and population structure of the Japanese eel Anguilla japonica in the Tanshui River system of northern Taiwan. J. Fish Biol. 1995, 46, 183–200. [Google Scholar] [CrossRef]
- Tzeng, W.-N.; Tabeta, O. First record of the short-finned eel Anguilla-bicolor-pacifica elvers from Taiwan. Bull. Japan. Soc. Sci. Fish. 1983, 49, 27–32. [Google Scholar] [CrossRef][Green Version]
- Beamish, R.J.; McFarlane, G.A.; King, J.R. Fisheries climatology: Understanding decadal scale processes that naturally regulate British Columbia fish populations. In Fisheries Oceanography: An Integrative Approach to Fisheries Ecology and Management; Blackwell Scientific Publications: Oxford, UK, 2000; pp. 94–139. [Google Scholar]
- Jan, S.; Chao, S.Y. Seasonal variation of volume transport in the major inflow region of the Taiwan Strait: The Penghu Channel. Deep-Sea Res. Part II-Top. Stud. Oceanogr. 2003, 50, 1117–1126. [Google Scholar] [CrossRef]
- Jan, S.; Wang, J.; Chern, C.-S.; Chao, S.-Y. Seasonal variation of the circulation in the Taiwan Strait. J. Mar. Syst. 2002, 35, 249–268. [Google Scholar] [CrossRef]


| Climate and Environmental Index | Pearson’s r | p Value | |
|---|---|---|---|
| ONI | NDJ (December–February) | 0.499 * | 0.042 |
| JAS (June–August) | 0.398 | 0.112 | |
| DJF (December–February) | 0.008 | 0.974 | |
| PDO | Dec (December–February) | 0.339 | 0.183 |
| Jul (June–August) | 0.500 * | 0.038 | |
| DJF (December–February) | 0.125 | 0.634 | |
| SCS–TS Region | 0.342 | 0.152 | |
Publisher’s Note: MDPI stays neutral with regard to jurisdictional claims in published maps and institutional affiliations. |
© 2021 by the authors. Licensee MDPI, Basel, Switzerland. This article is an open access article distributed under the terms and conditions of the Creative Commons Attribution (CC BY) license (https://creativecommons.org/licenses/by/4.0/).
Share and Cite
Ho, C.-H.; Wu, L.-J.; Lu, Z.; Lu, B.-Y.; Lan, Y.-C. Potential Effect of the Intrusion of the Kuroshio Current into the South China Sea on Catches of Japanese Eel (Anguilla Japonica) in the South China Sea and Taiwan Strait. J. Mar. Sci. Eng. 2021, 9, 1465. https://doi.org/10.3390/jmse9121465
Ho C-H, Wu L-J, Lu Z, Lu B-Y, Lan Y-C. Potential Effect of the Intrusion of the Kuroshio Current into the South China Sea on Catches of Japanese Eel (Anguilla Japonica) in the South China Sea and Taiwan Strait. Journal of Marine Science and Engineering. 2021; 9(12):1465. https://doi.org/10.3390/jmse9121465
Chicago/Turabian StyleHo, Ching-Hsien, Long-Jing Wu, Zhen Lu, Bo-Yi Lu, and Yang-Chi Lan. 2021. "Potential Effect of the Intrusion of the Kuroshio Current into the South China Sea on Catches of Japanese Eel (Anguilla Japonica) in the South China Sea and Taiwan Strait" Journal of Marine Science and Engineering 9, no. 12: 1465. https://doi.org/10.3390/jmse9121465
APA StyleHo, C.-H., Wu, L.-J., Lu, Z., Lu, B.-Y., & Lan, Y.-C. (2021). Potential Effect of the Intrusion of the Kuroshio Current into the South China Sea on Catches of Japanese Eel (Anguilla Japonica) in the South China Sea and Taiwan Strait. Journal of Marine Science and Engineering, 9(12), 1465. https://doi.org/10.3390/jmse9121465