Article

A Novel Strength Model for Cement Marine Clay Based on the Mechanical-Chemical Coupling Behavior

1
Research Center of Coastal and Urban Geotechnical Engineering, Zhejiang University, Hangzhou 310058, China
2
Engineering Research Center of Urban Underground Development of Zhejiang Province, Hangzhou 310058, China
3
Power China Huadong Engineering Corporation Limited, Hangzhou 311122, China
4
The Architectural Design & Research Institute of Zhejiang University Co., Ltd., Hangzhou 310028, China
5
Center for Balance Architecture, Zhejiang University, Hangzhou 310028, China
*
Author to whom correspondence should be addressed.
J. Mar. Sci. Eng. 2021, 9(12), 1454; https://doi.org/10.3390/jmse9121454
Submission received: 5 November 2021 / Revised: 10 December 2021 / Accepted: 13 December 2021 / Published: 19 December 2021
(This article belongs to the Section Geological Oceanography)

Abstract

:
Crucial mechanical-chemical (MC) interactions occur during the cement hydration process in cement marine clay; however, the role of such an important element of the resulting strength has been subject to less investigation, particularly from the theoretical perspective. To overcome this scientific gap, an efficient strength-based model accounting for the coupled MC processes is proposed here. Based on the analysis of the cement hydration mechanism, the porosity was chosen as the main factor to characterize the influence of the MC interactions on the overall response. To verify the accuracy of the MC model, the unconfined compressive strength (UCS) experiment was conducted for the cement marine clay samples, and the corresponding simulation model was constructed using COMSOL multiphysics®. In addition, a comparison between the predicted results by the existing three strength models and the proposed MC model was performed. Subsequently, the sensitivity analysis and identification of mechanical parameters were carefully carried out. The obtained results show that the UCS strength for Taizhou clay ranges from 10.21 kPa to 354.2 kPa as the cement content increases from 10% to 20%, and the curing time varies from 3 days to 28 days. The mechanical parameters in the MC model can be obtained according to the porosity level. A reasonably good agreement between the UCS strength results of simulations and the experimentally observed data is reported. Additionally, the predicted UCS strength results by the MC model demonstrate the best correspondence with the measured values, indicating the high efficacy of the established model.

1. Introduction

In coastal and offshore areas, there exists extensively marine clay with insufficient strength, high water content, excessive settlement, and high compressibility, which is not suitable for engineering purposes [1,2,3,4,5].
To solve the geotechnical-related problems and meet the demands of construction, many types of additives have been adopted to stabilize the marine clay. Some additives are ecofriendly, including recycled additives such as blended tiles (RBT) [6,7,8,9], disposed granite waste, and industrial waste by-products [10,11,12]. Other effective additives include cement [13,14], bioencapsulation [15], calcium-based additives [16], polyurethane [17], halloysite nanotubes [18], and nanometer magnesium oxide [19]. In the long term, marine clay treatment utilizing cement has proven to be the best solution to meet various requirements [1,20].
The cement hydration process is followed by mechanical-chemical interactions (MCI), which strongly contribute to the strength [21,22,23,24,25,26]. Ghirian and Fall (2013) carried out column experiments to examine the role of the mechanical-chemical coupling (MCC) behavior in the cemented paste backfill [21]. Santamarina et al. (2002) exploited interparticle forces, fabric formation, and fabric change to explain soil’s MCC [23]. To assess the mechanism of MC interactions in the strength evolution, researchers have recently investigated the microstructure of cement marine clay using a scanning electron microscope. Ekinci (2019) explored the strength and microstructural properties of marine clay-cemented mixes [27]. Rashid et al. (2017) employed the field emission scanning electron microscopy to inspect the effectiveness of xanthan gum for the stabilization of tropical laterite soil [28]. However, in most research works, the microstructure changes due to the MCC have not been quantitatively measured to establish the strength models [27,28,29,30,31,32].
A series of strength models have been outlined in Refs. [33,34,35,36,37,38,39,40,41,42,43]. Kang et al. (2016) proposed formulas to estimate the strength of cement marine clay based on the curing time and previously proposed formula related to the volumetric solid content [33]. Ma et al. (2016) developed a strength model for shale formations based on the Mohr’s theory and Coulomb criterion [34]. Locat et al. (1990) found the power-law between water content and strength of lime-stabilized clays [35]. Bi and Chian (2020) discussed the strength development of various types of cement-treated clay over a wide range of curing time at high water content and low cement dosage [36]. Yamashita et al. (2020) proposed the strength model of cement-treated soil by the volumetric solid ratio excluding sand and the ratio of the cement content to the mass of fine particles [37]. Yao et al. (2020) established and validated a strength-prediction model using mix ratios and curing periods [38]. Yin et al. (2015) adopted the concept of anisotropy and isotropy processes of soft Wenzhou marine clay, proposing a new anisotropic elastic viscoplastic model [39]. However, most strength models essentially focus on factors such as the clay water/cement ratio, water, and cement contents. The mechanism of MCI has not been described in the strength models using appropriate parameters.
The objective of this paper is to propose a simple but effective strength model for cement marine clay that considers the MCC behaviors during the cement hydration process. The latter’s mechanism is analyzed based on the SEM images at first. Subsequently through considering the MCI, the mechanical-chemical coupled model (MC model) is proposed. To verify the MC model, the unconfined compressive strength (UCS) test is conducted for the marine clay from Taizhou coastal industrial zone. Meanwhile, the experimental data are compared with those obtained from a corresponding UCS simulation model built in COMSOL Multiphysics®. Furthermore, the high efficiency of the MC model is demonstrated by comparison its results with those of existing three strength models. Finally, the sensitivity analysis and identification of mechanical parameters pertinent to the MC model are provided in some detail. However, the proposed MC model is simple and only has one parameter, but it can describe the coupling mechanism effectively and can be obtained easily.

2. Materials and Methods

2.1. Materials

The main materials are marine clay and ordinary Portland cement (OPC). The marine clay originated from the Taizhou coastal industrial zone. The cement is ‘42.5 N’ OPC from the Qianjiang cement factory, utilized for the admixture. The physical properties of the employed clay are also summarized in Table 1.

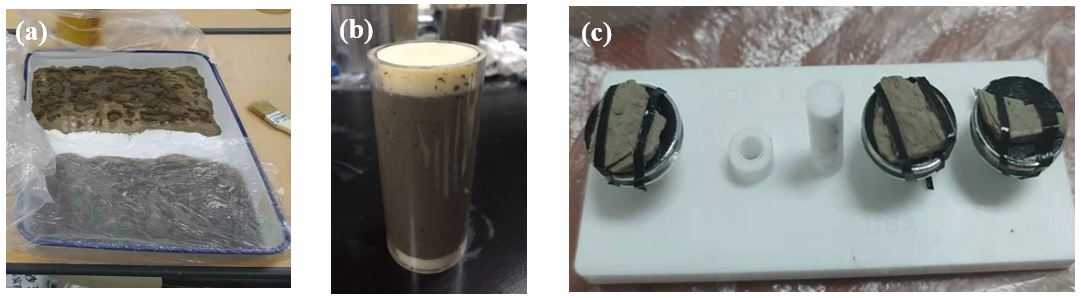
2.2. Preparation of Samples

2.2.1. Samples for Strength Test

The Taizhou clay was dried in the natural environment for one week. Then it was sliced into small pieces before oven drying at a temperature between 105 °C and 110 °C for at least 8 h. After that, it was ground into the fine powder, and filtered by a 2 mm sieve to take out coarse particles.
The next step is to make the cement marine clay. At first, the original Taizhou clay powder was weighed, then mixed with water to form remodeled clay (40% water content). Next, a certain mass of water and 42.5 ordinary Portland cement were weighed and mixed according to the water-cement ratio. At last, the cement paste was added into the original marine clay to produce a uniform mixture (see Figure 1a).
Then the samples of the cement clay could be prepared. The cement clay was compacted in the standard mold (height 80 mm, diameter 39.1 mm) for the UCS test (see Figure 1b). The prepared samples should be kept in natural conditions for 24 h, were pulled out from this mold, and then immediately wrapped with a vinyl film. Finally, they should be stored in a humidity chamber of constant temperature 20 ± 5 °C till the planed curing time.

2.2.2. Samples for the SEM Observation

The samples for the strength test were milled into small strips of 5 mm (length) × 5 mm (width) × 1 mm (height) (see Figure 1c). The clay strip was then dried by implementing the ‘liquid nitrogen vacuum drying method’ to remove moisture. Thereafter, the SEM sample was gold-coated by an SBC-12 ion sputterer from the KYKY to make the clay conductive.

2.3. Method and Tests
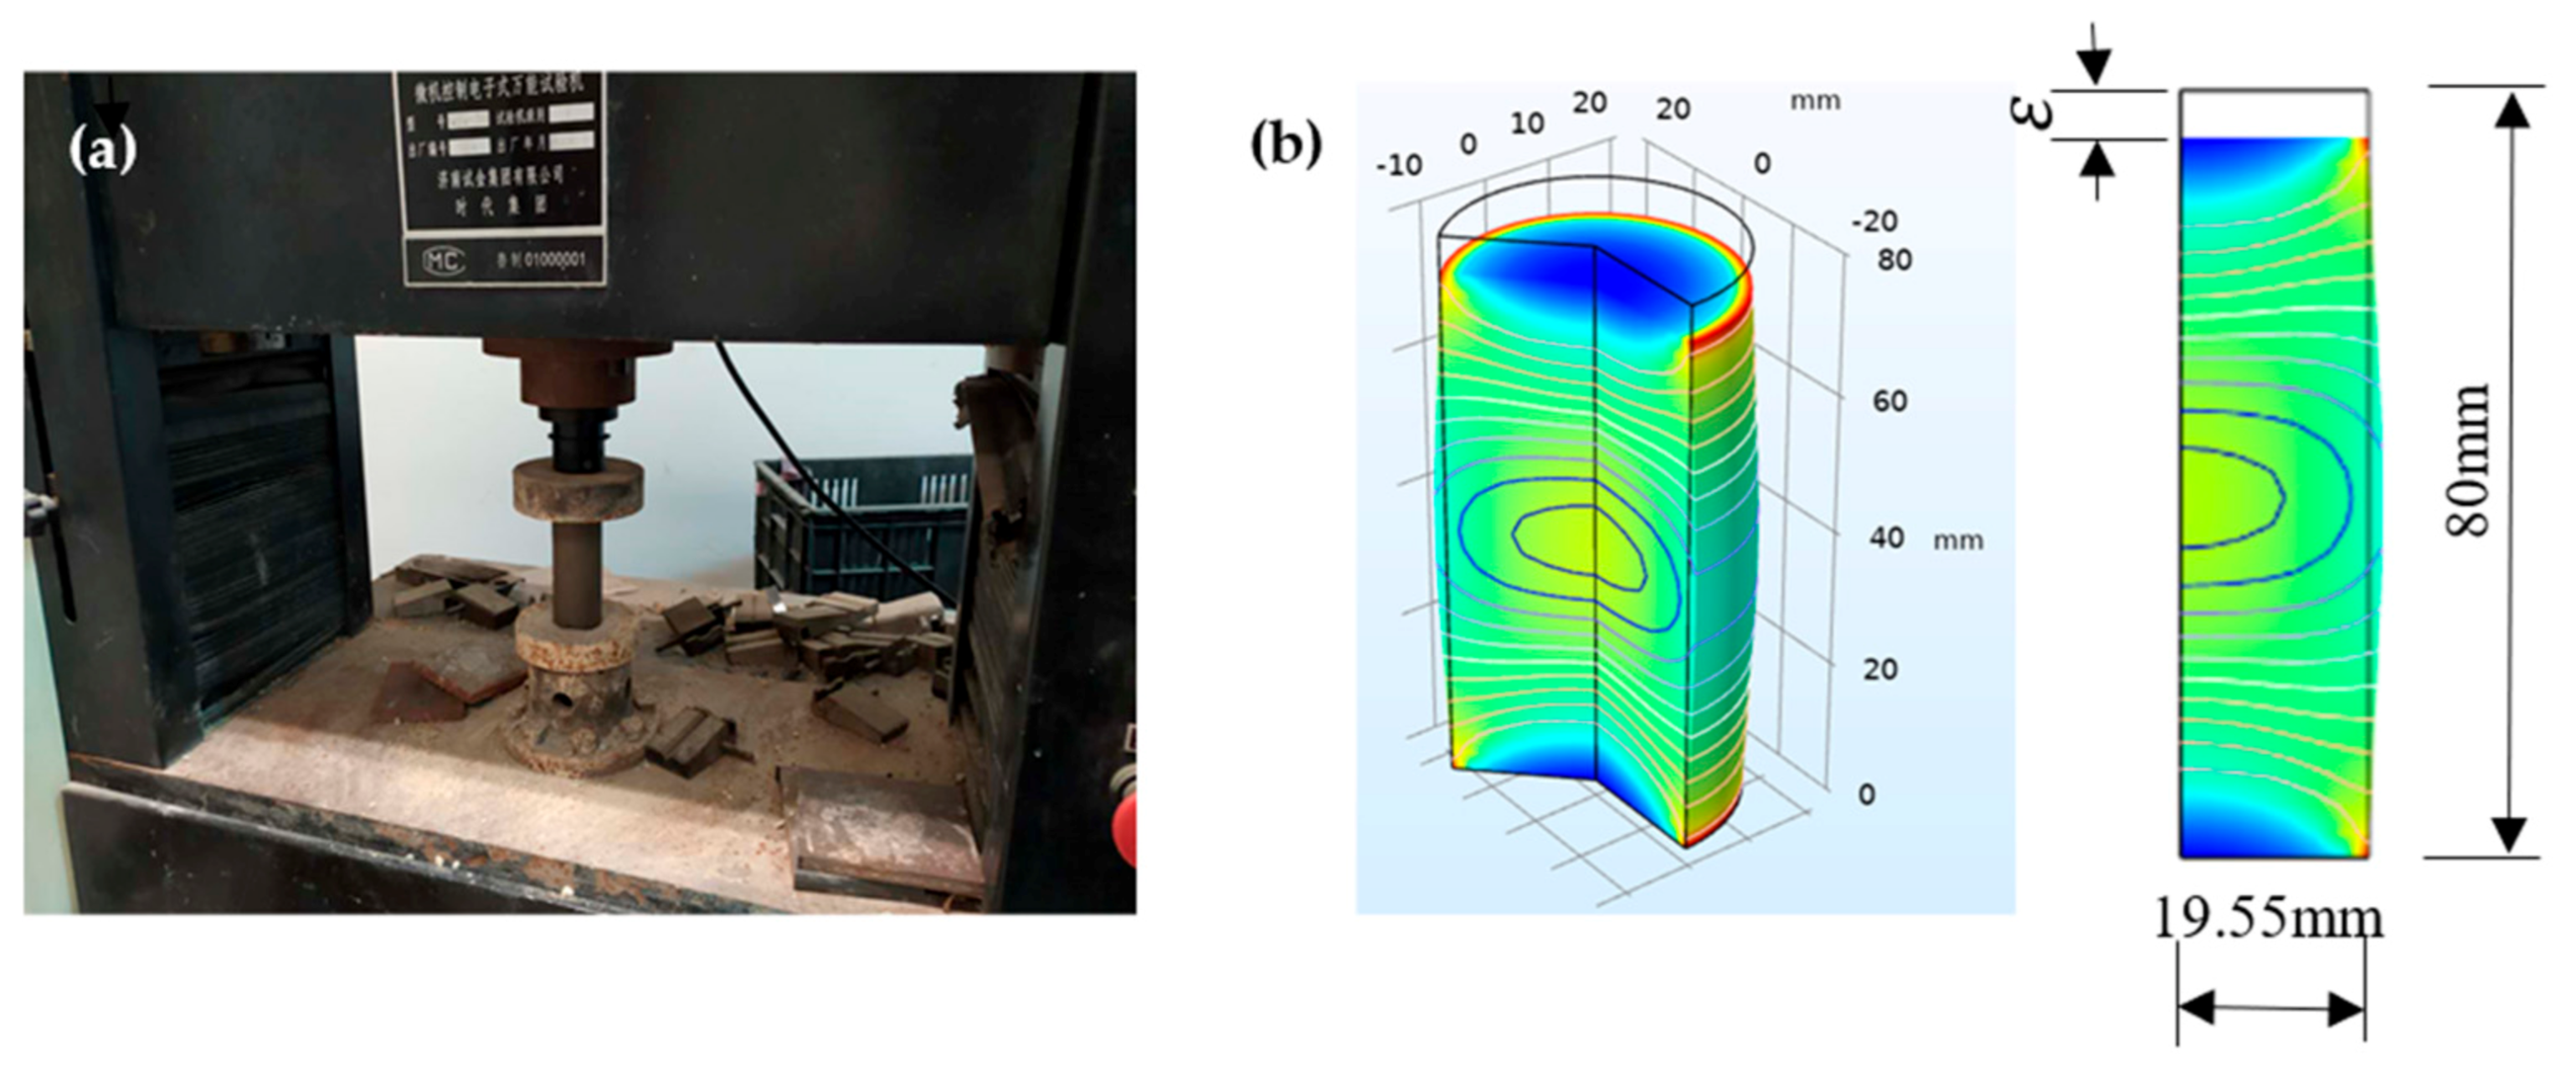
2.3.1. UCS Test

Samples with different curing ages and cement contents were assessed per the test schedule given in Table 2. The UCS test was adopted as the evaluation index of the curing effect. The initial average height H 0 and cross-sectional area A 0 of the sample were measured and calculated, and then the UCS was measured by the WDW–T50 type microcomputer-controlled electronic universal testing machine, produced by Jinan Testing Machine Factory in Shandong, China. The load was applied at the rate of 1 mm/min, and the required stress and strain data were collected by a microcomputer.

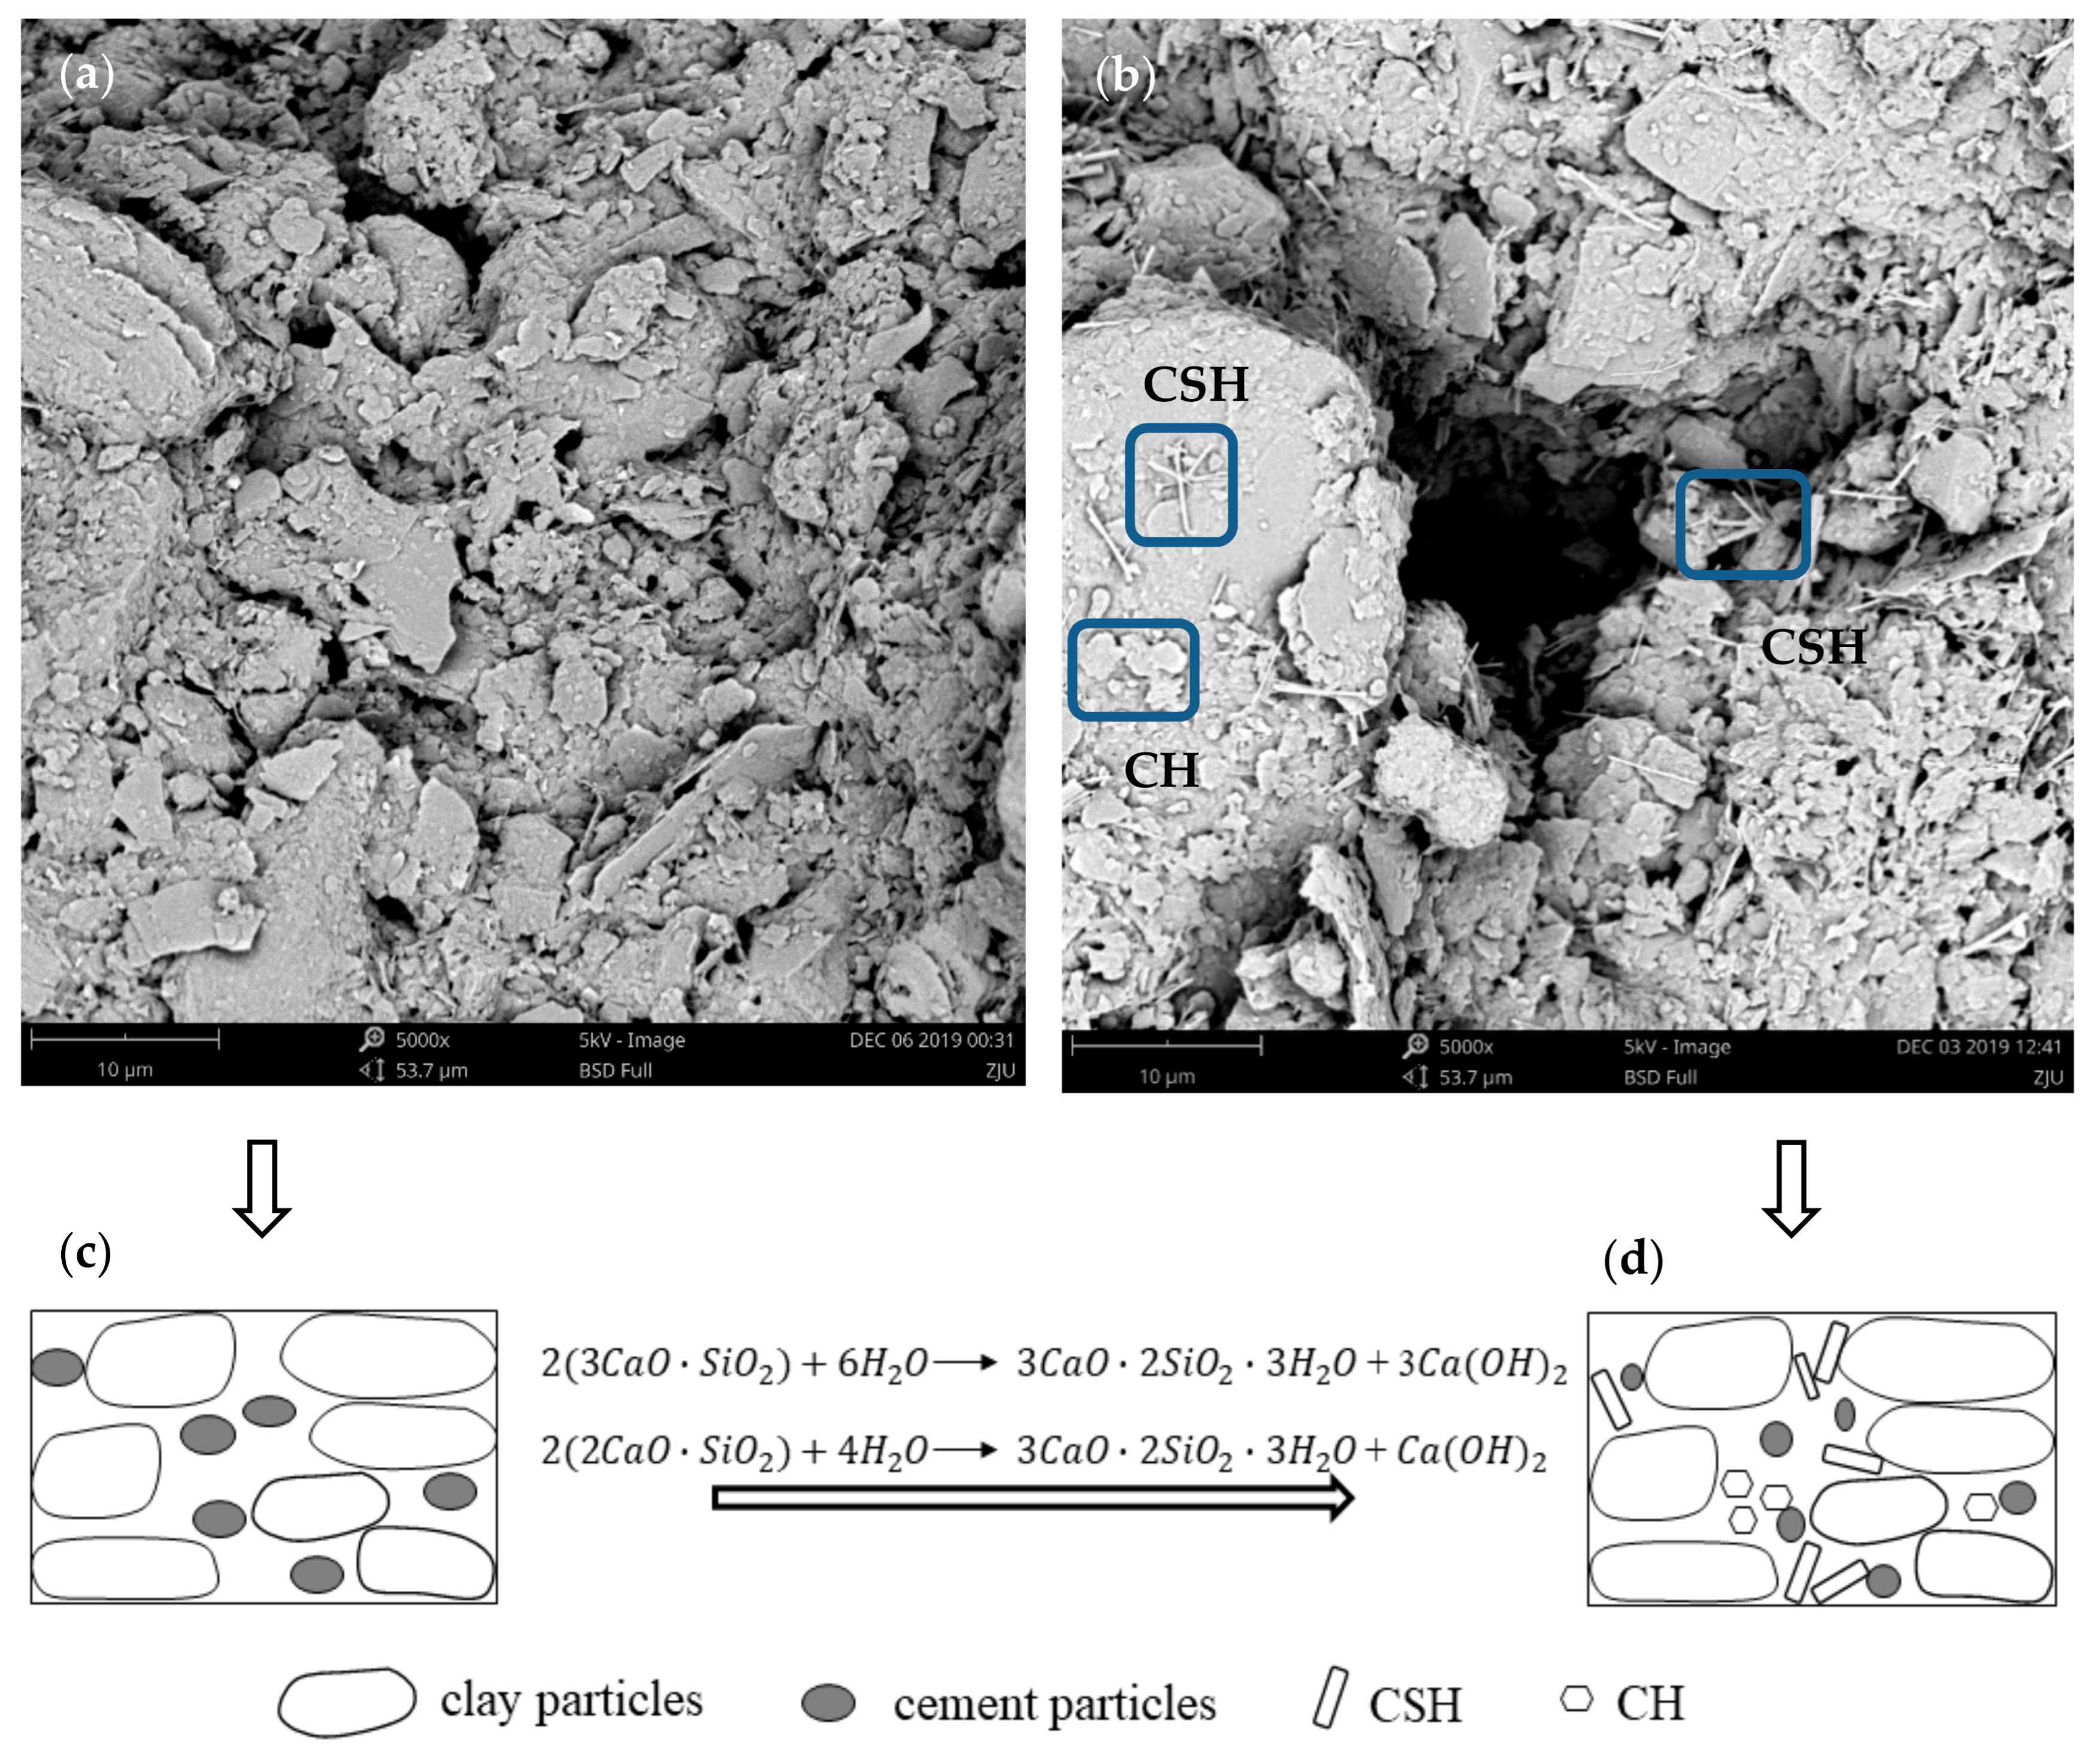
2.3.2. SEM Observation

Two samples in which corresponding data provided in Table 2 (i.e., No.2 and No.9) were observed by the scanning electron microscope (SEM) of FEG650 type, produced by FEI Company in the Netherlands. The BSD imaging mode was operated with 5 Kv accelerating voltage, and the magnification is 5000 times. All the experimental operations displayed in Section 2 meet the requirements of GB/T 50123-1999.

2.4. The Mechanisms of Mechanical-Chemical Coupling during the Cement Hydration Process

When the cement paste is added to the clay, they interact tightly. During the cement hydration process, the 3CaO·SiO2 and 2CaO·SiO2 in the cement can react with H2O, generating 3CaO·2SiO2·3H2O (i.e., CSH) and Ca(OH)2 (i.e., CH), which leads to the change of microstructure in the cement clay (see Figure 2a,b) [27,32].
The porosity can represent the mechanism of MCC due to cement hydration. The change of porosity mainly results from four aspects (see Figure 2c,d). The first is CSH, a fibrous and gelatinous substance that can combine small particles in a gel state. Therefore, the shape and size of particles in the cement clay are modified, resulting in the porosity alteration. The second is CH, represented by its own particular hexagonal plate-like structure, mainly characterized by very low solubility in water. Therefore, the pore space can be occupied, and the porosity will be reduced. Thirdly, the water is consumed in these reactions, resulting in the shortening of space between particles, lessening the porosity. Finally, electric repulsion and van der Waals attraction forces between clay particles are modified, and thereby, the porosity can be modified as well. This trend of porosity evolution is also supported by previous studies [44,45]. Figure 2e shows that the sample’s strength significantly increases with the curing time, and the mechanism can be described by the change of porosity.

2.5. The MC Model

Based on the mechanisms mentioned above, the strength model considering the mechanical-chemical coupling process can be established, the so-called MC model for the sake of brevity.

2.5.1. Elastic Behavior

The Hooke’s Law is employed to assess the elastic behavior of the cement clay:
σ = E ε
where E is the value of young’s modulus, and it changes during the cement hydration process. ε is strain and σ is the corresponding stress.
Since the microstructure of the cement clay is affected by the chemical-mechanical evolution of the cement-soil-water system, the young’s modulus E can be expressed in terms of the porosity change via an exponential function:
E = a E e b E n
where n is the porosity of cement clay, and it changes with the progress of cement hydration. a E ,   b E are the parameters for fitting curve.

2.5.2. The Yield Function

It is assumed that the clay behaves like a perfect elastoplastic material, and the Drucker–Prager yield function can reflect this behavior. Therefore,
f i j σ = J 2 + α I 1 k
where J 2 is the deviatoric stress tenor invariant; I 1 is the hydrostatic component of the stress tensor; α and k are material constants, which can be calculated by the cohesion force c   and friction angle φ as follows:
α = 2 3 sin φ 3 ± sin φ
k = 2 3 c · cos φ 3 ± sin φ
where c   and   φ are from the modified Mohr–Coulomb by matching the outer apices of the Mohr–Coulomb hexagon with the Drucker–Prager surface.   c   and   φ evolve with the chemical reaction.
c = a c e b c n
φ = a φ e b φ n
where n is the porosity, and it changes with the progress of cement hydration. a c ,   b c ,   a φ ,   b φ are the fitting curve parameters.

2.6. The Simulation of the UCS Test via COMSOL

The COMSOL Multiphysics® is a general-purpose simulation software based on advanced numerical methods. It has capabilities of fully coupled multiphysics and single physics modeling. To verify the proposed MC model, a UCS model was constructed using COMSOL Multiphysics® (see Figure 3). In the COMSOL-based model, all the mechanical and geometry parameters and the boundary conditions were considered similar to those of the experimentally tested sample. The dimensions of the circular cylindrical sample were 80 mm (height) and 19.55 mm (half diameter), and the bottom end is fixed, while the cylinder’s lateral side is free from any traction (i.e., unconfined condition). The control parameters for the MC model were the elastic modulus E , cohesion force c , and friction angle φ . The sensitivity analysis of the three parameters will be given and discussed in Section 4.2. The Drucker–Prager (matched to Mohr–Coulomb criterion) is adopted as the strength yield criterion in the Solid Mechanics Module of COMSOL. Subsequently, the stress–strain curve can be obtained after calculation.

3. Results

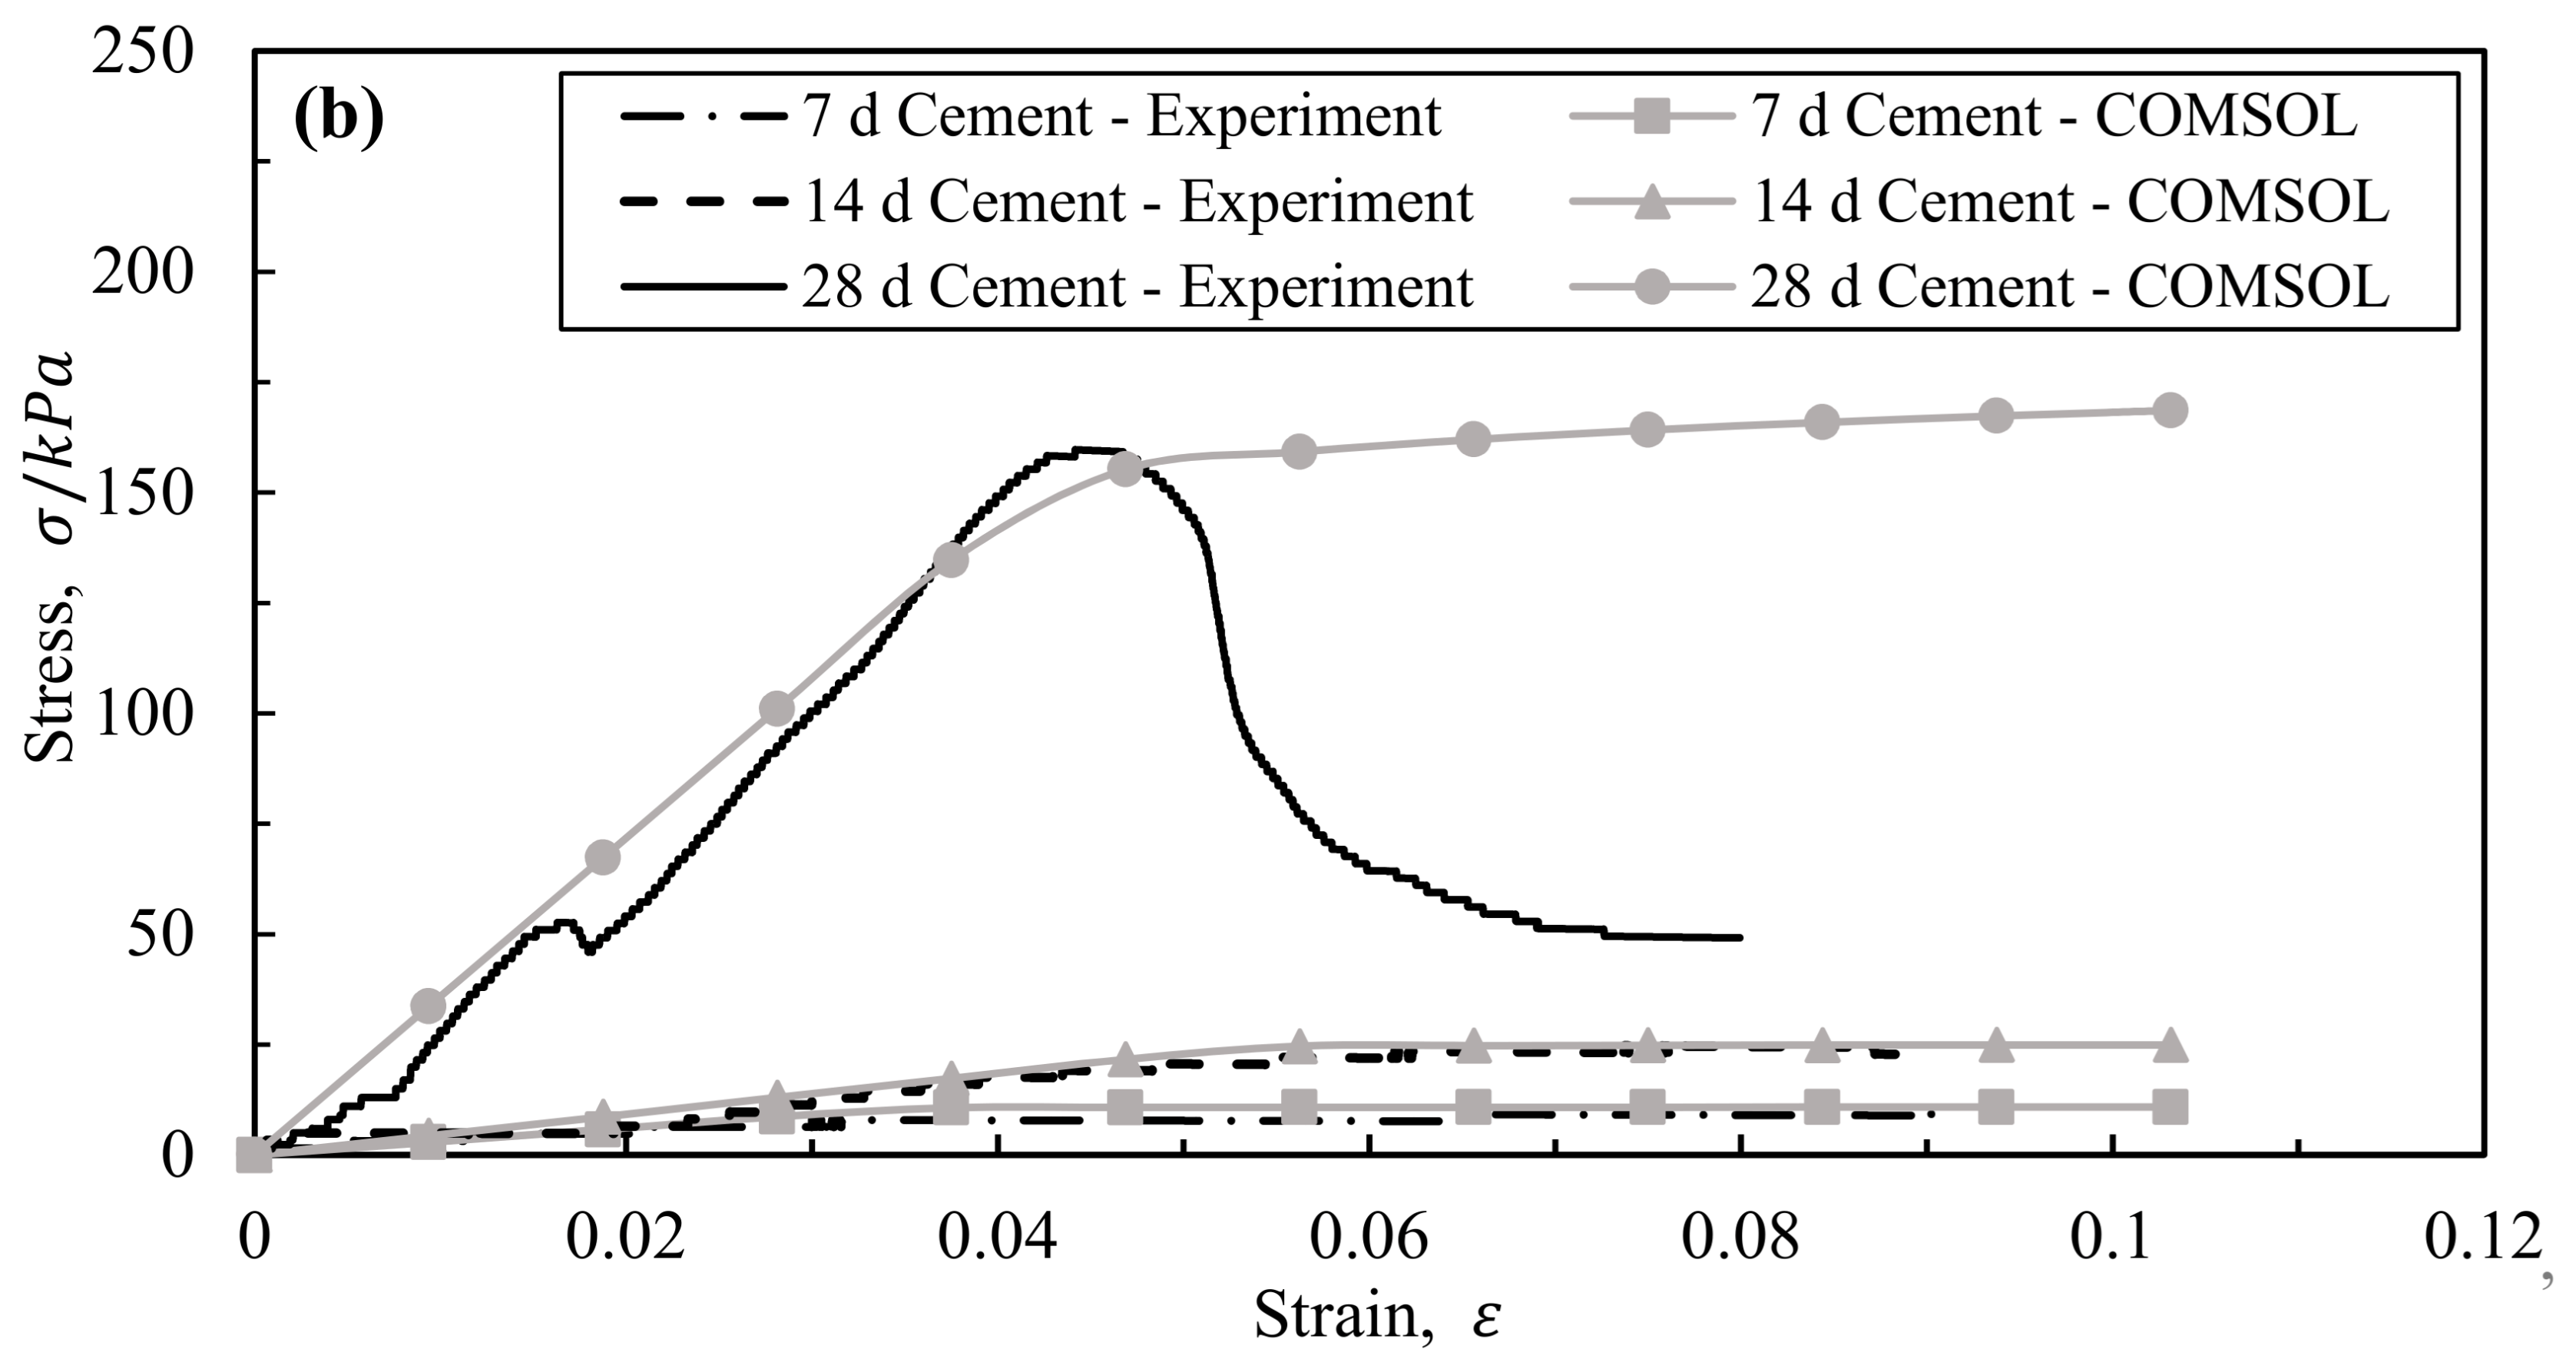
3.1. Comparison between the Experiment and Simulation

The stress–strain ( ε σ ) curve of the cement clay with various curing ages and cement contents are presented in Figure 4. The value of the peak point in each ε σ curve is selected as the UCS strength (see Table 3). When no peak point is detectable, the point’s value corresponding to 10% of the axial strain is taken as the shear strenngth.
The UCS strength for Taizhou clay ranges from 10.21 kPa to 354.2 kPa. Furthermore, the UCS strength increases with the curing time as well as the cement content. The trend of the stress–strain curve varies from strain-hardening to strain-softening as the curing age and cement content grows. The corresponding trends for 7 and 14 days indicate the strain-hardening behavior, while that associated with the curing time of 28 days shows different softening behavior (see Figure 4). Because with longer curing time, the UCS strength will rise more sharply toward a peak followed by a greater amount of the strain-softening [39]. Additionally, there is a very high growth of the strength for samples with a curing time of 28 days, as demonstrated in Figure 4. Such a trend is mainly attributed to the fact that at a low water-to-cement ratio (w/c = 1 in this paper), there exists a steep increment in the strength [46]. Figure 4 shows that the simulation results match well with those of the experiment before reaching the UCS strength. This evidence reveals that the MC model is available to predict the UCS strength of cement marine clay, as well as the stress–strain curve of the sample with hardening characteristics. However, the proposed MC model is a perfect elastic-plastic model, and it cannot capture the softening behavior.

3.2. Results of Mechanical Parameters of the M-C Model

For each tested cement clay sample, the values of E , c and φ have been listed in Table 4. As the curing time increases, all three mechanical parameters rise. With the growth of the cement content, both values of E and φ would rise. An increasing trend for c is observed, but its value for the sample with 20% cement content is a little smaller than that value for the case of 15% cement content. This fact may be caused due to the existence of the optimal cement content. Actually, the cement cannot be fully hydrated when the content is higher than the optimal content.

4. Discussion

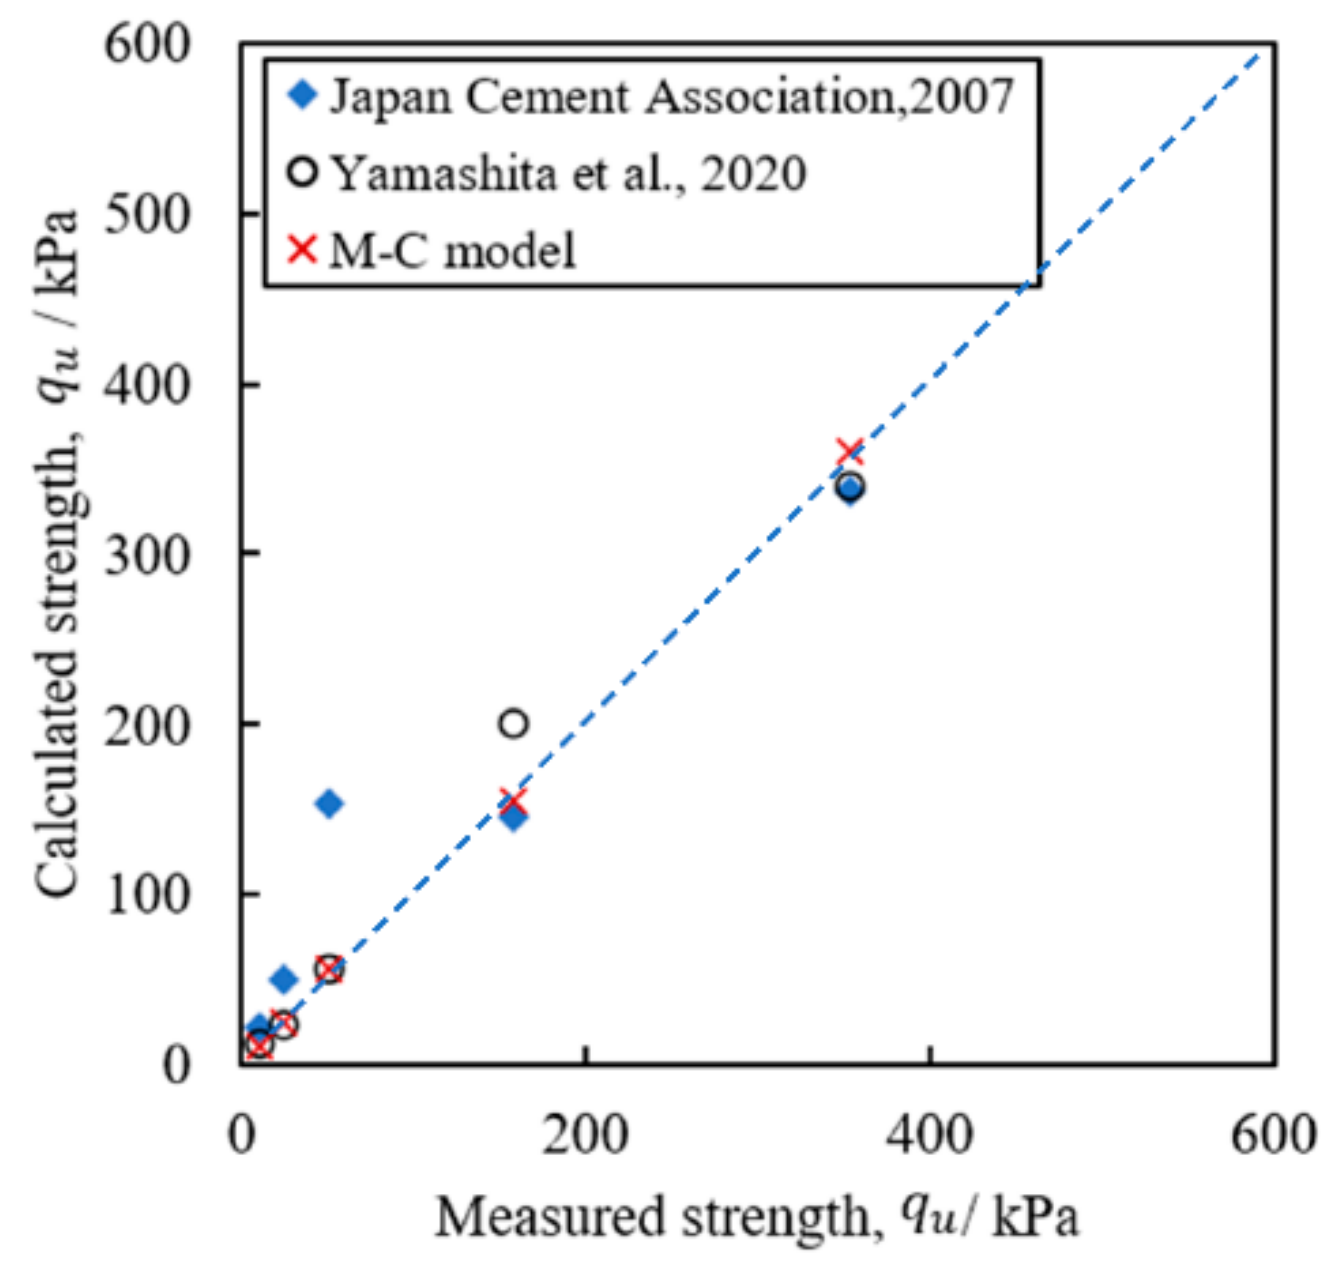
4.1. The Comparison with Existing Strength Models

Two strength models were selected for comparison [37,47]. One is from Japan Cement Association (2007), and the other one was proposed by Yamashita (2020). The UCS strength was calculated, and the obtained results are presented in Figure 5. The discrepancies between the measured data and the calculated values can be evaluated by the given Equation (8) as follows [37].
ε = 1 n i = 1 n A B / B
where ε is the average value of normalized difference, A and B are calculated strength and measured strength, respectively. n is the number of data. The average normalized discrepancies of ε based on the strength models proposed by Japan Cement Association, Yamashita, and this paper are 79%, 8%, and 3%, respectively. Obviously, the MC model demonstrates the best prediction, indicating that it is suitable for capturing the UCS strength of cement marine clays.

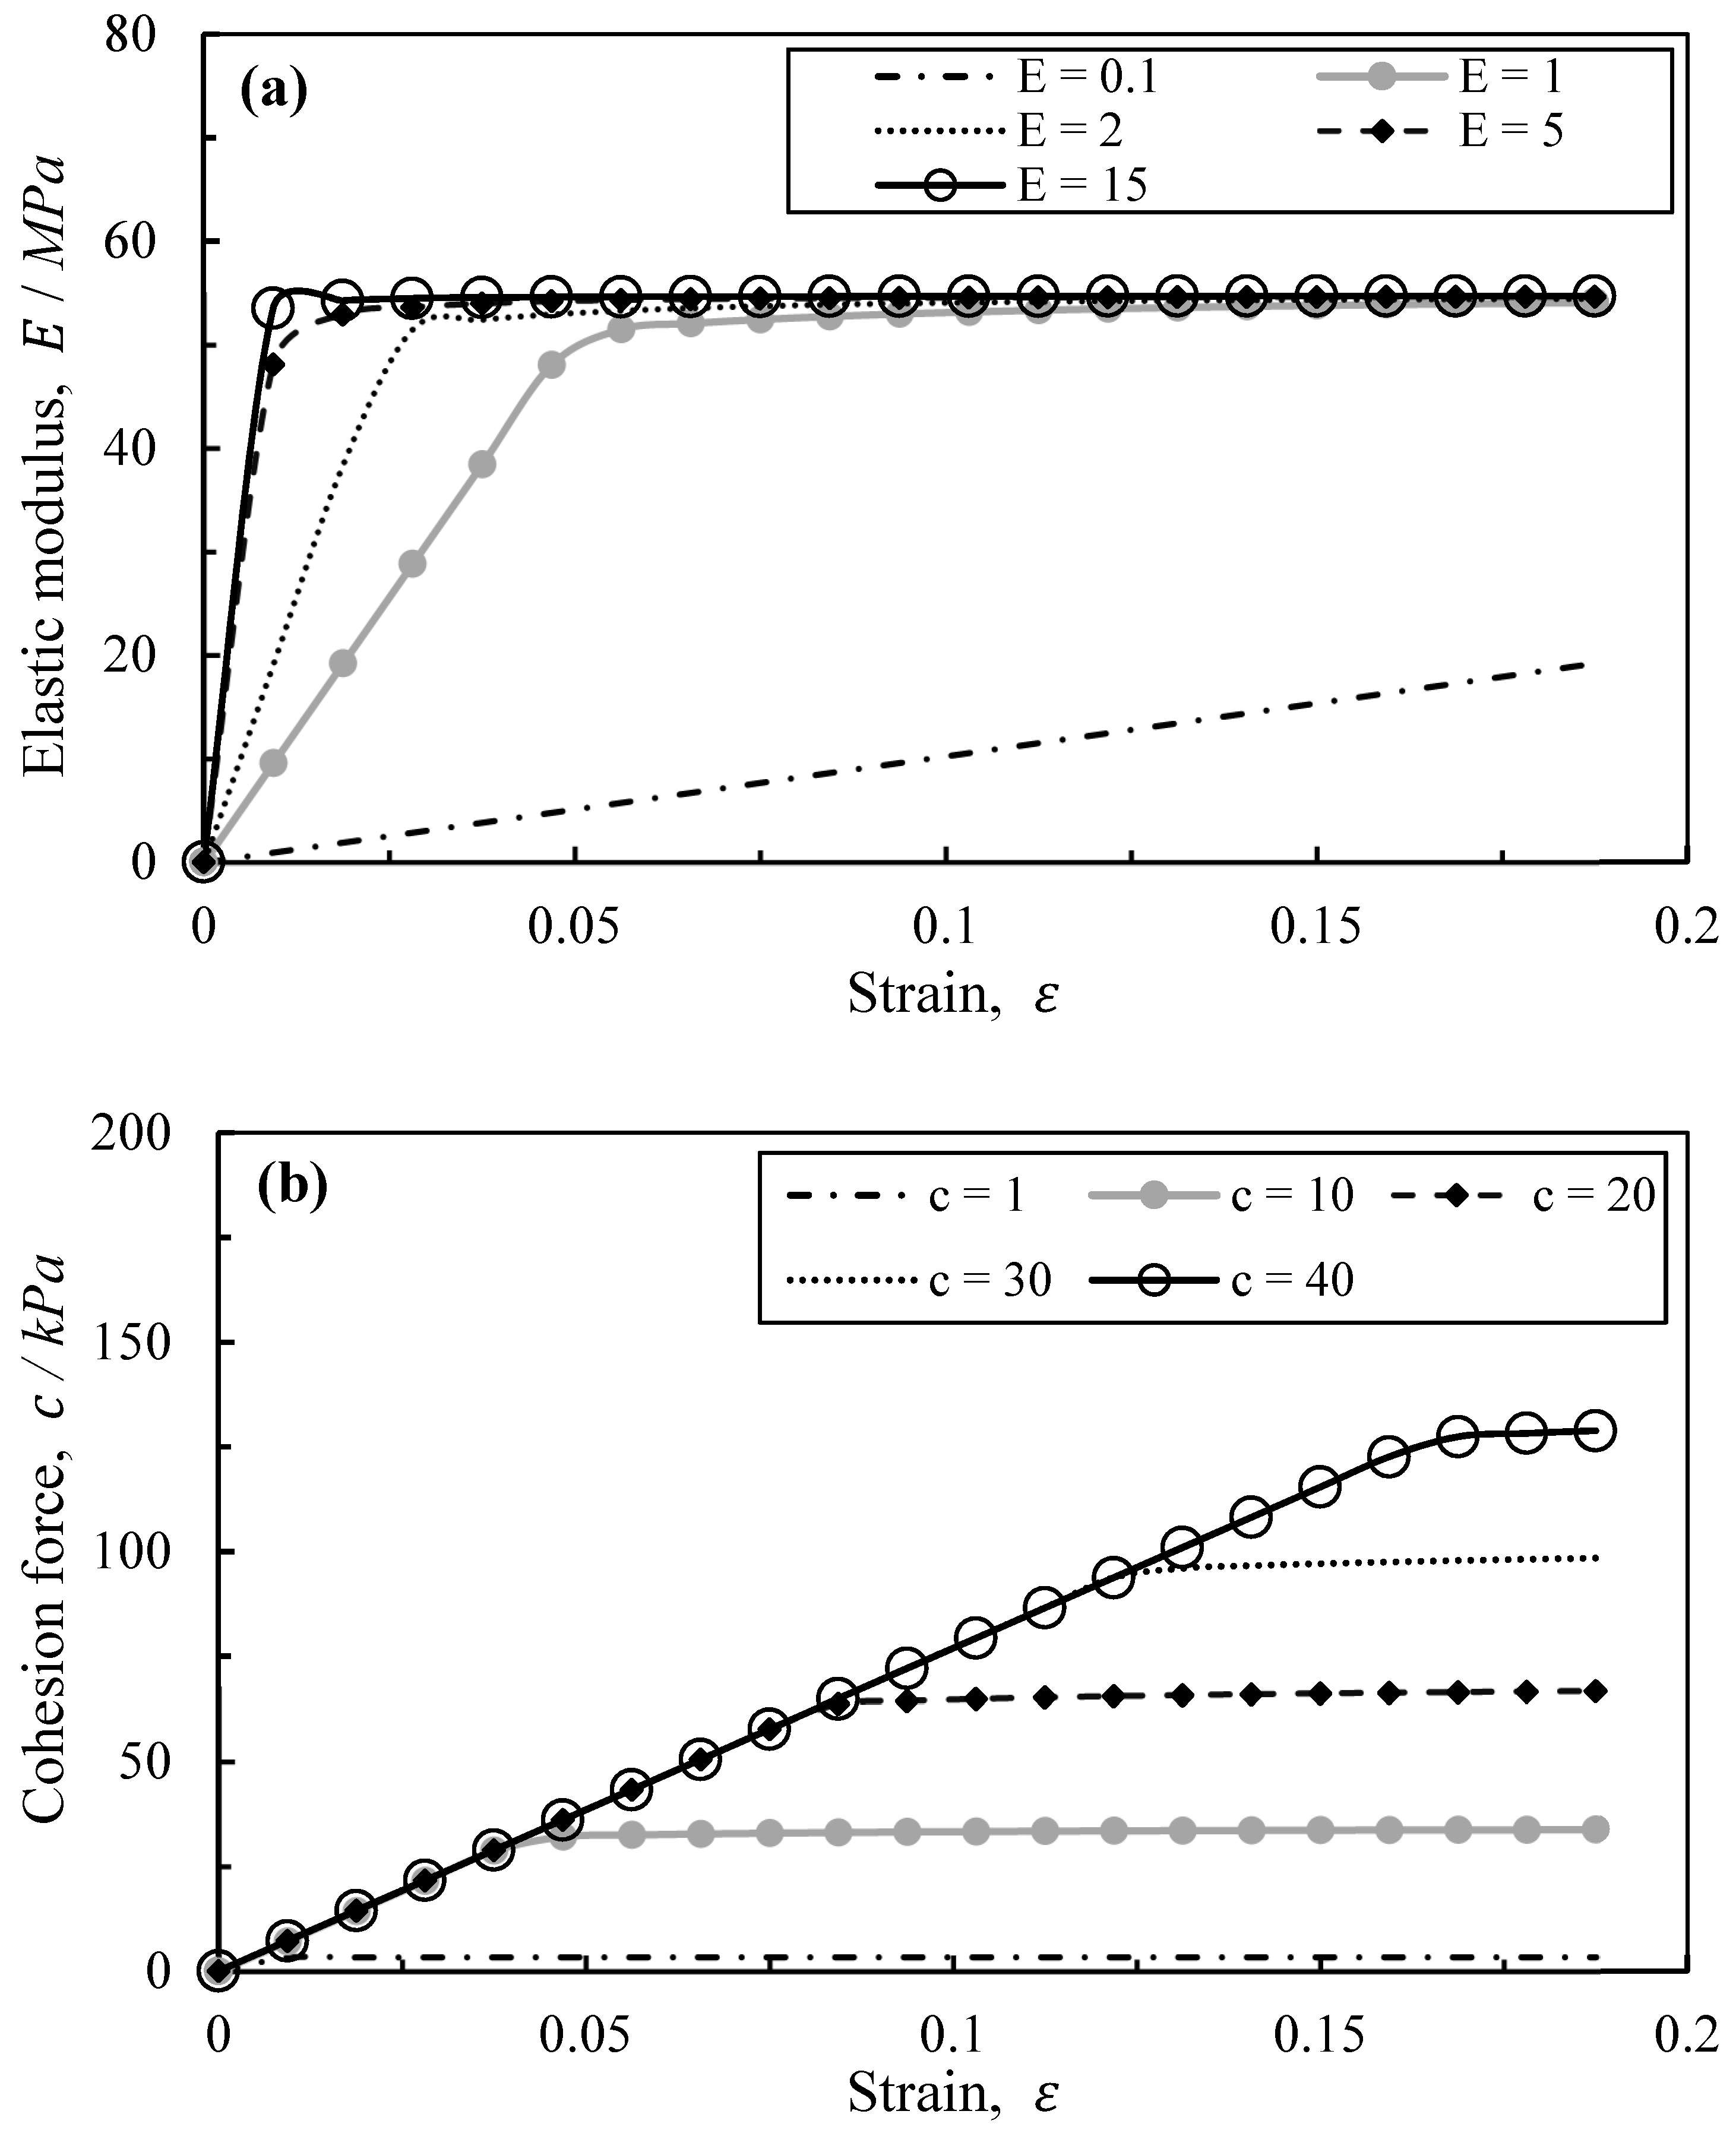
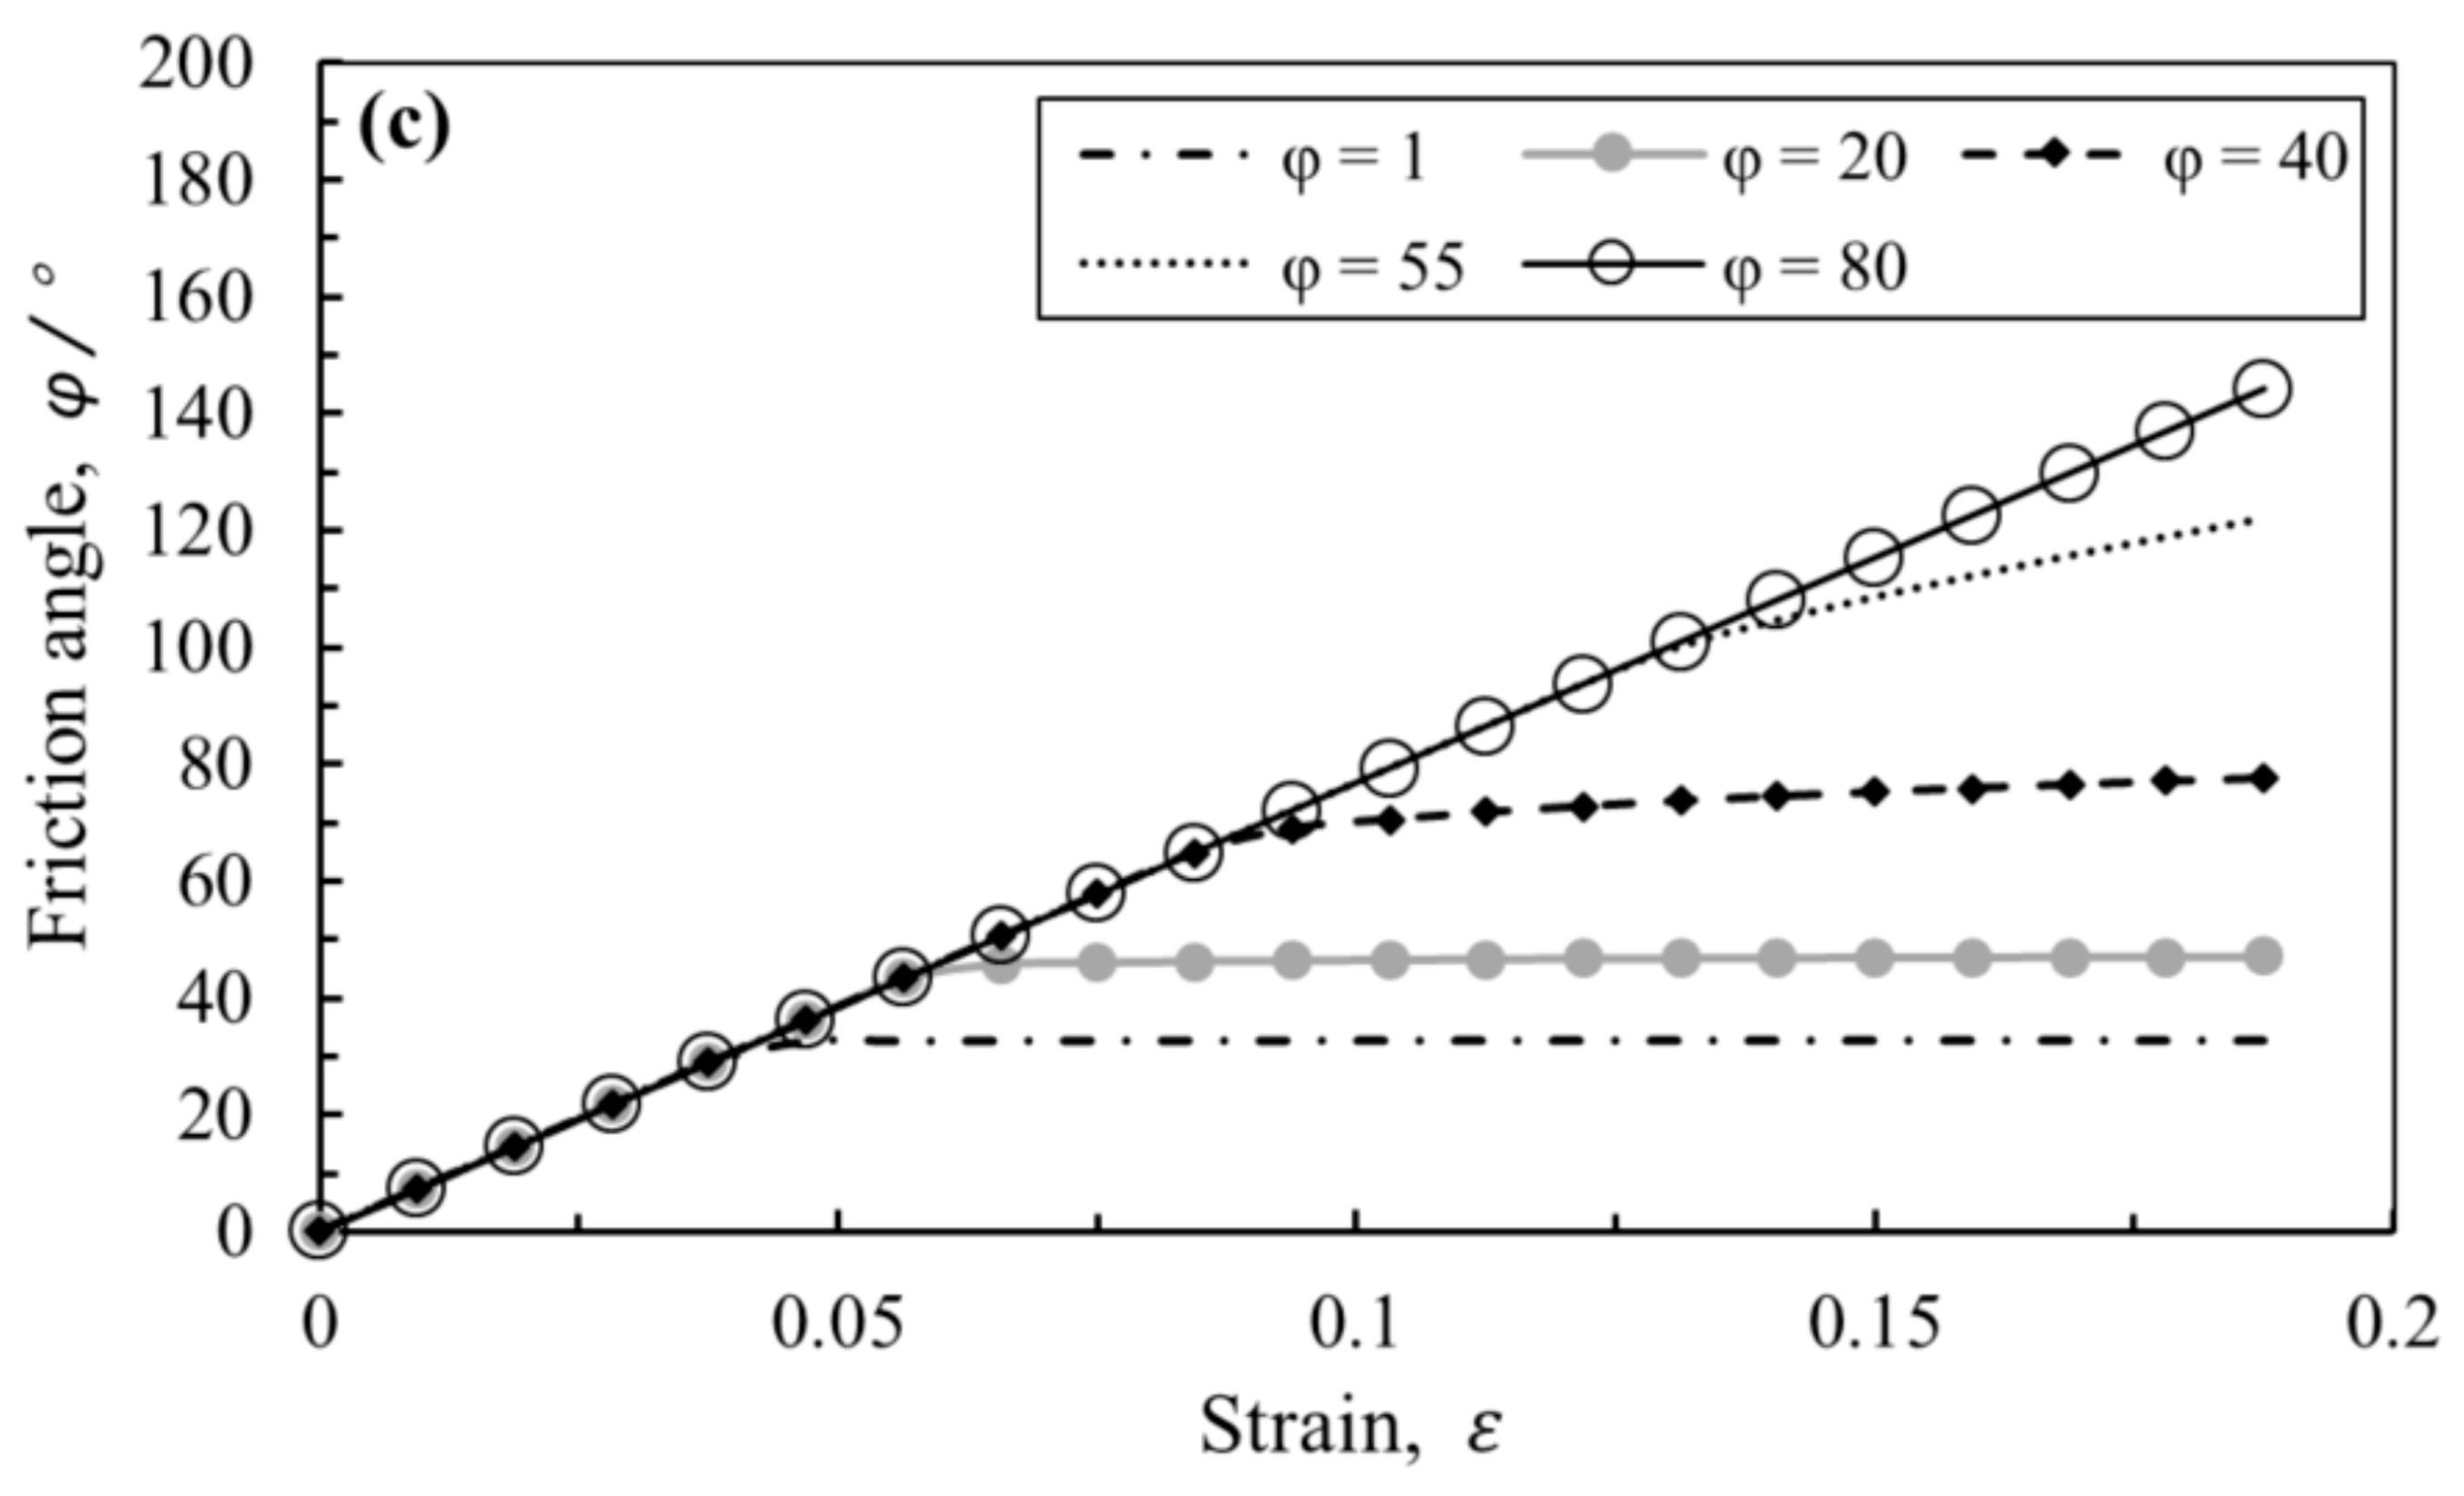
4.2. The Sensitivity Analysis of Mechanical Parameters

The sensitivity analysis of each mechanical parameter is also performed (see Figure 6). Figure 6a shows the effect of E on the stress–strain curve, with moconstant c   c = 16   kPa and φ   φ = 26 ° . The slope of the curve is influenced by E . The slope becomes steeper with increasing E , and the influence of E on the slope becomes smaller as E increases. Figure 6b shows the result for constant E   E = 0.75   MPa and φ   φ = 26 ° , with c ranging from 1 kPa and 40 kPa. As the cohesion force c grows, the peak strength also improves. Figure 6c shows the influence of different friction angle φ on the behavior of clay when using a constant elastic modulus E ( E = 0.75   MPa ) and cohesion force c ( c = 16   kPa ). It shows that φ affects both the yield point and the trend of the curve in the plastic stage. The yield stress grows with increasing φ . When φ is small, the plastic stage keeps constant stress. And when φ becomes larger, there is still an increasing trend for stress after the yield point. In summary, the plotted results indicate that the elastic stage is controlled by E , while the plastic stage is controlled by c and φ . The slope of the curve is significantly related to the level of E , while the height of the yield point is commonly influenced by c and φ . Additionally, φ affects the trend of the curve in the plastic stage.

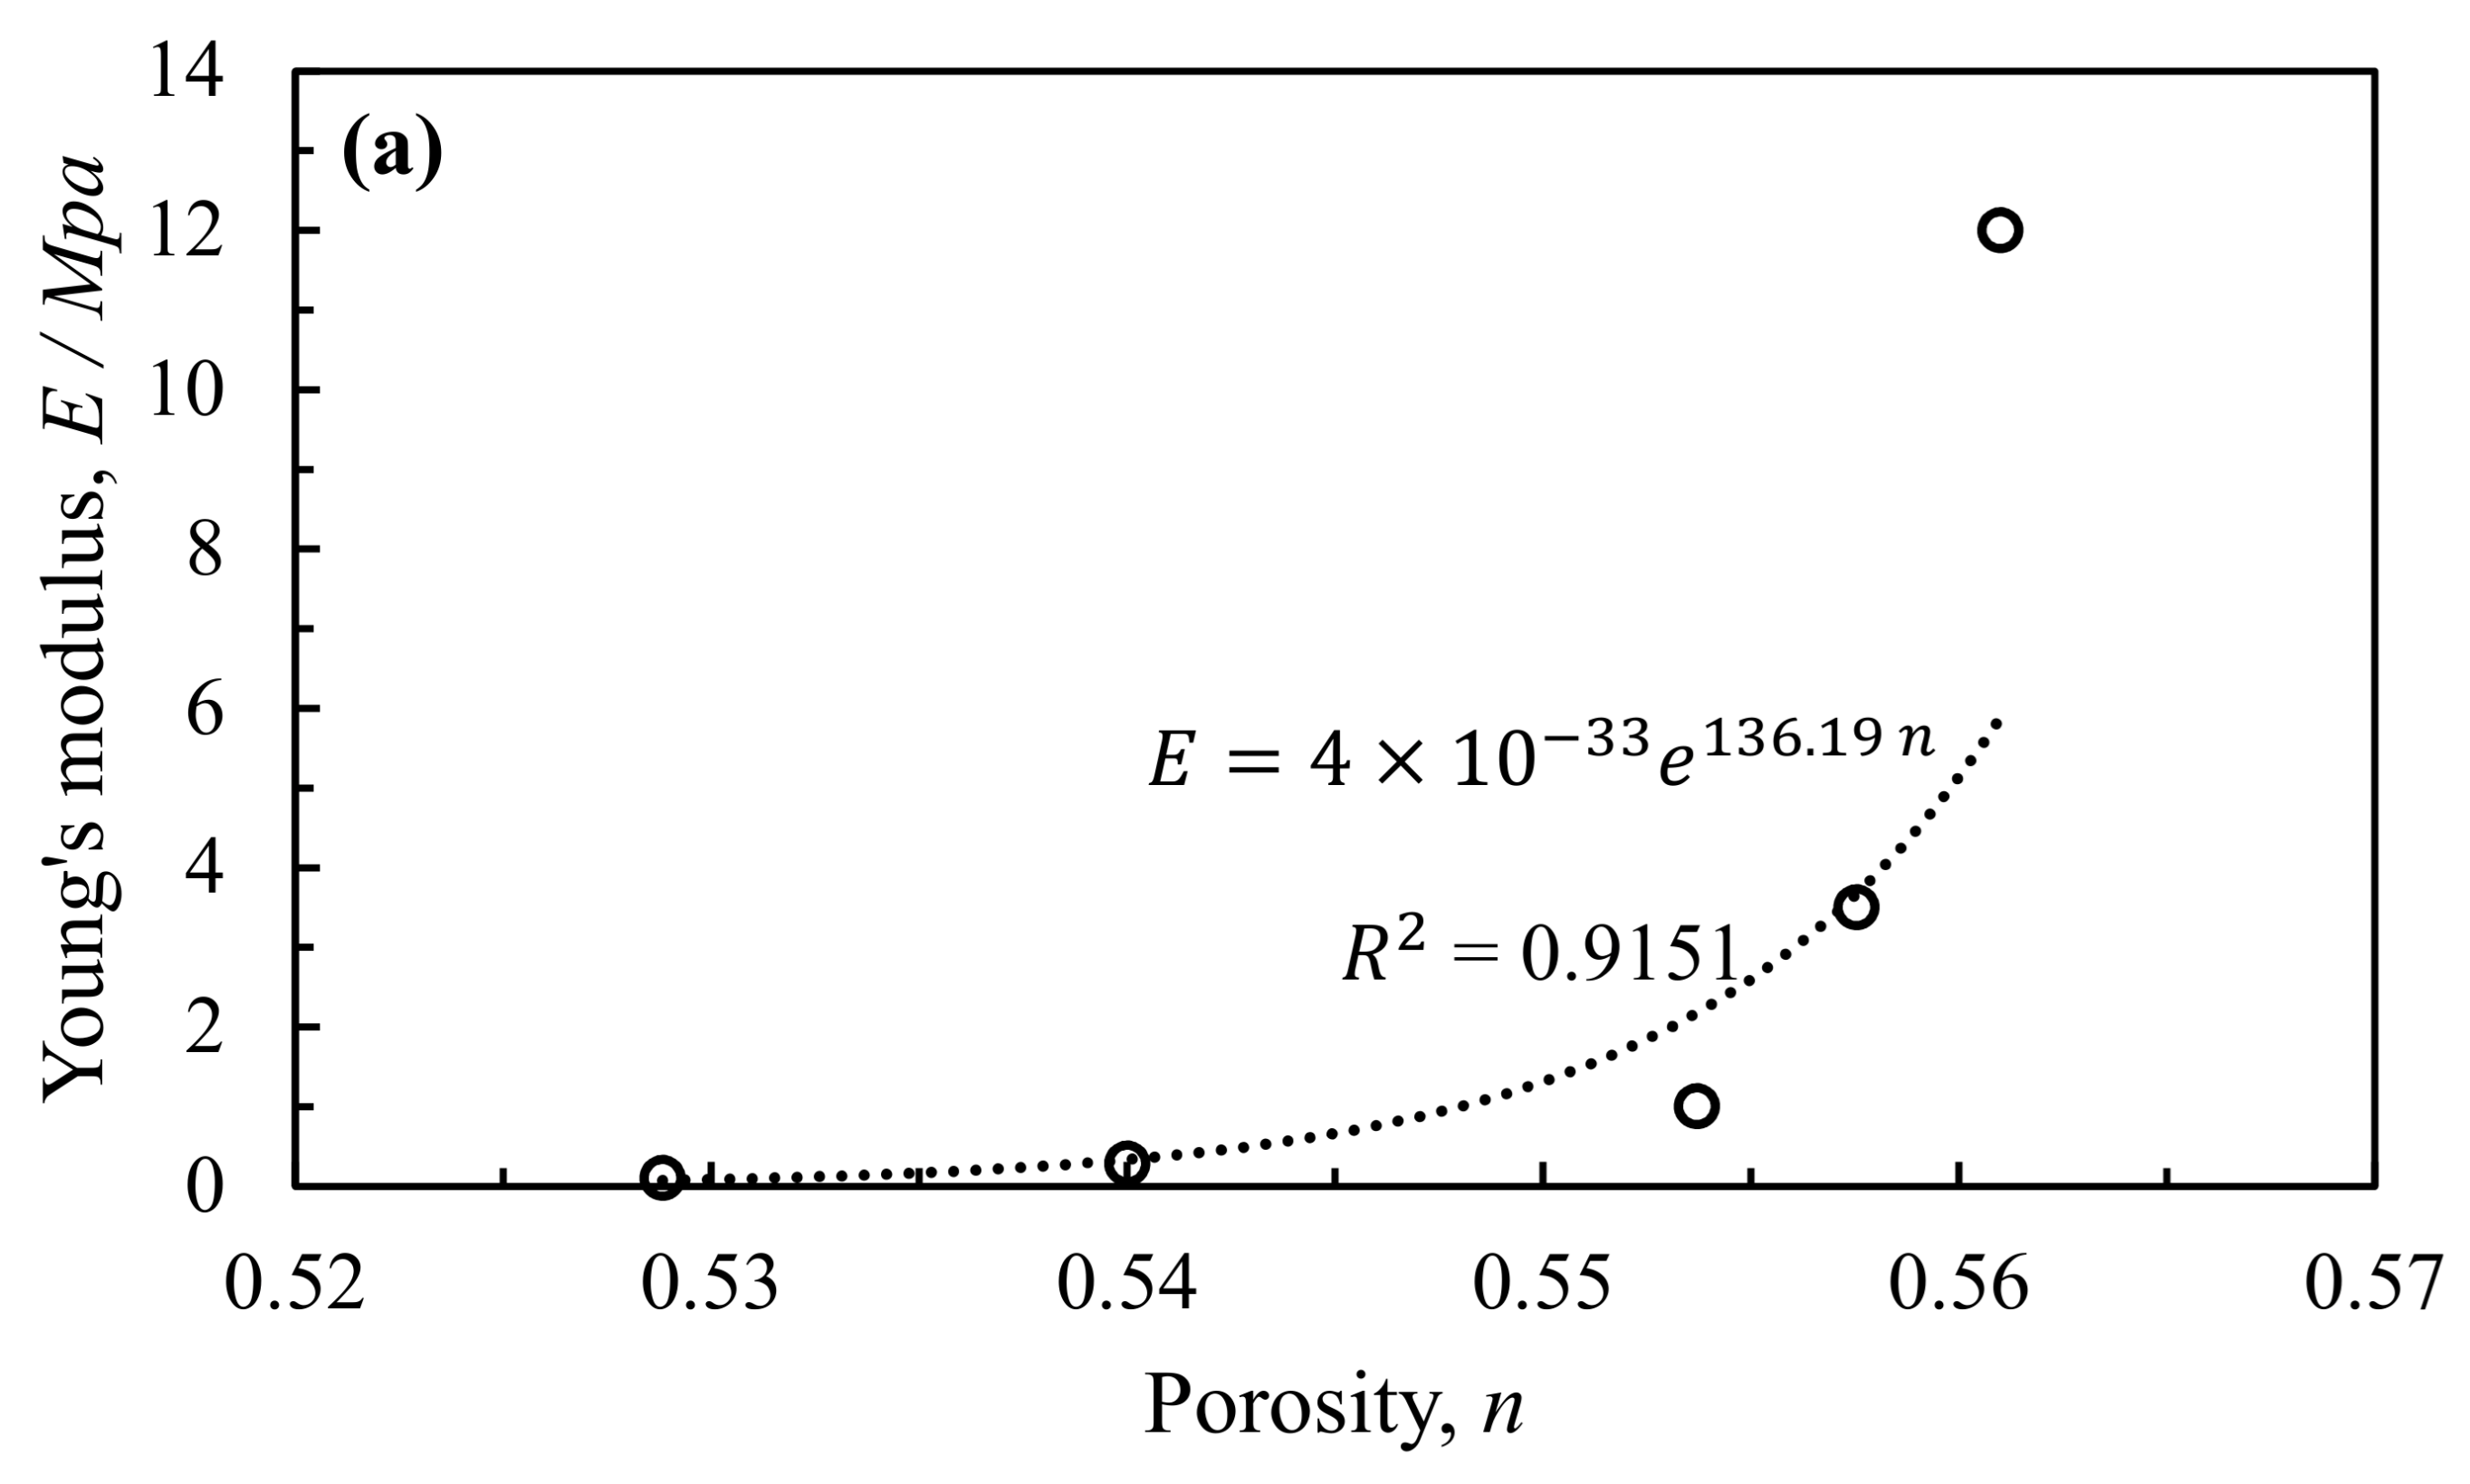
4.3. The Identification of Parameters in the M-C Model

The porosity n of each sample was measured, and the elastic modulus E , cohesion force c and friction angle φ can be achieved through the COMSOL simulation. According to Equations (2), (6) and (7), the parameters associated with the MC model (i.e., a E , b E ,   a c , b c ,   a φ ,   b φ ) can be estimated by the curve fitting based on the data of n and corresponding mechanical properties ( i.e., E , c and φ ). The obtained results are shown in Figure 7. The corresponding R 2 factor for young’s modulus, cohesive force, and friction angle in order are 0.9151, 0.9064, and 0.8688, indicating a good fitting. The value of R 2 in Figure 7c is relatively lower than that in Figure 7a,b), because the measured friction angle φ for sample No.3 is about 66°, much higher than other samples.

5. Conclusions

The mechanism of mechanical-chemical coupling was analyzed. Then the MC model for the cement stabilized marine clay was proposed, and verification studies were performed by comparing the obtained results from the experiment and those of the simulation. The mainly obtained results are summarized as follows:
  • The strength varies during the cement hydration process in the cement marine clay. According to the mechanism analysis of the MCI using SEM images, the porosity was employed to describe the influence of the mechanical-chemical coupling, and the MC model was appropriately established.
  • Comparisons were made between the predicted results by the MC model, the UCS test, and the existing strength model. The obtained results indicate that the proposed model is suitable for capturing the UCS strength of the cement marine clay. It is a simple model but an effective one with only one parameter (i.e., porosity), which can be readily obtained.
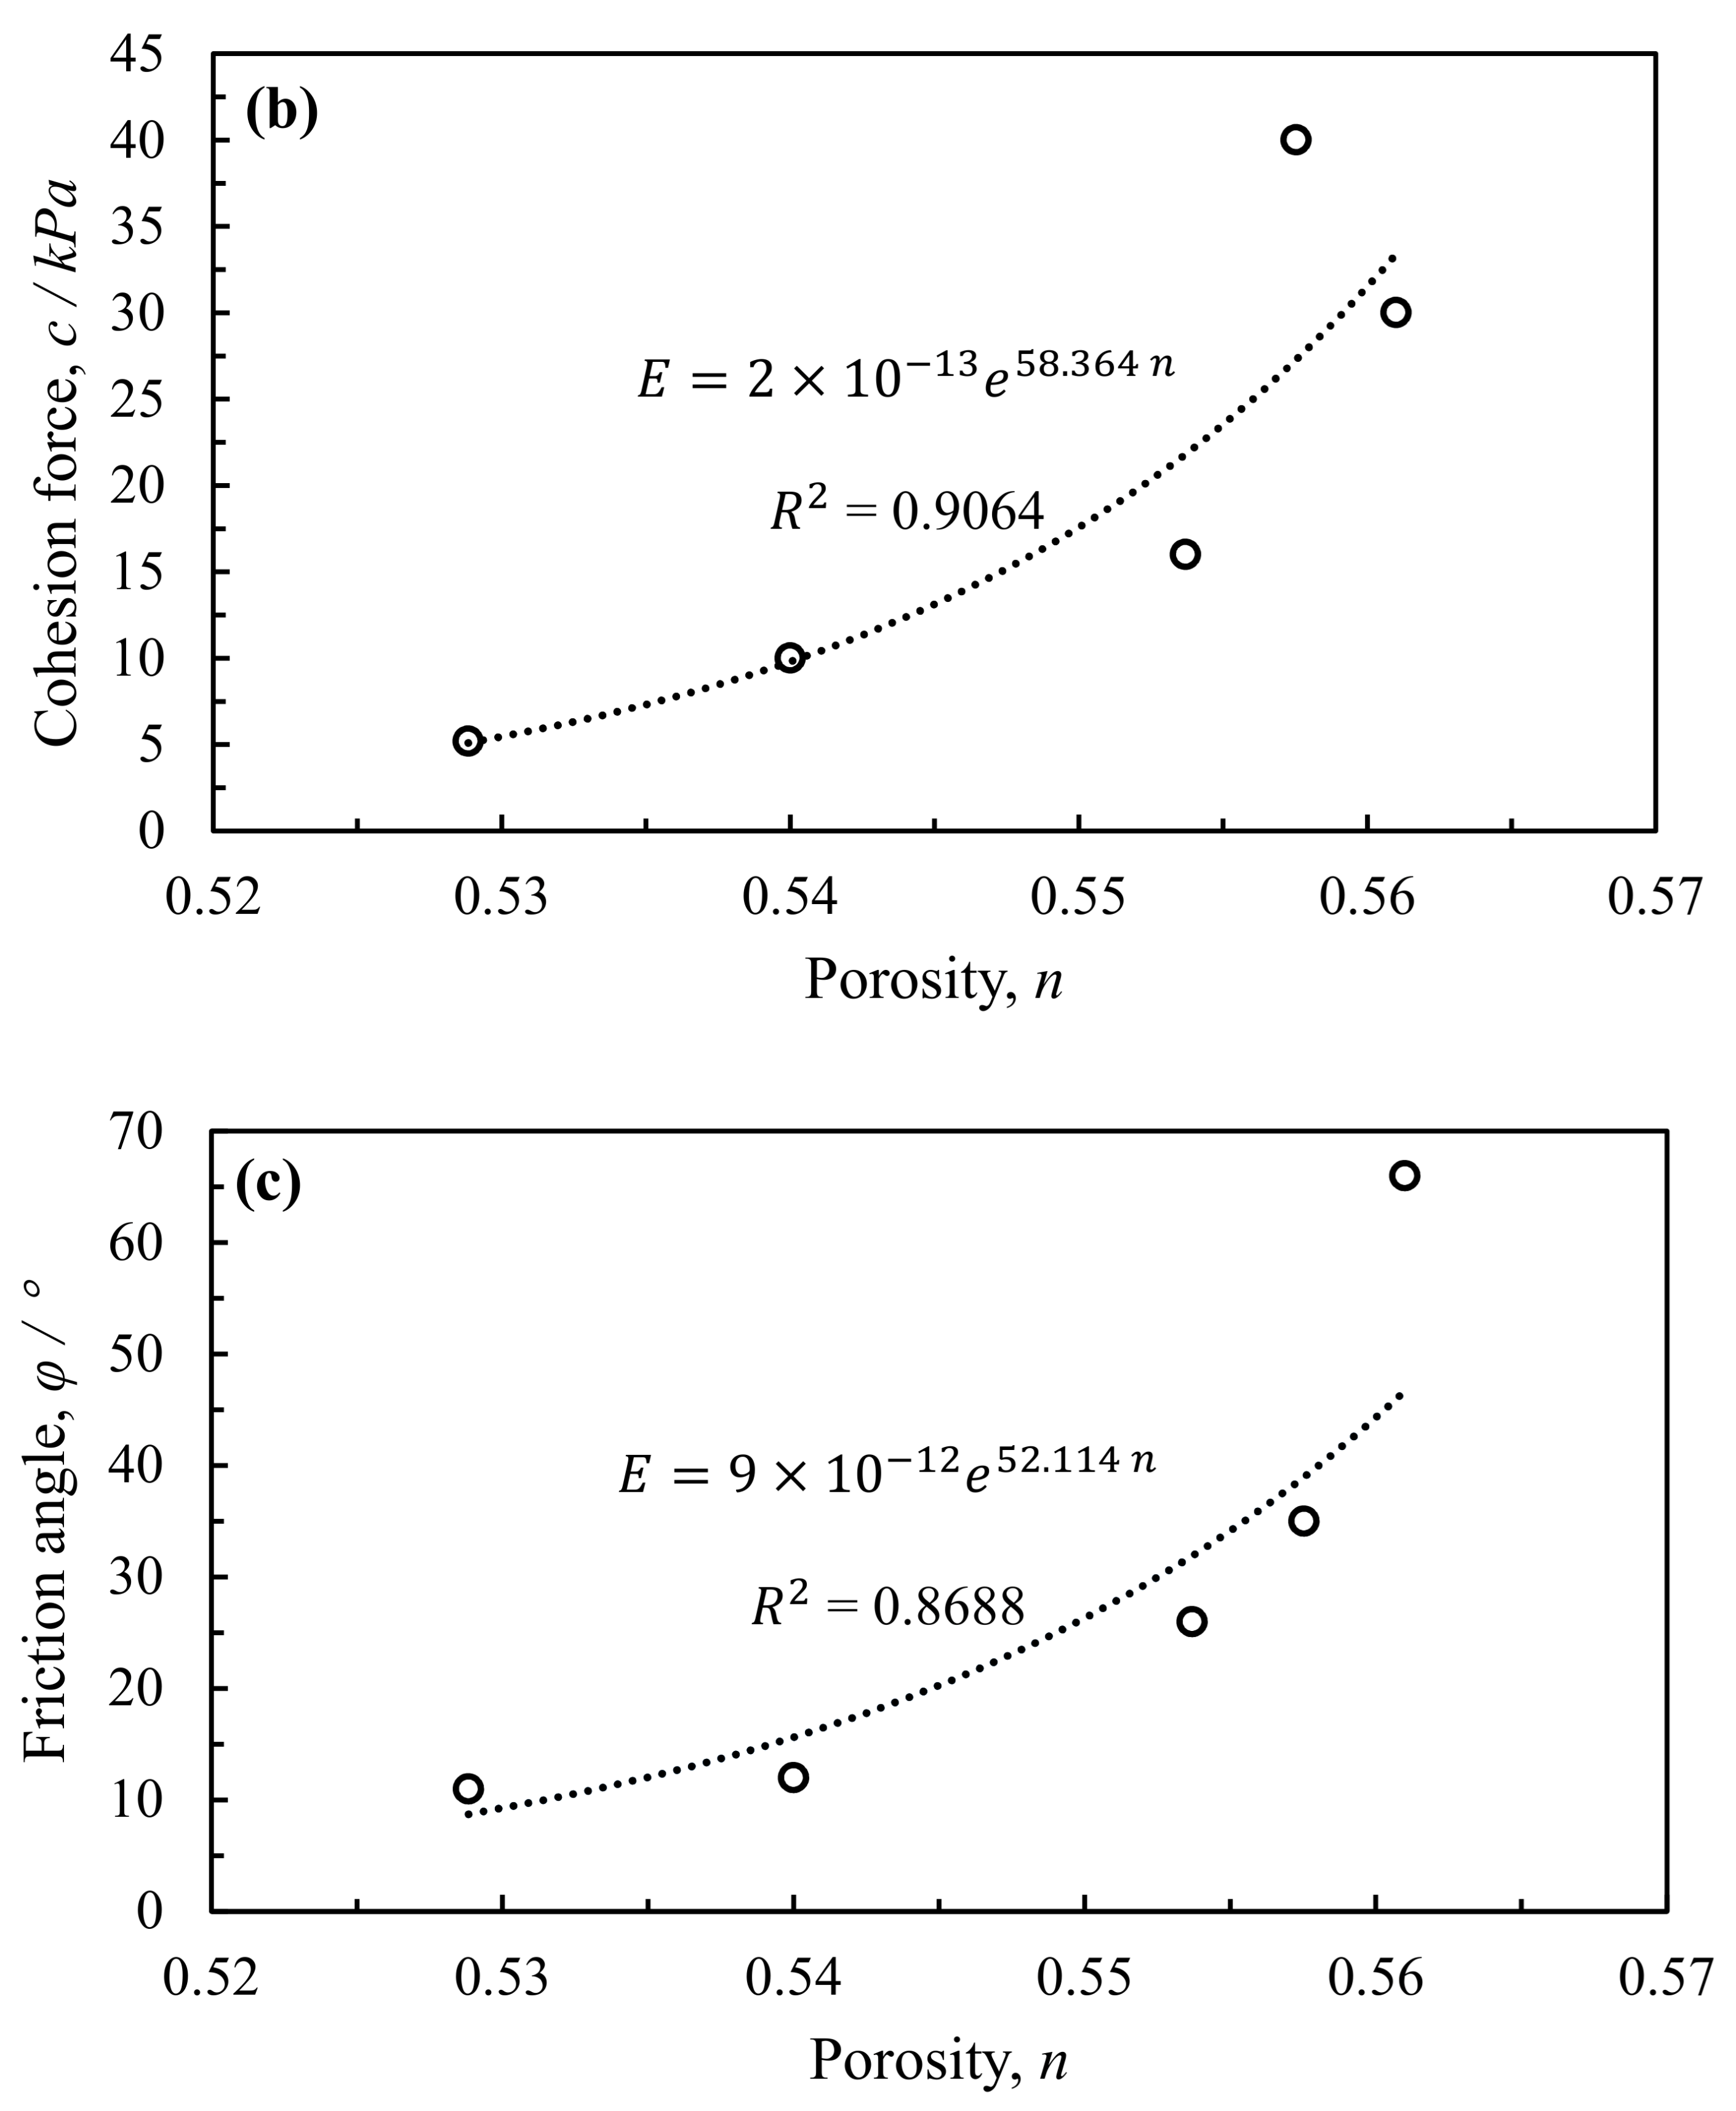
  • Regarding the stress–strain curve of the MC model, the elastic stage is controlled by Young’s modulus E , and the slope becomes steeper with its growth. Further, the plastic stage is controlled by the cohesion force c and friction angle φ , and the yield stress is enhanced by growing c and φ .

Author Contributions

Supervision, conceptualization, and project administration, R.X.; writing, investigation and data curation, L.X.; validation, Z.Y.; resources and investigation, J.Y.; resources and data curation, Q.X.; writing—review and editing, J.Z. All authors have read and agreed to the published version of the manuscript.

Funding

This research was funded by the National Natural Science Foundation of China under Grant No. 41672264; the Key Research and Development Program of Zhejiang Province, China, under Grant No. 2019C03103; and the China Scholarship Council under Grant No. 201906320246.

Institutional Review Board Statement

Not applicable.

Informed Consent Statement

Not applicable.

Data Availability Statement

All data, models, or code generated or used during the study are available from the corresponding author by request, including all raw data from the tests, all used test results.

Conflicts of Interest

The authors declare no conflict of interest.

References

  1. Al-Bared, M.A.M.; Marto, A. A Review on the Geotechnical and Engineering Characteristics of Marine Clay and the Modern Methods of Improvements. Malays. J. Fundam. Appl. Sci. 2017, 13, 825–831. [Google Scholar] [CrossRef] [Green Version]
  2. Zainuddin, N.; Yunus, N.Z.M.; Al-Bared, M.A.M.; Marto, A.; Harahap, I.S.H.; Rashid, A.S.A. Measuring the Engineering Properties of Marine Clay Treated with Disposed Granite Waste. Measurement 2019, 131, 50–60. [Google Scholar] [CrossRef]
  3. Saisubramanian, R.; Murugaiyan, V.; Sundararajan, T. Studies on Characteristics, Applications and Strength Improvement of Marine Clay: A Review. J. Geosci. Environ. Prot. 2019, 7, 93–106. [Google Scholar] [CrossRef] [Green Version]
  4. Shenal Jayawardane, V.; Anggraini, V.; Emmanuel, E.; Yong, L.L.; Mirzababaei, M. Expansive and Compressibility Behavior of Lime Stabilized Fiber-Reinforced Marine Clay. J. Mater. Civ. Eng. 2020, 32, 04020328. [Google Scholar] [CrossRef]
  5. Wu, H.N.; Shen, S.L.; Ma, L.; Yin, Z.Y.; Horpibulsuk, S. Evaluation of the Strength Increase of Marine Clay under Staged Embankment Loading: A Case Study. Mar. Georesour. Geotechnol. 2015, 33, 532–541. [Google Scholar] [CrossRef]
  6. Al-Bared, M.A.M.; Marto, A. Evaluating the Compaction Behaviour of Soft Marine Clay Stabilized with Two Sizes of Recycled Crushed Tiles. In Proceedings of the Global Civil Engineering Conference, Kuala Lumpur, Malaysia, 25–28 July 2017; Springer: Singapore, 2017; pp. 1273–1284. [Google Scholar]
  7. Al-Bared, M.A.M.; Marto, A.; Latifi, N.; Horpibulsuk, S. Sustainable Improvement of Marine Clay Using Recycled Blended Tiles. Geotech. Geol. Eng. 2018, 36, 3135–3147. [Google Scholar] [CrossRef]
  8. Al-Bared, M.A.M.; Marto, A.; Hamonangan, I.S.; Kasim, F. Compaction and Plasticity Comparative Behaviour of Soft Clay Treated with Coarse and Finesizes of Ceramic Tiles. E3S Web Conf. 2018, 34, 01012. [Google Scholar] [CrossRef] [Green Version]
  9. Al-Bared, M.A.M.; Mustaffa, Z.; Armaghani, D.J.; Marto, A.; Yunus, N.Z.M.; Hasanipanah, M. Application of Hybrid Intelligent Systems in Predicting the Unconfined Compressive Strength of Clay Material Mixed with Recycled Additive. Transp. Geotech. 2021, 30, 100627. [Google Scholar] [CrossRef]
  10. Arulrajah, A.; Yaghoubi, M.; Disfani, M.M.; Horpibulsuk, S.; Bo, M.W.; Leong, M. Evaluation of Fly Ash-and Slag-Based Geopolymers for the Improvement of a Soft Marine Clay by Deep Soil Mixing. Soils Found. 2018, 58, 1358–1370. [Google Scholar] [CrossRef]
  11. Phetchuay, C.; Horpibulsuk, S.; Arulrajah, A.; Suksiripattanapong, C.; Udomchai, R. Strength Development in Soft Marine clay Stabilized by Fly Ash and Calcium Carbide Residue Based Geopolymer. Appl. Clay Sci. 2016, 127, 134–142. [Google Scholar] [CrossRef]
  12. Yaghoubi, M.; Arulrajah, A.; Disfani, M.M.; Horpibulsuk, S.; Darmawan, S.; Wang, J. Impact of Field Conditions on the Strength Development of a Geopolymer Stabilized Marine Clay. Appl. Clay Sci. 2019, 167, 33–42. [Google Scholar] [CrossRef]
  13. Dahal, B.K.; Zheng, J.J.; Zhang, R.J.; Song, D.B. Enhancing the Mechanical Properties of Marine Clay Using Cement Solidification. Mar. Georesour. Geotechnol. 2019, 37, 755–764. [Google Scholar] [CrossRef]
  14. Tan, T.S.; Goh, T.L.; Yong, K.Y. Properties of Singapore Marine Clays Improved by Cement Mixing. Geotech. Test. J. 2002, 25, 422–433. [Google Scholar]
  15. Ivanov, V.; Chu, J.; Stabnikov, V.; Li, B. Strengthening of Soft Marine Clay Using Bioencapsulation. Mar. Georesour. Geotechnol. 2015, 33, 320–324. [Google Scholar] [CrossRef]
  16. Latifi, N.; Eisazadeh, A.; Marto, A.; Meehan, C.L. Tropical Residual Soil Stabilization: A Powder Form Material for Increasing Soil Strength. Constr. Build. Mater. 2017, 147, 827–836. [Google Scholar] [CrossRef]
  17. Saleh, S.; Yunus, N.Z.M.; Ahmad, K.; Ali, N. Stabilization of Marine Clay Soil Using Polyurethane. MATEC Web Conf. EDP Sci. 2018, 250, 01004. [Google Scholar] [CrossRef]
  18. Emmanuel, E.; Lau, C.C.; Anggraini, V.; Pasbakhsh, P. Stabilization of a Soft Marine Clay Using Halloysite Nanotubes: A Multiscale Approach. Appl. Clay Sci. 2019, 173, 65–78. [Google Scholar] [CrossRef]
  19. Wang, W.; Li, Y.; Yao, K.; Li, N.; Zhou, A.; Zhang, C. Strength Properties of Nano-MgO and Cement Stabilized Coastal Silty Clay Subjected to Sulfuric acid Attack. Mar. Georesour. Geotechnol. 2020, 38, 1177–1186. [Google Scholar] [CrossRef]
  20. Xiao, H.; Shen, W.; Lee, F.H. Engineering Properties of Marine Clay Admixed with Portland Cement and Blended Cement with Siliceous Fly Ash. J. Mater. Civ. Eng. 2017, 29, 04017177. [Google Scholar] [CrossRef]
  21. Ghirian, A.; Fall, M. Coupled Thermo-Hydro-Mechanical–Chemical Behaviour of Cemented Paste Backfill in Column Exper-iments. Part I: Physical, Hydraulic and Thermal Processes and Characteristics. Eng. Geol. 2013, 164, 195–207. [Google Scholar] [CrossRef]
  22. Loret, B.; Hueckel, T.; Gajo, A. Chemo-Mechanical Coupling in Saturated Porous Media: Elastic–Plastic Behaviour of Homoionic Expansive Clays. Int. J. Solids Struct. 2002, 39, 2773–2806. [Google Scholar] [CrossRef] [Green Version]
  23. Santamarina, J.C.; Klein, K.A.; Palomino, A.; Guimaraes, M.S. Micro-Scale Aspects of Chemical-Mechanical Coupling Interparticle Forces and Fabric. In Chemo-Mechanical Coupling in Clays; Routledge: London, UK, 2002; Volume 10, p. 2. [Google Scholar]
  24. Ng, C.; Alengaram, U.J.; Wong, L.S.; Mo, K.H.; Jumaat, M.Z.; Ramesh, S. A Review on Microstructural Study and Compressive Strength of Geopolymer Mortar, Paste and Concrete. Constr. Build. Mater. 2018, 186, 550–576. [Google Scholar] [CrossRef]
  25. Lei, H.; Wang, L.; Jia, R.; Jiang, M.; Zhang, W.; Li, C. Effects of Chemical Conditions on the Engineering Properties and Microscopic Characteristics of Tianjin Dredged Fill. Eng. Geol. 2020, 269, 105548. [Google Scholar] [CrossRef]
  26. Ghirian, A.; Fall, M. Coupled Thermo-Hydro-Mechanical–Chemical Behaviour of Cemented Paste Backfill in Column Experiments. Part II: Mechanical, Chemical and Microstructural Processes and Characteristics. Eng. Geol. 2014, 170, 11–23. [Google Scholar] [CrossRef]
  27. Ekinci, A. Effect of Preparation Methods on Strength and Microstructural Properties of Cemented Marine Clay. Constr. Build. Mater. 2019, 227, 116690. [Google Scholar] [CrossRef]
  28. Rashid, A.S.A.; Latifi, N.; Meehan, C.L.; Manahiloh, K.N. Sustainable Improvement of Tropical Residual Soil Using an Envi-ronmentally Friendly Additive. Geotech. Geol. Eng. 2017, 35, 2613–2623. [Google Scholar] [CrossRef]
  29. Saleh, S.; Yunus, N.Z.M.; Ahmad, K.; Ali, N.; Marto, A. Micro-Level Analysis of Marine Clay Stabilised with Polyurethane. KSCE J. Civ. Eng. 2020, 24, 807–815. [Google Scholar] [CrossRef]
  30. Ekinci, A.; Hanafi, M.; Aydin, E. Strength, Stiffness, and Microstructure of Wood-Ash Stabilized Marine Clay. Minerals 2020, 10, 796. [Google Scholar] [CrossRef]
  31. Kou, H.; Jia, H.; Chu, J.; Zheng, P.-G.; Liu, A.-S. Effect of Polymer on Strength and Permeability of Marine Clay. Mar. Georesour. Geotechnol. 2021, 39, 234–240. [Google Scholar] [CrossRef]
  32. Wu, J.; Deng, Y.; Zheng, X.; Cui, Y.; Zhao, Z.; Chen, Y.; Zha, F. Hydraulic Conductivity and Strength of Foamed Cement-Stabilized Marine Clay. Constr. Build. Mater. 2019, 222, 688–698. [Google Scholar] [CrossRef]
  33. Kang, G.; Tsuchida, T.; Wakioka, H.; Kim, Y. Strength Mobilization of Cement-Treated Marine Clay with Various Curing Time. Jpn. Geotech. Soc. Spec. Publ. 2016, 2, 2047–2052. [Google Scholar] [CrossRef] [Green Version]
  34. Ma, T.S.; Chen, P.; Zhang, Q.B.; Zhao, J. A Novel Collapse Pressure Model with Mechanical-Chemical Coupling in Shale Gas Formations with Multi-Weakness Planes. J. Nat. Gas Sci. Eng. 2016, 36, 1151–1177. [Google Scholar] [CrossRef]
  35. Locat, J.; Bérubé, M.; Choquette, M. Laboratory Investigations on the Lime Stabilization of Sensitive Clays: Shear Strength De-velopment. Can. Geotech. J. 1990, 27, 294–304. [Google Scholar] [CrossRef]
  36. Bi, J.; Chian, S.C. Modelling of Three-Phase Strength Development of Ordinary Portland Cement- and Portland Blast-Furnace Cement-Stabilised Clay. Géotechnique 2020, 70, 80–89. [Google Scholar] [CrossRef]
  37. Yamashita, E.; Cikmit, A.A.; Tsuchida, T.; Hashimato, R. Strength Estimation of Cement-Treated Marine Clay with Wide Ranges of Sand and Initial Water Contents. Soils Found. 2020, 60, 1065–1083. [Google Scholar] [CrossRef]
  38. Yao, K.; Pan, Y.; Jia, L.; Yi, J.T.; Hu, J.; Wu, C. Strength Evaluation of Marine Clay Stabilized by Cementitious Binder. Mar. Georesour. Geotechnol. 2020, 38, 730–743. [Google Scholar] [CrossRef]
  39. Yin, Z.Y.; Yin, J.H.; Huang, H.W. Rate-Dependent and Long-Term Yield Stress and Strength of Soft Wenzhou Marine Clay: Experiments and Modeling. Mar. Georesour. Geotechnol. 2015, 33, 79–91. [Google Scholar] [CrossRef]
  40. Horpibulsuk, S.; Rachan, R.; Suddeepong, A. Assessment of strength development in blended cement admixed Bangkok Clay. Constr. Build. Mater. 2011, 25, 1521–1531. [Google Scholar] [CrossRef]
  41. Ma, C.; Chen, L.Z.; Chen, B. Analysis of Strength Development in Soft Clay Stabilized with Cement-Based Stabilizer. Constr. Build. Mater. 2014, 71, 354–362. [Google Scholar]
  42. Lorenzo, G.A.; Bergado, D.T. Fundamental Parameters of Cement-Admixed Clay—New Approach. J. Geotech. Geoenviron. Eng. 2004, 130, 1042–1050. [Google Scholar] [CrossRef]
  43. Lee, F.-H.; Lee, Y.; Chew, S.-H.; Yong, K.-Y. Strength and Modulus of Marine Clay-Cement Mixes. J. Geotech. Geoenviron. Eng. 2005, 131, 178–186. [Google Scholar] [CrossRef]
  44. Read, D.; Glasser, F.P.; Ayora, C.; Guardiola, M.T.; Sneyers, A. Mineralogical and Microstructural Changes Accompanying the Interaction of Boom Clay with Ordinary Portland Cement. Adv. Cem. Res. 2001, 13, 175–183. [Google Scholar] [CrossRef]
  45. Gaucher, E.C.; Blanc, P. Cement/Clay Interactions—A Review: Experiments, Natural Analogues, and Modeling. Waste Manag. 2006, 26, 776–788. [Google Scholar] [CrossRef] [Green Version]
  46. Chian, S.C.; Nguyen, S.T.; Phoon, K.K. Extended Strength Development Model of Cement-Treated Clay. J. Geotech. Geoenviron. Eng. 2016, 142, 06015014. [Google Scholar] [CrossRef]
  47. Japan Cement Association. Ground Improvement Manual Using Cement-Based Solidification Material; JCA: Chiyoda-ku, Japan, 2007; Volume 3, pp. 43–44. [Google Scholar]
Figure 1. Sample preparation. (a) Mixture of marine clay and OPC cement. (b) The sample for strength test. (c) The samples for SEM observation.
Jmse 09 01454 g001
Figure 2. Comparison of cemented marine clay after 3 d and 28 d to show the influence of cement hydration on the microstructure and strength. (a) SEM images of 3 d cement marine clay. (b) SEM image of 28 d cement marine clay. (c) Concept model of 3 d cement marine clay. (d) Concept model of 28 d cement marine clay. (e) Comparison of strength for samples with different curing time.
Jmse 09 01454 g002aJmse 09 01454 g002b
Figure 3. Simulation of unconfined compressive strength test. (a) The WDW–T50 type microcomputer controlled electronic universal testing machine. (b) The corresponding UCS simulation model built by COMSOL.
Jmse 09 01454 g003
Figure 4. Comparison between the UCS experiment and COMSOL simulation. (a) Influence of different cement content. (b) Influence of different curing time.
Jmse 09 01454 g004aJmse 09 01454 g004b
Figure 5. Comparison of measured strength and estimated strength by two existing models and M-C model.
Jmse 09 01454 g005
Figure 6. Influence of each mechanical parameter on stress–strain curve. (a) Influence of different elastic modulus. (b) Influence of different cohesion force. (c) Influence of different friction angle.
Jmse 09 01454 g006aJmse 09 01454 g006b
Figure 7. Relation between mechanical parameters and porosity in the M-C model. (a) Relation between elastic modulus and porosity. (b) Relation between cohesion force and porosity. (c) Relation between friction angle and porosity.
Jmse 09 01454 g007aJmse 09 01454 g007b
Table 1. Physical properties of Taizhou clay.
Water Content
(%)
Unit Weight
(kN·m−3)
Specific GravityPorosityLiquid
Limit
Plastic
Limit
59.8%17.32.8170.61651.924.5
Table 2. Test schedule.
No.Water Content
(%)
Cement Slurry
Content (%)
Water Cement Ratio in Cement SlurryCuring Age (Days)
140101:128
240151:128
340201:128
440101:114
540151:114
640201:114
740151:17
840101:13
940151:13
1040201:13
Table 3. UCS strength of cemented Taizhou clay.
No.Water Content
(%)
Cement Slurry
Content
(%)
Water–Cement Ratio in Cement SlurryCuring Age
(Days)
UCS Strength
(kPa)
140101:12850.6
240151:128158.26
340201:128354.2
440101:11412.05
540151:11424.75
640201:114122
740151:1711.33
840101:1311.31
940151:1310.21
1040201:1311.2
Table 4. The value of E , c , and φ in the M-C model.
No.Curing Age
(days)
Cement Content
(%)
Porosity before TestElastic Modulus
(MPa)
Cohesion Force
(kPa)
Friction Angle
(°)
128100.553711626
228150.55753.54035
328200.5610123066
414150.54010.281012
57150.52880.15.211
Publisher’s Note: MDPI stays neutral with regard to jurisdictional claims in published maps and institutional affiliations.

