Article

Factors Affecting Soil Organic Carbon Content between Natural and Reclaimed Sites in Rudong Coast, Jiangsu Province, China

1
School of Marine Science and Engineering, Nanjing Normal University, Nanjing 210023, China
2
Jiangsu Center for Collaborative Innovation in Geographical Information Resource Development and Application, Nanjing 210023, China
3
School of Geography, Nanjing Normal University, Nanjing 210023, China
4
Geography Teaching and Research Group, Urumqi No. 70 Senior High School, No. 52, Beijing South Road, Urumqi 830000, China
*
Author to whom correspondence should be addressed.
J. Mar. Sci. Eng. 2021, 9(12), 1453; https://doi.org/10.3390/jmse9121453
Submission received: 7 November 2021 / Revised: 9 December 2021 / Accepted: 15 December 2021 / Published: 18 December 2021
(This article belongs to the Special Issue Ocean Engineering and Oceanography for Carbon Neutralization)

Abstract

:
The physical and chemical properties of coastal soils in China have changed due to the development of reclaimed stretches of coastline, which has a significant impact on the dynamics of organic carbon (OC) in the soils. We evaluated changes in the physical and chemical properties of soils in both a natural area and a reclaimed area along the coast of Rudong County, China, as well as the effects that these changes had on the OC content of the soils. A partial least squares regression (PLSR) model was used to determine which factors are most important for driving changes in soil OC at four sites from each area. According to dominant vegetation types, there were significant differences in soil physical and chemical properties and OC content between the reclaimed area and natural coastal area. The mean grain size and pH increased gradually with depth, and values were highest in reclaimed areas. Mean total N (TN), P, and S, salinity, water content, and soil OC were highest in natural areas and decreased with depth. The PLSR model determined that TN, silt content, and sand content were the most important factors affecting soil OC in the reclaimed area, whereas TN, clay content, and water content were important factors affecting soil OC dynamics in the natural coastal areas. This study provides important reference data for correctly assessing the role and status of coastal areas in the global carbon cycle.

1. Introduction

The rapid increase in the levels of greenhouse gases since the Industrial Revolution—especially CO2—has exacerbated global warming [1], and reducing the risk of climate change is a major challenge worldwide. Carbon pool expansion represents a practical way to mitigate global warming by offsetting anthropogenic CO2 emissions [2]. The ocean is the largest carbon sequestration on Earth, and plays a crucial role in the global carbon cycle. It stores approximately 93% of the global CO2 and has absorbed more than one-third of CO2 emitted since the Industrial Revolution [3,4]. Coastal zones, including tidal marshes, only account for 0.2% of the global ocean area; however, they are the principal zones for marine carbon burial and 50% of the total marine carbon is stored in coastal marine sediments [5]. As such, increasing the carbon sequestration capacity of coastal zones is important for climate change mitigation.
The coastal zone is the area connecting the sea and the land. In recent years, with rapid growth of the global population and acceleration of urbanization, coastal zones are facing increasing pressures. The construction of ports and economic parks [6,7], beach reclamation [8,9], and other coastal development activities have greatly reduced the area of coastal wetlands [10,11]. Overall, coastal ecosystems have suffered severe ecological damage and their carbon sequestration potential has decreased significantly.
Tidal flat reclamation is common practice in the coastal areas of eastern China, and it plays an important role in reducing the pressures caused by population growth and urbanization [8,12], while also promoting economic development. However, tidal flat reclamation has also changed the physical and chemical properties of coastal soils [13,14], soil aggregate formation [15] (Kong et al., 2009), heavy metal accumulation [16,17], and alteration of the carbon sequestration capacity of the soil [18,19,20,21]. To date, there have been relatively few studies on the physical and chemical properties of soil and their influence on the organic carbon (OC) characteristics. Furthermore, no studies have drawn comparisons between reclaimed areas and natural coastal areas in terms of their soil OC content and carbon cycling. In order to understand the carbon sequestration capacity of different coastal environments, as well as their role in the global carbon cycle, it is important to study the physical and chemical properties of soils, variation in their OC characteristics, as well as the factors affecting OC burial. Furthermore, it is crucial to compare these traits between reclaimed coastal areas and natural coastal areas, as this can provide a reference for scientific management of coastal blue carbon and the design of sustainable coastal ecosystems.
In this study, we collected soil columnar samples from eight different locations in the coastal reclaimed area and the natural coastal area of Nantong City, in Rudong County, China. We measured the samples for OC content, total carbon (TC) content, total nitrogen (TN) content, grain size, water content, salinity (SAL), pH, and phosphorus (P) and sulfur (S) levels. The objectives of this study were to: (1) determine the organic carbon sequestration capacity of soil in natural coastal areas versus those in areas which have been reclaimed; (2) reveal the effects of soil hydrological, physical, and chemical properties on organic carbon sequestration capacity; and (3) determine the importance of the factors affecting the organic carbon sequestration capacity.

2. Materials and Methods
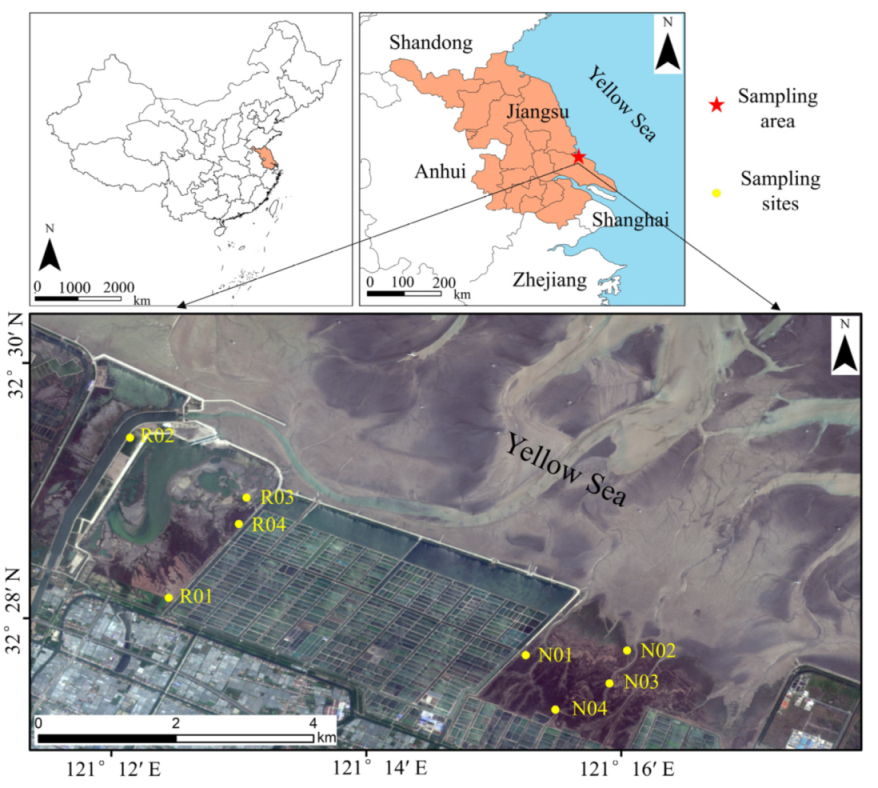
2.1. Study Area

The research was conducted in the coastal zone of Rudong County. Rudong County (120°42′–121°22′ E; 32°12′–32°36′ N), which has a total area of 1872 km2, is located north of the Yangtze River Delta, east of Jiangsu Province, and northeast of Nantong city (Figure 1). The area has a subtropical maritime monsoon climate, and is characterized by abundant precipitation, long frost-free periods, and mild, humid, sunny conditions. Sediments along the Rudong County coast are mainly sourced from the Yangtze River, which transports a large amount of detrital material from the upper reaches to the Yellow Sea, where they are redeposited via wave action along the coastline. The sediments in this area have characteristics of both terrestrial clastic materials and marine sediments.
Due to coastal development activities, dikes have been built in some areas of the Rudong coast in order to separate tidal flats and agricultural areas. Although agricultural activities have not been carried out in the dammed areas, the isolation of seawater has changed the hydrological and physicochemical properties of the soils. Accordingly, the vegetation has also undergone natural succession. In the natural coastal area, the main plant species is Spartina alterniflora, whereas, in the reclaimed area, the dominant species are Phragmites australis and Aeluropus.

2.2. Soil Sampling

On 18 May 2019, after nearly a week of fine weather, columnar soil samples were collected from eight sites in the coastal zone of Rudong County: four sites in the reclaimed area, numbered R01, R02, R03, and R04, which is not affected by sea water; and four sites in the natural coastal area, numbered N01, N02, N03, and N04, which is affected by tides (Figure 1). The subsamples were collected from the surface to a depth of 40 cm (0–40 cm) at 5 cm intervals at each site, and a total of 64 subsamples were obtained for the eight sampling sites. For water content analysis, a separate set of samples was taken using a cutting ring. The samples were refrigerated upon collection, transported back to the Key Laboratory of Ecological and Environmental Construction of Jiangsu Province, School of Geographical Sciences, Nanjing Normal University, and pretreated according to the experimental requirements. Thereafter, measurements of OC, TC, TN, grain size, water content, pH, SAL, P, and S were obtained.

2.3. Experimental Analysis

The samples used for OC, TC, and TN content, as well as P and S content, pH, and salinity (SAL) measurements were uniformly dried at a constant temperature of 40 °C, ground in an agate mortar, and passed through a 200-mesh fine sieve. The samples used for grain size analysis did not need to be dried; they could be used directly after pretreatment.

2.3.1. Measurement of OC, TC, and TN Content

A total of 250 mg of ground and sieved samples were weighed for the TC and TN test. In total, 2 g of ground and sieved samples were weighed and placed in a 100 mL centrifugal tube, and an appropriate concentration of 10% hydrochloric acid (HCl) was added to remove the inorganic C. Thereafter, 80 mL ultrapure water was added to dilute each subsample, and they were centrifuged, washed to neutral, dried in a constant temperature drying oven at 40 °C, and then placed in zip-locked bags for measuring OC. TC, OC, and TN were tested using a Vario Max elemental analyzer (Elementar, Langenselbold, Germany) in CN mode, and the sample analysis error was less than 0.03%. Since the inorganic C was removed prior to the OC test, the measured OC content was larger than the actual OC content in the soil. In order to correct for this error and to obtain the true OC content of the soil, the following mathematical equation was used:
OC = OC′ × (1 − TC)/(1 − OC′),
where OC is the true organic carbon content (mg/g); OC′ is the measured organic carbon content (mg/g) after removing inorganic carbon; and TC is the measured total carbon content (mg/g).

2.3.2. Grain Size Measurements

The following process was repeated for each sample: approximately 0.5 g of each soil sample was placed in a 100 mL beaker. Then, 10 mL of 10% hydrogen peroxide (H2O2) was added to completely remove the organic matter from the sample, and 10 mL of 10% HCl was added to completely remove any calcium cementitious material in the sample. Thereafter, 80 mL ultrapure water was added for dilution and the sample was allowed to stand for 24 h. Then, the solution supernatant was removed using a siphon. This was repeated several times until the sample solution pH was close to neutral. Finally, sodium hexametaphosphate dispersant was added to the sample solution, and the beaker was placed in an ultrasonic oscillator for oscillation to fully disperse the sample. After shaking, the grain size test was carried out using a Mastersizer 2000 particle size analyzer (Malvern Co., Malvern, UK). The measurement range of the instrument was 0.02–2000 µm, and the relative error was less than 2%.

2.3.3. Water Content Measurement

Each sample collected using the cutting ring was weighed directly to obtain its wet weight, dried in an oven at 40 °C for five days, and then reweighed to obtain its dry weight. The water content was calculated using the following formula:
W = (W1 − W2)/W2 × 100%,
where W is the water content (%); W1 is the wet weight of the soil sample (g); and W2 is the dry weight of the soil sample (g).

2.3.4. Measurement of pH and Salinity

A total of 2.5 g of ground and sieved samples were weighed and placed in 10 mL test tubes. A syringe was used to add 6.25 mL of ultrapure water to each test tube in order to mix it according to the water–soil ratio of 2.5:1. The test tubes were covered, shaken, and then placed on a test tube rack for 3 min. Then, an SX751 multi-parameter water quality instrument (Shanghai Sanxin Instrument Co., Ltd., Shanghai, China) was used to measure the pH and SAL. Both the pH and SAL were measured three times and the mean value was calculated.

2.3.5. Determination of the Nutrients P and S

A total of 5 g of ground and sieved samples were weighed out. The sample was treated with boric acid and then pressed into a tablet under 30 tons of pressure [22]. Levels of P and S were determined using an X-ray fluorescence spectrometer (XRF) (PANalytical Co., Almelo, The Netherlands), and the measurement error was less than 5%.

2.4. Factors Affecting OC Concentration

We used partial least squares regression (PLSR) to analyze the importance of factors affecting OC concentration. PLSR is a new multivariate statistical analysis method that integrates the advantages of principal component analysis, canonical correlation analysis, and multiple linear regression analysis. This method has been widely used to conduct regression analyses with small samples, multiple variables, and multicollinearity among variables [23,24,25,26]. PLSR presents multiple advantages over other methods; it easily identifies system information and noise, has a stronger interpretation ability for independent variables, and its results are more stable and reliable. PLSR uses cross-validation results to determine the number of components, avoids overfitting, and balances the interpretation ability (R2) and prediction ability (Q2) of the PLSR model [27]. The model is considered to have good predictive ability when the cumulative predictive value (Q2cum) of a dependent variable is greater than 0.5 [28,29]. The importance of an independent variable is measured by the variable importance in projection (VIP) value [30]. When VIP > 1, it means that the independent variable is important for predicting the dependent variable, whereas it is less important at V < 0.5 [29,31]. The regression coefficients (RC) indicate the action direction of each independent variable [32].

3. Results

3.1. Variation in Soil Physical and Chemical Properties
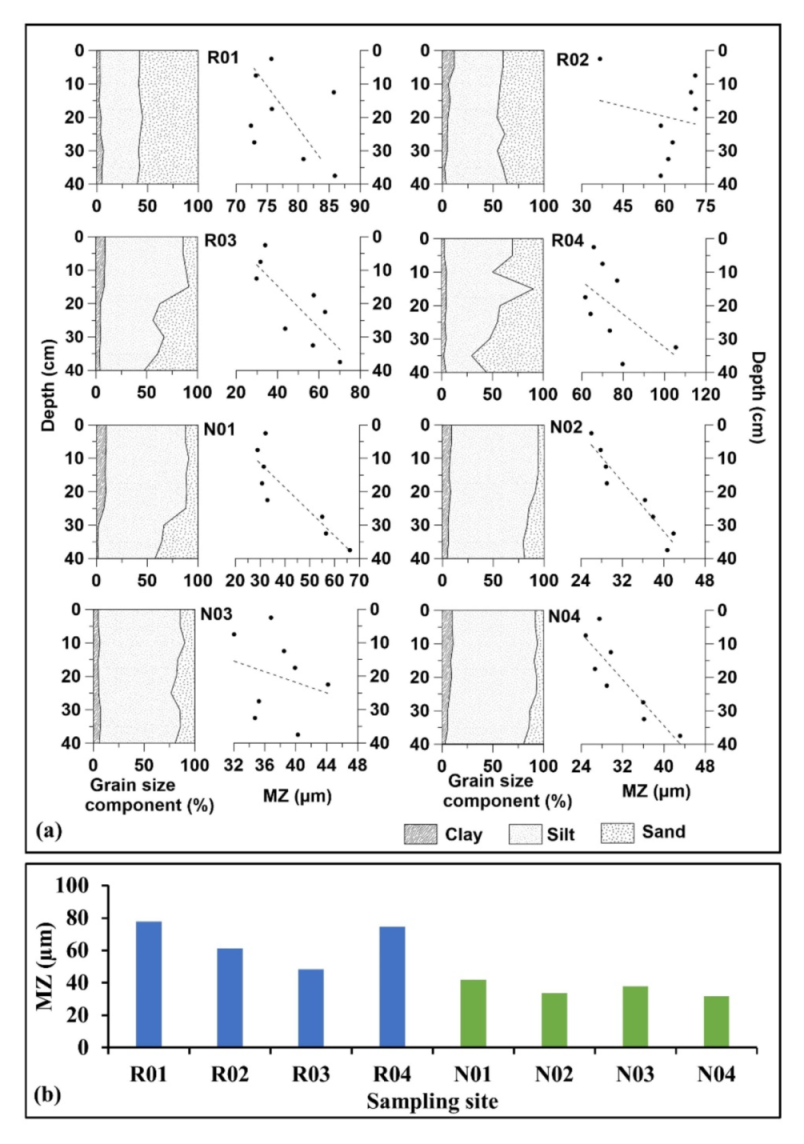
3.1.1. Grain Size

The soil samples from the reclaimed area (sites R01–R04) were mainly composed of sand and silt, with less clay content. The average mean grain sizes (MZ) from the four sampling sites were 77.81, 61.28, 48.35, and 74.65 µm, respectively. Generally, the MZ at each sampling site gradually increased with depth, except at site R02, where this trend was not clear. The soil samples from the natural coastal area (sites N01–N04) were mainly composed of silt, followed by sand and clay. The clay content in these samples was higher than that of samples from the reclaimed site, and the average MZs at the four sampling sites were 41.74, 33.57, 37.70, and 31.59 µm, respectively. The MZ at each sampling site increased gradually with depth (Figure 2a). Generally, the average MZs of soil samples from the natural coastal area were smaller than those from the reclaimed area (Figure 2b). The dominant species in the vegetation of the natural coastal area was S. alterniflora. S. alterniflora is an exotic pioneer plant species found in tidal flats and wetlands. As this species grows and develops, the vegetation density increases and it becomes more efficient at blocking tidal waters. This makes beds of S. alterniflora more conducive to the deposition of fine-grained sediments. Conversely, in reclaimed areas, activities are conducive to the formation of soil aggregates [15], and the mean grain size increases.

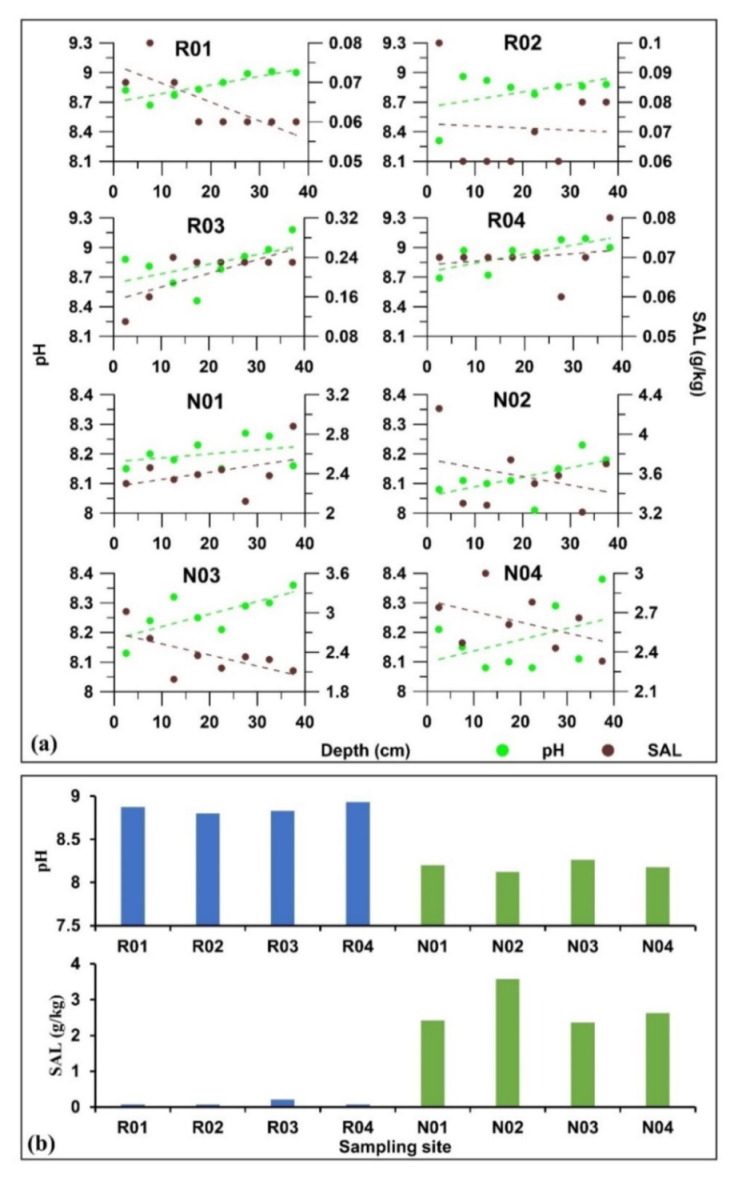
3.1.2. pH and Salinity

The pH values of soils from sites R01–R04 ranged from 8.31 to 9.18, and the mean values were 8.87, 8.80, 8.83, and 8.93, respectively. SAL ranged from 0.06 to 0.24 g/kg, with mean values of 0.071, 0.065, 0.208, and 0.07 g/kg, respectively. The pH values of soils from sites N01–N04 ranged from 8.01 to 8.38, and the mean values were 8.20, 8.12, 8.26, and 8.18, respectively. SAL ranged from 1.99 to 4.26 g/kg, with mean values of 2.414, 3.571, 2.359, and 2.628 g/kg, respectively. Generally, the pH at all eight sampling sites gradually increased with depth, which may be related to dilution by fresh water in surface soils, whereas SAL showed no clear trend with depth (Figure 3a). The mean pH of soils in the natural coastal area was lower than that of the soils in the reclaimed area, whereas their mean SAL was much higher (Figure 3b). In the natural coastal areas, the root system of S. alterniflora is more developed, and the organic acids produced by rhizosphere respiration continuously enter the soil. Therefore, the soil pH decreases as the vegetation beds of S. alterniflora continue to develop. The soil covered by P. australis and Aeluropus beds in the reclaimed area is no longer subject to the scouring effect of tidal waters. As a result, the soils are gradually desalinated through rainfall, resulting in the dissociation of colloidal exchangeable sodium ions, and the production of sodium carbonate and sodium bicarbonate, which leads to an increase in pH [33]. The soils covered by S. alterniflora had a higher salinity compared to that of soils covered by P. australis and Aeluropus. The rising tide floods the beds of S. alterniflora with seawater, which increases the salinity of the underlying sediment; conversely, in the reclaimed area, the soil is washed with freshwater by rain and is desalinated.

3.1.3. Nutrient Elements (TN, P, S)

The TN content of soils from sites R01–R04 ranged from 0.070 to 0.412 g/kg, and the mean values were 0.115, 0.143, 0.200, and 0.280 g/kg, respectively. The P content ranged from 0.495 to 0.595 g/kg, and the mean values were 0.541, 0.537, 0.570, and 0.538 g/kg, respectively. The S content ranged from 0.038 to 0.455 g/kg, with mean values of 0.094, 0.146, 0.162, and 0.062 g/kg, respectively. The TN content of soils from sites N01–N04 ranged from 0.092 to 0.829 g/kg, and the mean values were 0.485, 0.451, 0.415, and 0.497 g/kg, respectively. The P content ranged from 0.502 to 0.624 g/kg, and the mean values were 0.562, 0.559, 0.561, and 0.580 g/kg, respectively. The S content ranged from 0.237 to 0.647 g/kg, with mean values of 0.312, 1.153, 0.340, and 0.392 g/kg, respectively. In general, soil nutrients (TN, P, and S) in reclaimed areas and natural coastal areas decreased with depth, with the exception of the S content in soils from sites R01, R04, and N02 (Figure 4a). This may be due to the absorption of nutrient elements by vegetation roots, resulting in their decreased levels in the subsoil. The mean content of TN, P, and S in the soil at sites R01–R04 was lower than that of sites N01–N04, with the exception of P content at site R03 (Figure 4b). Previous studies have shown that S. alterniflora has high reserves and tolerance to S [34]; furthermore, a higher density of S. alterniflora greatly improves the content of organic matter in soil by increasing litter and root exudates, resulting in higher TN reserves.

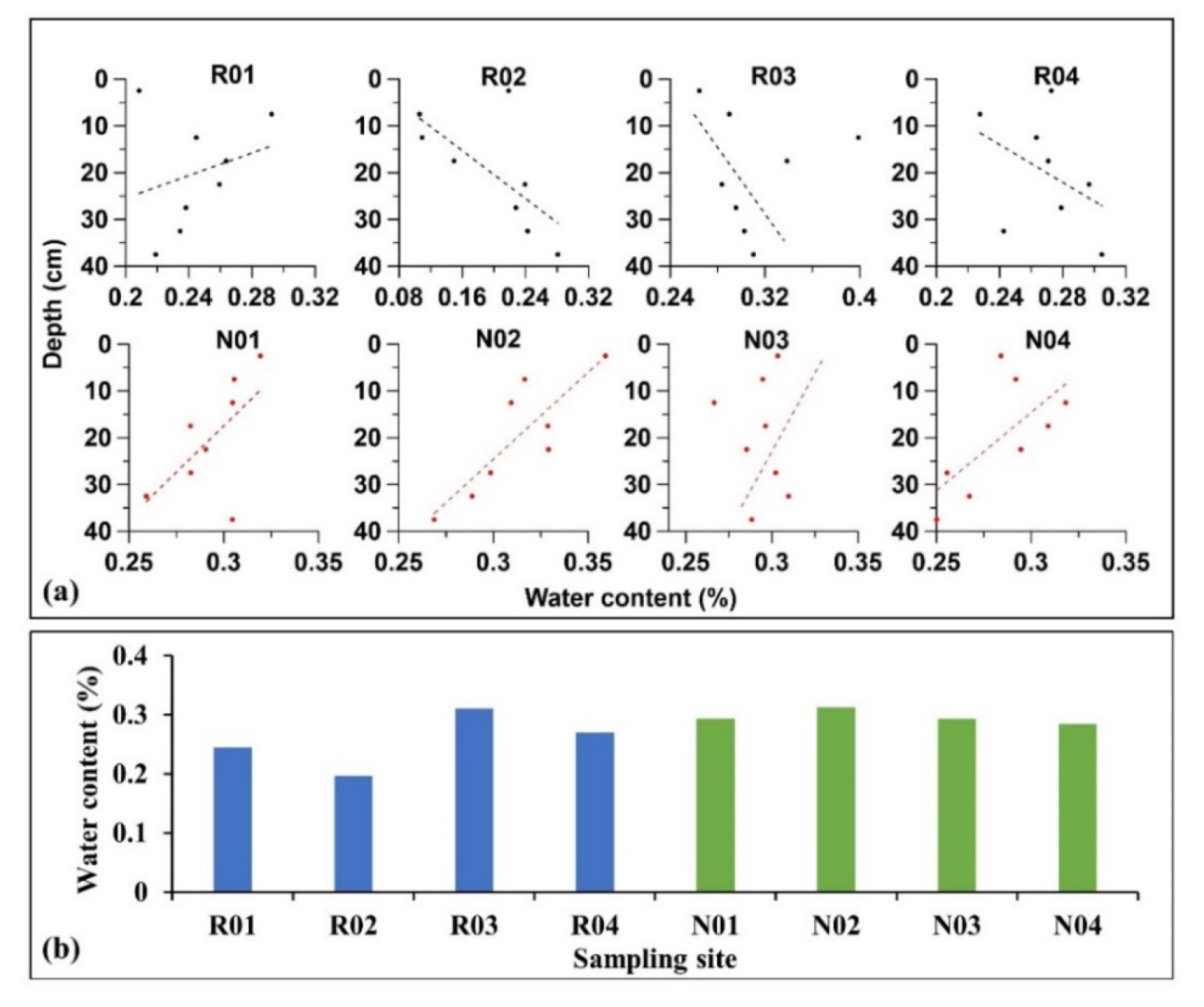
3.1.4. Water Content
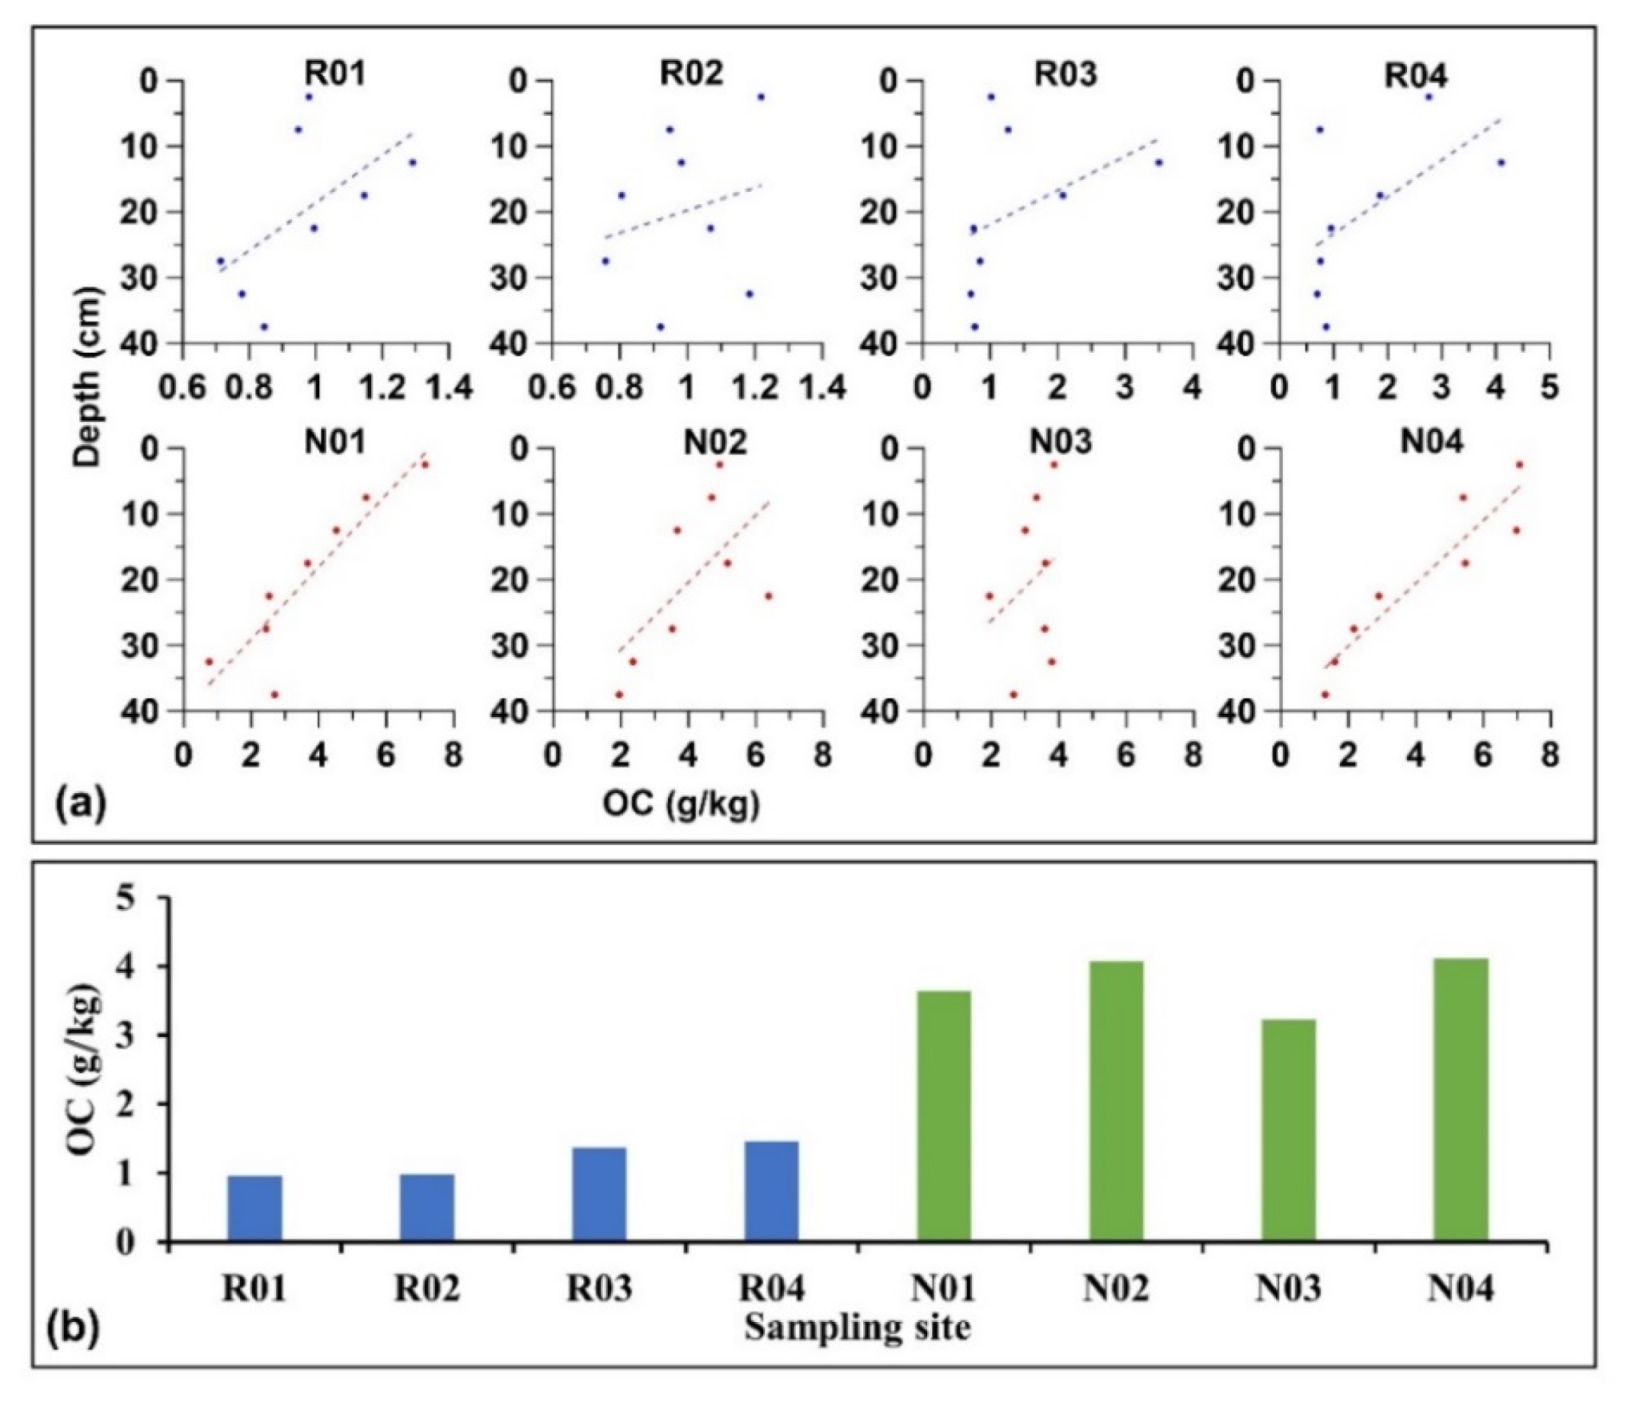
The mean water contents of soils from sites R01–R04 were 24.51, 19.67, 31.04, and 26.97%, respectively, and the mean water contents of soils from sites N01–N04 were 29.36, 31.23, 29.51, and 28.38%, respectively. Generally, there was more fluctuation in soil water content of samples from the reclaimed area. With the exception of site R01, soil water content in sampling sites within the reclaimed area gradually increased with depth. This is due to higher levels of soil evaporation and vegetation transpiration near to the ground surface, resulting in a lower soil moisture content. In the natural coastal area, the soil water content of sites gradually decreased with depth (Figure 5a). Sites in the natural coastal area are all affected by tidal waters, and more water is able to seep into the soil closer to its surface. Furthermore, soil compaction increases with depth, and water infiltration decreases as a result. Overall, the soil water content of sampling sites in reclaimed areas was slightly lower than that of sites in the natural coastal areas (Figure 5b). Sites in the natural coastal area are inundated by the tides and, thus, have a relatively stable, reliable water source. Conversely, the soil water supply in the reclaimed area is sourced mainly from natural precipitation and groundwater, which is further affected by weather conditions. As such, the water content of these soils is relatively low and subject to frequent fluctuations.

3.2. Organic Carbon

The mean OC content of soils from sites R01–R04 was 0.96, 0.99, 1.37, and 1.46 g/kg, respectively, and, for sites N01–N04, it was 3.64, 4.08, 3.22, and 4.11 g/kg, respectively. The OC content of soil at all sampling sites gradually decreased with depth (Figure 6a). The mean OC content of the soils from sampling sites in the natural coastal area was much greater than that of soils in the reclaimed area (Figure 6b).

3.3. Factors Influencing the Sequestration Capacity of OC

The sampling sites in reclaimed areas and natural coastal areas are subject to significant differences in environmental conditions; as such, the factors which influence the sequestration capacity of OC in these areas may vary. We used the OC content values of soils in the reclaimed and natural coastal areas as the response variables, and then used the PLSR model to analyze the data of all samples to identify factors that have an important impact on OC concentration.

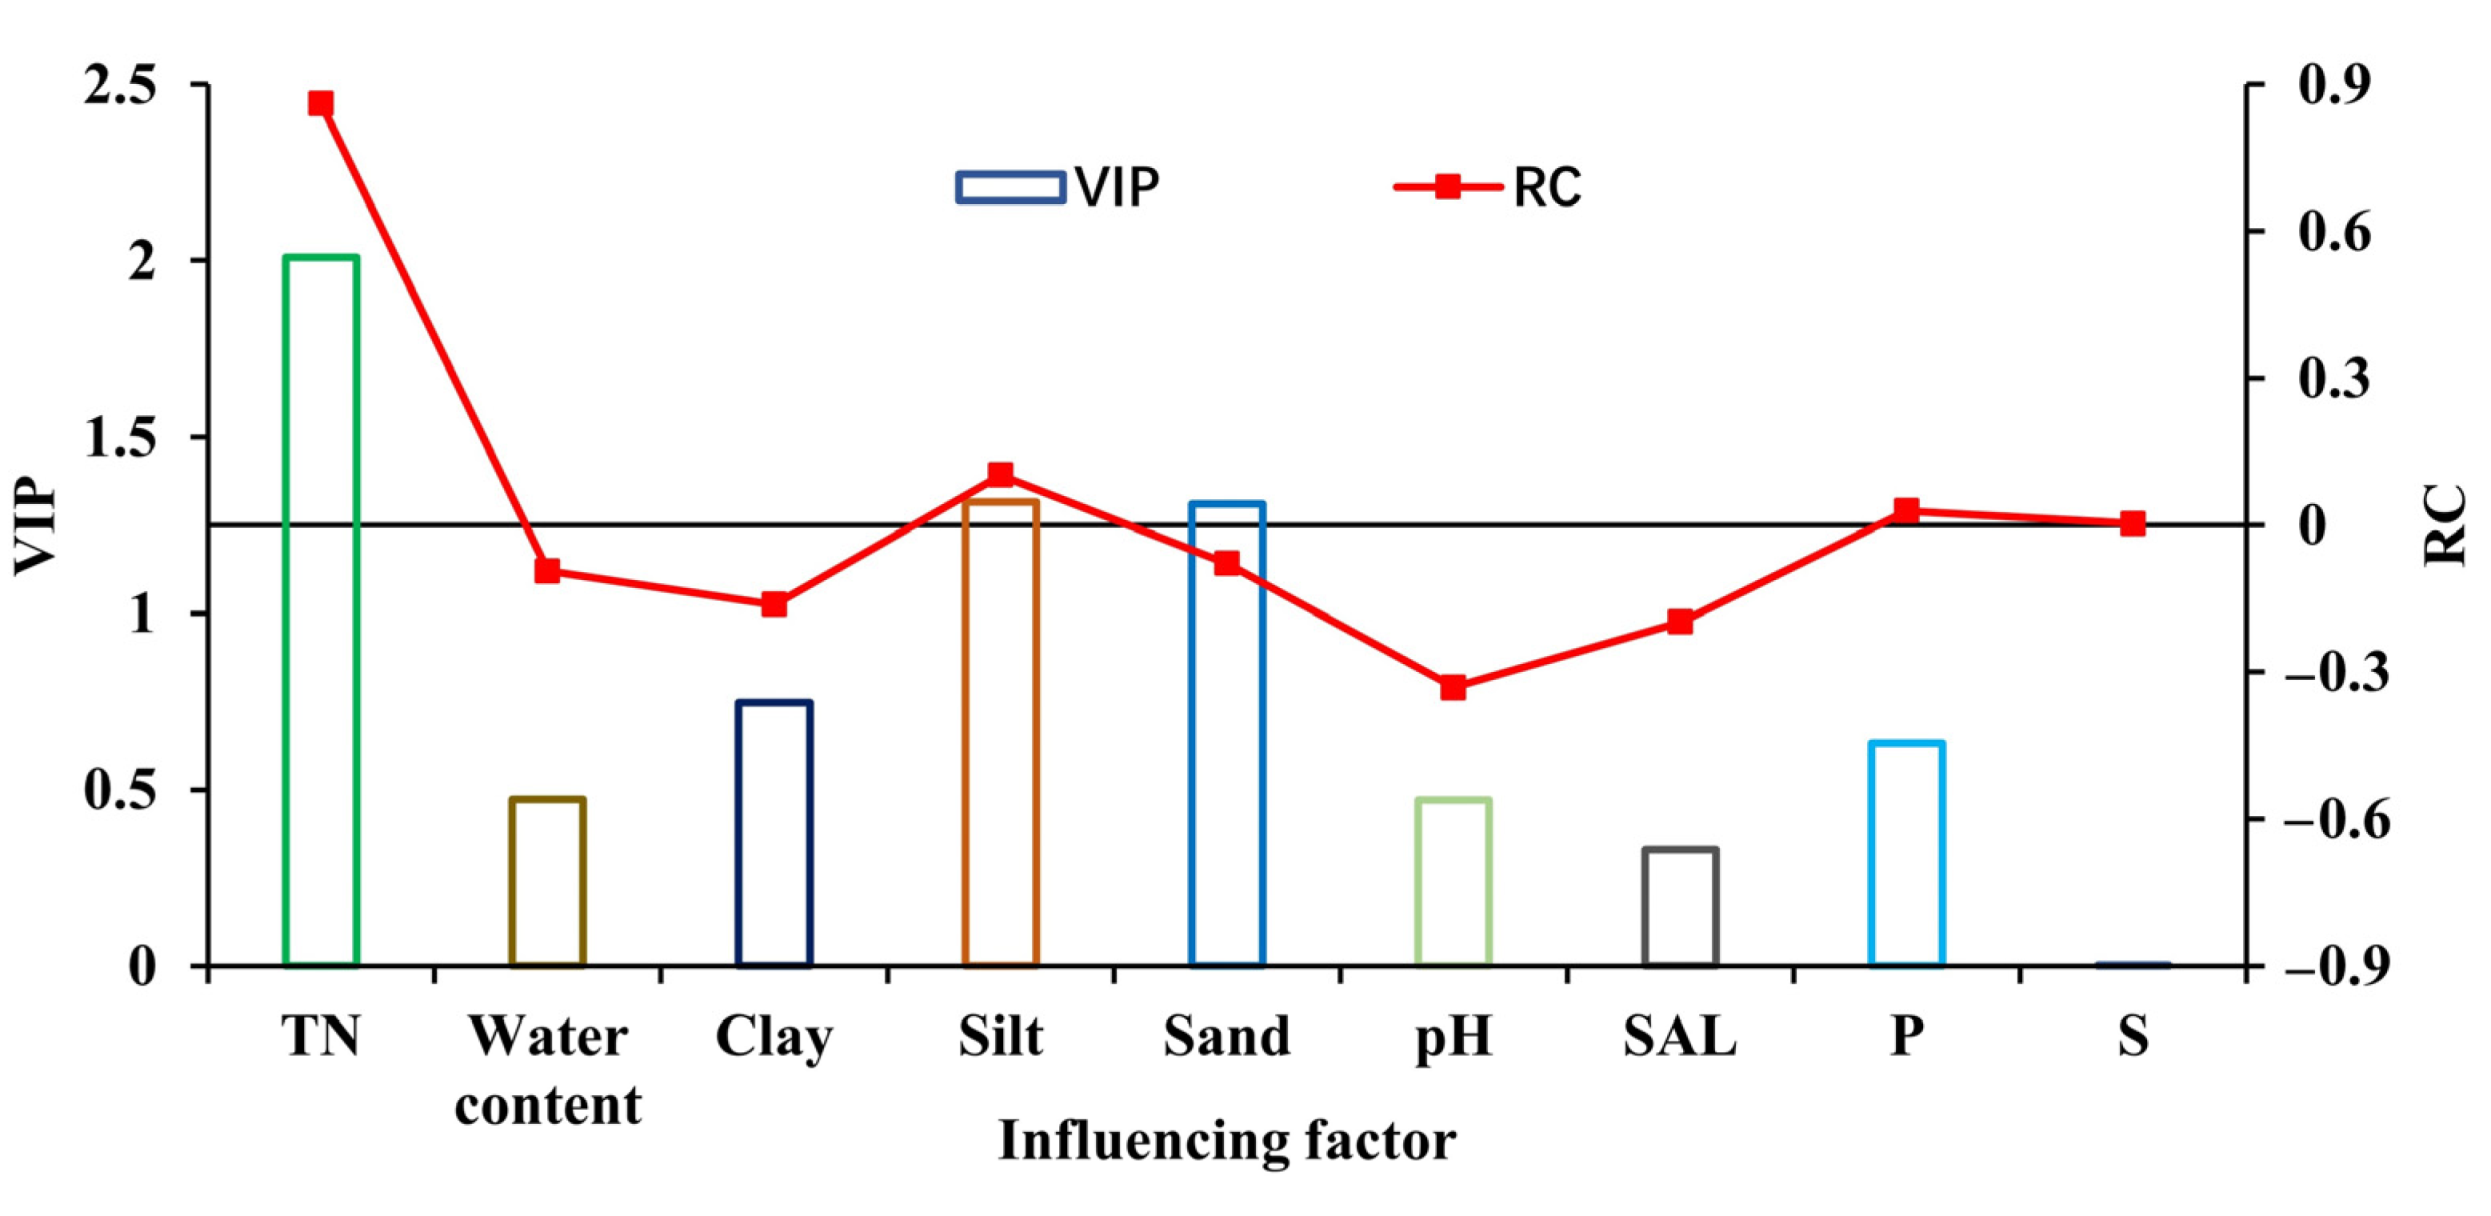
3.3.1. Important Factors Affecting OC Concentration in Reclaimed Areas

We used the OC content of soil samples from sites R01–R04 as the response variable, and the soil physical and chemical properties as the predictor variables in the PLSR model. The results showed that two components could explain 74.4% of OC variation. The maximum Q2 reached 57.9% (Table 1) and the model fit was good. The order of importance of factors influencing soil OC in the reclaimed area was as follows: TN > silt > sand > pH > water content > S > SAL > P > clay. The VIP values of TN (VIP = 1.58, RC = 0.426), silt (VIP = 1.50, RC = 0.238), and sand (VIP = 1.44, RC = −0.211) were greater than 1, indicating that these are the most important factors influencing soil OC concentration in the reclaimed area. The VIP values of SAL, P, and clay content were less than 0.5, suggesting that these factors had no significant effect on OC burial. In addition, TN, water content, silt content, and S had positive effects on OC, whereas clay content, sand content, pH, P, and SAL had negative effects (Figure 7).

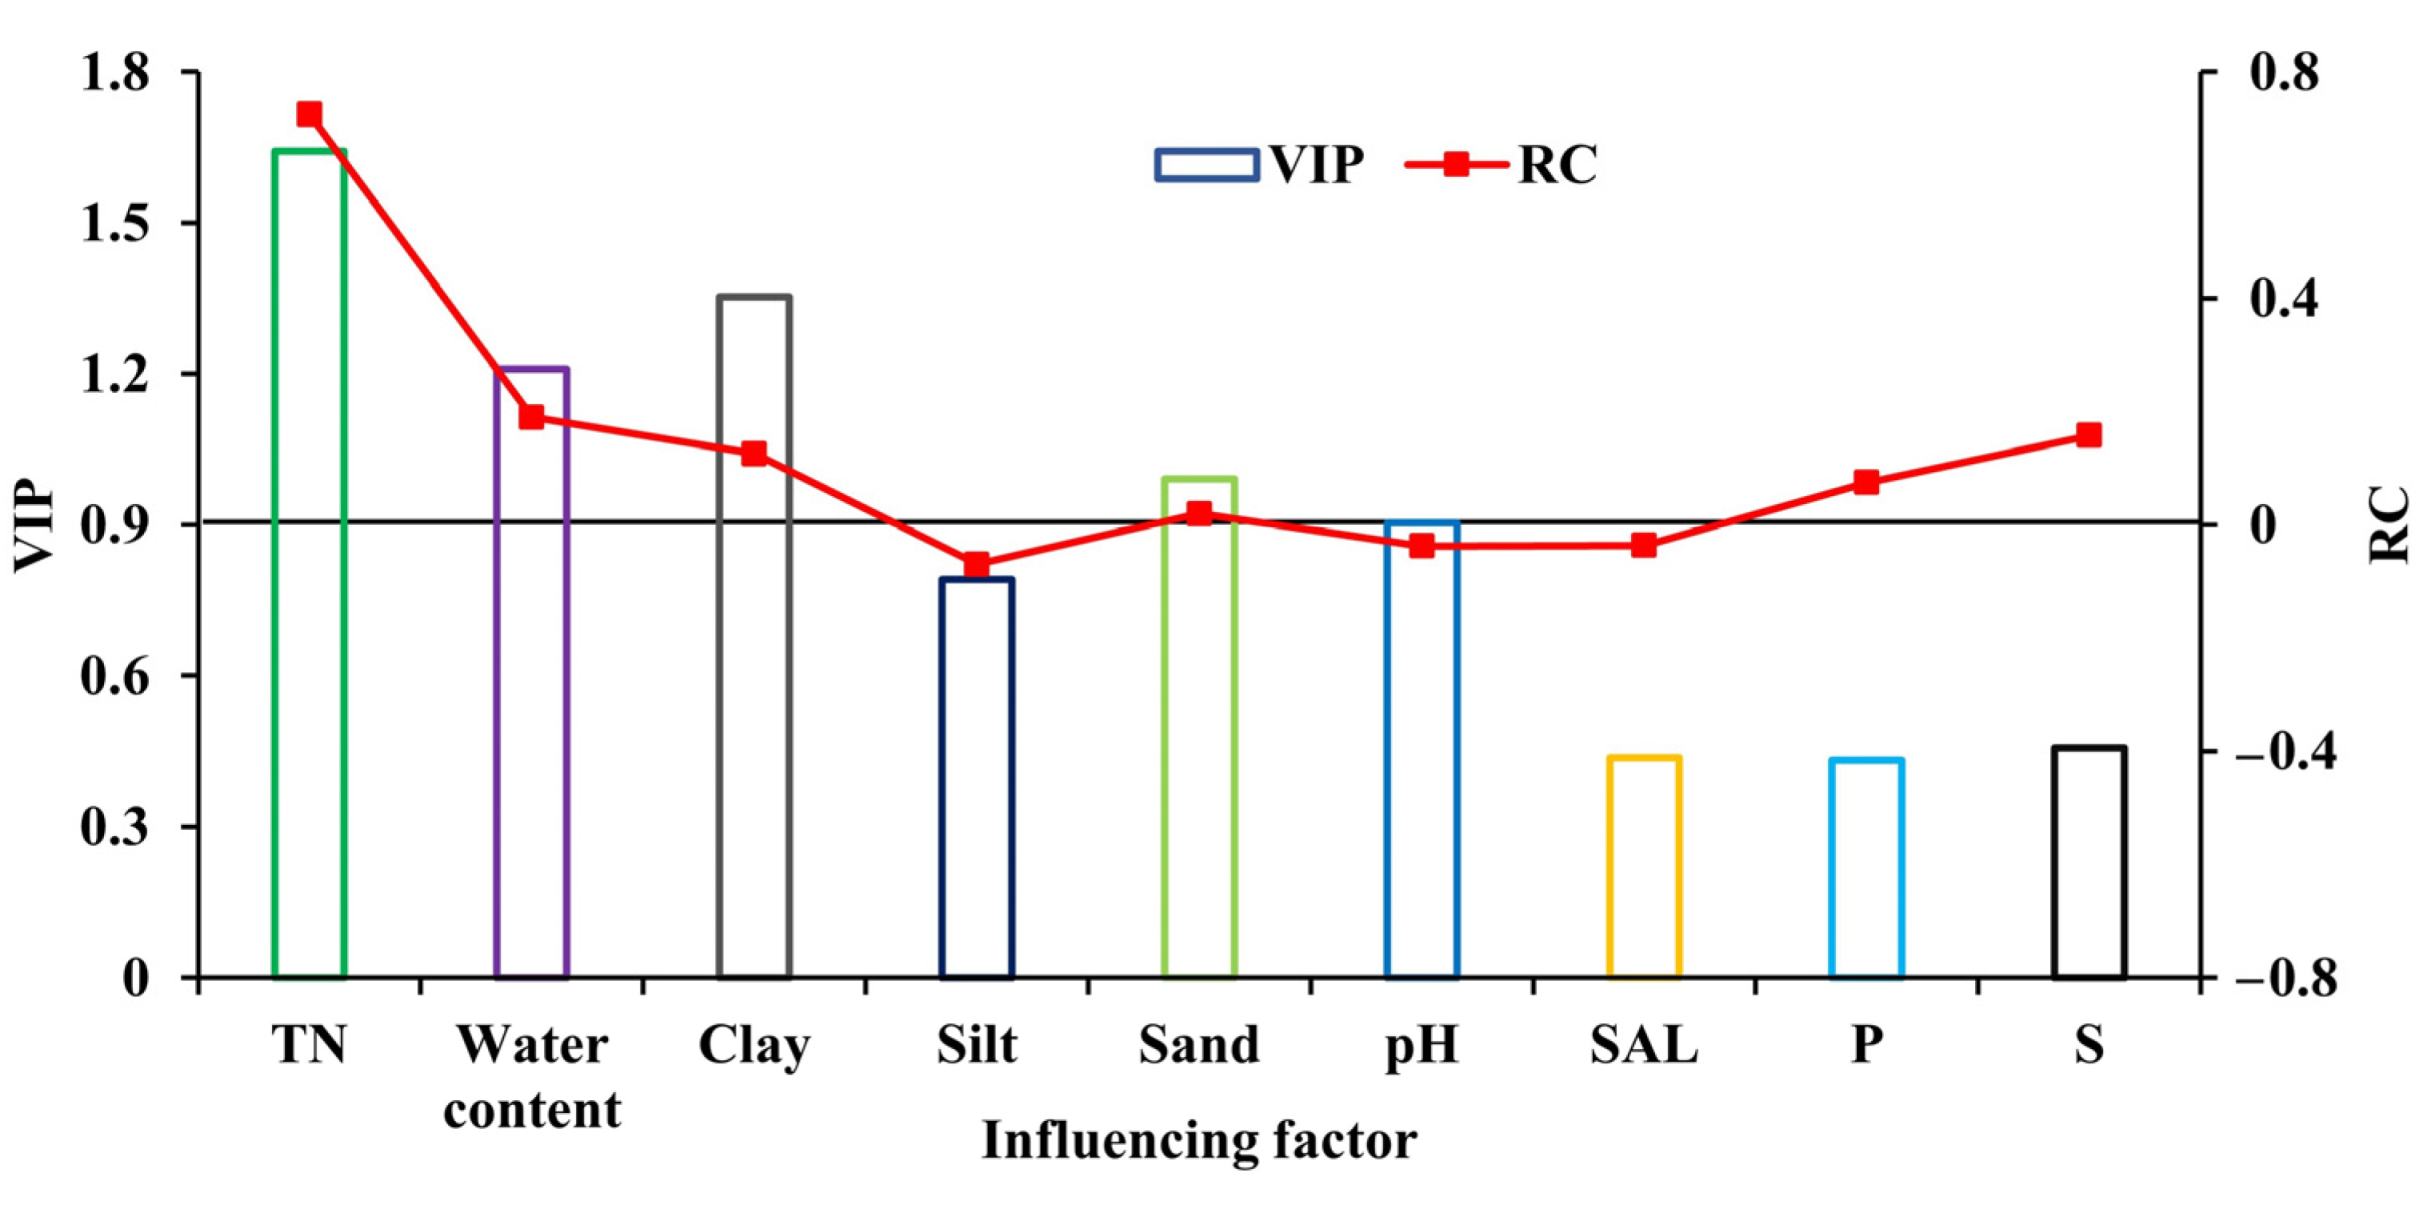
3.3.2. Important Factors Affecting OC Concentration in the Natural Coastal Areas

The OC content of soil samples from sites N01–N04 was considered the response variable, and the soil physical and chemical properties were used as the predictor variables in the PLSR model. The results show that three components explained 93.7% of OC variation. The maximum Q2 reached 90.1% (Table 2), and the model fit was excellent. The order of importance of factors influencing soil OC in natural coastal areas was as follows: TN > clay > water content > sand > pH > silt > S > SAL > P. The VIP values of TN (VIP = 1.64, RC = 0.725), clay content (VIP = 1.35, RC = 0.125), and water content (VIP = 1.21, RC = 0.190) were greater than 1, indicating that these are the most important factors influencing soil OC concentration in the natural areas. The VIP values of P, S, and SAL were less than 0.5, suggesting that these factors had no significant effect on OC burial. In addition, TN, water content, clay content, sand content, P, and S had positive effects on OC, whereas silt content, pH, and SAL had negative effects (Figure 8).

4. Discussion

4.1. The Effects of Vegetation Type on OC Content

The OC content at all soil depths in the samples from the natural coastal area was much greater than that at all depths in the samples from the reclaimed area (Figure 6). P. australis are tall, perennial, aquatic grasses of the Gramineae; they utilize C3 photosynthesis. They are generally tall plants with a strong reproductive capacity, and they are adapted to a wide range of aquatic conditions and can greatly enhance carbon burial capacity in the ecosystems in which they occur [35]. Species from the genus Aeluropus are perennial grasses with a medium rhizoid stem and strong adaptability and are an important component of salinized lowlands. S. alterniflora is an exotic plant. Compared with the native P. australis and Aeluropus, it has a stronger competitive advantage due to the wider ecological range in which it can grow. The upper limit of its distribution can reach the reed beds in the high tide zone, and the lower limit can reach the front of the beach [36]. The area in which S. alterniflora can grow is located within the tidal range, and the tide invasion frequency is between 50% and 80% [37]. The areas dominated by P. australis and Aeluropus are located within the reclaimed area and are no longer affected by tidal invasion. The areas dominated by S. alterniflora have a high tidal invasion frequency relative to those dominated by P. australis and Aeluropus, and this is conducive to the deposition of fine-grained sediments, which can lead to the enrichment of OC [38,39]. Furthermore, beds of S. alterniflora are greatly affected by tidal invasion, and the associated soils have a high water content; although this is not conducive to the mineralization and decomposition of OC, it is conducive to OC storage. Many studies have shown that the soil OC content under the cover of S. alterniflora is higher than that of soils under other native vegetation [40,41]. Huang et al. [42] found that, since the introduction of S. alterniflora, the burial rate of OC in Wanggang tidal flat in Northern Jiangsu has increased sevenfold, and the OC content rose from 1.7 g/kg to 8.8 g/kg. S. alterniflora is a C4 plant and has a higher photosynthetic efficiency compared to C3 plants [43]; thus, it has a higher primary productivity and burial rate, which can significantly increase the OC burial capacity of associated soils. As such, we believe that there are significant differences in the OC contributions of these two different vegetation types.

4.2. Factors Influencing the OC Content in Reclaimed Areas and Natural Coastal Areas

In the coastal area, the distribution and migration of soil OC are largely affected by vegetation type, soil physical and chemical conditions, and biogeochemical processes. PLSR analysis showed that the important factors influencing soil OC distribution in the reclaimed area were TN, silt content, and sand content, whereas, in the natural coastal vegetation area, they were TN, clay content, and water content. In summary, we found that soil grain size and TN are important factors affecting soil OC content in both areas, and water content is important in natural coastal areas.
Many studies have indicated that OC tends to be enriched in fine-grained matter [38,39,44,45]. Finer particles render the soil under vegetation less permeable to water and air, weakening the soil respiration process, and avoiding the decomposition of organic carbon; thus, the OC content in the soil increases. Coarse particles have a poor water holding capacity and carbon adsorption capacity; as such, the OC content in coarser soils is relatively low.
The soil OC content in samples from our sites along the Rudong coastline increased as the amount of fine particulate matter increased. In the reclaimed area, which is dominated by silt and sand, these two coarse particle sizes were important factors affecting the soil OC content. The coarser sand has a negative impact on soil OC content, and the finer silt particles have a positive impact. In the natural coastal area, there was an obvious increase in fine-grained material, specifically clay, which became an important predictive factor for OC content and had a positive impact on OC accumulation.
TN is an important nutrient for plant growth and has a significant impact on plant primary productivity, carbon fixation, distribution, and accumulation [46]. As such, a reliable supply of TN can promote plant growth and the accumulation of OC [47]. More than 90% of TN in soil is organically combined [48], and the availability of mineral TN in soil directly controls the decomposition rate of organic carbon [49]. Therefore, it is not surprising that the results of our PLSR model indicated that TN is an important factor affecting soil OC in both the reclaimed and natural coastal areas.
Based on our PLSR results, water content was another important factor which positively influenced the soil OC in natural coastal areas. Under the long-term influence of the tides, the soils in the natural coastal area have a high water content and can often become saturated, creating an anaerobic environment. Soil salinity is also high, which inhibits the activity of micro-organisms and slows the decomposition rate of OC [50,51]. Furthermore, other studies have shown that the water status of soils can significantly affect their permeability to air, which has a negative impact on the mineralization and decomposition of inherent and exogenous OC [52].

5. Conclusions

This study analyzed the physical and chemical properties of soils and their effects on the OC content in reclaimed and natural coastal areas along the Rudong coastline. The results show that:
(1)
There is a significant difference between the grain size compositions in both areas; although, the grain size of soil particles generally increases with depth in both the reclaimed and natural coastal areas. Overall, the fine particle content in the soil of natural coastal areas is much higher than that of the reclaimed areas. Although salinity in the soils varies greatly, there is no obvious trend with increasing depth. The pH in the soil at all sampling sites increased with depth. There was no clear variation in soil water content with depth in the reclaimed areas; however, soil water content decreases with depth in the natural coastal area. Furthermore, the mean soil water content at each sampling site in the reclaimed area was slightly lower than that of sites in the natural coastal area. The content of nutrient elements (TN, P, S) decreased with depth, but this trend was not significant. The contents of soil TN and S in the natural coastal area were much higher than those in the reclaimed area; however, the P content was not significantly different between the two areas.
(2)
The soil OC content in the two regions gradually decreased with depth, and the mean OC content of samples from the reclaimed area was lower than that of samples from the natural coastal area.
(3)
The factors which affect OC burial in the reclaimed areas were different to those that affect it in the natural coastal areas; however, at all sites, TN and grain size are important factors that influence the burial of OC. The relative composition of silt and sand play an important role in the sequestration capacity of soil OC in the reclaimed area, where coarser grain sizes result in the decomposition of OC and a decrease in OC content. In the natural coastal areas, clay and water content are important factors that affected soil OC concentration.
Our study provides critical information regarding the soil physical and chemical properties, as well as the important factors affecting OC concentration, in different areas along the Rudong County coastline. Furthermore, these results are crucial for understanding the different contributions that these contrasting environments provide to soil OC. This study provides important reference data for correctly assessing the role and status of coastal areas in the global carbon cycle.

Author Contributions

Conceptualization, Q.S. and P.Y.; methodology, P.Y. and Z.H.; software, Z.H.; investigation, Q.S., P.Y. and Z.H.; data curation, P.Y. and Z.H.; writing—original draft preparation, P.Y.; writing—review and editing, Q.S.; project administration, Q.S. All authors have read and agreed to the published version of the manuscript.

Funding

This work was supported by the National Natural Science Foundation of China (Grant No. 41671195); Marine science and technology innovation project of Jiangsu province (No. JSZRHYKJ202002).

Institutional Review Board Statement

Not applicable.

Informed Consent Statement

Not applicable.

Data Availability Statement

The data that support the findings of this study are available from the corresponding author upon request.

Conflicts of Interest

The authors declare no conflict of interest.

References

  1. Lonngren, K.E.; Bai, E.W. On the global warming problem due to carbon dioxide. Energy Policy 2008, 36, 1567–1568. [Google Scholar] [CrossRef]
  2. Lal, R. Soil carbon sequestration to mitigate climate change. Geoderma 2004, 123, 1–22. [Google Scholar] [CrossRef]
  3. Tang, Q.; Chen, C.; Yu, K.; Dai, M.; Ke, C.; Huang, T.; Chai, F.; Wei, G.; Zhou, L.; Chen, L.; et al. The effects of ocean acidification on marine organisms and ecosystem. Chin. Sci. Bull. 2013, 58, 1307–1314. [Google Scholar] [CrossRef]
  4. Wang, W.; Zheng, G.; Chao, Q.; Chen, Y.; Hu, G.; Pan, J. Annual Report on Actions to Address Climate Change; Social Sciences Academic Press: Beijing, China, 2015. [Google Scholar]
  5. Duarte, C.M.; Losada, I.J.; Hendriks, I.E.; Mazarrasa, I.; Marbà, N. The role of coastal plant communities for climate change mitigation and adaptation. Nat. Clim. Chang. 2013, 3, 961–968. [Google Scholar] [CrossRef] [Green Version]
  6. Kong, J.; Cheng, C.; Shen, C. Study on the role of sediment dike in the port construction near silt coast. Appl. Mech. Mater. 2012, 204–208, 2298–2308. [Google Scholar] [CrossRef]
  7. Shu, Q.; Ma, Y.; Liu, Q.; Zhang, S.; Hu, Z.; Yang, P. Levels and ecological risk of heavy metals in the surface sediments of tidal flats along the North Jiangsu coast, China. Mar. Pollut. Bull. 2021, 170, 112663. [Google Scholar] [CrossRef] [PubMed]
  8. Zhang, X.; Yan, C.; Xu, P.; Dai, Y.; Yan, W.; Ding, X.; Zhu, C.; Mei, D. Historical evolution of tidal flat reclamation in the Jiangsu coastal areas. Acta Geogr. Sin. 2013, 68, 1549–1558. [Google Scholar]
  9. Zhang, R.; Pu, L.; Li, J.; Zhang, J.; Xu, Y. Landscape ecological security response to land use change in the tidal flat reclamation zone, China. Environ. Monit. Assess. 2016, 188, 1. [Google Scholar] [CrossRef] [PubMed]
  10. Han, Q.; Huang, X.; Shi, P.; Zhang, Q. Coastal wetland in South China: Degradation trends, causes and protection countermeasures. Chin. Sci. Bull. Vol. 2006, 51, 121–128. [Google Scholar] [CrossRef]
  11. Chen, L.; Ren, C.; Zhang, B.; Wang, Z.; Song, K. Spatiotemporal Dynamics of Coastal Wetlands and Reclamation in the Yangtze Estuary During Past 50 Years (1960s–2015). Chin. Geogr. Sci. 2018, 28, 386–399. [Google Scholar] [CrossRef] [Green Version]
  12. Ma, Z.; Melville, D.S.; Liu, J.; Chen, Y.; Yang, H.; Ren, W.; Zhang, Z.; Piersma, T.; Li, B. Rethinking China’s new great wall. Science 2014, 346, 912–914. [Google Scholar] [CrossRef] [PubMed] [Green Version]
  13. Cui, J.; Liu, C.; Li, Z.; Wang, L.; Chen, X.; Ye, Z.; Fang, C. Long-term changes in topsoil chemical properties under centuries of cultivation after reclamation of coastal wetlands in the Yangtze Estuary, China. Soil Till. Res. 2012, 123, 50–60. [Google Scholar] [CrossRef]
  14. Doetterl, S.; Stevens, A.; Six, J.; Merckx, R.; VanOost, K.; Pinto, M.C.; Casanova-Katny, A.; Muñoz, C.; Boudin, M.; Venegas, E.Z.; et al. Soil carbon storage controlled by interactions between geochemistry and climate. Nat. Geosci. 2015, 8, 780–783. [Google Scholar] [CrossRef]
  15. Kong, Y.; Zhang, J.; Zhang, D.; Wang, H.; Cui, Z.; Tao, B. Effects of land-use change on soil and aggregate-associated organic carbon. J. Cent. South Univ. 2009, 29, 39–44. [Google Scholar]
  16. Bai, J.; Xiao, R.; Cui, B.; Zhang, K.; Wang, Q.; Liu, X.; Gao, H.; Huang, L. Assessment of heavy metal pollution in wetland soils from the young and older reclaimed regions in the Pearl River Estuary, South China. Environ. Pollut. 2011, 159, 817–824. [Google Scholar] [CrossRef] [PubMed]
  17. Cao, Z.; Wang, L.; Yang, L.; Yu, J.; Lv, J.; Meng, M.; Li, G. Heavy metal pollution and the risk from tidal flat reclamation in coastal areas of Jiangsu, China. Mar. Pollut. Bull. 2020, 158, 111427. [Google Scholar] [CrossRef] [PubMed]
  18. Cheng, Y.; Yang, L.; Cao, Z.; Ci, E.; Yin, S. Chronosequential changes of selected pedogenic properties in paddy soils as compared with non-paddy soils. Geoderma 2009, 151, 31–41. [Google Scholar] [CrossRef]
  19. Kalbitz, K.; Kaiser, K.; Fiedler, S.; Kölbl, A.; Amelung, W.; Bräuer, T.; Cao, Z.; Don, A.; Grootes, P.; Jahn, R. The carbon count of 2000 years of rice cultivation. Glob. Chang. Biol. 2013, 19, 1107–1113. [Google Scholar] [CrossRef] [PubMed]
  20. Fu, Q.; Ding, N.; Liu, C.; Lin, Y.; Guo, B. Soil development under different cropping systems in a reclaimed coastal soil chronosequence. Geoderma 2014, 230, 50–57. [Google Scholar] [CrossRef]
  21. Wissing, L.; Kölbl, A.; Schad, P.; Bräuer, T.; Cao, Z.; Kögel-Knabner, I. Organic carbon accumulation on soil mineral surfaces in paddy soils derived from tidal wetlands. Geoderma 2014, 228, 90–103. [Google Scholar] [CrossRef]
  22. Ji, A.; Tao, G.; Zhuo, S.; Luo, L. X-ray Fluorescence Spectrometric Analysis; Science Press: Beijing, China, 2003; pp. 201–203. [Google Scholar]
  23. Wold, S.; Sjöström, M.; Eriksson, L. PLS-regression: A basic tool of chemometrics. Chemom. Intell. Lab. Syst. 2001, 58, 109–130. [Google Scholar] [CrossRef]
  24. Fang, N.; Shi, Z.; Chen, F.; Wang, Y. Partial Least Squares Regression for Determining the Control Factors for Runoff and Suspended Sediment Yield during Rainfall Events. Water 2015, 7, 3925. [Google Scholar] [CrossRef] [Green Version]
  25. Tong, L.; Fang, N.; Xiao, H.; Shi, Z. Sediment deposition changes the relationship between soil organic and inorganic carbon: Evidence from the Chinese Loess Plateau. Agric. Ecosyst. Environ. 2020, 302, 107076. [Google Scholar] [CrossRef]
  26. Yang, P.; Shu, Q.; Liu, Q.; Hu, Z.; Zhang, S.; Ma, Y. Distribution and factors influencing organic and inorganic carbon in surface sediments of tidal flats in northern Jiangsu, China. Ecol. Indic. 2021, 126, 107633. [Google Scholar] [CrossRef]
  27. Qi, C.; Fang, Q. Partial least squares modelling with R software and empirical analysis. Math. Theory Appl. 2013, 33, 103–111. [Google Scholar]
  28. Yan, B.; Fang, N.F.; Zhang, P.C.; Shi, Z.H. Impacts of land use change on watershed streamflow and sediment yield: An assessment using hydrologic modelling and partial least squares regression. J. Hydrol. 2013, 484, 26–37. [Google Scholar] [CrossRef]
  29. Shi, Z.H.; Huang, X.D.; Ai, L.; Fang, N.F.; Wu, G.L. Quantitative analysis of factors controlling sediment yield in mountainous watersheds. Geomorphology 2014, 226, 193–201. [Google Scholar] [CrossRef]
  30. Shi, Z.H.; Ai, L.; Li, X.; Huang, X.D.; Wu, G.L.; Liao, W. Partial least-squares regression for linking land-cover patterns to soil erosion and sediment yield in watersheds. J. Hydrol. 2013, 498, 165–176. [Google Scholar] [CrossRef]
  31. Wold, S. PLS for multivariate linear modeling. In Chemometric Methods in Molecular Design; Van de Waterbeemd, H., Ed.; Verlag-Chemie: Weinheim, Germany, 1995; pp. 195–218. [Google Scholar]
  32. Onderka, M.; Wrede, S.; Rodný, M.; Pfister, L.; Hoffmann, L.; Krein, A. Hydrogeologic and landscape controls of dissolved inorganic nitrogen (DIN) and dissolved silica (DSi) fluxes in heterogeneous catchments. J. Hydrol. 2012, 450–451, 36–47. [Google Scholar] [CrossRef]
  33. Wang, G. The Effects of Salt Marsh Vegetation on Soil Organic Carbon Fractions, Sources and Distribution. Master’s Thesis, Anhui Normal University, Wuhu, China, 2012. [Google Scholar]
  34. Li, P.; Xie, W.; Wang, Z.; Yan, Q. Effects of Spartina alterniflora invasion on silfur content temporal and spatial variation in tidal flat wetland of Jiaozhou Bay. Acta Sci. Circumstantiae 2019, 39, 870–879. [Google Scholar]
  35. Yan, M.; Pan, G.; Li, L.; Zou, J. An overview of the potential role reed (phragmites australis) wetlands in terrestrial carbon sequestration of China. Chin. Agric. Sci. Bull. 2010, 26, 320–323. [Google Scholar]
  36. Zhang, T.; Ge, Z.; Zhang, L.; Chen, H.; Yan, G. Influence of saltmarsh vegetation and sedimentation on the distribution of soil carbon and nitrogen in the Chongming Dongtan wetlands. Acta Sci. Circumstantiae 2015, 35, 836–843. [Google Scholar]
  37. Yang, G.; Shi, Y.; Zhang, C. The ecological response of typical mud flat to sea level change in Jiangsu Coastal Plain. Acta Geogr. Sin. 2002, 57, 327–334. [Google Scholar]
  38. Hassink, J. The capacity of soils to preserve organic C and N by their association with clay and silt particles. Plant Soil 1997, 191, 77–87. [Google Scholar] [CrossRef]
  39. Zhang, X.; Zheng, J.; Li, S. The enrichments of organic matter and total nitrogen in sediment as affected by relevant factors. J. Geogr. Sci. 2004, 14, 495–502. [Google Scholar]
  40. Gao, J.; Yang, G.; Ou, W. The influence after introduvtion of spartina alterniflora on the distribution of TOC, TN and TP in the national Yancheng rare Birds nature reserve, Jiangsu province, China. Geogr. Res. 2007, 26, 799–808. [Google Scholar]
  41. Dun, J.; Wang, C.; Yao, D.; Huang, M.; Xu, J. Spatial Distribution Characteristics and Source Tracing of Organic Carbon in Surface Sediments of Salt Marsh in Dongtan of Chongming. Resour. Environ. Yangtze Basin 2019, 28, 157–165. [Google Scholar]
  42. Huang, M.; Ge, C.; Zou, P.; Ji, Z.; Fang, W.; Zhou, M. The contribution of sartina introduction on organic matter source and its effects on carbon burial in tidal flats. J. Nanjing Univ. 2018, 54, 655–664. [Google Scholar]
  43. Liao, C.; Luo, Y.; Jiang, L.; Zhou, X.; Wu, X.; Fang, C.; Chen, J.; Li, B. Invasion of Spartina alterniflora Enhanced Ecosystem Carbon and Nitrogen Socks in the Yangtze Estuary, China. Ecosystems 2007, 10, 1351–1361. [Google Scholar] [CrossRef]
  44. Lu, L.; Cai, J.; Bao, Y.; Li, C.; Yang, S.; Fan, D. Summary of processes and significance of clay minerals in marine sedimentary organic matter preservation and in global carbon cycle. Adv. Earth Sci. 2006, 21, 931–937. [Google Scholar]
  45. Zhang, W.; Jin, H.; Zhang, F.; Zhao, G.; Yang, K.; Li, H.; Bai, Y.; Gao, W. Organic carbon distribution in the Yangtze River Estuary-Hangzhou Bay and its adjacent sea area. Adv. Earth Sci. 2009, 24, 1202–1209. [Google Scholar]
  46. Batjes, N.H. Carbon and nitrogen socks in the soils of Central and Eastern Europe. Soil Use Manag. 2002, 18, 324–329. [Google Scholar] [CrossRef]
  47. Li, C.; Li, Q.; Zhao, L.; Ge, S.; Chen, D.; Dong, Q.; Zhao, X. Land-use effects on organic and inorganic carbon patterns in the topsoil around Qinghai Lake basin, Qinghai-Tibetan Plateau. Catena 2016, 147, 345–355. [Google Scholar] [CrossRef]
  48. Stevenson, F.J. Humus Chemistry: Genesis, Composition, Reactions; Wiley-Interscience: New York, NY, USA, 1982. [Google Scholar]
  49. Zhou, L.; Li, B.; Zhou, G. Advances in controlling factors of soil organic carbon. Adv. Earth Sci. 2005, 20, 99–105. [Google Scholar]
  50. Zhang, Y.; Li, Y.; Wang, L.; Chen, J.; Hu, Y.; Fu, X.; Le, Y. Variability in organic carbon storage capability of soils at different successional stages in Chongming Dongtan wetland and its microbial mechanism. J. Agro-Environ. Sci. 2012, 31, 631–637. [Google Scholar]
  51. Xiao, Y.; Huang, Z.; Wu, H.; Lv, X. Compositions and contents of active organic carbon in different wetland soils in Sanjiang Plain, Northeast China. Acta Ecologica Sinica 2015, 35, 7625–7633. [Google Scholar]
  52. Wang, H.; Xiao, C.; Li, C.; Li, Y.; Zhang, W.; Fu, X.; Le, Y.; Wang, L. Spatial variability of organic carbon in the soil of wetland in Chongming Dongtan and its influential factors. J. Argo-Environ. Sci. 2009, 28, 1522–1528. [Google Scholar]
Figure 1. Maps detailing the study area location and the sampling sites.
Jmse 09 01453 g001
Figure 2. Representation of soil sample composition and the change in grain size with depth at each sampling site. (a) The change in grain size composition with depth; (b) the average mean grain size (MZ) of samples from each sampling site. R01–R04 = reclaimed sites; N01–N04 = natural coastal sites.
Jmse 09 01453 g002
Figure 3. Comparison of changes in pH and salinity with depth at each sampling site. (a) The change in pH and salinity with depth; (b) the mean pH and salinity at each sampling site.
Jmse 09 01453 g003
Figure 4. Comparison of changes in TN, P, and S content with depth at each sampling site. (a) The change in TN, P, and S content with depth; (b) the mean TN, P, and S content at each sampling site.
Jmse 09 01453 g004
Figure 5. Changes in soil water content with depth at each sampling site. (a) The change in soil water content with depth; (b) the mean soil water content at each sampling site.
Jmse 09 01453 g005
Figure 6. Change in soil organic carbon (OC) content with depth at each sampling site. (a) The change in soil organic carbon content with depth; (b) the mean soil organic carbon content at each sampling site.
Jmse 09 01453 g006
Figure 7. PLSR model of factors influencing the content of soil OC in reclaimed areas.
Jmse 09 01453 g007
Figure 8. PLSR model of factors influencing soil OC content in natural coastal areas.
Jmse 09 01453 g008
Table 1. Summary of PLSR model outputs relating to soil organic carbon (OC) content in reclaimed area.
VariableR2Q2ComponentsExplained Variation
in Y (%)
Cumulative Explained
Variation in Y (%)
Q2cum
OC0.7440.580164.064.00.523
210.474.40.580
Note: OC = organic carbon content; R2 is a measure of fit; Q2 indicates how well the model predicts new data.
Table 2. Summary of PLSR model outputs relating to soil OC content in natural coastal areas.
VariableR2Q2ComponentsExplained Variation
in Y (%)
Cumulative Explained
Variation in Y (%)
Q2cum
OC0.9370.901173.473.40.705
218.091.40.871
32.393.70.901
Note: OC = organic carbon content; R2 is a measure of fit; Q2 indicates how well the model predicts new data.
Publisher’s Note: MDPI stays neutral with regard to jurisdictional claims in published maps and institutional affiliations.

