Article

Experimental Study of Local Scour around Tripod Foundation in Combined Collinear Waves-Current Conditions

1
College of Environmental Science and Engineering, Ocean University of China, Qingdao 266000, China
2
Key Laboratory of Marine Environment and Ecology, Ministry of Education, Ocean University of China, Qingdao 266000, China
3
Key Laboratory of Shandong Province for Marine Environment and Geological Engineering, Ocean University of China, Qingdao 266000, China
*
Author to whom correspondence should be addressed.
J. Mar. Sci. Eng. 2021, 9(12), 1373; https://doi.org/10.3390/jmse9121373
Submission received: 30 October 2021 / Revised: 17 November 2021 / Accepted: 23 November 2021 / Published: 3 December 2021
(This article belongs to the Section Ocean Engineering)

Abstract

:
A series of laboratory experiments were conducted in a wave-current flume to investigate the scour evolution and scour morphology around tripod in combined waves and current. The tripod model was made using the 3D printing technology, and it was installed in seabed with three installation angles α = 0°, 90°and 180° respectively. In the present study, the scour evolution and scour characteristic were first analyzed. Then, the equilibrium scour depth Seq was investigated. Furthermore, a parametric study was carried out to study the effects of Froude number Fr and Euler number Eu on equilibrium scour depth Seq respectively. Finally, the effects of tripod’s structural elements on Seq were discussed. The results indicate that the maximum scour hole appeared underneath the main column for installation angle α = 0°, 90° and 180°. The Seq for α = 90° was greater than the case of α = 0° and α = 180°, implying the tripod suffered from more severe scour for α = 90°. When KC was fixed, the dimensionless time scale T* for α = 90° was slightly larger than the case of α = 0° and α = 180° and the T* was linearly correlated with Ucw in the range of 0.347 < Ucw < 0.739. The higher Fr and Eu both resulted in the greater scour depth for tripod in combined waves and current. The logarithmic formula can depict the general trend of Seq and Fr (Eu) for tripod in combined waves and current.

1. Introduction

As a kind of clean and renewable energy, offshore wind energy developed rapidly in recent years. There are many different types of foundations, such as monopiles, gravity foundations, jackets and tripods were adopted to support the offshore wind turbine tower. So far, the monopiles have been widely used in offshore wind farms [1,2]. After the monopiles were installed in the seabed, due to the formation of horseshoe vortex and wake vortex in the upside and lee-side of the monopile respectively, the shear stresses on the seabed induced by waves and current were amplified in the vicinity of the monopile [3,4,5,6]. Consequently, the sediments adjacent to the monopile surface would be mobilized and carried away by shear stresses, leading to scour pits emerging. The embedded depths of monopiles decreased with scour depths increasing, which weaken the bearing capacity and stability of monopiles [7,8]. Given that, the scour evolution and scour depth prediction around the foundation captured a lot of attention from coastal engineers.
In ocean environments, waves generally coexist with current [9]. The local scour around monopiles in combined waves and current involves the interaction between fluids, monopile and sediments, and the scour processes may be more complicated than the conditions of waves-only or current-only [9,10,11]. Due to the blockage effects of foundation, the adverse pressure gradient emerged at the upside of monopile, resulting in a separation of wave-current boundary layer close to the seabed, and it made the formation of horseshoe vortexes [3,12,13]. Furthermore, the wake vortexes shed off at the lee-side of monopile, and its core is similar to a vacuum cleaner, sucking and transporting the sediments from seabed [12,14,15]. Considerable research has revealed that the horseshoe vortexes and wake vortexes are responsible for scour around monopile in combined waves and current [9,12,14,16]. Sumer et al. [12] conducted a series of flume tests to investigate the scour evolution around a single pile in waves and current, indicating that the scale and lifespan of horseshoe vortex increased when a current was superimposed on waves. According to Eadie and Herbich [17], compared with the condition of current-only, the time scale to reach the equilibrium state decreased and the equilibrium scour depth increased significantly in combined waves and current. The equilibrium scour depth in combined waves and current is related with KC number and the ratio of velocities Ucw (=Uc/(Uc + Uwm)), in which Uc denotes the undisturbed near-bed current velocity and Uwm represents the maximum undisturbed wave-induced oscillatory flow velocity above the wave boundary layer [10,12,14,18]. The adverse pressure gradient at the upside of monopile increased apparently when a current was superimposed on waves, and the higher Uc/Um led to the lower critical KC number for the threshold of horseshoe vortex [9,15,16,18]. The scour around a single pile occurred when KC > 6 in waves [3,12], but the scour was initiated even when KC < 6 in combined waves and current [10,13,19]. For a relatively small KC (KC < 4), the equilibrium scour depth around a single pile could be still great when Ucw ≥ 0.6 [9,15,18]. Rudolph and Bos [13] proposed an equilibrium scour depth prediction formula around a single pile in combined waves and current for 1 < KC < 10. When KC was fixed, the equilibrium scour depth increased with increasing Ucw, and the equilibrium scour depth approached an asymptotic value corresponding to the case of current-only when Ucw ≥ 0.7, indicating the scour process was dominated by current. Afzal et al. [20] adopted the open-source CFD model REEF3D to study the scour evolution and hydrodynamics around a pier in waves and current, and the calculating results correspond well to the experimental data. Later, Quezada et al. [21] used the REEF3D to investigate the scour morphology and scour process around a pier in combined waves and current. Afzal et al. [22] performed the numerical simulations using the REEF3D, the results instruct that the numerical model can predict instantaneous scour depth accurately around abutment. Gautam et al. [23] used the REEF3D for simulating scour process around a single pile in combined waves and current, indicating the equilibrium scour depth increases significantly in combined waves and strong current, compared with the case of combined waves and weak current. Pu et al. [24] adopted the multi-fluid Incompressible Smoothed Particle Hydrodynamics (ISPH) model to investigate the multi-fluid flow process and the sediment transport, which has accurate predictions for the flow process. Ma et al. [25] conducted a series of flume tests to study the temporal scour development around a dumbbell-shaped group pile in steady current and tidal flows. Schendel et al. [26] carried out a set of hydraulic model tests to study the scour evolution and flow field around a single pile, indicating the scouring process is much faster for a live bed than a clear water regime.
For the foundation with complex shapes, such as tripod and jacket, the scour process was more complicated than the case of monopile due to the blockage effects induced by structural elements [27,28,29], so a unique scour morphology around foundation with complex shapes would be expected compared with a single pile. Thus, the scour results from the single pile can’t be applied directly for foundation with complex shapes. Welzel et al. [28,29] carried out a series of wave flume tests to study the scour evolution around jacket foundation, the results implying the streamline contraction and flow acceleration adjacent to the structural elements, resulting in the shear stresses on the seabed amplified and consequently the greater scour depth. The tripod foundation consists of three piles, one main column and structural elements between piles and the main column. According to the experimental results of Welzel et al. [28,29], the structural elements exerted a significant effect on the scour evolution and scour morphology, so it was vital to investigate the scour development and scour topography around tripod in combined waves and current. Yuan et al. [27] conducted several groups of scour experiments to study the scour development around tripod in steady current, and the test results instruct that all the maximum scour depths occurred at the downstream tripod’s pile. What’s more, the scour extent extended along the lower diagonal braces, and the scour hole deepened underneath the main column. The experimental results disagreed with the results of the field survey conducted by Stahlmann [30], and there was no clear explanation about it. Noteworthy is that the dimensionless equilibrium scour depth Seq/D was 3.5 for flow depth d = 0.25 m, V/Vc = 1 (V the mean inflow velocity, Vc the threshold velocity for the onset of soil particles motion on the bed) in steady current, which reached about three times of the recommend value proposed by the DNV guideline for monopile [31]. Therefore, it can be reasonably concluded that the seabed around tripod suffered from scour more severely than the case of monopile. Stahlmann [30] performed flume tests to study the scour evolution around tripod in waves, implying the local scour holes mainly appeared in the vicinity of tripod’s pile and beneath the main column, and the maximum scour depth was located beneath the main column in all tests. What’s more, the scour also occurred under the structural elements, indicating the flow accelerated induced by the structural elements, and it was responsible for scour in there. Yamini et al. [32] investigated the scour depth around tripod in combined waves and current by numerical simulation, and the effects of the median diameter of soil particles, wave heights, flow velocity and pile diameter on scour depth were discussed respectively.
Compared with the understanding of scour around a single pile, there are not many studies available for complex subsea structures (e.g., tripod, jacket). Such types of complex subsea structures often present numerous challenging design aspects [33,34], for example, the scour design for tripod usually refers to the criterion for a single pile, leading to an underestimated scour depth. Consequently, this can lead to safety risks for offshore wind farms. Hence, in the present study, a series of scour tests were conducted to investigate the scour evolution and scour morphology around tripod in combined waves and current. The present paper is organized as follows. The scour evolution and scour characteristic were first analyzed. Then, the equilibrium scour depth Seq was investigated. Furthermore, a parametric study was carried out to study the effects of Froude number Fr and Euler number Eu on equilibrium scour depth Seq respectively. Finally, the effects of the tripod’s structural elements on Seq were discussed.

2. Experiment Design

A series of scour tests were conducted in a wave-current flume. The flume (see Figure 1) is 20 m in length, 1 m in width, 1.2 m in height. A rectangle soil pit (3 m in length, 1 m in width, 0.4 m in height) was installed in the middle of the flume. The wave generation system consists of wave paddle, piston rod and controller, and it was set on the one end of the flume. The rubble and scree were used as the wave absorption band (2.5 m in length, 12° in inclination) on another end of the flume. As shown in Figure 1, two axial-flow pumps were set on the offshore side and onshore side of flume respectively. The Echo sounder was adopted to measure the scour depth around tripod, and the measure positions were depicted in Figure 2. The wave height gauge was employed to monitor the wave height in experiments, and it was set on the upstream section between the tripod model and wave generation system. The acoustic doppler velocimeter (ADV) was used to measure the flow velocity in experiments.
The tripod foundation consists of three piles, one main column and structural elements connecting tripod’s piles and main column, which was made using the 3D printing technology, and it was pained with waterborne coating on the surface to obtain a relatively smooth surface roughness. The tripod model was installed in the center of the soil pit with an embedded depth of 20 cm. As shown in Figure 2, there are three installation angles (α = 0°, 90°and 180°) were adopted in tests, and the α = 0° and α = 180° denote one tripod’s pile and two tripod’s piles facing incoming waves-current respectively, and α = 90° represents the asymmetric installation. The maximum vertically projected area of the tripod is about 0.081 m2, resulting in an overall blockage ratio of 0.0975, which is below the threshold value of 0.167 proposed by Whitehouse [35] for influences on the results due to a high ratio between the tripod projected area and the cross-section area of the flume.
The seabed was made up of sandy silt, and Figure 3 shows the particle size grading curve of the soil sample. The basic mechanical parameters of the soil sample are as follows. The median diameter d50 = 0.051 mm, the geometric standard deviation of the soil σg (=d84/d50) = 1.24, where d84 is the soil particles size for which 84% is finer. The specific gravity of soil particle Gs = 2.65, the plastic limit ωP = 17.6%, liquid limit ωL = 26.9%, porosity n = 0.41, Possion’s ratio ν = 0.28, shear modulus G = 5.0 × 10⁵ Pa, permeability coefficient ks = 1.0 × 10⁻⁵ m/s.
In laboratory tests for scour around foundation, it is typically impossible to ensure the Froude similarity of all parameters between the prototype and model, contributing the scale effects in model tests [36]. For example, the sediments were not scaled according to the geometrical size. Consequently, it leads to the underpredicted of suspended load transport and overpredicted of bed load transport [37]. Moreover, the disproportional scaled sediments result in the difference of bed roughness between model and prototype, thereby the obvious effects on the wave-current boundary and scour evolution.
Table 1 lists the experimental plans and test parameters. The water depth was held 30 cm in all tests. The regular waves with wave height Hw = 6~8 cm and wave period T = 1.5~2.0 s were used in the present study. The flow velocity Uc = 0.1~0.4 m/s.
The KC can be calculated by [14]
KC = U wm T D
The Ucw can be calculated from the following equation [14].
U cw = U c U wm + U c
The Shields parameter θ can be obtained from Equation (3) according to Soulsby [38]:
θ = U f , m 2 ( ρ s / ρ w 1 ) g d 50
where Uf,m is the maximum value of the near-bed friction velocity; ρw is the fluid density; ρs is the sediments density; g is the gravity acceleration.
The critical Shields parameter θcr can be calculated according to Equation (4) [38]:
θ cr = 0.3 1 + 1.2 d * + 0.055 [ 1 exp   ( 0.02 d * ) ]
d * = [ ( ρ s / ρ w 1 ) g v 2 ] 1 / 3
where ν is the kinematic viscosity of water.
The relationship between θ and θcr satisfies θ > θcr in all tests, instructing the live bed scour prevails. There are about 24,000~32,000 wave cycles in tests due to the limitation of wave generation system, so the equilibrium scour state can’t be reached in some tests according to the equilibrium criterion proposed by Melville and Chiew [39]. In the following section, the equilibrium scour depth Seq was acquired by fitting scour evolution curves based on the formula used by Petersen et al. [40].

3. Results and Discussions

3.1. Scour Development and Scour Morphology

The scour depth evolution curves can be obtained by the echo sounders. Figure 4 depicts the scour depth beneath the main column for case R4 and R15. As shown in Figure 4, the scour depth showed quick increase at initial stage. After that, the scour rate decreased and the scour depth approached the asymptotic value, indicating the scour reached a relatively stable scour state. All the scour development curves appeared the evident fluctuation over the whole tests due to the sand dunes passing scour holes in the live bed regime. According to the equilibrium standard suggested by Melville and Chew [39], the equilibrium scour state still was not reached at the end of tests. In order to obtain the equilibrium scour depth Seq, the scour depth prediction formula (Equation (6)) used by Petersen et al. [40] was adopted to fit the scour development curves of the present study.
S t / D = S eq / D   ( 1 exp   ( t / T c ) )
where Tc is the time scale of scour process. Tc defined in Equation (6) represents the time period where the line going through the origin of coordinates is tangent to the asymptotic line of St/D (see Figure 4).
The fitting results were also shown in Figure 4. From Figure 4, it can be seen that Equation (6) can depict the scour evolution effectively around tripod in combined waves and current. In this way, the equilibrium scour depth in following section was obtained by Equation (6).
Compared with a single pile, the tripod consists of a main column and diagonal bracings, which has significant effects on the flow field adjacent to tripod, so a unique scour topography can be expected in the vicinity of tripod. Figure 5 shows the scour topography in test R4 for installation angle α = 0°, 90° and 180°. From Figure 5, it can be seen that the maximum scour hole appeared underneath the main column for α = 0°, 90°and 180°. Furthermore, the scour extent was not just limited to underneath the main column, and it extended along the lower diagonal braces. The phenomenon can be attributed to the blockage effects of the structural elements, it leading to streamlined compression and flow acceleration adjacent to the diagonal bracings, thus the relative high bed shear stress, so more sediments were mobilized and transported. This similar scour morphology around tripod in random waves or steady current was also reported by Yuan et al. [27], Stahlmann [30] and Yamini et al. [32]. Supposing (Seq/D)α=0° denotes the maximum value of the dimensionless equilibrium scour depth for α = 0°. As shown in Table 1, the (Seq/D)α=90° are greater than (Seq/D)α=0° and (Seq/D)α=180° in tests, indicating the tripod suffered from more severe scour when α = 90° than the case of α = 0° and α = 180°. This can be explained as follows. For α = 90°, the diagonal braces connecting with the wall-facing pile are perpendicular to the waves progressing direction, leading the higher blockage effects than α = 0° and α = 180°, thus more significant streamlined compression and flow acceleration, consequently higher shear stress on the seabed.

3.2. Time Scale

As shown in Figure 4, the time scale Tc can be obtained from Equation (6) by fitting the scour evolution curves, which reflects the needed time for a substantial amount of scour to occur. The dimensionless time scale T* can be calculated as [29]
T * = ( g ( ρ s ρ 1 ) d 50 3 ) 0.5 T c D
Figure 6 depicts the correlation of T* and Ucw. Compared with the case of wave-only (Ucw = 0), the T* increased significantly when a current was superimposed on the waves, indicating a faster scour process in combined waves and current. According to Petersen et al. [40], it can be explained by the formation of flow-induced horseshoe vortex when a current component was introduced in waves, which contributes to an increased scour depth around the foundation, thus the longer duration to the equilibrium scour state. However, the T* decreased again with increasing Ucw in the range of 0.347 < Ucw < 0.739, implying a faster scour process. Furthermore, for the case of current-only (Ucw = 1), the T* equaled to the value for Ucw > 0.7, indicating the current-dominated regime when Ucw > 0.7. When KC was fixed, the T* for α = 90° were slightly larger than the case of α = 0° and α = 180°, possibly because high blockage effects led to flow acceleration and bed shear stress on seabed evidently, thus more sediments were mobilized and transported.
ln T * = 3.43 U cw + 3.66
ln T * = 2.43 U cw + 3.37
ln T * = 2.58 U cw + 3.48
Similar to the results of Welzel et al. [29] and Petersen et al. [40] for the jacket and single pile, the linear formula (see Figure 6) was used to fitting the present data in the range of 0.347 < Ucw < 0.739. As shown in Figure 6, the linear formula can well depict the relationship between T* and Ucw. Compared with the case of KC = 8.06 and 10.35, the T* appeared more dependent for KC = 6.04 over the whole range, which was similar to the experimental results for jacket structure reported by Welzel et al. [29]. The reason may be that the effects of current on scour evolution were easing off for larger KC and thus waves dominated scour process.

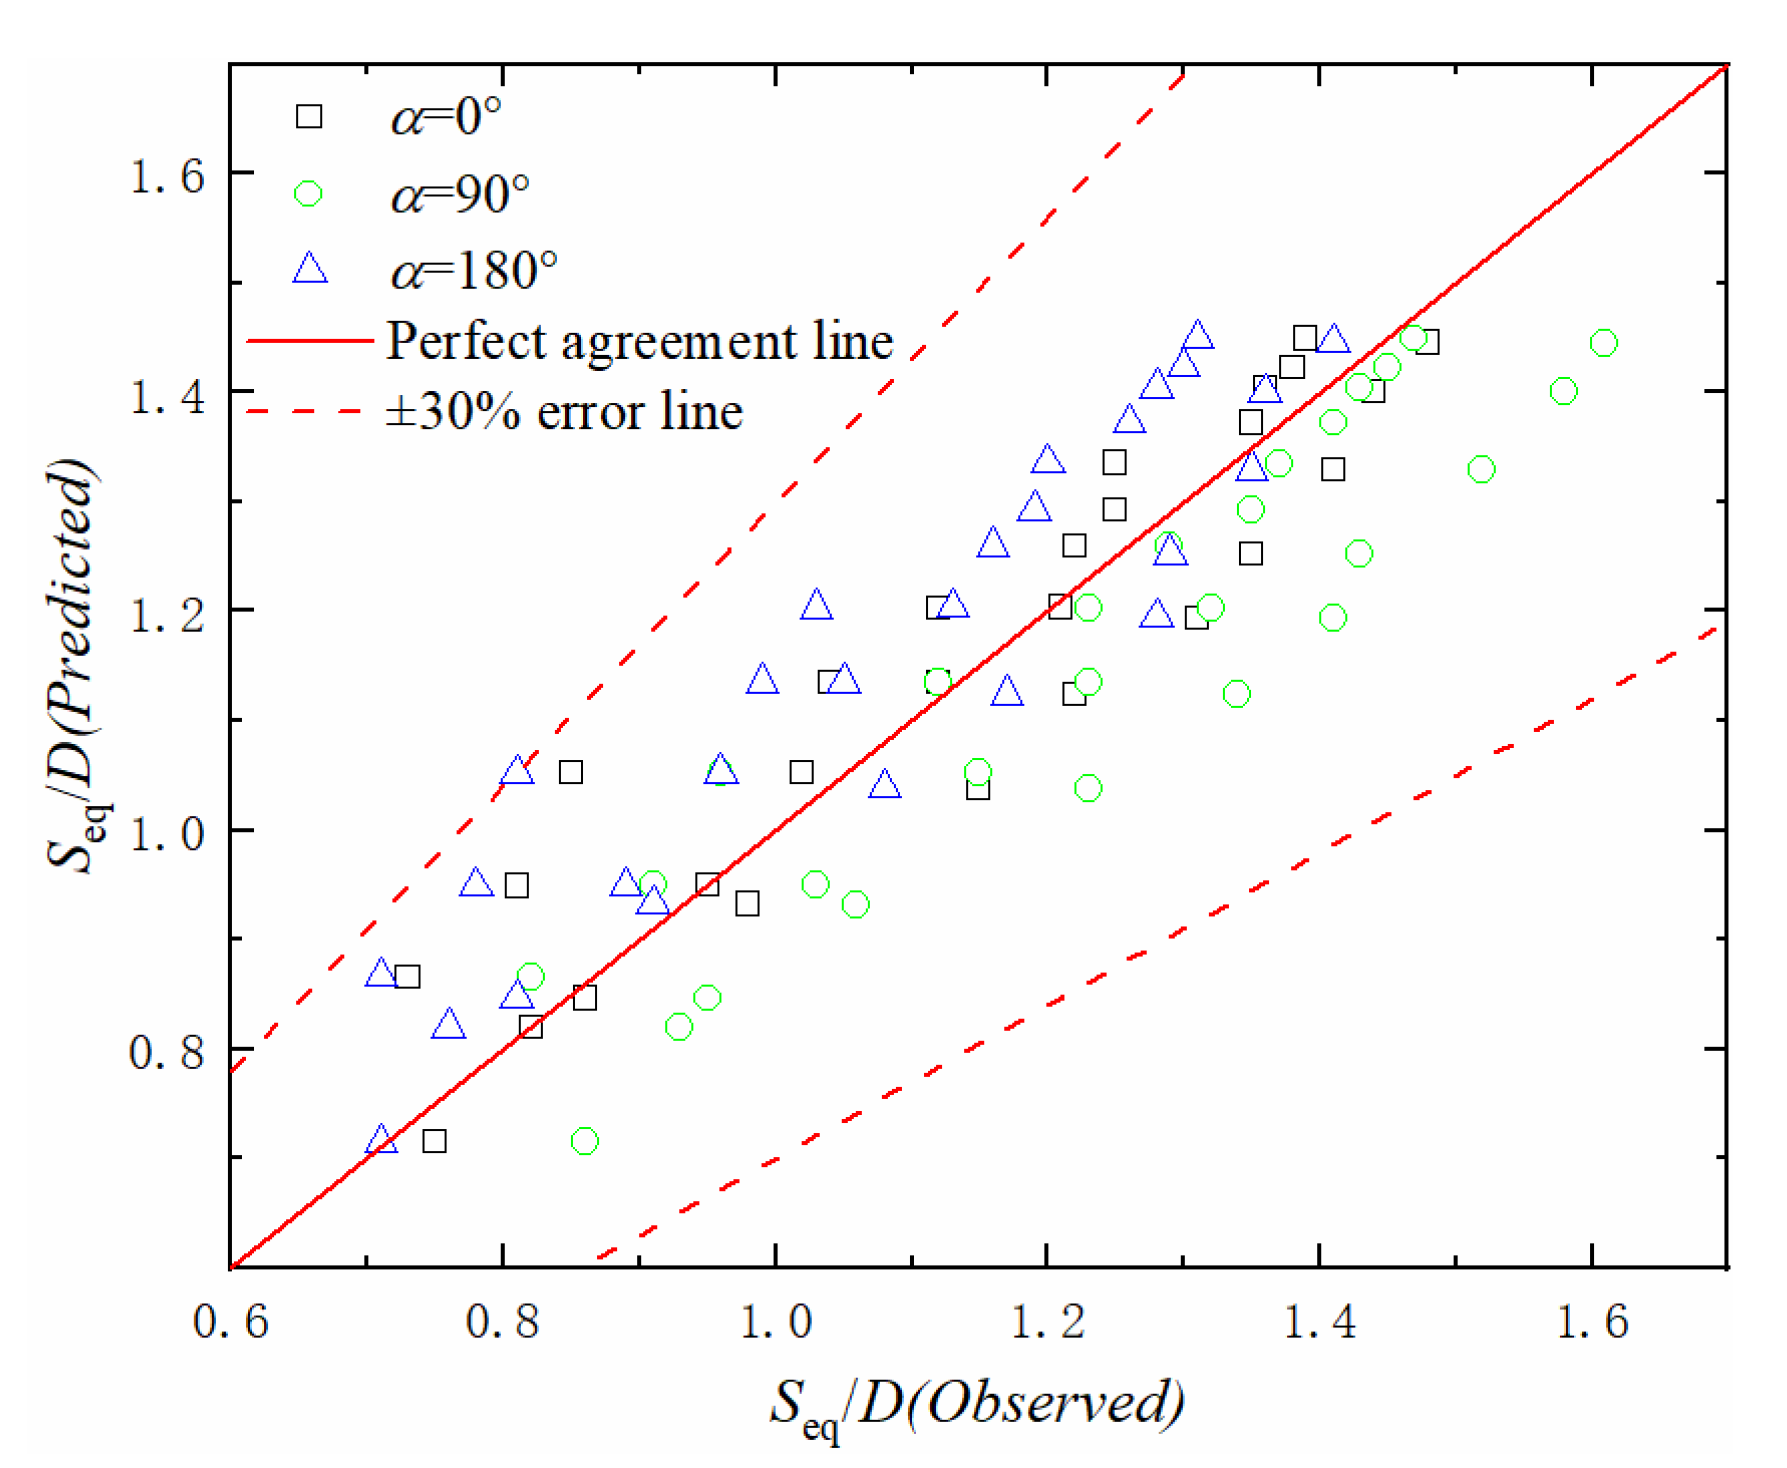
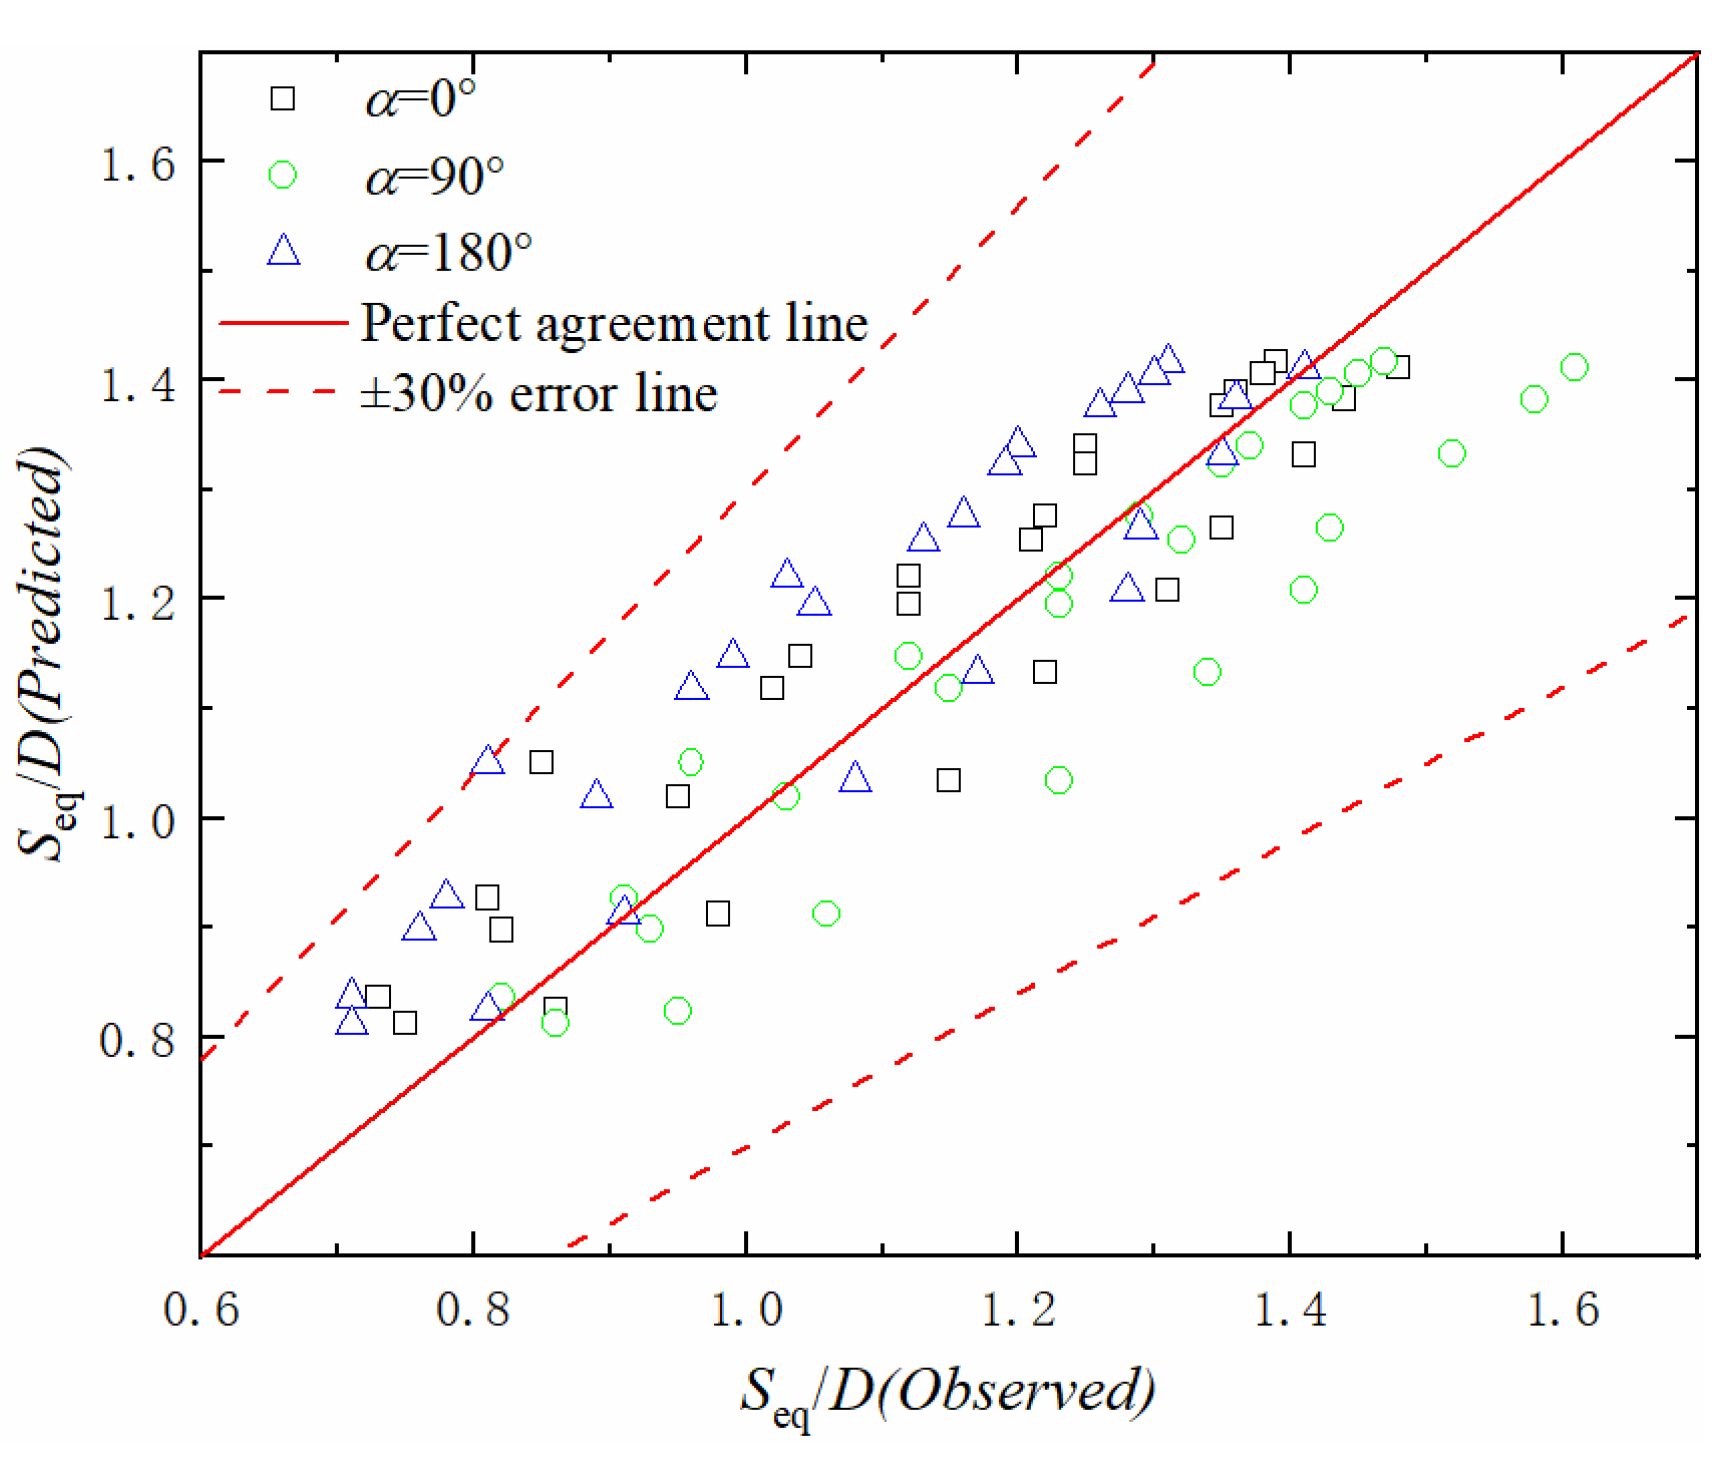
3.3. Scour Depth Prediction

3.3.1. Influence of KC and Ucw on Scour Depth

Figure 7 presents the results of the equilibrium scour depth Seq beneath the main column with different KC and Ucw. The experimental data from Sumer and Fredsøe [14] were also depicted in Figure 7 to facilitate comparison. The results imply that for the same KC, the Seq increased with increasing Ucw over the whole range. For small KC (e.g., KC = 6.04 in Figure 7), the Seq increased considerably by introducing a current in waves. These results were similar with the findings by Qi and Gao [9] and Welzel et al. [29] for single pile and jacket respectively. The phenomenon can be attributed to that superimposing a current in waves lowered the critical KC for scour initiation, especially for small KC condition. For a fixed Ucw, the larger KC usually led to a greater Seq, and it had an enhanced effect on Seq for a relatively smaller Ucw. The Seq approached the asymptotic value when Ucw > 0.7, and the values corresponded to the case of current-only (Ucw = 1), indicating the scour around tripod was dominated by current when Ucw > 0.7. The mechanism may be that the horseshoe vortex became weaker for relative larger Ucw, ultimately impeding the development of the scour hole.
Sumer and Fredsøe [41] proposed the formula (Equation (11)) to predict the Seq around single pile in combined waves and current.
S eq / D = S c / D { 1 exp   [ A ( KC B ) ] } ;   KC 4
where Sc the equilibrium scour depth around single pile under current-only, and the A and B are calculated as follows
A = 0.03 + 3 / 4 U cw 2.6
B = 6 exp   ( 4.7 U cw )
To validate the applicability of Equation (11) for the tripod in combined waves and current, Equation (11) was also plotted in Figure 7. The results show that despite the definite scatter, the varying trend of the experimental data were generally consistent with the predicting values by Equation (11) in the range of 0.347 < Ucw < 0.739. Figure 8 presents the comparison between the experimental results and predicted values. As shown in Figure 8, Equation (11) underestimated the experimental results to some extent. The experimental values were about 25% higher on average than the prediction values for α = 90°. The errors can be attributed to the blockage effects induced by tripod’s structural elements, consequently the greater scour depth. Moreover, although the maximum scour depth appeared underneath the main column for all cases, the scour hole was not just limited to underneath the main column, and it extended along the lower diagonal braces. Therefore, it was recommended to multiply a safety coefficient (e.g., 1.3 for α = 90°) when Equation (11) was adopted to predict Seq around tripod in combined waves and current.
Considering the scour protection around tripod, the scour protection layer should be strengthened specially in these zones to minimize scour risks. Traditionally, hard protective materials, such as rocks, were widely adopted as the armor layer around monopoles [42,43]. If the same scour protection type is used as the armor layer around tripod, a larger thickness of armor layer is indispensable and the zones beneath the lower diagonal braces should also be reinforced. What’s more, thinking of the complex geometry of tripod, it’s advisable the scour protection layer was placed beneath the main column and the lower diagonal braces before the installation of tripod [44].

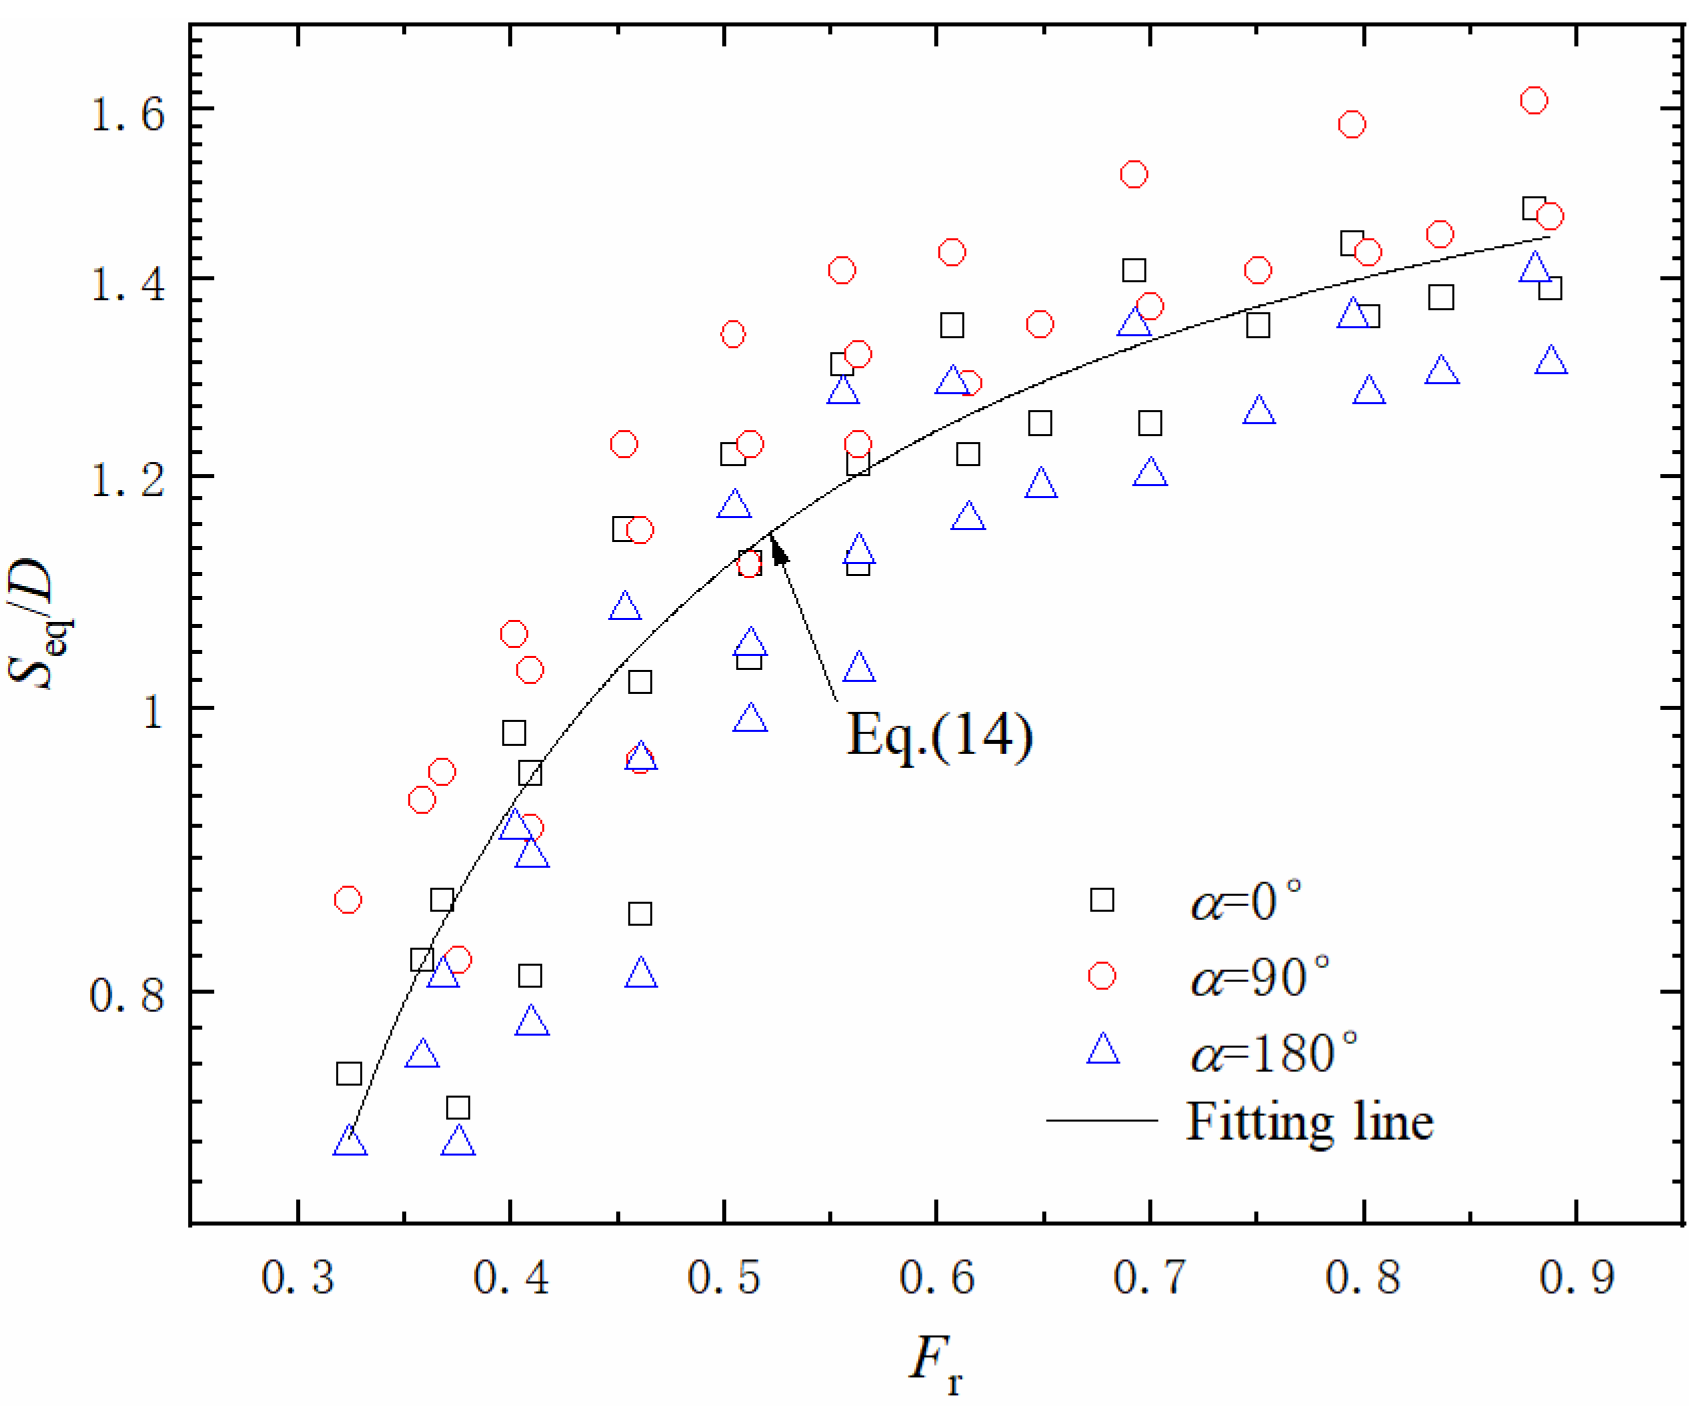
3.3.2. Influence of Fr on Scour Depth

Based on the experimental results of Sumer et al. [12], the horseshoe vortex and wake vortex are responsible for scour around single pile in combined waves and current. The Froude number Fr has significantly influence on the intensity of horseshoe vortex. In this section, the effects of Fr on the Seq for tripod were investigated. Figure 9 shows the correlation between Seq and Fr. The results reveal that the Seq increased with increasing Fr, and it gradually approached asymptotic value, so the higher Fr resulted in the greater scour depth around tripod. The similar observations for single pile were also reported by Qi and Gao [9] and Corvaro et al. [19].
According to the results of flume tests conducted by Qi and Gao [9], a logarithmic formula can be used to depict the correlation between Seq and Fr for single pile. In present study, the logarithmic formula was also adopted to fit the correlation between Seq and Fr, and Figure 9 presents the fitting results. The fitting line can depict the general trend of Seq and Fr despite the existing discrepancy between experimental data and fitting results. Figure 10 displays the comparison between the experimental data and fitting results. The results instruct that the experimental data generally distributed within the ±30 error lines, indicating the adaptation of the logarithmic formula (Equation (14) in Figure 9) to depict the correlation between Seq and Fr for tripod.
lg ( S eq / D ) = 0.23 exp   ( 0.33 / F r ) + 0.49

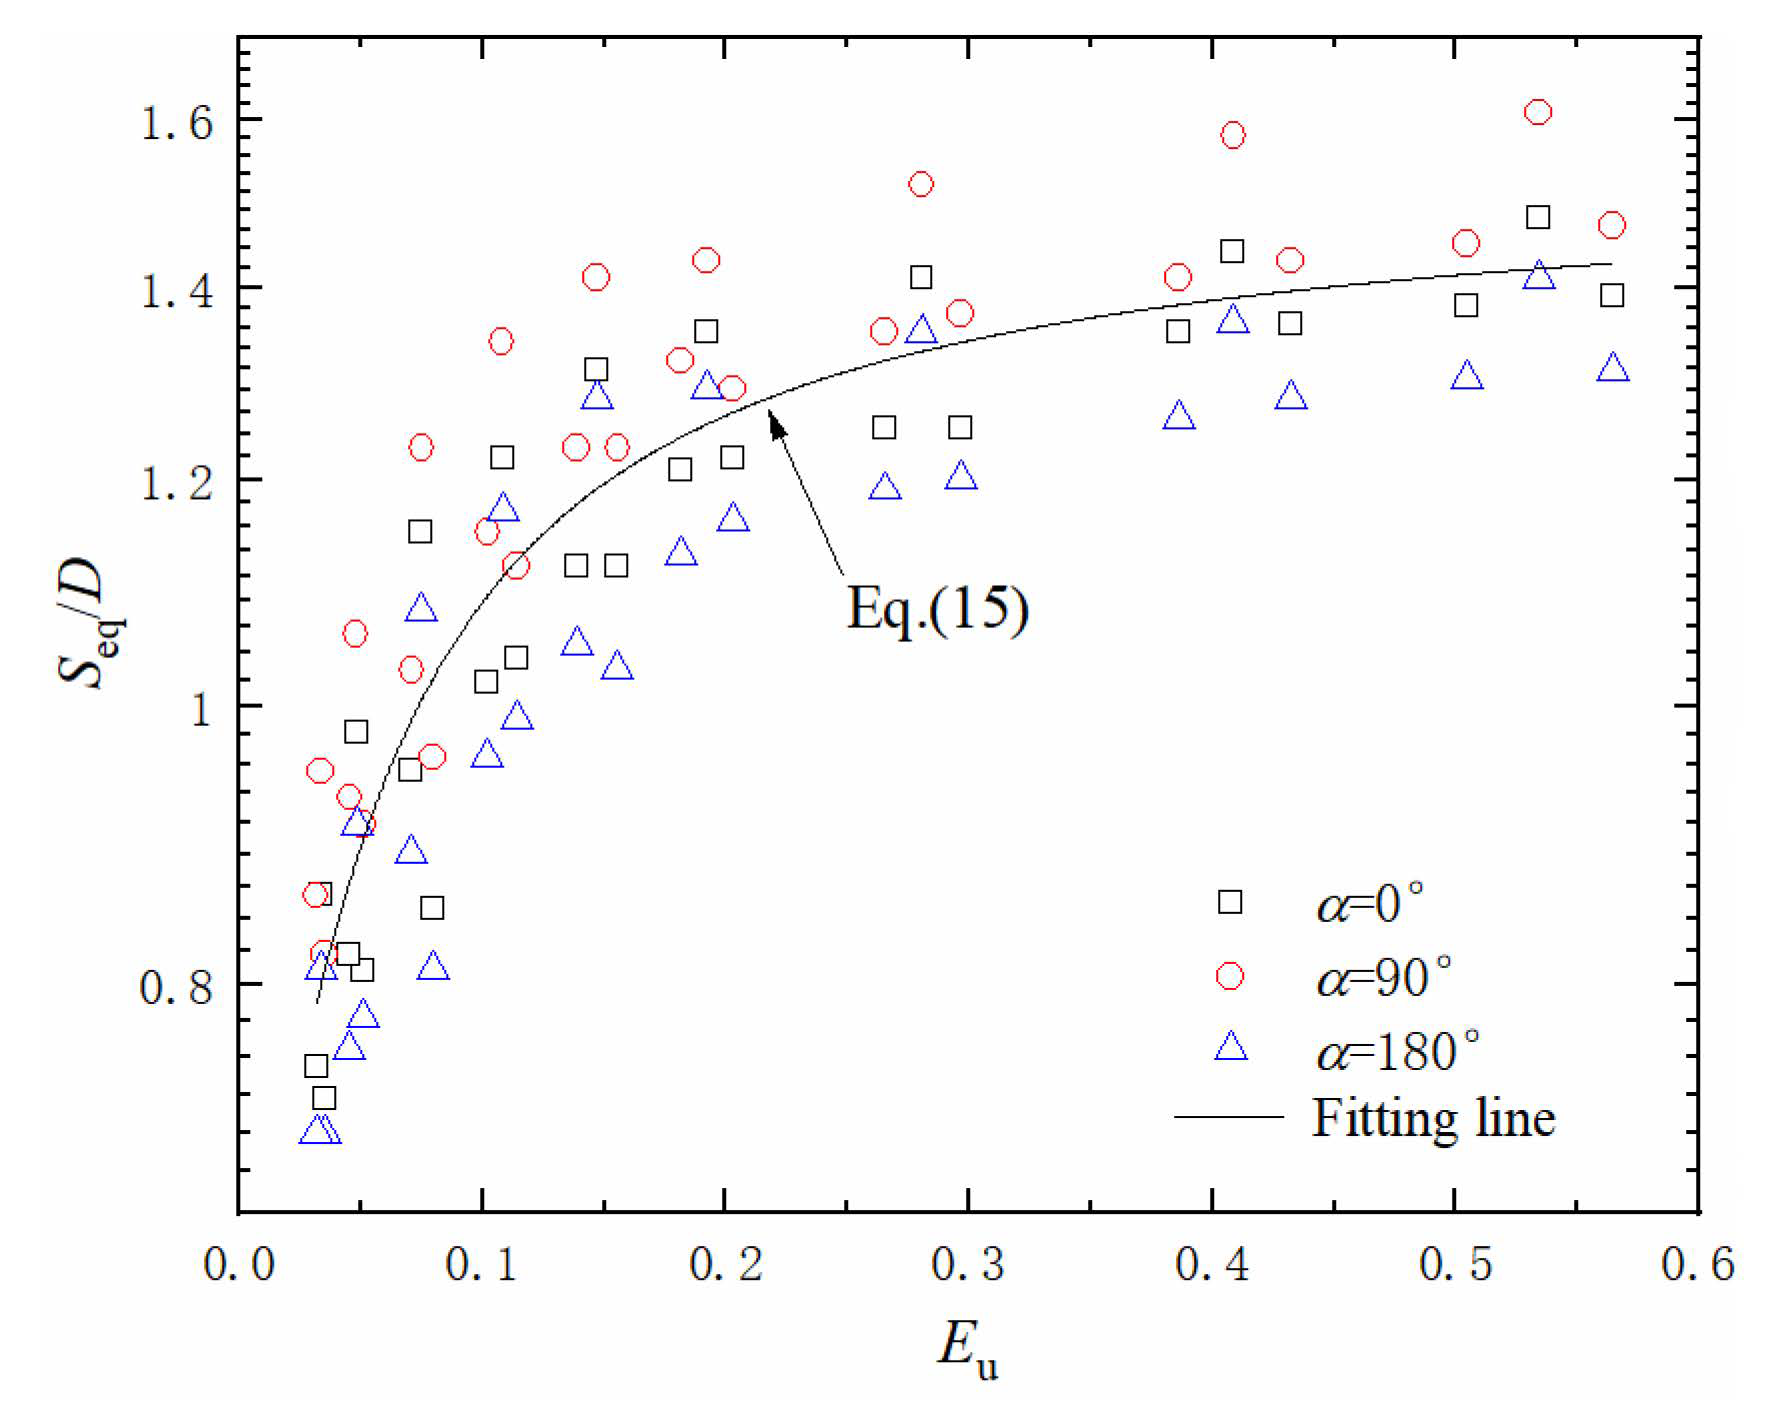
3.3.3. Influence of Eu on Scour Depth

According to the experimental results of Tavouktsoglou et al. [45], the Euler number Eu has effects on Seq for single pile. In the present section, the effects of Eu on the Seq for tripod were studied. Figure 11 presents the correlation between Seq and Eu. The results reveal that the Seq increased with increasing Eu, and it gradually approached the asymptotic value, which was similar to the varying trend between Seq and Fr. In this way, it can be reasonably concluded the logarithmic formula alao can be adopted to depict the correlation between Seq and Eu. Figure 11 shows the fitting results.
From Figure 11, it can be seen that the logarithmic formula can depict the general varying trend of Seq and Eu despite the existing discrepancy between experimental data and fitting results, indicating the logarithmic formula (Equation (15) in Figure 11) was also applicable to depict the correlation between Seq and Eu for tripod. The results also imply that the higher Fr and Eu both resulted in the greater scour depth for tripod in combined waves and current. Figure 12 displays the comparison between the experimental data and fitting results. The results instruct that the experimental data generally distributed within the ±30 error lines, indicating the adaptation of the logarithmic formula to express the correlation between Seq and Eu for tripod.
lg ( S eq / D ) = 0.34 exp   ( 0.05 / E u ) 0.16

3.3.4. Remarks Regarding the Effects of Structural Elements on Seq

In the present study, a series of scour tests for tripod were conducted in a wave-current flume, and the maximum equilibrium scour depth Seq was obtained by fitting experimental data using the formula proposed by Petersen et al. [40]. The experimental data were compared with the prediction values by Equation (11). The comparison results indicate that the varying trend of experimental data were basically consistent with the predicting values by Equation (11) in the range of 0.347 < Ucw < 0.739, but Equation (11) generally underestimated the experimental results, especially for the case of α = 90°. The errors can be attributed to the higher blockage effects induced by tripod’s structural elements, which led to significantly streamline compression and flow acceleration adjacent to structural elements, thus higher shear stress on the seabed, consequently more sediments being mobilized and transported.
However, it is believed that the smaller distance between tripod’s structural elements and the seabed contributes to an increased streamline compression and flow acceleration close to the seabed, so it may exert considerable effects on the scour evolution and scour depth. Thus, the effect of each of the structural elements on the Seq should be studied systematically in following studies. What’s more, noteworthy is that the minimum value of Ucw = 0.347 was realized in the present study due to the limitation of experimental setup, so it is vital to further investigate the varying trend of Seq for the relative lower Ucw.

4. Conclusions

According to the above analysis, the main conclusions can be drawn:
(1)
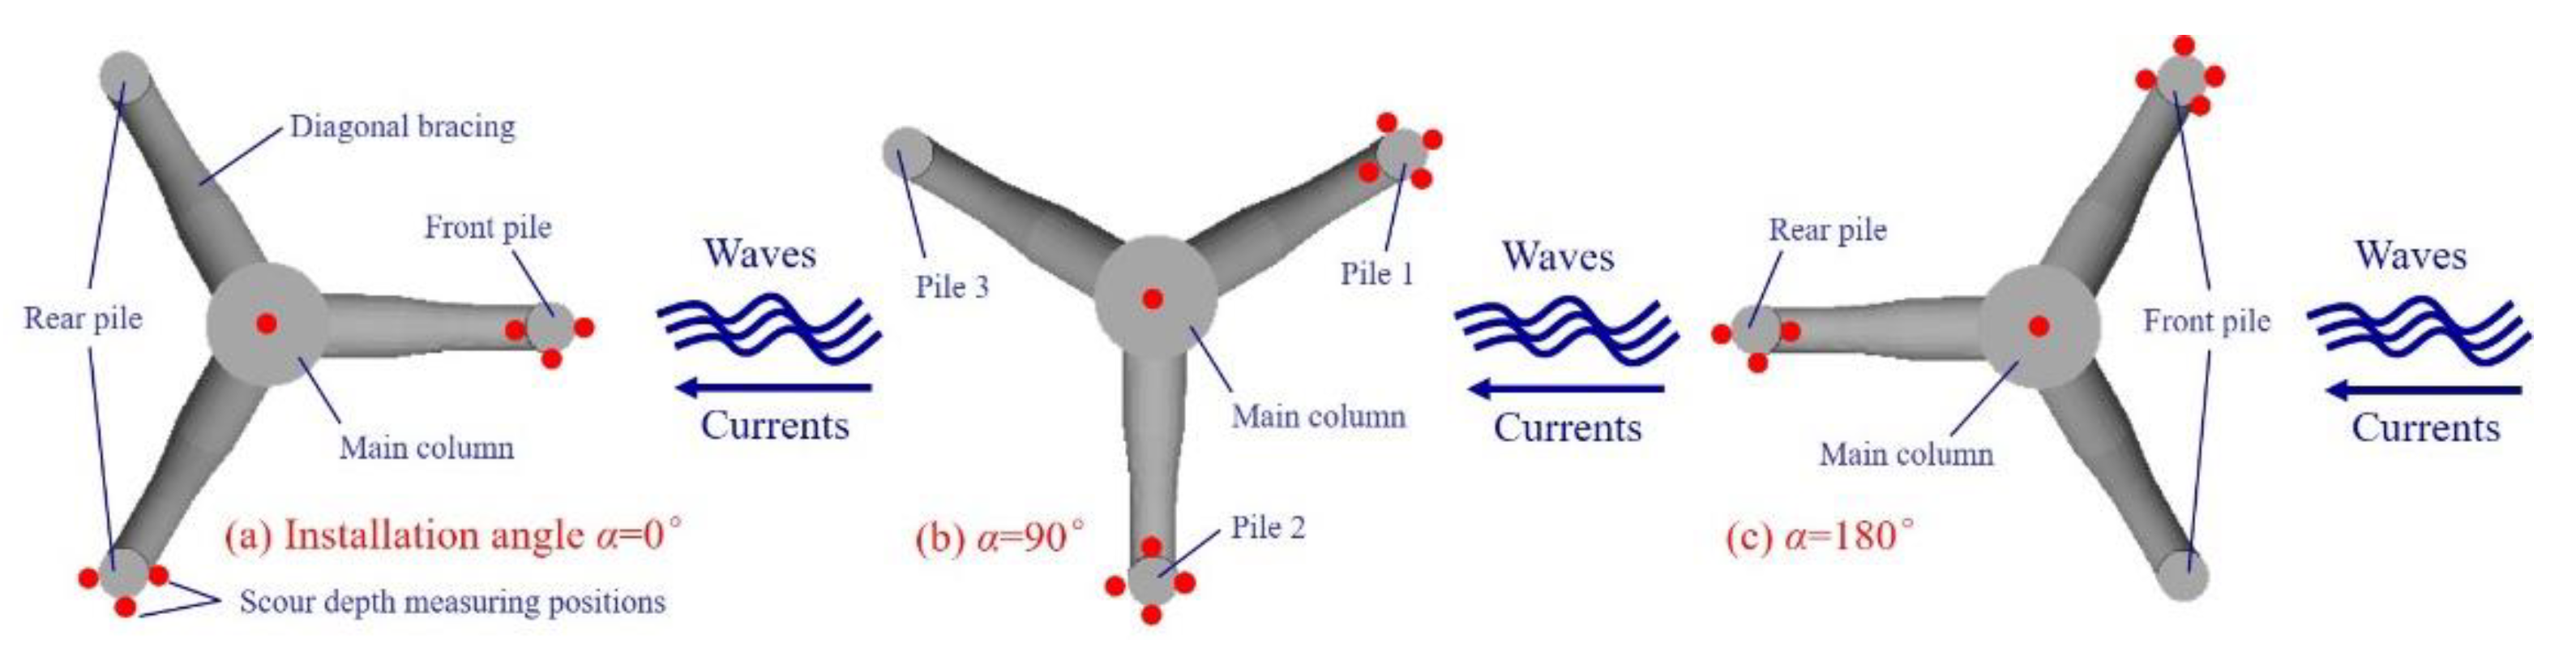
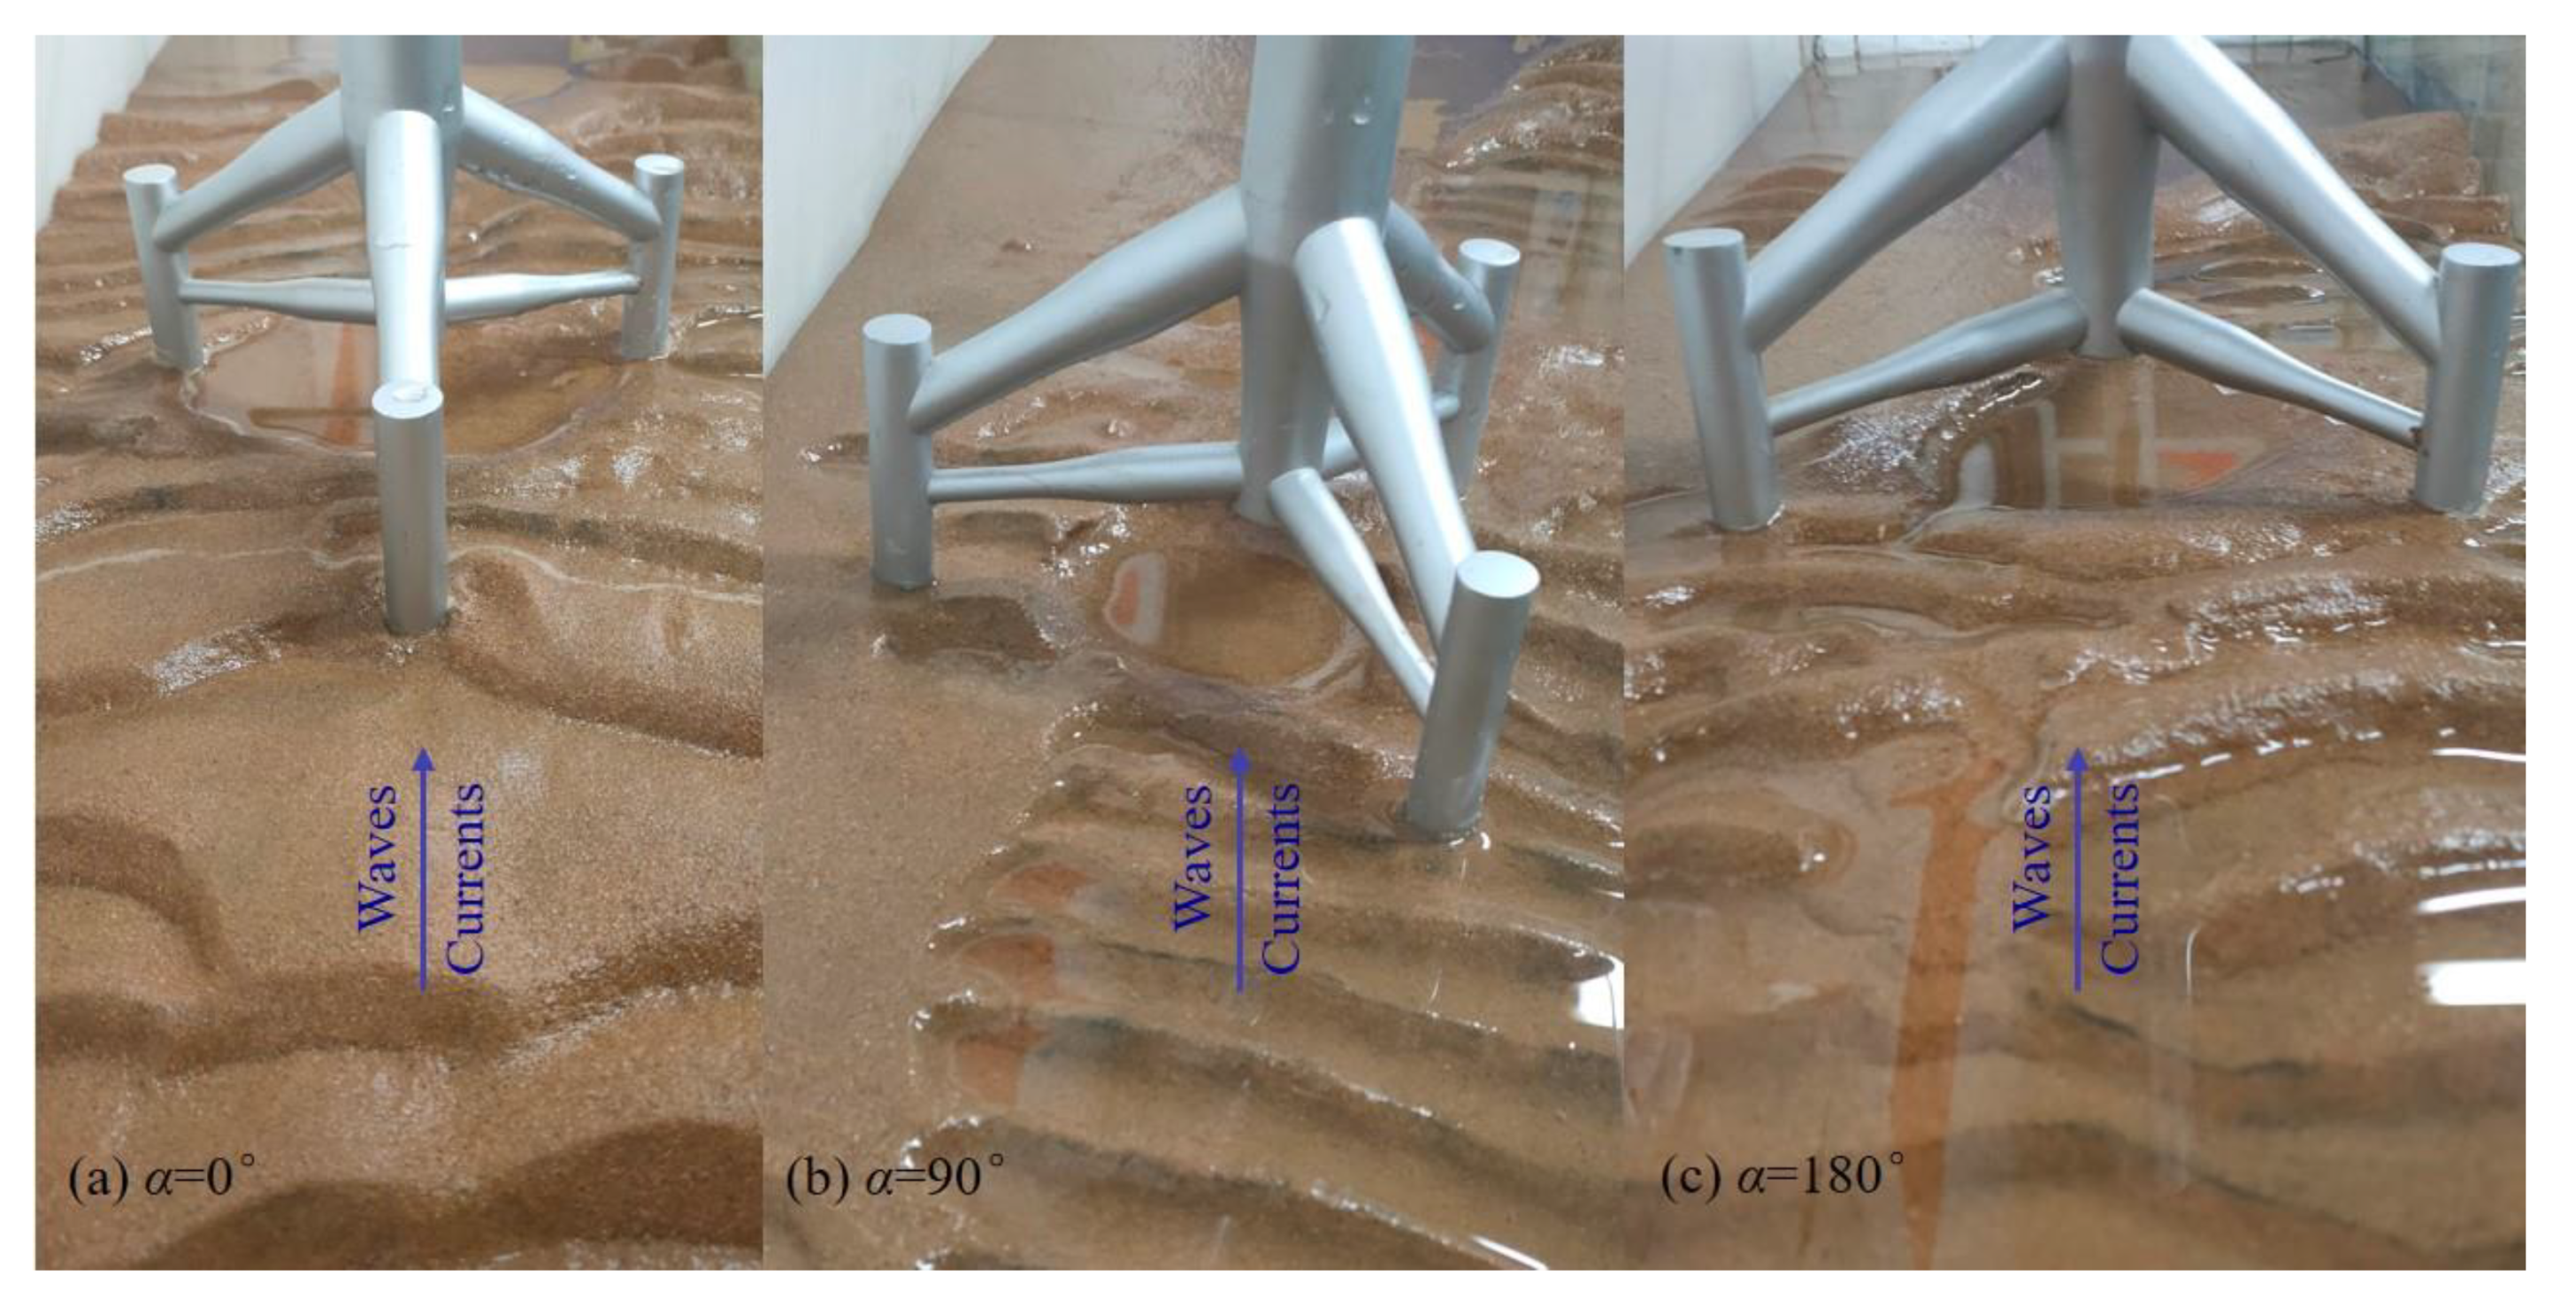
The maximum scour hole appeared underneath the main column for installation angle α = 0°, 90° and 180°, which can be attributed to the blockage effects of the structural elements, it leading to streamline compression and flow acceleration adjacent to the diagonal bracings, thus the relative high bed shear stress, so more sediments were mobilized and transported.
(2)
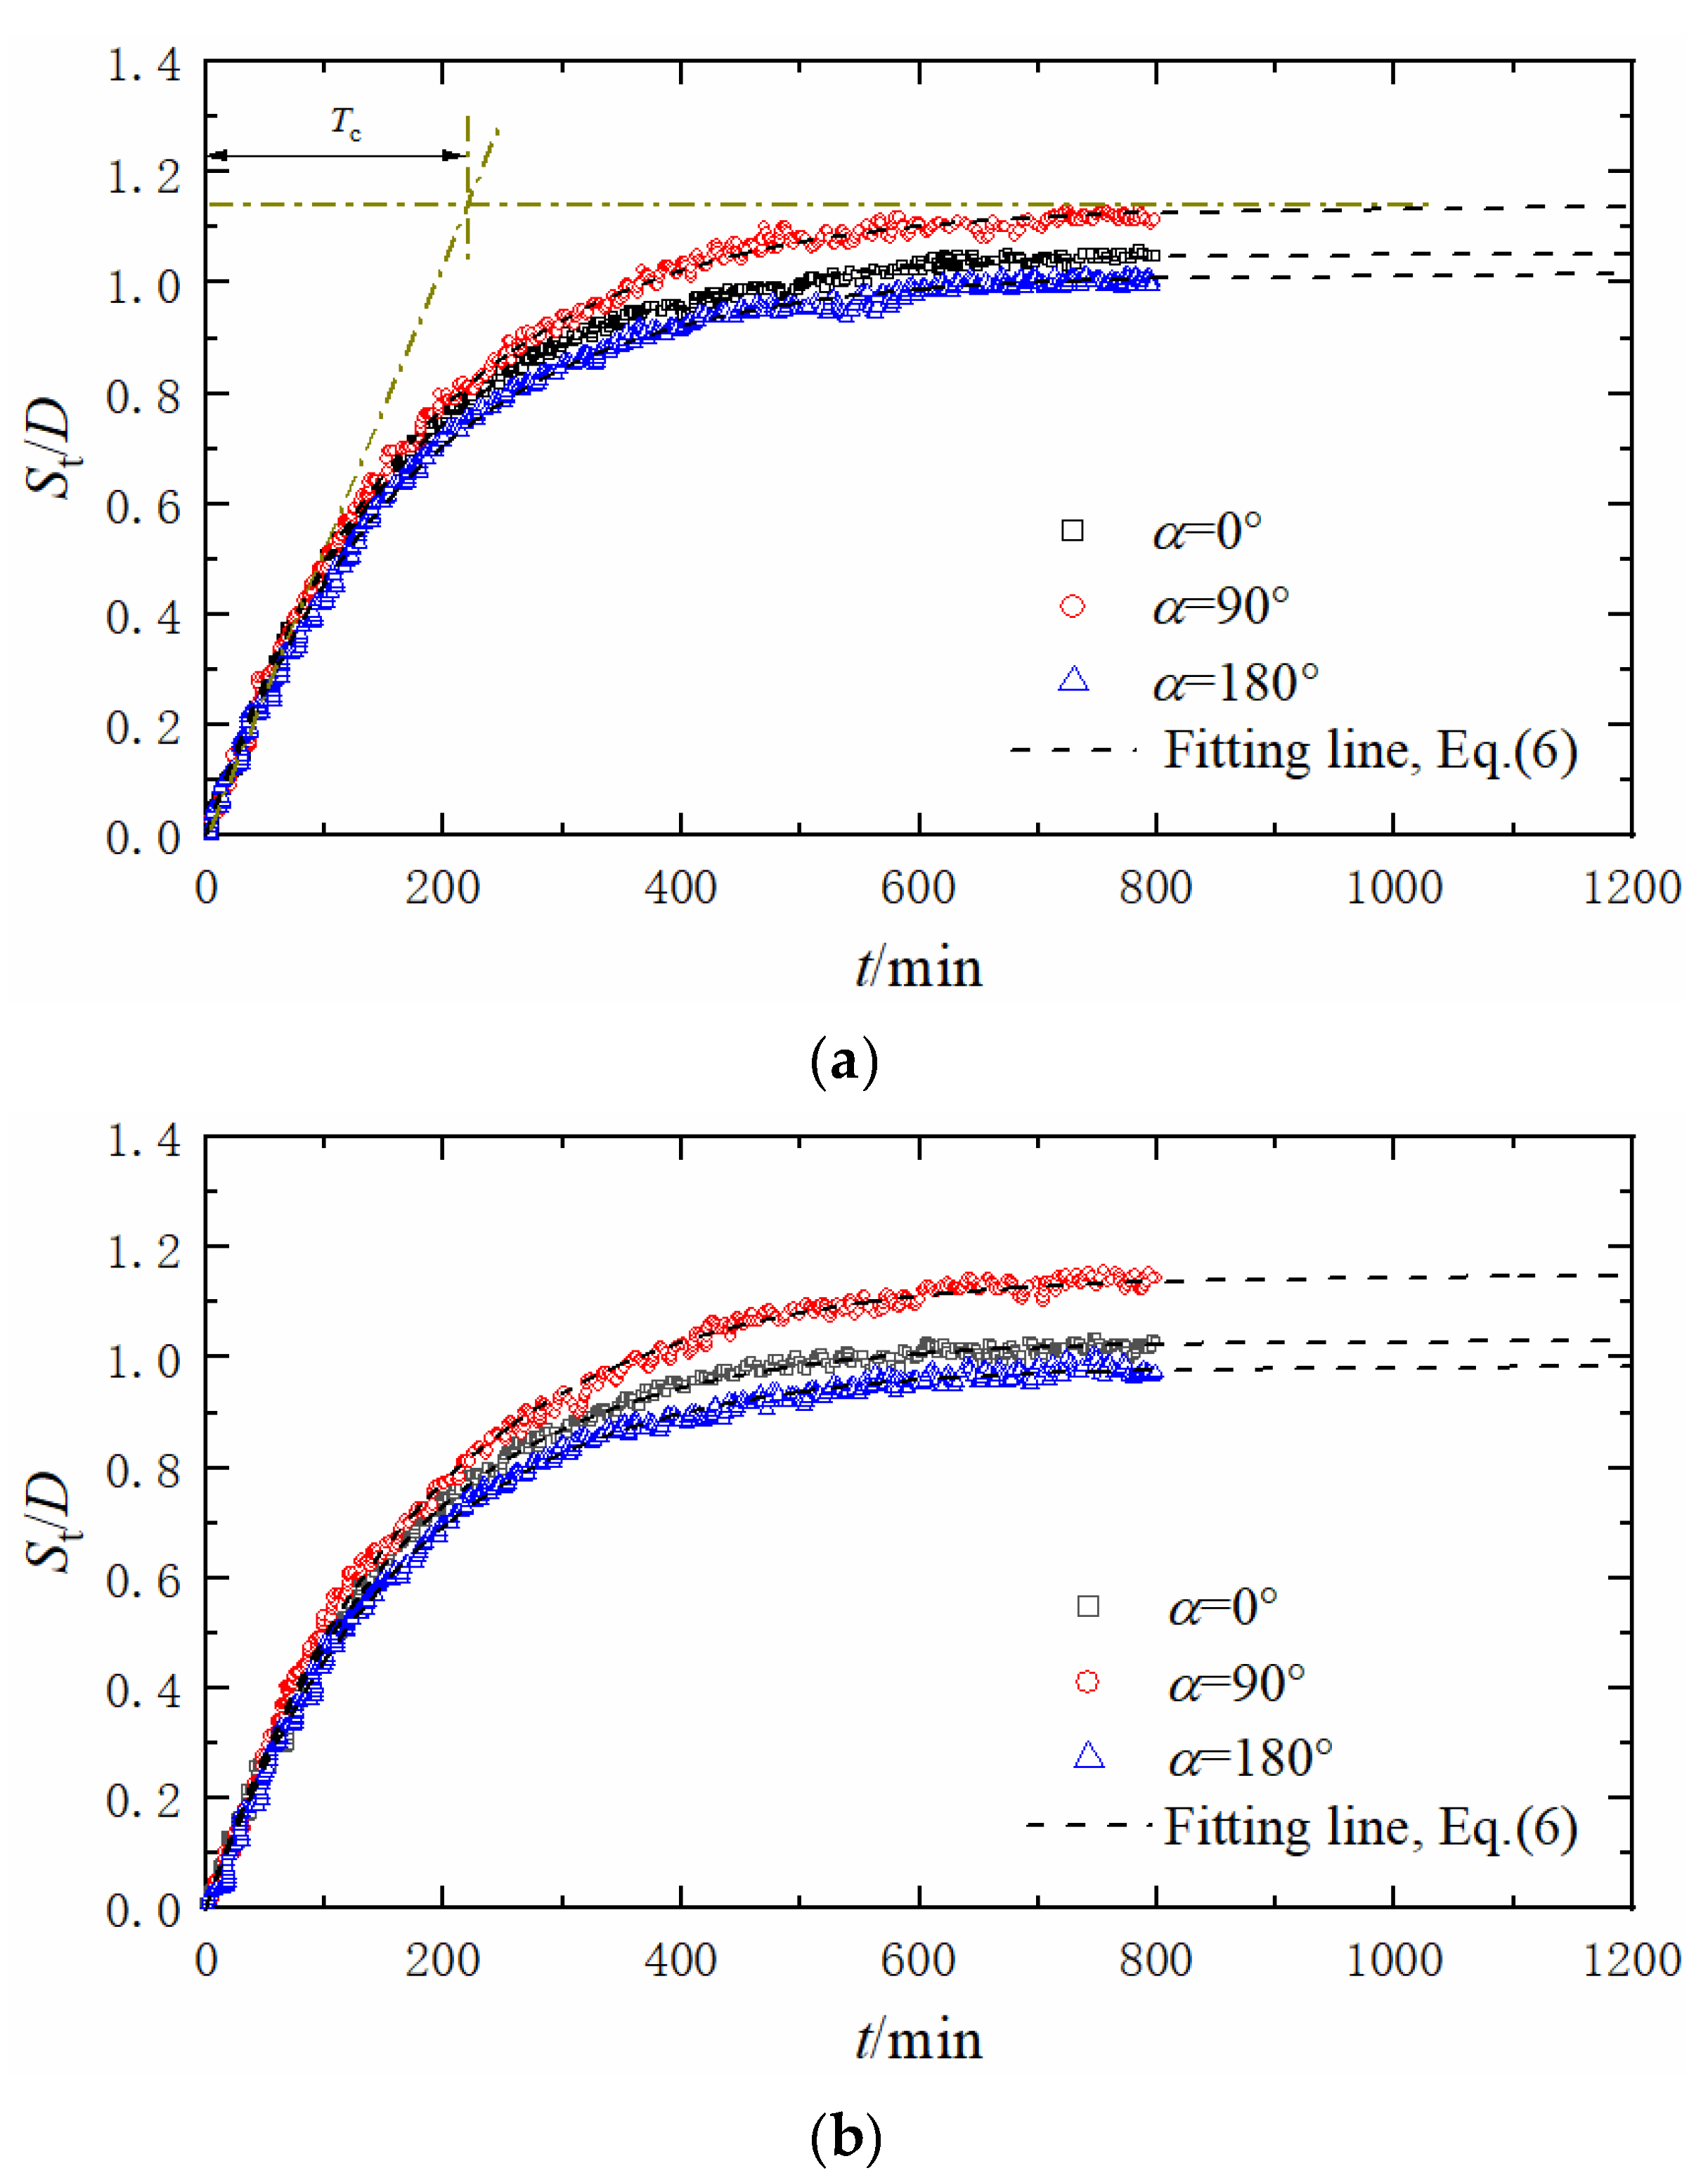
The equilibrium scour depth for α = 90° was greater than the case of α = 0° and α = 180°, indicating the tripod suffered from more severe scour for α = 90°. The scour mechanism can be explained by the higher blockage effects for α = 90° due to the diagonal braces connecting with the wall-facing pile perpendicular to the waves’ progressing direction.
(3)
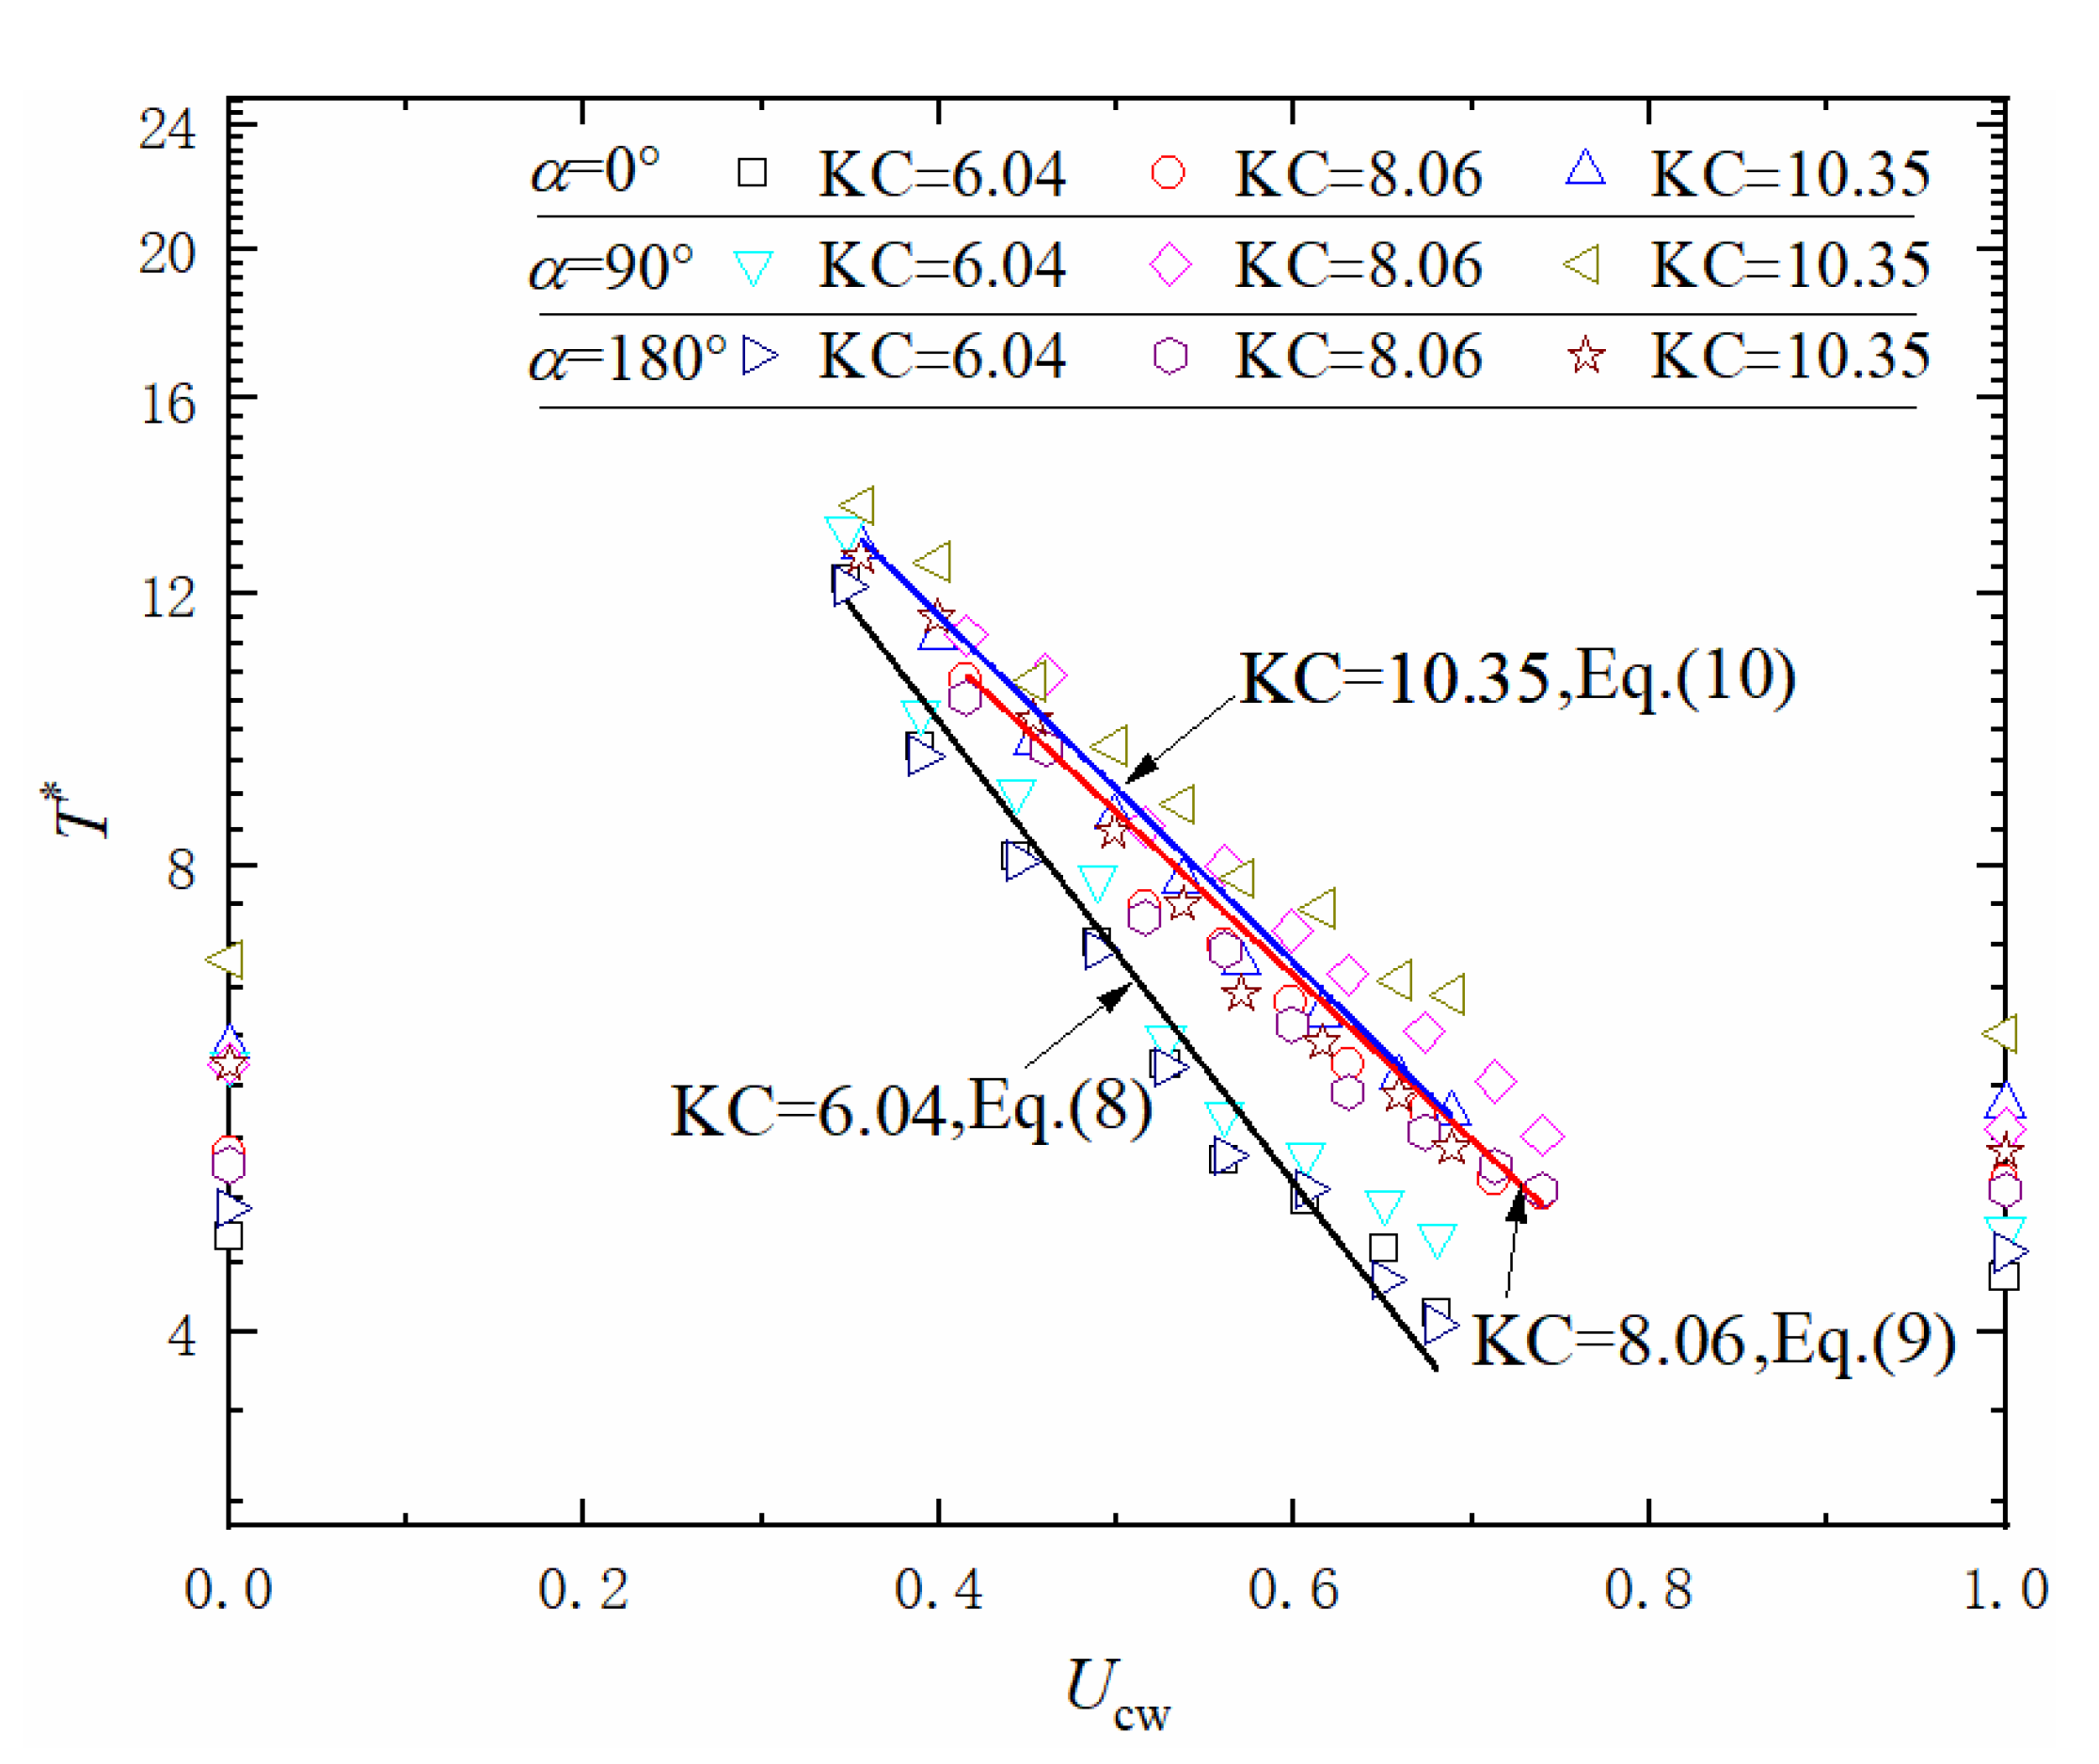
When KC was fixed, the dimensionless time scale T* for α = 90° were slightly larger than the case of α = 0° and α = 180°, meaning the longer duration to the equilibrium scour state. The T* was linearly correlated with Ucw in the range of 0.347 < Ucw < 0.739.
(4)
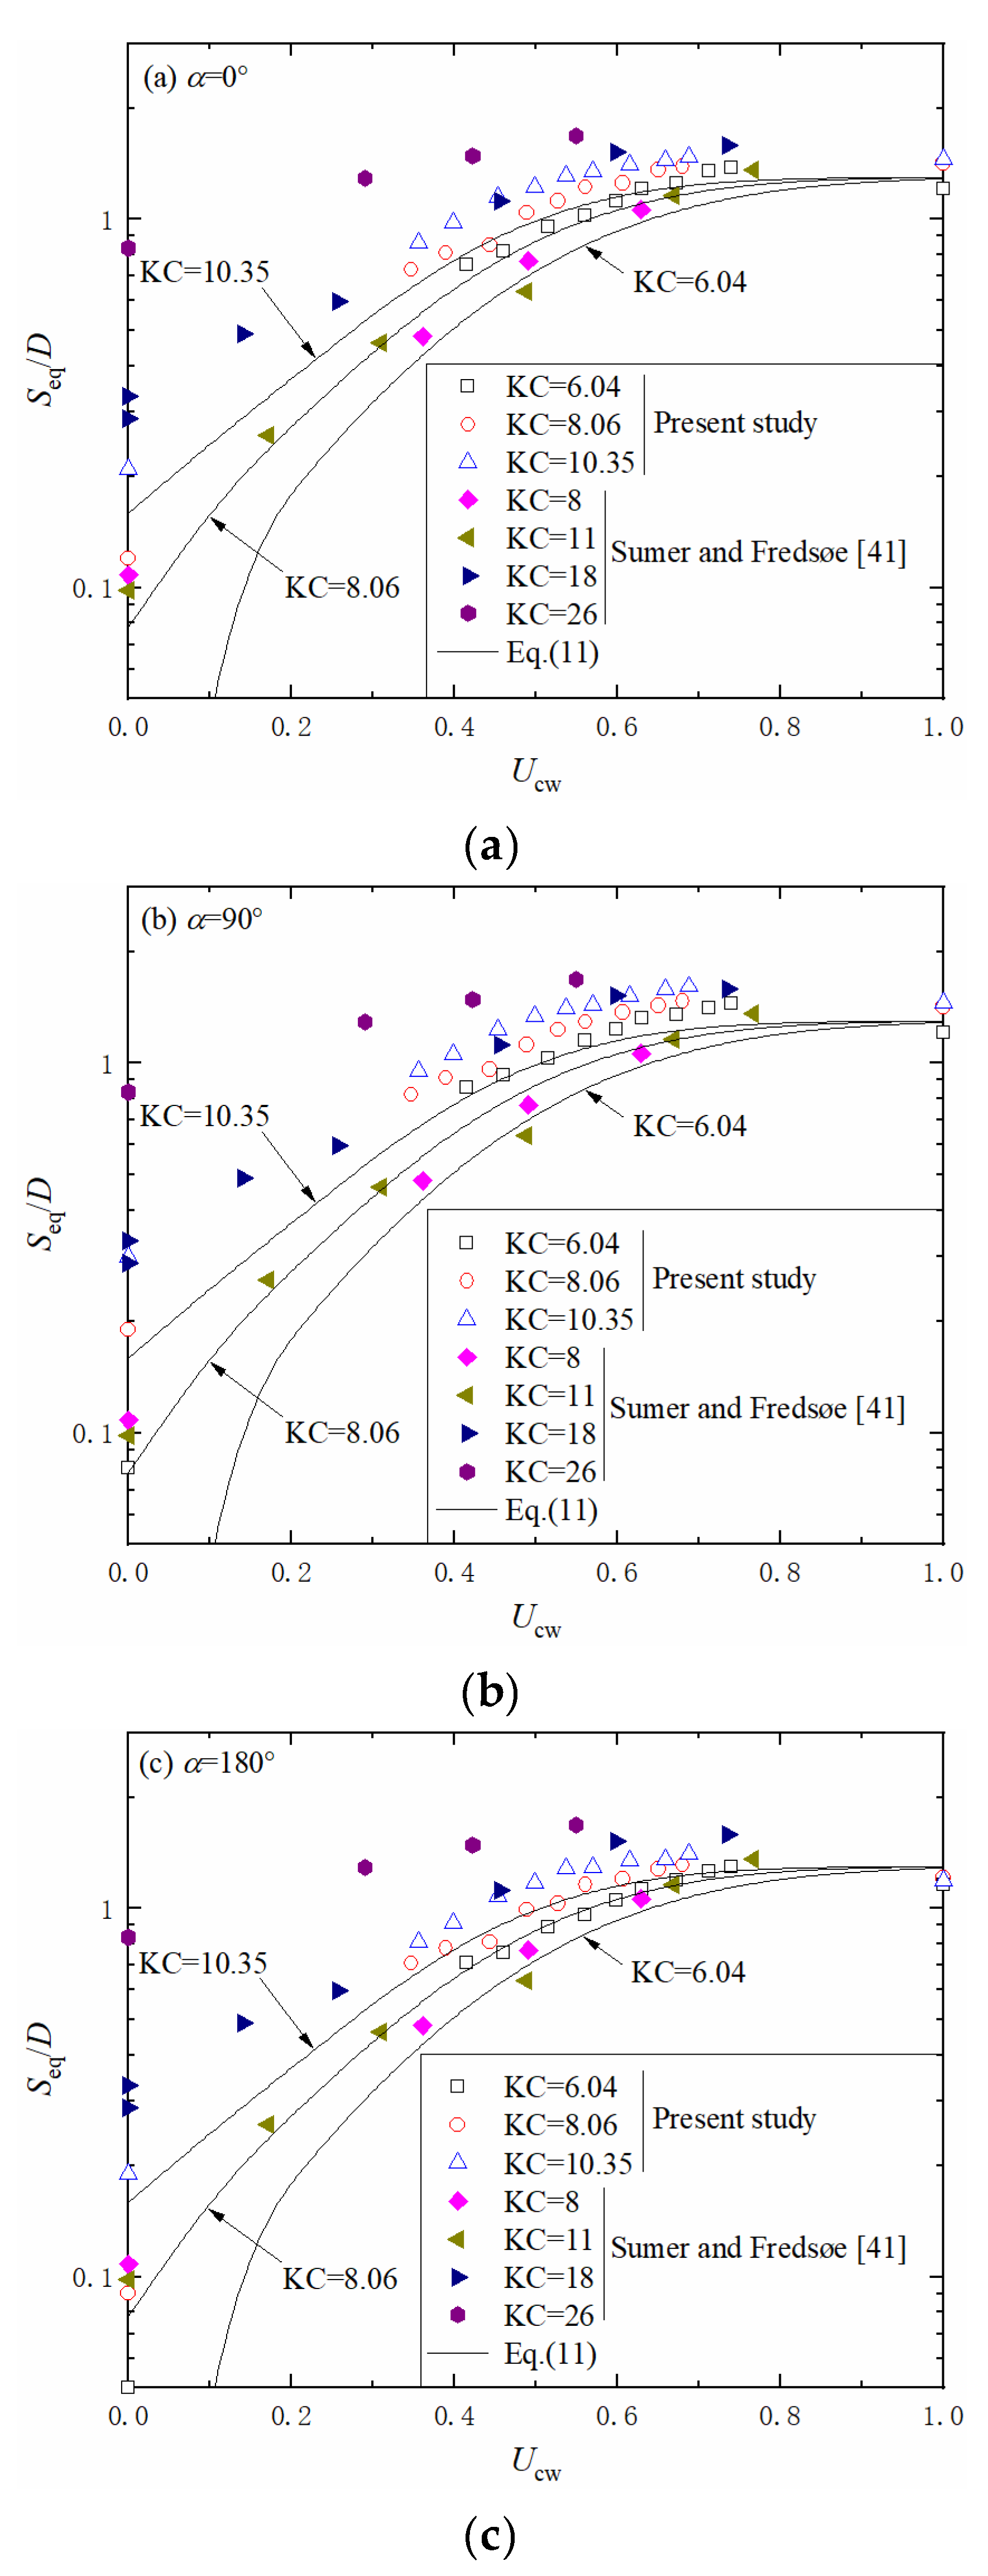
The varying trend of the experimental data were basically consistent with the prediction results by Equation (11), but the Equation (11) generally underestimated the experimental results, especially for the case of α = 90°. The errors can be attributed to the higher blockage effects induced by tripod’s structural elements, so it was recommended to multiply a safety coefficient (e.g., 1.3 for α = 90°) when the Equation (11) was adopted to predict Seq around tripod in combined waves and current.
(5)
The higher Fr and Eu both resulted in the greater scour depth for tripod in combined waves and current. The logarithmic formula can depict the general trend of Seq and Fr (Eu) for tripod in combined waves and current.

Author Contributions

Conceptualization, H.L.; Data curation, R.H. and Y.L.; Formal analysis, X.W. and H.L.; Funding acquisition, X.W.; Writing—original draft, R.H. and Y.L.; Writing—review & editing, X.W. and H.L. The final manuscript has been approved by all the authors. All authors have read and agreed to the published version of the manuscript.

Funding

This research was funded by the Fundamental Research Funds for the Central Universities (grant number 202061027) and the National Natural Science Foundation of China (grant number 41572247).

Institutional Review Board Statement

Not applicable.

Informed Consent Statement

Not applicable.

Data Availability Statement

The data presented in this study are available on request from the corresponding author.

Conflicts of Interest

The authors declare no conflict of interest.

References

  1. Fazeres-Ferradosa, T.; Chambel, J.; Taveira-Pinto, F.; Rosa-Santos, P.; Taveira-Pinto, F.V.C.; Giannini, G.; Haerens, P. Scour protections for offshore foundations of marine energy harvesting technologies: A review. J. Mar. Sci. Eng. 2021, 9, 297. [Google Scholar] [CrossRef]
  2. Fazeres-Ferradosa, T.; Taveira-Pinto, F.; Romão, X.; Reis, M.; Neves, L.D. Reliability assessment of offshore dynamic scour protections using copulas. Wind Eng. 2019, 43, 506–538. [Google Scholar] [CrossRef]
  3. Sumer, B.M.; Fredsøe, J.; Christiansen, N. Scour around Vertical Pile in Waves. J. Waterw. Port Coast. Ocean Eng. 1992, 118, 15–31. [Google Scholar] [CrossRef]
  4. Chen, B.; Li, S. Experimental Study of Local Scour around a Vertical Cylinder under Wave-Only and Combined Wave-Current Conditions in a Large-Scale Flume. J. Hydraul. Eng. 2018, 144, 04018058. [Google Scholar] [CrossRef]
  5. Nielsen, A.W.; Liu, X.; Sumer, B.M.; Fredsøe, J. Flow and bed shear stresses in scour protections around a pile in a current. Coast. Eng. 2013, 72, 20–38. [Google Scholar] [CrossRef]
  6. Hu, R.G.; Liu, H.J.; Leng, H.; Yu, P.; Wang, X.H. Scour characteristics and equilibrium scour depth prediction around umbrella suction anchor foundation under random waves. J. Mar. Sci. Eng. 2021, 9, 886. [Google Scholar] [CrossRef]
  7. Li, H.; Ong, M.C.; Leira, B.J.; Myrhaug, D. Effects of Soil Profile Variation and Scour on Structural Response of an Offshore Monopile Wind Turbine. J. Offshore Mech. Arct. Eng. 2018, 140, 042001. [Google Scholar] [CrossRef]
  8. Li, H.; Liu, H.; Liu, S. Dynamic analysis of umbrella suction anchor foundation embedded in seabed for offshore wind turbines. Géoméch. Energy Environ. 2017, 10, 12–20. [Google Scholar] [CrossRef]
  9. Qi, W.; Gao, F. Equilibrium scour depth at offshore monopile foundation in combined waves and current. Sci. China Technol. Sci. 2014, 57, 1030–1039. [Google Scholar] [CrossRef] [Green Version]
  10. Yu, P.; Hu, R.; Yang, J.; Liu, H. Numerical investigation of local scour around USAF with different hydraulic conditions under currents and waves. Ocean Eng. 2020, 213, 107696. [Google Scholar] [CrossRef]
  11. Yang, Q.; Yu, P.; Liu, Y.; Liu, H.; Zhang, P.; Wang, Q. Scour characteristics of an offshore umbrella suction anchor foundation under the combined actions of waves and currents. Ocean Eng. 2020, 202, 106701. [Google Scholar] [CrossRef]
  12. Sumer, B.M.; Christiansen, N.; Fredsøe, J. The horseshoe vortex and vortex shedding around a vertical wall-mounted cylinder exposed to waves. J. Fluid Mech. 1997, 332, 41–70. [Google Scholar] [CrossRef]
  13. Rudolph, D.; Bos, K. Scour around a monopile under combined wave-current conditions and low KC-numbers. In Proceedings of the 6th International Conference on Scour and Erosion, Amsterdam, The Netherlands, 1–3 November 2006; pp. 582–588. [Google Scholar]
  14. Sumer, B.M.; Fredsøe, J. Scour around Pile in Combined Waves and Current. J. Hydraul. Eng. 2001, 127, 403–411. [Google Scholar] [CrossRef]
  15. Yu, T.; Zhang, Y.; Zhang, S.; Shi, Z.; Chen, X.; Xu, Y.; Tang, Y. Experimental study on scour around a composite bucket foundation due to waves and current. Ocean Eng. 2019, 189, 106302. [Google Scholar] [CrossRef]
  16. Schendel, A.; Welzel, M.; Schlurmann, T.; Hsu, T.-W. Scour around a monopile induced by directionally spread irregular waves in combination with oblique currents. Coast. Eng. 2020, 161, 103751. [Google Scholar] [CrossRef]
  17. Eadie, R.W.; Herbich, J.B. Scour about a single, cylindrical pile due to combined random waves and current. In Proceedings of the 20th Coastal Engineering Conference, Taipei, China, 9–14 November 1986. [Google Scholar]
  18. Qi, W.G.; Gao, F.P. Physical modeling of local scour development around a large-diameter monopile in combined waves and current. Coast. Eng. 2014, 83, 72–81. [Google Scholar] [CrossRef] [Green Version]
  19. Corvaro, S.; Marini, F.; Mancinelli, A.; Lorenzoni, C.; Brocchini, M. Hydro- and Morpho-dynamics Induced by a Vertical Slender Pile under Regular and Random Waves. J. Waterw. Port. Coastal Ocean Eng. 2018, 144, 04018018. [Google Scholar] [CrossRef]
  20. Afzal, M.S.; Bihs, H.; Kamath, A.; Arntsen, Ø.A. Three-dimensional numerical modeling of pier scour under current and waves using level-set method. J. Offshore Mech. Arct. Eng. 2015, 137, 032001. [Google Scholar] [CrossRef]
  21. Quezada, M.; Tamburrino, A.; Nino, Y. Numerical study of the hydrodynamics of waves and currents and their effects in pier scouring. Water 2019, 11, 2256. [Google Scholar] [CrossRef] [Green Version]
  22. Afzal, M.S.; Bihs, H.; Kumar, L. Computational fluid dynamics modeling of abutment scour under steady current using the level set method. Int. J. Sediment. Res. 2020, 35, 355–364. [Google Scholar] [CrossRef]
  23. Gautam, S.; Dutta, D.; Bihs, H.; Afzal, M.S. Three-dimensional Computational Fluid Dynamics modelling of scour around a single pile due to combined action of the waves and current using Level-Set method. Coast. Eng. 2021, 170, 104002. [Google Scholar] [CrossRef]
  24. Pu, J.H.; Huang, Y.; Shao, S.; Hussain, K. Three-Gorges Dam fine sediment pollutant transport: Turbulence SPH model simulation of multi-fluid flows. J. Appl. Fluid Mech. 2016, 9, 1–10. [Google Scholar] [CrossRef]
  25. Ma, L.L.; Wang, L.Z.; Guo, Z.; Jiang, H.Y.; Gao, Y.Y. Time development of scour around pile groups in tidal currents. Ocean Eng. 2018, 163, 400–418. [Google Scholar] [CrossRef]
  26. Schendel, A.; Hildebrandt, A.; Goseberg, N.; Schlurmann, T. Processes and evolution of scour around a monopile induced by tidal currents. Coast. Eng. 2018, 139, 65–84. [Google Scholar] [CrossRef]
  27. Yuan, C.G.; Melville, B.W.; Adams, K.N. Scour at wind turbine tripod foundation under steady flow. Ocean Eng. 2017, 141, 277–282. [Google Scholar] [CrossRef]
  28. Welzel, M.; Schendel, A.; Goseberg, N.; Hildebrandt, A.; Schlurmann, T. Influence of Structural Elements on the Spatial Sediment Displacement around a Jacket-Type Offshore Foundation. Water 2020, 12, 1651. [Google Scholar] [CrossRef]
  29. Welzel, M.; Schendel, A.; Hildebrandt, A.; Schlurmann, T. Scour development around a jacket structure in combined waves and current conditions compared to monopile foundations. Coast. Eng. 2019, 152, 103515. [Google Scholar] [CrossRef]
  30. Stahlmann, A. Experimental and Numerical Modeling of Scour at Foundation Structures for Offshore Wind Turbines. Ph.D. Thesis, Franzius-Institute for Hydraulic, Estuarine and Coastal Engineering, Leibniz Universität Hannover, Hannover, Germany, 2013. [Google Scholar]
  31. DNV. Design of Offshore Wind Turbine Structures. Offshore Standard DNV-OSJ101; Det Norske Veritas AS: Berum, Norway, 2013. [Google Scholar]
  32. Yamini, O.A.; Mousavi, S.H.; Kavianpour, M.R.; Movahedi, A. Numerical modeling of sediment scouring phenomenon around the offshore wind turbine pile in marine environment. Environ. Earth Sci. 2018, 77, 776. [Google Scholar] [CrossRef]
  33. Fazeres-Ferradosa, T.; Rosa-Santos, P.; Taveira-Pinto, F.; Vanem, E.; Carvalho, H.; Correia, J.A.F.D.O. Advanced research on offshore structures and foundation design: Part 1. In Proceedings of the Institution of Civil Engineers-Maritime Engineering; Thomas Telford Ltd.: London, UK, 2019. [Google Scholar]
  34. Fazeres-Ferradosa, T.; Rosa-Santos, P.; Taveira-Pinto, F.; Pavlou, D.; Gao, F.P.; Carvalho, H.; Oliveira-Pinto, S. Advanced research on offshore structures and foundation design: Part 2. In Proceedings of the Institution of Civil Engineers-Maritime Engineering; Thomas Telford Ltd.: London, UK, 2020. [Google Scholar]
  35. Whitehouse, R. Scour at Marine Structures: A Manual for Practical Applications; Thomas Telford Ltd.: London, UK, 1998. [Google Scholar]
  36. Frostick, L.E.; McLelland, S.J.; Mercer, T.G. Users Guide to Physical Modelling and Experimentation: Experience of the HYDRALAB Network; CRC Press: Los Angeles, CA, USA, 2019. [Google Scholar]
  37. Sutherland, J.; Whitehouse, R.J.S. Scale Effects in the Physical Modelling of Seabed Scour; Technical Report; HR Wallingford: Oxford, UK, 1998. [Google Scholar]
  38. Soulsby, R. Dynamics of Marine Sands; Thomas Telford Ltd.: London, UK, 1998. [Google Scholar]
  39. Melville, B.W.; Chiew, Y.M. Time scale for local scour in bridge piers. J. Hydraul. Eng. 1999, 125, 59–65. [Google Scholar] [CrossRef]
  40. Petersen, T.U.; Sumer, B.M.; Fredsøe, J. Time scale of scour around a pile in combined waves and current. In Proceedings of the 6th International Conference on Scour and Erosion, Paris, France, 27–31 August 2012. [Google Scholar]
  41. Sumer, B.M.; Fredsøe, J. The Mechanics of Scour in the Marine Environment; World Scientific: Singapore, 2002. [Google Scholar]
  42. Fazeres-Ferradosa, T.; Welzel, M.; Schendel, A.; Baelus, L.; Santos, P.R.; Pinto, F.T. Extended characterization of damage in rubble mound scour protections. Coast. Eng. 2020, 158, 103671. [Google Scholar] [CrossRef]
  43. Fazeres-Ferradosa, T.; Taveira-Pinto, F.; Reis, M.T.; das Neves, L. Physical modelling of dynamic scour protections: Analysis of the Damage Number. In Proceedings of the Institution of Civil Engineers-Maritime Engineering; Thomas Telford Ltd.: London, UK, 2018. [Google Scholar]
  44. De Sonneville, B.; Van Velzen, G.; Wigaard, J. Design and optimization of scour protection for offshore wind platform Dolwin Beta. In Proceedings of the International Conference on Offshore Mechanics and Arctic Engineering; American Society of Mechanical Engineers: San Francisco, CA, USA, 2014. [Google Scholar]
  45. Tavouktsoglou, N.S.; Harris, J.M.; Simons, R.R.; Whitehouse, R.J.S. Equilibrium Scour-Depth Prediction around Cylindrical Structures. J. Waterw. Port. Coastal Ocean Eng. 2017, 143, 04017017. [Google Scholar] [CrossRef] [Green Version]
Figure 1. Schematic of the experiment system.
Jmse 09 01373 g001
Figure 2. Schematic of tripod with different installation angles.
Jmse 09 01373 g002
Figure 3. Particle size grading curves of sandy silt.
Jmse 09 01373 g003
Figure 4. Scour evolution curves for: (a) Case R4; (b) Case R15.
Jmse 09 01373 g004
Figure 5. Scour topography around tripod under different installation angles.
Jmse 09 01373 g005
Figure 6. The relationships between T* and Ucw and fitting results.
Jmse 09 01373 g006
Figure 7. The relationships of Seq and Ucw under different ranges of KC for: (a) α = 0°; (b) α = 90°; (c) α = 180°.
Jmse 09 01373 g007
Figure 8. Comparison of experimental data and predicted values by Equation (11).
Jmse 09 01373 g008
Figure 9. The relationships between Seq/D and Fr for different installation angles and fitting results.
Jmse 09 01373 g009
Figure 10. Comparison of experimental data and predicted values by Equation (14).
Jmse 09 01373 g010
Figure 11. The relationships between Seq/D and Eu for different installation angles and fitting results.
Jmse 09 01373 g011
Figure 12. Comparison of experimental data and predicted values by Equation (15).
Jmse 09 01373 g012
Table 1. Test plans and parameters for tripod.
Test NumberUc (m/s)Hw (m)T (s)KCUcwFrSmax/D
α = 0°α = 90°α = 180°
R10.10 0.081.5 8.06 0.35 0.38 0.73 0.820.71
R20.12 0.081.5 8.06 0.39 0.41 0.81 0.910.78
R30.15 0.081.5 8.06 0.44 0.46 0.85 0.960.81
R40.18 0.081.5 8.06 0.49 0.51 1.04 1.120.99
R50.21 0.081.5 8.06 0.53 0.56 1.12 1.231.03
R60.24 0.081.5 8.06 0.56 0.61 1.22 1.291.16
R70.29 0.081.5 8.06 0.61 0.70 1.25 1.371.20
R80.35 0.081.5 8.06 0.65 0.80 1.36 1.431.28
R90.40 0.081.5 8.06 0.68 0.89 1.39 1.471.31
R100.00 0.081.5 8.06 0.00 0.20 0.12 0.190.09
R110.24 ------1.00 0.41 1.25 1.421.21
R120.10 0.061.5 6.04 0.41 0.32 0.75 0.860.71
R130.12 0.061.5 6.04 0.46 0.36 0.82 0.930.76
R140.15 0.061.5 6.04 0.52 0.41 0.95 1.030.89
R150.18 0.061.5 6.04 0.56 0.46 1.02 1.150.96
R160.21 0.061.5 6.04 0.60 0.51 1.12 1.231.05
R170.24 0.061.5 6.04 0.63 0.56 1.21 1.321.13
R180.29 0.061.5 6.04 0.67 0.65 1.25 1.351.19
R190.35 0.061.5 6.04 0.71 0.75 1.35 1.411.26
R200.40 0.061.5 6.04 0.74 0.84 1.38 1.451.30
R210.00 0.061.5 6.04 0.00 0.15 0.03 0.080.05
R220.21 ------1.00 0.36 1.14 1.211.16
R230.10 0.072.0 10.35 0.36 0.37 0.86 0.950.81
R240.12 0.072.0 10.35 0.40 0.40 0.98 1.060.91
R250.15 0.072.0 10.35 0.45 0.45 1.15 1.231.08
R260.18 0.072.0 10.35 0.50 0.50 1.22 1.341.17
R270.21 0.072.0 10.35 0.54 0.56 1.31 1.411.28
R280.24 0.072.0 10.35 0.57 0.61 1.35 1.431.29
R290.29 0.072.0 10.35 0.62 0.69 1.41 1.521.35
R300.35 0.072.0 10.35 0.66 0.79 1.44 1.581.36
R310.40 0.072.0 10.35 0.69 0.88 1.48 1.611.41
R320.00 0.072.0 10.35 0.00 0.20 0.21 0.300.19
R330.29 ------1.00 0.50 1.26 1.451.19
Publisher’s Note: MDPI stays neutral with regard to jurisdictional claims in published maps and institutional affiliations.

