Article

Emergency Situation Safety Evaluation of Marine Ship Collision Accident Based on Extension Cloud Model

Navigation College, Dalian Maritime University, Dalian 116026, China
*
Author to whom correspondence should be addressed.
J. Mar. Sci. Eng. 2021, 9(12), 1370; https://doi.org/10.3390/jmse9121370
Submission received: 10 October 2021 / Revised: 25 November 2021 / Accepted: 26 November 2021 / Published: 2 December 2021
(This article belongs to the Special Issue Advances in Maritime Safety)

Abstract

:
After collisions at sea, situation evaluation and analysis are very important to follow-up rescue operations. At present, there are few ways give weights in the current situational safety evaluation methods after collisions of marine ships. Most safety evaluation models ignore the blurred boundaries of evaluation grades. To solve these issues, this paper identifies the safety evaluation indicator system and evaluation standards, and establishes an after-collisions safety evaluation model of maritime ships based on the extension cloud theory. This model combines the extension cloud model, the analytic hierarchy process, the entropy weight method, and game theory. Using this model, the situation safety of two collisions was evaluated. The evaluation results reflect the effectiveness of the model. In order to ensure the safety of the lives and property of marine personnel, suggestions have been made to strengthen crew training, improve ship’s self-rescue ability at sea, and establish a complete marine emergency response rescue system.

1. Introduction

With the continuous increase in ship size, ship design speed, and navigation environment complexity, the risk of maritime traffic safety continues to increase. Marine transport is a relatively safe mode of transport. Despite the safety standards and advanced technology constantly improving, maritime transport accidents continue to occur [1]. According to the literature, the maritime industry loses approximately $541 million due to human error each year [2]. According to EMSA data [3], there were 20,616 marine accidents from 2011 to 2017. As a result of these accidents, a total of 203 ships sank or became unserviceable, 6812 seafarers were injured, and 683 crew members were killed. In all these accidents, human factors dominate, and accident losses caused by human factors account for 75–96% of marine accidents [4]. Maritime accidents are also closely related to the development of the region. Take China as an example. According to statistics, in 2020, a total of 138 maritime traffic accidents (grade accidents) occurred in China, an increase of 0.7% over the previous year. The number of deaths and missing persons caused by accident was 196, an increase of 26.5% over the previous year. A total of 76 ships sank in accidents, an increase of 65.2% over the last year [5]. Marine accidents endanger not only the safety of persons and property, but also the local marine environment and marine traffic.
In all of these water traffic accidents, ship collision accidents account for a large proportion [4,5,6]. At present, many scholars have conducted research and analysis on the causes of collision accidents. According to these studies, the leading causes of collision accidents can be summarized as follows: negligence of lookout, ineffective use of bridge navigation equipment, violation of International Regulations for Preventing Collisions at Sea, poor visibility, heavy traffic, darkness, and communication and coordination errors between ships and bridge team members [7].
Ship collision accidents usually cause significant damages to human life, goods, and ships. For the ship itself, a collision accident may cause serious hull damage. The damage degree of a ship collision is affected by many factors, such as the collided ship’s position, the colliding ship’s speed, and the collision angle. After the collision, the ship may be in three states: capsizing rapidly, sinking slowly, or remaining afloat due to its stability and buoyancy changes. As for oil tankers and hazardous chemicals ships, after a collision accident, a large-scale leak of oil or other hazardous chemicals may cause serious pollution to the environment and bring substantial economic consequences [8]. In addition, the strength of the struck ship’s hull may be reduced due to damage. Hull girder collapses may occur when the hull’s maximum residual load-carrying capacity is insufficient to sustain the corresponding hull girder loads applied. In this case, the struck ships will bear all the losses [9,10]. It is not just that the hull may be damaged when an accident occurs. If the struck ship still stays afloat after the collision, it needs to be towed to the salvage harbor to be repaired as fast as possible. There is a possibility that the initial damage caused by collision or grounding will further propagate during ship salvage operations due to the fluctuating wave loads [11]. The aggravation of its damage is often affected by ship age and corrosion. The reason for this is that corrosion wastage has a more significant influence on structural safety compared to the load effects of the sudden collision damage [11,12]. In summary, ship sinking may occur after a ship collision. This will pose a significant threat to the security of marine navigation of other ships crossing the area. Accurately evaluating the collision emergency situation and predicting the possible future evolution of the situation is of great guiding significance for formulating appropriate emergency measures.
The purpose of research on marine accidents is to avoid marine accidents. The research on maritime collision accidents is often carried out from three aspects: prevention and avoidance before the accident, emergency plan formulation and rescue after the accident, and accident analysis after the accident. With the development of electronic technology, many scholars have studied collision avoidance algorithms from the perspective of assisted driving to assist drivers in avoiding ship collision accidents [13]. Some scholars also assess the potential risks of navigation to prevent future accidents. In [4], the effects of human factor-related errors associated with the use of the bridge’s electronic navigational devices on grounding and collision-contact accidents were investigated. In [6], the authors propose using the Human Factor Analysis and Classification System (HFACS) and Bayesian network models to analyze maritime accidents, and an accident network is established to allow users to assess the accident risk of variable conditions. The article proposes suggestions to reduce these factors to further prevent the occurrence of maritime accidents. In [1], the Human Factor Analysis and Classification System for Passenger Vessel collisions (HFACS-PV) structure is used for accident analysis of contact, grounding, and collision accidents to more clearly and consistently identify the human and organizational factors in marine accidents. Another study [14] explores the influencing factors of accident consequences from the accident report through statistical analysis. Further, [15] uses the Bayesian network model to analyze the internal laws of ship collision accidents’ occurrence, development, and final results. In [16], a situation model of ship collision accidents is established by a cross-layer adaptive particle swarm optimization algorithm, and the complex relationship among influencing factors of ship collision accidents are studied. Previous studies have well analyzed the cause of accidents and the possible consequences after an accident, which positively impacts on the prevention of accidents. However, from the perspective of emergency assistance, a method is needed to assess the current situation risk when a collision occurs to assist rescuers in better formulating rescue plans.
The purpose of this paper is to establish an evaluation model for emergency situation safety after collisions of ships by comprehensively considering the situation influencing factors of the emergency scene. Due to the fuzziness and uncertainty of the situation level boundary of the emergency scene after the collision of ships, it is difficult to reflect the fuzziness and uncertainty in the evaluation process by using the traditional safety evaluation method. The extension cloud model is a comprehensive evaluation method that combines qualitative and quantitative description by introducing the cloud model into matter-element theory. At the same time, the cloud model can consider the fuzziness and uncertainty of the evaluation indicators. In the aspect of extension cloud application research, Wang Zhihe et al. [17] proposed a regional ecological security early warning model based on the extension cloud model, considering the randomness, fuzziness, and dynamics of the boundary information ecological security level. The model was used to quantitatively assess the ecological security of the Zhangye section of Qilian Mountain Glacier and the water conservation ecological function area from 2005 to 2015. The results showed that the extension cloud model can consider the fuzziness and uncertainty of the evaluation indicators, and can well integrate the evaluation results of multiple evaluation indicators. Wang Feng et al. [18] introduced the extension cloud model into the network security situation evaluation of the automated command system (C4ISR), and the example analysis results showed that this method could be applied to the network security situation evaluation considering the randomness and fuzziness of the value of qualitative evaluation indicators. Lu Feng [19] et al. constructed a mooring safety evaluation model based on normal cloud extension theory to solve the problem that traditional mooring safety evaluation methods did not consider the uncertainty and fuzziness of evaluation level boundaries. Li Ruqi et al. [20] established a standard cloud matter-element model for the comprehensive power quality evaluation. The extension cloud model has been widely used in safety evaluation. Given that the extension cloud model has the characteristics of cloud model uncertain reasoning and the advantages of the matter-element extension model with qualitative and quantitative analysis, this paper introduces the extension cloud model into the situation evaluation after the collision of ships at sea.
The main contributions can be summarized as follows:
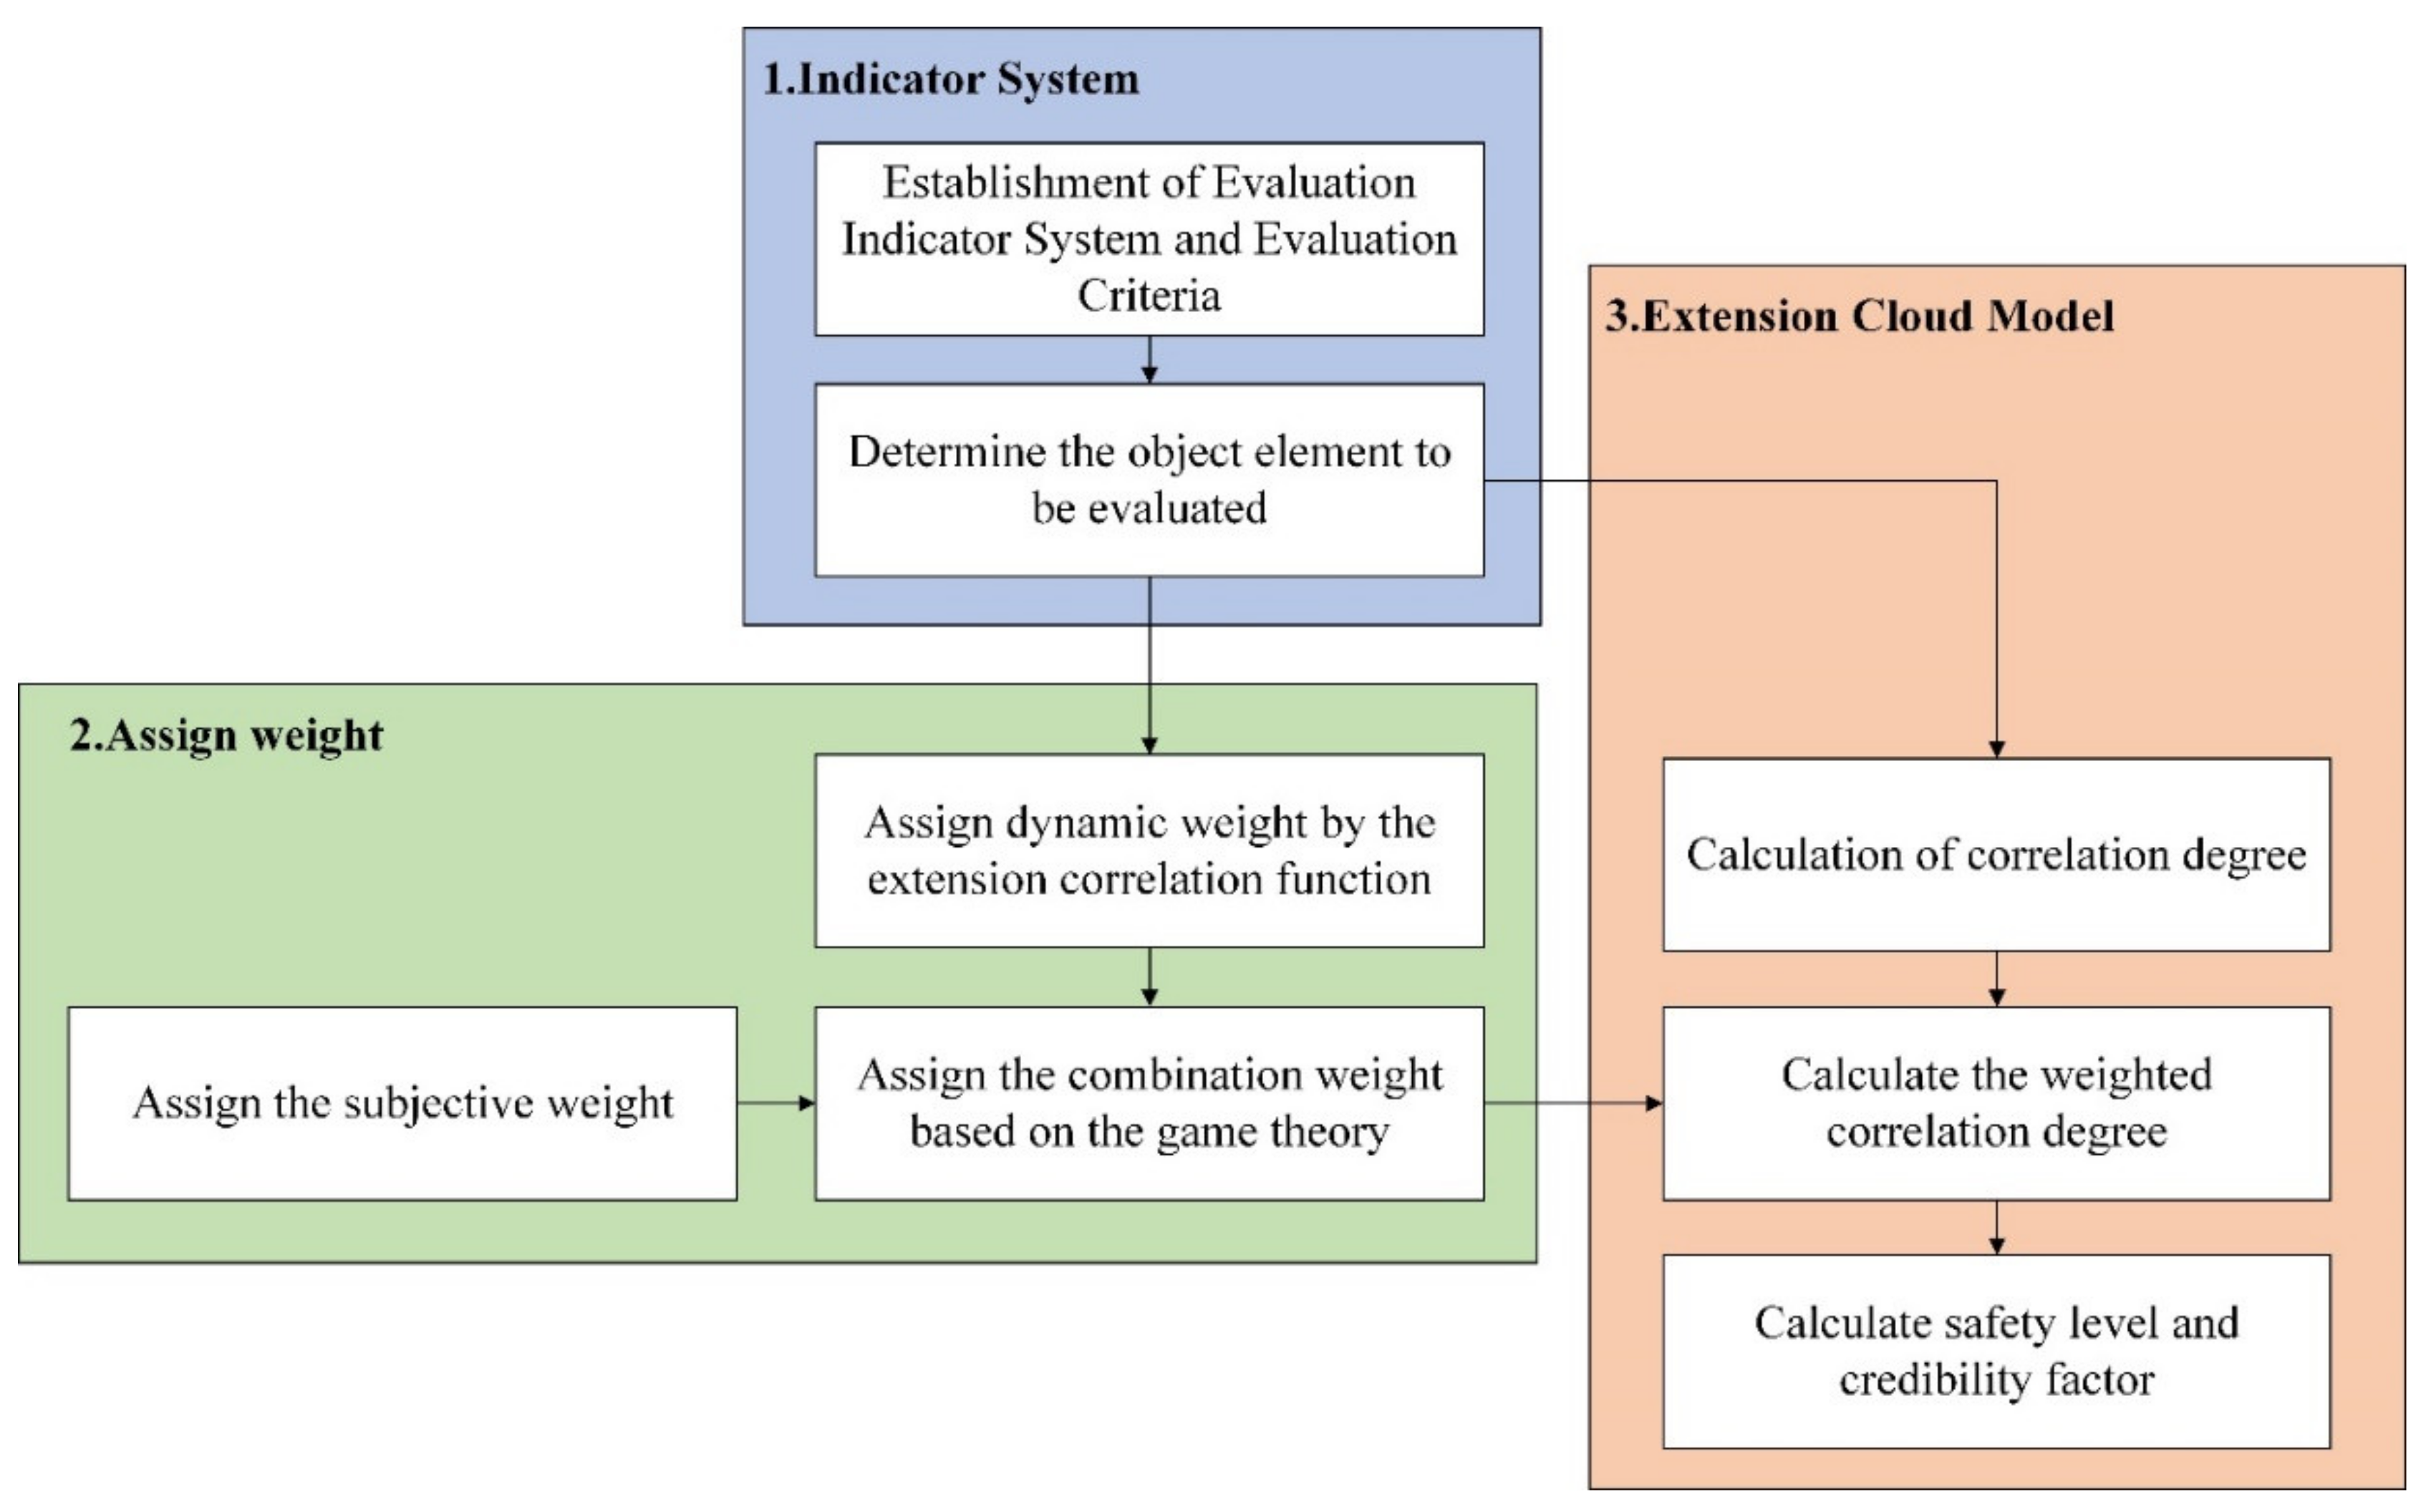
In this paper, the extension cloud model, which has the advantages of the cloud model and matter-element extension model, innovatively applies to the assessment of the emergency situation safety level after marine ship collision accidents. In this process, this paper constructs an evaluation indicator system for the emergency situation safety rating of marine collision accidents based on the ship–environment–rescue logic model, thereby ensuring the comprehensiveness of the evaluation results. According to this evaluation system, this paper uses the extension cloud model to evaluate the risk level. The entropy and super entropy in the extension cloud model can express the ambiguity and randomness in the evaluation process. This paper uses the game theory method to combine and optimize the subjective weights obtained by the analytic hierarchy process, the dynamic weights obtained from the extension correlation function, and obtain the comprehensive weights of each indicator in the emergency situation security level assessment. The model in this paper is verified through two real accident cases published by the China Maritime Safety Administration, and the results prove that the method in this paper can accurately and reasonably assess the safety posture of a ship after a collision. The model framework established in this paper is shown in Figure 1. All parts of the model are described in detail in subsequent sections of this article.

2. Methodology

2.1. Cloud Model

The cloud model expresses the randomness and ambiguity in objective things or human knowledge through a unified mathematical expression, reflecting the universal law of objective phenomena with randomness and ambiguity [21,22]. The cloud model mainly includes the normal cloud model, triangular cloud model, and symmetric cloud model. The normal cloud model is the most important and widely used. The general applicability of the normal cloud model has been proven [23,24,25]. The normal cloud model embodies its numerical characteristics by the expected value   E x , entropy   E n , and hyper-entropy   H e . The expected value   E x is the centre of the cloud of the cloud diagram, and it is also the point which best represents the qualitative concept of things. The situational safety after collisions at sea is based on this value. The entropy   E n   describes the uncertainty of things, which is determined by the randomness and ambiguity of things. It can not only reflect the randomness of the situational safety evaluation indicator value, it can also reflect the fuzziness of the data of the object to be evaluated in the situational safety level; the hyper-entropy H e   is the uncertainty measure of the entropy E n , it represents the degree of correlation between randomness and ambiguity of various factors that affect situational security. To weaken the randomness and fuzziness in the process of the situation security evaluation, the expected value   E x , entropy E n , and hyper-entropy   H e are used to construct the situational security level boundary and the cloud correlation function.

2.2. Extension Evaluation Method

The extension evaluation method is an evaluation method developed by relying on the extension theory found by Professor Cai Wen. It introduces the matter element, namely the triplet R = (thing, feature, value) = N , c , v , to describe the basic elements of things, where N represents the thing, c represents the name of the feature of the thing, and v represents the measurement value of the feature c of the thing N [26]. For example, if the matter element R expresses the information related to the collision situation to be evaluated, the matter element to be evaluated is expressed by Equation (1):
R = N , c , v = N c 1 v 1 c 2 v 2 c n v n
where R is the matter element to be evaluated, N is the emergency situation after collisions at sea to be evaluated, and   v 1   is the data of the i-th indicator   c i   related to the safety of the collision situation to be evaluated.
The Classic Domain is the standard interval classification of each level for the indicators. The Classic Domain of the emergency situation after collisions at sea is expressed in Equation (2):
R 0 j = M 0 j , c , w j = M 0 j c 1 v 0 j 1 c 2 v 0 j 2 c n v 0 j n = M 0 j c 1 a 0 j 1 , b 0 j 1 c 2 a 0 j 2 , b 0 j 2 c n a 0 j 15 , b 0 j 15
In Equation (2), R 0 j represents the n-dimensional emergency situation matter element model of the j-th level. M 0 j represents the emergency situation state level, j = 1, 2, 3, 4, 5; c i represents the evaluation indicator; v 0 j n = a 0 j i , b 0 j i represents the value range of the indicator c i .

2.3. Extension Cloud Model

The extension cloud model is a combination of extension evaluation and the cloud model. Replace v in R = (thing, feature, value) = N , c , v in extension evaluation with the normal cloud model ( E x , E n , H e ). Then, the fuzziness of the situational security level boundary is represented by E n , and H e represents the randomness of the situational security evaluation indicators data. The improved extension matter-element model is expressed as Equation (3):
R = N C 1 E x 1 , E n 1 , H e 1 C 2 E x 2 , E n 2 , H e 2 C n E x n , E n n , H e n

2.4. Establishment of Evaluation Indicator System and Evaluation Criteria for the Emergency Situation after Collisions at Sea

After the ship collision accident occurs, the emergency situation at the emergency scene is complicated, therefore the situation of the emergency scene is the result of multiple factors. Analyzing the rules and influencing factors of the emergency situation in ship collision accidents, then extracting reasonable situation elements is the premise to construct the indicator system for situation analysis after collisions at sea.
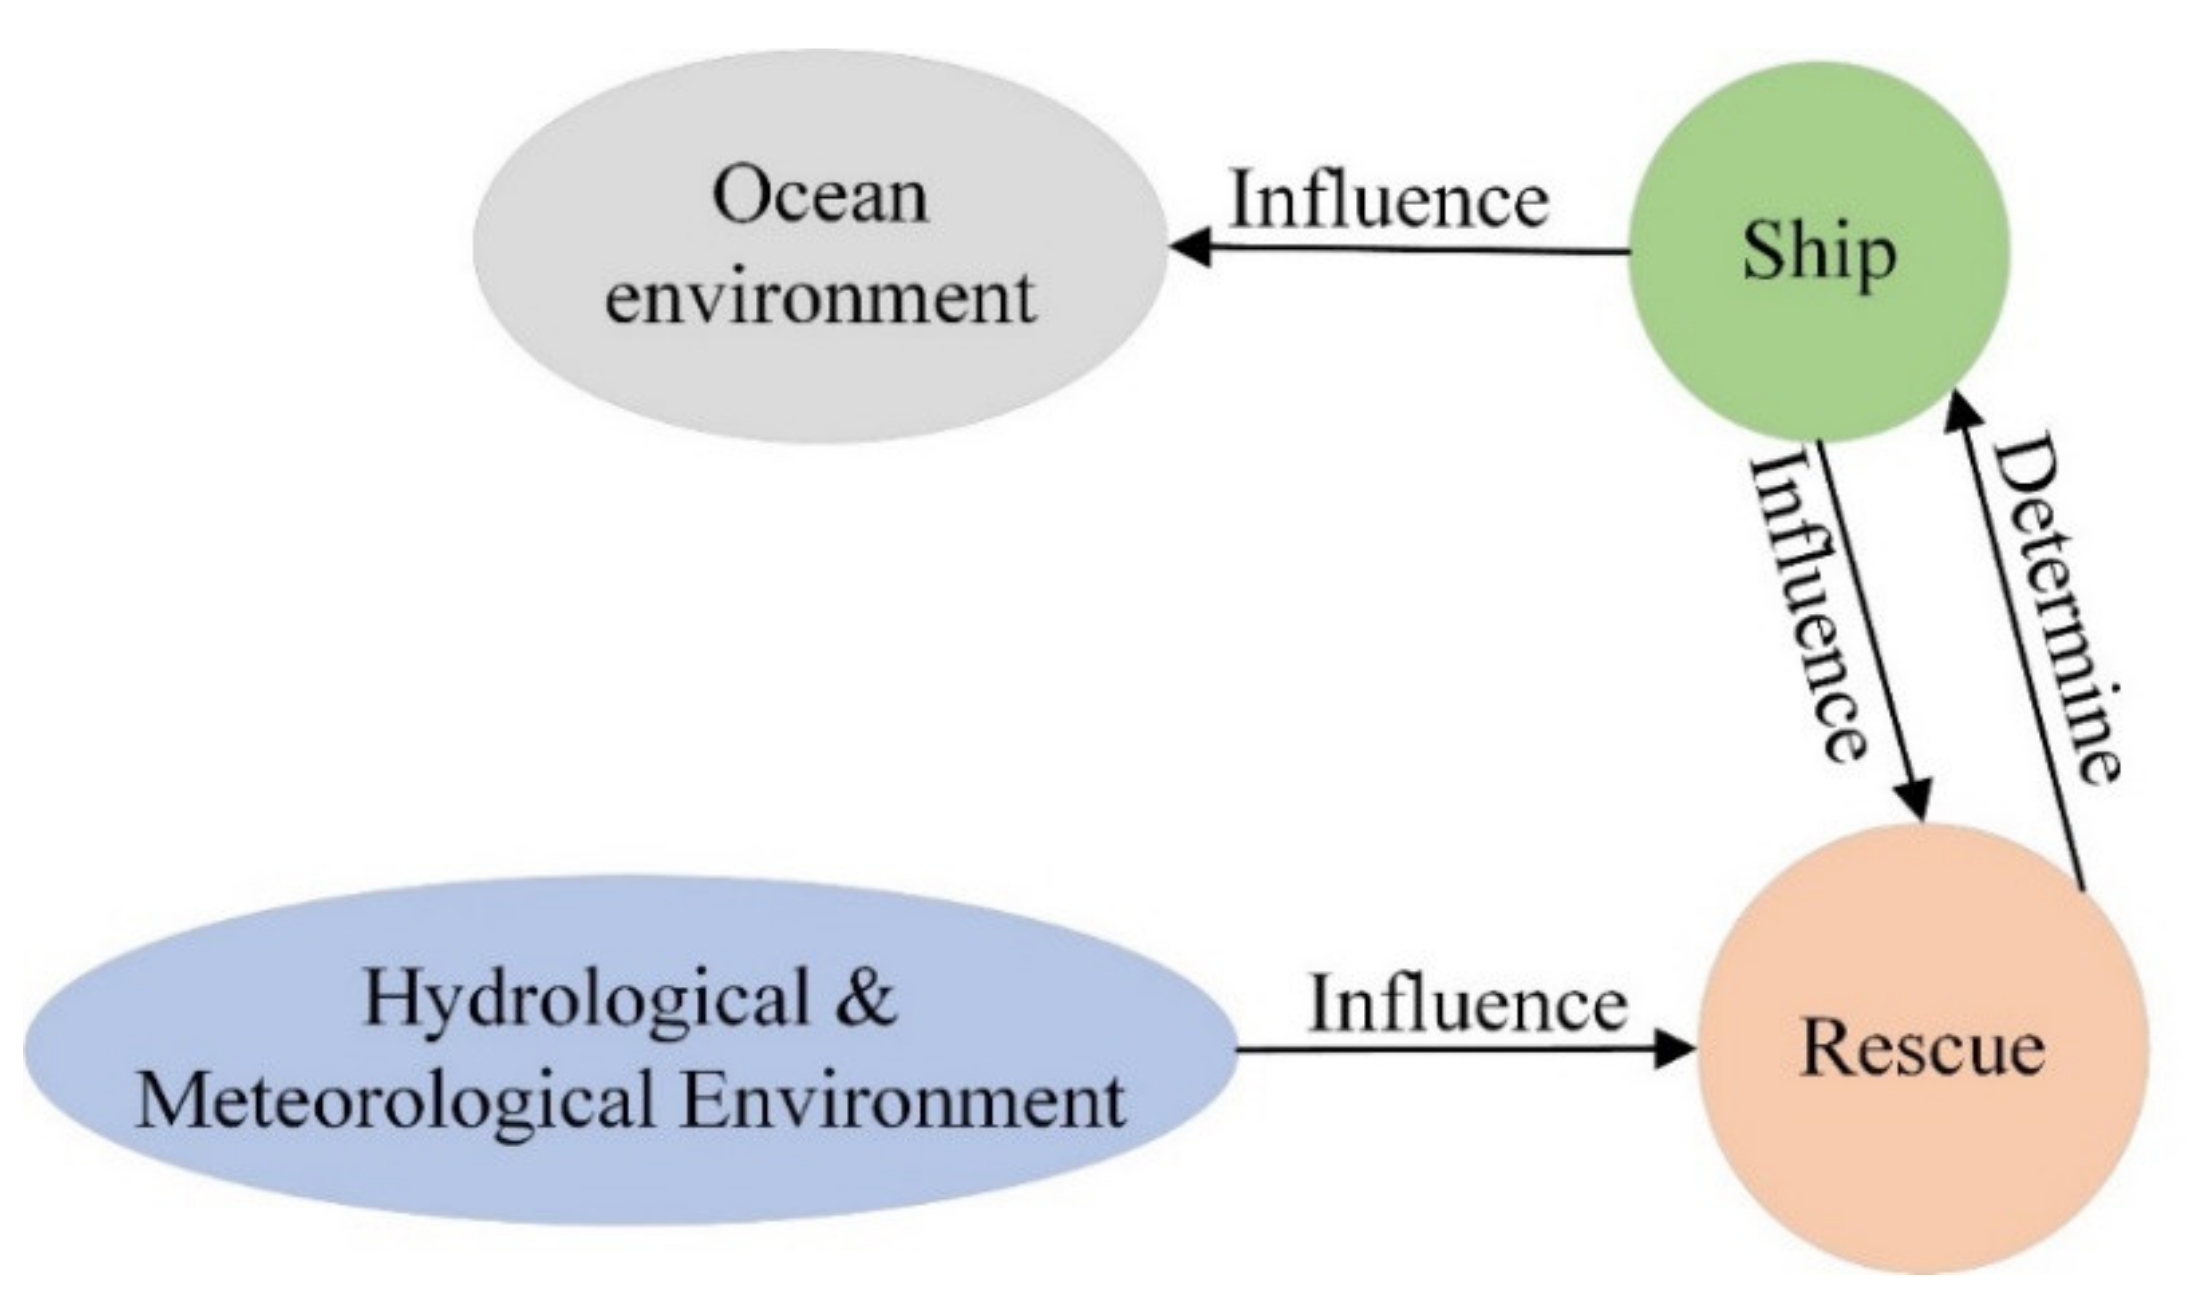
The construction of the indicator system is not composed of several indicators randomly piled up, but needs to follow a logical framework to which a specific indicator is attached [27]. This article constructs the safety situation assessment indicator system after a ship collision accident from the three aspects of ship, environment, and rescue. The ship–environmental–rescue logic model is shown in Figure 2.
In the actual emergency rescue process at sea, the hydrometeorological environment and ship damage status affect the difficulty of rescue, and the difficulty of rescue determines whether the wrecked ship is rescued. The damage state of the ship will affect the marine ecological environment and navigation environment on the scene, resulting in increased loss and difficulty in rescue. Based on the above logic, this paper constructs a situational safety evaluation indicator system after a ship collision accident.
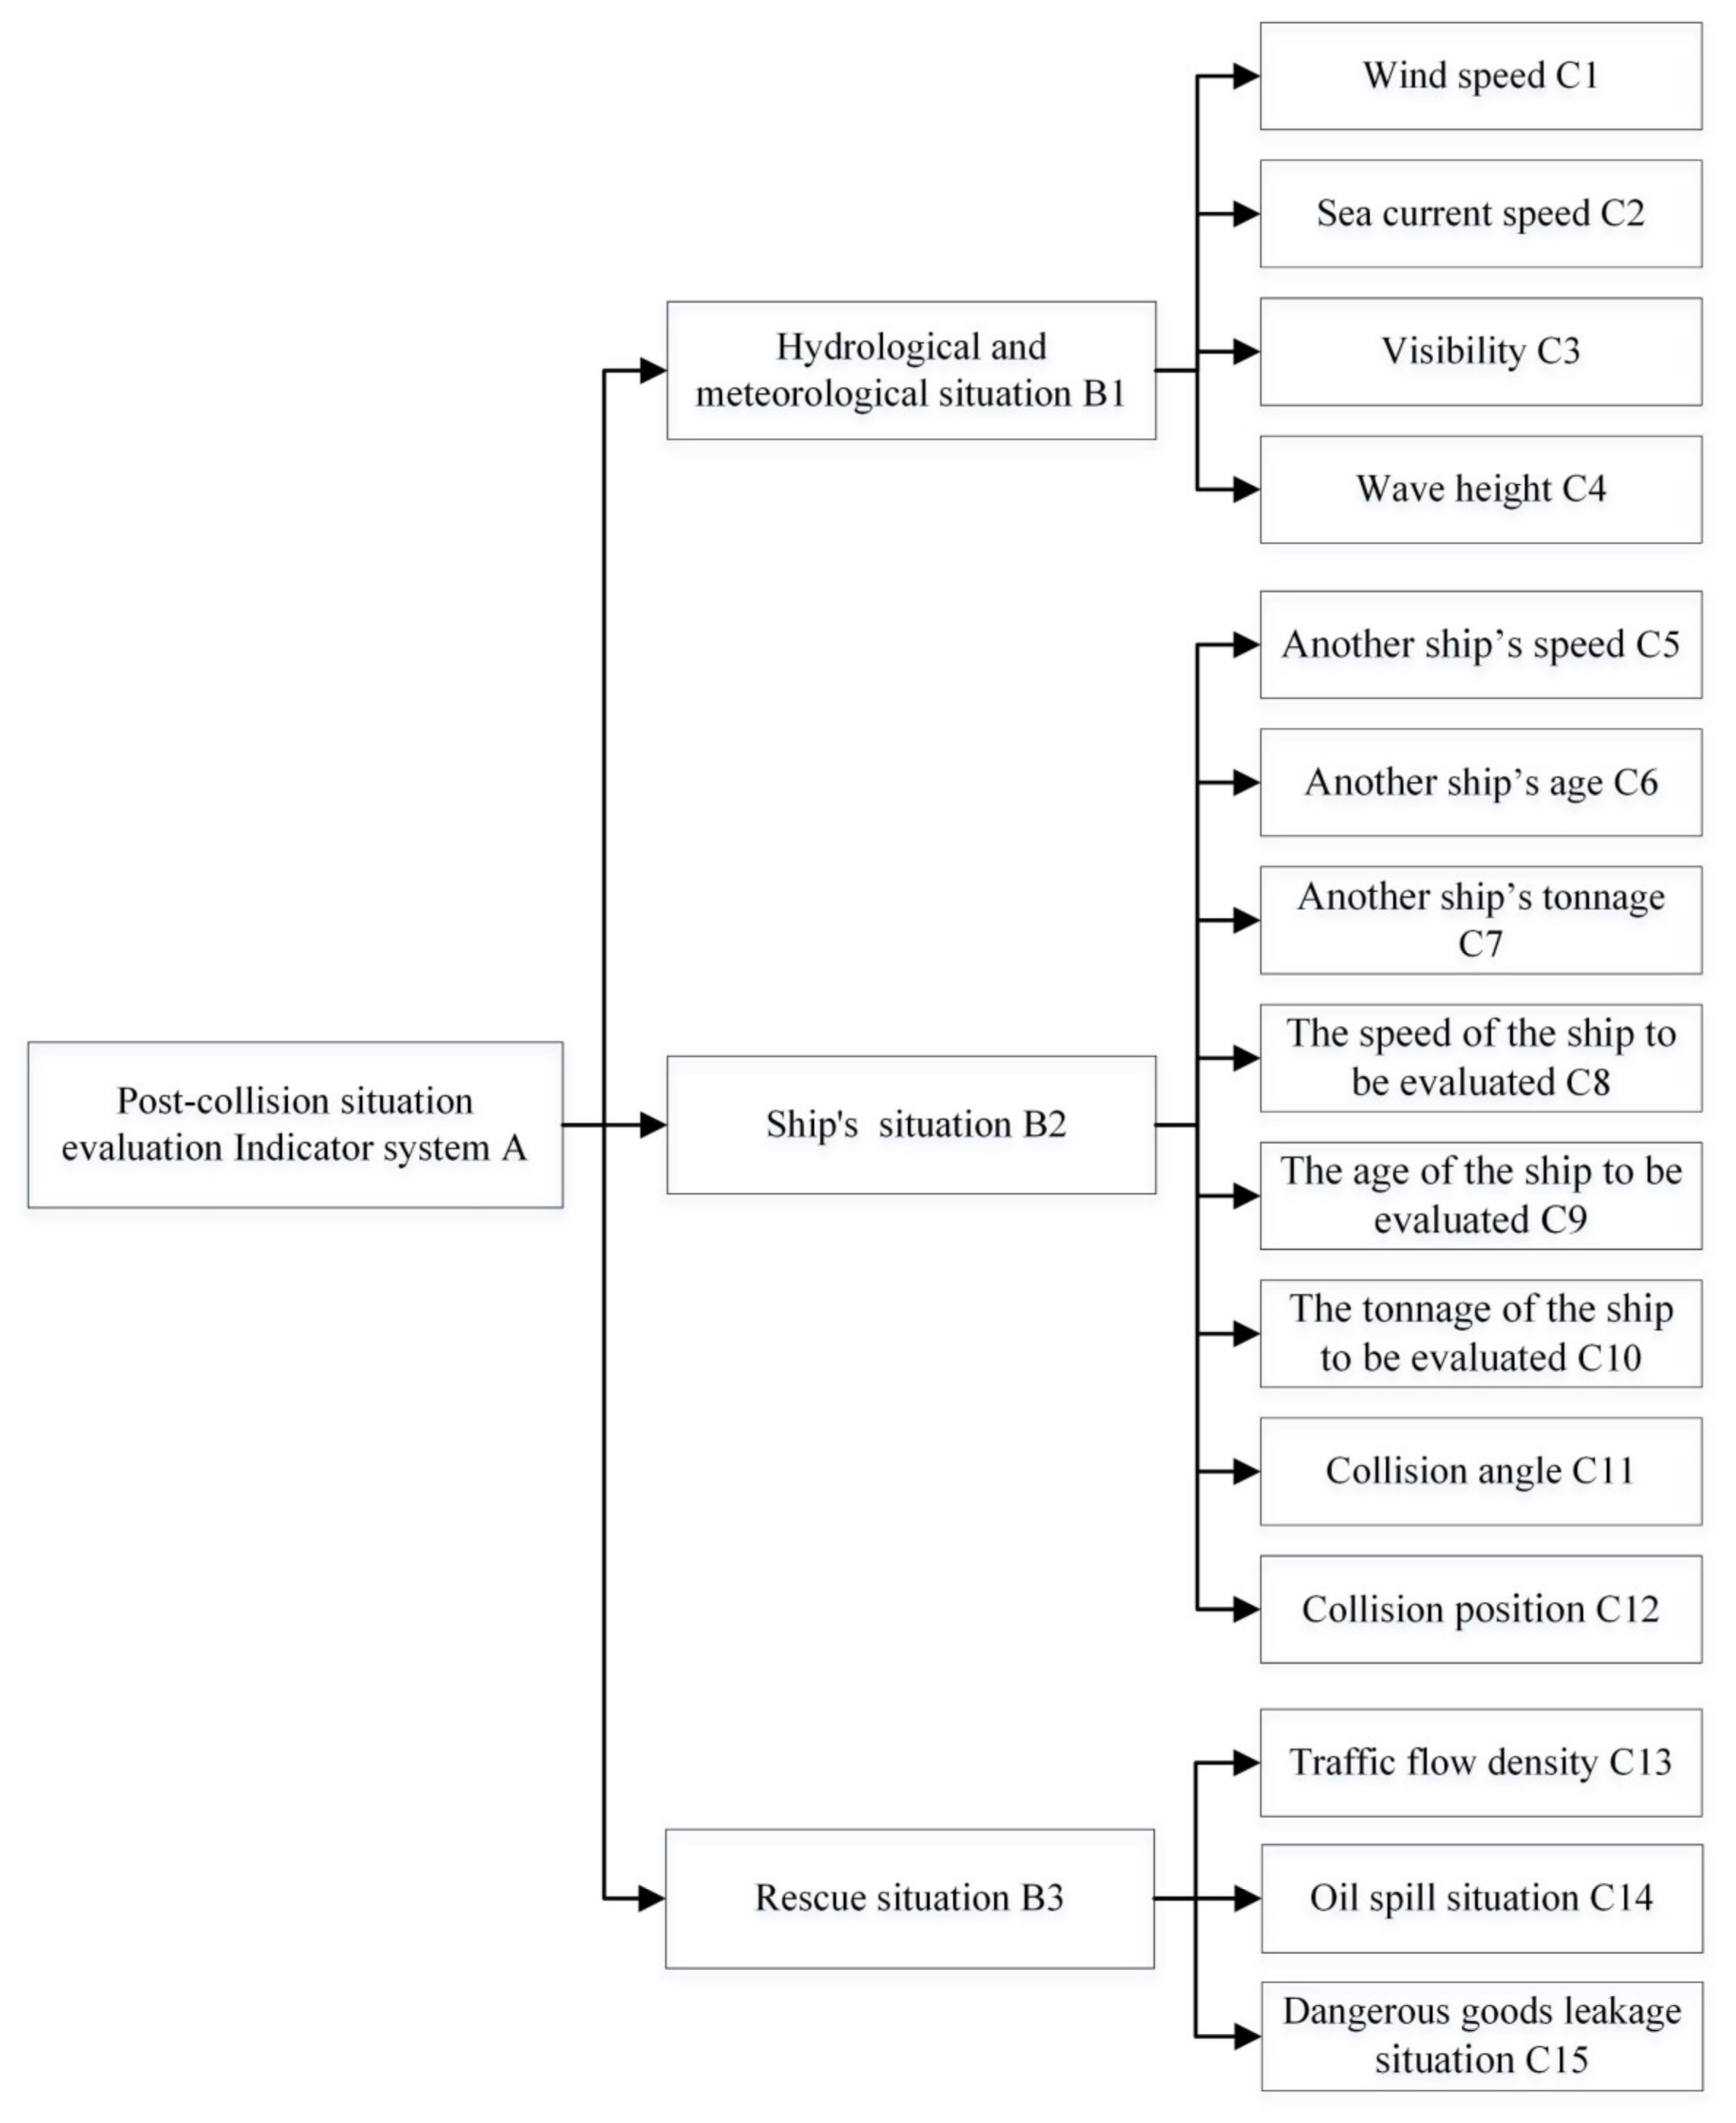
The evaluation indicator system of the situation safety after collisions at sea established in this paper is shown in Figure 3. This article uses the idea of stratification of indicators in the Analytic Hierarchy Process (AHP) and divides the indicators into three levels [28]. The top level is the evaluation indicator describing the post-collision situation safety of the ship, which is an abstract evaluation objective. The second level includes the ships situation, rescue situations, and emergency site hydrometeorological conditions. The third level provides 15 evaluation indicators, including wind speed, sea current speed, visibility, wave height, another ship’s speed, another ship’s tonnage, another ship’s age, the speed of the ship to be evaluated, the tonnage of the ship to be evaluated, the age of the ship to be evaluated, collision angle, collision position, traffic flow density, oil spill situation, and dangerous goods leakage situation.
The selection basis of each indicator in the third level is as follows:
  • Wind speed and sea current speed. Wind and sea current have a significant impact on the safety of ships at sea. If the wind and sea current are too strong, the ship’s maneuverability will deteriorate, and it is more likely to lose stability and capsize in complex seas [29]. In this regard, the Maritime Safety Administration of China stipulates that ro-ro passenger ships with winds above force 8 Beauforts must not be allowed to sail. The high wind speed and sea current speed not only threaten the safety of the crew of the colliding ship, but also affect the arrival of emergency rescue forces. For example, the wind force for rescue helicopters to take off is limited to 8 Beauforts;
  • Visibility. Low visibility will make it difficult for the ship to approach and identify the rescue target. Thus, low visibility affects the arrival time of rescue assistance and hinders the development of on-site rescue work;
  • Wave height. The hull may be severely deformed by the impact of sea waves, and the rescue ship will experience fierce turbulence and sway under the action of strong waves. The deck is prone to waves, and if the seawater cannot be discharged in time, water will accumulate on the deck, causing slippery decks, complex operations, and even casualties and equipment damage [29];
  • Ship’s speed. Under certain mass conditions, the higher the ship’s speed during the collision, the more serious the loss of both ships after the collision;
  • Ship’s age. As the age of the ship increases, the hull of the ship has a high degree of corrosion, and the structure of the ship is weaker than that of a newer ship. In addition, the age of the ship’s equipment is also relevant. After an accident, the ship’s self-rescue ability is poor. Therefore, the older the ship, the greater the possibility of loss after a collision [30];
  • Tonnage. The inertia of ships of different tonnages is different, and the tonnage ratio of collided ships significantly impacts the loss after the collision [30]. There is no indicator of ship mass in the accident report data that we have collected. No ship mass data were found in the ship accident database we collected. In actual collision accidents, mass information about the accident ships cannot be obtained in time, however, gross tonnage can be obtained immediately, therefore this article uses gross tonnage as an approximate substitute for mass;
  • Collision position. Generally, collision in the middle of the collision ship is more severe than head and stern collision of the collision ship [14];
  • Impact angle. The impact angle refers to the acute angle of 0–90° between the bow and stern lines of the impacted ship. Generally, the impact angle is large, and the ship is seriously damaged [31];
  • Traffic flow density. If the traffic flow is high, the maneuvering room is small and the traffic situation is complicated, which is not conducive to the development of rescue work;
  • Oil spill and dangerous goods leakage. If oil spills or dangerous goods leakage occur at the emergency site, this will increase the difficulty of emergency response and may endanger the lives of rescuers.
In addition, many vital indicators have a significant impact on the emergency situation after a ship collision. According to research [32,33,34], the local restrictions (narrow channel structure, sharp turn, etc.) are an important factor that needs to be considered when formulating a rescue plan. Through the analysis of foretime accident cases, it is difficult to obtain the above indicators, such as narrow channel structure, sharp turn, and distance to coastal structures, in time when the accident occurs. Thus, the above indicators are not considered in the research of this article. This article uses the concept of traffic flow density to describe the traffic environment around the accident ship uniformly. Therefore, factors such as population density and whether it is an anchorage area are not considered in selecting indicators.
Based on the relevant research achievements regarding ship collision accidents at sea, we divide the safety risks into 5 levels. According to the literature [35,36], we determine the evaluation standards corresponding to each level for the indicator system above. The evaluation standards are given in Table 1.
The unit of indicators C1 and C4 is level. The level of the C1 indicator uses the Beaufort scale [37]. The level of the C4 indicator uses the Douglas scale [38]. The following will convert the obtained wind speed and wave height data into the corresponding level.
The indicator values of C3, C12, C13, C14, and C15 are subjectively scored. For example, when the collision position is the bow, the ship’s condition is better than if the collision position were on other positions of the ship; therefore, if the collision position is the bow, the score is higher than the collision position of other parts.
The indicator value of C2, C5, C6, C7, C8, C9, C10, and C11 set an upper limit. This article considers the maximum possible value of the indicator under the current conditions when setting the upper limit. When these indicator values exceed the upper limit, they will be processed according to the highest upper limit. Among them, C7 is the indicator of another ship’s gross tonnage. C10 is the gross tonnage of our ship. C7 and C10 are inversely proportional. This is because, in the actual collision process, the larger the gross tonnage of one ship compared to a second ship, the higher the risk of the second ship and the lower the risk of the first ship.
We treat the interval boundary of each level of the emergency situation as a double constraint space   C m i n , C m a x [23], C m a x and C m i n are the maximum and minimum limit values of a certain level of a specific indicator. By the Equations (4)–(6), the expected values E x , entropy E n , and hyper-entropy H e 
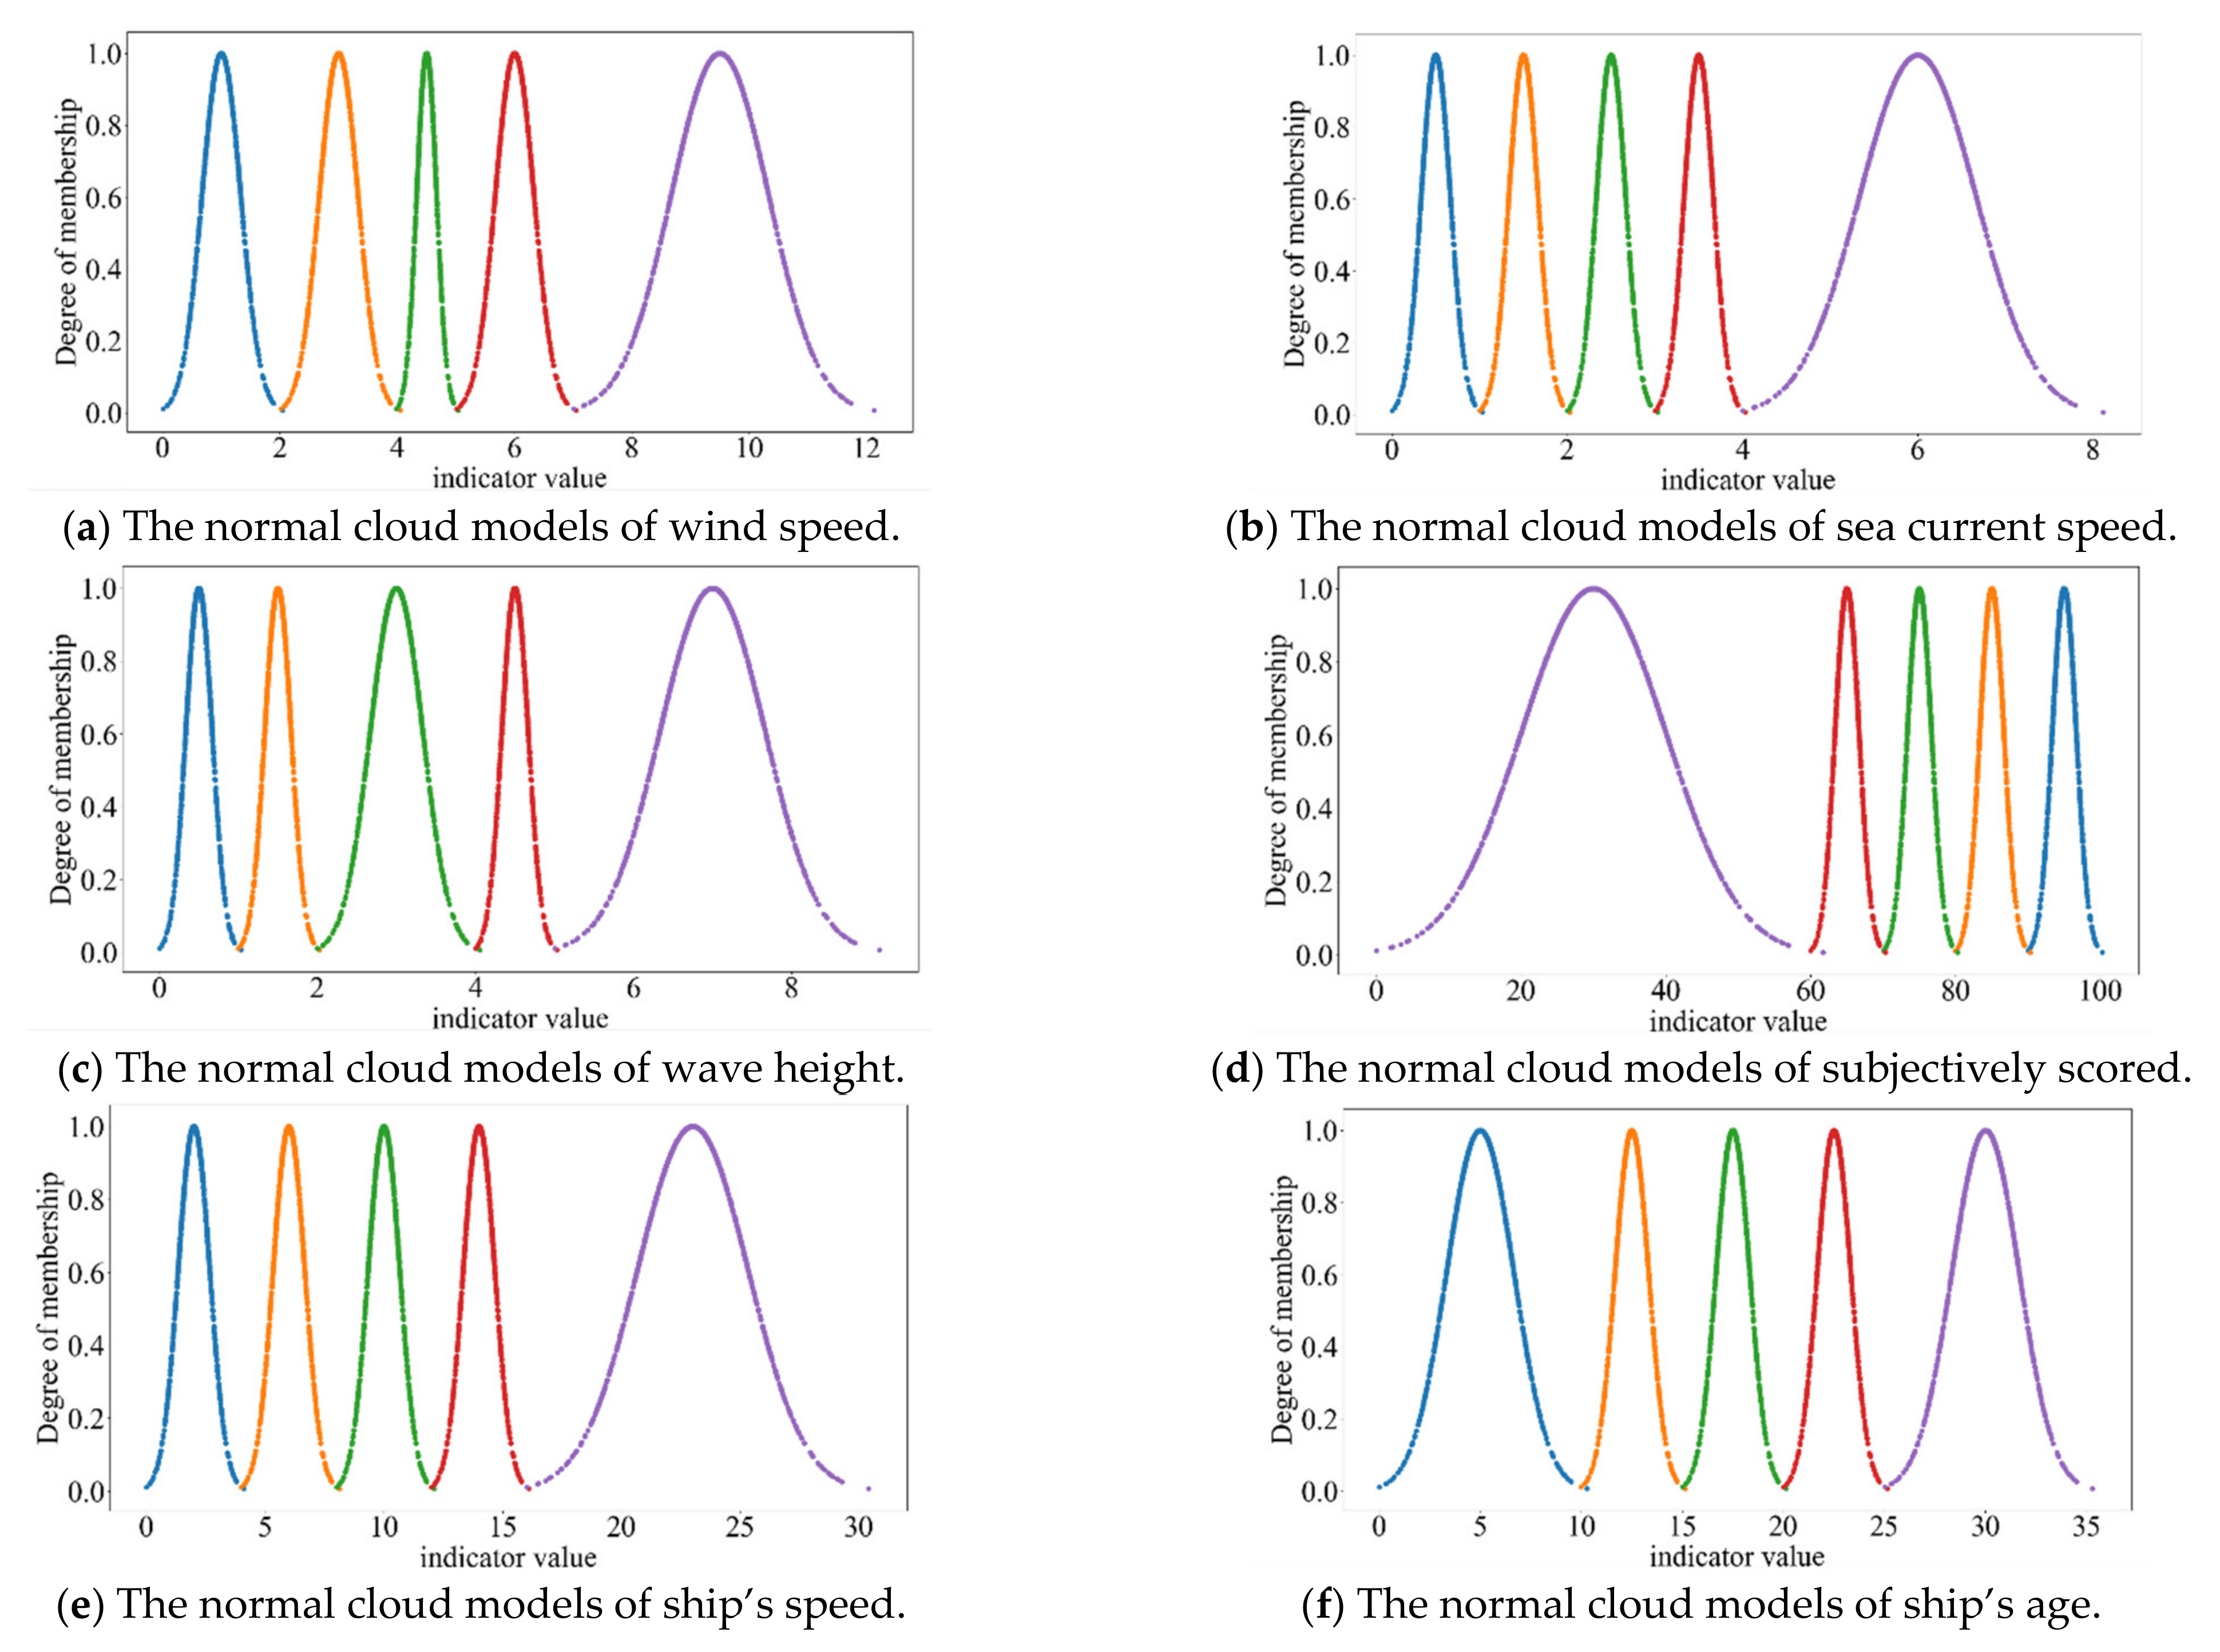
of the normal cloud model can be calculated, and we can then construct the extension cloud matter-element model of each evaluation level. The extension cloud models at all levels are shown in Table 2. The cloud maps of the evaluation level of the emergency situation are shown in Figure 4.
E x = C m a x + C m i n 2
E n = C m a x C m i n 6  
H e = s
In Equation (6), s is a constant that can be determined based on experience. H e is the entropy of entropy, which indicates the degree of dispersion of entropy [20,39,40]. In this paper, considering the degree of dispersion of the entropy of the obtained data, the s value is set to 0.001.

2.5. Assign the Weights

2.5.1. Assign the Subjective Weights by AHP

The AHP is a multi-standard evaluation method which can objectively quantify the subjective judgments of qualitative problems. By analysing the factors that affect the safety level of accidents and their interrelationships, each indicator can be decomposed into different levels to form a multi-level structural analysis model that is objectively guided by the AHP [41]. The subjective weight of the evaluation index can be obtained through the analytic hierarchy process.
The steps of using AHP to calculate subjective weights are as follows:
(1) Construct the judgment matrix
We compare the indicators of each level, then obtain a judgment matrix according to the comparison results. The judgment matrix is shown in Equation (7).
q = q 11 q 12 q 1 n q 21 q 22 q 2 n q n 1 q n 2 q n n
In Equation (7), we suppose that there are n indicators in this level, q i   and q j represent the i-th and j-th indicator (i,j = 1, 2,…,n). q i j represents the importance of indicator q i relative to indicator q j . In order to quantify the contrast judgment conveniently, a scale method of 1–9 is introduced. We use 1, 3, 5, 7, and 9 to show how important the indicator q i is to indicator q j ; 1 means equally important, 3 means slightly important, 5 means strongly important, 7 means more strongly important, and 9 means extremely important, and 2, 4, 6, and 8 are used to represent compromise between numbers on the above scale. The meaning of q i j is shown in Table 3.
There are three indicators (hydrometeorological situation, ship’s situation, and rescue situation) in the second level. The judgment matrix based on expert scoring is shown in Equation (8)
P = 1 1 5 1 3 5 1 3 3 1 3 1
(2) Calculate the maximum eigenvalue and the maximum eigenvector of the matrix P; we can obtain the maximum eigenvalue as λ m a x = 3.04 and the maximum eigenvector as ω = 0.15 , 0.92 , 0.37 . Normalizing the ω , we can obtain the weight vector ω   of the judgment matrix P. The ω   is [0.1, 0.64, 0.26].
(3) Consistency test
After calculating the weight of the indicator, we also need to calculate whether it has satisfactory consistency. The consistency test is shown in Equations (9) and (10) [42,43,44].
C I = λ m a x n n 1
C R = C I R I
In Equation (10), C R is the consistency index used to determine whether the judgment matrix q is reasonable. When C R < 0.1, this means that the judgment matrix q has consistency. The smaller the CR value is, the better the consistency of the judgment matrix q is. RI is a random consistency index, and the value of RI is shown in Table 4.
The weights of all indicators of the emergency situation after collisions at sea can be obtained after analysing a pairwise comparison of all levels of indicators. The subjective weights of all indicators are shown in Table 5.

2.5.2. Assign Dynamic Weight by the Extension Correlation Function

The idea of the method to assign the dynamic weight is according to the position of indicator data falling into the classification interval. Indicator data falling into the centre of the interval should be given a greater weight value than indicator data falling on the edge of the interval. This is because the closer the indicator data fall into the centre of the classification interval, the clearer the grade that the indicator represents. At the same time, the larger the grade category that the indicator data fall into, the more dangerous the grade represented by the indicator is and the more attention should be paid to it, therefore a more excellent weight value should be given.
According to the literature [45], the correlation function is used to determine the weight, and the steps of extension dynamic weight are as follows:
The value range of characteristic C i in the classical domain of grade j is v i j = a i j , b i j .
r i j v x , v i j = 2 x a i j b i j a i j , x a i j + b i j / 2 2 b i j x b i j a i j , x > a i j + b i j / 2       i = 1 , 2 , , n ; j = 1 , 2 , , m
Let
r i j m a x v x , v i j m a x = m a x j r i j v x , v i j
The larger the grade category that the data fall into, the higher the weight value which should be given to the indicator.
r i = j m a x × 1 + r i j m a x v x , v i j m a x , r i j m a x v x , v i j m a x 0.5 j m a x × 0.5 , r i j m a x v x , v i j m a x < 0.5
From the above, we can calculate the weight by Equation (14).
w i = r i / i = 1 n r i

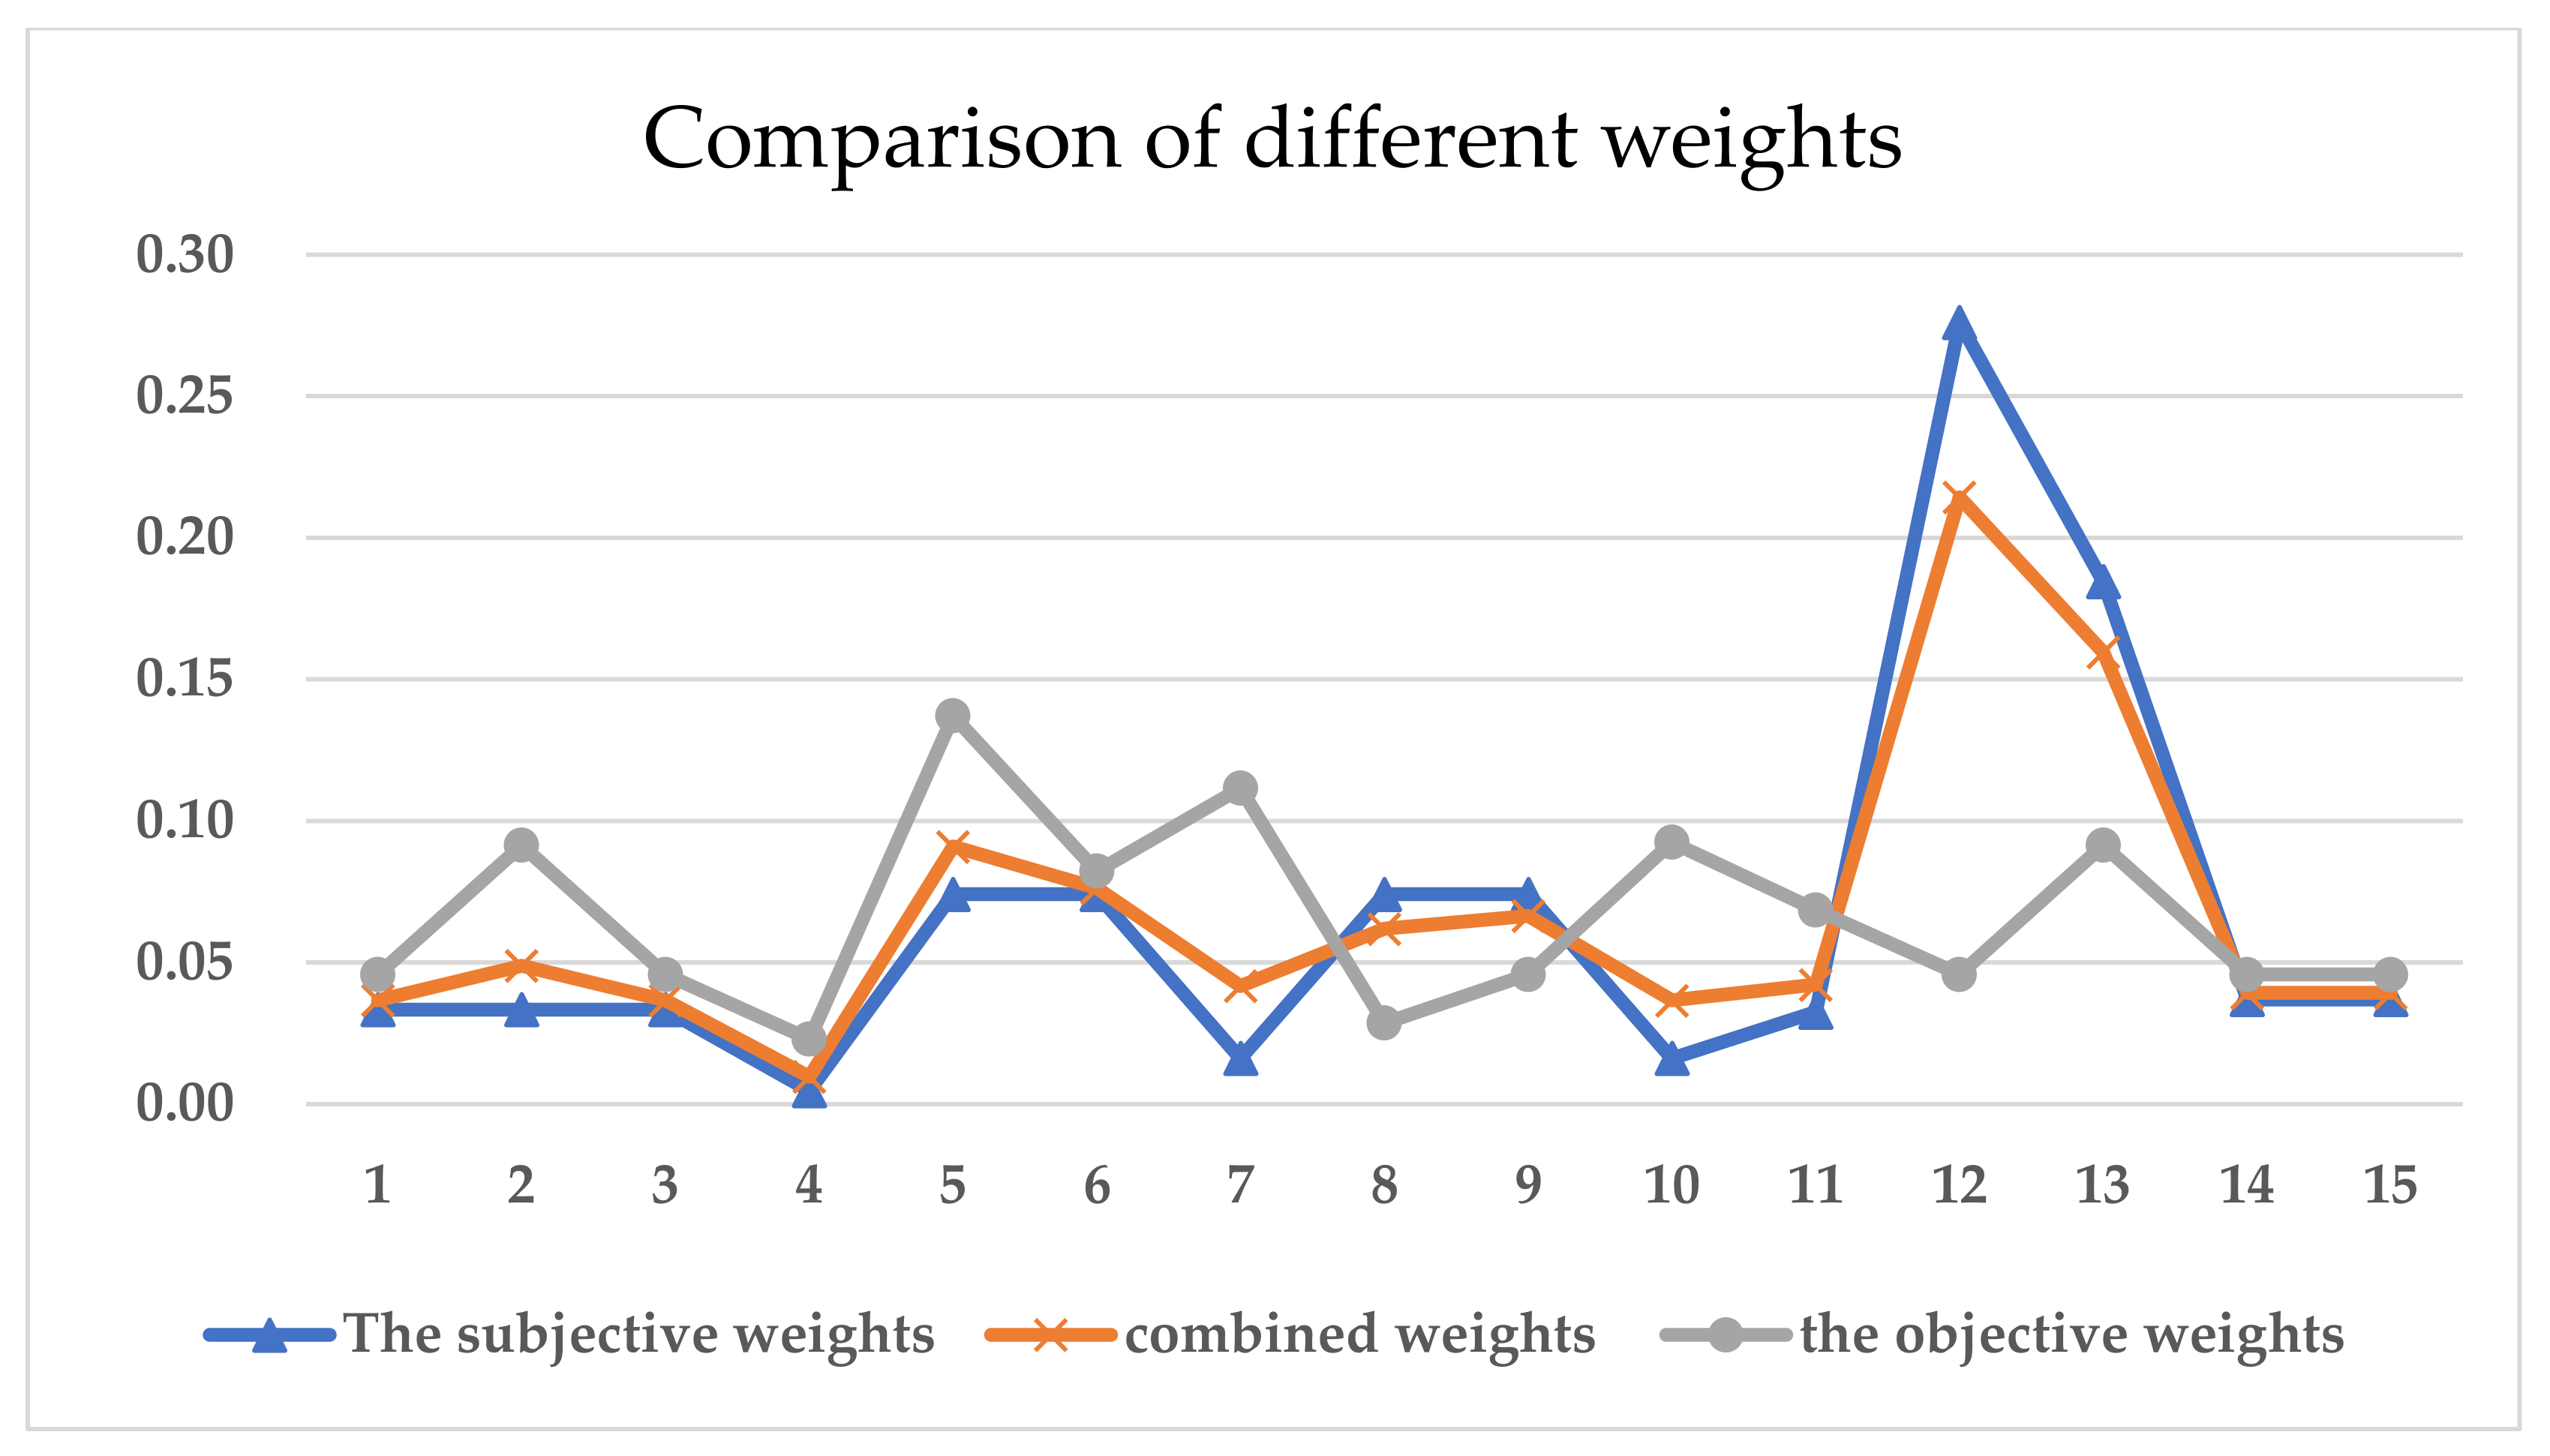
2.5.3. Assign the Combination Weight Based on the Idea of Game Theory

We determine the combination weight based on the idea of game theory, which comprehensively considers the subjective and objective weight of indicators and seeks compromise or consistency between different weights. It can achieve Nash equilibrium while reducing the deviation between subjective and objective weights, and optimize the combination of subjective and objective weights scientifically and reasonably, to obtain the optimal combination weight [46,47]. The calculation steps of combination weight are as follows.
(1) Let the basic weight vector set be w k = w k 1 , w k 2 , , w k n k = 1 , 2 , , L ; n is the number of indicators and L is the number of methods to determine the weight, which is 2 in this paper. Let the linear combination weight coefficient be α = α 1 , α 2 , , α L . Any linear combination of these vectors is shown as Equation (15):
w = k = 1 L α k · w k T ,   α k > 0 , k = 1 , 2 , , L
(2) The consensus and compromise between different weights were sought. With the minimization of deviation between w and w k as the goal, L linear weight combination coefficients α k in Equation (15) were optimized to obtain the most satisfactory weight in w, and the objective function was shown as Equation (16):
m i n k = 1 L a k w k T w k 2 k = 1 , 2 , , L
According to matrix differential properties, the linear equations of the first derivative condition of Equation (16) for optimization are shown as Equation (17):
w 1 · w 1 T w 1 · w 2 T w 1 · w L T w 2 · w 1 T w 2 · w 2 T w 2 · w L T w L · w 1 T w L · w 2 T w L · w L T α 1 α 2 α L = w 1 · w 1 T w 2 · w 2 T w L · w L T
(3) The optimized combination coefficient α k obtained by calculation is normalized.
α k * = α k / k = 1 L α k
(4) Finally, the combination weight w = w 1 , w 2 , , w n based on game theory is obtained by the Equation (19).
w * = k = 1 L α k * w k T

2.6. Calculation of Correlation Degree

We consider each evaluation metric as a cloud droplet, the correlation of the value x i i = 1 , 2 , 15 of the metric to be evaluated about each level of the cloud model is shown as Equation (20)
k i j = e x p x i E x 2 2 E n ' 2
In Equation (20), x i is the quantitative value of the situation safety evaluation indicator; E x , E n , and H e are the mathematical characteristics of the extension cloud corresponding to the level of situation safety of the indicator; E n is a normal random coefficient with the expected value of E n and standard deviation of H e .
D = k 11 k 12 k 13 k 14 k 15 k 21 k 22 k 23 k 24 k 25 k 31 k 32 k 33 k 34 k 35 k 41 k 42 k 43 k 44 k 45 k 151 k 152 k 153 k 154 k 155

2.7. Calculate Safety Level

The evaluation vector is B = w * · D . Finally, the weighted average method is used to obtain the comprehensive evaluation score r , and the formula is shown as Equation (22)
r = j = 1 5 b j f j j = 1 5 b j
In Equation (22), f j is the score value, and the scores are 1, 2, 3, 4, and 5, corresponding to the evaluation level of 1 to 5, respectively; b j is the corresponding component of vector B.
In order to reflect the general trend of random factors that cannot be avoided in the evaluation process, the expected value E r x and entropy E r n can be obtained after m times cyclic operation.
E r x = r 1 x + r 2 x + + r m x / m
E r n = 1 m i = 1 m r i x E r x 2
In Equation (23), m is 100, and r i x is the comprehensive evaluation score calculated for the i-th time.
Since the entropy E r n can reflect the dispersion of the situation security evaluation results, and the expected value E r x can represent the evaluation score of the situation security evaluation level, the ratio of expected value E r x and entropy E r n is defined as the credibility factor σ .
σ = E r n / E r x
The larger the value σ is, the greater the evaluation result’s dispersion, and the smaller the credibility is.

3. Case Analysis

In order to verify the validity of the model proposed in this paper, this paper used the relevant data of real collision accidents to calculate. The data came from the investigation report for collision accidents published on the official website of the China Maritime Safety Administration.

3.1. Case 1

At about 1829 on 21 November 2020, the ship “Hua Jinzhou” collided with the ship “WAN HAI 316” at 22° 33.337′ N/113° 43.530′ E. The wind speed at the scene was level 4, the sea current speed was 1.5 knots, the visibility was good, the wave height was 1 m, the speed of the ship “Hua Jinzhou” was 3.5 knots, the age of the ship “Hua Jinzhou” was 15 years, the gross tonnage of the ship “Hua Jinzhou” was 2986 tons, the speed of the ship “WAN HAI 316” was 15 knots, the age of the ship “WAN HAI 316” was 13 years, the gross tonnage of the ship “WAN HAI 316” was 27,800 tons. The starboard side of the bow of the “Hua Jinzhou” ship collided with the starboard side of the “WAN HAI 316”. There were not many ships around the site, and there was no risk of oil spill or dangerous goods leakage. The indicator data of emergency situation after the collision are shown in Table 6.
The calculation process is as follows:
(1) Assign the weights
Taking the distribution of the weights of emergency situation indicators after the collision of “Hua Jinzhou” as an example, firstly, we use the Analytic Hierarchy Process to assign the subjective weights. The subjective weights are shown in Table 5, and then the dynamic weights are assigned by the extension correlation function, that is, using Equations (11)–(14) to calculate the objective weights. The objective weights calculation results are shown in Table 7. Finally, we use game theory to determine the combined weight. From Equations (15)–(17), the equations for solving the optimal combination coefficients are established:
a 1 W 1 W 1 T + a 2 W 1 W 2 T = W 1 W 1 T a 1 W 2 W 1 T + a 2 W 2 W 2 T = W 2 W 2 T
Solving Equation (26), the optimal combination coefficient is a1 = 0.886 a2 = 0.223, we normalize a1 and a2 according to Equation (18) to obtain a1* = 0.799 a2* = 0.201, and then we used Equation (19) to calculate the final combination weights. The combined weight results are shown in Table 7.
Through Figure 5, we can intuitively compare the weights assigned by the different assignment methods of each indicator.
As we can see from Figure 5, the integration of subjective and objective weights through the combination of weights allows us not only to consider the characteristics of subjective or objective weighting when single weighting is assigned but also to avoid the result deviation caused by single weighting. The comprehensive weight obtained in this way is more reasonable.
(2) We use Equation (20) to calculate the correlation degree of each evaluation indicator for each level of the cloud model. The calculated results are shown in Table 8 and Table 9. The risk level of each indicator of “WAN HAI 316” and “Hua Jinzhou” is shown in Figure 6.
(3) Calculate the security level and credibility factor according to Equations (21)–(24). The calculation results are shown in Table 10.
Since the starboard side of the bow of “Hua Jinzhou” collided with the starboard side of “WAN HAI 316”, as we can see from Figure 6, the indicator “collision position” of “Hua Jinzhou” was low risk, while the indicator “collision position” of “WAN HAI 316” was high risk. Therefore, the final evaluation result shows that the risk level of “WAN HAI 316” is higher than that of “Hua Jinzhou”.
The risk level of the emergency situation at the accident site is medium risk.

3.2. Case 2

In 2036 on May 11, 2018, the ship “X” collided with the ship “Z” at 31° 58.684′ N, 120° 20.440′ E. The wind speed at the scene was level 4, the sea current speed was 2 knots, the visibility was good, the wave height was 0.5 m, the speed of the ship “X” was 13 knots, the age of the ship “X” was 7 years, the gross tonnage of the ship “X” was 32964 tons, the speed of the ship “Z” was 5.4 knots, the age of the ship “Z” was 14 years, the gross tonnage of the ship “Z” was 1398 tons, the left side of the bow of the ship “X” collided with the rear right side of the stern of the ship “Z”. There were some ships around the site, and there was no risk of oil spills and dangerous goods leakage. The indicator data of emergency situation after the collision are shown in Table 11.
The weight calculation process is the same as above, then we calculate the correlation degree of each evaluation indicator for each level of the cloud model. The calculated results are shown in Table 12 and Table 13. The risk level of each indicator of “Z” and “X” is shown in Figure 6. Finally, we calculate the security level and credibility factor, for which the calculation results are shown in Table 14.
In this accident, the bow of the “X” ship collided with the stern of the “Z” ship. As we can see from Figure 6, in the indicator “collision position”, the “Z” ship was at high risk and the “X” ship was at low risk. Therefore, the final evaluation result shows that the risk level of “Z” is higher than that of “X”. The risk level of the emergency situation at the accident site is medium risk in case 2.

3.3. Result

The final level of two cases is medium risk. In these two cases, the risk level of “WAN HAI 316” represents the situational risk level of the emergency scene in Case 1, and the risk level of “Z” represents the situational risk level of the emergency scene in Case 2. The risk level of each indicator for “WAN HAI 316” and “Z” is shown in Figure 6. Both cases occurred when the weather and sea conditions were good, and the emergency response was not difficult, therefore the safety level of the accident was not high. In the end, according to the maritime accident statistics method of the China Maritime Safety Administration [48], both case studies were judged to be general accidents. The final assessment results of these two cases are consistent with the accident assessment results in the accident report issued by the China Maritime Safety Administration.

4. Discussion and Suggestion

4.1. Discussion

The emergency situation evaluation and analysis after a maritime collision accident has a crucial guiding significance for the follow-up emergency rescue operations. At present, there is limited associated research on the quantitative evaluation of the emergency situation after a ship collision accident. Therefore, this paper applies the extension cloud model to the safety situation evaluation after a ship collision accident and constructs a safety situation evaluation model.
This paper constructs an evaluation indicator system for the safety situation level after a ship collision accident through the ship–environment–rescue logic model. This indicator system is used in the evaluation model to evaluate and analyze the emergency scene safety situation. After that, this paper uses the extension cloud model in the security situation evaluation model to overcome the ambiguity and uncertainty of the indicators in the emergency situation evaluation. In addition, we use game theory to combine the weights when calculating the weighted correlation. In this way, we can avoid the problem of unreasonable results caused by single weighting.
The evaluation model in this paper evaluates the safety level from the perspective of the size and tonnage of the ship. This article does not consider the types of ships in the evaluation process. The evaluation of collision accident safety levels for different types of ships will be our next research endeavour. At the same time, this article does not consider the local restrictions, and the impact of accidents on the surrounding personnel and property losses in different sea areas is also different. In order to simplify the evaluation process in this paper, the local restrictions are not considered in the process of using the model evaluation. Therefore, the local restrictions are also a point that we need to study when we use the model to evaluate the safety level of the emergency situation of collision accidents. This paper takes a constant value for the hyper-entropy H e of all indicators in the normal cloud model based on empirical values. In the next study, we will explore a more reasonable and scientific way to determine the value of H e for different indicators to make the evaluation result more universal. In the process of maritime emergency rescue, the situation of the emergency scene changes rapidly. The prediction of the emergency situation can provide decision-making support for emergency commanders. The model proposed in this paper is only an evaluation of the current emergency situation and cannot predict the trend of a given emergency situation. It is worthwhile to continue research in the forecast of emergency situations.

4.2. Suggestion

4.2.1. Strengthen Crew Training and the Management of On-Board Duty Personnel

Ninety percent of marine collision accidents are related to human factors, of which 60% are directly related to people, and the remaining 30% are indirectly related to people. Human factors mainly include improper human operation, human negligence, improper use of equipment, and failure to comply with related common practices [49]. This also indirectly reflects that the current seafarer training system is imperfect and that the personnel management on board is loose. Therefore, it is necessary to increase the crew’s professional ability training, strengthen the crew’s management on the ship, and formulate a reasonable personnel management system to effectively protect the life and property safety of people at sea.

4.2.2. Optimize the Ship Structure and Improve the Ship’s Self-Rescue Ability at Sea

In maritime collision accidents, different collision forces and collision angles cause different damages to the same ship, and indirectly lead to different lives and property losses caused by maritime collision accidents. The severity of collision of different ships will also be affected by the ship’s tonnage and the colliding ship’s speed. Therefore, it is necessary to consider the structural strength of various parts of the ship in the early stage of ship design, strengthen the weak points, and optimize the escape design to improve the escape ability of the people on the ship.

4.2.3. Establish a Complete Marine Emergency Response Rescue System

Maritime search and rescue are different from that on land. When a maritime accident occurs, it is necessary to obtain the hydrometeorological information of the emergency site, the basic information about the accident ship, and the basic information about the accident in time. The information obtained can be used to assess the emergency site’s safety situation and formulate a corresponding search and rescue plan. Therefore, to improve search and rescue capabilities and reduce casualties at sea, an intelligent search and rescue system is urgently needed to allow further study based on emergency scene safety situations [50,51].

5. Conclusions

This paper takes the ship collision reports published by the China Maritime Safety Administration as examples for analysis. The following conclusions are obtained by analyzing these cases. Based on the extension cloud model, the reliability of the safety level evaluation results of maritime collision accidents in this paper is within a reasonable range. By evaluating the safety level of various indicators in the indicator system, it is not difficult to see that the severity of the collision accident is mainly related to the speed, tonnage, location of the collision, and the angle of the collision. The analysis results indicate that this model can effectively and reasonably evaluate the emergency situation after collisions at sea. In practical applications, the model proposed in this paper can be used for real-time emergency situation analysis at the emergency site, and the indicator data can be measured in real-time. This will provide real-time situation analysis results for emergency rescuers. This model can be very helpful for emergency commanders to grasp the emergency scene situation accurately.

Author Contributions

Supervision, Y.Z. (Yingjun Zhang); Funding acquisition, Y.Z. (Yingjun Zhang); Methodology, Z.M.; Writing-review & editing, Y.Z. (Yiyang Zou). All authors have read and agreed to the published version of the manuscript.

Funding

This work was supported by: National Key R&D Program of China (2018YFC0309600\03); Liao Ning Revitalization Talents Program (XLYC1902071); Fundamental Research Funds for the Central Universities (3132019313).

Institutional Review Board Statement

Not applicable.

Informed Consent Statement

Not applicable.

Data Availability Statement

Not applicable.

Conflicts of Interest

The authors declare no conflict of interest.

References

  1. Yildiz, S.; Uğurlu, Ö.; Wang, J.; Loughney, S. Application of the HFACS-PV Approach for Identification of Human and Organizational Factors (HOFs) Influencing Marine Accidents. Reliab. Eng. Syst. Saf. 2021, 208, 107395. [Google Scholar] [CrossRef]
  2. Etman, E.; Halawa, A. Safety Culture, the Cure for Human Error: A Critique. Dmitriy Zhukov 2007, 115, 115–126. [Google Scholar]
  3. Agency, E.M.S. Annual Overview of Marine Casualties and Incidents. Available online: http://www.emsa.europa.eu/news-a-press-centre/external-news/item/3406-annual-overview-of-marine-casualties-and-incidents-2018.html (accessed on 16 November 2021).
  4. Kaptan, M.; Uğurlu, Ö.; Wang, J. The Effect of Nonconformities Encountered in the Use of Technology on the Occurrence of Collision, Contact and Grounding Accidents. Reliab. Eng. Syst. Saf. 2021, 215, 107886. [Google Scholar] [CrossRef]
  5. Ministry of Transport of the People’s Republic of China (Government Information Publicity). Available online: https://xxgk.mot.gov.cn/2020/jigou/zhghs/202105/t20210517_3593412.html (accessed on 10 July 2021).
  6. Uğurlu, Ö.; Yldz, S.; Loughney, S.; Wang, J.; Kuntchulia, S.; Sharabidze, I. Analyzing Collision, Grounding, and Sinking Accidents Occurring in the Black Sea Utilizing HFACS and Bayesian Networks. Risk Anal. 2020, 40, 2610–2638. [Google Scholar] [CrossRef]
  7. Yildirim, U.; Ugurlu, O.; Basar, E.; Yuksekyildiz, E. Human Factor Analysis of Container Vessel’s Grounding Accidents. Int. J. Marit. Eng. 2017, 159, 89–98. [Google Scholar] [CrossRef]
  8. Parunov, J.; Prebeg, P.; Rudan, S. Post-Accidental Structural Reliability of Double-Hull Oil Tanker with near Realistic Collision Damage Shapes. Ships Offshore Struct. 2020, 15, 1–18. [Google Scholar] [CrossRef]
  9. Gledić, I.; Mikulić, A.; Parunov, J. Improvement of the Ship Emergency Response Procedure in Case of Collision Accident Considering Crack Propagation during Salvage Period. J. Mar. Sci. Eng. 2021, 9, 737. [Google Scholar] [CrossRef]
  10. Luis, R.M.; Teixeira, A.P.; Guedes Soares, C. Longitudinal strength reliability of a tanker hull accidentally grounded. Struct. Saf. 2008, 31, 224–233. [Google Scholar] [CrossRef]
  11. Gledić, I.; Parunov, J.; Prebeg, P.; Ćorak, M. Low-Cycle Fatigue of Ship Hull Damaged in Collision. Eng. Fail. Anal. 2019, 96, 436–454. [Google Scholar] [CrossRef]
  12. Primorac, B.B.; Parunov, J.; Soares, C.G. Structural Reliability Analysis of Ship Hulls Accounting for Collision or Grounding Damage. J. Mar. Sci. Appl. 2020, 19, 717–733. [Google Scholar] [CrossRef]
  13. Zhou, Z.; Zhang, Y.; Wang, S. A Coordination System between Decision Making and Controlling for Autonomous Collision Avoidance of Large Intelligent Ships. J. Mar. Sci. Eng. 2021, 9, 1202. [Google Scholar] [CrossRef]
  14. Zhang, L.; Wang, H.; Meng, Q.; Xie, H. Ship Accident Consequences and Contributing Factors Analyses Using Ship Accident Investigation Reports. Proc. Inst. Mech. Eng. Part O J. Risk Reliab. 2019, 233, 35–47. [Google Scholar] [CrossRef]
  15. Zhang, Y.Y. Study on Ship Collision Accident Situation at Sea; Jimei University: Xiamen, China, 2019. [Google Scholar]
  16. Zhang, X. Research on the Decision-Making under Different Situations of Ship Collision Accident; Jimei University: Xiamen, China, 2019. [Google Scholar] [CrossRef]
  17. Wang, Z.H.; Huang, K.; Zhang, Q. Early-Warning Model for the Ecological Security and Its Application Based on the Extension-Liable Theory—A Case Study of Zhangye Section of Qilian Mountain Glacier and Water Conservation Ecological Function Area. J. Saf. Environ. 2017, 17, 768–774. [Google Scholar] [CrossRef]
  18. Wang, F.; Sun, J.; Lin, Y. Research on the Extension Precision Evaluation of Fault Damage Grade of Aeronautical Equipment. Fire Control Command Control 2020, 45, 105–109. [Google Scholar] [CrossRef]
  19. Feng, L.; Li, W.L.; Jun, N.; Yu, R.H. Evaluation of anchoring safety based on normal cloud extension theory. J. Shanghai Marit. Univ. 2020, 41, 30–35. [Google Scholar] [CrossRef]
  20. Li, R.; Su, H. A Synthetic Power Quality Evaluation Model Based on Extension Cloud Theory. Autom. Electr. Power Syst. 2012, 1, 66–70. [Google Scholar] [CrossRef]
  21. Li, D.; Cheung, D.; Shi, X.; Ng, V. Uncertainty Reasoning Based on Cloud Models in Controllers. Comput. Math. Appl. 1998, 35, 99–123. [Google Scholar] [CrossRef] [Green Version]
  22. Li, J.; Wang, Z.T.; Xie, B. Pipline Vulnerability Evaluation in Collapsible Loess Regin Based on Game Theory and Cloud Mode. Oil-Gasfield Surf. Eng. 2021, 40, 67–72. [Google Scholar] [CrossRef]
  23. Li, D.; Liu, C.-Y.; Liu, L.Y. Study on the Universality of the Normal Cloud Model. Eng. Sci. 2004, 6, 28–34. [Google Scholar]
  24. Ma, M.F.; Zhang, Z.F. Network trust evaluation based on extension cloud. J. Comput. Appl. 2016, 36, 1533–1537. [Google Scholar] [CrossRef]
  25. Lu, F.; Li, W.; Zhang, H. Safety Assessment of Ship Anchoring Based on the Extenics. J. Dalian Marit. Univ. 2015, 41, 10–14. [Google Scholar] [CrossRef]
  26. Cai, W. Overview of Extenics. Syst. Eng. Theory Pract. 1998, 1, 77–85. [Google Scholar]
  27. Ming-ke, P.G.S. On the 3-D Structure of Government Performance Evaluation System. J. Lanzhou Univ. Soc. Sci. 2007, 1, 40–46. [Google Scholar] [CrossRef]
  28. Zhang, D.; Yang, X.R.; Fan, X.B. Research on Risk Assessment of Vessel-Bridge Collision Accident in Inland Waterway. In Proceedings of the 2nd International Conference on Civil Engineering and Transportation (ICCET 2012), Guilin, China, 27 October 2012; Volume 256, pp. 2790–2793. [Google Scholar] [CrossRef]
  29. Zhang, N. Discussion on the assessment and decision of rescue risk in big storm and waves. China Water Transp. 2013, 13, 17–18. [Google Scholar]
  30. Liu, H.; He, P. Influence Factor Analysis of Maritime Accidents Based on Rough Set. J. Shanghai Marit. Univ. 2013, 34, 17–22. [Google Scholar] [CrossRef]
  31. Zheng, Z.; Yan, H.; Zhao, N. Research on Ship Collision Damage Based on Rough Set. J. Dalian Marit. Univ. 2012, 38, 1–4. [Google Scholar]
  32. Chen, S.-T.; Wall, A.; Davies, P.; Yang, Z.; Wang, J.; Chou, Y.-H. A Human and Organisational Factors (HOFs) Analysis Method for Marine Casualties Using HFACS-Maritime Accidents (HFACS-MA). Saf. Sci. 2013, 60, 105–114. [Google Scholar] [CrossRef]
  33. Mazaheri, A.; Montewka, J.; Kujala, P. Towards an Evidence-Based Probabilistic Risk Model for Ship-Grounding Accidents. Saf. Sci. 2016, 86, 195–210. [Google Scholar] [CrossRef]
  34. Graziano, A.; Teixeira, A.P.; Soares, C.G. Classification of Human Errors in Grounding and Collision Accidents Using the TRACEr Taxonomy. Saf. Sci. 2016, 86, 245–257. [Google Scholar] [CrossRef]
  35. Fan, X.W. Study on SAR Environment at Sea; Dalian Maritime University: Dalian, China, 2013. [Google Scholar]
  36. Xue, W. The Risk Analysis of Collision Accidents in Dalian Port and Its Nearby Waters; Dalian Maritime University: Dalian, China, 2013. [Google Scholar]
  37. Beaufort Scale—Wikipedia. Available online: https://en.wikipedia.org/wiki/Beaufort_scale (accessed on 16 November 2021).
  38. EuroWEATHER-Douglas Scale. Available online: http://www.eurometeo.com/english/read/doc_douglas (accessed on 16 November 2021).
  39. Ji, H.; Han, Q.; Li, X.; You, H.; Ye, Z. Air Combat Situation Assessment Based on Improved Cloud Model Theory. In Proceedings of the 2019 IEEE 8th Joint International Information Technology and Artificial Intelligence Conference (ITAIC), Chongqing, China, 24 May 2019; pp. 754–758. [Google Scholar] [CrossRef]
  40. Liu, H.; Zhang, L.; Liu, S. Modeling of Ship Collision Risk Based on Cloud Model. IEEE Access 2020, 8, 221162–221175. [Google Scholar] [CrossRef]
  41. Zheng, Z.; Li, H. Study of Navigation Safety Evaluation in Navigable Waters. Navig. China 2008, 31, 30–35. [Google Scholar]
  42. Gao, Z.H. Research on Inland Bridge Water Area Safety Monitoring System; Dalian Maritime University: Dalian, China, 2016. [Google Scholar]
  43. Tian, Y.J. Application of analytic hierarchy process in quantitative evaluation of ship maintenance risk. China Water Transp. 2021, 2021, 98–100. [Google Scholar] [CrossRef]
  44. Tang, D.F.; Han, Y. Seafarer ability evaluation model based on analytic hierarchy process and fuzzy comprehensive evaluation. J. Shanghai Ship Shipp. Res. Inst. 2020, 43, 65–70. [Google Scholar] [CrossRef]
  45. Baoqing, H.U. Application of Extension Assessment Method to Stability Classification of Surrounding Rocks. J. Hydraul. Eng. 2000, 2, 66–70. [Google Scholar] [CrossRef]
  46. Hu, J.F.; Guo, Z.L.; Gong, Y.; Liu, L.; He, Z. Optimization of stone structure parameters based on game theory-improved TOPSIS mode. Min. Res. Dev. 2020, 40, 11–17. [Google Scholar] [CrossRef]
  47. Zhang, M.X.; Han, D.; Zhao, T.M. Comprehensive evaluation of ship type based on game theory and TOPSIS. Appl. Sci. Technol. 2020, 47, 13–19. [Google Scholar] [CrossRef]
  48. Ministry of Transport of the People’s Republic of China (Measures for Statistics of Water Traffic Accidents). Available online: https://www.msa.gov.cn/page/article.do?type=hsfg&articleId=CBDD3979CDAA47C6E0533A0820C60BF9 (accessed on 16 November 2021).
  49. Shang, Y.L. Vessel Collision Causation Analysis Based on Bayesian Network; Dalian Maritime University: Dalian, China, 2009. [Google Scholar]
  50. Gao, M.; Shi, G.-Y. Ship-Collision Avoidance Decision-Making Learning of Unmanned Surface Vehicles with Automatic Identification System Data Based on Encoder—Decoder Automatic-Response Neural Networks. J. Mar. Sci. Eng. 2020, 8, 754. [Google Scholar] [CrossRef]
  51. Xiong, W.; van Gelder, P.; Yang, K. A Decision Support Method for Design and Operationalization of Search and Rescue in Maritime Emergency. Ocean Eng. 2020, 207, 107399. [Google Scholar] [CrossRef]
Figure 1. The model framework for an emergency situation safety evaluation after collisions at sea.
Jmse 09 01370 g001
Figure 2. Ship–environment–rescue logical model.
Jmse 09 01370 g002
Figure 3. Indicator system for the emergency situation after collisions.
Jmse 09 01370 g003
Figure 4. The cloud maps of the evaluation level of the emergency situation.
Jmse 09 01370 g004aJmse 09 01370 g004b
Figure 5. Comparison of different weights.
Jmse 09 01370 g005
Figure 6. The risk level of each indicator of “WAN HAI 316”, “Z”, “Hua Jinzhou”, and “X”.
Jmse 09 01370 g006
Table 1. Evaluation standards corresponding to each level of the emergency situation after collisions at sea.
IndicatorRank
Lower Risk (1)Low Risk (2)Medium Risk (3)High Risk (4)Higher Risk (5)
C1 (level)[0–2)[2–4)[4–5)[5–7)[7–12)
C2 (knot)[0–1)[1–2)[2–3)[3–4)[4–8)
C3[100–90)[90–80)[80–70)[70–60)[60–0)
C4 (level)[0–1)[1–2)[2–4)[4–5)[5–9)
C5 (knots)[0–4)[4–8)[8–12)[12–16)[16–30)
C6 (years)[0–10)[10–15)[15–20)[20–25)[25–35)
C7 (tons)[0–500)[500–3000)[3000–10,000)[10,000–30,000)[30,000–600,000)
C8 (knots)[0–4)[4–8)[8–12)[12–16)[16–30)
C9 (years)[0–10)[10–15)[15–20)[20–25)[25–35)
C10 (tons)[30,000–600,000)[10,000–30,000)[3000–10,000)[500–3000)[0–500)
C11 (degrees)[0–15)[15–30)[30–45)[45–60)[60–90)
C12[90–100)[80–90)[70–80)[60–70)[0–60)
C13[90–100)[80–90)[70–80)[60–70)[0–60)
C14[90–100)[80–90)[70–80)[60–70)[0–60)
C15[90–100)[80–90)[70–80)[60–70)[0–60)
Table 2. The normal cloud models at all level of the emergency situation.
IndicatorRank
Lower Risk (1)Low Risk (2)Medium Risk (3)High Risk (4)Higher Risk (5)
C1 (level)(1, 0.333, 0.001)(3, 0.333, 0.001)(4.5, 0.167, 0.001)(6, 0.333, 0.001)(9.5, 0.833, 0.001)
C2 (knot)(0.5, 0.167, 0.001)(1.5, 0.167, 0.001)(2.5, 0.167, 0.001)(3.5, 0.167, 0.001)(6, 0.667, 0.001)
C3(95, 1.667, 0.001)(85, 1.667, 0.001)(75, 1.667, 0.001)(65, 1.667, 0.001)(30, 10, 0.001)
C4 (level)(0.5, 0.167, 0.001)(1.5, 0.167, 0.001)(3, 0.333, 0.001)(4.5, 0.167, 0.001)(7, 0.667, 0.001)
C5 (knots)(2, 0.667, 0.001)(6, 0.667, 0.001)(10, 0.667, 0.001)(14, 0.667, 0.001)(23, 2.333, 0.001)
C6 (years)(5, 1.667, 0.001)(12.5, 0.833, 0.001)(17.5, 0.833, 0.001)(22.5, 0.833, 0.001)(30, 1.667, 0.001)
C7 (tons)(250, 83.333, 0.001)(1750, 416.667, 0.001)(6500, 1166.667, 0.001)(20,000, 3333.333, 0.001)(315,000, 95,000, 0.001)
C8 (knots)(2, 0.667, 0.001)(6, 0.667, 0.001)(10, 0.667, 0.001)(14, 0.667, 0.001)(23, 2.333, 0.001)
C9 (years)(5, 1.667, 0.001)(12.5, 0.833, 0.001)(17.5, 0.833, 0.001)(22.5, 0.833, 0.001)(30, 1.667, 0.001)
C10 (tons)(315,000, 95,000, 0.001)(20,000, 3333.333, 0.001)(6500, 1166.667, 0.001)(1750, 416.667, 0.001)(250, 83.333, 0.001)
C11 (degrees)(7.5, 2.5, 0.001)(22.5, 2.5, 0.001)(37.5, 2.5, 0.001)(52.5, 2.5, 0.001)(75, 5, 0.001)
C12(95, 1.667, 0.001)(85, 1.667, 0.001)(75, 1.667, 0.001)(65, 1.667, 0.001)(30, 10, 0.001)
C13(95, 1.667, 0.001)(85, 1.667, 0.001)(75, 1.667, 0.001)(65, 1.667, 0.001)(30, 10, 0.001)
C14(95, 1.667, 0.001)(85, 1.667, 0.001)(75, 1.667, 0.001)(65, 1.667, 0.001)(30, 10, 0.001)
C15(95, 1.667, 0.001)(85, 1.667, 0.001)(75, 1.667, 0.001)(65, 1.667, 0.001)(30, 10, 0.001)
Table 3. The meaning of q i j .
ScaleDefinitionScaleDefinition
1equally important7more strongly important
3slightly important9extremely important
5strongly important2,4,6,8between two scales
Table 4. The value of RI.
Order of Matrix P23456789
RI00.580.901.121.241.321.411.45
Table 5. Subjective weights of all indicators.
The Second LevelThe Third LevelOverall Weight W
The hydrological and meteorological situation0.1C10.3180.033
C20.3180.033
C30.3180.033
C40.0460.005
ships situation0.64C50.1160.074
C60.1160.074
C70.0250.016
C80.1160.074
C90.1160.074
C100.0250.016
C110.0510.032
C120.4330.276
rescue situation0.26C130.7140.184
C140.1430.037
C150.1430.037
Table 6. Data of emergency situation after the collision in case 1.
Indicator“Hua Jinzhou”“WAN HAI 316”
C1 (level)44
C2 (knot)1.51.5
C39595
C4 (level)11
C5 (knots)153.5
C6 (years)1315
C7 (tons)27,8002986
C8 (knots)3.515
C9 (years)1513
C10 (tons)298627,800
C11 (degrees)4545
C129535
C138585
C149595
C159595
Table 7. The final combination weights.
IndicatorThe Subjective Weights w1The Objective Weights w2Combined Weights w
C1 (level)0.0330.0460.037
C2 (knot)0.0330.0910.049
C30.0330.0460.037
C4 (level)0.0050.0230.010
C5 (knots)0.0740.1370.091
C6 (years)0.0740.0820.076
C7 (tons)0.0160.1110.042
C8 (knots)0.0740.0290.062
C9 (years)0.0740.0460.066
C10 (tons)0.0160.0920.037
C11 (degrees)0.0320.0690.042
C120.2760.0460.214
C130.1840.0910.160
C140.0370.0460.039
C150.0370.0460.039
Table 8. Relevance of indicator data of “Hua Jinzhou” to each level of the cloud model. (The bold value in the table represents the final risk level of the indicator).
K i j Lower Risk (1)Low Risk (2)Medium Risk (3)High Risk (4)Higher Risk (5) m a x K i j
C1 (level)0.0000.9400.9940.9430.8380.994
C2 (knot)0.1891.0000.9190.8540.8041.000
C31.0000.9930.9660.8940.2141.000
C4 (level)0.5670.9270.7550.7440.6850.927
C5 (knots)0.0000.1350.8760.9970.9440.997
C6 (years)0.4260.9990.9630.9160.8690.999
C7 (tons)0.0000.0000.0000.8960.8270.896
C8 (knots)0.5630.9020.8050.7430.6990.902
C9 (years)0.0990.9820.9900.9460.8860.990
C10 (tons)0.5720.6390.8180.7710.0000.818
C11 (degrees)0.0000.5590.9810.9900.9270.990
C121.0000.9940.9660.8900.0171.000
C130.9951.0000.9910.9560.3021.000
C141.0000.9930.9660.8990.0911.000
C151.0000.9930.9670.8960.1851.000
Table 9. Relevance of indicator data of “WAN HAI 316” to each level of the cloud model. (The bold value in the table represents the final risk level of the indicator.).
K i j Lower Risk (1)Low Risk (2)Medium Risk (3)High Risk (4)Higher Risk (5) m a x K i j
C1 (level)0.0340.9510.9940.9480.8770.994
C2 (knot)0.0001.0000.9400.8390.7721.000
C31.0000.9930.9650.8920.0081.000
C4 (level)0.7100.9610.7790.7220.7590.961
C5 (knots)0.6020.8910.8140.7510.6710.891
C6 (years)0.4760.9790.9900.9460.8870.990
C7 (tons)0.0000.8960.9110.6860.1310.911
C8 (knots)0.0000.2780.8770.9970.9420.997
C9 (years)0.0030.9990.9690.9170.8290.999
C10 (tons)0.6910.9320.0100.0000.0000.932
C11 (degrees)0.0000.5450.9800.9890.9400.989
C120.8220.8430.8680.9040.9840.984
C130.9951.0000.9910.9530.1171.000
C141.0000.9930.9650.8970.2921.000
C151.0000.9930.9650.8970.0001.000
Table 10. Final evaluation result for “Hua Jinzhou” and “WAN HAI 316”.
Ship Name E r x Evaluation Result σ
“Hua Jinzhou”2.9083Low risk0.0004
“WAN HAI 316”3.0467Medium risk0.0008
Table 11. Data of emergency situation after the collision in case 2.
Indicator“X”“Z”
C1 (level)44
C2 (knot)22
C39595
C4 (level)0.50.5
C5 (knots)5.413
C6 (years)147
C7 (tons)139832,964
C8 (knots)135.4
C9 (years)714
C10 (tons)32,9641398
C11 (degrees)00
C129515
C137575
C149595
C159595
Table 12. Relevance of indicator data of “X” to each level of the cloud model. (The bold value in the table represents the final risk level of the indicator.).
K i j Lower Risk (1)Low Risk (2)Medium Risk (3)High Risk (4)Higher Risk (5) M a x K i j
C1 (level)0.0090.9360.9940.9460.8210.994
C2 (knot)0.0020.9340.9830.9110.8380.983
C31.0000.9930.9640.8990.0011.000
C4 (level)1.0000.7660.7920.6910.6791.000
C5 (knots)0.3230.9950.8910.8340.7240.995
C6 (years)0.2800.9940.9820.9260.8730.994
C7 (tons)0.0000.9840.7480.6960.7520.984
C8 (knots)0.0000.6330.9700.9970.9270.997
C9 (years)0.9390.8870.8600.7840.7330.939
C10 (tons)0.6940.8360.0000.0000.0000.836
C11 (degrees)0.2930.6970.6080.5990.6440.697
C121.0000.9930.9670.8980.0391.000
C130.9770.9931.0000.9890.5291.000
C141.0000.9930.9650.9000.0001.000
C151.0000.9930.9650.8990.0791.000
Table 13. Relevance of indicator data of “Z” to each level of the cloud model. (The bold value in the table represents the final risk level of the indicator.).
K i j Lower Risk (1)Low Risk (2)Medium Risk (3)High Risk (4)Higher Risk (5) M a x K i j
C1 (level)0.1690.9630.9940.9490.8040.994
C2 (knot)0.0660.9350.9770.9140.8090.977
C31.0000.9930.9660.9010.0901.000
C4 (level)1.0000.8070.7150.6860.6481.000
C5 (knots)0.0000.4420.9520.9970.8860.997
C6 (years)0.6190.8980.8390.7820.7410.898
C7 (tons)0.0000.0000.0000.8070.2410.807
C8 (knots)0.0900.9960.8840.8540.7910.996
C9 (years)0.2500.9930.9810.9200.8760.993
C10 (tons)0.2970.6110.5460.9860.0000.986
C11 (degrees)0.7290.5630.6350.6130.5830.729
C120.6970.7050.7090.7580.9510.951
C130.9790.9931.0000.9880.3151.000
C141.0000.9930.9660.9000.0891.000
C151.0000.9930.9670.9020.0401.000
Table 14. Final evaluation result for “X” and “Z”.
Ship Name E r x Evaluation Result σ
“X”2.8844Low risk0.0029
“Z”3.0758Medium risk0.0037
Publisher’s Note: MDPI stays neutral with regard to jurisdictional claims in published maps and institutional affiliations.

