Article

Cavitation of Multiscale Vortices in Circular Cylinder Wake at Re = 9500

National Research Center of Pumps, Jiangsu University, Zhenjiang 212013, China
*
Author to whom correspondence should be addressed.
J. Mar. Sci. Eng. 2021, 9(12), 1366; https://doi.org/10.3390/jmse9121366
Submission received: 13 October 2021 / Revised: 8 November 2021 / Accepted: 15 November 2021 / Published: 2 December 2021
(This article belongs to the Section Ocean Engineering)

Abstract

:
Cavitation characteristics in the wake of a circular cylinder, which contains multiscale vortices, are numerically investigated via Large Eddy Simulation (LES) in this paper. The Reynolds number is 9500 based on the inlet velocity, the cylinder diameter and the kinematic viscosity of the noncavitation liquid. The Schneer–Sauer (SS) model is applied to cavitation simulation because it is more sensitive to vapor–liquid two-phase volume fraction than the Zwart–Gerber–Belamri (ZGB) model, according to theoretical analyses. The wake is quasiperiodic, with an approximate frequency of 0.2. It is found that the cavitation of vortices could inhibit the vortex shedding. Besides, the mutual aggregation of small-scale vortices in the vortex system or the continuous stripping of small-scale vortices at the edge of large-scale vortices could induce the merging or splitting of cavities in the wake.

1. Introduction

Vortex cavitation [1] is a common physical phenomenon in hydraulic machines, and it usually occurs at the inlet [2] and the draft tube [3,4] of the hydraulic machinery, and the tail of the blade, such as pump impeller [5] and marine propeller [6,7,8]. Cavitation could cause pressure fluctuation [9,10], uneven load distribution, hydrodynamic noise [11] and erosion [12], which seriously reduce the operation efficiency of the hydraulic machine. Therefore, it is very urgent to learn about the characteristics of vortex cavitation. However, it is at great cost to study the vortex cavitation in the hydraulic machinery because the real flow models are very complex. Therefore, it is a better choice to obtain the multiscale vortices in a simple flow model. Fortunately, the flow over a circular cylinder is not only simple in structure, but also has rich vortical structures in the wake at a high Reynolds number. It is an ideal model to investigate the vortical cavitation. Studies of the flow over a circular cylinder are abundant in the literature, because this flow is common in the engineering [13,14,15,16]. Researchers found the inception of cavities occurs in the shear layer via the high-speed imaging at Re = 64,000 [17]. Besides, the volume fraction of vapor in the wake increases with the decreased cavitation number, and the pressure in the cavitation region fluctuates [18]. In the noncavitating flow region, the increase in the Reynolds number will reduce the vortex region behind the cylinder by more than twofold, resulting in the displacement of the downstream separation angle. In addition, cavitation increases the vortex area behind the cylinder and displaces the upstream separation angle [19]. Though the experimental observations could help us understand the flow phenomena, the cost is expensive and they do not provide the internals of the flow system in detail. Numerical simulations are alternative methods to investigate the flow characteristics [20]. Researchers have found that the cavitation has a significant impact on the vortex-shedding characteristics through numerical simulations and experiments [21]. The vibration acting on the cylinder might decrease and eventually disappear with the developments of cavitation, but further cavitation could produce a longer vapor area near the cylinder and form a vortex street further away from the cylinder [22]. Compared with the results of the non-cavitating flow, the vortex cavitation could suppress the three-dimensional instability of Kármán vortices because it reduces the effective Reynolds number [23].
As we know, there exist multiscale vortical structures in the cylinder wake at high Reynolds numbers, and only Direct Numerical Simulation (DNS) could capture all scales of vortical structures, but the high Reynolds numbers may make DNS prohibitively expensive. Large Eddy Simulation (LES) is an alternative computational method. It resolves larger-length scales and models the small unresolved scales to account for the interscale interaction between the resolved and unresolved scales, so it is computationally cheaper than DNS, and viable for practical complex flows [24]. In addition, an appropriate cavitation model should be chosen for the cavitation simulation. In the numerical simulation of airfoil cavitation, the Schnerr–Sauer (SS) [25] cavitation model is better than the Zwart–Gerber–Belamri (ZGB) [26] cavitation model [27]. However, for the simulation of a multiscale, vortex-cavitation flow field around a cylinder, whether the SS model is still better requires further study. Moreover, the interactions between vortical evolution and cavitation are not clear from current studies on vortical cavitation [22]. In this paper, the cavitation of multiscale vortices in the cylinder wake are investigated. The Reynolds number based on the inlet velocity, the cylinder diameter and the kinematic viscosity of the noncavitation liquid is 9500, because the wake has multiscale vortices at this Reynolds number [28,29], and the former research results at this Reynolds number [30] could be adopted for numerical validation. Besides, the effects of SS and ZGB models on cavitation as well as the interactions between the vortical evolution and cavitation may be discussed.

2. Methodology

2.1. Governing Equations

It is assumed that the flow field is a single mixed medium composed of liquid and vapor phases, and each phase fluid has the same pressure and velocity. A cavitation numerical model based on the single fluid mixture model is constructed. The flow field satisfies Navier–Stokes equations which contains the continuity equation:
t ( ρ m ) + ( ρ m u ) = 0 ,
and the momentum equation:
t ( ρ m u ) + u m ( ρ m u ) = p + μ m 2 u ,
where ρ m = α v ρ v + ρ l ( 1 α v ) is the mixed density and μ m = α v μ v + μ l ( 1 α v ) is the mixed dynamic viscosity. α represents the volume friction, and the subscripts v and l represent the vapor and liquid, respectively.
LES utilize Navier–Stokes equations to carry out filtering in a small-space area, and divides the turbulent flow into large-scale motion and small-scale motion. The momentum equation after filtering could be rewritten as follows:
t ( ρ m u ¯ ) + u ¯ ( ρ m u ¯ ) = p ¯ + μ m 2 u ¯ τ .
where the overbar donates the filter and τ is the Subgrid Scale (SGS) stress tensor, which satisfies
τ i j = ρ m ( u i u j ¯ u ¯ i u ¯ j ) ,
and could be computed as follows
τ i j 1 3 τ k k δ i j = 2 μ sgs S ¯ i j ,
in which   μ s g s is the subgrid eddy viscosity and S ¯ i j is the strain rate tensor of the large scale or resolved field.

2.2. Cavitation Models

The cavitation could be modelled by the following mass-transfer equation:
t ( α v ρ v ) + ( α v ρ v u ) = m e m c ,
where m e and m c are the source terms of vaporization and condensation, respectively. m e and m c   have different descriptions in different cavitation models, such as Schnerr–Sauer (SS) cavitation model:
{ m e = 3 ρ v ρ l ρ m α v ( 1 α v ) R B 2 | P v P | 3 ρ l       (   P P v   )   m c = 3 ρ v ρ l ρ m α v ( 1 α v ) R B 2 | P P v | 3 ρ l       (   P P v   )   ,
and the Zwart–Gerber–Belamri (ZGB) cavitation model:
{ m e = F v a p 3 α n u c ( 1 α v ) ρ v R B 2 | P v P | 3 ρ l (   P P v   )   m c = F cond   α v ρ v R B 2 | P P v | 3 ρ l (   P P v   )   .
In fact, the SS cavitation model is based on the bubble dynamics and the nucleus radius. In Equation (7), the relationship between the nucleus radius RB, the volume fraction α and the nucleus number density n satisfies R B = ( ( α v / ( 1 α v ) ) ( 3 / 4 π n ) ) 1 / 3 , where n is the given empirical constant and the default value is   n = 1 × 10 13 . The ZGB model is based on the assumption that the cavitation bubbles do not influence each other and that the vapor core density decreases with the increase in the vapor volume fraction. In Equation (8), m e and m c represent the source terms of vapor generation and condensation, respectively. The radius of the vapor core R B is 10 6 m, the volume fraction α n u c at the nucleation location is 5 × 10 4 , the evaporation coefficient F v a p is 50, and the condensation coefficient F c o n d is 0.01. The usability of the two cavitation models will be discussed in the follow parts.

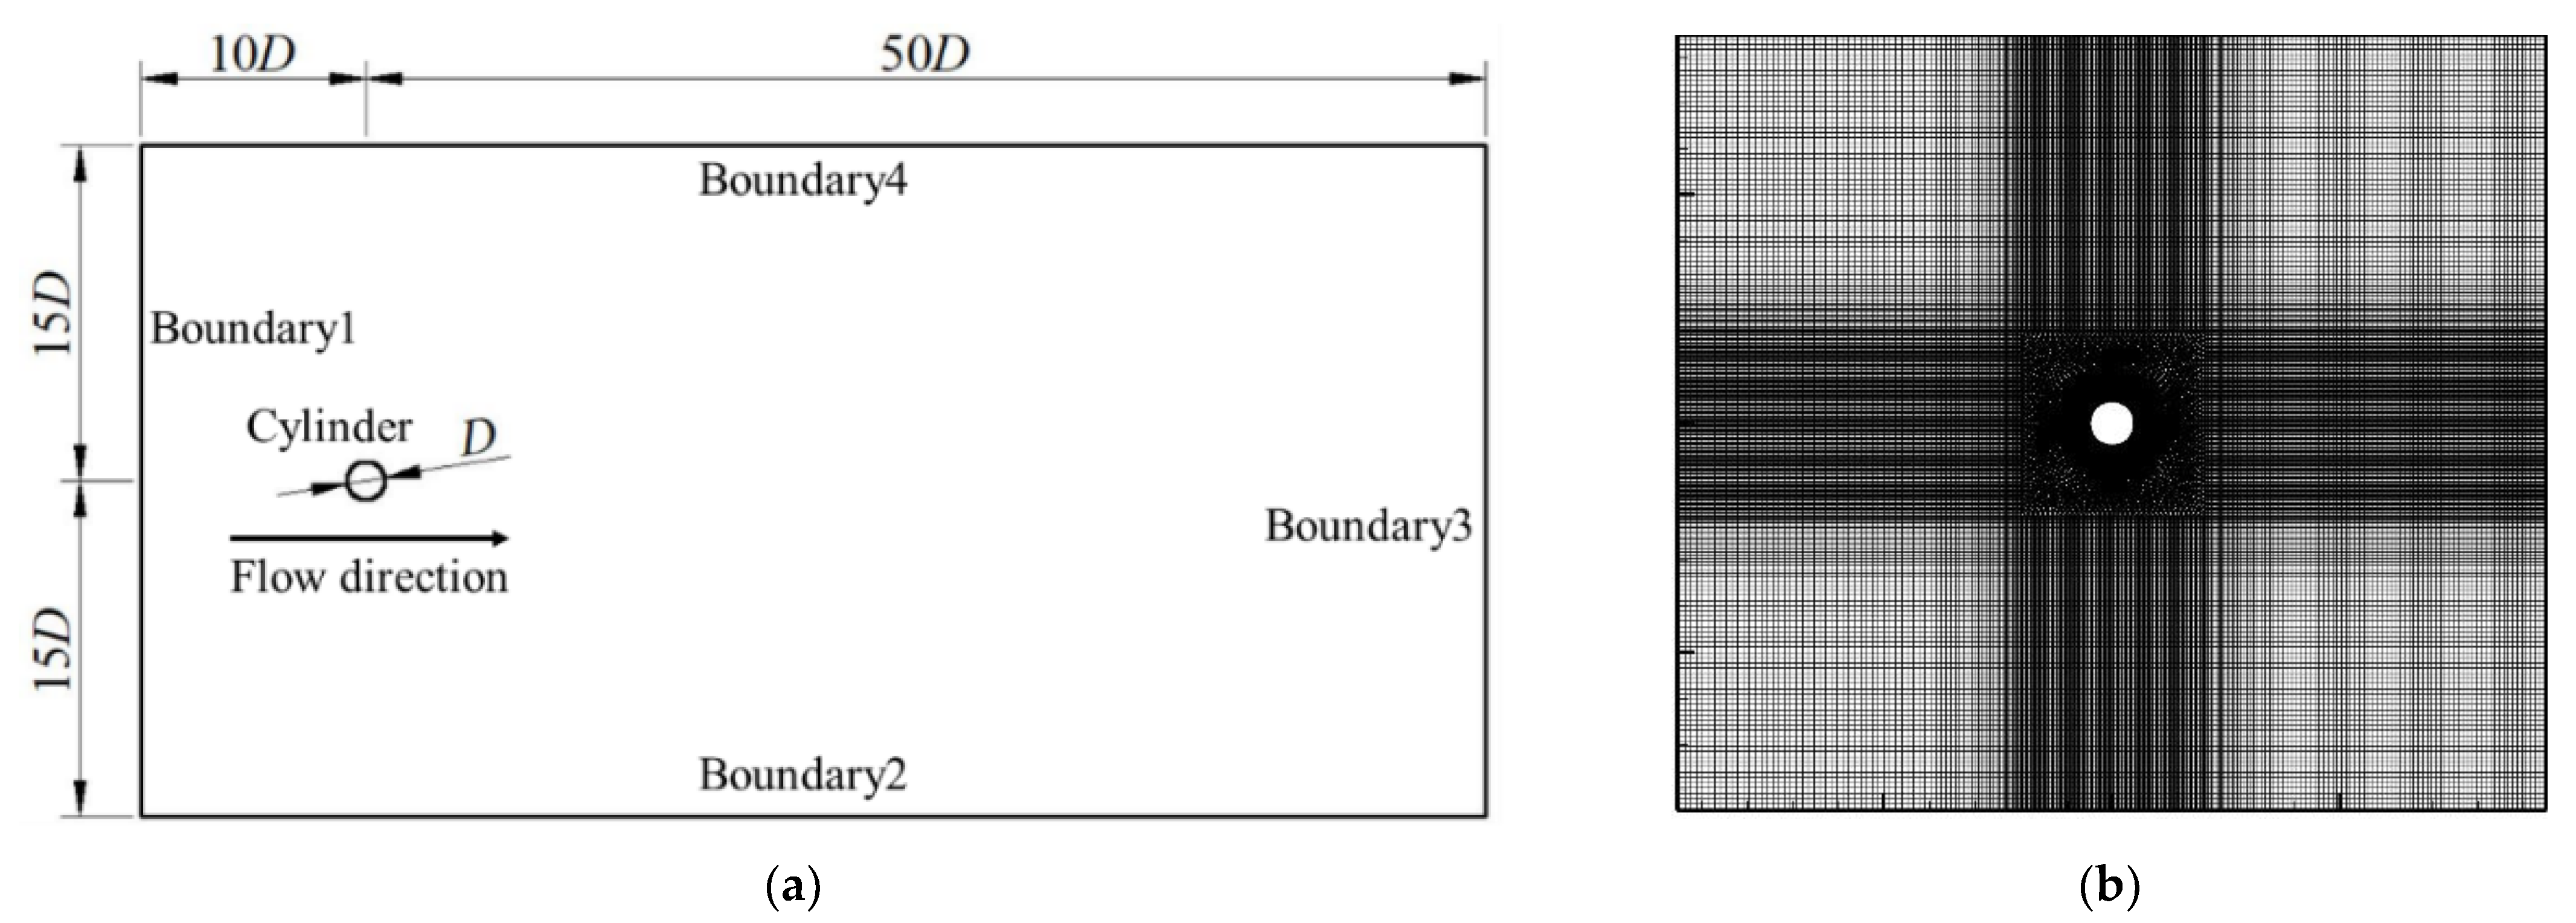
3. Mesh and Validation

The computational model is shown in Figure 1. As shown in Figure 1a, the cylinder diameter D is 9.5 mm, and the two-dimensional computational domain is 60D × 30D with an upstream dimension 10D and a downstream dimension 50D. The computational domain adopts the structured grids to improve the simulation accuracy. The area around the cylinder adopts O-type grids. Meanwhile, the cylinder surface and wake region are locally refined. The total number of grids is about 336,000 and the wall y+ value is less than 4.6.
In this paper, Fluent 2020 R2 is employed for numerical simulation. Boundary 1 of the computational domain is set as a velocity inlet, and the inlet velocity is 1 m/s. Boundary 3 is set to outlet vent. Boundary 2 and Boundary 4 of the computational domain are set as the specified shear force condition, and the shear force is 0, that is, the motion of the fluid attached to the wall is not affected by the wall. The cylinder wall is set as no slip wall. The ambient pressure is set to one standard atmosphere. The Subgrid-Scale model [31] is Smagorinsky-Lilly. The solution method adopts pressure base solver and a coupled pressure–velocity coupling algorithm. The pressure dispersion mode is second-order discrete mode, and the momentum equation is discrete by finite central difference scheme [32]. The convergence standard of all residuals is 10 6 . The fluid medium is water and vapor, in which the density of water is 1000 kg/m3, the dynamic viscosity is 0.001 Pa·s, and the saturated vapor pressure is 3540 Pa. The cavitation number is defined as σ = 2 ( p p v ) / ρ l u 2 where p is the reference pressure, p v is the saturated vapor pressure, and u is the inlet velocity. It should be mentioned that in the following analyses, all parameters shown in the figures are nondimensionalized via the cylinder diameter, the inlet velocity and their ratio.
Figure 2 shows the lift coefficient and related amplitude spectrum. The results are achieved via the high-accuracy vortex method [30] and LES adopted in this paper. It could be found that the amplitude of the lift coefficient from LES is similar to that of the vortex method. The main frequencies distribute around f * = 0.2 for the results from both methods. In other words, the wake at R e = 9500 is also quasiperiodic. The profiles in Figure 2 illustrate that the algorithm adopted in this paper is validated.

4. Results and Discussions

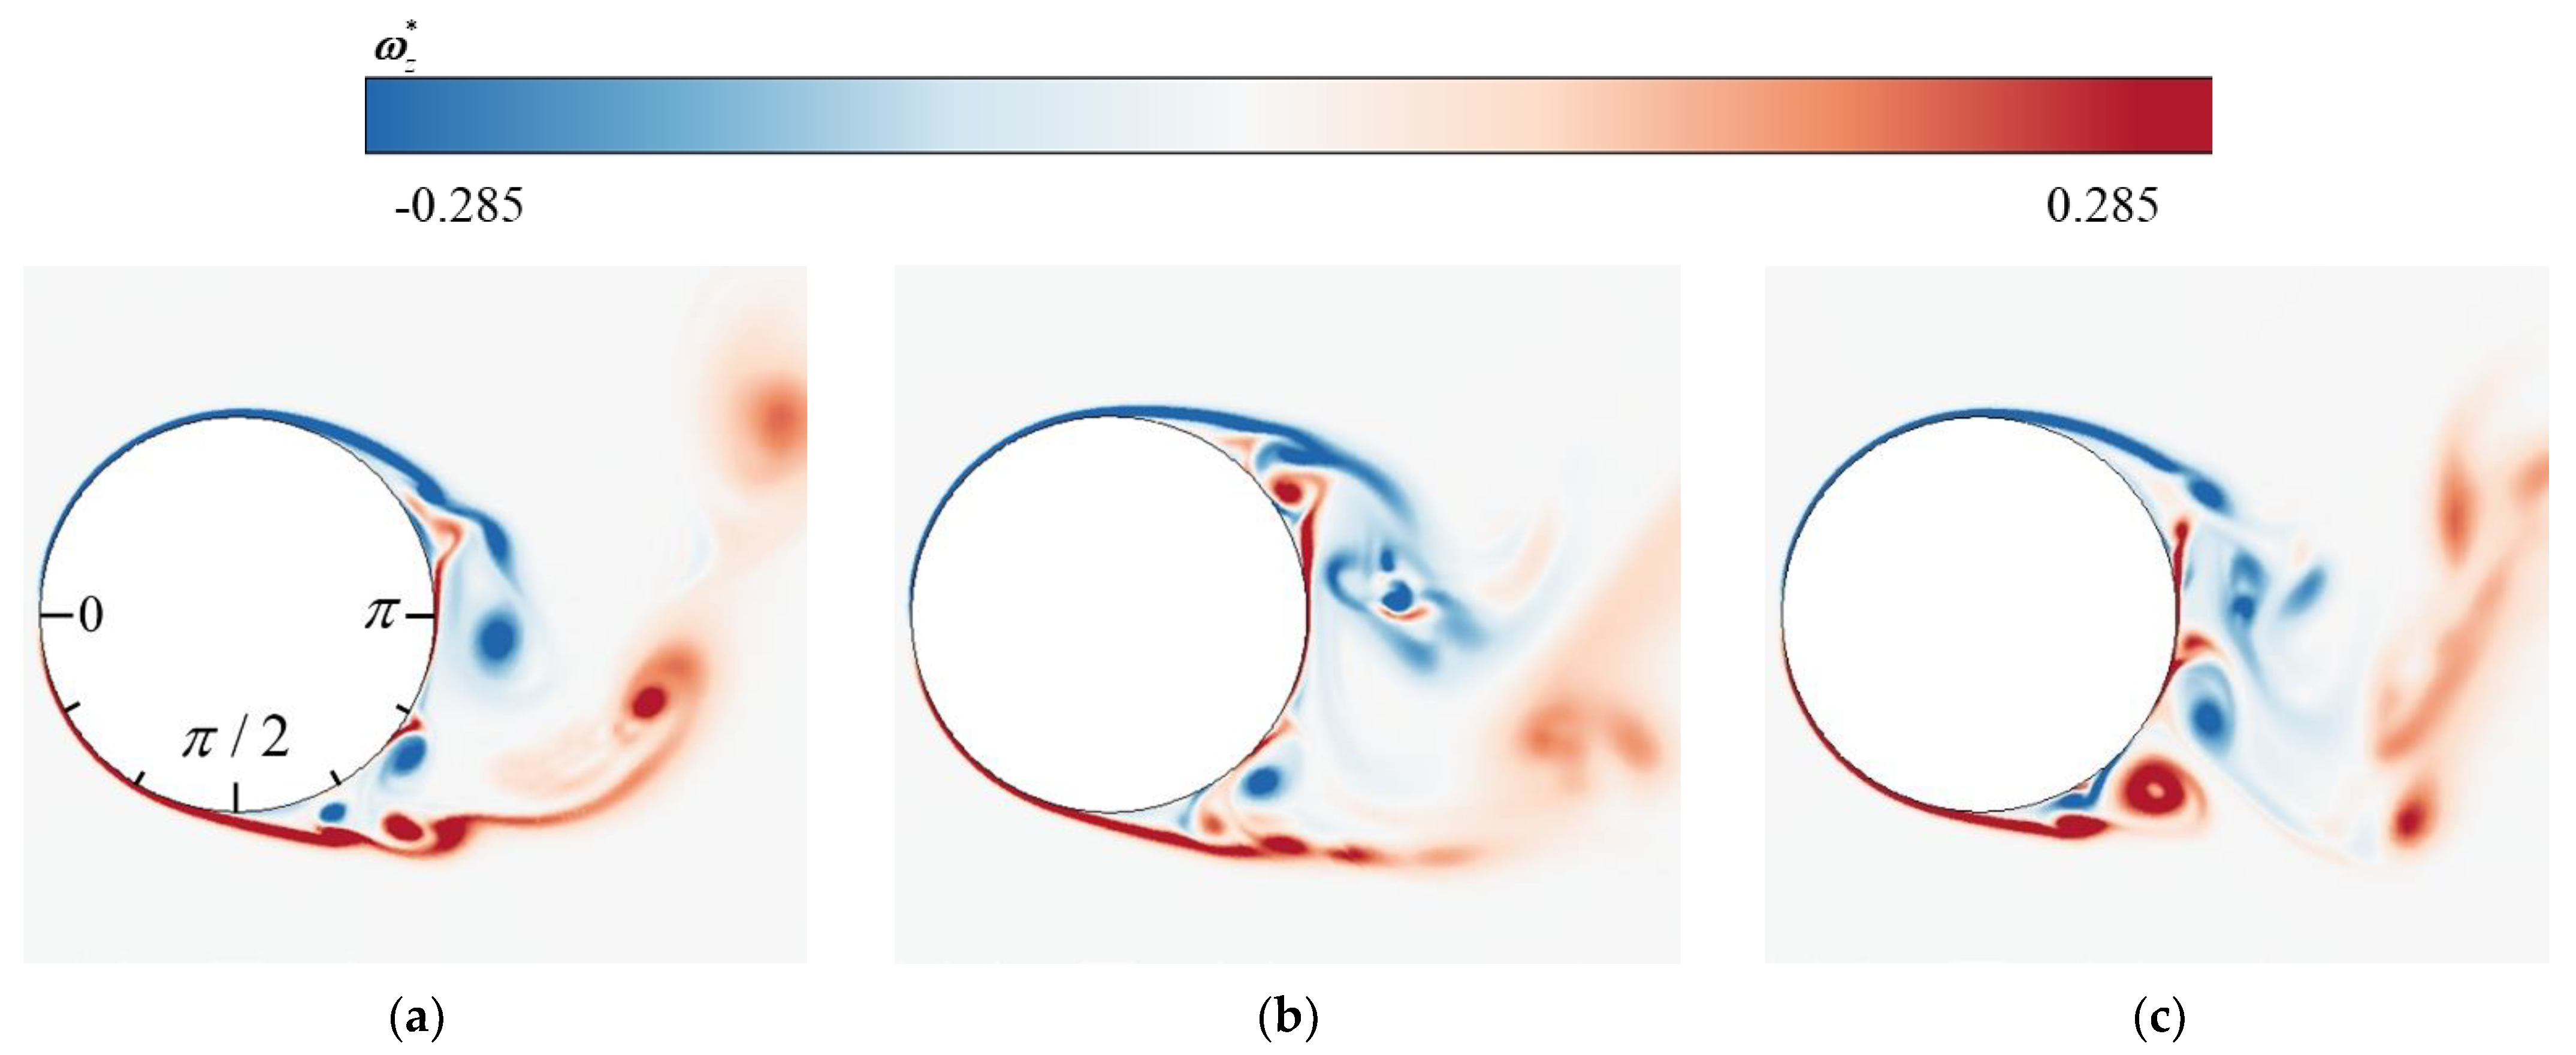
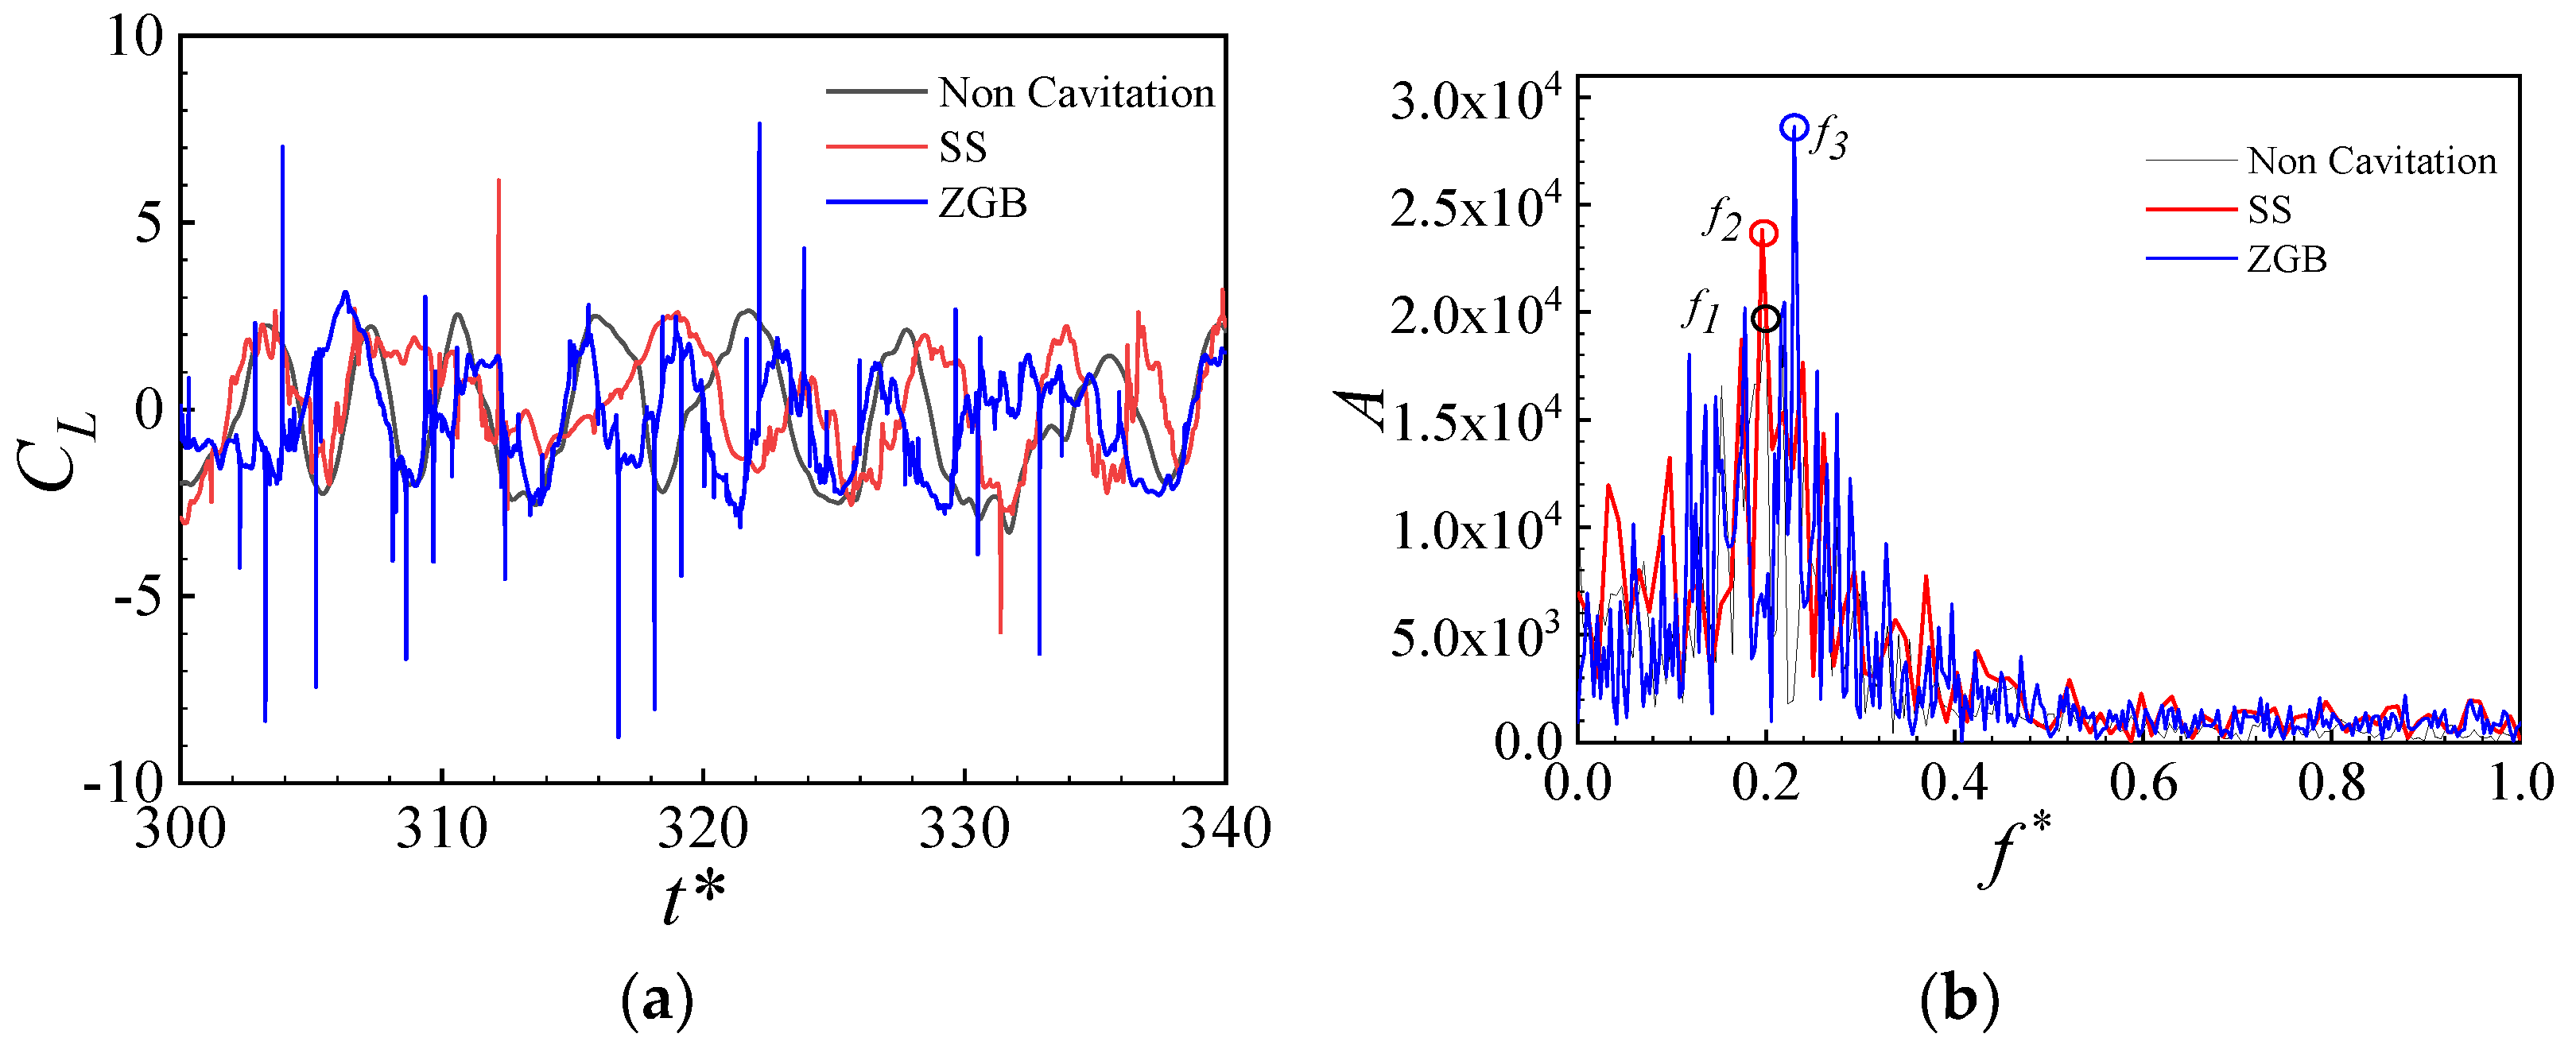
4.1. Effects of Cavitation Models on Vortical Cavitations

Figure 3 shows the vorticity distributions in the wake for different cases. It can be clearly seen that multiscale vortices occur in the wake for both cavitation and noncavitation cases. Compared with the vortical structures for the noncavitation case, the vortical structures for cavitation cases are seriously deformed. Though the separation points on the lower surface of the cylinder are similar to each other, the separation points on the upper surface are quite different. For the noncavitation case, it could be found that the separation point on the upper surface of the cylinder is closer to the trailing edge, and the included angle between the separation direction and the mainstream direction is larger. For the cavitation cases, the position of the flow separation point is more forward than that without cavitation. Moreover, the separation point for the SS model is closer to the front than that for the ZGB model. Therefore, the angle between the separation direction and the mainstream direction is smaller. The reason for these differences lies in the presence of cavitating flow in the wake flow field, which interacts with the vortices, leading to changes of the flow separation point. Comparing Figure 3b with Figure 3c, it can be found that the vortical structures for different cavitation models are also quite different, thus the applicability of the two cavitation models should be discussed.
Figure 4 shows the lift coefficient of the cylinder and related amplitude spectrum for three cases. The amplitudes of the lift coefficients are similar to each other in Figure 4a. It can be seen that the lift coefficient may suddenly increase at some time for the cavitation cases. This phenomenon is mainly attributed to the sudden changes in the pressure and viscous force on the cylinder, due to cavitating flow compressing and decelerating the upstream fluid. The amplitude spectrums of the lift coefficient curves are reported in Figure 4b. The main frequencies for the maximum amplitudes are located near f * = 0.2 for all three cases. The dominant frequency of vortex shedding for noncavitation is about 0.2, while the dominant frequency of vortex shedding for the SS model and ZGB model are 0.196 and 0.23, respectively. The relationship between the dominant frequencies is f2 < f1 < f3. In former investigations, researchers found the frequency corresponding to vortex shedding may gradually decrease with the occurrence of cavitation [33]. Therefore, the SS model may be more available than the ZGB model for vortical cavitation in this paper, according to the numerical results. This is consistent with the conclusion stated in [27], which reported the comparative study of cavitation numerical simulations on a two-dimensional hydrofoil.
As mentioned above, the SS model is based on the bubble dynamics and the vapor core radius, while the ZGB model is based on the assumption that the cavitation bubbles do not affect each other and the vapor core density decreases with the increase in vapor volume fraction. The evaporation mass-transfer rate and condensation mass-transfer rate of the SS model and ZGB model are compared to obtain Equations (9) and (10):
m e S S m e Z G B ~ a ( b + α l α v ) ( α v α l ) 1 / 3 .
m c S S m c Z G B ~ c ( d + α v α l ) ( α v α l ) 1 / 3 .
where a, b, c and d are the ratios of constants in Equations (7) and (8), respectively. The remaining variables are only α v and α l . Assuming that the vapor phase volume fraction α v at the cavitating vortex boundary is 0.1, the range of α v at the primary cavitation location is [0,0.1]. Let β = α v / α l , then β [ 0 , 1 / 9 ] . So, the denominators in Equations (9) and (10) could be rewritten as f ( x ) = β 1 / 3 ( b + 1 / β ) and g ( x ) = β 1 / 3 ( d + β ) . We could find that f ( x ) is a monotonic decreasing function while g ( x ) takes a contrary variation in the interval of [0,1/9]. Once the cavitation occurs, β gradually increases with the growth of α v , thereby f ( x ) gradually decreases thus increasing the ratio of evaporation mass-transfer rate. However, β may gradually decrease in the process of cavitation condensation owing to the decrease in α v , and g ( x ) also decreases thus increasing the ratio of condensation mass-transfer rate. This change regulation demonstrates that the cavity volume achieved via the SS model is larger than that of ZGB in the process of cavitation initiation, while it is smaller than that of ZGB in the process of void condensation. In other words, the SS model is more sensitive to the vapor–liquid two-phase volume fraction than the ZGB model. Therefore, the subsequent analyses of vortical cavitation are based on the results calculated via the SS model.

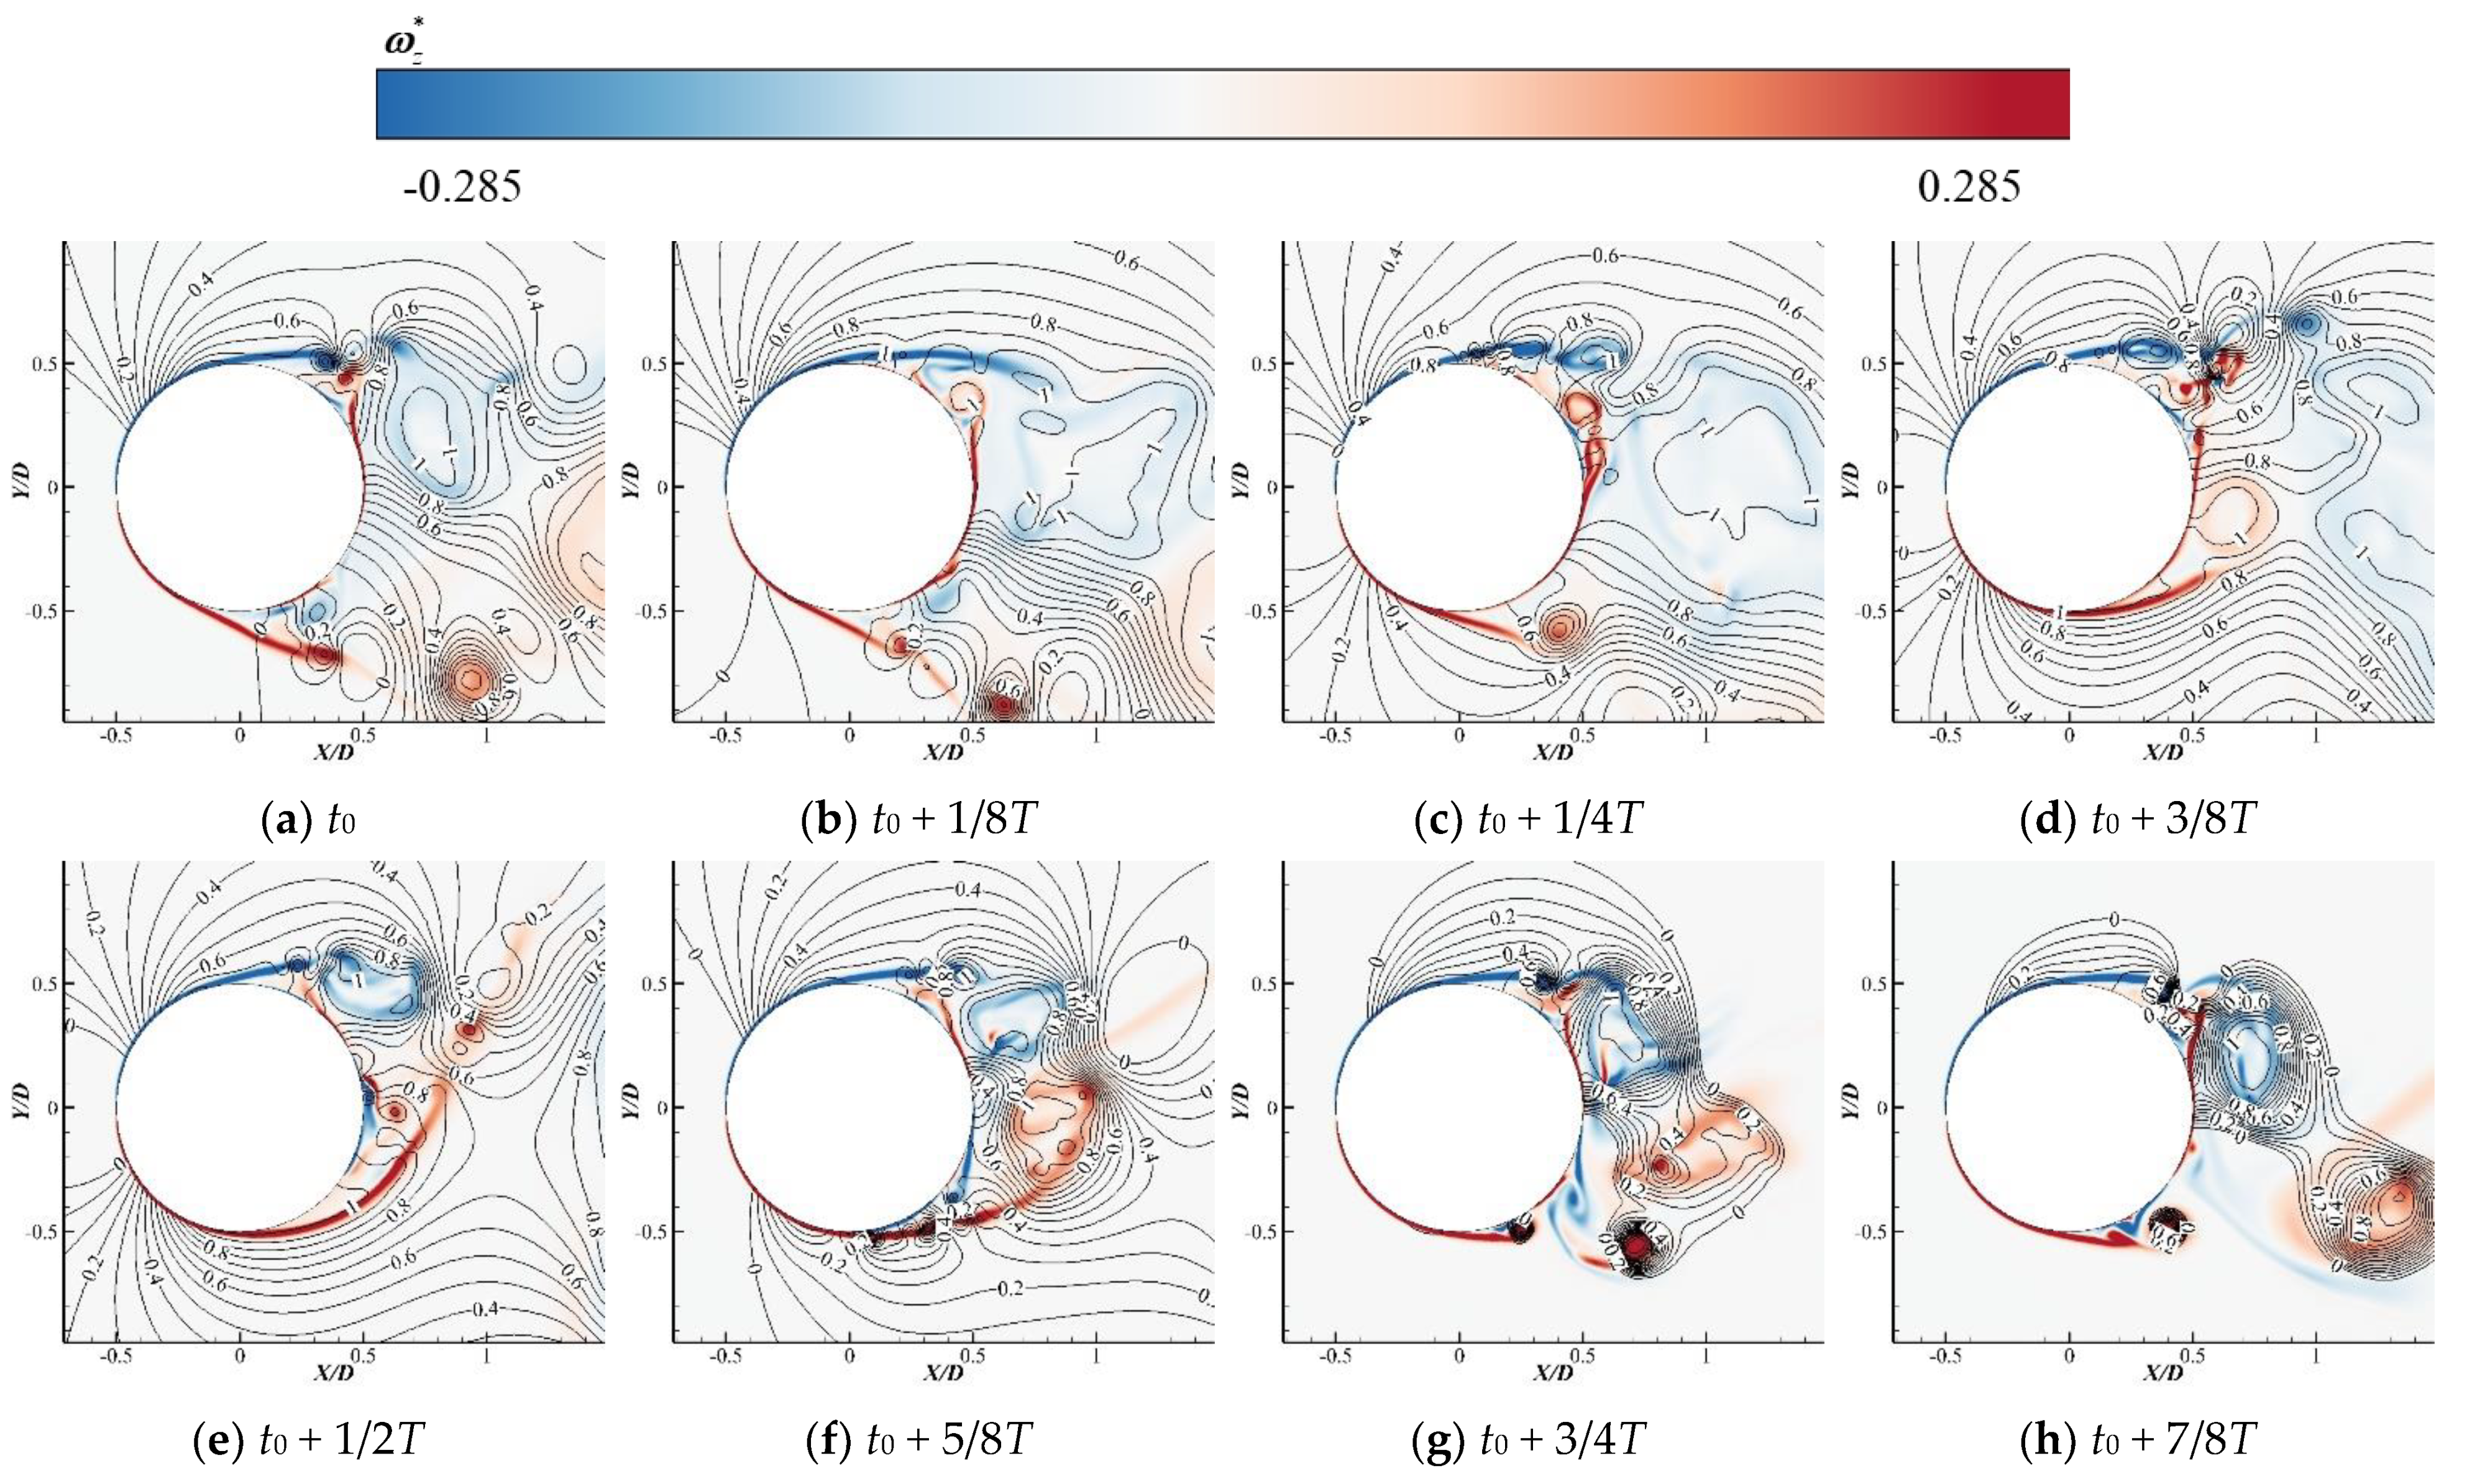
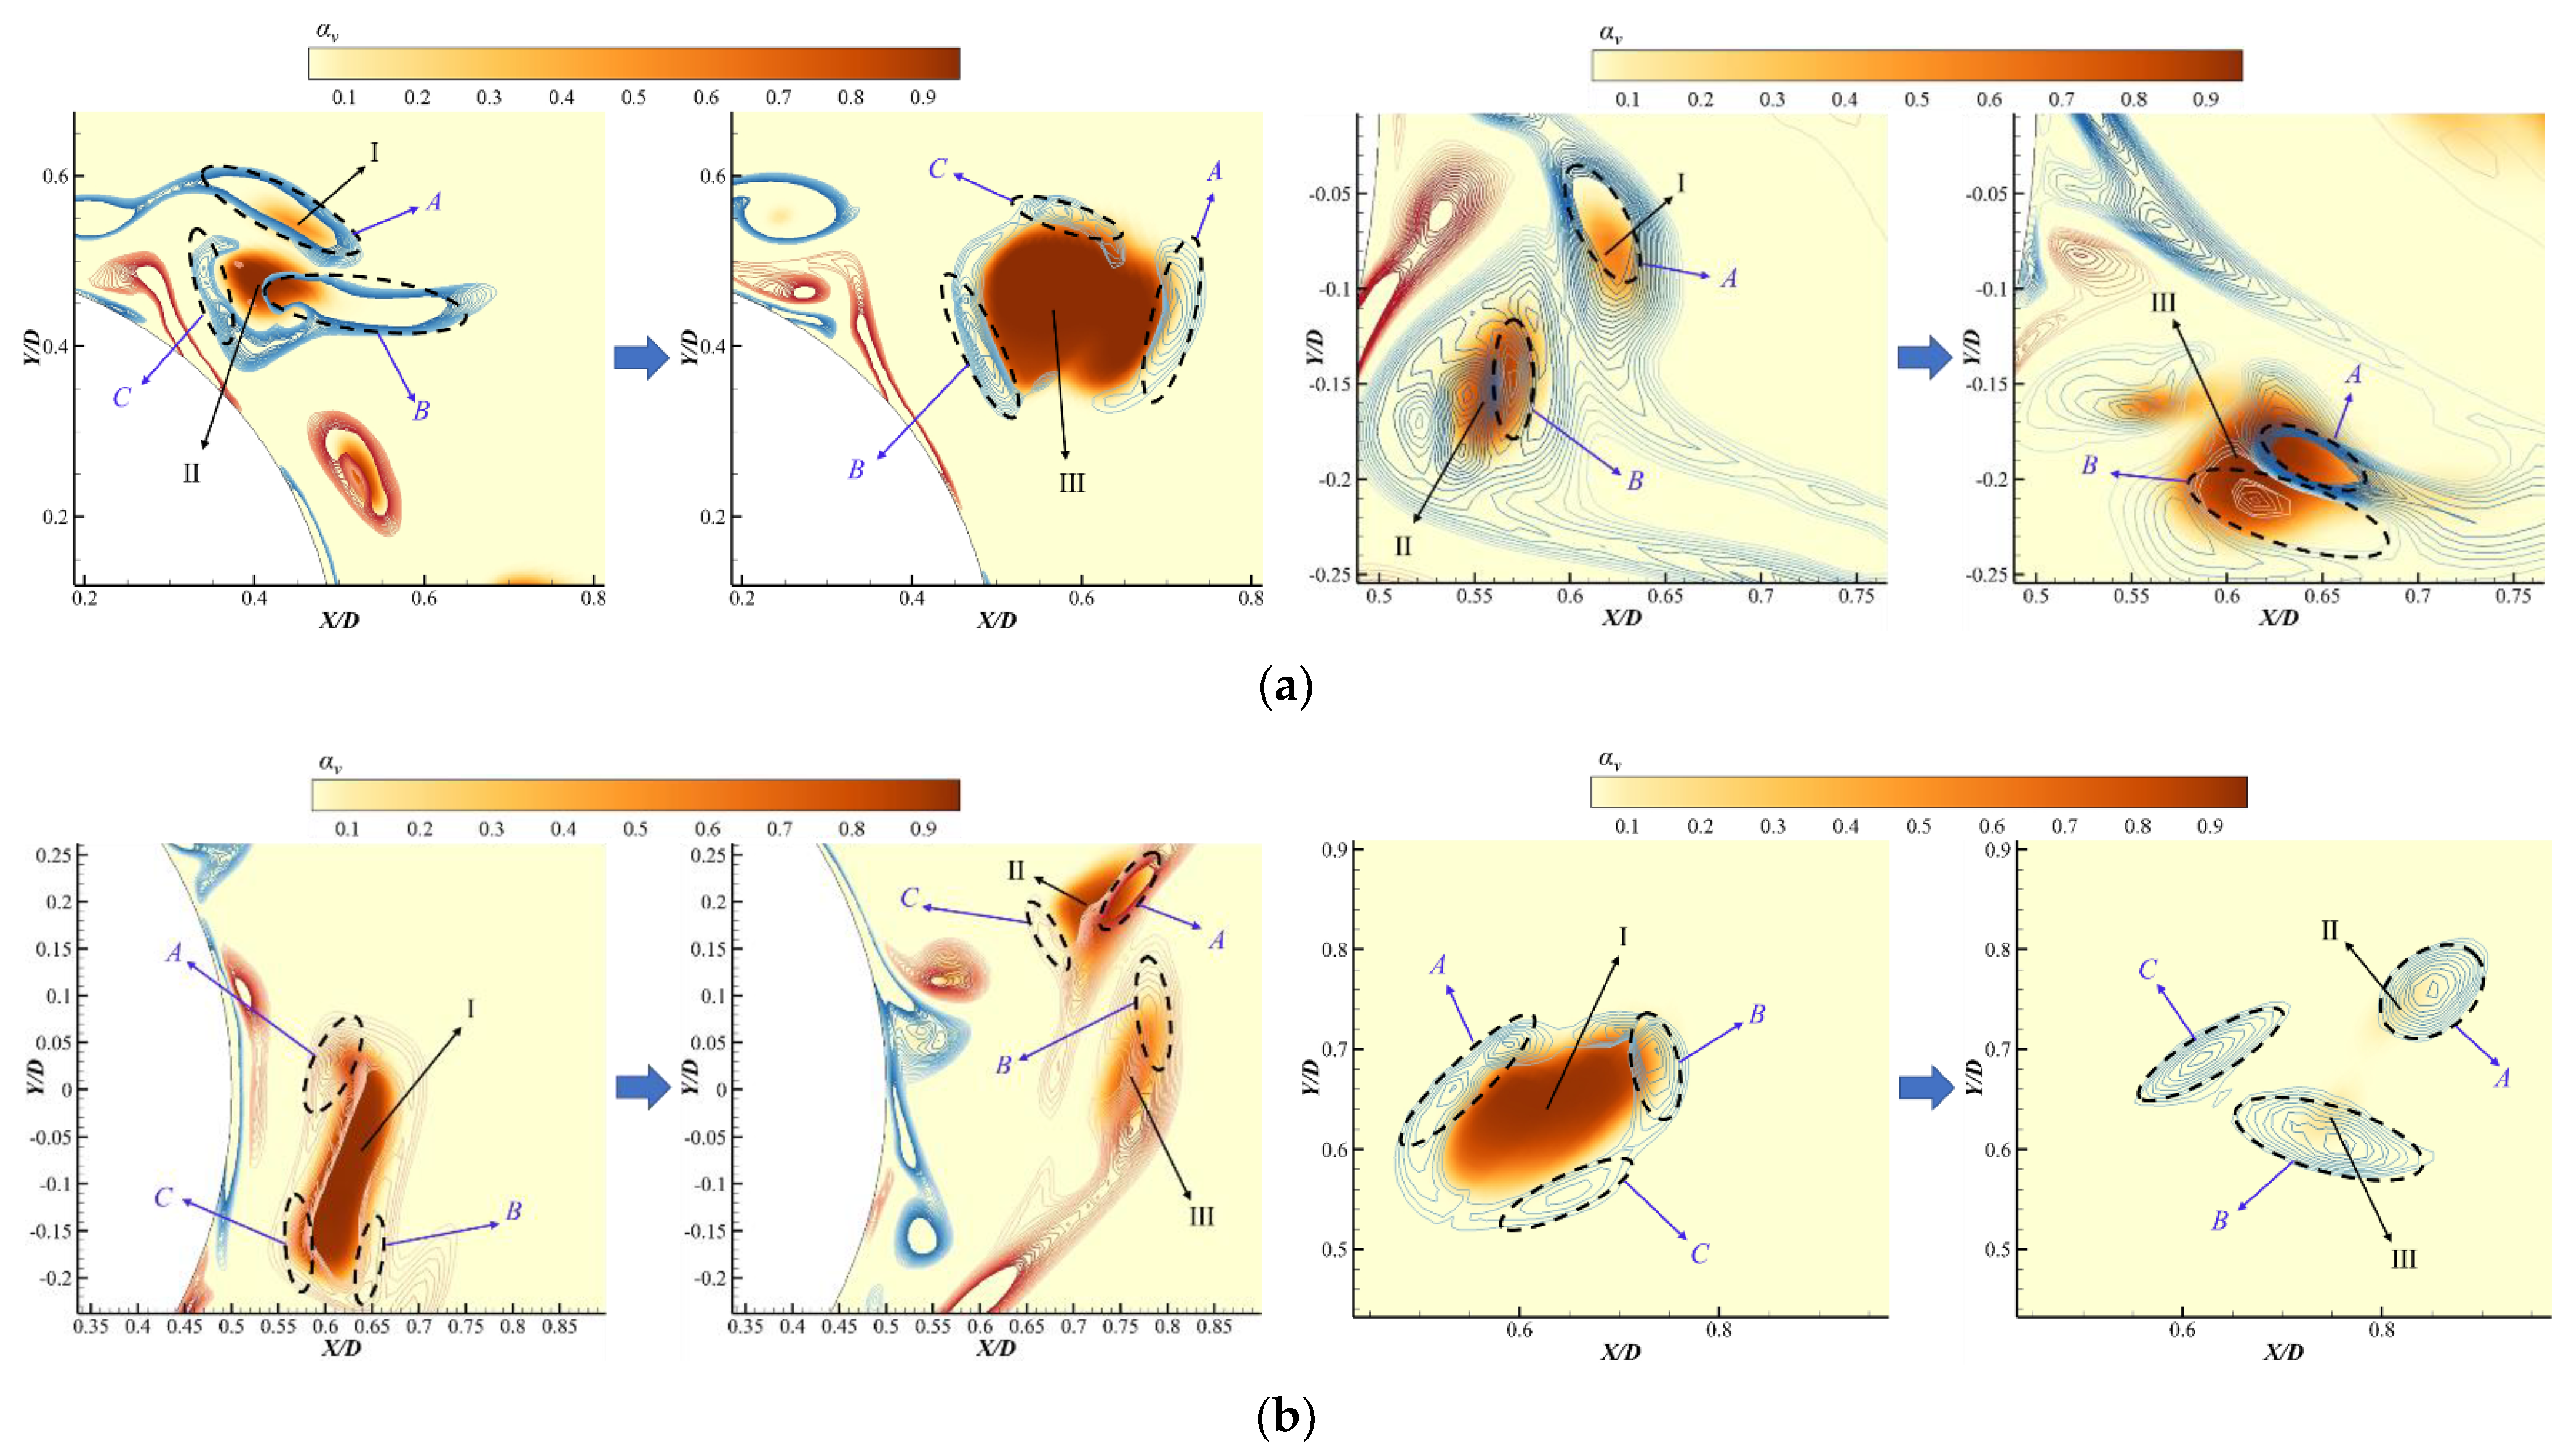
4.2. Characteristics of Quasiperiodic Vortical Structures

Evolutions of the cavitating vortices for the cavitation numbers of σ = 2.92 in a quasiperiod are shown in Figure 5. The contour is colored by the spanwise vorticity. The isolines denote the nondimensional pressure obtained by the equation p * = ( p p ) / ( p p v ) where p represents the absolute pressure in the flow field. The nondimensional pressure indicates the pressure drop. p * > 1 means cavitation occurs while p * < 1 demonstrates that there is no cavitation. It can be found that the wake contains multiscale complex vortices, and the maximum pressure drop always appears in the center part of the vortex. The fluid in the center part of the vortex could be transported outside due to the centrifugal force induced by the vortical rotation, hence the pressure at the center of the vortex may decrease. Once the pressure at the center of the vortex drops below the saturation vapor pressure at the corresponding temperature of the liquid, cavitation occurs. Thus, the cavities always firstly appear at the vortex center, and then develop, fuse and collapse with the evolution of multiscale vortices.
Figure 6 and Figure 7 show the evolution of cavitating vortices and nondimensional pressure in a quasiperiod with cavitation number 2.52 and 2.12. Comparing the wake structures of the three cavitation numbers, it can be seen that the area of the low-pressure region in the wake increases significantly with the decreasing cavitation number and is closer to the cylinder surface. Meanwhile, the separation point moves upstream at a smaller cavitation number because the cavitation area increases with the decreasing cavitation number. In other words, the cavitation at a smaller cavitation number could enhance the inhibiting effects on the vortex shedding, thus causing a large number of primary vortices to accumulate on the cylinder surface, inducing a further pressure decrease near the cylinder surface. Therefore, some cavities appear on the cylinder surface, grow up and fall off with the vortical evolutions. Moreover, the vortical intensity also decreases with the cavitation number, and the deformations of vortical structures under the extrusion of cavitation flow become more intense, leading to more abnormal cavitation shapes. However, the cavitation still appears in the vortex center at first, and then develops with the vortical evolution. It could be found that the evolution characteristics of the vortical evolution at different cavitation numbers are similar to each other, hence we mainly discuss the vortical evolution at cavitation number 2.92 in the following analyses.
The periodic shedding and unstable flow of vortex cavitation will lead to drastic changes in cavitation morphology, and will significantly enhance the local vorticity distribution which will have a significant impact on the evolution of vortex structure. In this paper, the vortex transport equation is introduced to analyze the wake flow field.
ω t = ω u u ω + ρ m × p ρ m 2 ρ m × μ m 2 u ρ m 2 + μ m 2 ω ρ m
The left-hand side of Equation (11) represents the growth rate of the vorticity. The first term in the right-hand side of Equation (11) is the tensile distortion term. The second term is the expansion and contraction term. The third term is the baroclinic moment term, and the last two terms are viscous dissipation terms. The stretch distortion term could cause the stretching and deformation of vortical structures due to the velocity gradient. The expansion and contraction term may reflect the impacts of the expansion or contraction of fluid on the vorticity. The baroclinic moment term is mainly caused by the non-parallelism between pressure and gradient. The viscous dissipation terms refer to the gradual dissipation of vorticity due to fluid viscosity. As the calculation model in this paper is two-dimensional, the first term in the right-hand side of Equation (11) equals zero. The expansion contraction term is an important vorticity source in cavitation flows because it is proportional to the interphase mass-transport velocity [34]. Moreover, the density gradient of the mixture and the pressure gradient in the cavitation flow are not always parallel to each other [35], so the baroclinic moment term also could cause the increase of vorticity.
Figure 8 shows the distributions of the vapor phase volume fraction, the vortex expansion and contraction term distribution, the baroclinic moment term and the vortex viscosity dissipation term. It could be observed that the areas of the expansion and contraction term are larger than the other two terms. The baroclinic moment term mainly focuses on the vapor-liquid interface and plays a mass-transfer role. The baroclinic moment term is very important for the vorticity generation with cavitation. The viscous dissipation terms mainly distribute at the interface between the vapor and liquid because phases take intense changes near the interface. Besides, the velocity gradient between the vortex center and the vortex edge is very large, resulting in large shear stress in this region, which leads to the increase in viscous force at the vapor–liquid interface. Therefore, in the process of vortex cavitation, the viscous dissipation term is not negligible, and the viscous dissipation term has a certain influence on the formation of bubbles in the process of cavitation.

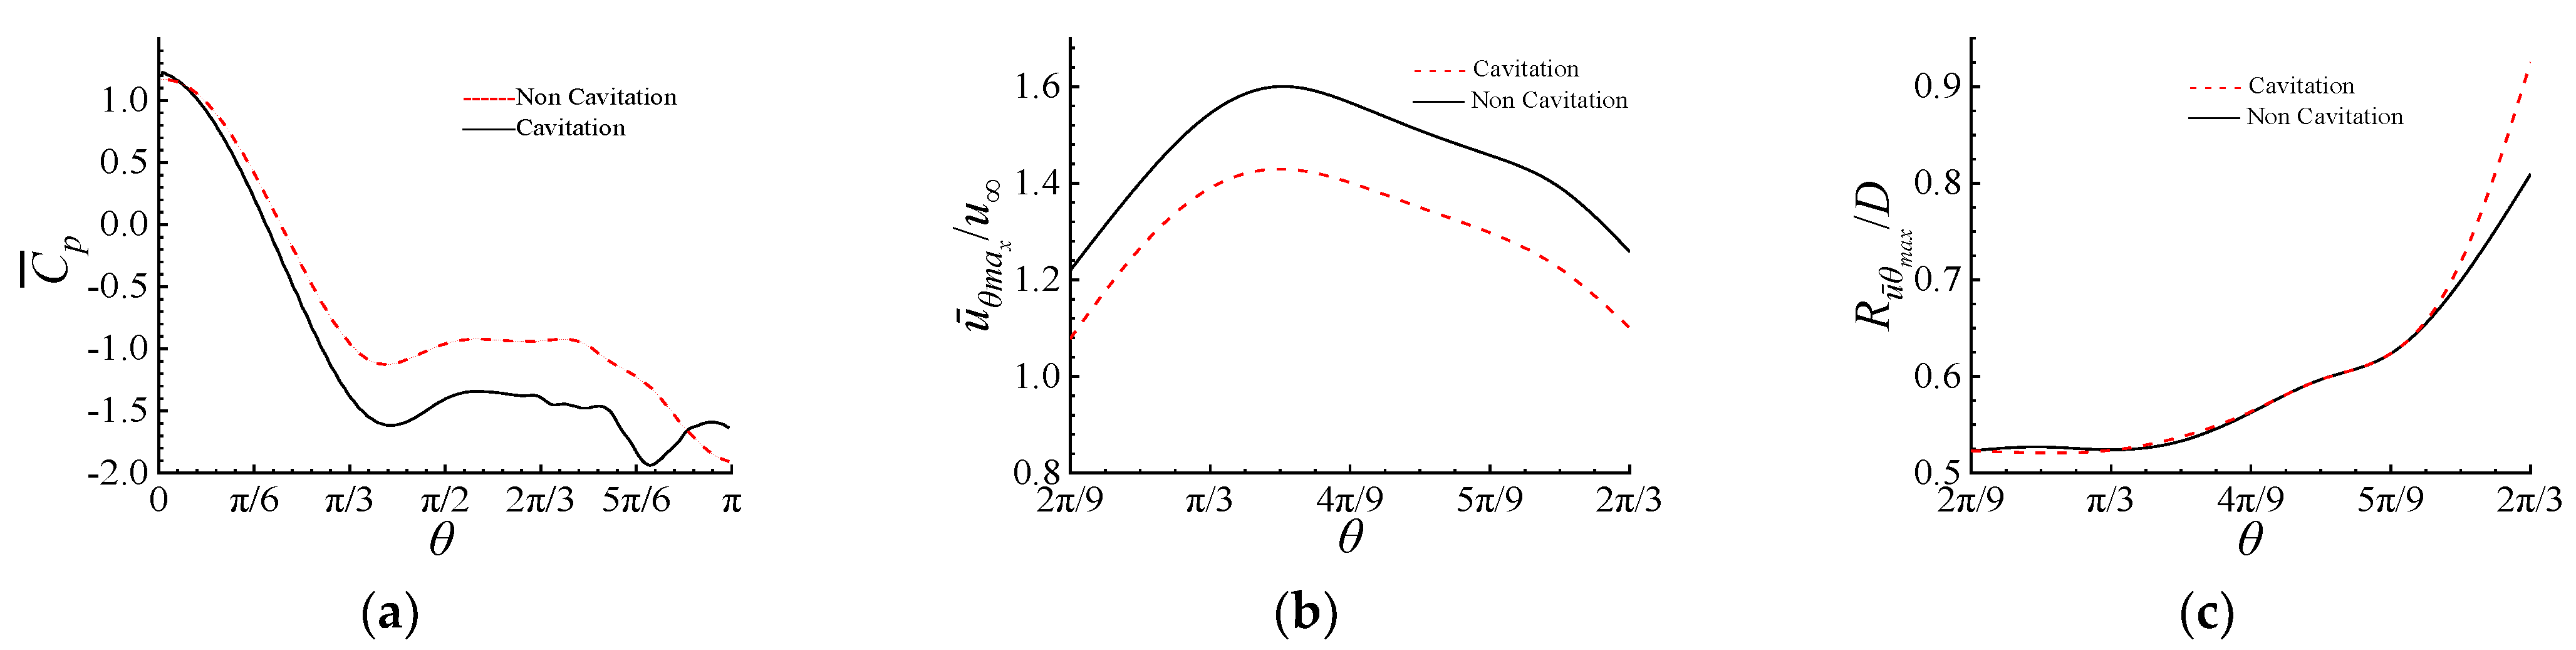
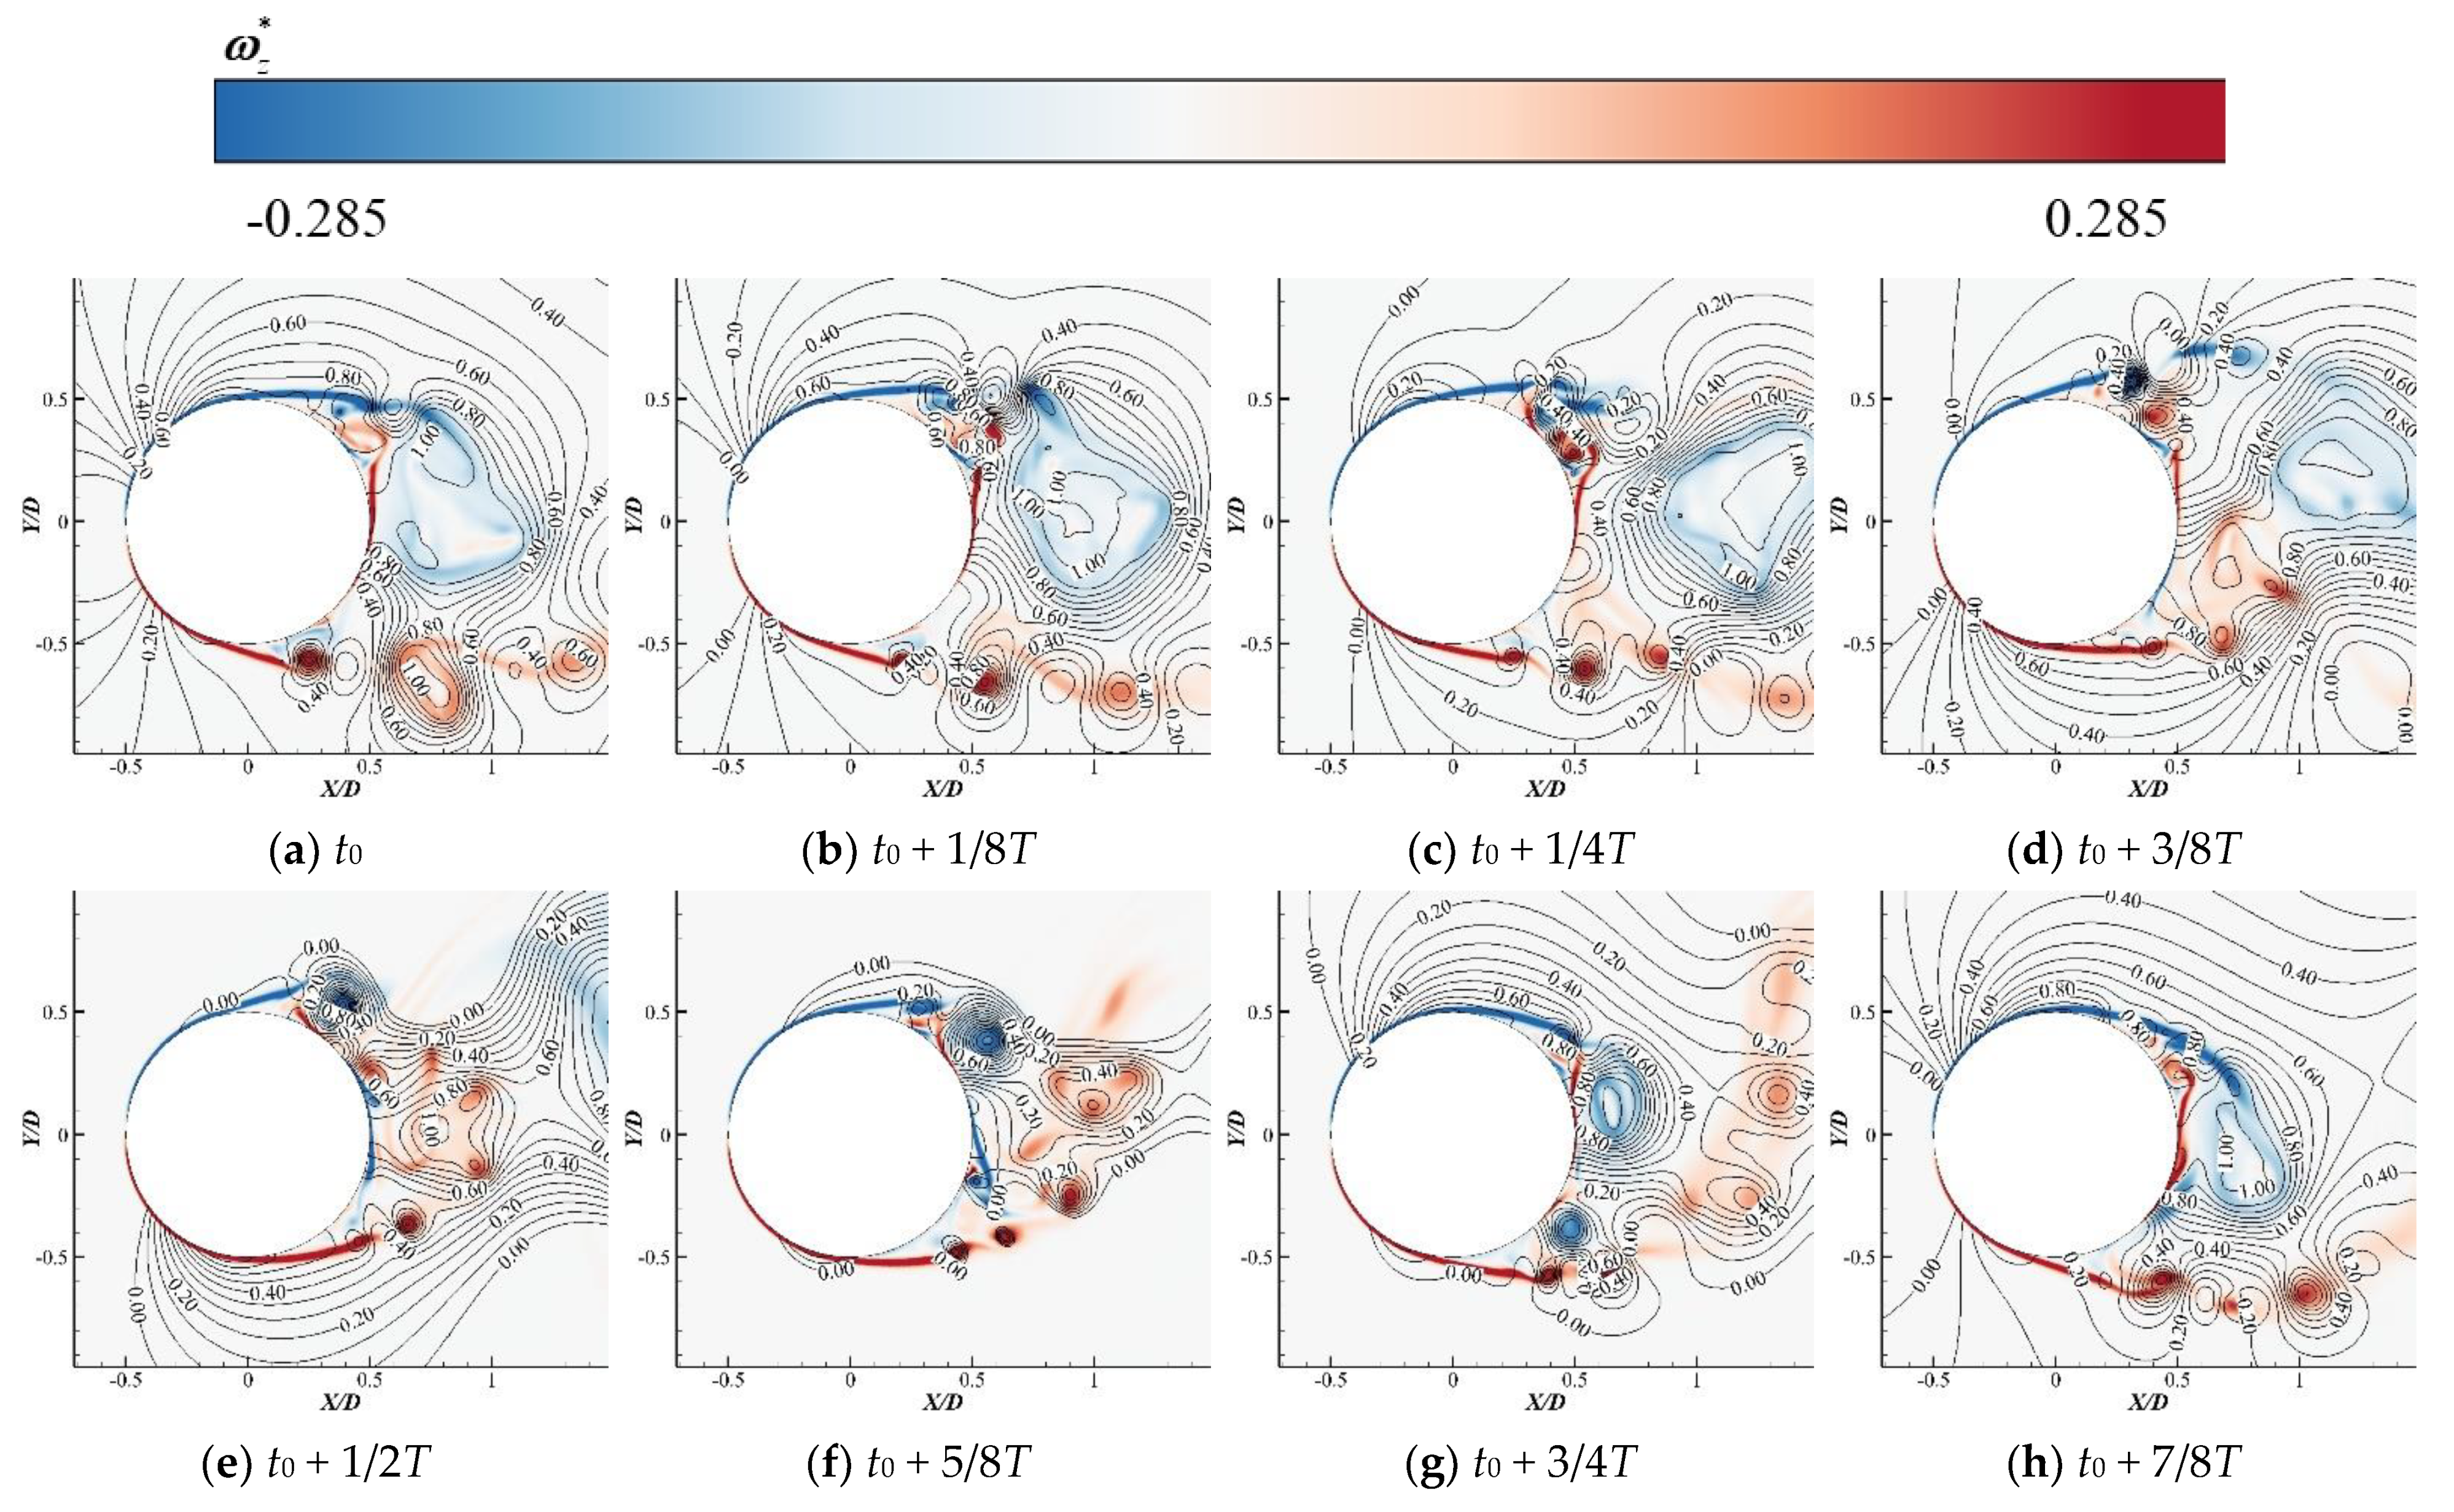
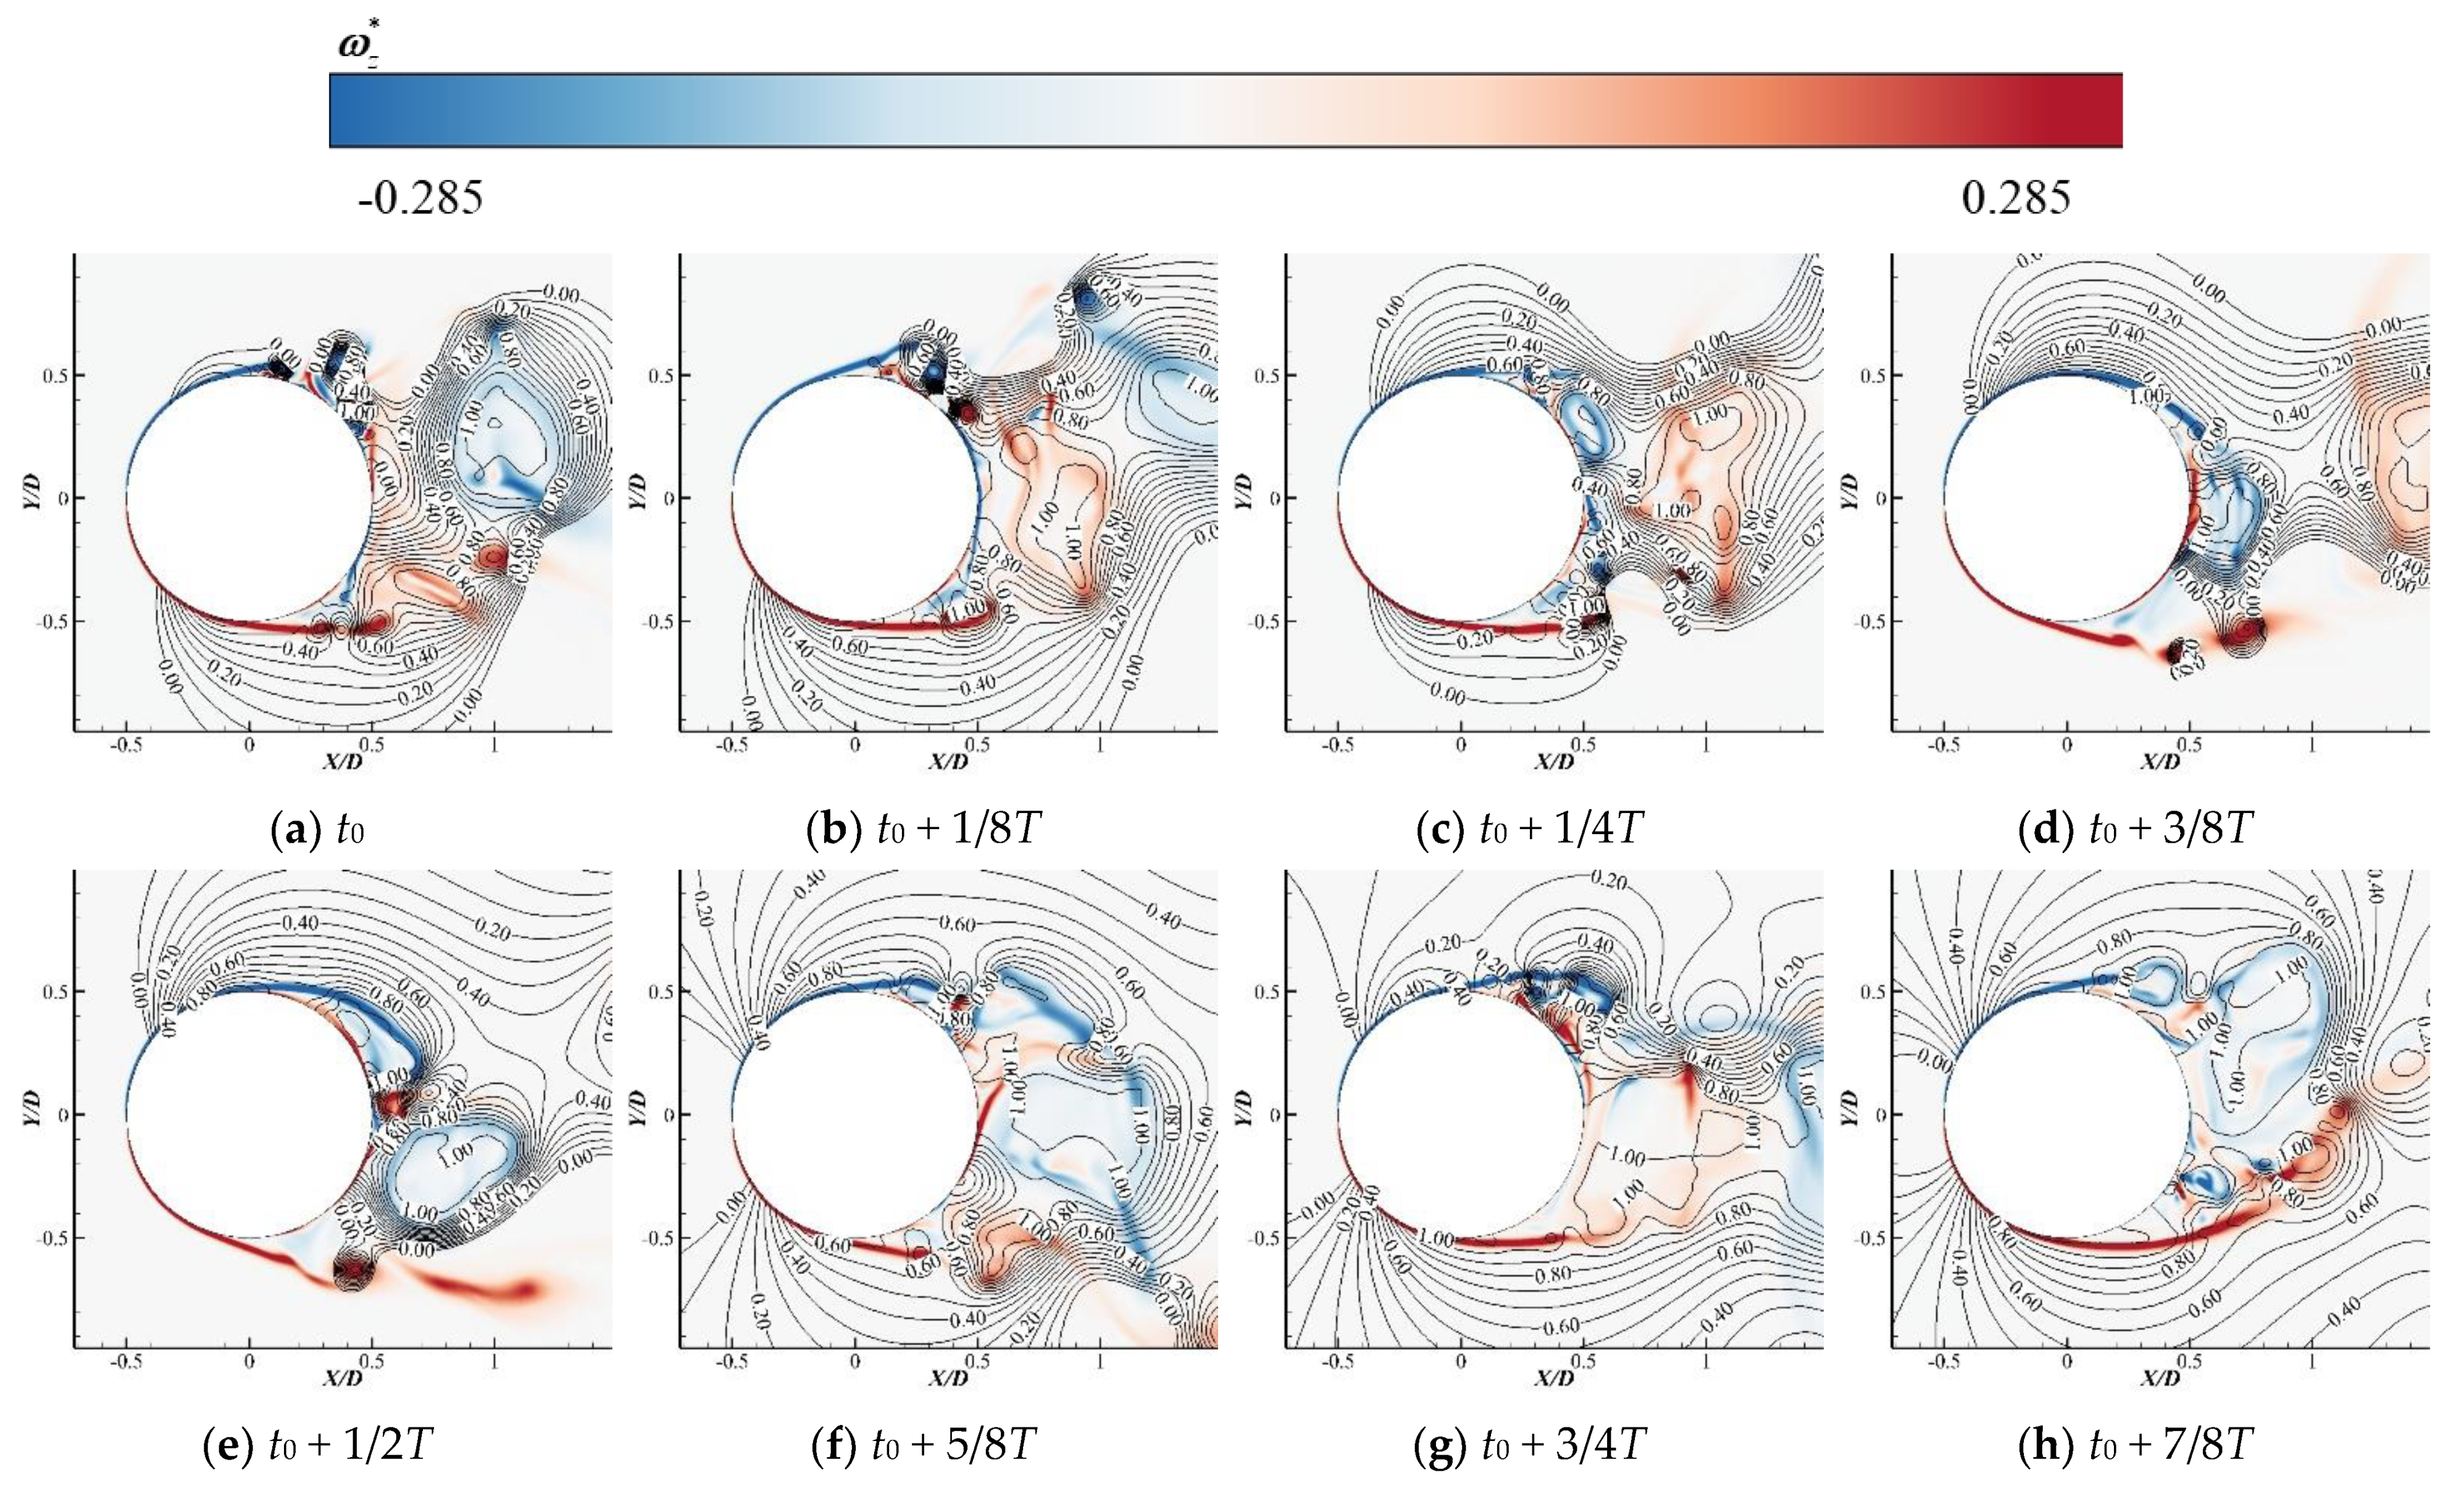
4.3. Interactions of Vortical Evolution with Cavitation

The pressure and velocity distributions around the cylinder surface are shown in Figure 9. The average values are achieved from several periods. Figure 9a shows the mean pressure coefficient on the cylinder surface. Here, θ = 0 and π correspond to the stagnation point near the leading edge and trailing edge, respectively (see Figure 3). For the noncavitation cases, the pressure coefficient decays from 0 to 7π/18, and then increases and approximately keeps a constant from 11π/18 to 13π/18. The pressure coefficient has a fluctuation after 13π/18 due to the multiscale vortices. For the cavitation case, the variation trend of the average pressure coefficient from 0 to 13π/18 resembles that of the noncavitation case. However, the magnitude of the time-averaged pressure coefficient for cavitation case is generally greater than that for the noncavitation case. This is because the cavitating flow generated in the wake flow field compresses the upstream fluid, which slows down the upstream fluid, reduces the local pressure drop and increases the pressure coefficient.
The distribution of the maximum tangential velocity in the boundary layer from 2π/9 to 2π/3 is plotted in Figure 9b. According to Figure 9a, the region from 2π/9 to π/3 has the most favorable pressure gradient. The region from 4π/9 to 5π/9 represents the most adverse pressure gradient, and the interval 5π/9 to 2π/3 represents the separated flow region. Hence, we could observe that the maximum tangential velocity increases in the favorable pressure gradient region but decays in the adverse pressure gradient region. The variation trend of the maximum tangent velocity is contrary to the time-averaged pressure coefficient. Furthermore, the maximum tangent velocity in the boundary layer is significantly reduced compared with that for noncavitation case. The Bernoulli principle is responsible for this phenomenon. The position of the maximum tangential velocity in the boundary layer varied with θ is shown in Figure 9c. In both cases, the location of maximum tangential velocity is similar from 2π/9 to 11π/18. However, the position of the maximum tangential velocity is located away from the cylinder surface in the trailing edge region (θ > 11π/18). In other words, the boundary-layer thickness increases. As analyzed above, the cavitating flow could compress the upstream flow. Therefore, the cavitating flow in the near wake region could thicken the boundary layer and decrease the maximum tangential velocity, thus further inhibiting the shedding of the vortex system.
Figure 10a,b shows the cloud diagram of vapor volume fraction distribution and the vorticity isolines in the merging and splitting process of cavities, respectively, at the different spatiotemporal positions. In Figure 10a, three small-scale vortices A, B and C, in the same direction, gradually gather with the evolution of vortices, and finally form a large-scale vortex. The rotation direction of the large-scale vortex is consistent with that of the small-scale vortices. Corresponding to the development of cavitation morphology, it can be seen that two smaller cavities in the flow field, cavity I and cavity II, merge into one larger cavity, cavity III. In Figure 10b, the three small-scale vortices A, B and C revolve around the large-scale vortex. The small-scale vortex B is gradually stripped of the original large-scale vortex under the influence of viscosity, leading to the decomposition of the large-scale vortex and the increase in pressure in the central region of the vortex. Corresponding to the development of cavitation morphology, it can be seen that the large cavity I in the flow field splits into two small cavities, II and III. This is because the effect of viscosity is very important in the interaction between vortical evolution and cavitation. The velocity gradient from the vortex center to the vortex edge is very large, which will cause a great viscous force. Under the influence of viscosity, it will inevitably lead to the stripping of small-scale vortices at the edge of large-scale vortices, increase the pressure in the center of large-scale vortices, and finally lead to the splitting of the large cavity into many small cavities. By comparing the cases of vortex system evolution and cavitation development in the flow field at different times, it can be seen that the above process of cavities merging or cavities splitting is not an accidental phenomenon in the wake, but a conventional phenomenon caused by the vortex system evolution.

5. Conclusions

In this paper, characteristics of the cavitation in the cylinder wake containing multiscale vortices are numerically investigated via LES coupled with the SS cavitation model. The following conclusions are drawn according to the detailed analyses:
(1) The vortex shedding in the cylinder wake is quasiperiodic with an approximate frequency of 0.2, and this frequency may take a little drop if cavitation occurs. The SS cavitation model is more sensitive to the vapor–liquid two-phase volume fraction than the ZGB cavitation model, according to the theoretical analysis.
(2) The cavitation could inhibit the shedding of the multiscale vortices because the cavitation could compress the upstream flow and thicken the boundary layer in the near wake region. With the decrease in the cavitation number, the cavitation area increases and further inhibits the vortex shedding. This phenomenon could make more vortices, as well as the attached cavities, appear on the cylinder surface.
(3) Analyses of the vorticity transports illustrate that the expansion shrinkage is the main cause of vorticity, and it mainly distributes in the near wake region. The baroclinic moment is mainly distributed at the vapor liquid interface because the density gradient in the cavity is inconsistent with the pressure gradient in the region. The viscous dissipation also exists in the interface between vapor and liquid.
(4) The mutual aggregation of small-scale vortices in the vortex system or the continuous stripping of small-scale vortices at the edge of large-scale vortices could induce the merging or splitting of cavities in the wake. Moreover, the process of cavities merging or splitting is a conventional phenomenon caused by the evolution of a vortex system in the flow field.

Author Contributions

Data curation, F.G.; writing—original draft preparation, F.G.; writing—review and editing, Y.H.; supervision, D.Z. All authors have read and agreed to the published version of the manuscript.

Funding

This research was funded by the National Natural Science Foundation of China (51776087), the Equipment Pre-Research Fund Project (8151440002) and the Intelligent Manufacturing Equipment Design and Engineering Application Program of Excellent Scientific and Technological Innovation Team of College and Universities in Jiangu Provience (201907).

Institutional Review Board Statement

Not applicable.

Informed Consent Statement

Not applicable.

Data Availability Statement

The numerical data used to support the findings of this study are included within the article.

Conflicts of Interest

The authors declare no conflict of interest.

References

  1. Peng, X.X.; Wang, B.L.; Li, H.Y.; Xu, L.H.; Song, M.T. Generation of abnormal acoustic noise: Singing of a cavitating tip vortex. Phys. Rev. Fluids 2017, 2, 053602. [Google Scholar] [CrossRef]
  2. Deng, Y.X.; Li, R.N.; Han, W.; Yang, W.J.; Li, Z.G.; Zhang, Y.P. Characteristics of backflow vortex cavitation in screw centrifugal pump. Trans. Chin. Soc. Agric. Eng. 2015, 31, 86–90. [Google Scholar] [CrossRef]
  3. Li, Y.X.; Zhou, D.Q.; Yu, A. Research of swirl cavity flow performance in the draft tube of pump turbine. Renew. Energy Resour. 2019, 37, 303–309. [Google Scholar]
  4. Eg, A.; Sj, B.; Mn, C.; Sb, C.; Cp, B.; Reb, A. Experimental and numerical study of cavitating flow around a surface mounted semi-circular cylinder. Int. J. Multiph. Flow 2020, 124, 103191. [Google Scholar] [CrossRef]
  5. Hu, Q.X.; Yang, Y.; Shi, W.D. Cavitation Simulation of Centrifugal Pump with Different Inlet Attack Angles. Int. J. Simul. Model. 2020, 19, 279–290. [Google Scholar] [CrossRef]
  6. Ebrahimi, A.; Razaghian, A.H.; Tootian, A.; Seif, M.S. An experimental investigation of hydrodynamic performance, cavitation, and noise of a normal skew B-series marine propeller in the cavitation tunnel. Ocean Eng. 2021, 238, 109739. [Google Scholar] [CrossRef]
  7. Köksal, Ç.S.; Usta, O.; Aktas, B.; Atlar, M.; Korkut, E. Numerical prediction of cavitation erosion to investigate the effect of wake on marine propellers. Ocean Eng. 2021, 239, 109820. [Google Scholar] [CrossRef]
  8. Stark, C.; Shi, W.C.; Troll, M. Cavitation funnel effect: Bio-inspired leading-edge tubercle application on ducted marine propeller blades. Appl. Ocean. Res. 2021, 116, 102864. [Google Scholar] [CrossRef]
  9. Tan, L.; Yu, Z.Y.; Xu, Y.; Liu, Y.B.; Cao, S.L. Role of blade rotational angle on energy performance and pressure fluctuation of a mixed-flow pump. Proc. Inst. Mech. Eng. Part A J. Power Energy 2017, 231, 227–238. [Google Scholar] [CrossRef]
  10. Tan, L.; Xie, Z.F.; Liu, Y.B.; Hao, Y.; Xu, Y. Influence of T-shape tip clearance on performance of a mixed-flow pump. Proc. Inst. Mech. Eng. Part A J. Power Energy 2018, 232, 386–396. [Google Scholar] [CrossRef]
  11. Fry, S.A. Investigating cavity/wake dynamics for a circular cylinder by measuring noise spectra. J. Fluid Mech. 1984, 142, 187–200. [Google Scholar] [CrossRef]
  12. Zhang, Y.N.; Qian, Z.D.; Ji, B.; Wu, Y.L. A review of microscopic interactions between cavitation bubbles and particles in silt-laden flow. Renew. Sustain. Energy Rev. 2016, 56, 303–318. [Google Scholar] [CrossRef]
  13. Berger, E.; Wille, R. Periodic Flow Phenomena. Annu. Rev. Fluid Mech. 1972, 4, 313–340. [Google Scholar] [CrossRef]
  14. Williamson, C.H.K. Vortext Dynamics in the Cylinder Wake. Annu. Rev. Fluid Mech. 1996, 28, 477–539. [Google Scholar] [CrossRef]
  15. Norberg, C. Fluctuating lift on a circular cylinder: Review and new measurements. J. Fluids Struct. 2003, 17, 57–96. [Google Scholar] [CrossRef]
  16. Desai, A.; Mittal, S.; Mittal, S. Experimental investigation of vortex shedding past a circular cylinder in the high subcritical regime. Phys. Fluids 2020, 32, 014105. [Google Scholar] [CrossRef]
  17. Kumar, P.; Chatterjee, D.; Bakshi, S. Experimental investigation of cavitating structures in the near wake of a cylinder. Int. J. Multiph. Flow 2017, 89, 207–217. [Google Scholar] [CrossRef]
  18. Gugulothu, K.; Rajesh, C.H.; Deekshith, P. Study of cavitation in the wake of a cylinder. In Proceedings of the IEEE-International Conference on Advances in Engineering, Science and Management (ICAESM-2012), Nagapattinam, Tamil Nadu, India, 14 June 2012. [Google Scholar]
  19. Dobroselsky, K.G. Applying PIV to study a fluid flow in the vicinity of a circular streamlined cylinder. J. Phys. Conf. Ser. 2019, 1421, 012015. [Google Scholar] [CrossRef]
  20. Pendar, M.R.; Esmaeilifar, E.; Roohi, E. LES Study of Unsteady Cavitation Characteristics of a 3-D Hydrofoil with Wavy Leading Edge. Int. J. Multiph. Flow 2020, 132, 103415. [Google Scholar] [CrossRef]
  21. Wang, Z.; Huang, B.; Zhang, M.; Wang, G.; Zhao, X.A. Experimental and numerical investigation of ventilated cavitating flow structures with special emphasis on vortex shedding dynamics. Int. J. Multiph. Flow 2017, 98, 79–95. [Google Scholar] [CrossRef]
  22. Asano, Y.; Watanabe, H.; Noguchi, H. Effects of cavitation on Kármán vortex behind circular-cylinder arrays: A molecular dynamics study. J. Chem. Phys. 2020, 152, 034501. [Google Scholar] [CrossRef] [Green Version]
  23. Gnanaskandan, A.; Mahesh, K. Numerical investigation of near-wake characteristics of cavitating flow over a circular cylinder. J. Fluid Mech. 2016, 790, 453–491. [Google Scholar] [CrossRef] [Green Version]
  24. Gnanaskandan, A.; Mahesh, K. A numerical method to simulate turbulent cavitating flows. Int. J. Multiph. Flow 2015, 70, 22–34. [Google Scholar] [CrossRef]
  25. Sauer, J.; Winkler, G.; Schnerr, G.H. Cavitation and Condensation-Common Aspects of Physical Modeling and Numerical Approach. Chem. Eng. Technol. 2000, 23, 663–666. [Google Scholar] [CrossRef]
  26. Zwart, P.; Gerber, A.G.; Belamri, T. A two-phase flow model for predicting cavitation dynamics. In Proceedings of the ICMF 2014 International Conference on Multiphase Flow, Yokohama, Japan, 30 May–3 June 2004; p. 152. [Google Scholar]
  27. Jiang, W.Q.; Zheng, Y.; Ge, X.F. Comparative numerical study of cavitation on a two-dimensional hydrofoil. S-N Water Transf. Water Sci. Technol. 2017, 15, 204–208. [Google Scholar] [CrossRef]
  28. Niu, X.D.; Chew, Y.T.; Shu, C. Simulation of flows around an impulsively started circular cylinder by Taylor series expansion- and least squares-based lattice Boltzmann method. J. Comput. Phys. 2003, 188, 176–193. [Google Scholar] [CrossRef]
  29. Liu, C.; Hu, C. An adaptive multi-moment FVM approach for incompressible flows. J. Comput. Phys. 2018, 359, 239–262. [Google Scholar] [CrossRef]
  30. Hejlesen, M.M.; Koumoutsakos, P.; Leonard, A.; Walther, J.H. Iterative Brinkman penalization for remeshed vortex methods. J. Comput. Phys. 2015, 280, 547–562. [Google Scholar] [CrossRef]
  31. Xiong, Y.; Guan, H.; Wu, C.J. LES Discretization Methods for Unstructured Meshes Based on the Finite Volume Method. Appl. Math. Mech. 2016, 37, 1129–1144. [Google Scholar] [CrossRef] [Green Version]
  32. Xiao, H.L.; Luo, J.S. Improvement of sub-grid model in large eddy simulation and applications in turbulent channel flow. J. Aerosp. Power 2007, 22, 583–587. [Google Scholar] [CrossRef]
  33. Gnanaskandan, A. Development of a Methodology for LES of Turbulent Cavitating Flows. Ph.D. Thesis, University of Minnesota, Minneapolis, MN, USA, 2015. [Google Scholar]
  34. Ji, B.; Cheng, H.Y.; Huang, B.; Luo, X.W.; Peng, X.X.; Long, X.P. Research progresses and prospects of unsteady hydrodynamics characteristics for cavitation. Adv. Mech. 2019, 49, 428–479. [Google Scholar] [CrossRef]
  35. Laberteaux, K.R.; Ceccio, S.L. Partial cavity flows. Part 2. Cavities forming on test objects with spanwise variation. J. Fluid Mech. 2001, 431, 43–63. [Google Scholar] [CrossRef]
Figure 1. Computational model: (a) Computational domain; (b) Local grids.
Jmse 09 01366 g001
Figure 2. Lift coefficient and related amplitude spectrum: (a) Lift coefficient; (b) Amplitude spectrum.
Jmse 09 01366 g002
Figure 3. Vorticity distributions in the wake: (a) Noncavitation; (b) SS model (σ = 2.92); (c) ZGB model (σ = 2.92).
Jmse 09 01366 g003
Figure 4. Lift coefficient and related amplitude spectrum for different calculation cases: (a) Lift coefficient; (b) Amplitude spectrum (σ = 2.92).
Jmse 09 01366 g004
Figure 5. Evolutions of the cavitating vortices and the pressure in a quasiperiod at σ = 2.92.
Jmse 09 01366 g005
Figure 6. Evolutions of the cavitating vortices and the pressure in a quasiperiod at σ = 2.52.
Jmse 09 01366 g006
Figure 7. Evolutions of the cavitating vortices and the pressure in a quasiperiod at σ = 2.12.
Jmse 09 01366 g007
Figure 8. Distributions of the vapor phase volume fraction, the vortex expansion and contraction term distribution, the baroclinic moment term and the vortex viscosity dissipation term: (a) the vapor phase volume fraction; (b) the vortex expansion and contraction term; (c) the vortex baroclinic moment term; (d) the vortex viscous dissipation term.
Jmse 09 01366 g008
Figure 9. Pressure and velocity distributions around the cylindrical surface: (a) Time-averaged pressure coefficient; (b) Time-averaged tangential velocity; (c) Location of maximum time-averaged tangential velocity.
Jmse 09 01366 g009
Figure 10. Interactions of vortical evolution and cavitation: (a) Merging; (b) Splitting.
Jmse 09 01366 g010
Publisher’s Note: MDPI stays neutral with regard to jurisdictional claims in published maps and institutional affiliations.

