Article

Phytoplankton Biomass Dynamics in Tropical Coastal Waters of Jakarta Bay, Indonesia in the Period between 2001 and 2019

1
Department of Aquatic Resources Management, Faculty of Fisheries and Marine Sciences, IPB University (Bogor Agricultural University), Jl. Agatis Darmaga Bogor, Bogor 16680, Indonesia
2
Center for Coastal and Marine Resources Studies, IPB University (Bogor Agricultural University), Kampus IPB Baranangsiang, Jl. Raya Pajajaran No. 1, Bogor 16127, Indonesia
3
Institute for Coastal Research, Centre for Material and Coastal Research, Helmholtz-Zentrum Geesthacht, Max-Planck-Strasse 1, 21502 Geesthacht, Germany
4
Forschungs-und Technologiezentrum, Westküste, Hafentörn, 25761 Büsum, Germany
*
Author to whom correspondence should be addressed.
J. Mar. Sci. Eng. 2020, 8(9), 674; https://doi.org/10.3390/jmse8090674
Submission received: 16 July 2020 / Revised: 25 August 2020 / Accepted: 26 August 2020 / Published: 1 September 2020
(This article belongs to the Section Marine Biology)

Abstract

:
A study of nutrients, underwater light dynamics, and their correlation with phytoplankton biomass was conducted in the tropical estuary of Jakarta Bay, Indonesia, in the dry season during the period from 2001 to 2019. This study analyzed the spatial and temporal dynamics of phytoplankton biomass and its correlation with phytoplankton biomass. There was significant increase in nutrient concentration in Jakarta Bay, with annual means of 27.97 µM dissolved inorganic nitrogen (DIN) and 11.31 µM phosphates in 2001, increasing to 88.99 µM DIN and 25.92 µM phosphates in 2019. Increased mean nutrient concentrations were accompanied by increased mean phytoplankton biomass, from 15.81 µg Chl-a L−1 in 2001 to 21.31 µg Chl-a L−1 in 2019. The eutrophication status of Jakarta Bay waters was calculated using the Tropical Index for Marine Systems eutrophication index, which showed increased areas of hyper-eutrophic and eutrophic zones, while the mesotrophic area decreased. The hyper-eutrophic zone dominated the areas around river mouths and the inner part of the bay, while eutrophic status was observed in the middle part of the bay and mesotrophic status was found in the outer part of the bay. The area of hyper-eutrophic water increased 1.5-fold, from 75.1 km2 in 2001 to 114.0 km2 in 2019. Increasing eutrophication of the bay has had negative ecological consequences including algal blooms, hypoxic conditions, and mass mortality of marine biota, and it urgently requires remediation.

1. Introduction

Coastal eutrophication is a condition caused by increased nutrient supply to coastal waters [1]. The increased levels of organic matter and nutrients affect phytoplankton development. However, phytoplankton growth is governed not only by nutrients but also by other factors such as underwater light and physical hydrodynamics [2,3,4,5]. The classic approach to investigating the responses of the phytoplankton community to the two main resources on which it depends (nutrients and light) involves determining which acts as the limiting factor. Under natural conditions, all resources together influence phytoplankton development. Studies on the relative importance of nutrients and light to phytoplankton development have mostly been conducted in temperate areas [1,6,7,8]. Such studies in tropical regions are scarce, although the matter is of particular importance in tropical systems, where sufficient light is available throughout the year. In contrast to temperate regions, tropical coastal waters have less seasonal variability in solar irradiance, resulting in a constant light supply throughout the year. Hence, in this region, underwater light is regulated solely by water turbidity, which is in turn driven by organic materials suspended in the water, including phytoplankton assemblages [9,10].
Jakarta Bay, Indonesia, is among the most eutrophic estuaries in the world, with primary production ranging from 105 to 503 g C m−2 year−1 [9]. In 2001, it received an annual load of nutrients from 13 small river mouths that amounted to 6700 tons of phosphates, 22,250 tons of dissolved inorganic nitrogen (DIN), and 51,760 tons of silicate per year [10]. As a consequence, the bay shows severe symptoms of eutrophication, including hypoxic near-bottom waters, frequent algal blooms, and mass mortality of aquatic biota [11,12,13,14]. Around 60–80% of domestic wastewater is untreated and flows directly into the sewage system that ends in the bay, resulting in massive accumulation of organic matter in the water [15].
A study of phytoplankton biomass, nutrients, and underwater light dynamics in the tropical estuary of Jakarta Bay was conducted in selected dry seasons during the period from 2001 to 2019. Monitoring over this 19-year period showed spatial and temporal changes in phytoplankton biomass and their correlation to changes in nutrients and light over time. In this study, the spatial and temporal variation in phytoplankton biomass and its correlation with nutrients and light was examined. Changes in eutrophication levels of the bay during this period were also assessed in order to gain a better view of how anthropogenic activities are affecting the nearby estuarine system.
Our results contribute to understanding how tropical coastal phytoplankton biomass correlates to changes in nutrient and light levels as a function of increasing eutrophication in a tropical bay. This study provides empirical observations for threshold levels of nutrient concentrations that produce eutrophic and hyper-eutrophic conditions in tropical coastal embayment. From a practical viewpoint, this study provides important information for the management of eutrophication in a tropical embayment affected by anthropogenic pressures.

2. Materials and Methods

Jakarta Bay, Indonesia, is a shallow bay with an average depth of 12.5 m, composed of three main watersheds, which are affected by anthropogenic activities of around 12 million inhabitants of the greater Jakarta City area. The bay is 26.64 km in length and 19.75 km in maximum width, and it covers an area of around 526.14 km2 [16].
Measurements were conducted at fixed monitoring stations (Figure 1) in the years 2001, 2007, 2013, 2017, 2018, and 2019. For the purpose of comparison, all data shown in this paper were collected in the dry season. Data from 2001, 2007, and 2013 have been published previously [17], and those representing the dry season were selected for this paper. Some of the dissolved inorganic nitrogen (DIN) data from 2017 are presented in another study [18]. The dates of the measurement campaigns are shown in Table 1.
In all, 15 stations were sampled, covering river mouths (stations at the Angke, Priok, and Marunda Rivers) and the inner (stations 10, 11, 12), middle (stations 2, 5, 8, 3, 6, 9), and outer parts of the bay (stations 1, 4, and 7). To cover a spatial gradient of riverine input, the gradient of salinity was used to select the sampling sites, ranging from low values at the river mouths and inner part of the bay to high values in the middle and outer parts of the bay [10].
Sampling and measurement were performed between 10:00 AM and 2:00 PM during periods with similar tidal characteristics, as this area experiences semidiurnal tides with a tidal range of around 0.9 m. For each sampling date and each station, one surface water sample was taken. Around 1 to 2 L of surface sea water was collected using a 5 L Van Dorn water sampler at each station and then filtered using MFS nucleofilters of 47 mm diameter and 0.2 µm pore size; the filtrate was used for nutrient analyses and the filters were used for chlorophyll-a (Chl-a) analyses. Nutrient analyses (DIN and phosphates) were performed according to the method of Grasshoff et al. [19]. Chl-a analyses were conducted spectrophotometrically according to the method of Lorenzen [20].
A Licor spherical quantum sensor (LI-1935A) was used to measure surface water irradiance. A conversion factor of 1 W m−2 = 4.17 μmol photons m−2 s−1 was applied [21]. The empirical relationship k = 0.191 + 1.242/Sd (R2 = 0.853) [22] was used to calculate irradiance at the desired depth based on Secchi disk readings (Sd [m]).
Two-way analysis of variance (ANOVA) was used to analyze the interaction between station and year of measurement in the values of nutrient concentrations, light, and Chl-a concentrations. In the event that there was no significant difference, this was followed by one-way ANOVA and Tukey’s post hoc tests to identify differences either between stations or year of measurement and the significant highest values of each parameter. In addition, the effects between nutrients and light on phytoplankton biomass were analyzed using single linear regression and interactions between them by using multiple linear regression. The software used for statistical analyses was MS Excel 2016. The spatial distribution maps of nutrients, light, Chl-a, and trophic levels were developed using the program Surfer 16 (Golden Software).
To assess the level of eutrophication, the Tropical Index for Marine Systems (TRIX) [23] was applied, which includes the parameters DIN, phosphates, Chl-a, and oxygen percent saturation. The formula of this index is TRIX = k/n i = 0 n ( ( log   M log   L ) / (   log   U log   L ) ) , where k = 10 (scaling factor), n = number of variables (4), U = upper limit, L = lower limit, and M = value of a variable. TRIX ranges from 0 to 10, representing conditions from oligotrophic (approaching 0) to hyper-eutrophic (approaching 10). Values above 6.0 indicate strong eutrophication [24]. TRIX has been applied to routine eutrophication monitoring of the Adriatic Sea [25], the Mar Menor coastal lagoon in Spain [26], and Jakarta Bay [10].

3. Results

3.1. Spatial and Temporal Changes in Nutrients, Light, and Phytoplankton Biomass

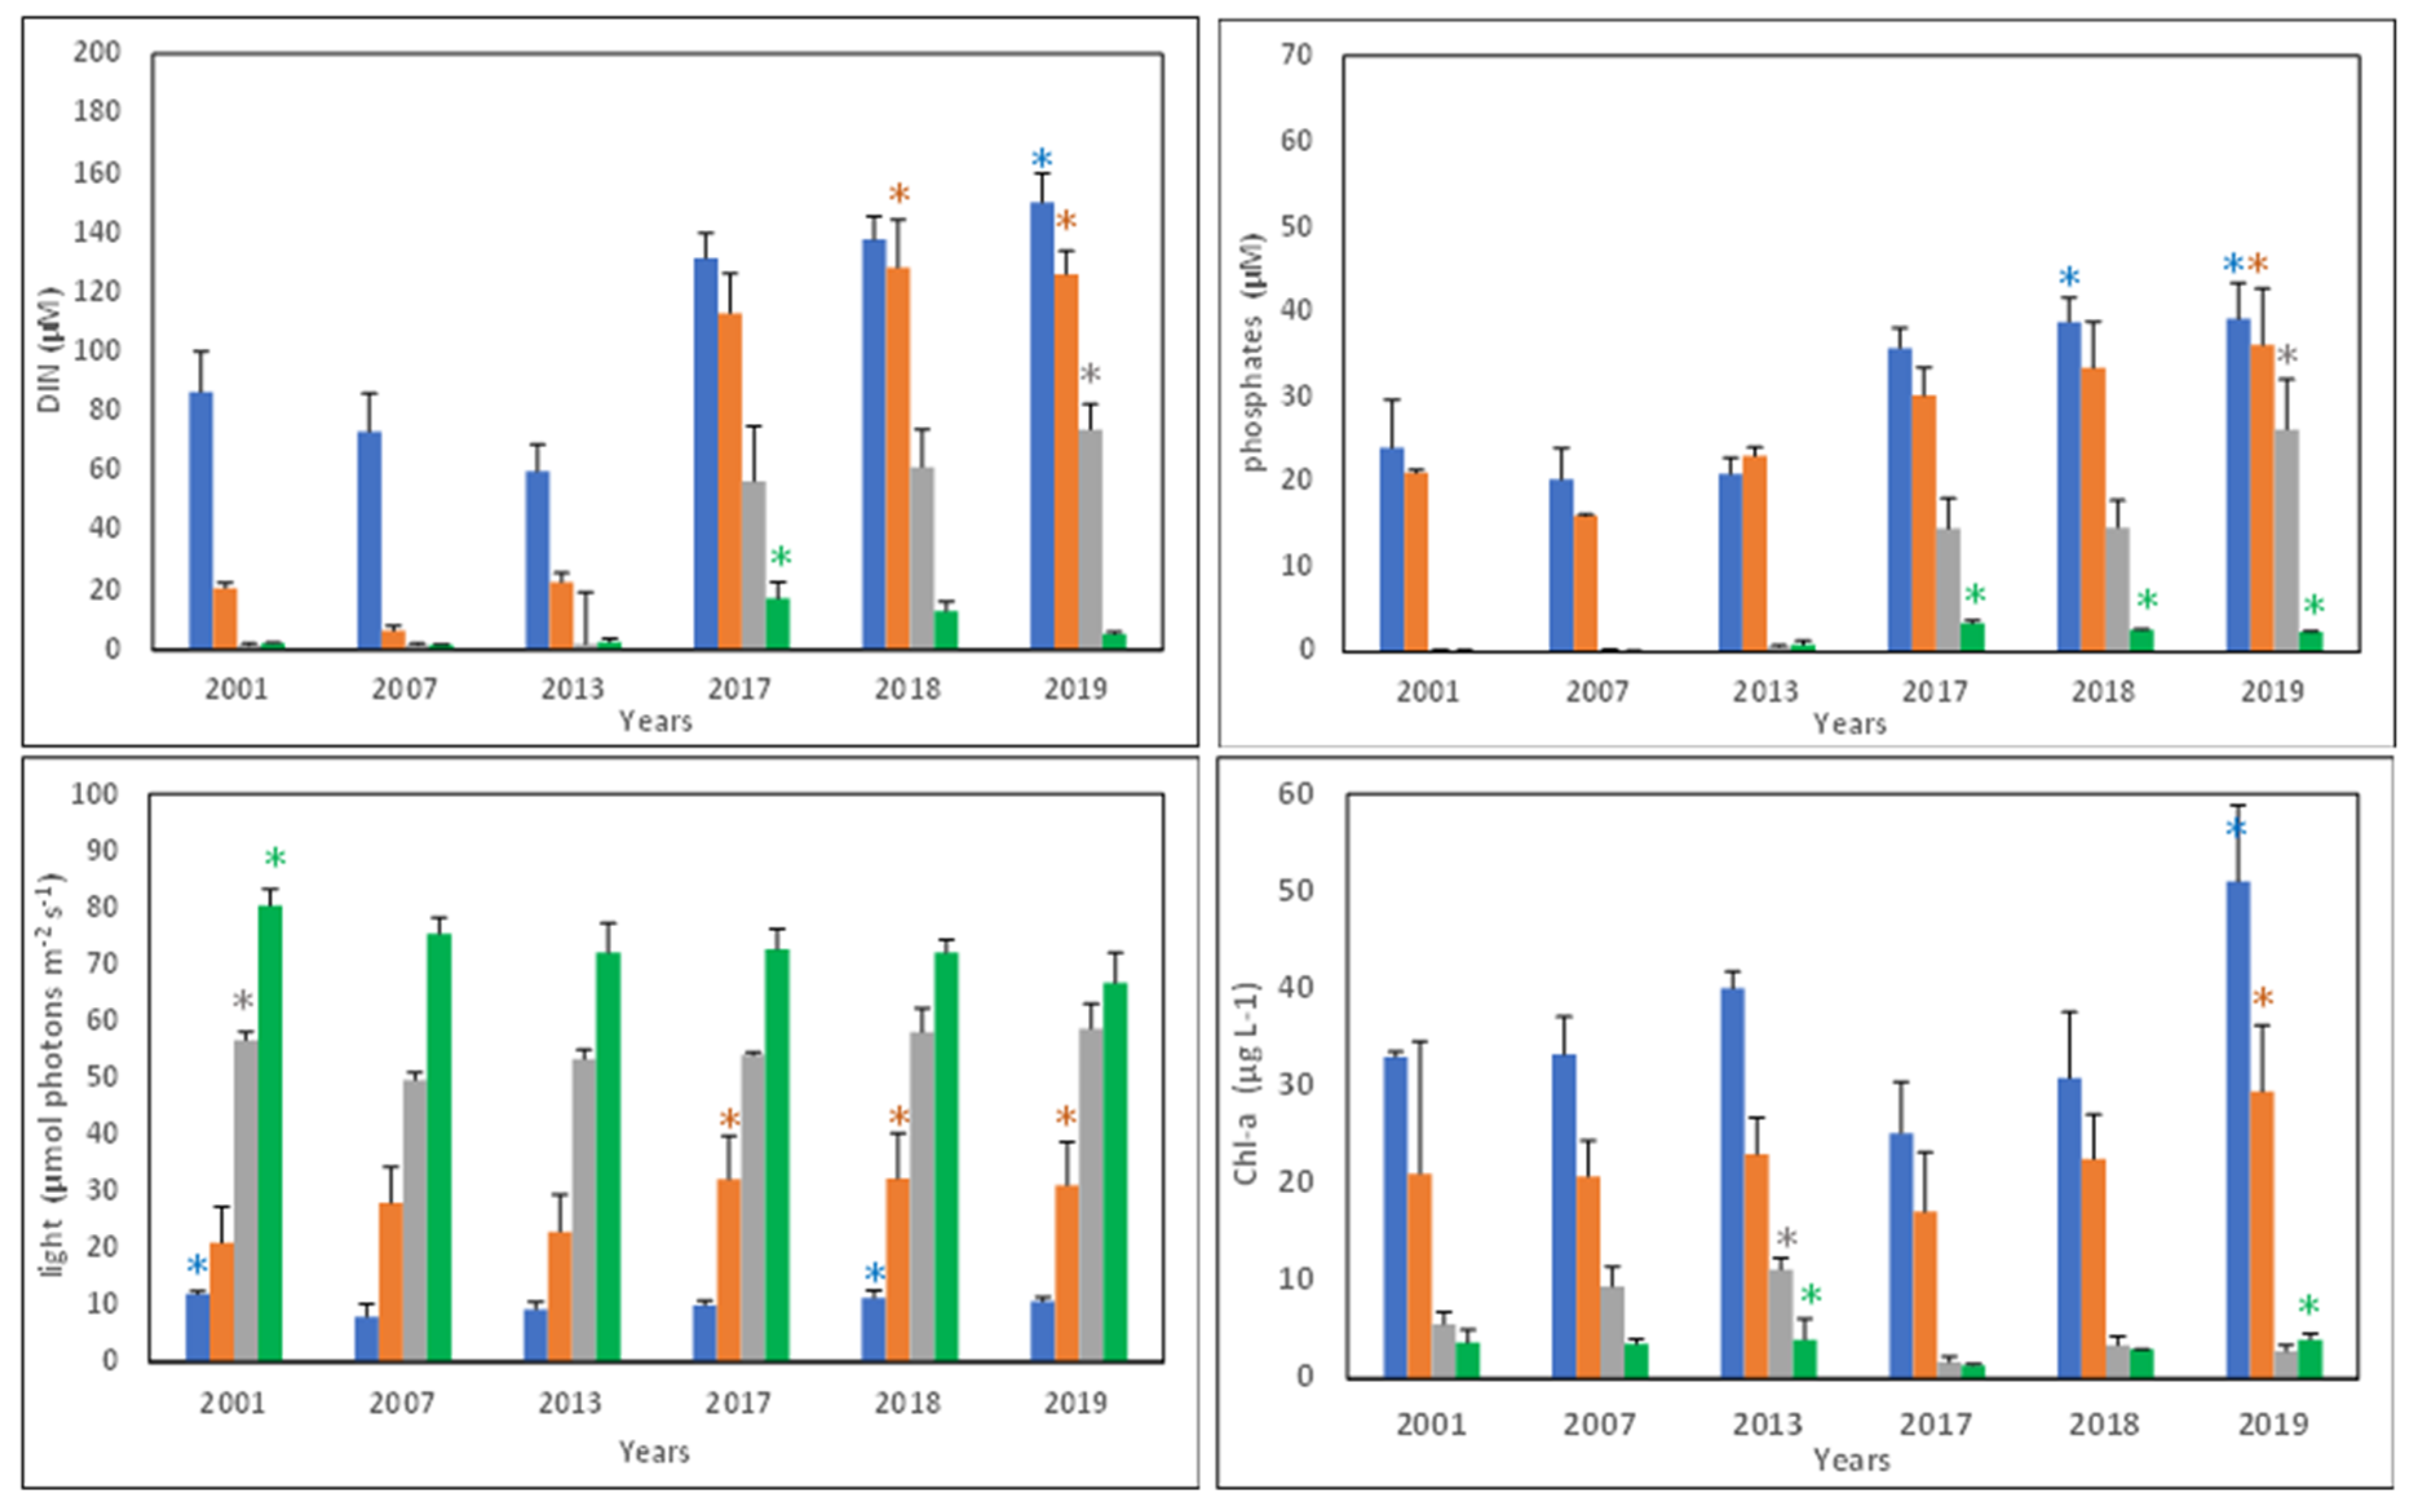
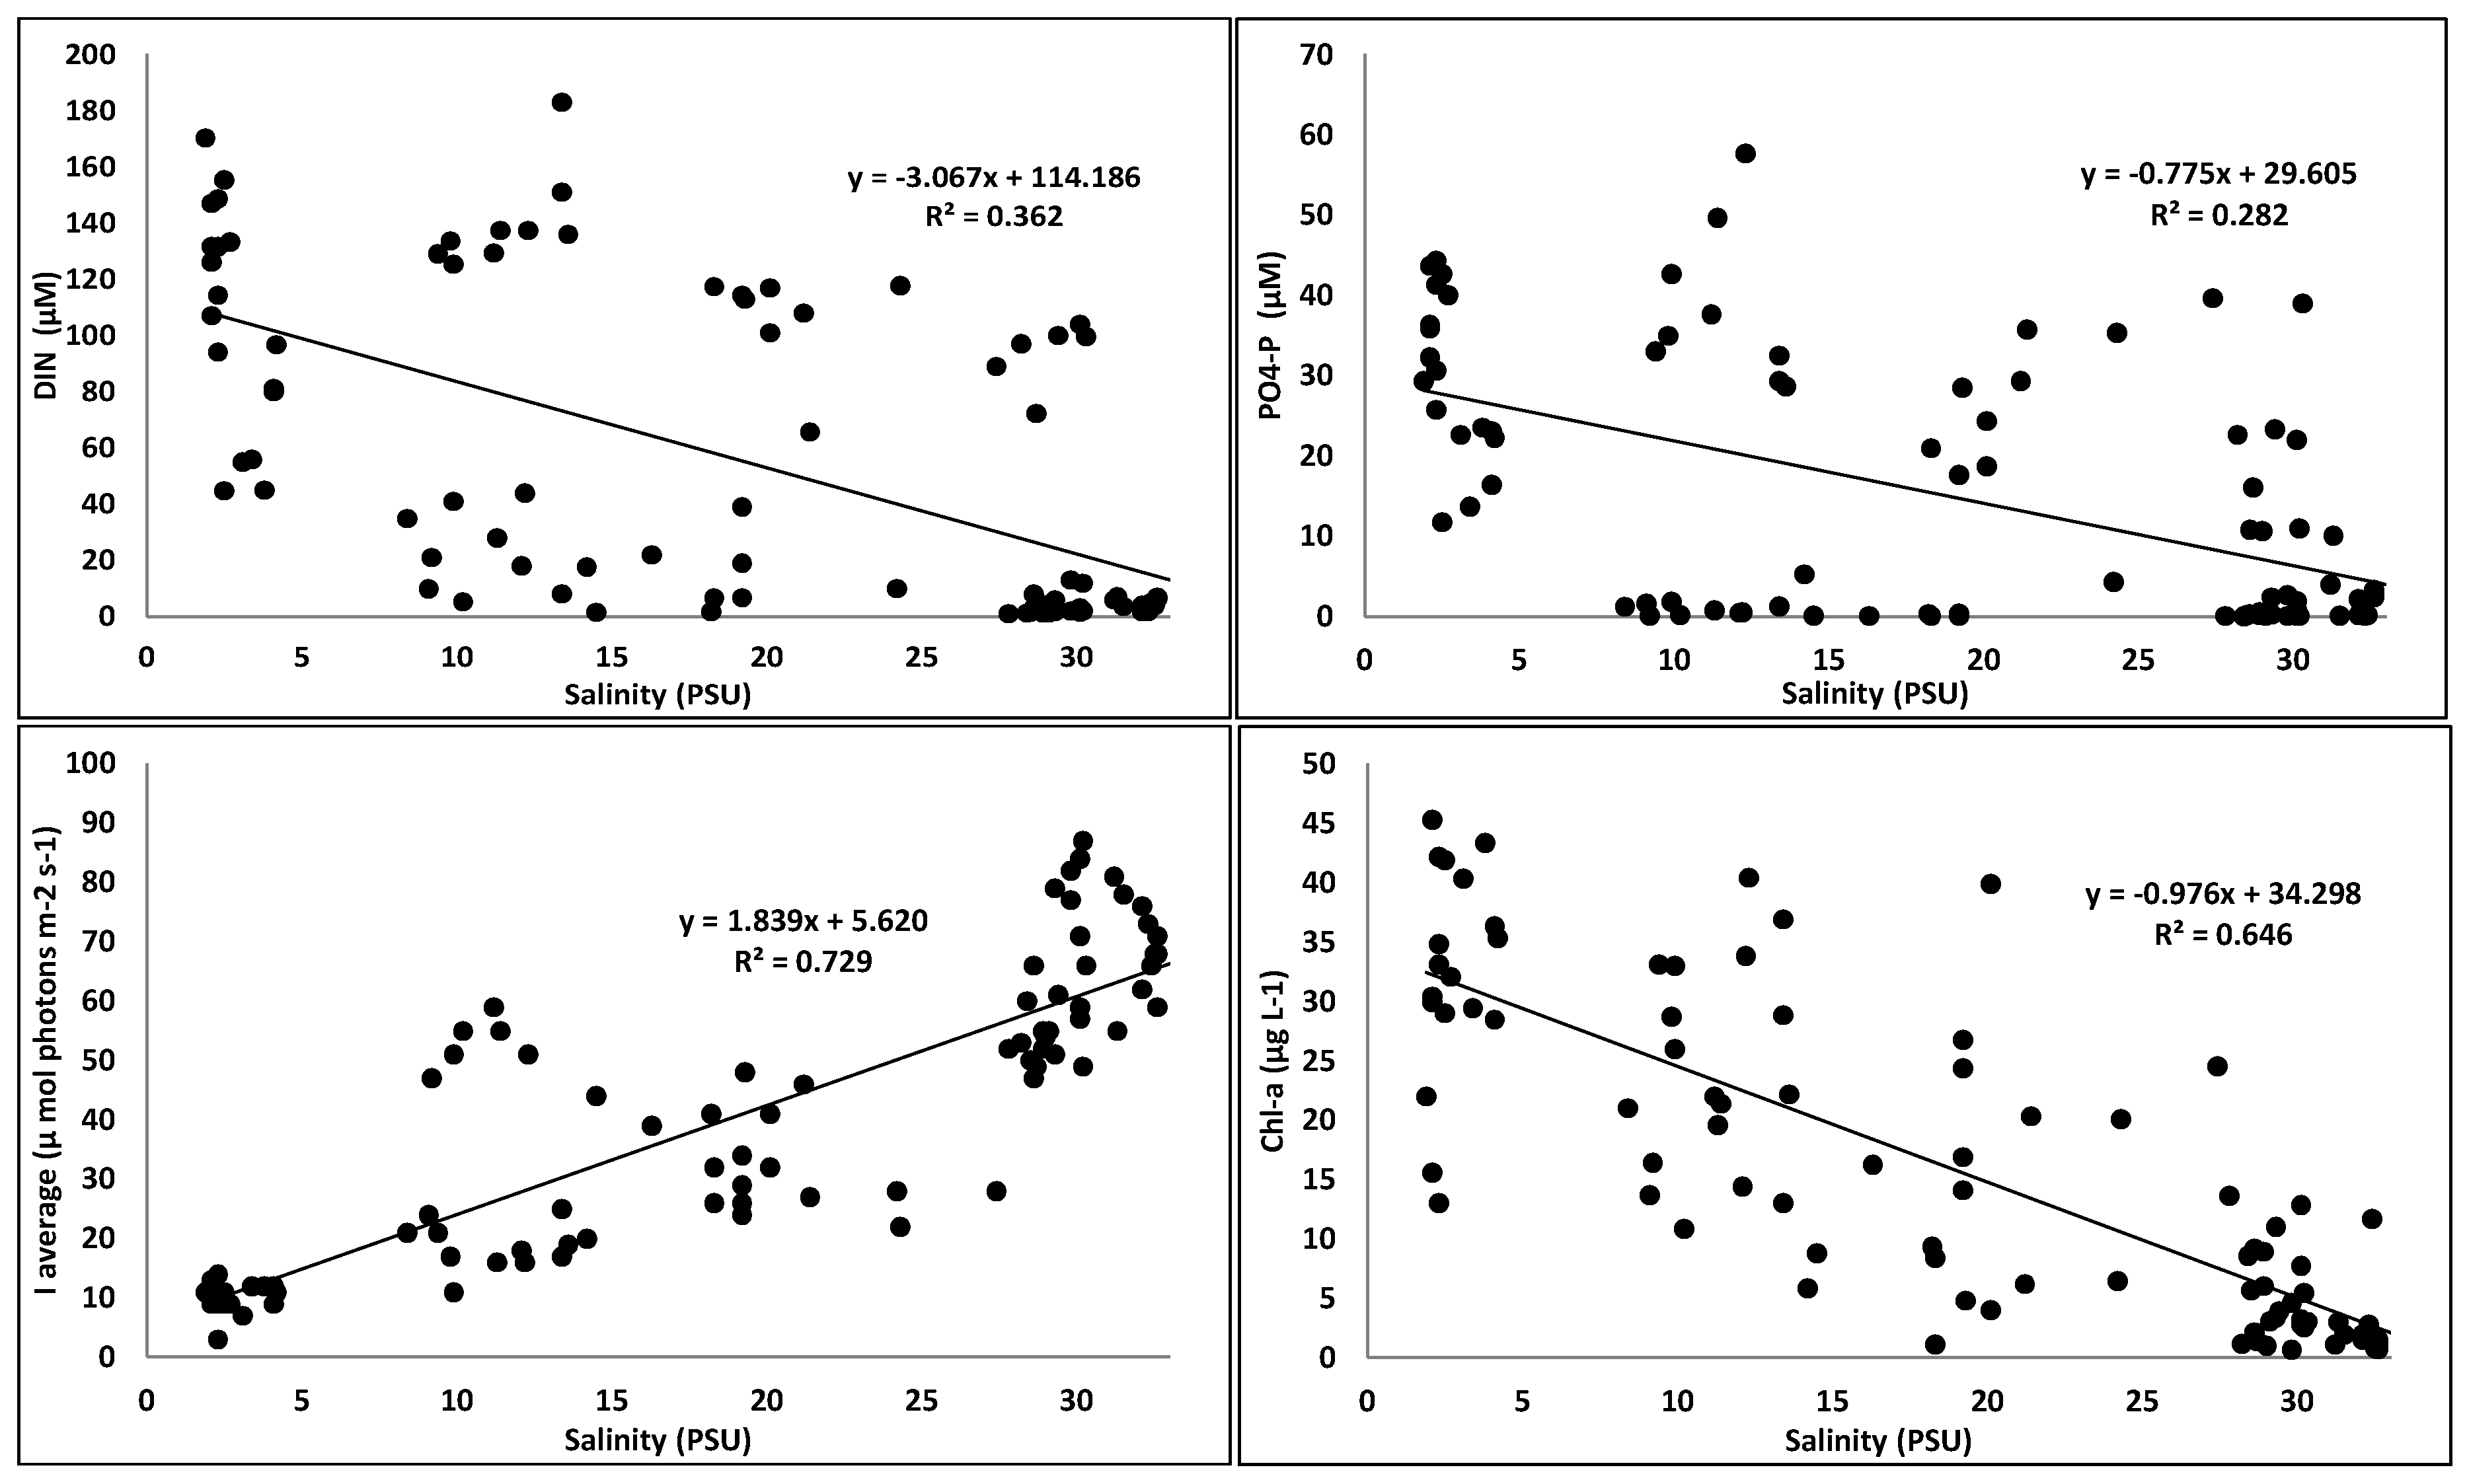
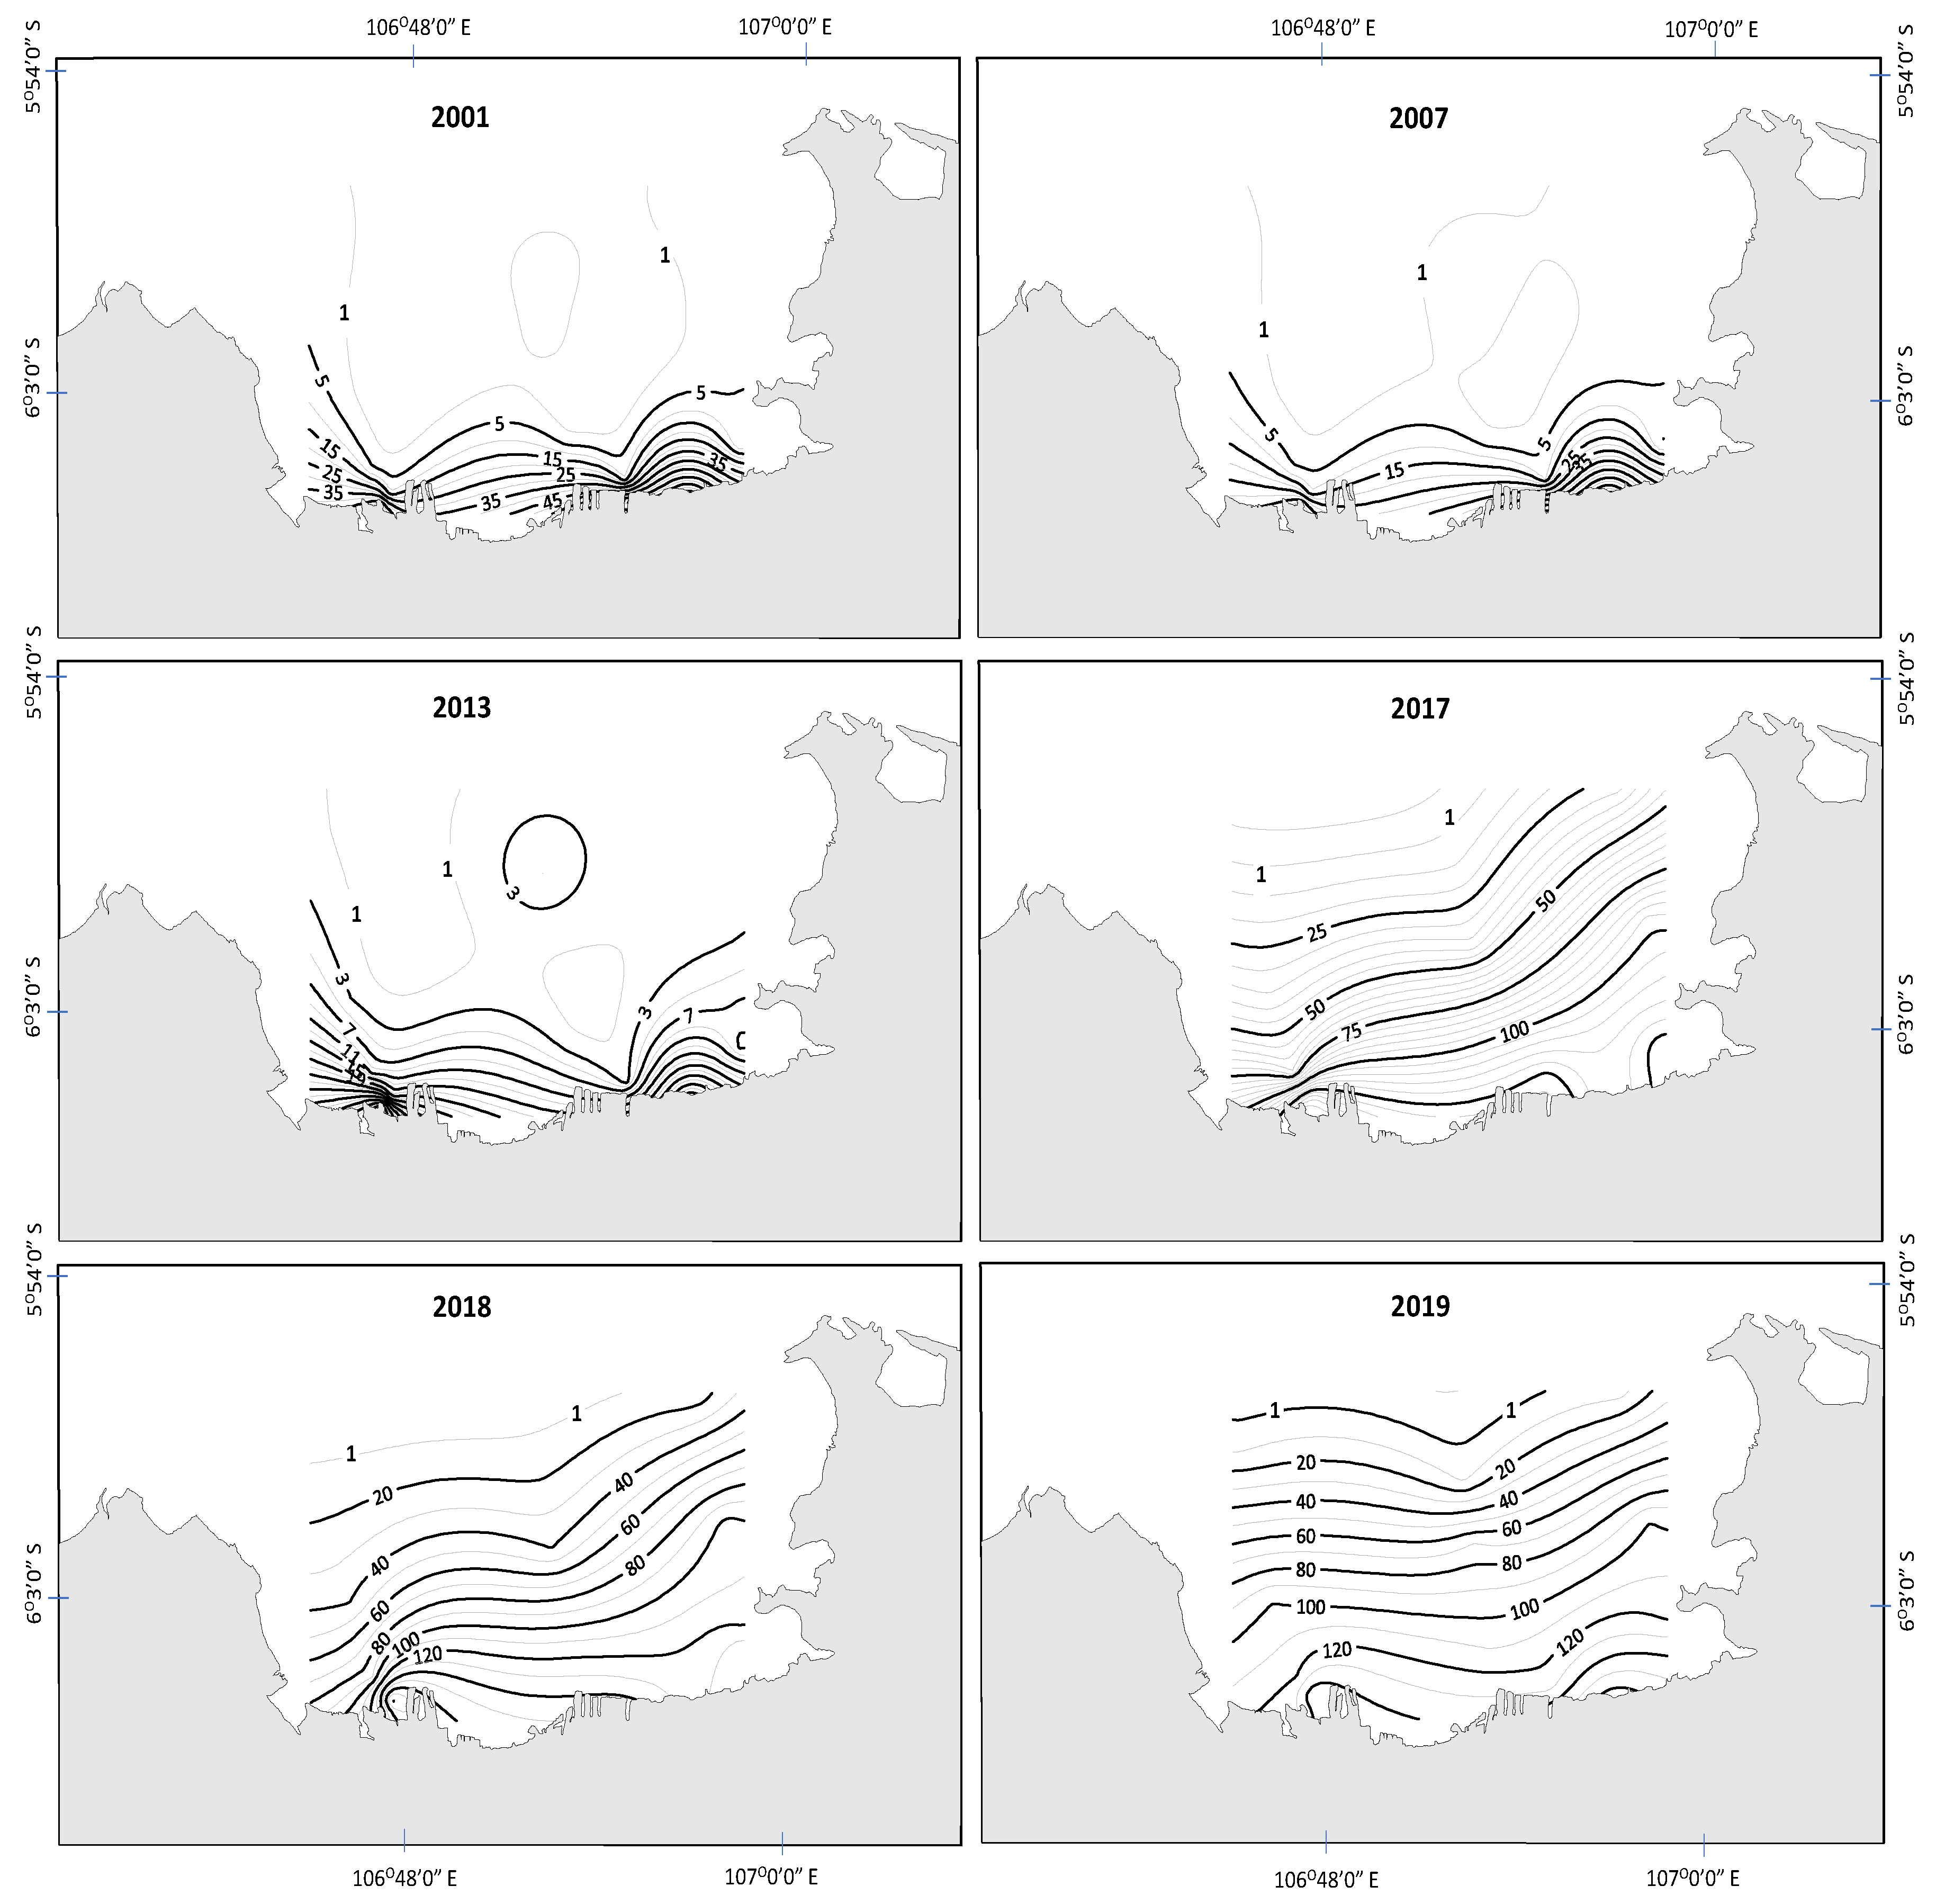
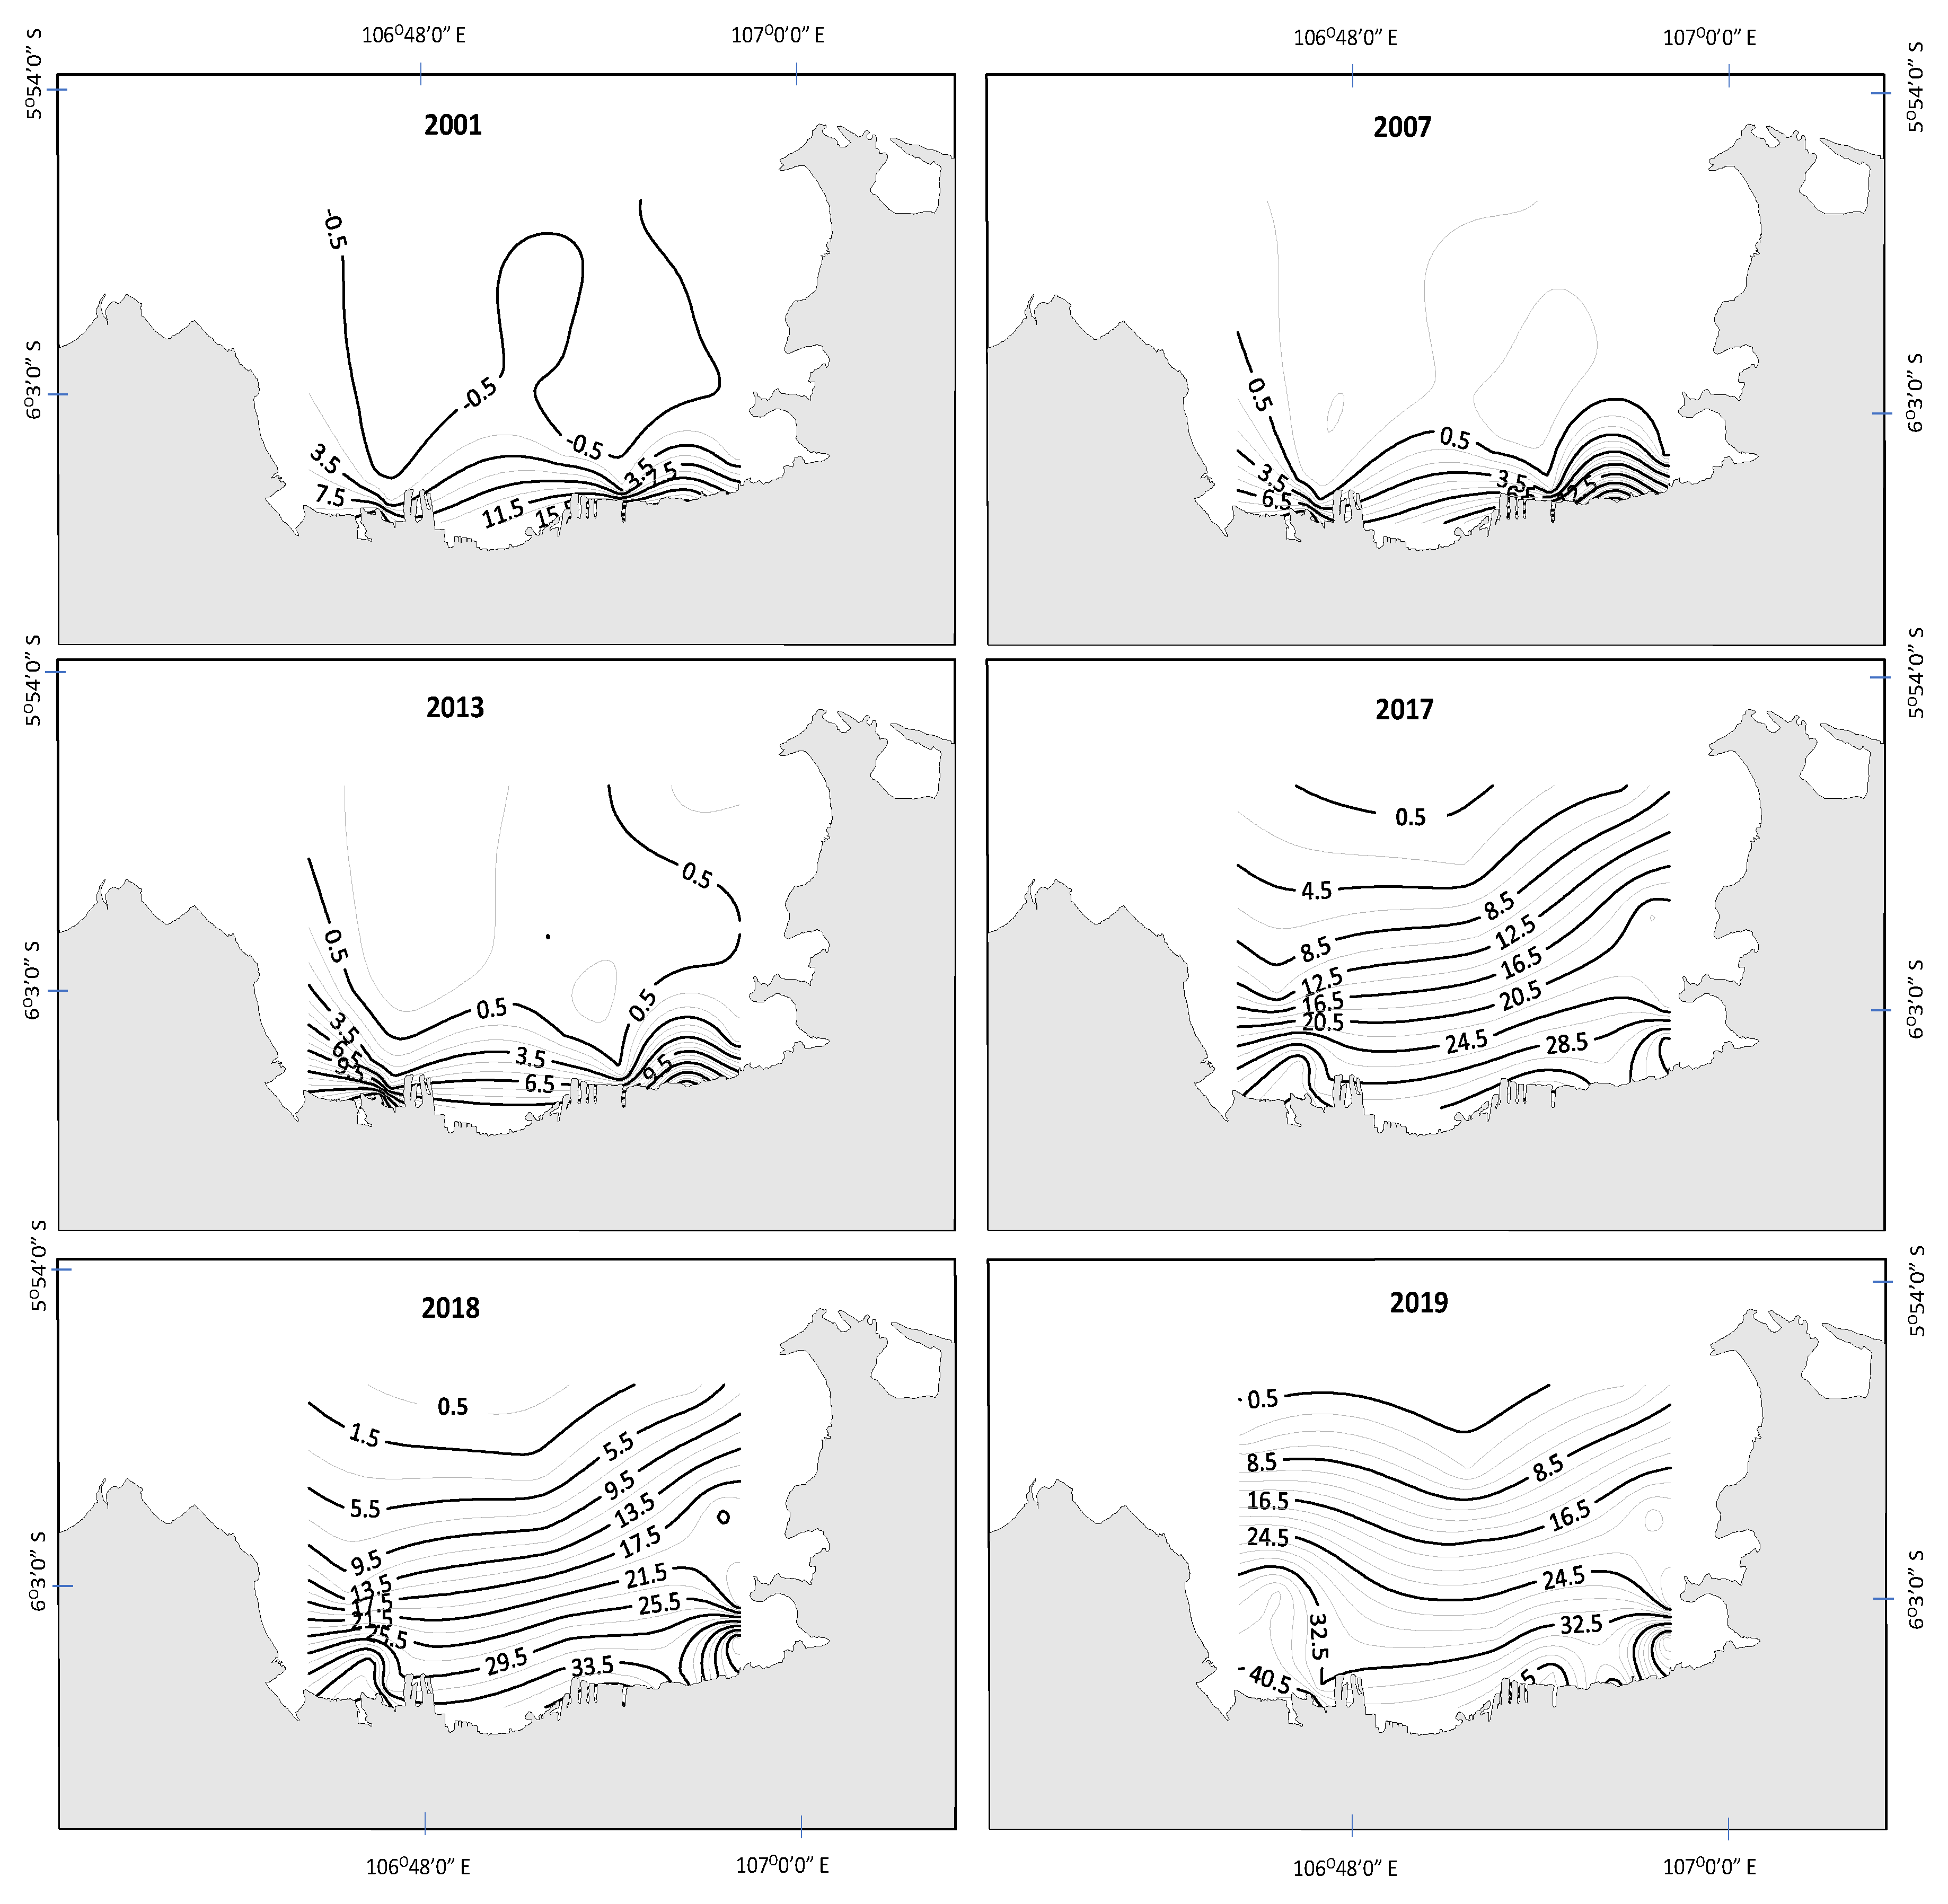
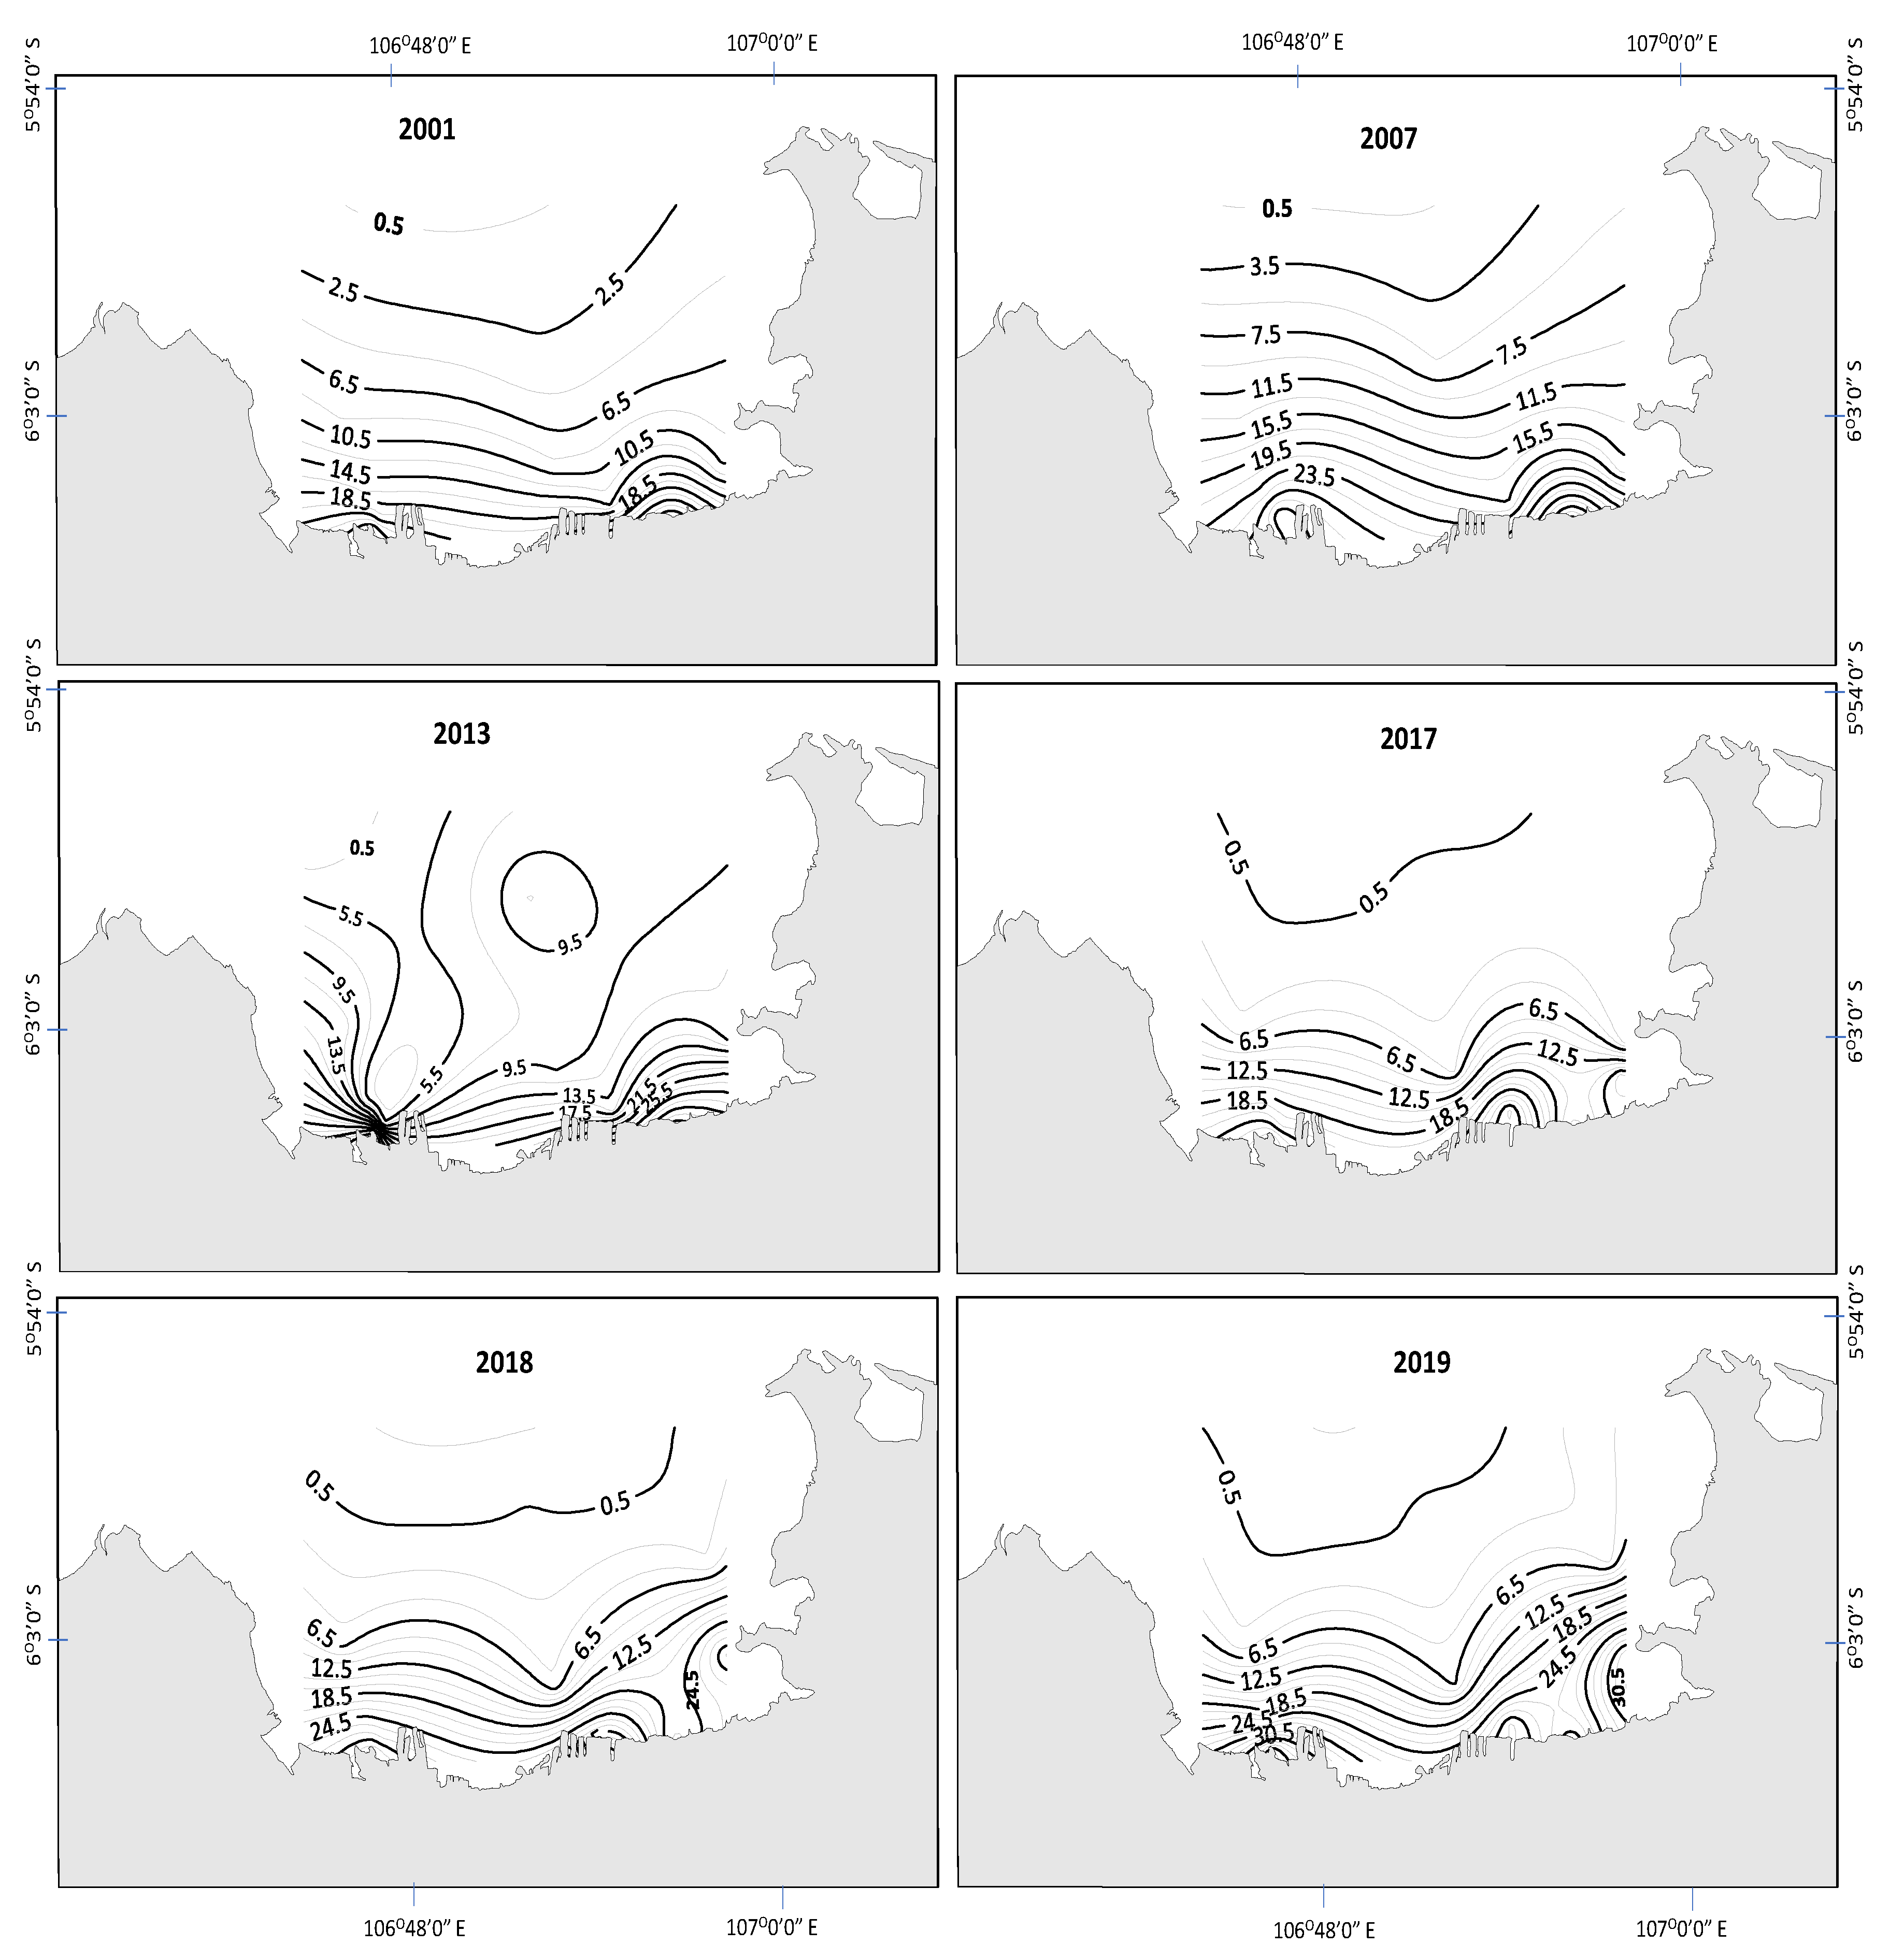
The DIN and phosphate concentrations of the outermost stations were 14 and 19 times lower than those of the river mouth stations, respectively (Table S1 and Figure 2, Figure 3, Figure 4 and Figure 5). There were significant spatial differences, with the highest nutrient levels observed at the river mouths and in near-shore waters (post hoc test result) (one-way ANOVA; p-value = 0.000259 and 0.00032, for DIN and phosphates, respectively—Table S2). These data indicate that nutrients are closely related to the salinity gradient (Figure 3), supporting the prominent role of riverine nutrient loads.
Temporally, there were increases in both the DIN and phosphate concentrations over the study period, with a minimum value in 2001 and a maximum in 2019. Significant temporal differences in mean nutrient concentrations were observed, with values in 2018 and 2019 (post hoc test result) being significantly higher than those of previous years, for both DIN and phosphates (one-way ANOVA; p-value = 2.327 × 10⁻⁹ and 1.875 × 10⁻⁸, for DIN and phosphates, respectively—Table S2). Two-way ANOVA test results show that there was a significant interaction between stations and years of measurement, highlighting a strong interaction between these two factors in affecting values of nutrients, light, and phytoplankton biomass (Table S3).
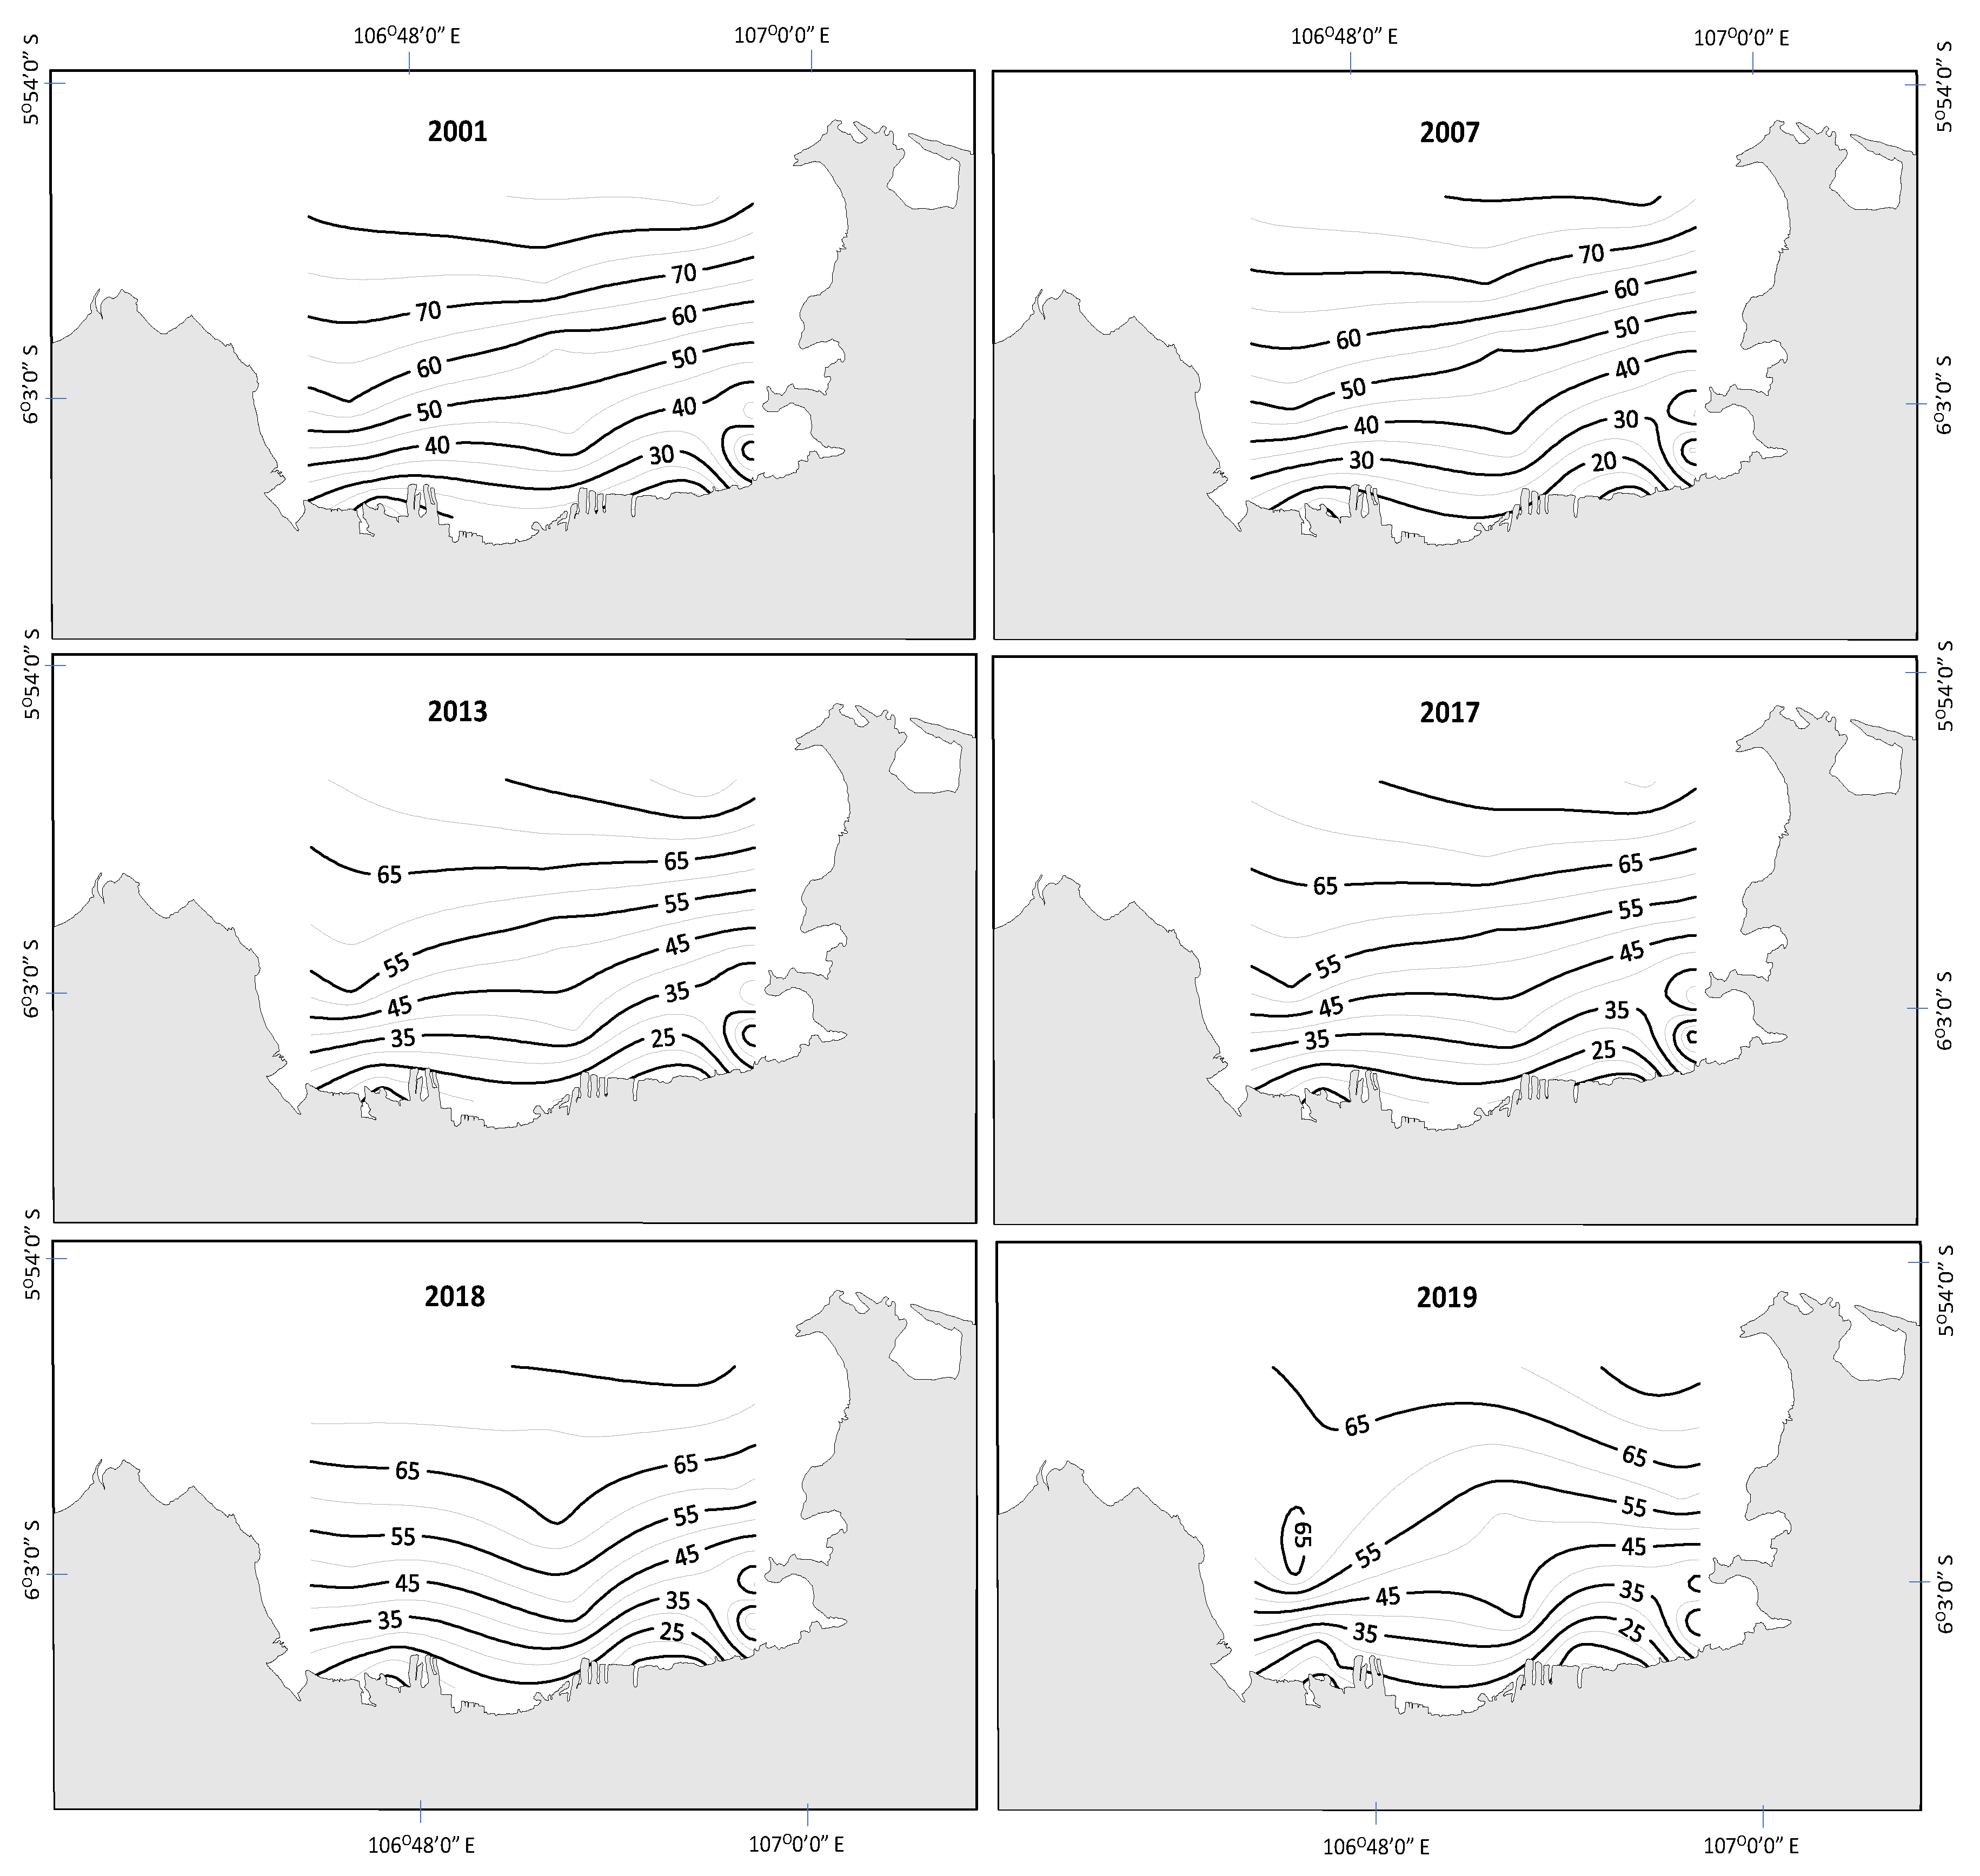
In contrast to nutrient concentrations, the spatial and temporal patterns of underwater light had low values at the river mouths and in adjacent waters and higher ones in the middle and outermost stations. The trend was significant (Table S2; one-way ANOVA; p-value = 2.188 × 10−52) and was strongly associated with the salinity gradient (Figure 3). The mean light value of river mouth stations was 10.22 µM photon m−2 s−1, while those of the inner, middle, and outer parts of the bay were 27.94, 55.06, and 73.17 µM photon m−2 s−1, respectively (Table S1). A significant temporal difference in light values was observed, with significantly lower values in 2018 and 2019 than other measurements (one-way ANOVA; p-value = 0.00247). As observed with nutrients, there is a significant interaction between stations and year of measurement in the values of underwater light (Table S3). The mean levels of light in 2001, 2007, 2013, 2017, 2018, and 2019 were 49.53, 40.25, 39.42, 42.21, 43.42, and 41.79 µM photon m−2 s−1, respectively (Table S1 and Figure 2 and Figure 6).
Figure 2 shows results of the post hoc test, highlighting the highest average of nutrients, light, and Chl-a across the type of station and year of measurement. In general, the results show that river mouth stations (M, A, and P) were the highest in nutrients and Chl-a, and 2018 and 2019 were the years in which nutrients, light, and Chl-a were significantly different.
Spatial and temporal comparisons of Chl-a concentrations showed significant differences among sampling stations and among study years (Table S2; one-way ANOVA). Spatially, the highest Chl-a concentrations were always observed at the river mouth stations and decreased sharply in the nearshore waters and middle part of the bay, reaching the lowest values at the outermost stations (Figure 7, Tables S1 and S2; one-way ANOVA; p-value = 1.974 × 10⁻⁸). This spatial gradient of phytoplankton biomass was closely related to that of salinity (Figure 3). The mean Chl-a concentration (from all years of observation) of river mouth stations was 38.26 µg L−1, while those of the inner, middle, and outer parts of the bay were 22.29 µg L−1, 5.69 µg L−1, and 3.14 µg L−1, respectively (Table S1). The highest Chl-a concentrations were observed in 2017, 2018, and 2019, while the lowest value was recorded in 2001 (Table S2; one-way ANOVA; p-value = 7.25 × 10⁻⁴). Table S1 and Figure 7 show the temporal distribution of mean Chl-a concentration over the years of this study. Two-way ANOVA result shows that significant interaction between factors was detected in influencing the variabilities in phytoplankton biomass (Table S3; p-value = 4.1 × 10−55).
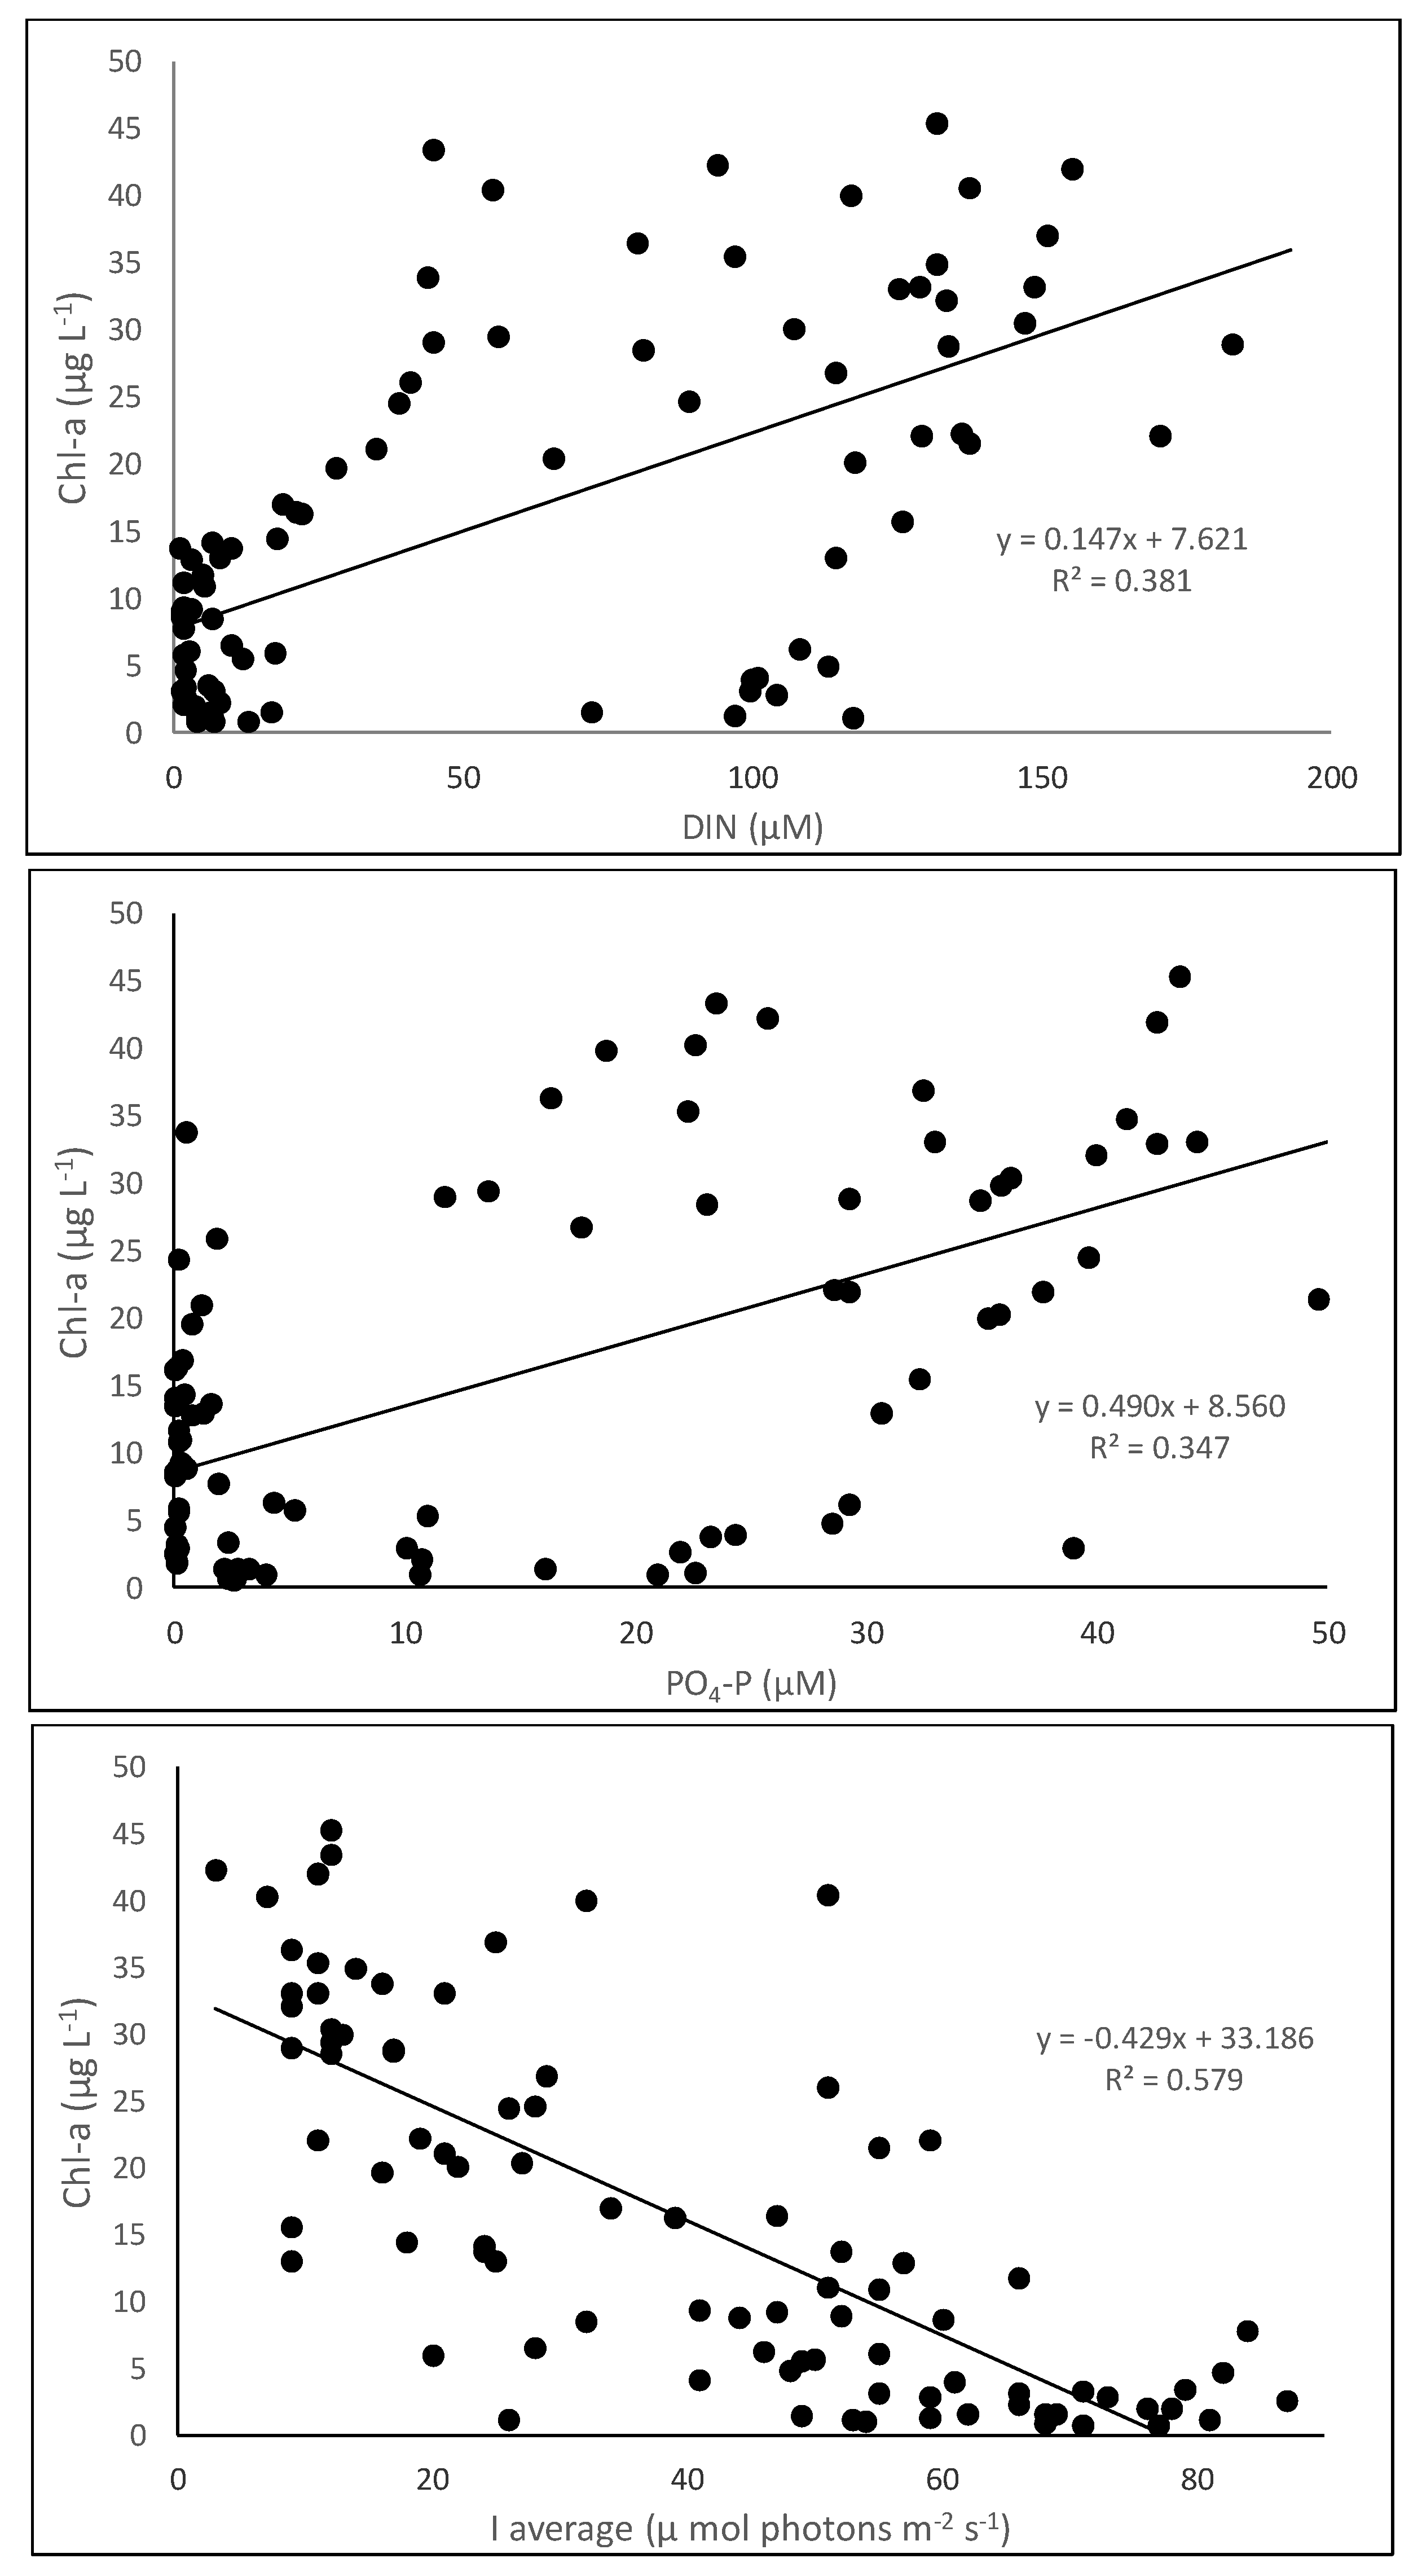
Linear regressions of the relationship between Chl-a and nutrients and light were performed on data from each year individually (Figure 8 and Table S4). Significant linear correlations were found between nutrients and Chl-a and between light and Chl-a (p-values < 0.005). In 2013, a nonsignificant linear correlation between light and Chl-a was observed (p-value = 0.016), while all other comparisons were significant. These regressions show that, in each year of observation, phytoplankton biomass variability was strongly correlated with both nutrients and underwater light variability.
To address a combined interaction between nutrients and light in the correlation with phytoplankton biomass, a multiple linear regression of DIN, phosphates, and light was conducted, resulting in the equation Chl-a = 26.45 + 0.00107 DIN + 0.23 phosphates − 0.35 light. In contrast to the single linear regression results, the results showed a significant correlation between light and Chl-a, while nutrients were insignificant (Table 2). Comparison of the relative effects of DIN and phosphates (p-values of DIN and phosphate are 0.9784 and 0.0744, respectively—Table 2) on the variability in phytoplankton biomass indicated that phosphates were relatively more significant, highlighting the important role of phosphates. Different results between multiple and single linear regression show that there is a multicollinearity of the independent variables in influencing phytoplankton biomass (Table 2), shown by high variance in the inflation factor (MIF) for DIN and phosphate and a low value for light. This means that, in single linear regression analysis, the individual roles of both DIN and phosphate in influencing the variabilities in Chl-a are significant, but if they are both analyzed together in a multiple regression, their individual effects on Chl-a were not significant, caused by inter-collinearity between them. It is seen in Table 2 that the MIF of DIN and phosphate are high in three-variable multi-regression, but they are low in the two-variable multi-regression.

3.2. Eutrophication State

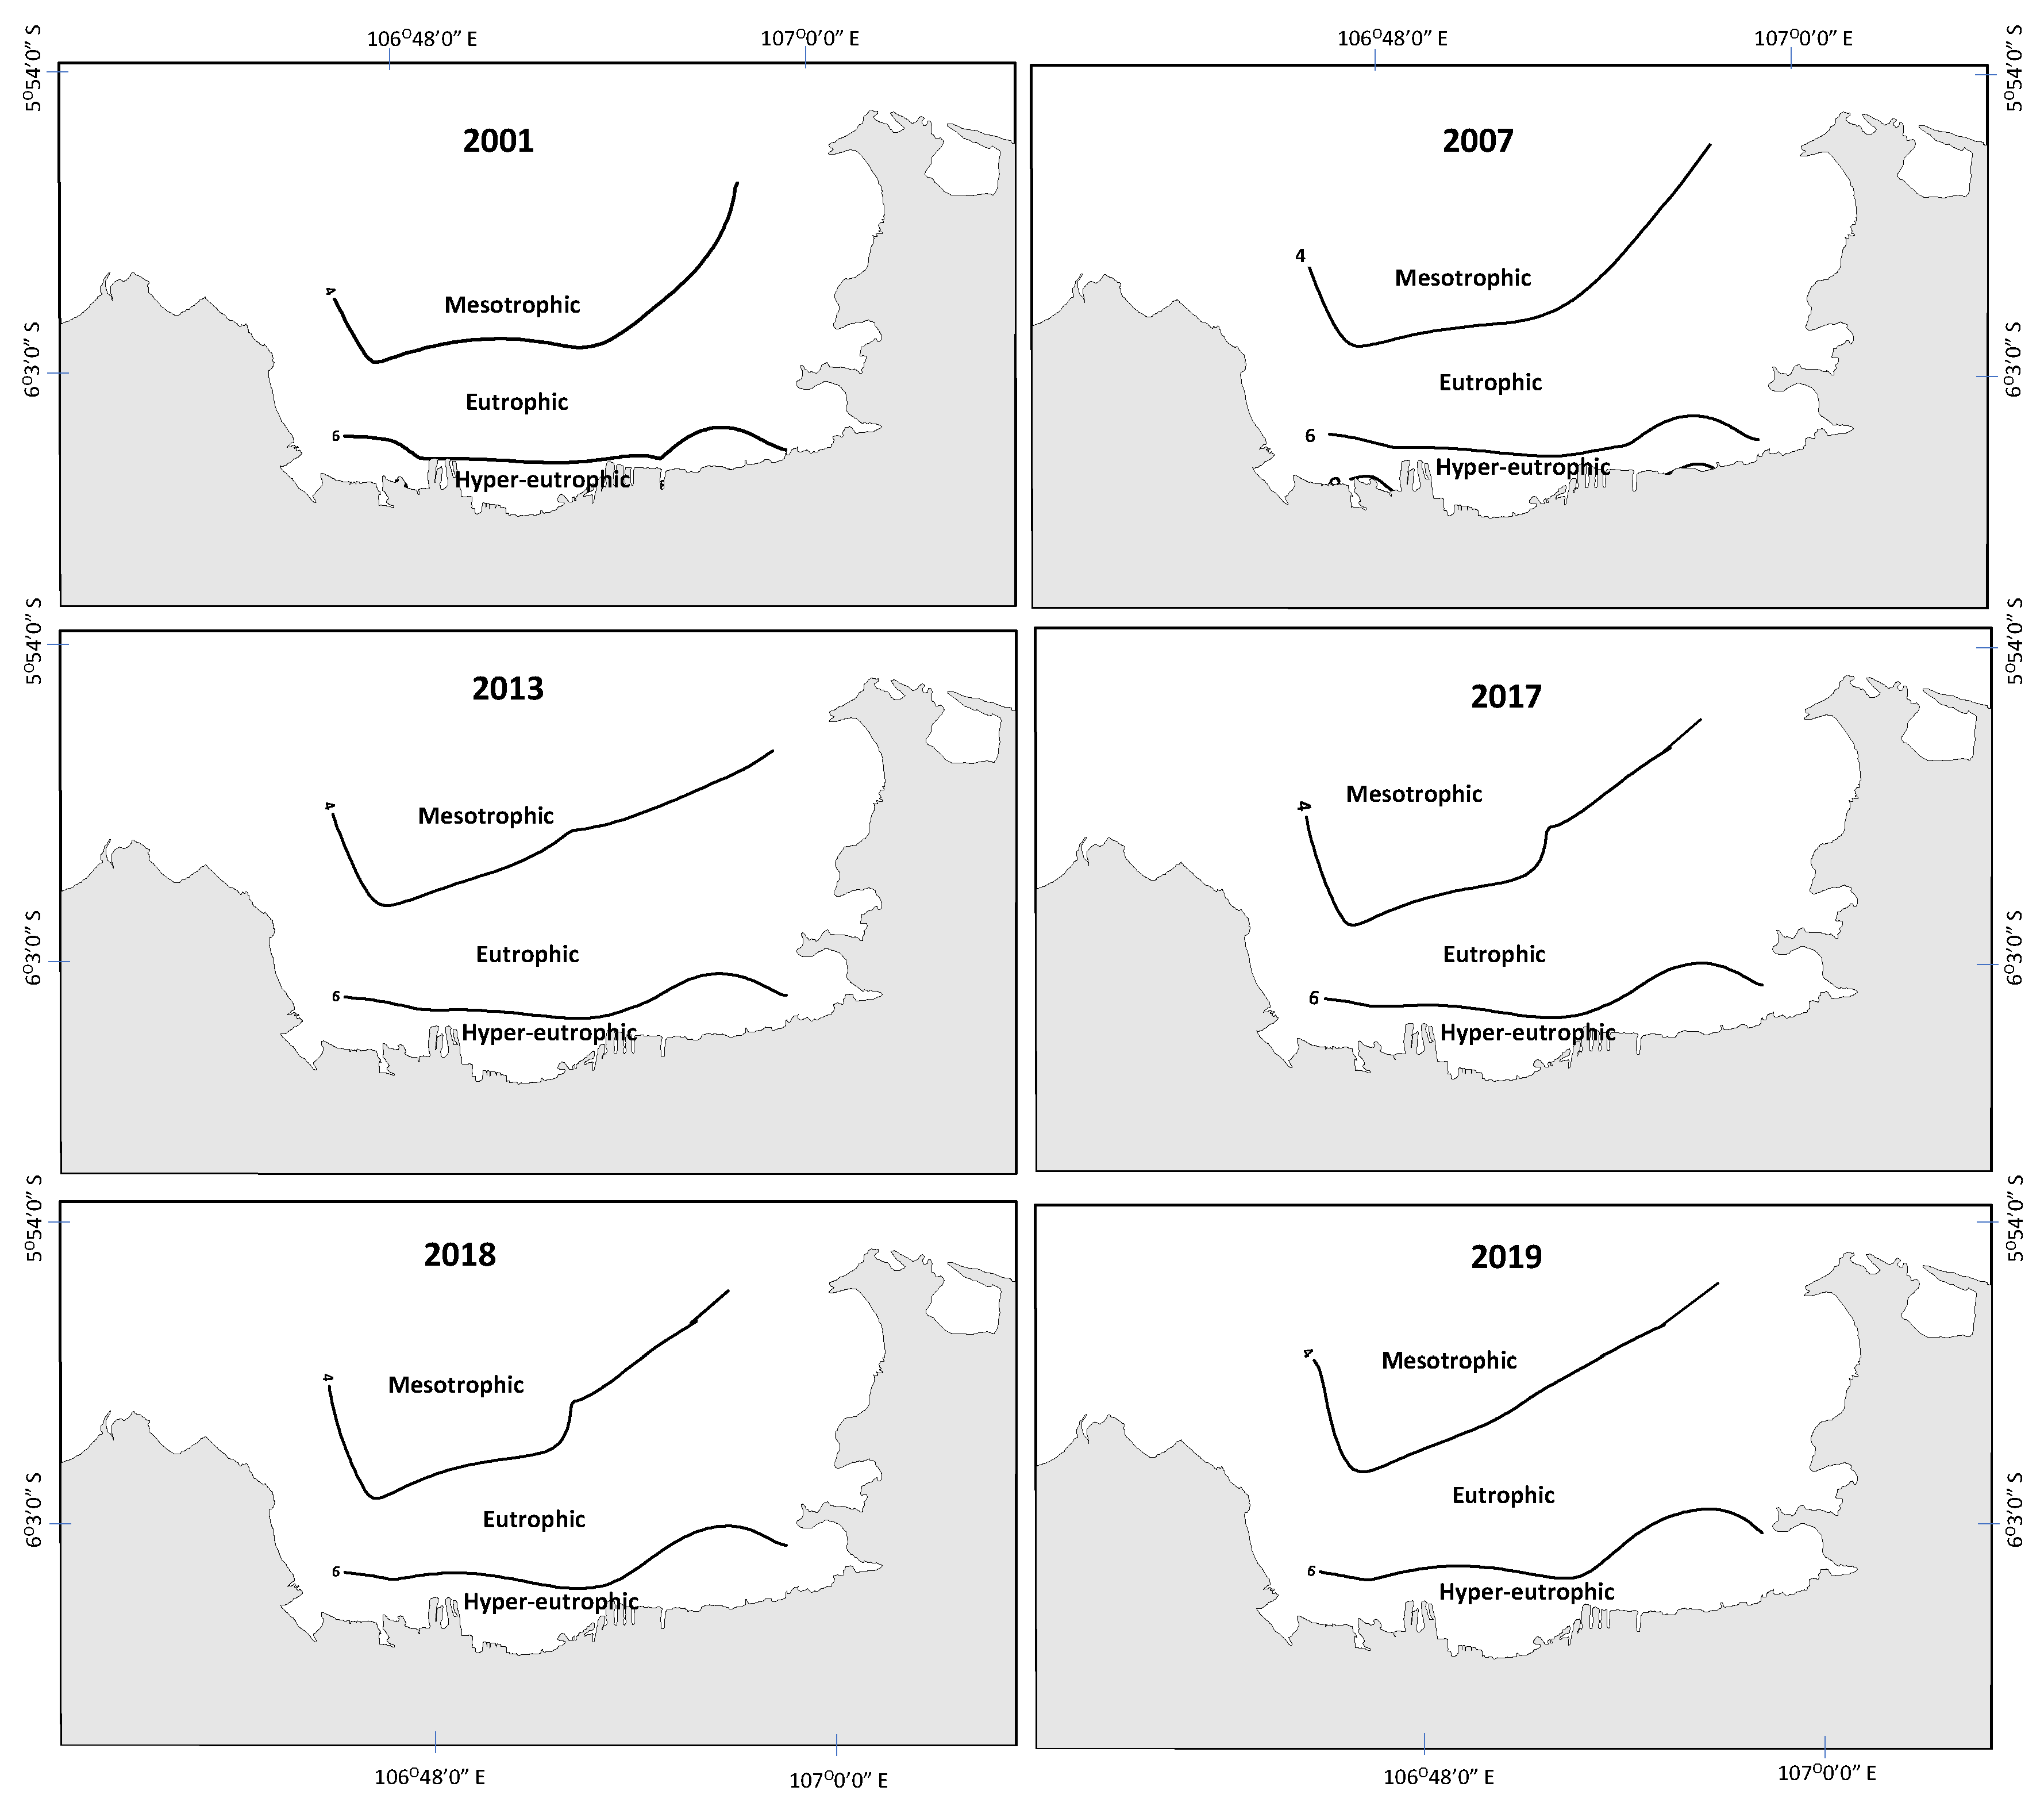
The results of TRIX calculation indicated a shift in the eutrophication levels of Jakarta Bay over the period from 2001 to 2019 (Figure 9). Three levels of eutrophication were identified: hyper-eutrophic, eutrophic, and mesotrophic; no oligotrophic areas were observed. The spatial distribution maps show an increase in the areas of hyper-eutrophic and eutrophic waters and reduction in the mesotrophic area over time. These results indicate that the eutrophication of Jakarta Bay progressed from 2001 to 2019 (Table 3). The hyper-eutrophic area increased to 114.0 km2 in 2019, which is more than 1.5 times the value from 2001 (75.1 km2). A similar increase was observed for the eutrophic area, which was around 1.13-fold larger in 2019 than in 2001 (186.21 to 211.73 km2). Conversely, the mesotrophic area decreased from 210.69 km2 in 2001 to 146.27 km2 in 2019 (Table 3).

4. Discussion

Monitoring of phytoplankton biomass, nutrients, and light from 2001 to 2019 in Jakarta Bay showed an increase in nutrients and phytoplankton biomass and a reduction in underwater light values. We observed an upsurge in nutrient concentrations between 2001 and 2019, which was particularly strong in the last 3 years of monitoring (2017, 2018, and 2019). This increase was followed by an increase in phytoplankton biomass, which was around 1.6-fold higher in 2019 than in 2001. Furthermore, the outer part of the bay, which always had relatively low phytoplankton biomass, showed an increase in 2019. This temporal increase in phytoplankton biomass was observed in all parts of the bay, with higher levels in 2019 relative to 2001. Mean phytoplankton biomass of this study is comparable to those of the Wadden Sea spring phytoplankton biomass of around 15 µg L−1 [22], Southern German Baltic Sea levels between 22 and 120 µg L−1 [27], and Neva Estuary Baltic Sea values ranging from 6.4 to 33.2 µg L−1 [3]. These values are higher than those for oligotrophic waters of the Eastern Adriatic Sea, which ranged from 2.79 to 4.73 µg L−1 [28], and the tropical Porong Estuary in Indonesia, which ranged from 2.51 to 4.75 µg L−1 [29].
The results presented an increase in biomass in river mouths and surrounding waters, correlating with and likely driven by the increase in nutrients. It is predicted that light may have become limiting to phytoplankton in these sites. Reduced underwater light has been reported in this area, possibly due to high levels of organic matter and turbidity as well as high phytoplankton biomass [12,14,30]. At the seaward sites of the bay, the phytoplankton community was more nutrient limited, as nutrient levels decreased due to dilution with the low-nutrient water of the Java Sea, as explained previously [31]. The mean DIN concentrations at the outermost stations were low and fell below KN, the half-saturation constant for nutrient for phytoplankton growth (i.e., 1.5 µM DIN [6]). For phosphates, the contents were even further below the corresponding K, i.e., 0.5 µM phosphates, resulting in strong nutrient limitation at the outermost sites. This spatial pattern of nutrients and phytoplankton biomass in Jakarta Bay has been reported in previous studies [6,13,17,30]. Numerous reports have explored the classic positive relationship between nutrients and phytoplankton biomass worldwide [32,33]. Studies on the relative importance of nutrients and light to phytoplankton growth have reported similar results, showing different effects of nutrients and light on phytoplankton biomass. This inverse pattern of influence has been reported in the Wadden Sea [34], the Ems–Dollard estuary [35], the Mississippi River [36], and North Sulawesi waters [37].
In this study, even though underwater light is negatively correlated with phytoplankton biomass, this does not mean that light directly influences phytoplankton biomass to this extent. Light penetration is influenced by phytoplankton biomass and vice versa; hence, this regression relationship indicates correlation but not causation. As previously observed [30], light penetration is also affected by light absorption and decreased penetration due to phytoplankton biomass. Another explanation is that the light-harvesting mechanism of phytoplankton cells is complex [7,22]. In the natural environment, where phytoplankton assemblages always consist of multiple species, the effects of light on overall growth of the phytoplankton community may be varied and unpredictable [34,38,39]. In the water column, these organisms drift vertically due to turbulence in the water column and may be entrained into deeper waters characterized by reduced illumination (below the euphotic depth) or raised to the surface, where light is abundant [22]. The availability of underwater light is determined through comparison of the euphotic (Zeu) and mixed layer (Zmix) depths [34], which makes it difficult to accurately determine the proportion of time that a phytoplankton assemblage spends at a particular depth [34]. Other considerations include the absolute amount of underwater irradiance available and the species-specific light-harvesting rate and coefficients [40,41]. Lippemeier et al. [42] demonstrated various responses of different species of phytoplankton to different irradiance levels through laboratory experiments.
Damar et al. [43] reported that the role of nutrients in phytoplankton growth in Jakarta Bay was more pronounced than that of light in turbid and high-nutrient coastal waters. In that study [43], the role of light in phytoplankton development appears to be confounded by its relationship with nutrient levels, resulting in the finding of a nonsignificant effect of light on phytoplankton development. In that study, high-nutrient, turbid waters appeared to be the main driver of this negative correlation. Similar results regarding the role of light in phytoplankton growth have been reported in the Wadden Sea [34], in the Banyuasin Estuary, Indonesia [44], and in the southern estuary of Vietnam [45]. In natural systems, light or nutrients cannot act as the sole factor regulating phytoplankton growth.
The sharp increase in nutrient concentration indicates intensified human activities in the corresponding watersheds, which facilitate the input of nutrients. This increase may be related to the increase in human population in the adjacent river basin from around 9.8 to 12.6 million people between 2001 and 2018 [16]. Another plausible reason for eutrophication was the direct disposal of 60–80% of domestic wastewater into the bay untreated [15]. Damar [10] reported on the three levels of eutrophication in Jakarta Bay in 2001. These included a hyper-eutrophic area, limited to a very narrow region along the shoreline, eutrophic waters observed mostly in the central bay, and mesotrophic offshore waters. In the present study, eutrophication levels of Jakarta Bay were calculated for the period from 2001 to 2019. The areas of hyper-eutrophic and eutrophic waters increased over the 19-year period. This increase was related to the elevated intensity of anthropogenic activities in the surrounding watersheds. The eastern area was the most affected by eutrophication, and this effect is likely related to physical hydrodynamic factors. The accumulation of phytoplankton biomass is facilitated in more enclosed areas of the bay and in calmer waters, leading to higher levels of eutrophication. Koropitan et al. [31] described a combination of physical factors associated with this phenomenon, while Sidabutar et al. [12] described the influence of stagnant water in the eastern part of the bay.
Some symptoms of coastal eutrophication were observed in Jakarta Bay, such as hypoxic near-bottom water [11], frequent algal blooms [11,12,13,14], and mass mortality of aquatic biota [46]. Severe impacts occur along the northern coast of Java and nearby islands, including in Lamongan, East Java coastal waters [47], at Lampung Bay [48], at the mouth of the Banyuasin River [44], and in Cirebon coastal waters [49]. Moreover, there was a reduction in fisheries’ production, as reported by Arifin [50] as well as Arifin and Fitriati [51]. Anthropogenic pressure on Jakarta Bay consists not only of the inputs of nutrients but also other types of pollution, e.g., hydrocarbon and heavy metals [52,53,54]. Contamination of fish and other aquatic biota in Jakarta Bay has been reported [54,55,56,57,58], reflecting the severe impact of anthropogenic activities on this tropical bay. Remediation of the eutrophication in Jakarta Bay and other tropical estuaries in the region is urgently needed to ensure the continued quality of estuarine ecosystem services and fisheries’ food products. Some measures that could be implemented immediately, as suggested previously, include implementation and operation of more domestic wastewater treatment facilities in the nearby densely populated watersheds containing Jakarta City [15,57].

5. Conclusions

Spatial patterns of phytoplankton biomass observed in this study are consistent with those described in previous studies conducted in the same area, showing high values in the high-nutrient nearshore waters and low in the low-nutrient offshore waters. In this study, nutrient variability was observed to significantly correlate with phytoplankton biomass. Meanwhile, the role of light cannot be clearly observed since phytoplankton biomass also vice versa affects light penetration into the water. During the study period, light penetration decreased and nutrient levels increased. Changes in phytoplankton biomass and eutrophication state were observed, in accordance with the increase in nutrients and decrease in underwater light. The observed changes reflect higher inputs of riverine nutrient loads from the surrounding watersheds, associated with increased anthropogenic activity in this area. These inputs are responsible for the increase in eutrophication, reaching a hyper-eutrophic state in the inner part of the bay, eutrophic state in the middle part, and mesotrophic state in the outer areas.

Supplementary Materials

The following is available online at https://www.mdpi.com/2077-1312/8/9/674/s1, Table S1. Mean and standard deviations of Dissolved Inorganic Nitrogen (DIN) (µM), phosphates (µM), light (µM photon m−2 s−1), and chlorophyll-a (Chl-a) (µg L−1) in Jakarta Bay. River mouths n = 12, Inner part n = 12; Middle part n = 24 and Outer part n = 12. Table S2. Results of the One-way ANOVA between stations and years of measurements in Jakarta Bay 2001–2019. Table S3. Results of the Two-Way ANOVA between stations and years of measurements in Jakarta Bay 2001–2019. Table S4. Results of regression analyses comparing dissolved inorganic nitrogen (DIN) vs. chlorophyll-a (Chl-a), phosphates vs. chlorophyll-a (Chl-a) and underwater light vs. chlorophyll-a (Chl-a).

Author Contributions

Conceptualization, A.D., F.C. and K.-J.H.; data curation, A.D.; formal analysis, A.D.; funding acquisition, A.D.; investigation, A.D., A.F., A.D.P., S.M.R., B.R. and A.R.; methodology, A.D., F.C., K.-J.H., L.A., Y. and A.D.P.; project administration, B.Y.R.; software, A.D.; supervision, A.D., F.C. and K.-J.H.; validation, A.D.; visualization, A.D.; writing—original draft, A.D.; writing—review and editing, A.D., F.C., K.-J.H., L.A., Y., A.F. and F.K. All authors have read and agreed to the published version of the manuscript.

Funding

This research was funded by the Deutscher Akademischer Austauschdienst (DAAD), Germany (A/99/09416, 1999), Directorate General of Higher Education, Ministry of Research and Technology and Higher Education, the Republic of Indonesia, grant number 011/SP2H/LT/DRPM/IV/2017, dated 20 April 2017, RG No.129/SP2H/PTNBH/DRPM/2018, dated 1 February 2018, and RG No. 3/E1/KP.PTNBH/2019, dated 29 March 2019.

Acknowledgments

The authors are grateful to the Forschungs-und Technologie Zentrum (FTZ)-Westkueste, Germany, the Center for Coastal and Marine Resources Studies, IPB University (PKSPL IPB), Indonesia, and the Directorate General of Higher Education, Ministry of Research and Technology and Higher Education, the Republic of Indonesia, that provided the research facilities, partial funding, and grant for the authors. Sincere thanks go to Mennofatria Boer for have advised the authors of some statistical data analysis. Figure 1 is redrawn from Deep Sea Res. Part II 2019, 163 72-86, Damar, A.; Hesse, K.-J.; Colijn, F.; Yonvitner, The eutrophication states of the Indonesian sea large marine ecosystem: Jakarta Bay, 2001–2013, Page No.: 73., 4860830085146 (2020), with permission from Elsevier.

Conflicts of Interest

We declare that we do not have any conflict of interest related to this research and publication.

References

  1. Cloern, J.E. Our evolving conceptual model of the coastal eutrophication problem. Mar. Ecol. Prog. Ser. 2001, 210, 223–253. [Google Scholar] [CrossRef]
  2. Cloern, J.E.; Schraga, T.S.; Nejad, E.; Martin, C. Nutrient Status of San Francisco Bay and Its Management Implications. Estuar. Coast. 2020, 43, 1299–1317. [Google Scholar] [CrossRef] [Green Version]
  3. Golubkov, M.; Golubkov, S. Eutrophication in the Neva Estuary (Baltic Sea): Response to temperature and precipitation patterns. Mar. Freshw. Res. 2020, 71, 583–595. [Google Scholar] [CrossRef]
  4. Townhill, B.L.; Tinker, J.; Jones, M.; Pitois, S.; Creach, V.; Dye, S.D.S.; Bear, E.; Pinnegar, J.K. Harmful algal blooms and climate change: Exploring future distribution changes. ICES J. Mar. Sci. 2018, 75, 1882–1893. [Google Scholar] [CrossRef] [Green Version]
  5. Zhang, J.; Xiao, T.; Huang, D.; Liu, S.M.; Fang, J. Eutrophication and hypoxia and their impacts on the ecosystem of the Changjiang Estuary and adjacent coastal environment. J. Mar. Syst. 2016, 154, 1–4. [Google Scholar] [CrossRef]
  6. Cloern, J.E. The relative importance of light and nutrient limitation of phytoplankton growth: A simple index of coastal ecosystem sensitivity to nutrient enrichment. Aquat. Ecol. 1999, 33, 3–16. [Google Scholar] [CrossRef]
  7. Colijn, F.; Hesse, K.-J.; Ladwig, N.; Tillmann, U. Effects of the large-scale uncontrolled fertilisation process along the continental coastal North Sea. Hydrobiologia 2002, 484, 133–148. [Google Scholar] [CrossRef]
  8. Kocum, E.; Underwood, G.J.C.; Nedwell, D.B. Simultaneous measurement of phytoplanktonic primary production, nutrient, and light availability along a turbid, eutrophic UK east coast estuary (the Colne Estuary). Mar. Ecol. Prog. Ser. 2002, 231, 1–12. [Google Scholar] [CrossRef] [Green Version]
  9. Damar, A.; Colijn, F.; Hesse, K.-J. Effects of different nutrient loadings on planktonic primary production in embayments of Indonesia. J. Trop. Biol. Conserv. 2014, 11, 63–85. [Google Scholar]
  10. Damar, A.; Colijn, F.; Hesse, K.-J.; Wardiatno, Y. The eutrophication states of Jakarta, Lampung and Semangka Bays: Nutrient and phytoplankton dynamics in Indonesian tropical waters. J. Trop. Biol. Conserv. 2012, 9, 61–81. [Google Scholar]
  11. Ladwig, N.; Hesse, K.-J.; van der Wulp, S.A.; Damar, A.; Koch, D. Pressure on oxygen levels of Jakarta Bay. Mar. Pollut. Bull. 2016, 110, 665–674. [Google Scholar] [CrossRef] [PubMed]
  12. Sidabutar, T.; Srimariana, E.S. The Connectivity of Nutrient Ratios on The Abundance of Phytoplankton Population In Jakarta Bay. E3S Web Conf. 2020, 147, 02012. [Google Scholar] [CrossRef] [Green Version]
  13. Sidabutar, T.; Srimariana, E.S.; Wouthuyzen, S. The potential role of eutrophication, tidal and climatic on the rise of algal bloom phenomenon in Jakarta Bay. IOP Conf. Ser. EES 2020, 429, 012021. [Google Scholar] [CrossRef]
  14. Yuliana. Implikasi perubahan ketersediaan nutrien terhadap perkembangan pesat (blooming) fitoplankton di Perairan Teluk Jakarta. Ph.D. Thesis, Bogor Agricultural University, Bogor, Indonesia, 2012. [Google Scholar]
  15. van der Wulp, S.A.; Damar, A.; Ladwig, N.; Hesse, K.-J. Numerical simulations of river discharges, nutrient flux and nutrient dispersal in Jakarta Bay, Indonesia. Mar. Pollut. Bull. 2016, 110, 675–685. [Google Scholar] [CrossRef]
  16. BPS. Provinsi DKI Jakarta Dalam Angka 2018/DKI Jakarta Province in Figures 2018; Badan Pusat Statistik (BPS) Provinsi DKI Jakarta: Jakarta, Indonesia, 2018; p. 581, Nomor Katalog: 1102001.31, Nomor Publikasi: 31560.1803. (Unpublished Document). [Google Scholar]
  17. Damar, A.; Hesse, K.-J.; Colijn, F.; Yonvitner. The eutrophication states of the Indonesian sea large marine ecosystem: Jakarta Bay, 2001–2013. Deep Sea Res. Part II 2019, 163, 72–86. [Google Scholar] [CrossRef]
  18. Prismayanti, A.D.; Damar, A.; Pratiwi, N.T.M. Distributions of dissolved inorganic nitrogen to estimate trophic state in Jakarta Bay. IOP Conf. Series: EES 2019, 241, 012023. [Google Scholar] [CrossRef]
  19. Grasshoff, K.; Kremling, K.; Ehrhardt, M. Methods of Seawater Analysis; Verlag Chemie: Weinheim/Deerfield Beach, FL, USA, 1983; p. 419. [Google Scholar]
  20. Lorenzen, C.J. Determination of Chlorophyll and Pheopigments: Spectrophotometric Equations. Limnol. Oceanogr. 1967, 12, 343–346. [Google Scholar] [CrossRef]
  21. Lalli, C.M.; Parsons, P.R. Biological Oceanography. An Introduction, 2nd ed.; Elsevier Butterworth-Heinemann: Oxford, UK, 1997. [Google Scholar]
  22. Tillmann, U.; Hesse, K.-J.; Colijn, F. Planktonic primary production in the German Wadden Sea. J. Plankton Res. 2000, 22, 1253–1276. [Google Scholar] [CrossRef]
  23. Vollenweider, R.A.; Giovanardi, F.; Montanari, G.; Rinaldi, A. Characterisation of the trophic conditions of marine coastal waters with special reference to the NW Adriatic Sea: Proposal for a trophic scale, turbidity and generalised water quality index. Environmetrics 1998, 9, 329–357. [Google Scholar] [CrossRef]
  24. Caiaffa, E. European marine information system: EUMARIS. In Proceedings of the OCEANS 2000 MTS/IEEE Conference and Exhibition. Conference Proceedings (Cat. No.00CH37158), Providence, RI, USA, 11–14 September 2000; p. 44. [Google Scholar]
  25. Ærtebjerg, G.; Carstensen, J.; Dahl, K.; Hansen, J.; Nygard, K.; Rygg, B.; Sørensen, K.; Severinsen, G.; Casartelli, S.; Schrimpf, W.; et al. Eutrophication in Europe’s Coastal Waters; European Environmental Agency: Copenhagen, Denmark, 2001; p. 86. [Google Scholar]
  26. Pérez-Ruzafa, A.; Campillo, S.; Fernández-Palacios, J.M.; García-Lacunza, A.; García-Oliva, M.; Ibañez, H.; Navarro-Martínez, P.C.; Pérez-Marcos, M.; Pérez-Ruzafa, I.M.; Quispe-Becerra, J.I.; et al. Long-term dynamic in nutrients, chlorophyll a, and water quality parameters in a coastal lagoon during a process of eutrophication for decades, a sudden break and a relatively rapid recovery. Front. Mar. Sci. 2019, 6, 26. [Google Scholar] [CrossRef] [Green Version]
  27. Berthold, M.; Karsten, U.; Weber, M.v.; Bachor, A.; Schumann, R. Phytoplankton can bypass nutrient reductions in eutrophic coastal water bodies. Ambio 2018, 47 (Suppl. 1), 146–158. [Google Scholar] [CrossRef] [PubMed] [Green Version]
  28. Bužančić, M.; Gladan, Ž.N.; Marasović, I.; Kušpilić, G.; Grbec, B. Eutrophication influence on phytoplankton community composition in three bays on the eastern Adriatic coast. Oceanologia 2016, 58, 302–316. [Google Scholar] [CrossRef] [Green Version]
  29. Damar, A. Net Phytoplankton Community Structure and Its Biomass Dynamics in the Brantas River Estuary, Java, Indonesia. In Coastal Environments: Focus on Asian Regions; Subramanian, V., Ed.; Springer: Dordrecht, The Netherlands, 2012. [Google Scholar]
  30. Sidabutar, T.; Bengen, D.G.; Wouthuyzen, S.; Partono, T. The abundance of phytoplankton and its relationship to the N/P ratio in Jakarta Bay, Indonesia. Biodiversitas 2016, 17, 673–678. [Google Scholar] [CrossRef]
  31. Koropitan, A.F.; Ikeda, M.; Damar, A.; Yamanaka, Y. Influences of physical processes on the ecosystem of Jakarta Bay: A coupled physical-ecosystem model experiment. ICES J. Mar. Sci. 2009, 66, 336–348. [Google Scholar] [CrossRef] [Green Version]
  32. Dring, M.J. The Biology of Marine Plants; Edward Arnold Limited: London, UK, 1982; p. 129. [Google Scholar]
  33. Margalef, R. Life-forms of phytoplankton as survival alternatives in an unstable environment. Oceanol. Acta 1978, 1, 493–509. [Google Scholar]
  34. Colijn, F.; Cadée, G.C. Is phytoplankton growth in the Wadden Sea light or nitrogen limited? J. Sea Res. 2003, 49, 83–93. [Google Scholar] [CrossRef]
  35. Colijn, F. Primary Production in the Ems-Dollard Estuary. Ph.D. Thesis, State University Groningen, Groningen, The Netherlands, 1983. [Google Scholar]
  36. Lohrenz, S.E.; Fahnenstiel, G.L.; Redalje, D.G.; Lang, G.A.; Dagg, M.J.; Whitledge, T.E.; Dortch, Q. Nutrients, irradiance, and mixing as factors regulating primary production in coastal waters impacted by the Mississippi River plume. Cont. Shelf Res. 1999, 19, 1113–1141. [Google Scholar] [CrossRef]
  37. Tang, S.; Rachman, A.; Fitria, N.; Thoha, H.; Chen, B. Phytoplankton changes during SE monsoonal period in the Lembeh Strait of North Sulawesi, Indonesia, from 2012 to 2015. Acta Oceanol. Sin. 2018, 37, 9–17. [Google Scholar] [CrossRef]
  38. Domingues, R.B.; Barbosa, A.; Galvão, H. Nutrients, light and phytoplankton succession in a temperate estuary (the Guadiana, south-western Iberia). Estuar. Coast. Shelf Sci. 2005, 64, 249–260. [Google Scholar] [CrossRef]
  39. Lemley, D.A.; Adams, J.B.; Strydom, N.A. Triggers of phytoplankton bloom dynamics in permanently eutrophic waters of a South African estuary. Afr. J. Aquat. Sci. 2018, 43, 229–240. [Google Scholar] [CrossRef]
  40. Huisman, J.; Sommeijer, B. Population dynamics of sinking phytoplankton in light-limited environments: Simulation techniques and critical parameters. J. Sea Res. 2002, 48, 83–96. [Google Scholar] [CrossRef]
  41. Platt, T.; Gallegos, C.K.; Harrison, W.G. Photoinhibition of photosynthesis in natural assemblages of marine phytoplankton. J. Mar. Res. 1980, 38, 687–701. [Google Scholar]
  42. Lippemeier, S.; Hintze, R.; Vanselow, K.H.; Hartig, P.; Colijn, F. In-line recording of PAM fluorescence of phytoplankton cultures as a new tool for studying effects of fluctuating nutrient supply on photosynthesis. Eur. J. Phycol. 2001, 36, 89–100. [Google Scholar] [CrossRef]
  43. Damar, A.; Colijn, F.; Hesse, K.-J.; Kurniawan, F. Coastal Phytoplankton Pigments Composition in Three Tropical Estuaries of Indonesia. J. Mar. Sci. Eng. 2020, 8, 311. [Google Scholar] [CrossRef]
  44. Aryawati, R.; Bengen, D.G.; Prartono, T.; Zulkifli, H. Harmful Algal in Banyuasin Coastal Waters, South Sumatera. Biosaintifika 2016, 8, 231–239. [Google Scholar] [CrossRef] [Green Version]
  45. Nguyen, T.T.N.; Némery, J.; Gratiot, N.; Strady, E.; Tran, V.Q.; Nguyen, A.T.; Aimé, J.; Peyne, A. Nutrient dynamics and eutrophication assessment in the tropical river system of Saigon-Dongnai (southern Vietnam). Sci. Total Environ. 2019, 653, 370–383. [Google Scholar] [CrossRef]
  46. Breckwoldt, A.; Dsikowitzky, L.; Baum, G.; Ferse, S.C.A.; Wulp, S.v.d.; Kusumanti, I.; Ramadhan, A.; Adrianto, L. A review of stressors, uses and management perspectives for the larger Jakarta Bay Area, Indonesia. Mar. Pollut. Bull. 2016, 110, 790–794. [Google Scholar] [CrossRef]
  47. Choirun, A.; Sari, S.H.J.; Iranawati, F. Phytoplankton Harmfull Algae Bloom (Hab) Identification during Tide Period in Brondong Coastal Waters, Lamongan, East Java. Torani J. Fish. Mar. Sci. 2015, 25, 58–66. [Google Scholar]
  48. Barokah, G.R.; Putri, A.K.; Gunawan. The Abundance of Phytoplankton Causing HAB (Harmful Algal Bloom) in Lampung Bay during West and East Monsoon. JPB Kelaut. dan Perikan. 2016, 11, 115–126. [Google Scholar]
  49. Buditama, G.; Damayanti, A.; Pin, T.G. Identifying Distribution of Chlorophyll-a Concentration Using Landsat 8 OLI on Marine Waters Area of Cirebon. IOP Conf. Ser. EES 2017, 98, 012040. [Google Scholar] [CrossRef]
  50. Arifin, Z. Trend of coastal pollution of Jakarta Bay Indonesia: Its implication for fishery and recreational activities. In Proceedings of the International Workshop on Coastal Resources Exploration and Conservation; Rachmawati, Aldrian, R.E., Hendiarti, N., Tejakusuma, I., Eds.; Badan Pengkajian dan Penerapan Teknologi Jakarta: Jakarta, Indonesia, 2004; pp. 16–21. [Google Scholar]
  51. Arifin, Z.; Fitriati, M. Green mussels cultured in highly polluted area of Jakarta Bay, in Indonesia. In International Conference on Hubs, Harbours and Deltas in Southeast Asia: Multidisciplinary and Intercultural Perspectives; Verhasselt, Y., Ed.; Royal Academy of Overseas Sciences Brussel: Brussels, Belgium, 2006; pp. 525–536. [Google Scholar]
  52. Dsikowitzky, L.; Sträter, M.; Dwiyitno, D.; Ariyani, F.; Irianto, H.E.; Schwarzbauer, J. First comprehensive screening of lipophilic organic contaminants in surface waters of the megacity Jakarta, Indonesia. Mar. Pollut. Bull. 2016, 110, 654–664. [Google Scholar] [CrossRef] [PubMed]
  53. Dsikowitzky, L.; Van der Wulp, S.A.; Dwiyitno, D.; Ariyani, F.; Hesse, K.-J.; Damar, A.; Schwarzbauer, J. Transport of pollution from the megacity Jakarta into the ocean: Insights from organic pollutant mass fluxes along the Ciliwung River. Estuar. Coast. Shelf Sci. 2018, 215, 219–228. [Google Scholar] [CrossRef]
  54. Dwiyitno, D.; Dsikowitzky, L.; Nordhaus, I.; Andarwulan, N.; Irianto, H.E.; Lioe, H.N.; Ariyani, F.; Kleinertz, S.; Schwarzbauer, J. Accumulation patterns of lipophilic organic contaminants in surface sediments and in economic important mussel and fish species from Jakarta Bay, Indonesia. Mar. Pollut. Bull. 2016, 110, 767–777. [Google Scholar] [CrossRef]
  55. Baum, G.; Kegler, P.; Scholz-Böttcher, B.M.; Alfiansah, Y.R.; Abrar, M.; Kunzmann, A. Metabolic performance of the coral reef fish Siganus guttatus exposed to combinations of water borne diesel, an anionic surfactant and elevated temperature in Indonesia. Mar. Pollut. Bull. 2016, 110, 735–746. [Google Scholar] [CrossRef] [PubMed]
  56. Huhn, M.; Hattich, G.S.I.; Zamani, N.P.; Juterzenka, K.V.; Lenz, M. Tolerance to stress differs between Asian greenmussels Perna viridis from the impacted Jakarta Bay and from natural habitats along the coast of West Java. Mar. Pollut. Bull. 2016, 110, 757–766. [Google Scholar] [CrossRef] [PubMed]
  57. Kunzmann, A.; Arifin, Z.; Baum, G. Pollution of Coastal Areas of Jakarta Bay: Water Quality And Biological Responses. Mar. Res. Indones. 2018, 43, 37–51. [Google Scholar] [CrossRef]
  58. Oetama, V.S.P.; Hennersdorf, P.; Abdul-Aziz, M.A.; Mrotzek, G.; Haryanti, H.; Saluz, H.P. Microbiome analysis and detection of pathogenic bacteria of Penaeus monodon from Jakarta Bay and Bali. Mar. Pollut. Bull. 2016, 110, 718–725. [Google Scholar] [CrossRef]
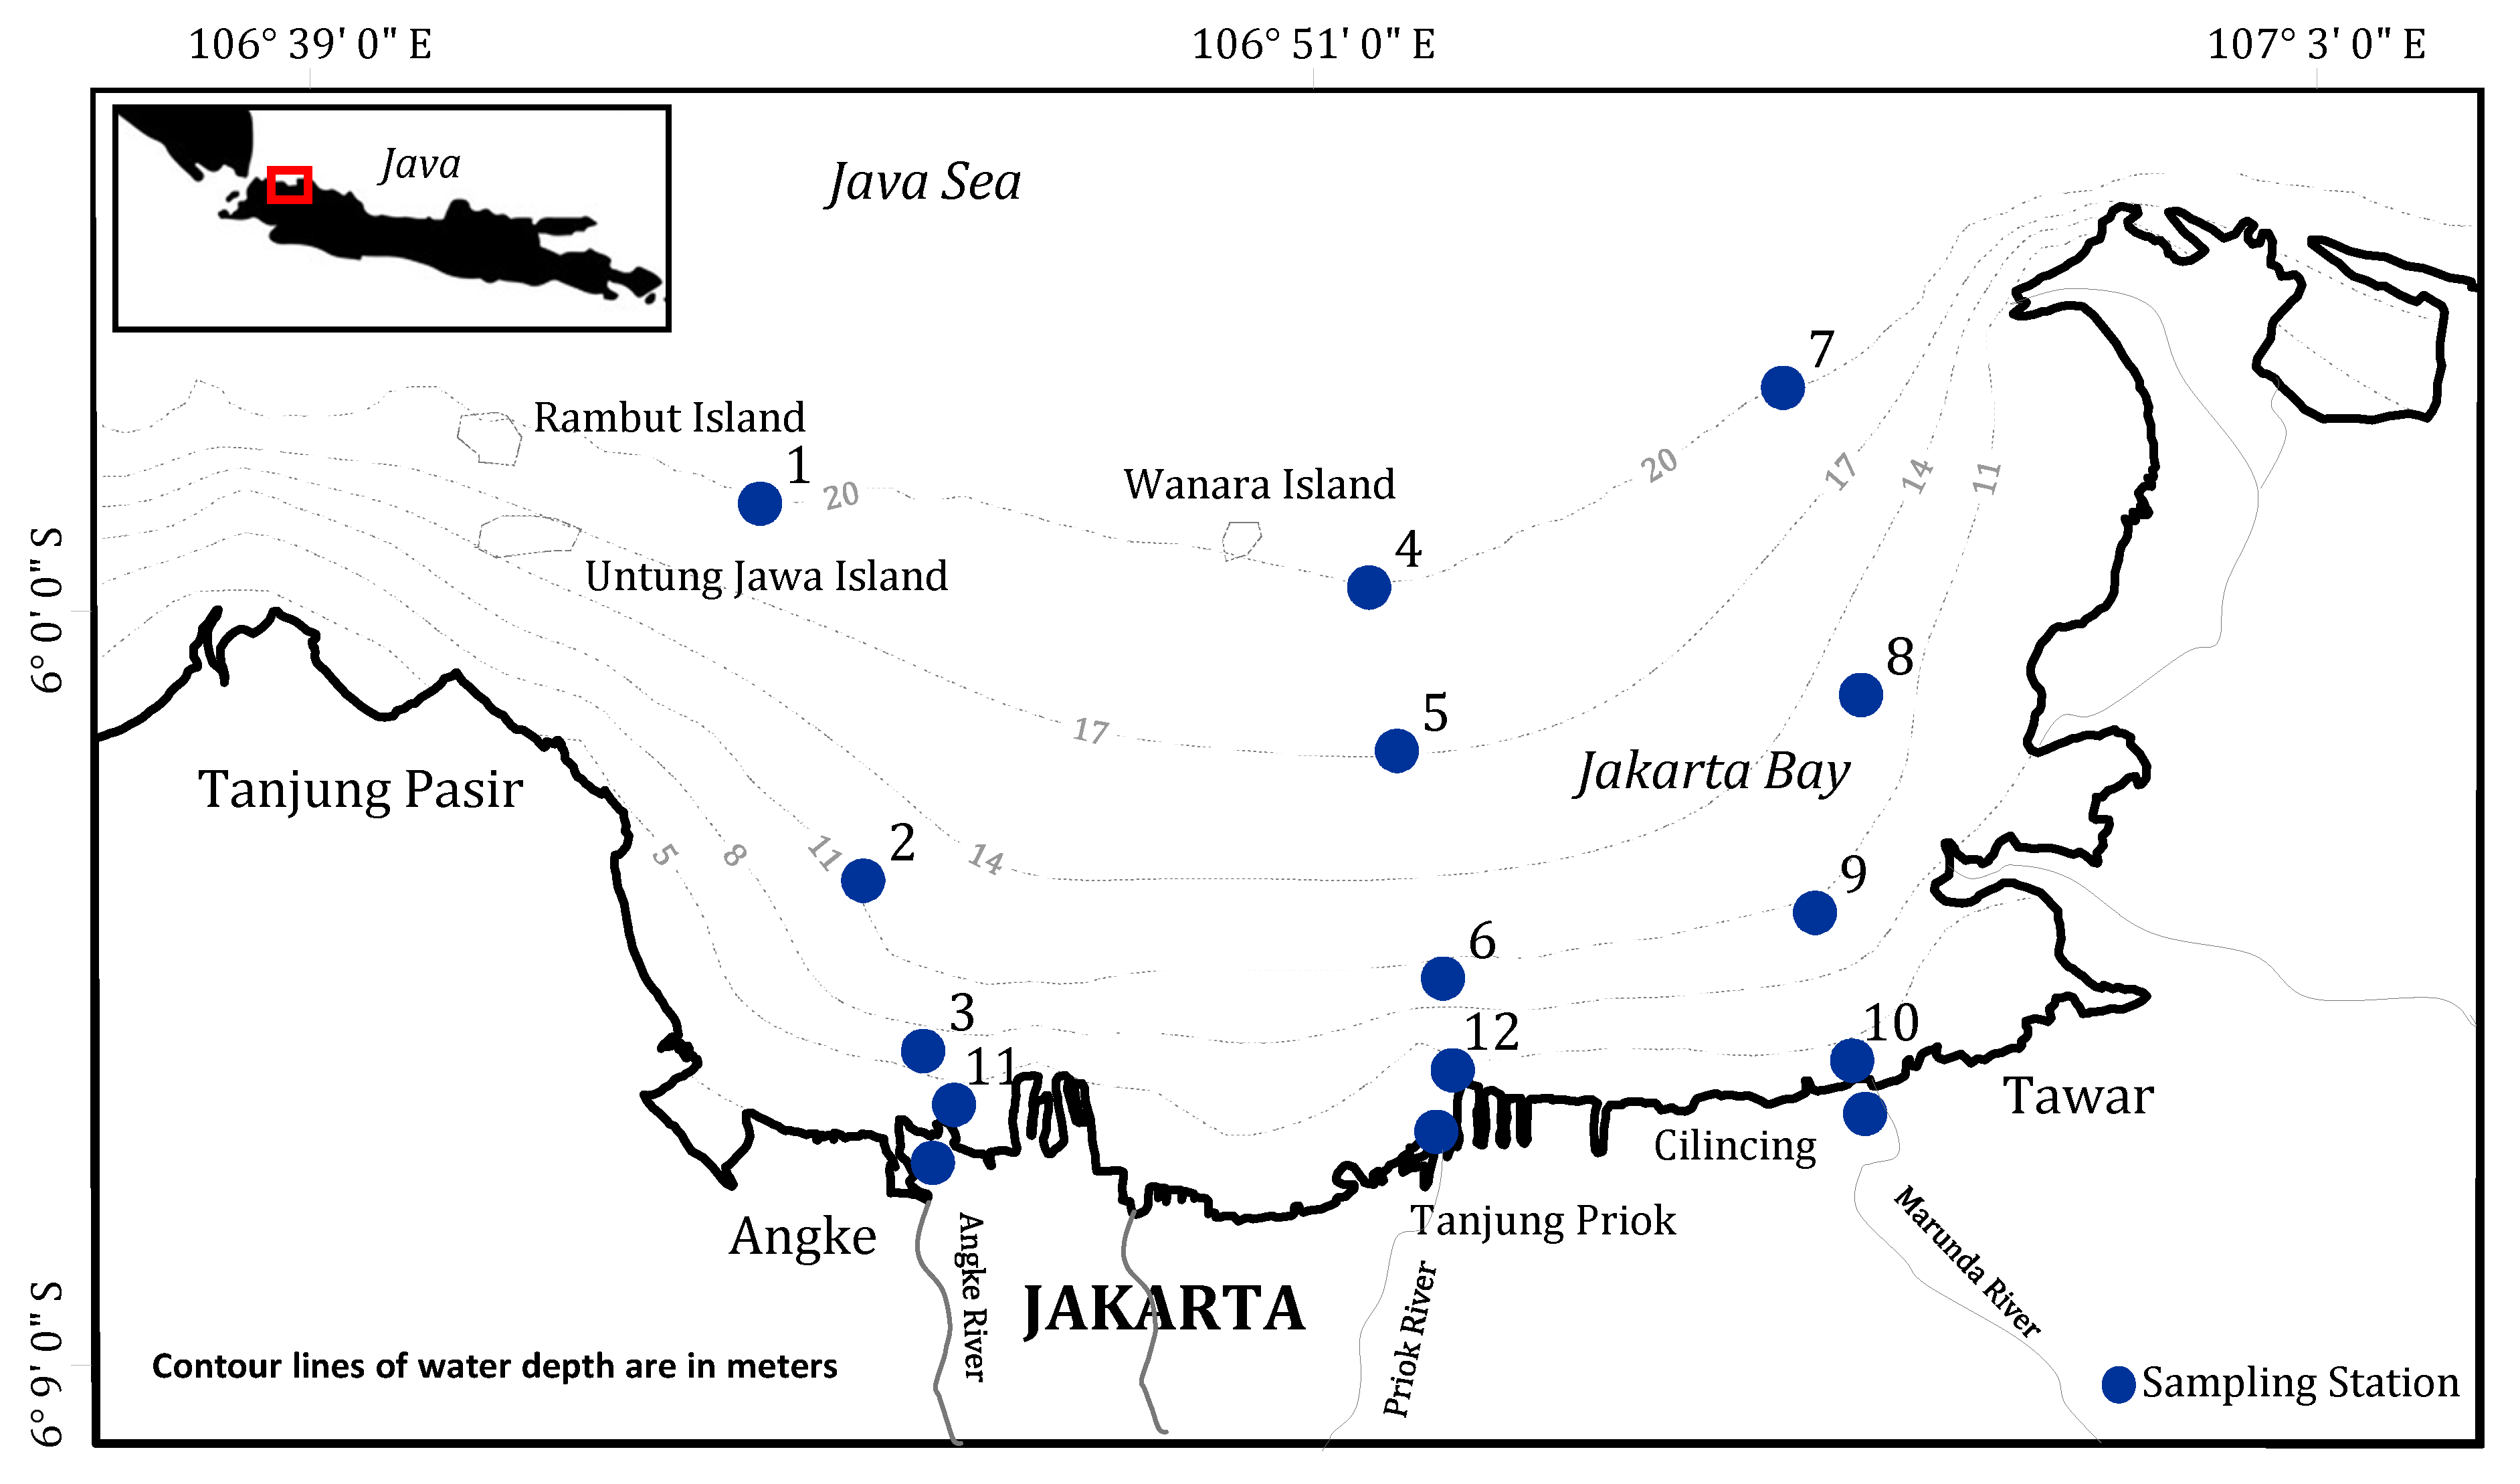
Figure 1. Sampling and measurement stations in Jakarta Bay (redrawn from Damar et al. [17]). Reproduced with permission from Elsevier and Damar, A.; Hesse, K.-J.; Colijn, F.; Yonvitner, Deep Sea Research Part II; published by Elsevier, 2019.
Jmse 08 00674 g001
Figure 2. Mean and standard deviations of dissolved inorganic nitrogen (DIN) (upper left), phosphates (upper right), light (lower left), and chlorophyll-a (Chl-a) (lower right) in Jakarta Bay, 2001–2019. Notes: Blue color is for river mouth stations; orange color is for inner part of the bay stations; grey color is for middle part of the bay stations, and green color is for outer part of the bay stations. (*) are the highest mean of river mouths (blue), inner part (orange), middle part (grey), and outer part (green) of the bay stations.
Jmse 08 00674 g002
Figure 3. Results of regression analyses for salinity versus dissolved inorganic nitrogen (DIN), phosphates, light, and chlorophyll-a (Chl-a) in Jakarta Bay.
Jmse 08 00674 g003
Figure 4. Spatial distribution of the mean dissolved inorganic nitrogen (DIN) concentration (µM) in Jakarta Bay.
Jmse 08 00674 g004
Figure 5. Spatial distribution of the mean phosphate concentration (µM) in Jakarta Bay.
Jmse 08 00674 g005
Figure 6. Spatial distribution of the mean of underwater light level (µmol photon m−2 s−1) in Jakarta Bay.
Jmse 08 00674 g006
Figure 7. Spatial distribution of mean phytoplankton biomass (µg L−1) in Jakarta Bay.
Jmse 08 00674 g007
Figure 8. Linear regressions between dissolved inorganic nitrogen (DIN) and chlorophyll-a (Chl-a) (upper chart), phosphates and chlorophyll-a (Chl-a) (middle chart), and light and chlorophyll-a (Chl-a) (lower chart) based on combined data from 2001–2019.
Jmse 08 00674 g008
Figure 9. Spatial distribution of eutrophication levels in Jakarta Bay, 2001–2019.
Jmse 08 00674 g009
Table 1. Dates of measurement campaigns.
The Surveys200120072013201720182019
1st24th Apr.3rd Mar.4th Mar.14th Jul.30th Jun.10th Apr.
2nd9th Jul.21st Apr.17th May3rd Aug.28th Jul.24th Apr.
3rd20th Sep.27th Jul.21st Jul.11th Sep.1st Sep.2nd May
4th20th Nov.1st Oct.2nd Oct.3rd Oct.2nd Oct.4th Jun.
Table 2. Multiple regression properties between dissolved inorganic nitrogen (DIN), phosphates, and light to chlorophyll-a (Chl-a).
VariableCoefficientsSEt Statp-ValueVariance Inflation Factor
DIN, phosphates, and light to Chl-a
Intercept26.452.709.780.13 × 10−15
DIN0.001070.040.030.97846.597
Phosphates0.230.131.810.07445.797
Light−0.350.04−7.820.12 × 10−11 1.511
DIN and light to Chl-a
Intercept26.092.73 9.55 3.33 × 10⁻¹⁵
DIN0.0640.019 3.34 0.00121.492
Light−0.34 0.045 −7.58 3.46 × 10−111.491
Phosphates and light to Chl-a
Intercept26.478032.423410.935.34 × 10−18
Phosphates0.2367320.06123.8660.000211.31243
Light−0.350590.0415−8.4476.09 × 10−131.3135
Table 3. Temporal change in the area (km2) of each eutrophication status in Jakarta Bay, 2001–2019.
Eutrophication Status 200120072013201720182019
Hyper-eutrophic75.173.1483.3387.5892.64114
Eutrophic186.21188.76214.66235.39207.08211.73
Mesotrophic210.69210.1174.01149.03172.28146.27