Application of the Saffir-Simpson Hurricane Wind Scale to Assess Sand Dune Response to Tropical Storms

 ,
,  , , and
Abstract
1. Introduction
2. Study Area
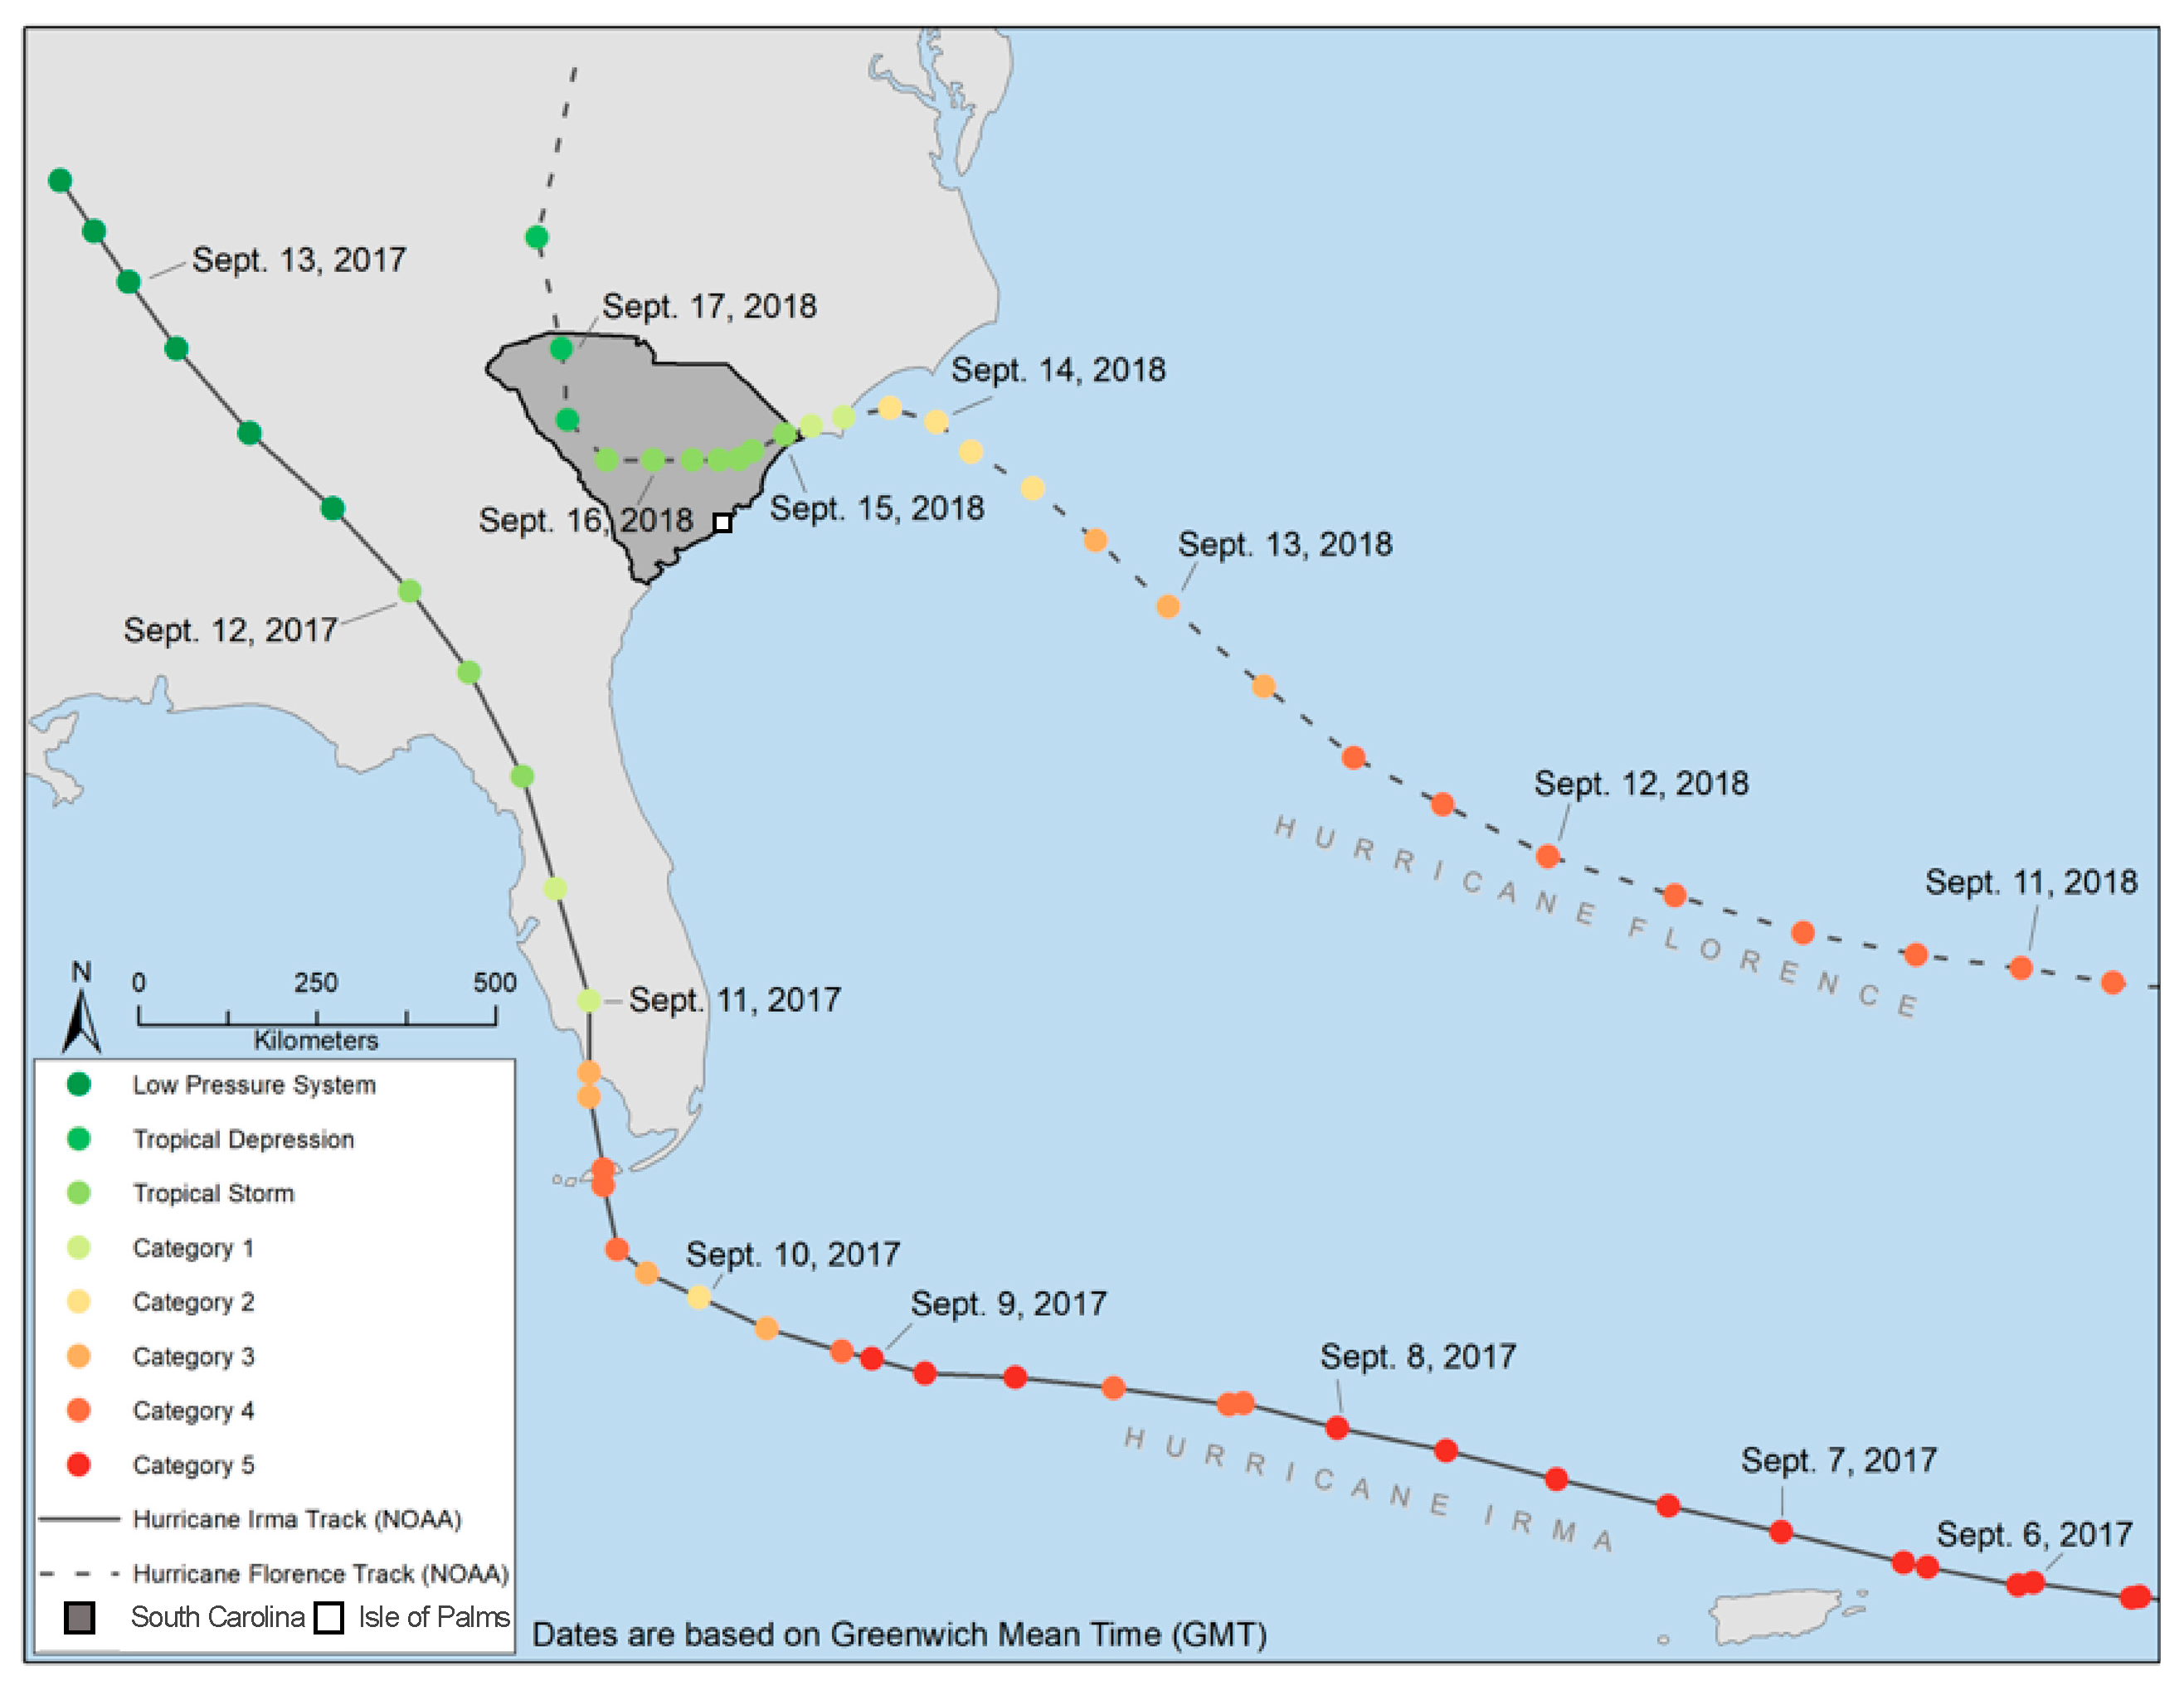
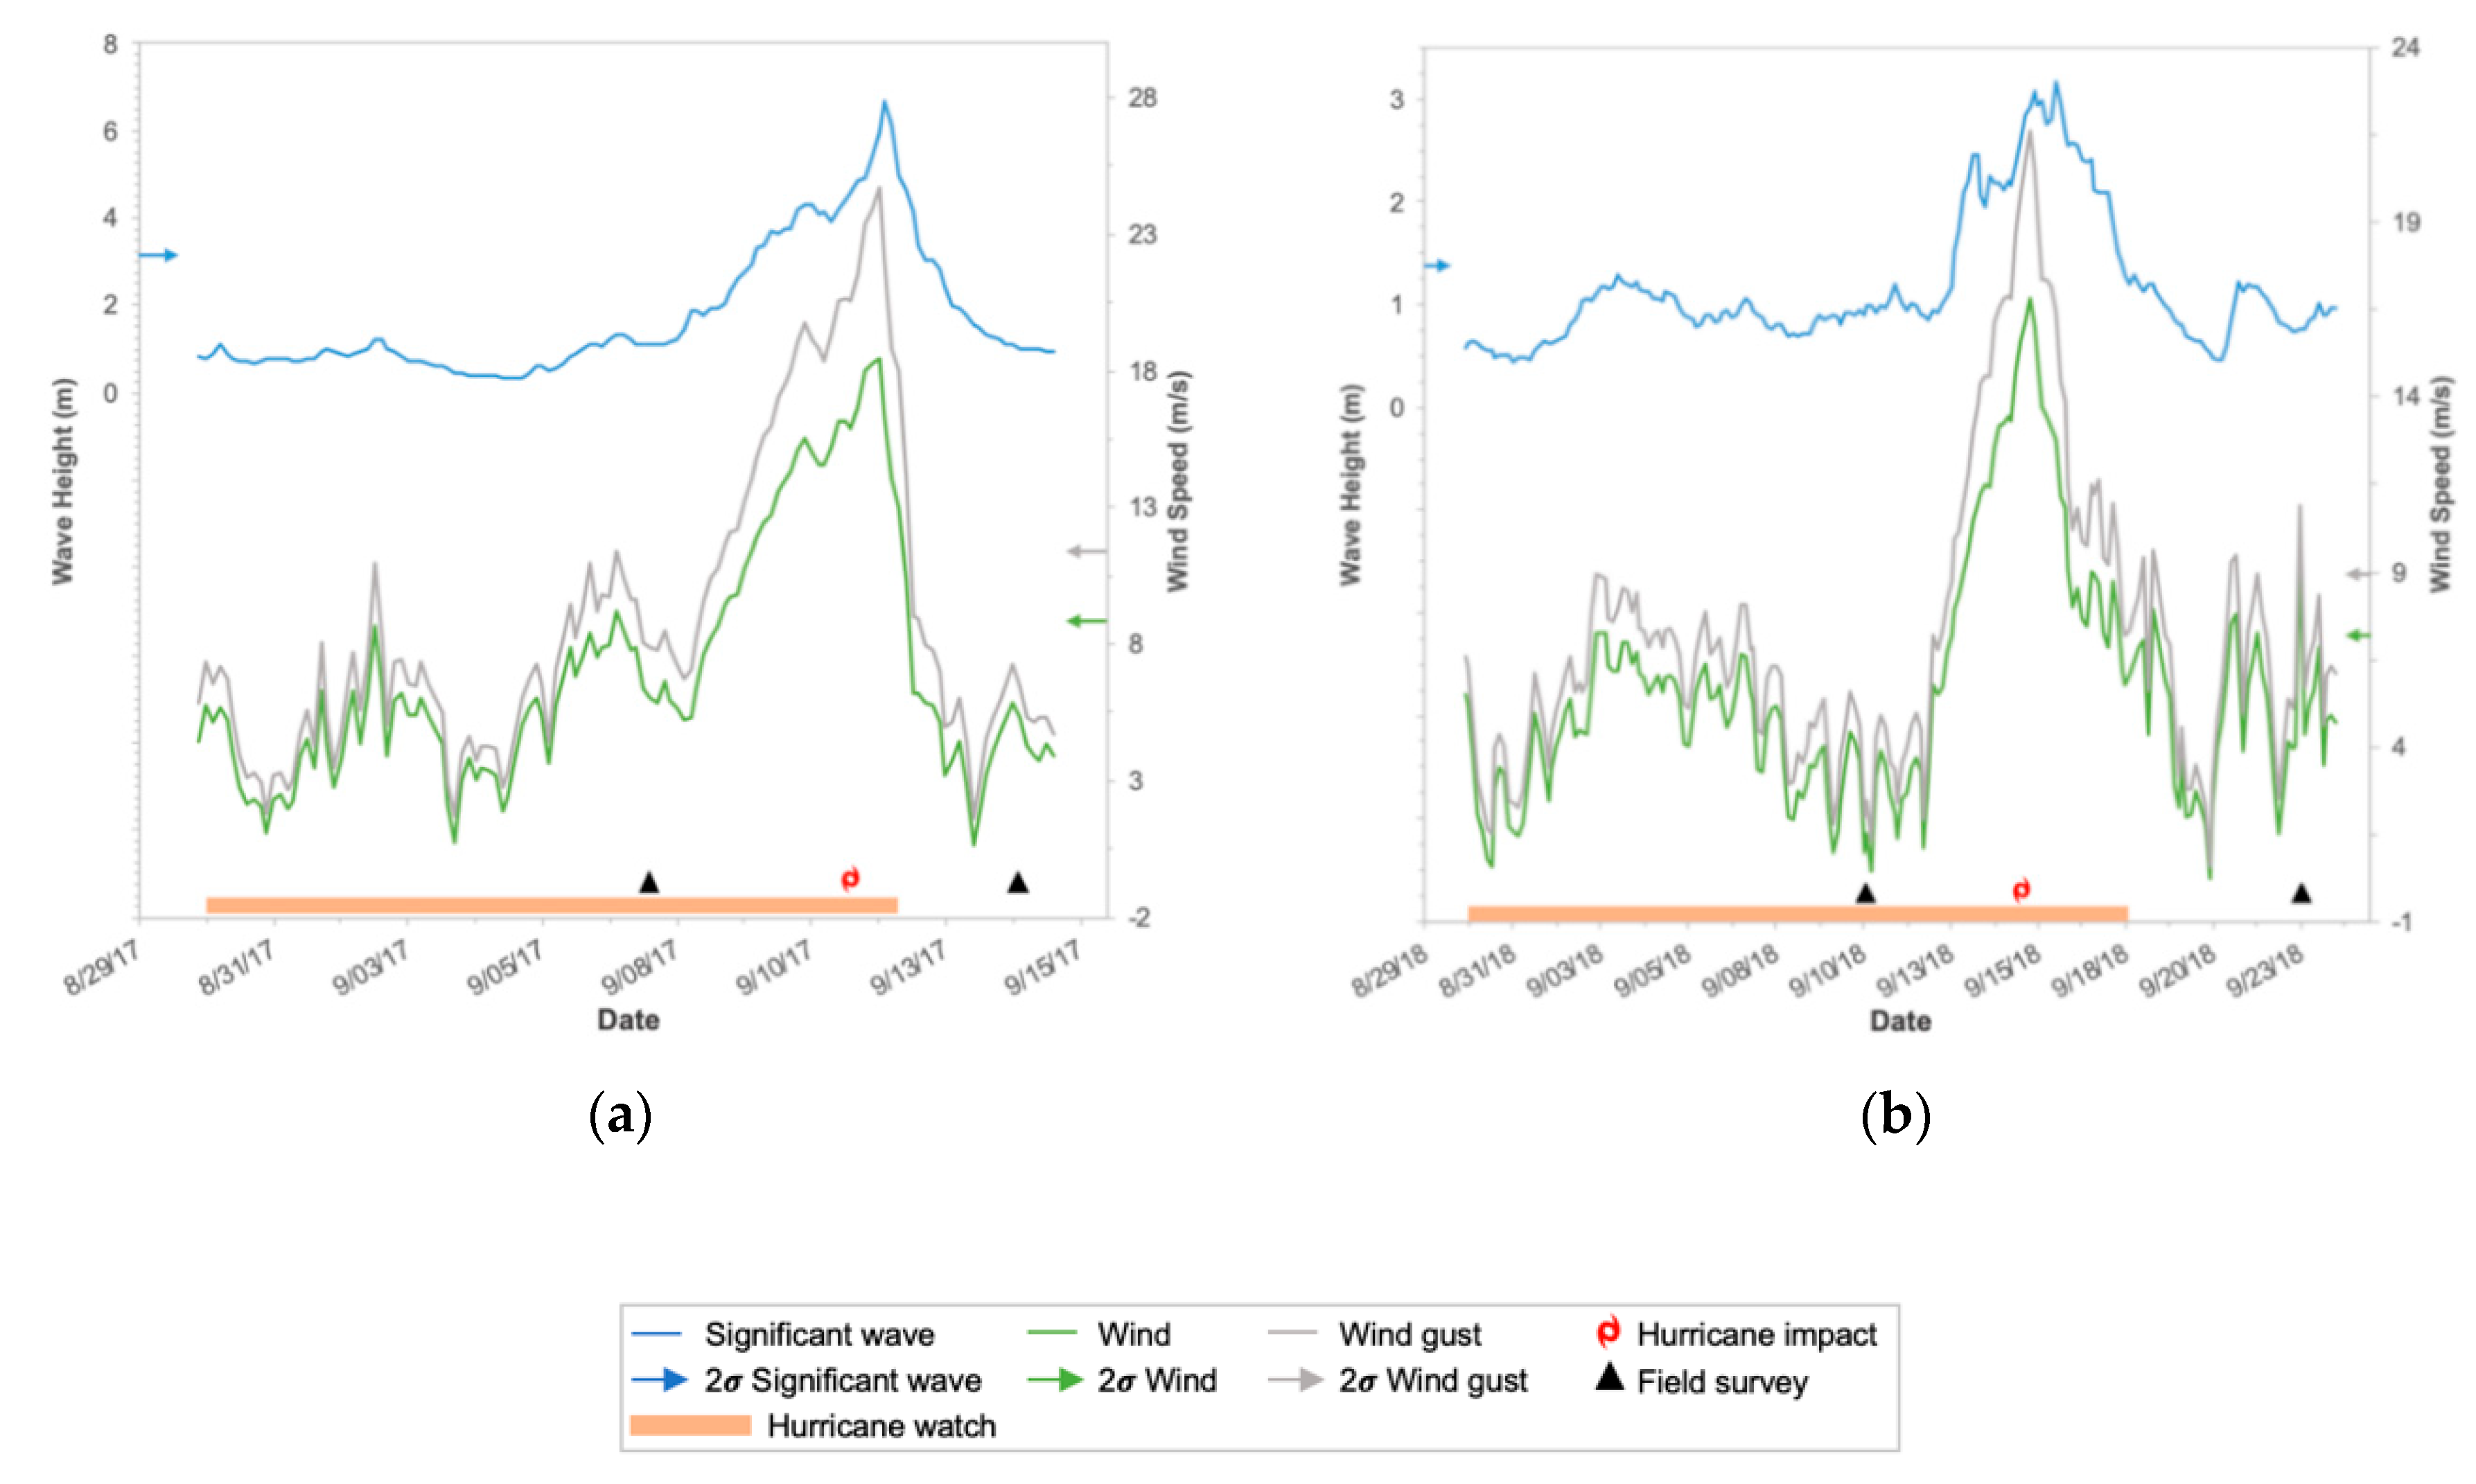
3. Hurricanes Irma and Florence
4. Assessing Dune Change
5. Results
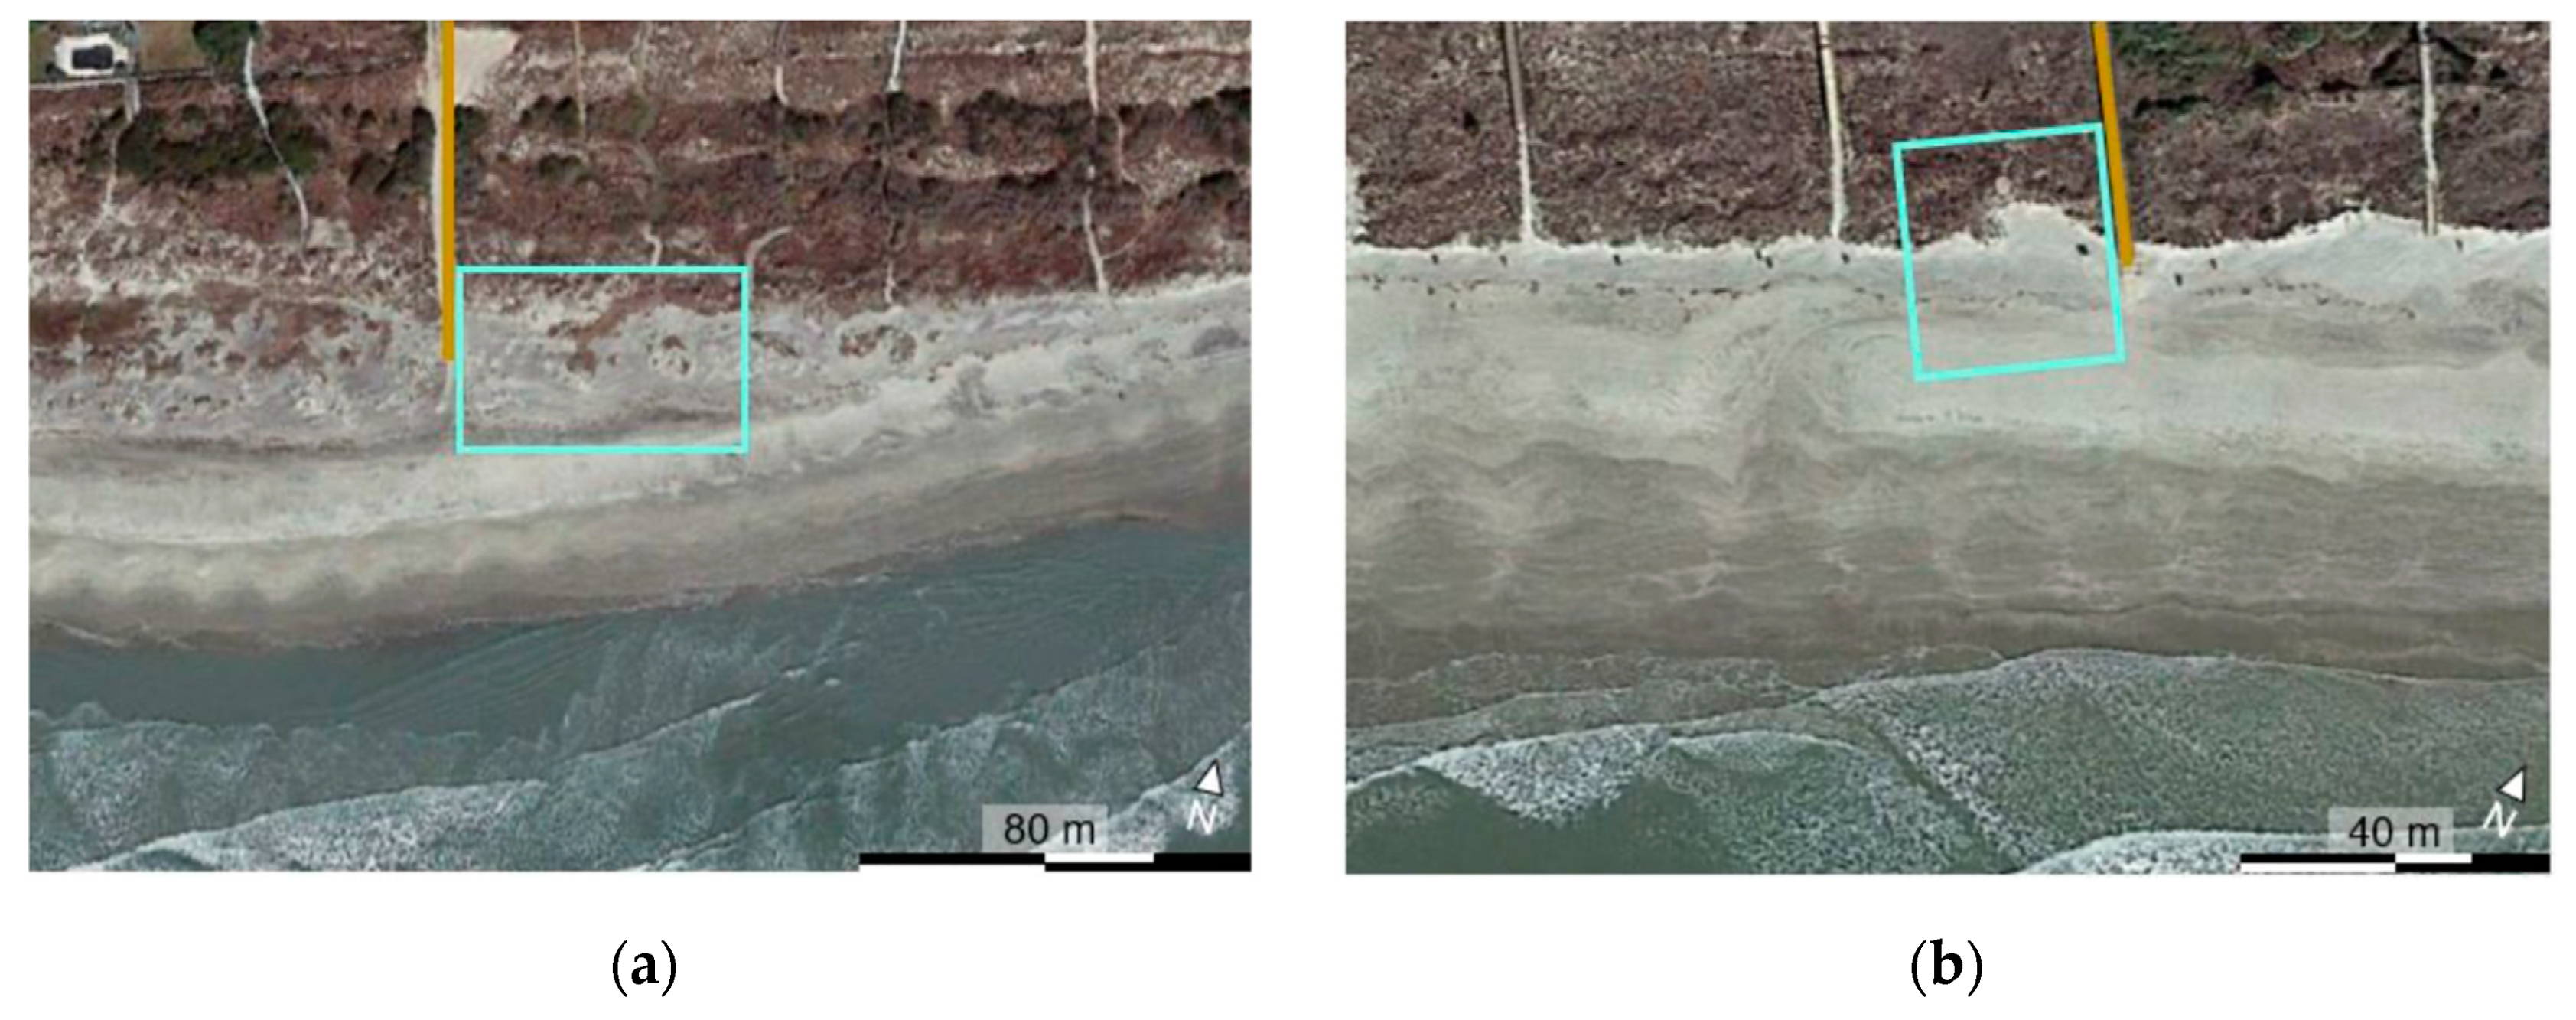
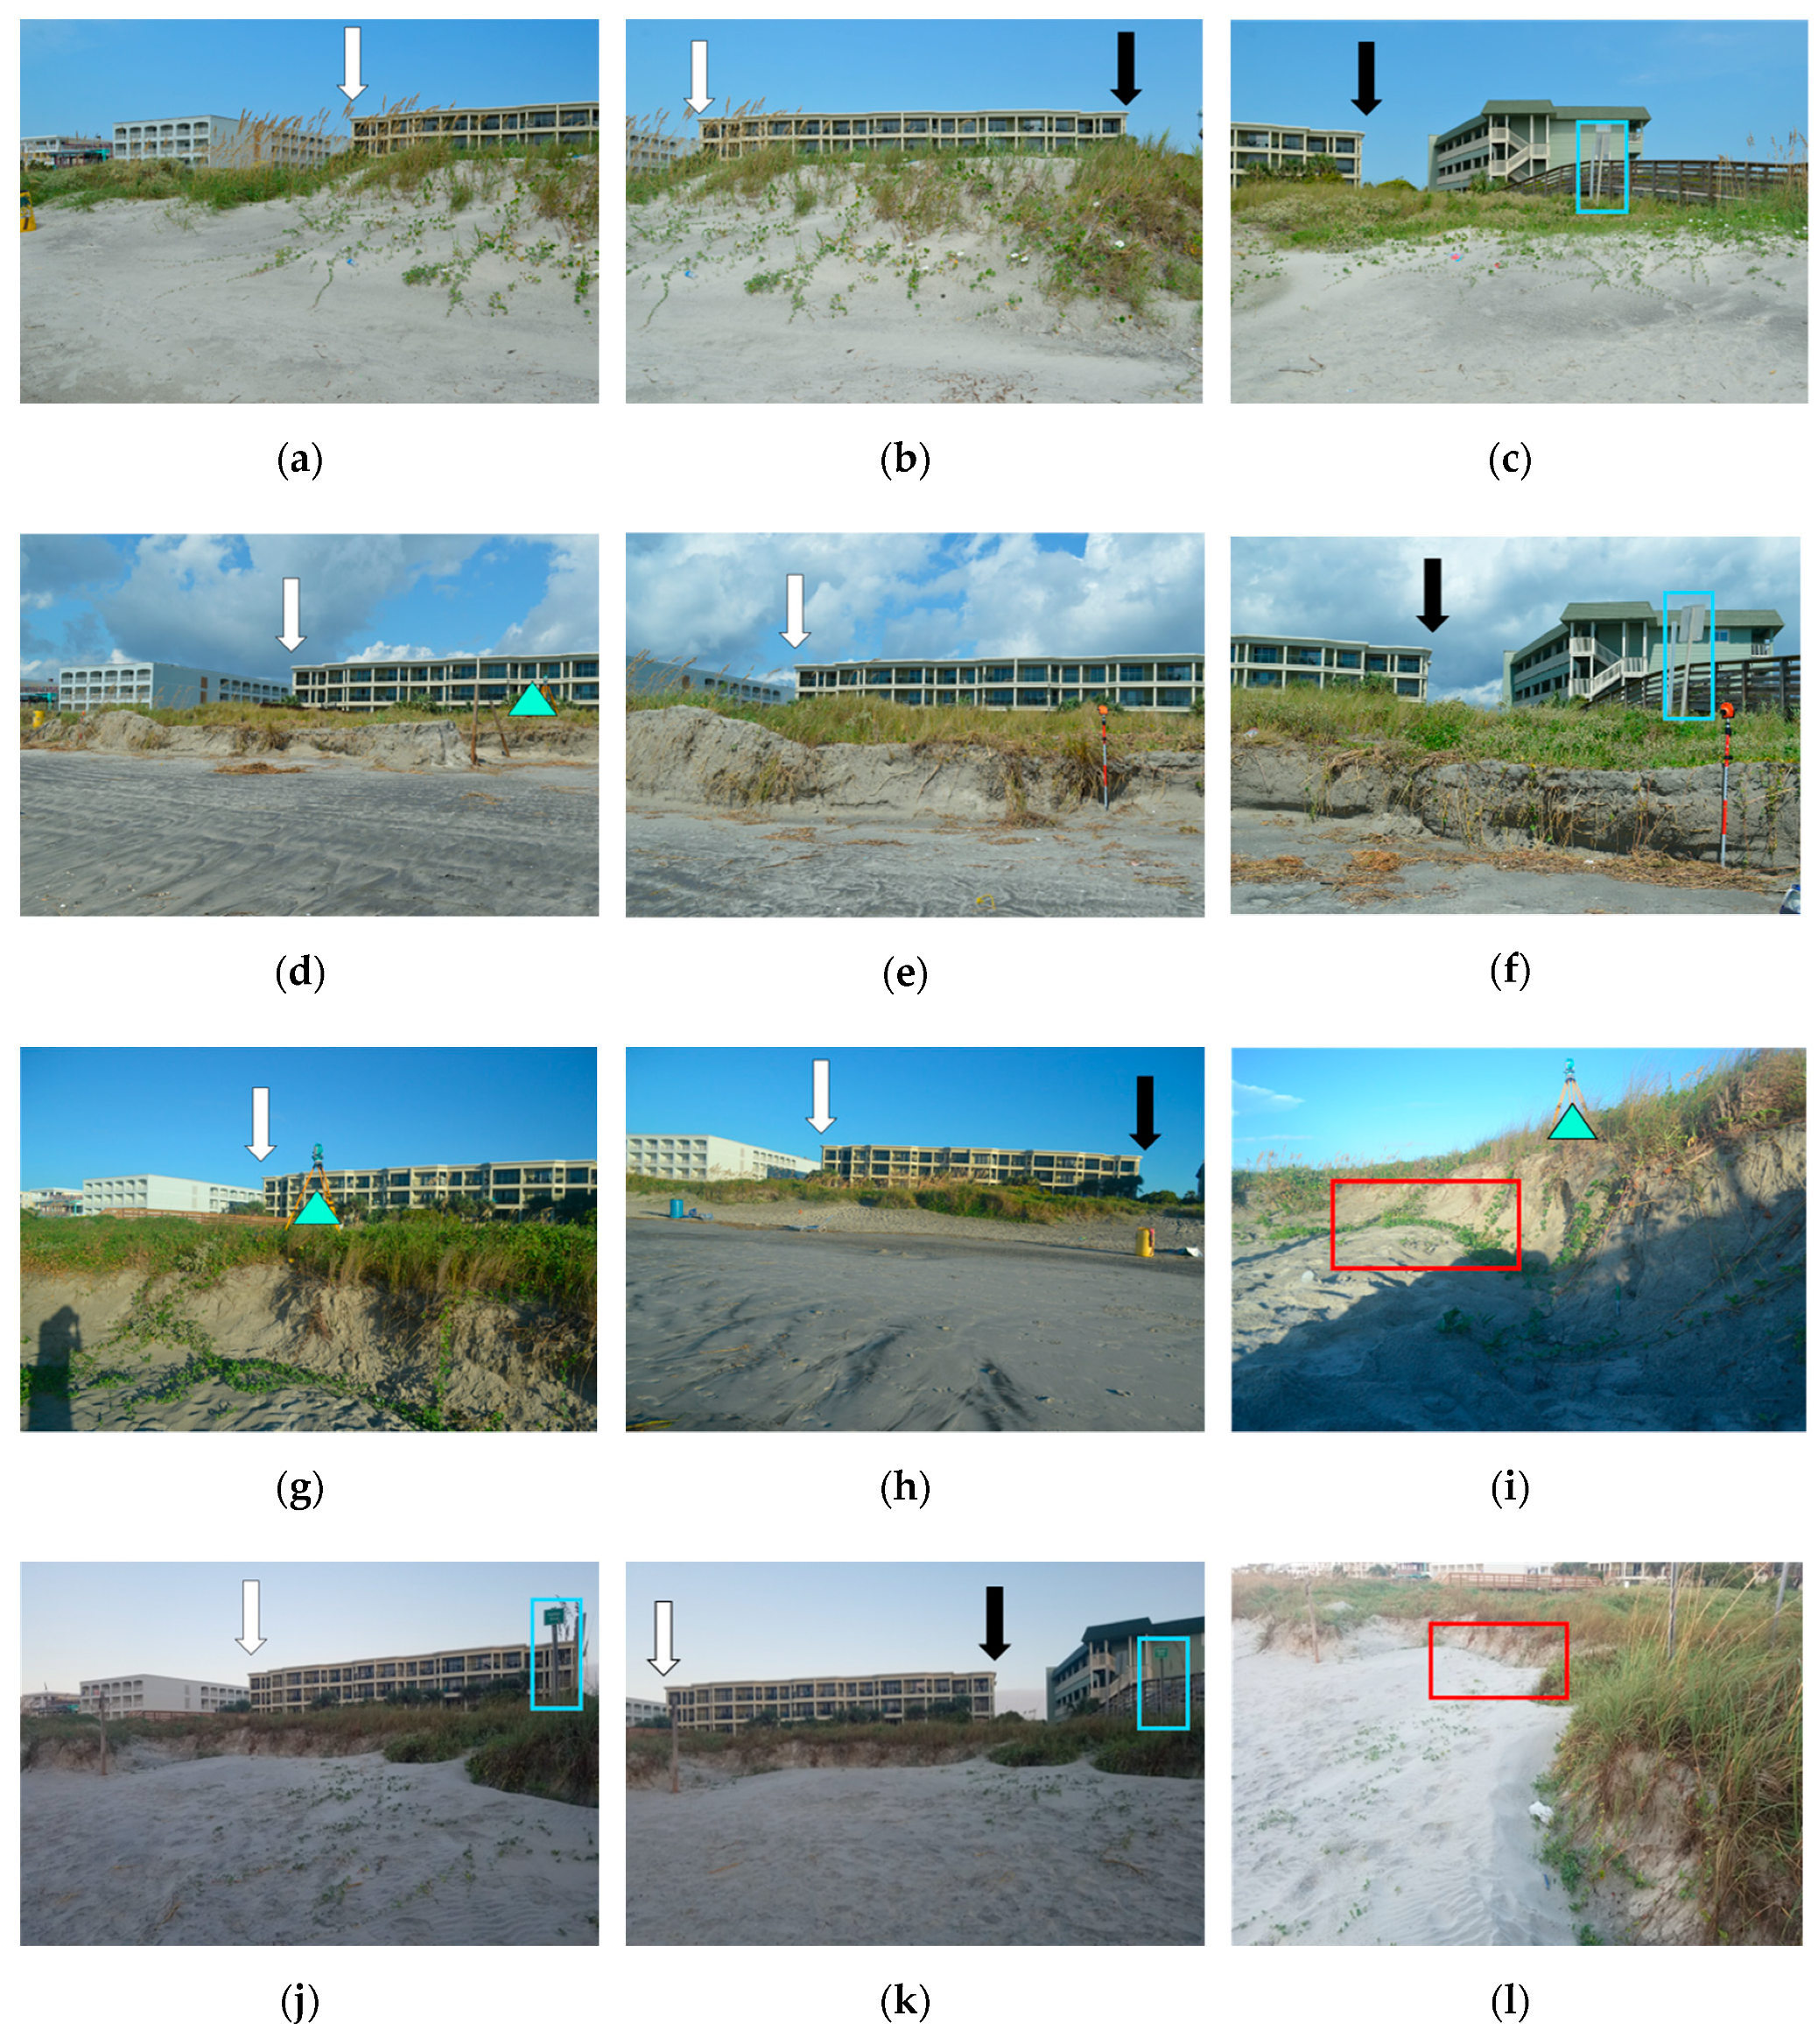
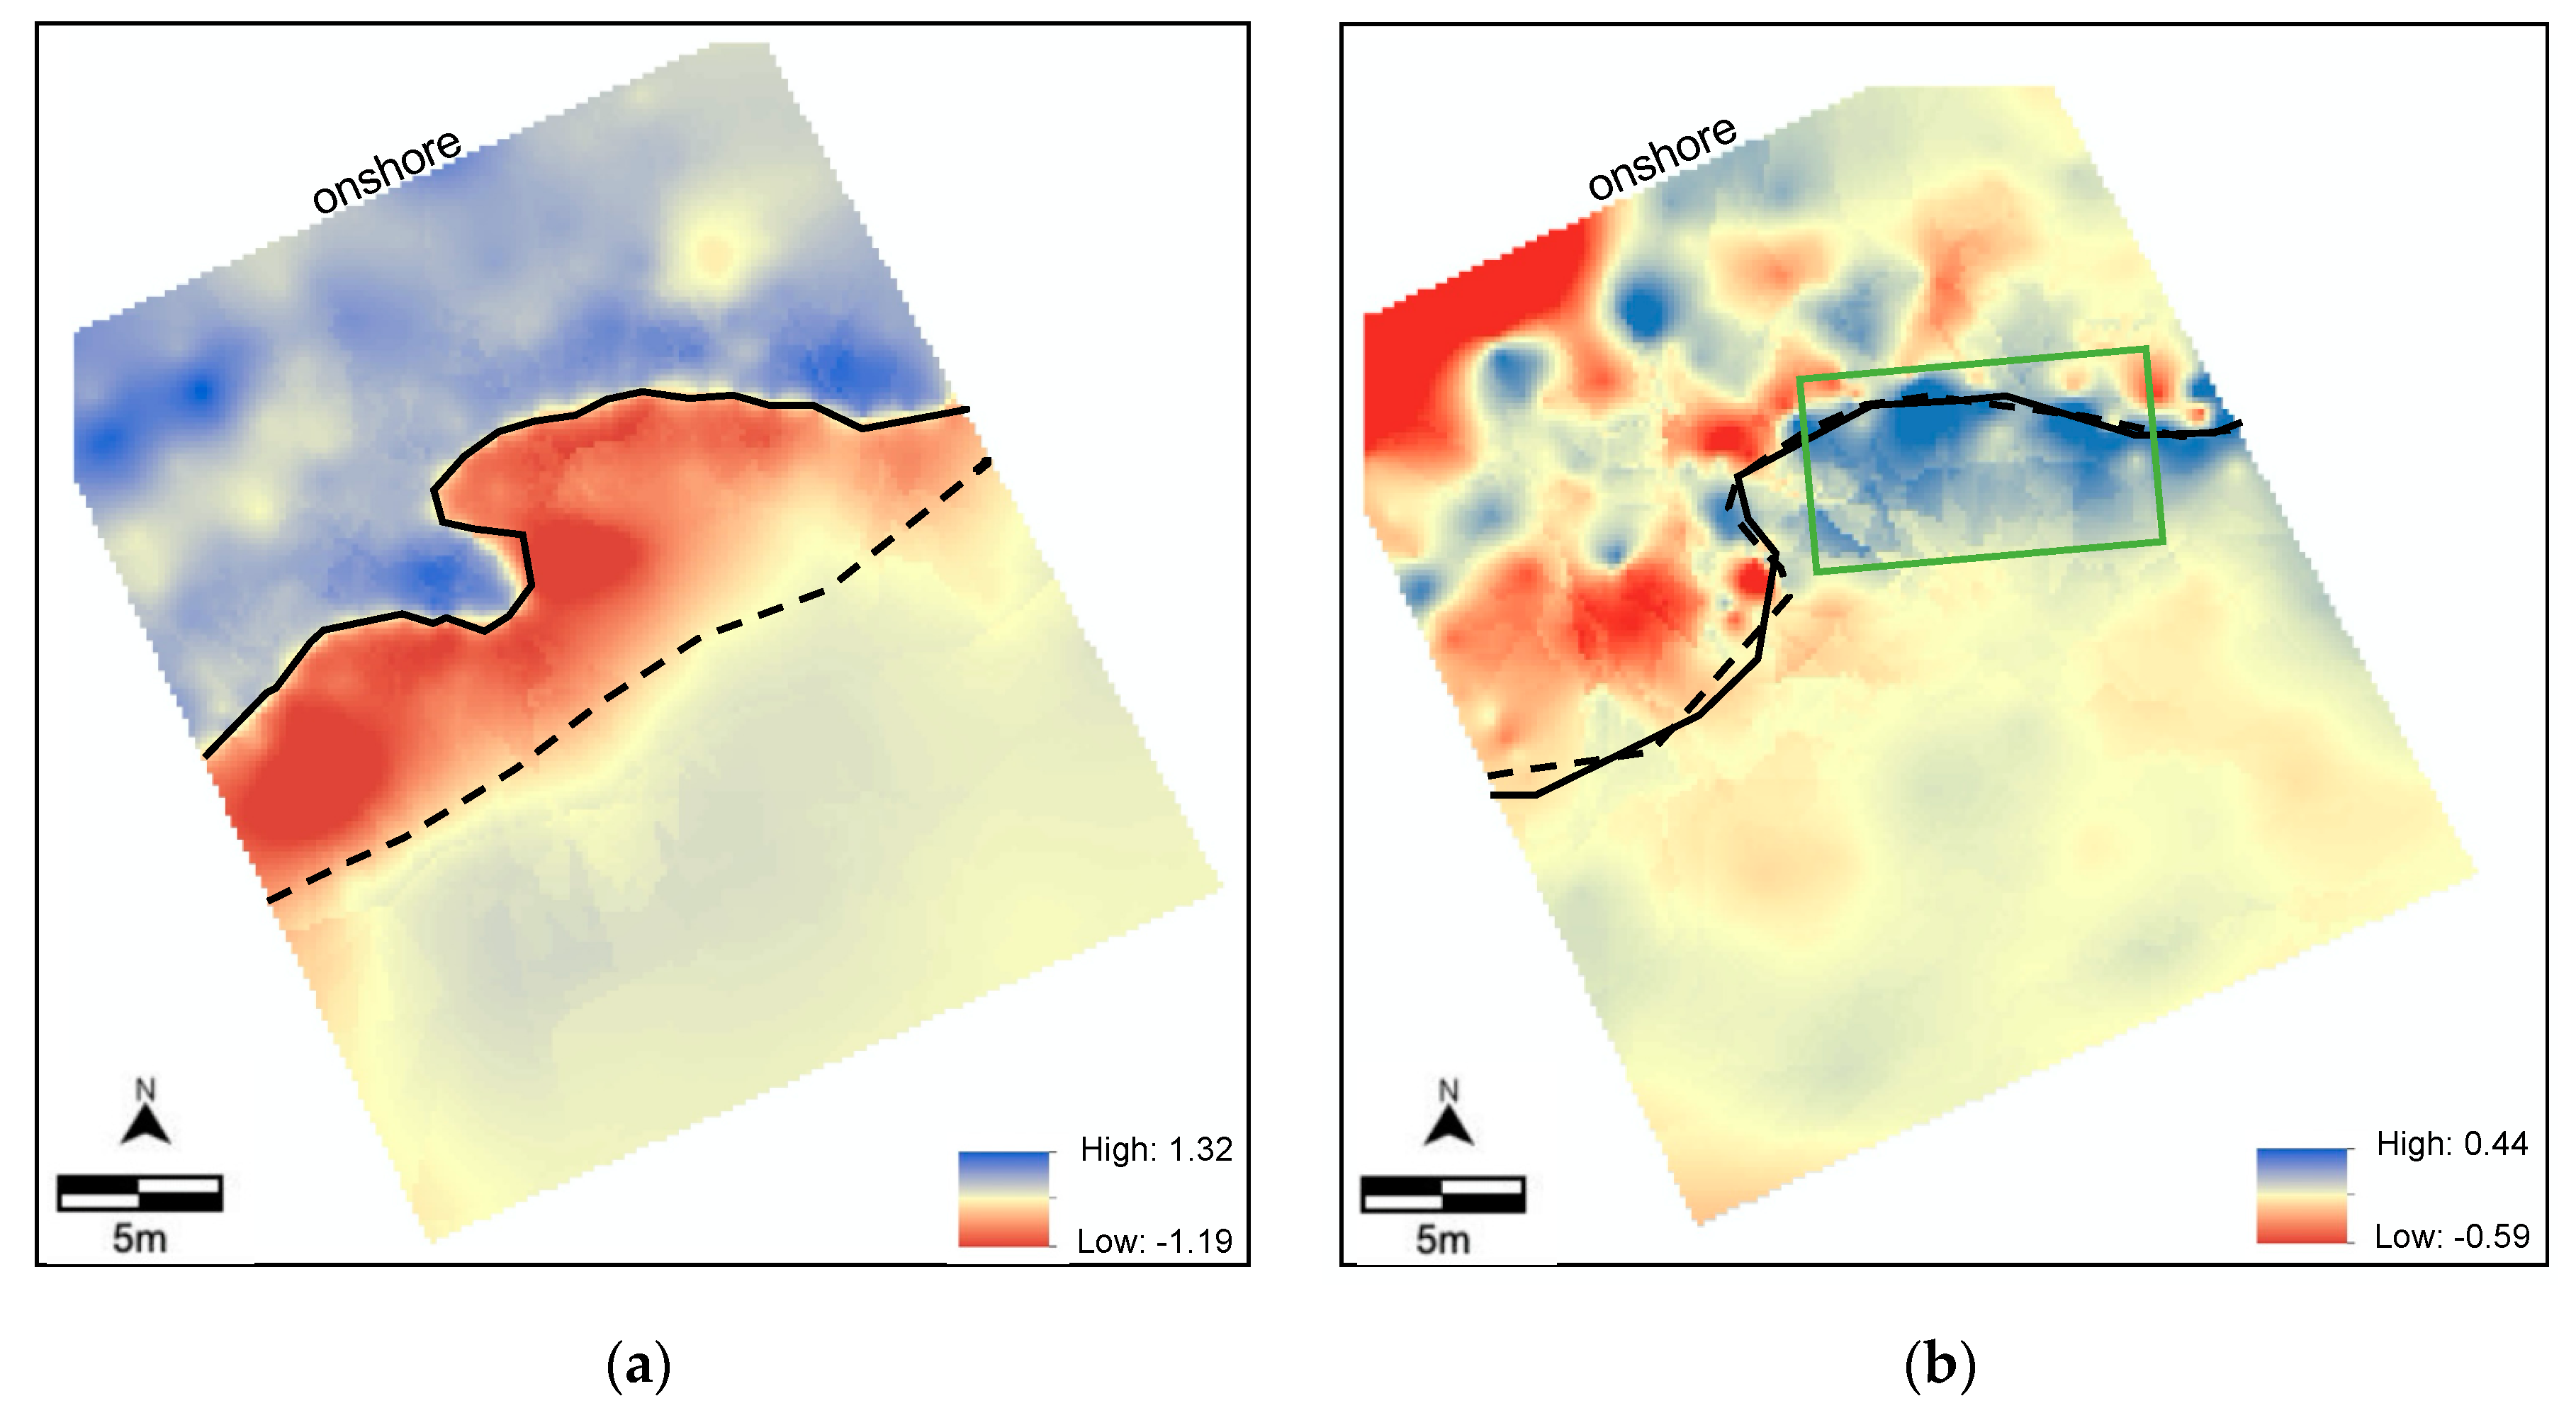
5.1. Site A Beach-Dune System
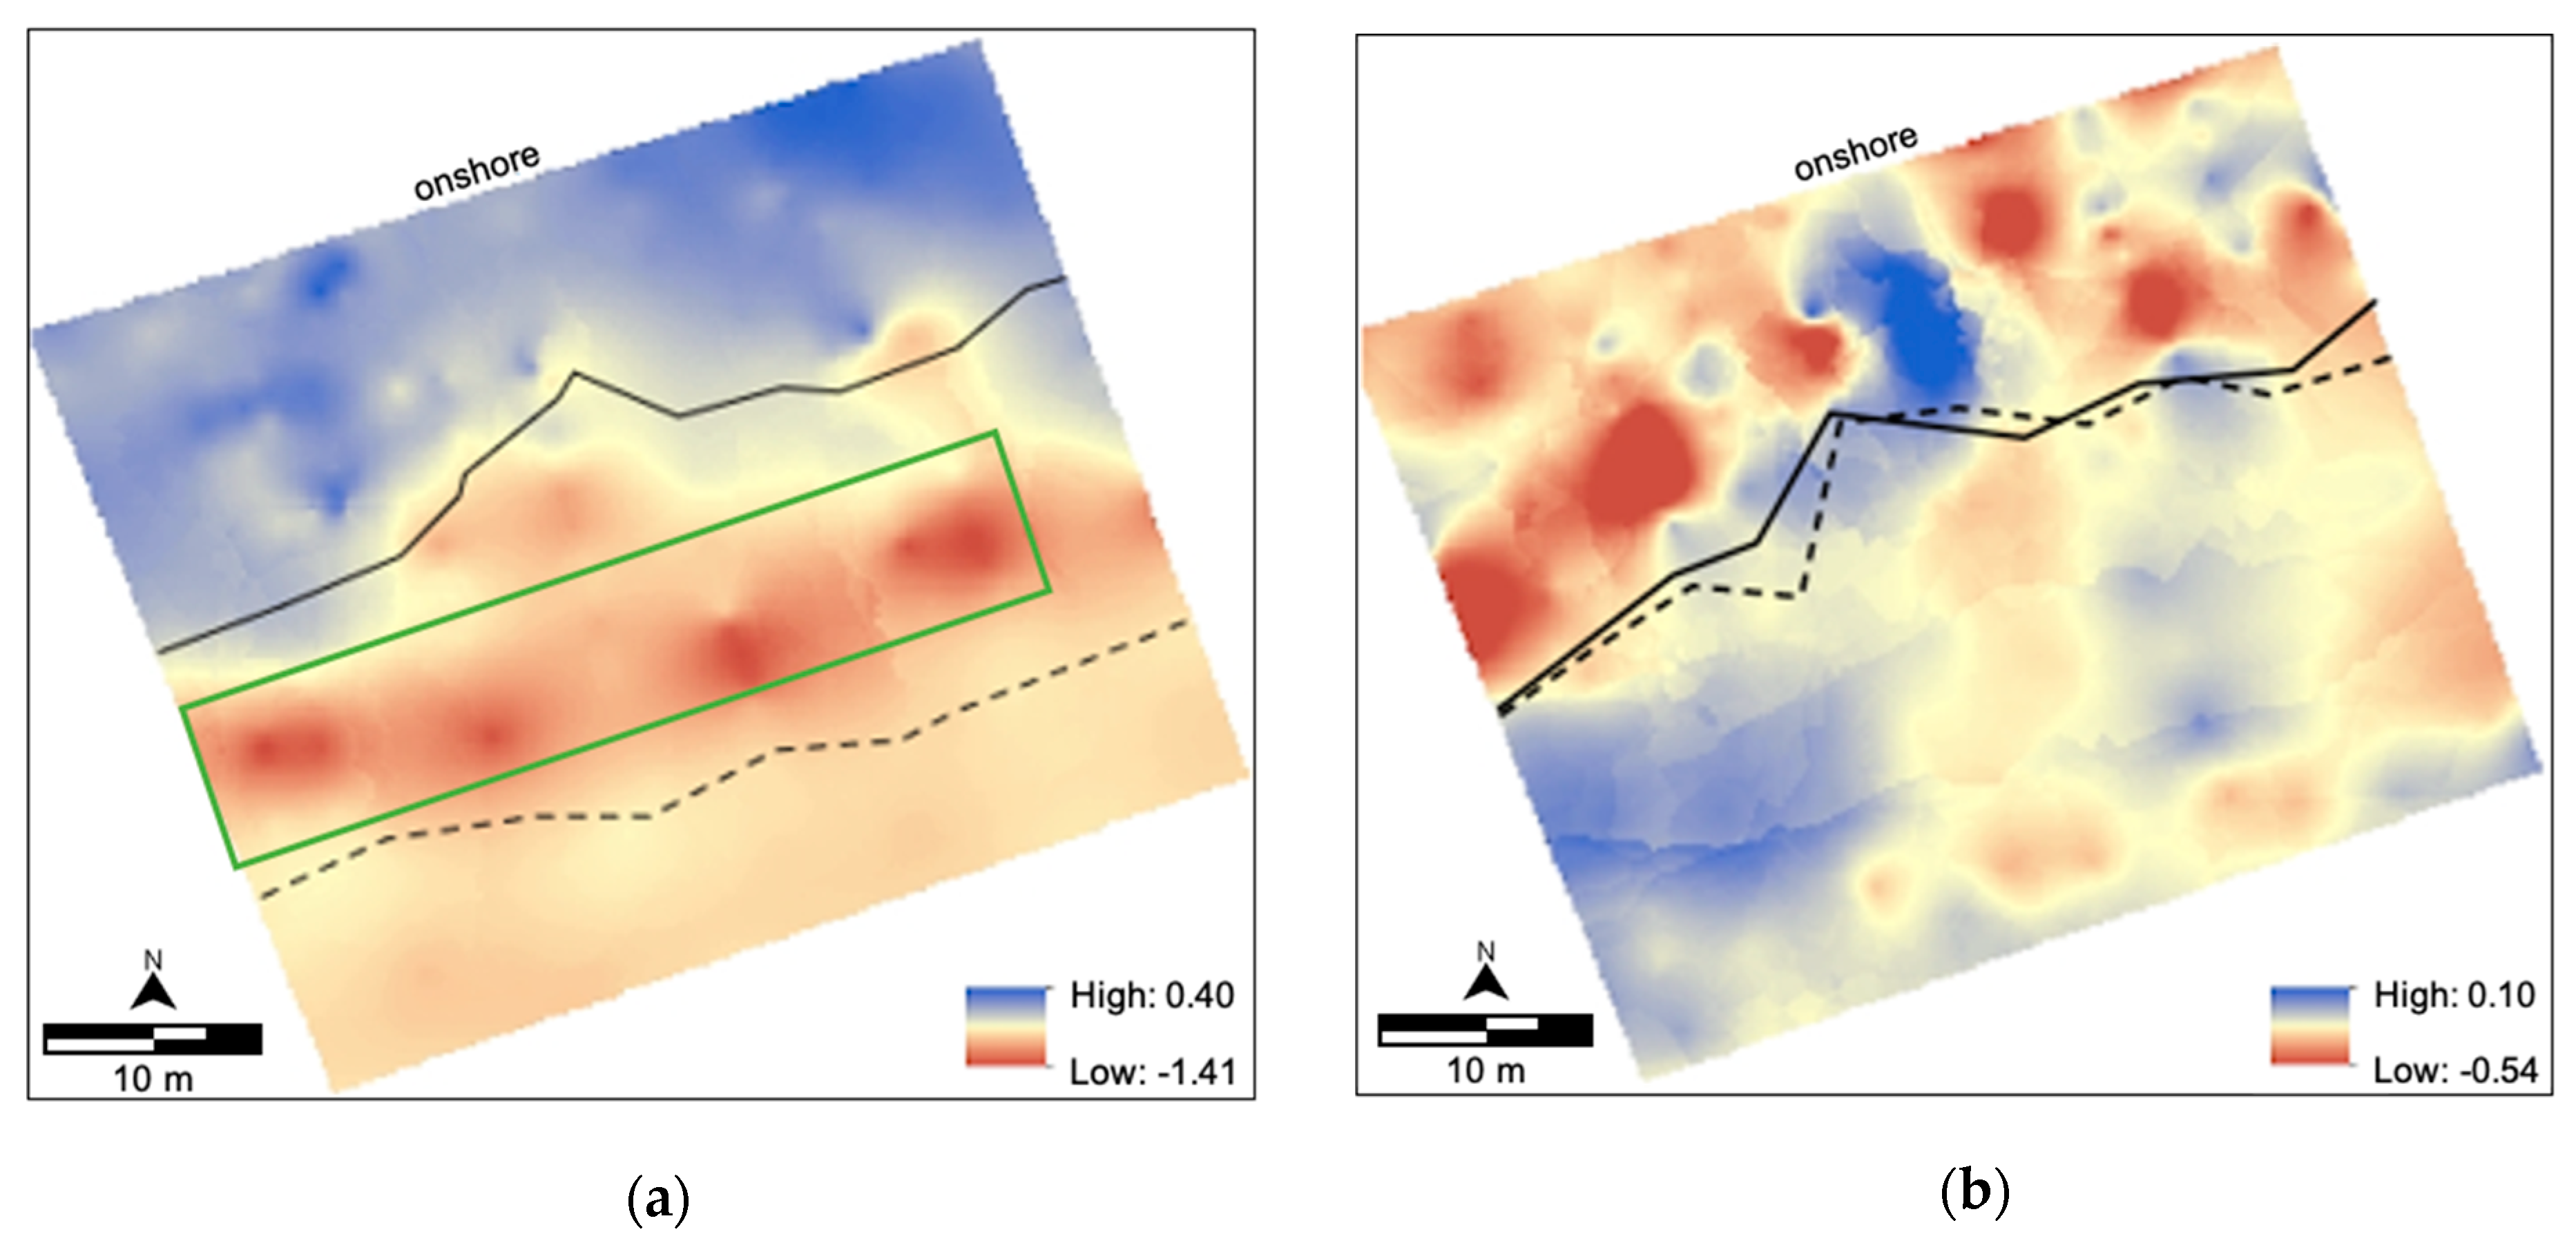
5.2. Site B Beach-Dune System
6. Discussion
7. Conclusions
Author Contributions
Funding
Acknowledgments
Conflicts of Interest
References
- The Coastal Population Explosion. Available online: http://oceanservice.noaa.gov/websites/retiredsites/natdia_pdf/3hinrichsen.pdf (accessed on 8 September 2018).
- Nicholls, R.J. Planning for the impacts of sea level rise. Oceanography 2011, 24, 144–157. [Google Scholar] [CrossRef]
- Harley, M.D.; Ciavola, P. Managing local coastal inundation risk using real-time forecasts and artificial dune placements. Coast. Eng. 2013, 77, 77–90. [Google Scholar] [CrossRef]
- Hall, M.J.; Halsey, S.D. Comparison of overwash penetration from Hurricane Hugo and pre-storm erosion rates for Myrtle Beach and North Myrtle Beach, South Carolina, USA. J. Coast. Res. 1991, SI8, 229–235. [Google Scholar]
- Claudino-Sales, V.; Wang, P.; Horwitz, M.H. Factors controlling the survival of coastal dunes during multiple hurricane impacts in 2004 and 2005: Santa Rosa Barrier Island, Florida. Geomorphology 2008, 95, 295–315. [Google Scholar] [CrossRef]
- Plant, N.G.; Stockdon, H.F. Probabilistic prediction of barrier-island response to hurricanes. J. Geophys. Res. Earth Surf. 2012, 117. [Google Scholar] [CrossRef]
- Houser, C.; Wernette, P.; Rentschlar, E.; Jones, H.; Hammond, B.; Trimble, S. Post-storm beach and dune recovery: Implications for barrier island resilience. Geomorphology 2015, 234, 54–63. [Google Scholar] [CrossRef]
- Coco, G.; Senechal, N.; Rejas, A.; Bryan, K.R.; Capo, S.; Parisot, J.P.; Brown, J.A.; MacMahan, J.H.M. Beach response to a sequence of extreme storms. Geomorphology 2014, 204, 493–501. [Google Scholar] [CrossRef]
- Karunarathna, H.; Pender, D.; Ranasinghe, R.; Short, A.D.; Reeve, D.E. The effects of storm clustering on beach profile variability. Mar. Geol. 2014, 348, 103–112. [Google Scholar] [CrossRef]
- Dissanayake, P.; Brown, J.; Wisse, P.; Karunarathna, H. Effect of storm clustering on beach / dune erosion. J. Geol. 2015, 370, 63–75. [Google Scholar]
- Angnuureng, D.B.; Almar, R.; Senechal, N.; Castelle, B.; Addo, K.A.; Marieu, V.; Ranasinghe, R. Shoreline resilience to individual storms and storm clusters on a meso-macrotidal barred beach. Geomorphology 2017, 290, 265–276. [Google Scholar] [CrossRef]
- Everard, M.; Jones, J.; Watts, B. Have we neglected the societal importance of sand dunes? An ecosystem services perspective. Aquat. Conserv. 2010, 20, 476–487. [Google Scholar] [CrossRef]
- Webster, P.J.; Holland, G.J.; Curry, J.A.; Chang, H.R. Changes in tropical cyclone number, duration, and intensity in a warming environment. Science 2005, 5742, 1844–1846. [Google Scholar] [CrossRef]
- Houser, C.; Ellis, J. Morphodynamic systems: Beach and dune interaction. In Treatise on Geomorphology; Schroder, J., Sherman, D.J., Eds.; Academic Press: San Diego, CA, USA, 2013; pp. 267–288. [Google Scholar]
- Román-Rivera, M.A. Innovative Approaches Using Multispectral Imagery to Detect Nearshore Bars and Elucidate Beach System Dynamics. Ph.D. Thesis, University of South Carolina, Columbia, SC, USA, 2019. [Google Scholar]
- Sallenger, A.H. Storm impact scale for barrier islands. J. Coast. Res. 2000, 16, 890–895. [Google Scholar] [CrossRef]
- Hesp, P. Foredunes and blowouts: Initiation, geomorphology and dynamics. Geomorphology 2002, 48, 245–268. [Google Scholar] [CrossRef]
- Thieler, E.R.; Young, R.S. Quantitative evaluation of coastal geomorphological changes in South Carolina after Hurricane Hugo. J. Coast. Res. Spec. Issue 1991, 8, 187–200. [Google Scholar] [CrossRef]
- Houser, C.; Hapke, C.; Hamilton, S. Controls on coastal dune morphology, shoreline erosion and barrier island response to extreme storms. Geomorphology 2008, 100, 223–240. [Google Scholar] [CrossRef]
- Leatherman, S.P. Barrier island dynamics: Overwash processes and eolian transport. In Coastal Engineering 1976, Proceedings of the 15th International Conference; American Society of Civil Engineers: Reston, VA, USA, 1976; pp. 1958–1974. [Google Scholar]
- Leatherman, S.P. Barrier dune systems: A reassessment. Sediment. Geol. 1979, 24, 1–16. [Google Scholar] [CrossRef]
- Armon, J.W. Dune erosion and recovery on a northern barrier. In Coastal Zone ’80, Proceedings of the 2nd Symposium on Coastal and Ocean Management; American Society of Civil Engineers: Reston, VA, USA, 1980; pp. 1233–1250. [Google Scholar]
- Psuty, N.P. Spatial variation in coastal foredune development. In Coastal Dunes: Geomorphology, Ecology and Management for Conservation; Carter, R.W.G., Curtis, T.G.F., Sheehy-Skeffington, M.J., Eds.; Balkema: Rotterdam, The Netherlands, 1992; pp. 3–13. [Google Scholar]
- Morton, R.A. Factors controlling storm impacts on coastal barriers and beaches—A preliminary basis for near real-time forecasting. J. Coast. Res. 2002, 18, 486–501. [Google Scholar]
- Priestas, A.M.; Fagherazzi, S. Morphological barrier island changes and recovery of dunes after Hurricane Dennis, St. George Island, Florida. Geomorphology 2010, 114, 614–626. [Google Scholar] [CrossRef]
- Claudino-Sales, V.; Wang, P.; Horwitz, M.H. Effect of Hurricane Ivan on coastal dunes of Santa Rosa Barrier Island, Florida: Characterized on the basis of pre- and poststorm LIDAR surveys. J. Coast. Res. 2010, 26, 470–484. [Google Scholar] [CrossRef]
- Wang, P.; Kirby, J.H.; Haber, J.D.; Horwitz, M.H.; Knorr, P.O.; Krock, J.R. Morphological and sedimentological impacts of Hurricane Ivan and immediate poststorm beach Recovery along the Northwestern Florida barrier-island coasts. J. Coast. Res. 2006, 226, 1382–1402. [Google Scholar] [CrossRef]
- Katuna, M.P. The effect of Hurricane Hugo on the Isle of Palms, South Carolina: From destruction to recovery. J. Coast. Res. Spec. Issue 1991, 8, 263–273. [Google Scholar]
- Coch, N.K.; Wolff, M.P. Effects of Hurricane Hugo storm surge in coastal South Carolina. J. Coast. Res. 1991, SI, 201–226. [Google Scholar]
- Saffir, H.S. Hurricane wind and storm surge. Military Eng. 1973, 423, 4–5. [Google Scholar]
- Simpson, R.H. The hurricane disaster-potential scale. Weatherwise 1974, 27, 169–186. [Google Scholar]
- Kantha, L. Time to replace the Saffir-Simpson Hurricane Scale? Eos Trans. Am. Geophys. Union 2006, 87, 3–6. [Google Scholar] [CrossRef]
- Powell, M.D.; Reinhold, T.A. Tropical cyclone destructive potential by integrated kinetic energy. Bull. Am. Meteorol. Soc. 2007, 88, 513–526. [Google Scholar] [CrossRef]
- Anthony, E.J. Geomorphology storms, shoreface morphodynamics, sand supply, and the accretion and erosion of coastal dune barriers in the southern North Sea. Geomorphology 2013, 199. [Google Scholar] [CrossRef]
- Hayes, M.O.; Moslow, T.F.; Hubbard, D.K. Beach Erosion in South Carolina; Coastal Research Division, Department of Geology, University of South Carolina: Colombia, SC, USA, 1978; p. 99. [Google Scholar]
- Tides & Currents: Isle of Palms Pier, SC–Station ID 8665494. Available online: https://tidesandcurrents.noaa.gov/stationhome.html?id=8665494 (accessed on 24 July 2020).
- Kana, T.W. Beach erosion during minor storms. J. Waterway Port Coast. Ocean Division 1977, 103, 505–518. [Google Scholar]
- CSC (Coastal Science & Engineering). Final Report 2018 Beach Restoration Project City of Isle of Palms; Technical Report #CSE–2453FR; CSE: Columbia, SC, USA, 2018; p. 57. [Google Scholar]
- Ellis, J.T.; Román-Rivera, M.A. Assessing natural and mechanical dune performance in a post-hurricane environment. J. Mar. Sci. Eng. 2019, 7, 126. [Google Scholar] [CrossRef]
- Stephen, M.F.; Brown, P.J.; Fitzgerald, D.M.; Hubbard, M.K.; Hayes, M.O. Beach Erosion Inventory of Charleston County, South Carolina: A Preliminary Report; Technical Report No. 4; S.C.; Sea Grant: Charleston, SC, USA, 1975; p. 79. [Google Scholar]
- Fico, C. Influence of Wave Refraction on Coastal Geomorphology - Bull Island to Isle of Palms, South Carolina. Master’s Thesis, Coastal Research Division, Department of Geology, University of South Carolina, Columbia, SC, USA, 1978; p. 190. [Google Scholar]
- Ellis, J.T.; Román-Rivera, M.A.; Harris, M.E.; Tereszkiewicz, P.A. Two years and two hurricanes later: Did the dunes recover? Shore & Beach 2020. (in print). [Google Scholar]
- South Carolina Department of Health and Environmental Control-Ocean & Coastal Management (SCDHEC-OCRM). SC Beachfront Jurisdictional Lines. Available online: https://gis.dhec.sc.gov/shoreline/ (accessed on 5 May 2020).
- Cangialosi, J.P.; Latto, A.S.; Berg, R. National Hurricane Center Tropical Cyclone Report: Hurricane Florence (AL112017). National Hurricane Center. 30 June 2018. p. 111. Available online: https://www.nhc.noaa.gov/data/tcr/AL112017_Irma.pdf (accessed on 21 December 2019).
- Stewart, S.R.; Berg, R. National Hurricane Center Tropical Cyclone Report: Hurricane Florence (AL062018). National Hurricane Center. 30 May 2019. 2019; p. 98. Available online: https://www.nhc.noaa.gov/data/tcr/AL062018_Florence.pdf (accessed on 21 December 2019).
- National Hurricane Center and Central Pacific Hurricane Venter. NHC GIS Archive – Tropical Cyclone Best Track for AL 11207. Available online: https://www.nhc.noaa.gov/gis/archive_besttrack_results.php?id=al11&year=2017&name=Hurricane%20IRMA (accessed on 1 July 2020).
- National Hurricane Center and Central Pacific Hurricane Venter. NHC GIS Archive – Tropical Cyclone Best Track for AL 062018. Available online: https://www.nhc.noaa.gov/gis/archive_besttrack_results.php?id=al06&year=2018&name=Hurricane%20FLORENCE (accessed on 1 July 2020).
- Harris, M.E.; Ellis, J.T.; Barrineau, C.P. Evaluating the geomorphic response from sand fences on dunes impacted by hurricanes. Ocean Coast. Manage 2020. (in print). [Google Scholar] [CrossRef]
- Zhang, K.; Douglas, B.; Leatherman, S.; The, S.; July, N.; Zhang, K.; Douglas, B.; Leatherman, S. Do storms cause long-term beach erosion along the U.S. east barrier coast? J. Geol. 2002, 110, 493–502. [Google Scholar] [CrossRef]
- National Weather Service (NWS). Tropical Storm Irma–September 10-11, 2017. Available online: https://www.weather.gov/chs/TropicalStormIrma-Sep2017f (accessed on 9 March 2020).
- Masselink, G.; Hughes, M.G. Introduction to Coastal Geomorphology and Processes; Arnold: London, UK, 2003; p. 354. [Google Scholar]
- Ellis, J.T.; Sherman, D.J. Fundamentals of aeolian sediment transport: Wind blown sand. In Treatise on Geomorphology; Schroder, J., Lancaster, N., Sherman, D.J., Baas, A.C.W., Eds.; Academic Press: San Diego, CA, USA, 2013; Volume 11, pp. 85–108. [Google Scholar]
- USGS Coastal Change Hazards. Available online: https://marine.usgs.gov/coastalchangehazardsportal/ (accessed on 9 March 2020).
- Griffen, M.; Malsick, M.; Mizzell, H.; Moore, L. Historic rainfall and record-breaking flooding from Hurricane Florence in the Pee Dee Watershed. J. South Carolina Water Res. 2019, 6, 28–35. [Google Scholar] [CrossRef]


| Irma | Florence | ||
|---|---|---|---|
| SSHWS | Tropical storm | Tropical Storm | |
| Wind Speed (m/s) | Average | 7.3 * | 6.0 * |
| 2σ | 8.9 * | 7.2 * | |
| Wind Gust (m/s) | Average | 9.4 * | 7.6 * |
| 2σ | 11.5 * | 9.0 * | |
| Maximum | 30.1 * | 23.6 * | |
| Dominant Storm Wind Direction | NE * | SSW * | |
| Significant Wave Height (m) | Average | 1.8 * | 3.1 * |
| 2σ | 1.3 * | 1.4 * | |
| Storm Surge (m) MHHW | 1.28 ° | 0.45 # | |
| Storm Precipitation Total (mm) | 184.25 ° | 31.75 # |
| Irma | Florence | |||
|---|---|---|---|---|
| Pre- | Post- | Pre- | Post- | |
| SITE A | ||||
| Volume (m3) | 1762.2 | 1437.1 | 1488.9 | 1482.1 |
| nv | 1.00 | 0.82 | 1.00 | 1.00 |
| SITE B | ||||
| Volume (m3) | 4934.6 | 2017.3 | 2953.5 | 2772.7 |
| nv | 1.00 | 0.41 | 1.00 | 0.94 |
© 2020 by the authors. Licensee MDPI, Basel, Switzerland. This article is an open access article distributed under the terms and conditions of the Creative Commons Attribution (CC BY) license (http://creativecommons.org/licenses/by/4.0/).
Share and Cite
Ellis, J.T.; Harris, M.E.; Román-Rivera, M.A.; Ferguson, J.B.; Tereszkiewicz, P.A.; McGill, S.P. Application of the Saffir-Simpson Hurricane Wind Scale to Assess Sand Dune Response to Tropical Storms. J. Mar. Sci. Eng. 2020, 8, 670. https://doi.org/10.3390/jmse8090670
Ellis JT, Harris ME, Román-Rivera MA, Ferguson JB, Tereszkiewicz PA, McGill SP. Application of the Saffir-Simpson Hurricane Wind Scale to Assess Sand Dune Response to Tropical Storms. Journal of Marine Science and Engineering. 2020; 8(9):670. https://doi.org/10.3390/jmse8090670
Chicago/Turabian StyleEllis, Jean T., Michelle E. Harris, Mayra A. Román-Rivera, J. Brianna Ferguson, Peter A. Tereszkiewicz, and Sean P. McGill. 2020. "Application of the Saffir-Simpson Hurricane Wind Scale to Assess Sand Dune Response to Tropical Storms" Journal of Marine Science and Engineering 8, no. 9: 670. https://doi.org/10.3390/jmse8090670
APA StyleEllis, J. T., Harris, M. E., Román-Rivera, M. A., Ferguson, J. B., Tereszkiewicz, P. A., & McGill, S. P. (2020). Application of the Saffir-Simpson Hurricane Wind Scale to Assess Sand Dune Response to Tropical Storms. Journal of Marine Science and Engineering, 8(9), 670. https://doi.org/10.3390/jmse8090670