Beach Nourishment as an Adaptation to Future Sandy Beach Loss Owing to Sea-Level Rise in Thailand


Abstract
1. Introduction
2. Methods
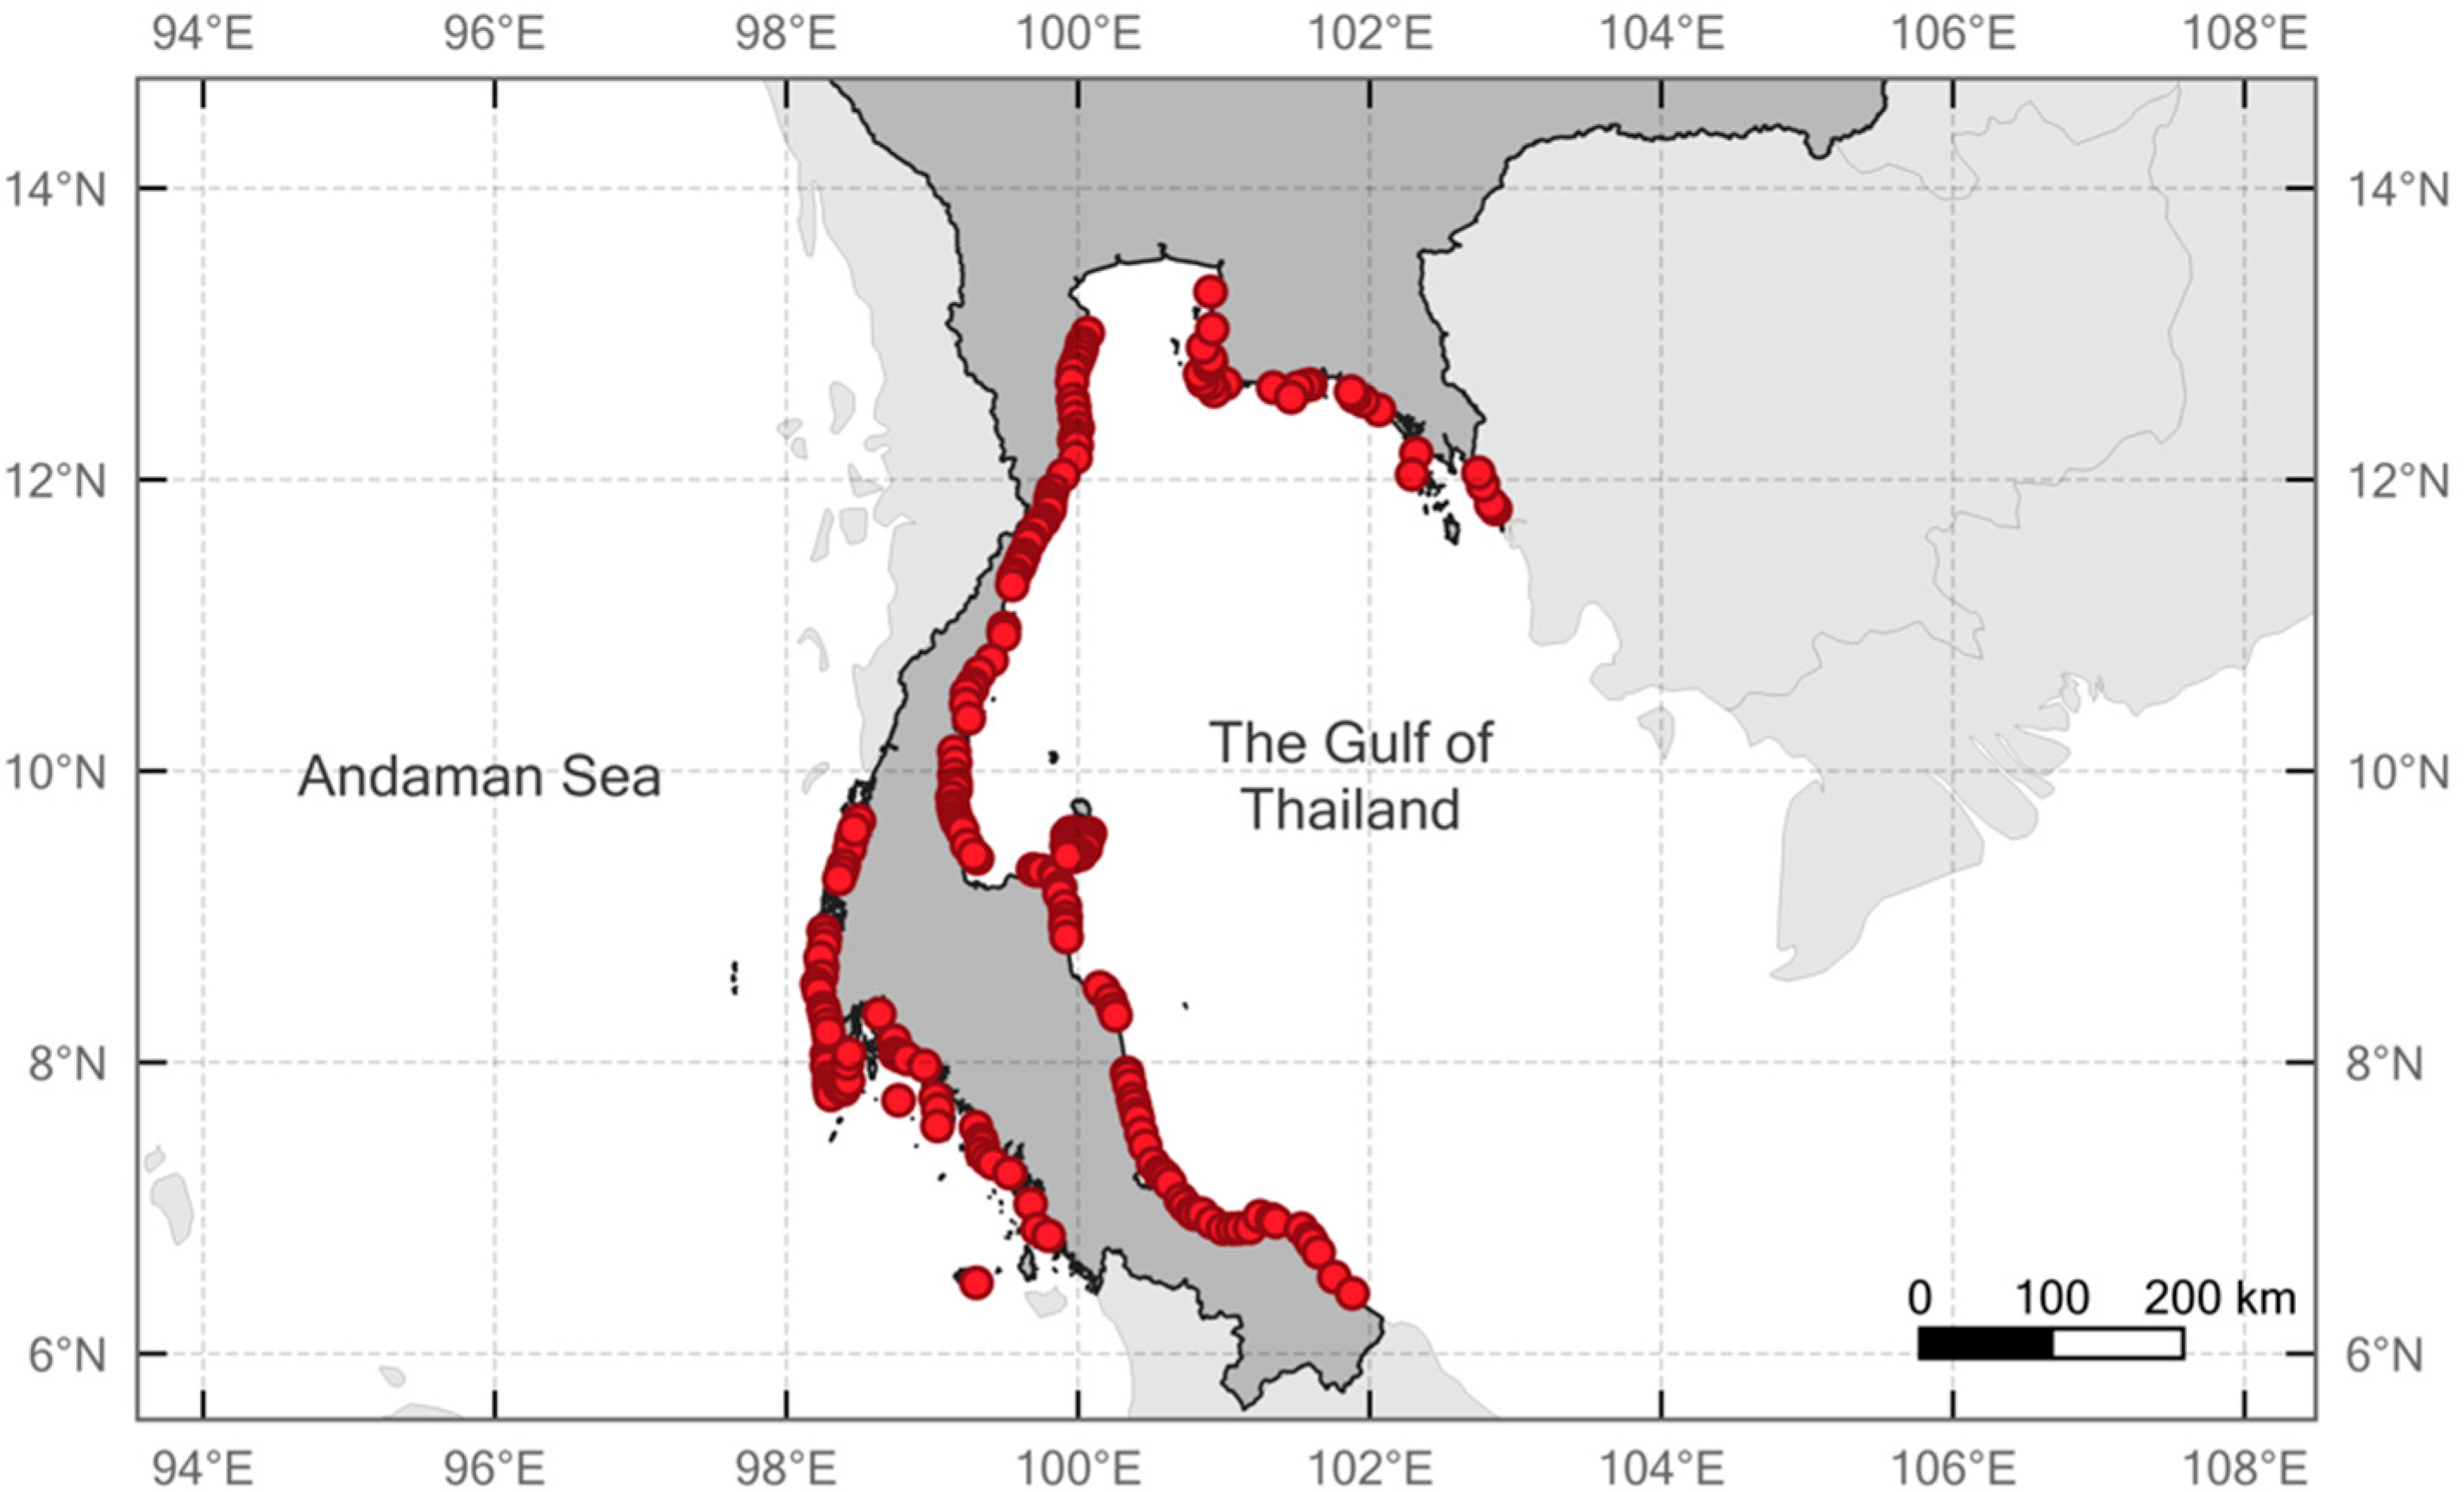
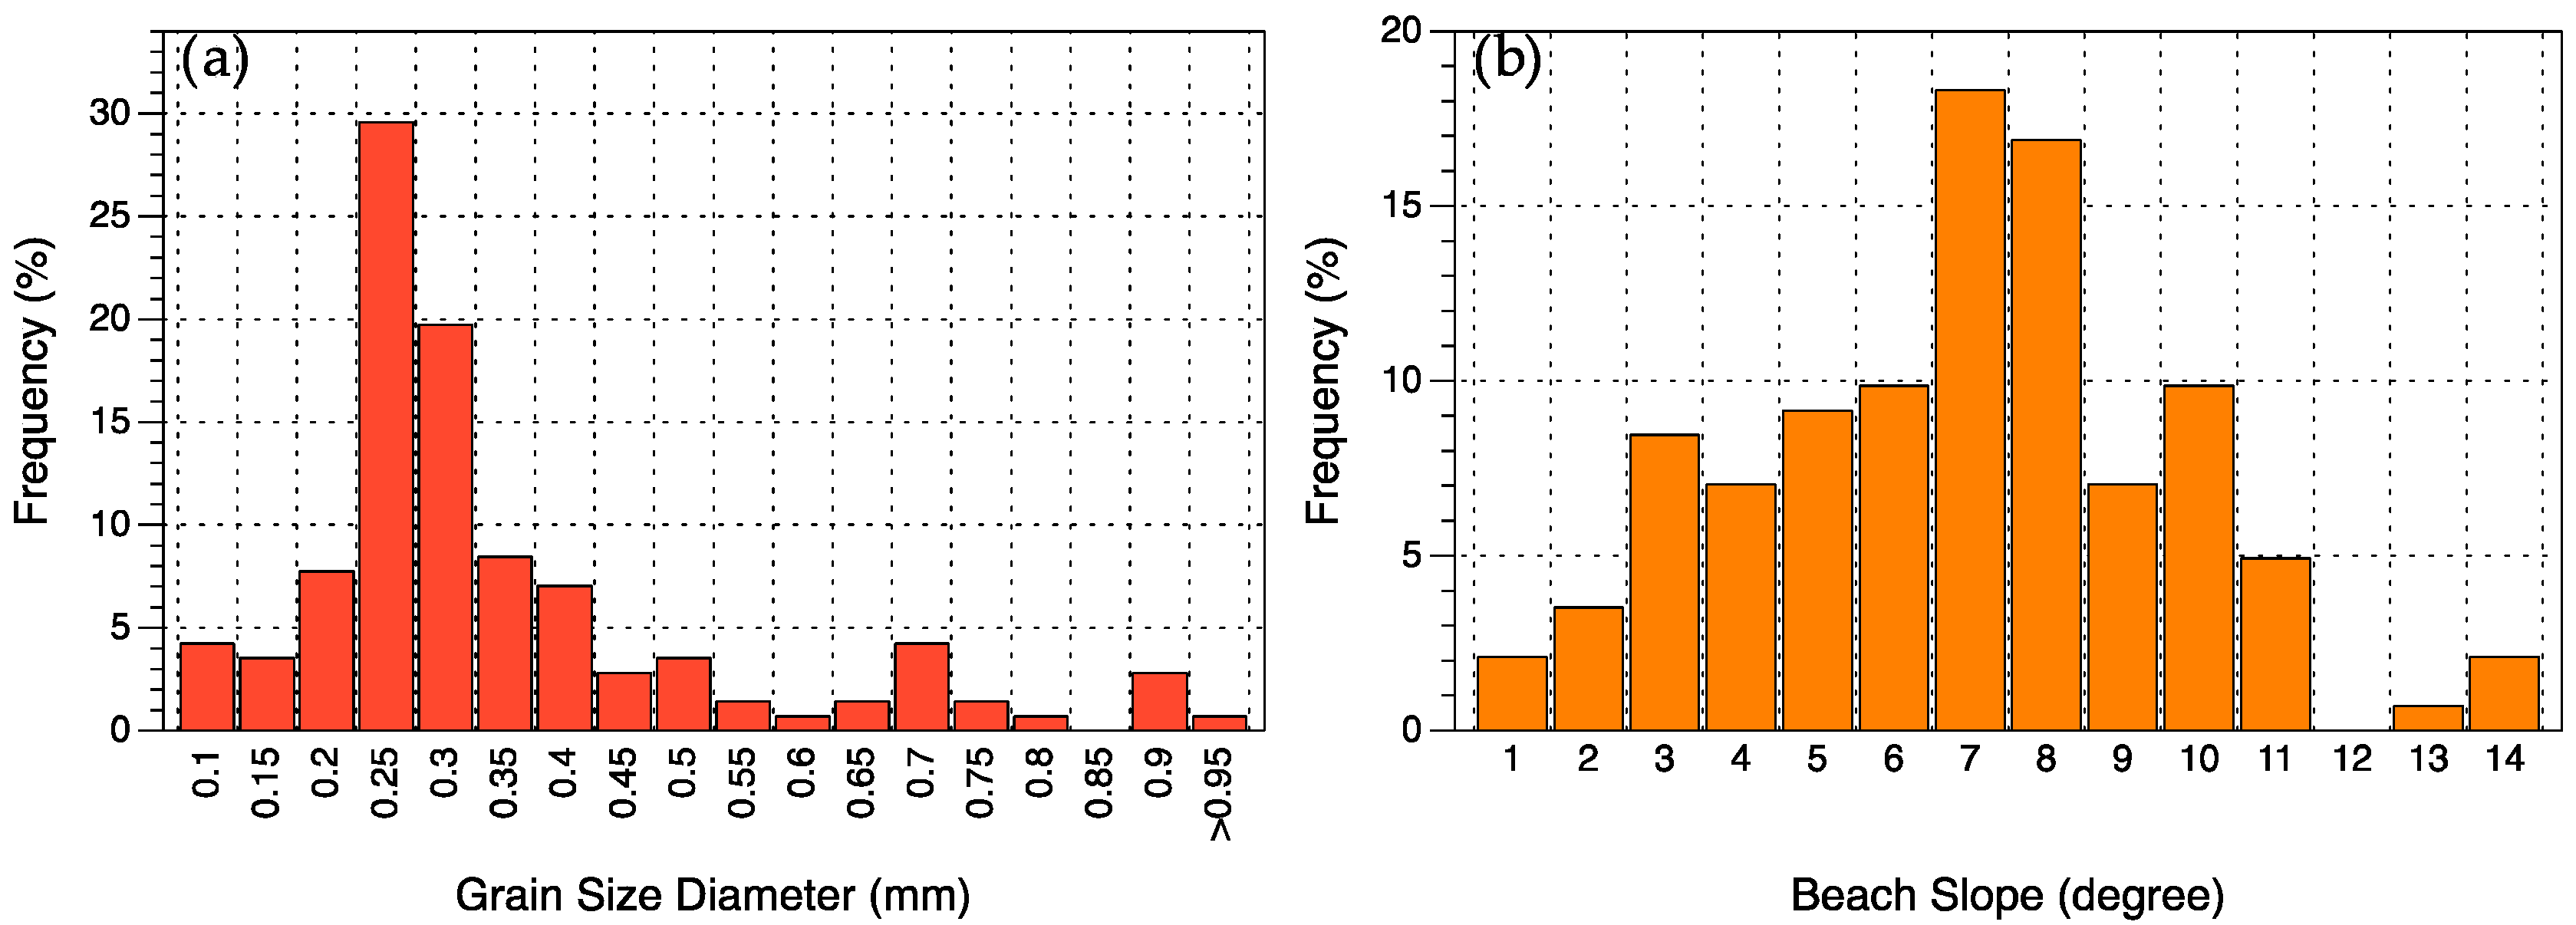
2.1. Study Area
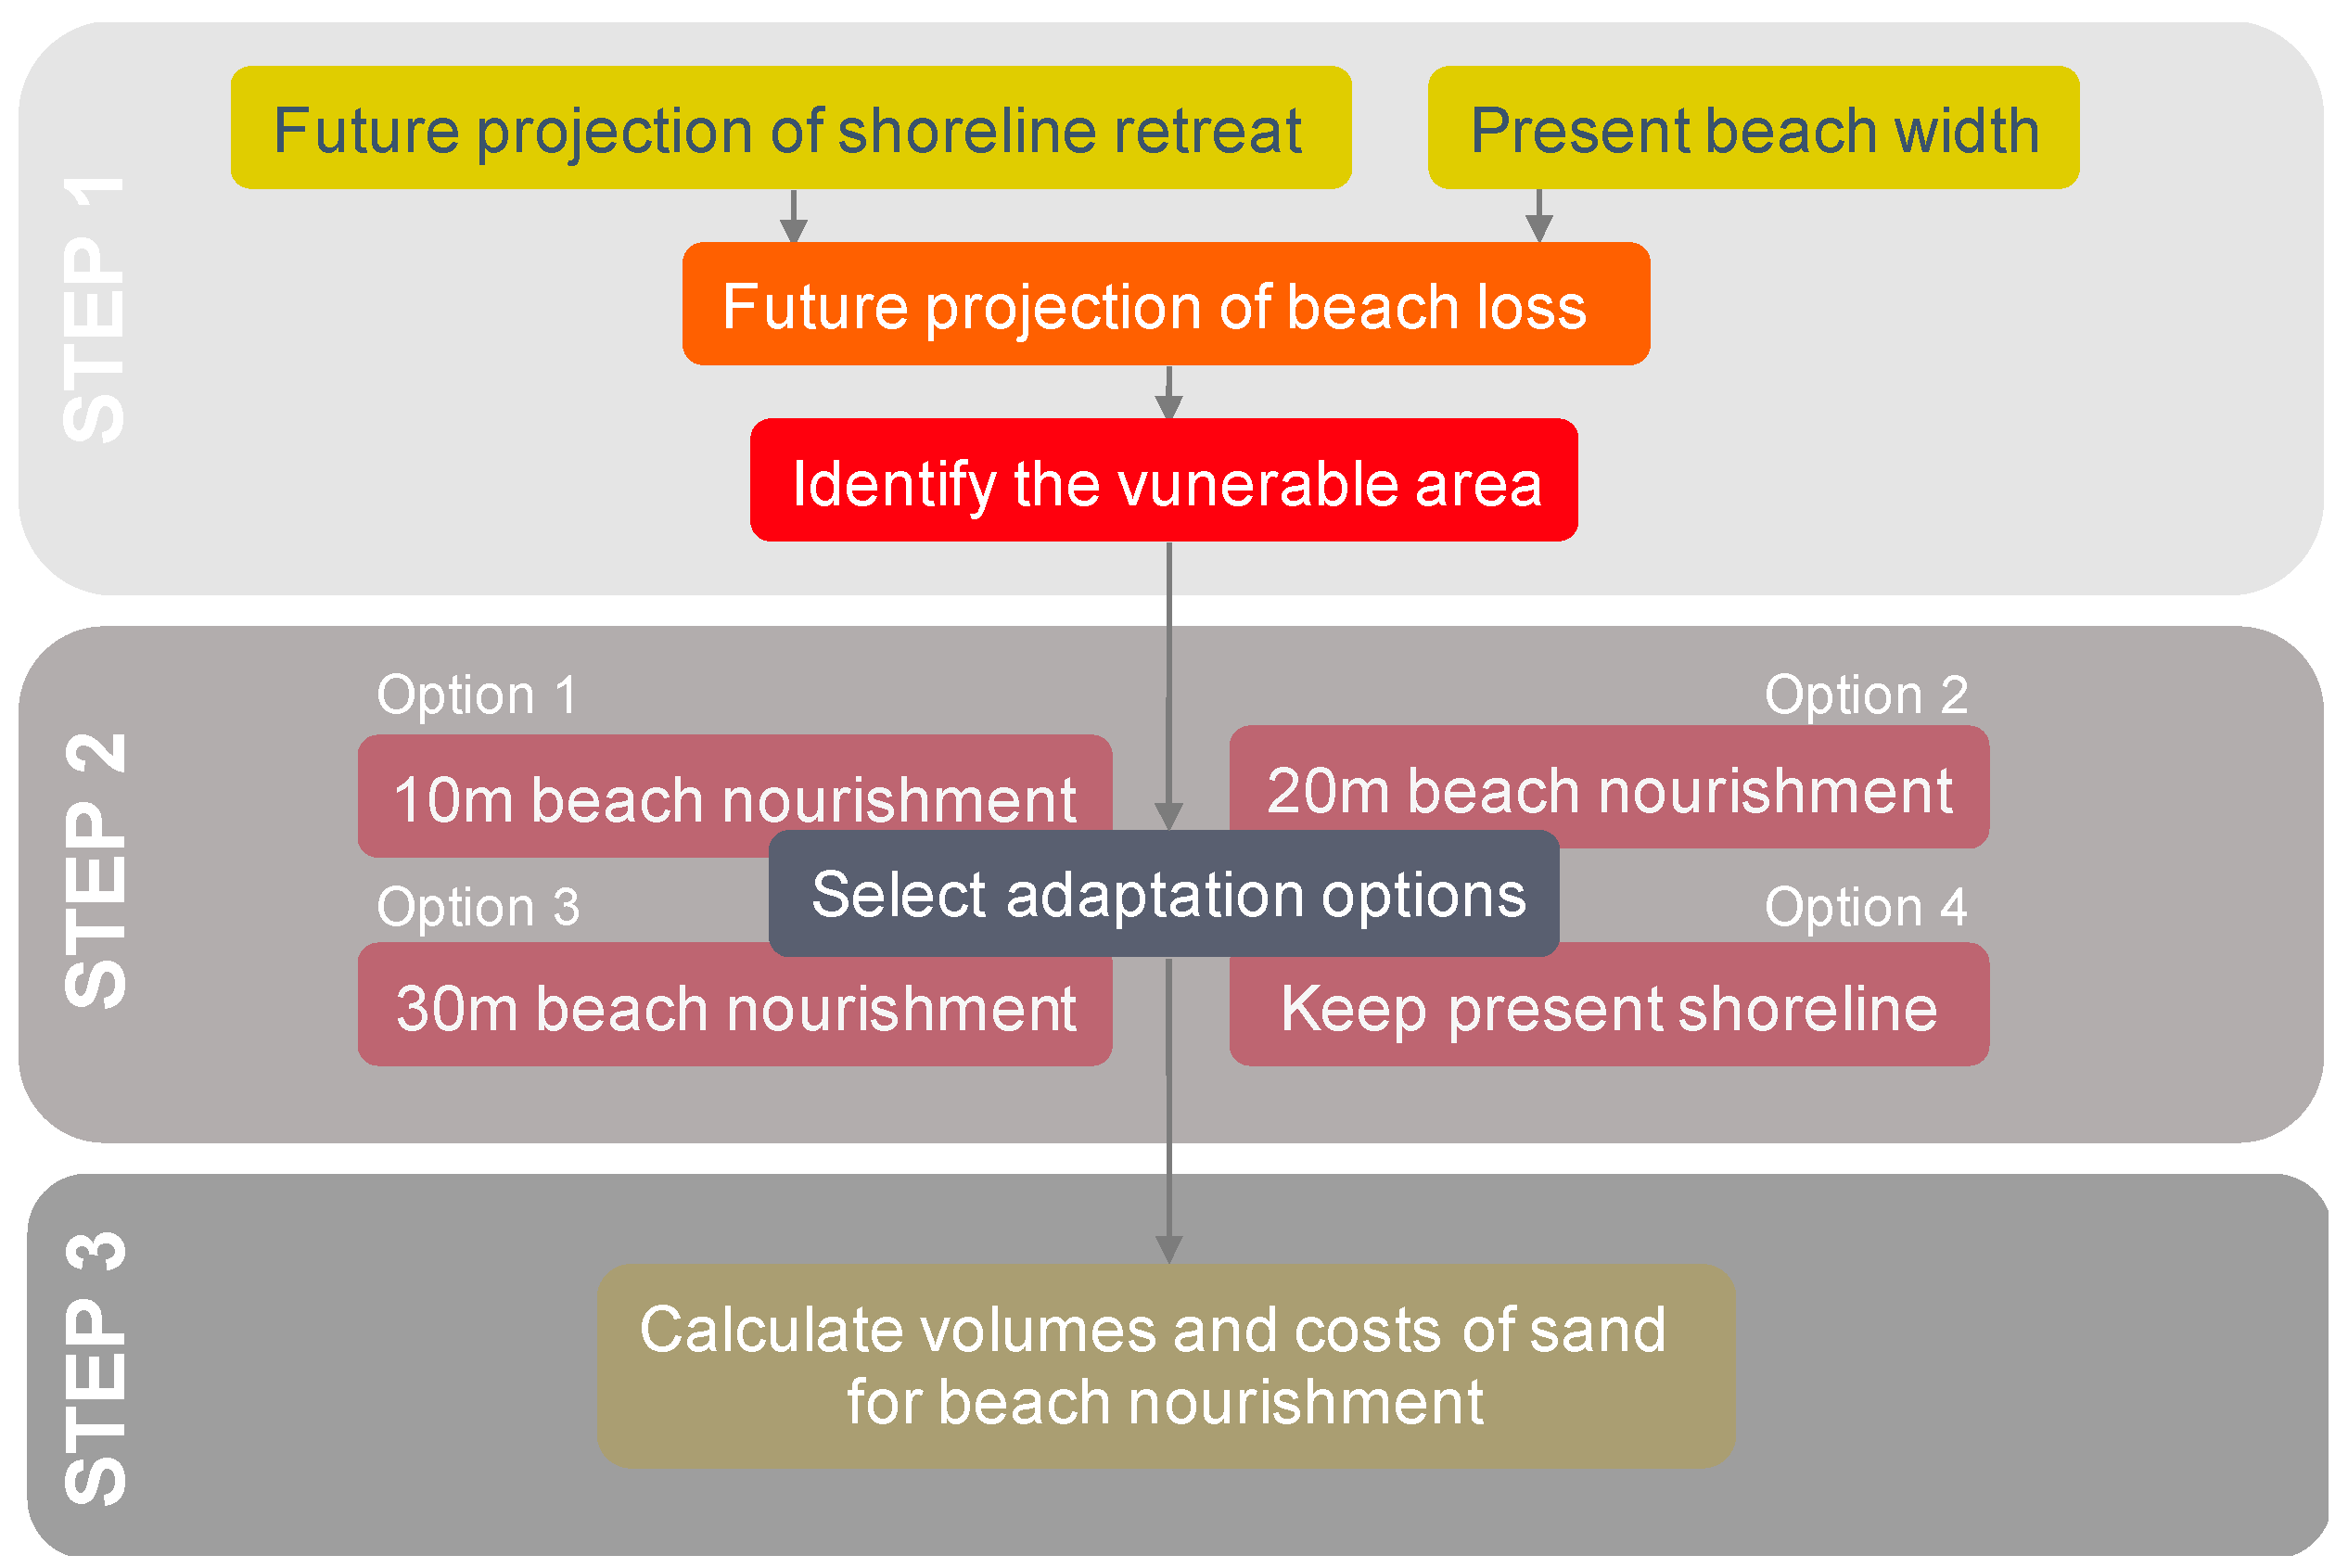
2.2. Framework for Beach Nourishment
2.3. Beach Nourishment Model
3. Results and Discussion
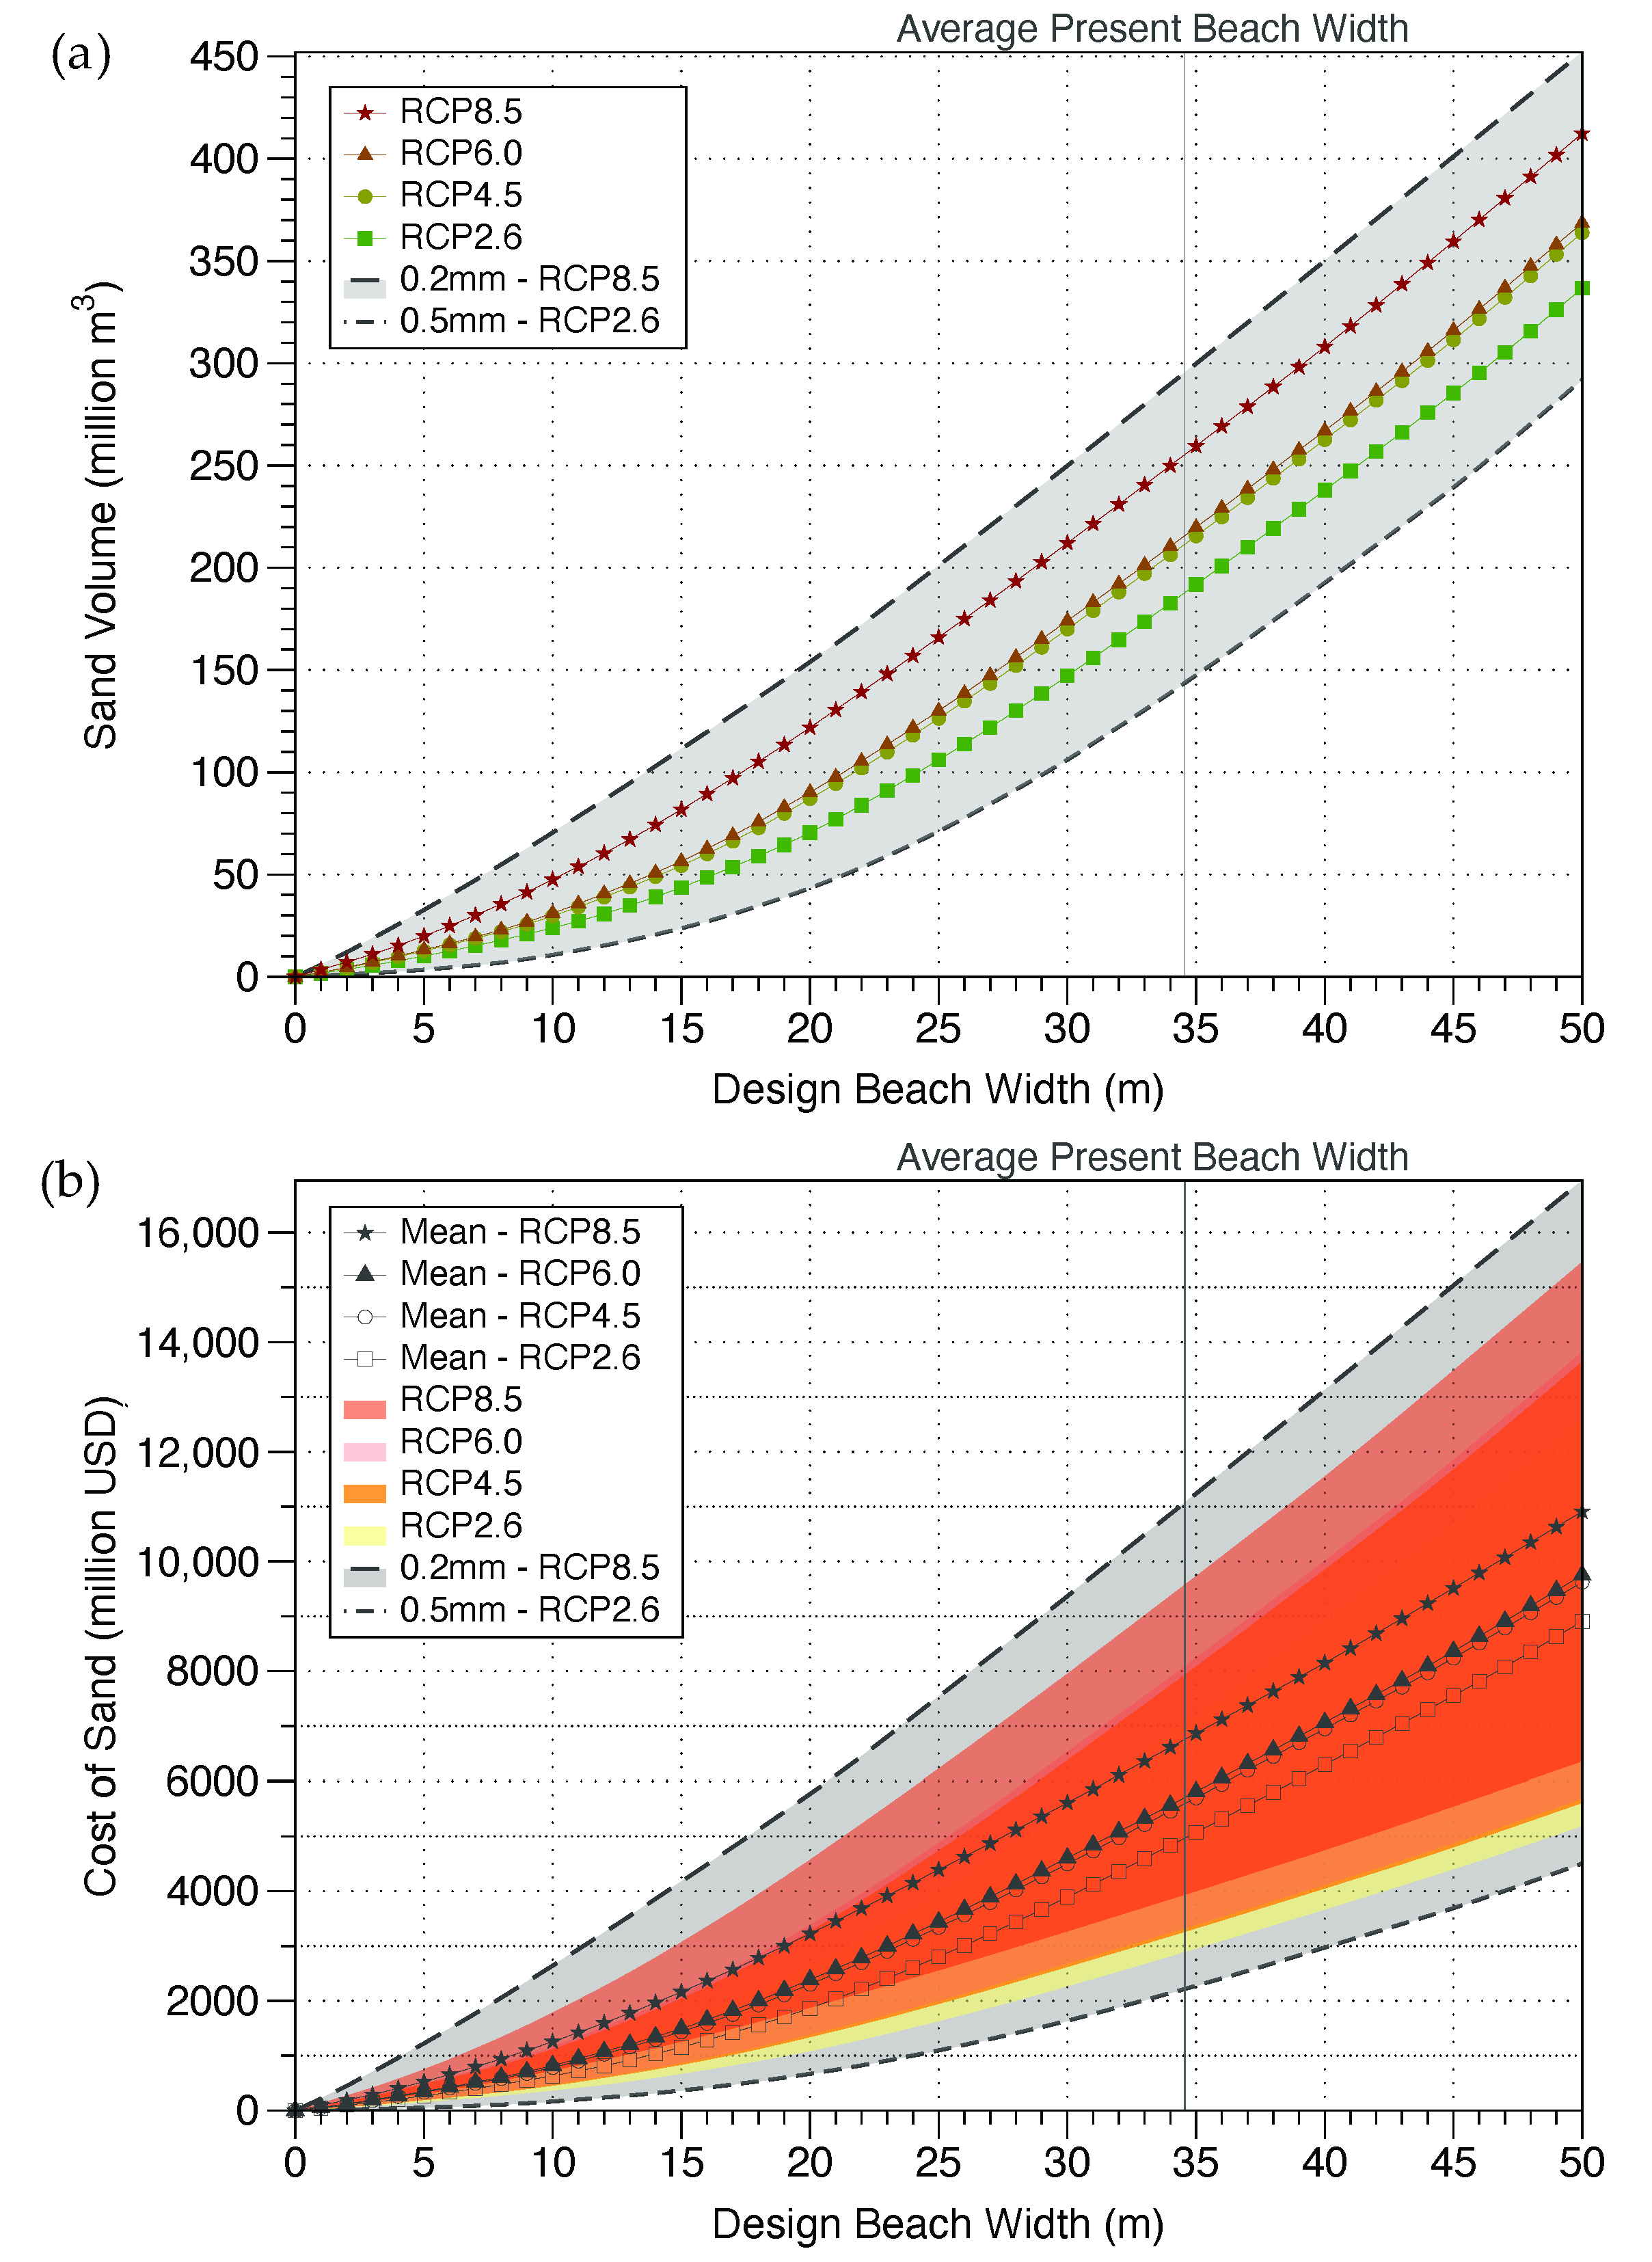
3.1. Sand Volume and Cost of Beach Nourishment
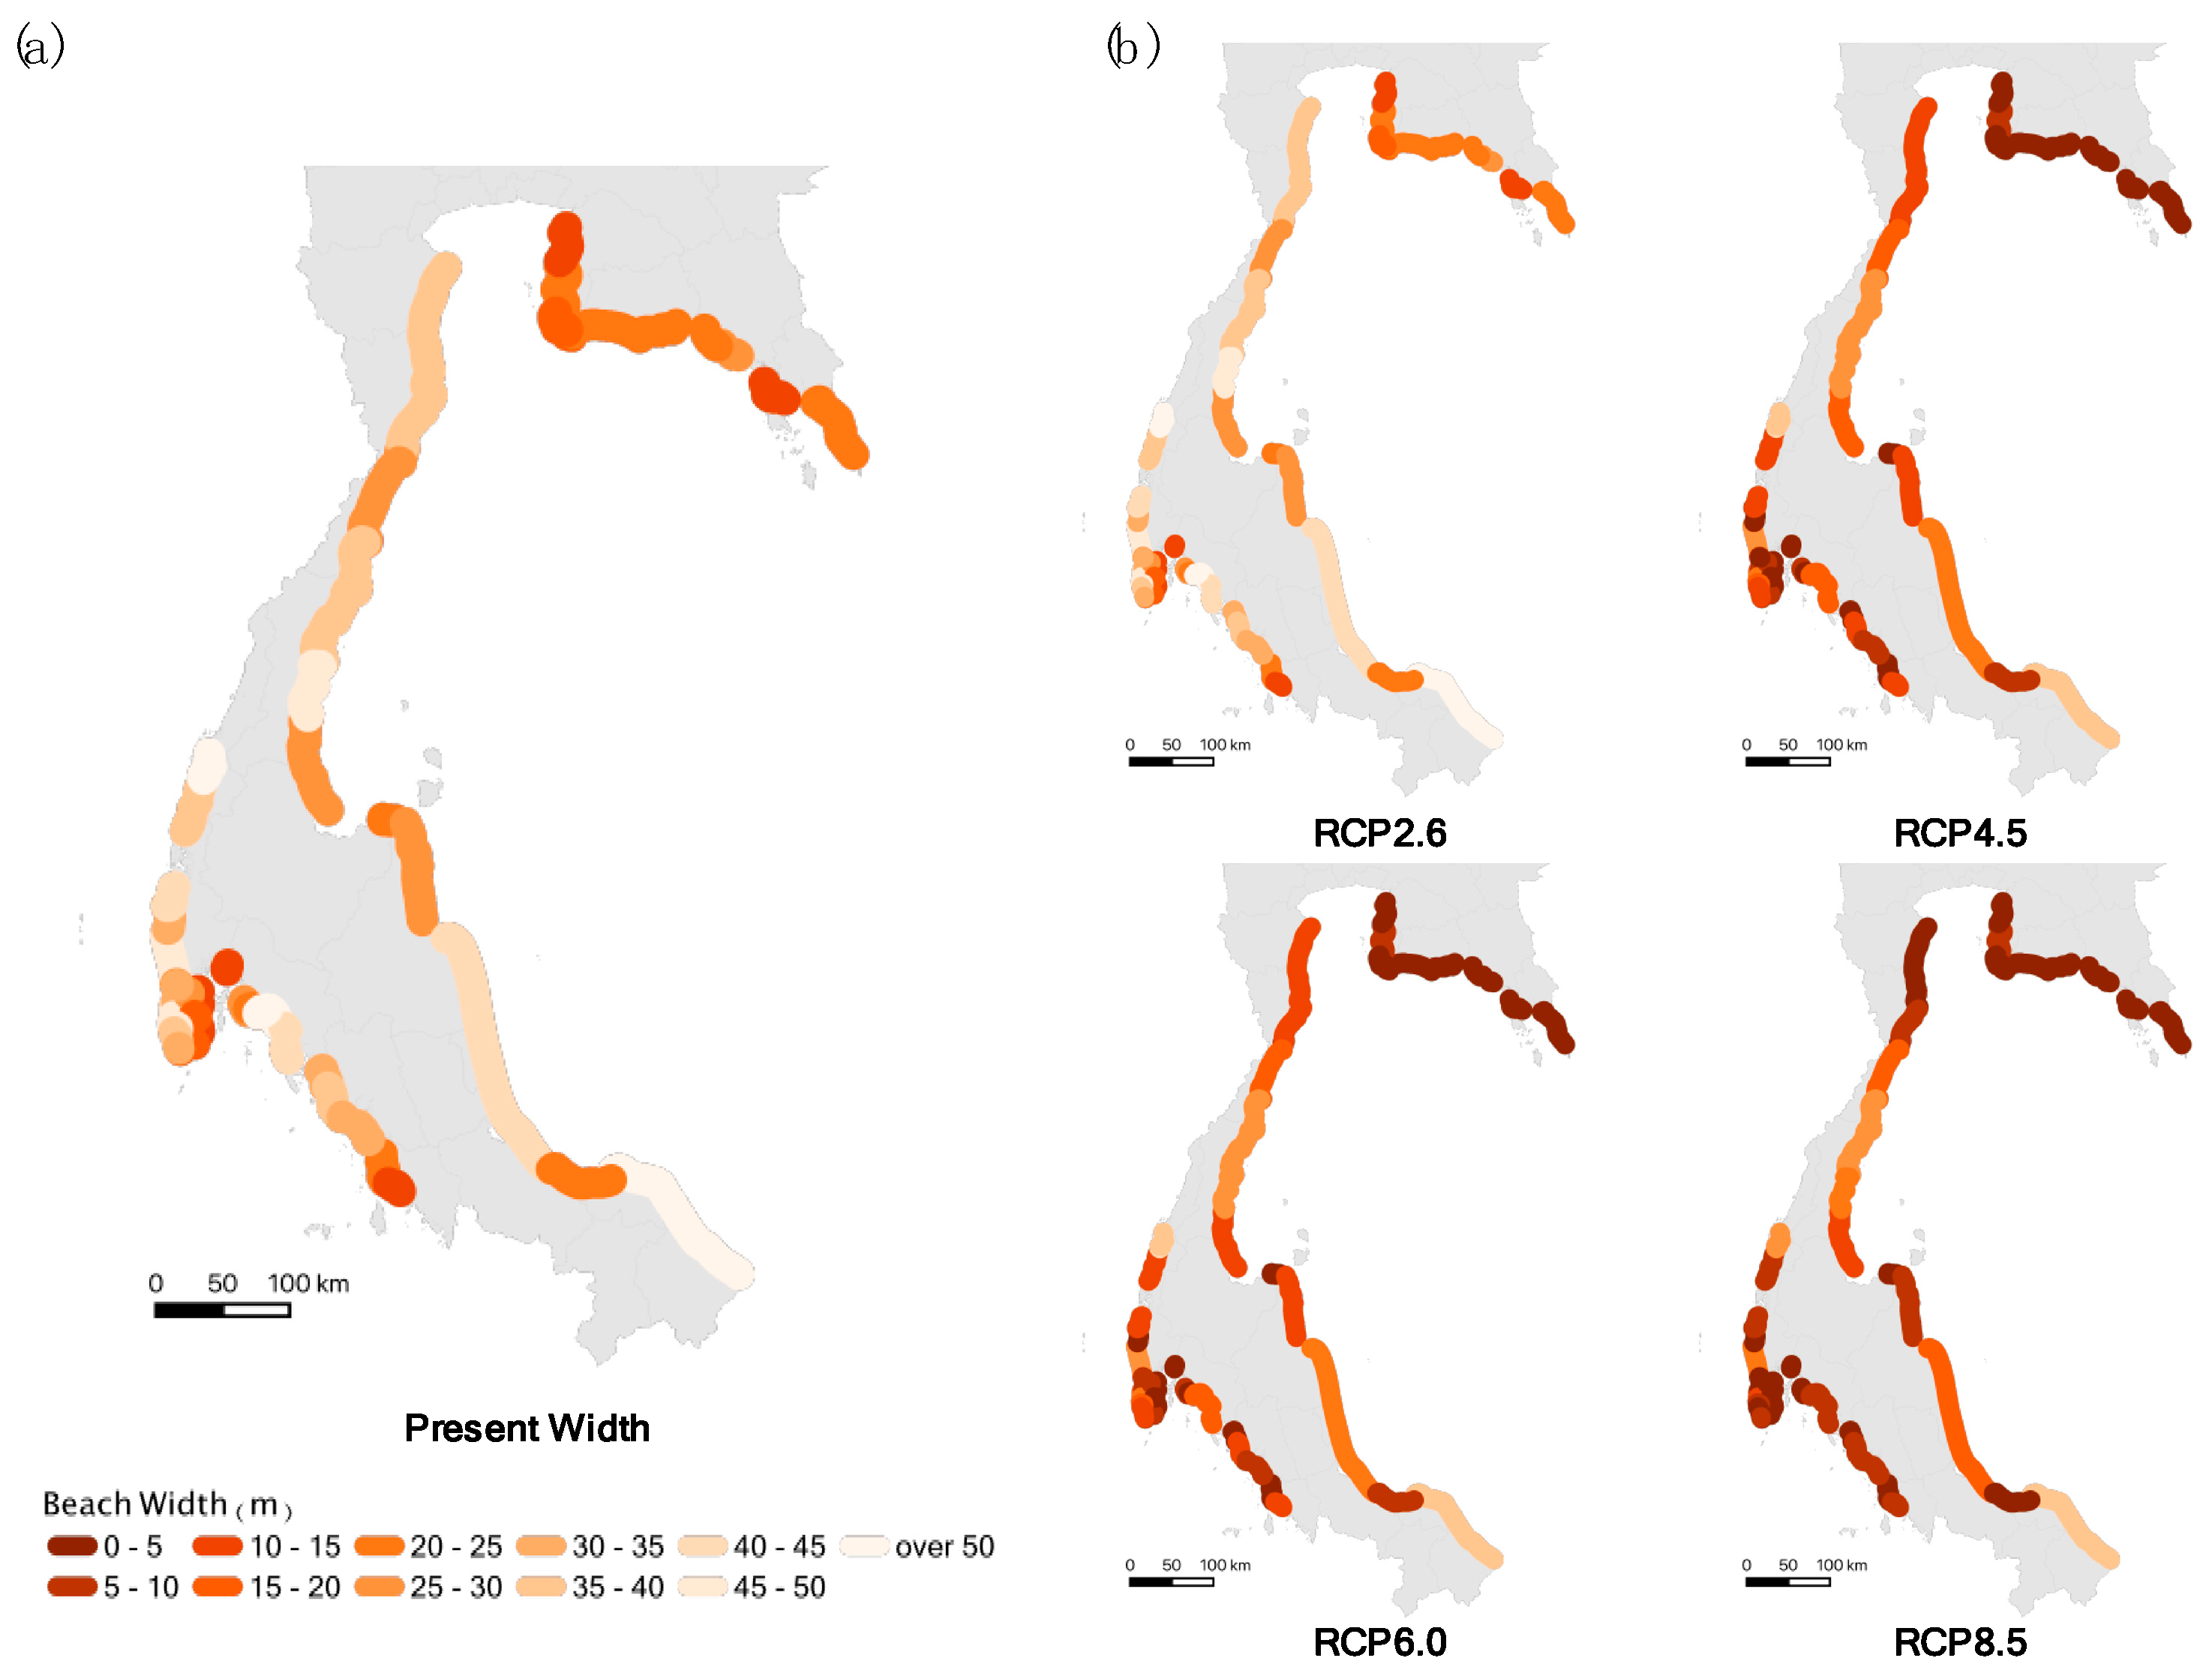
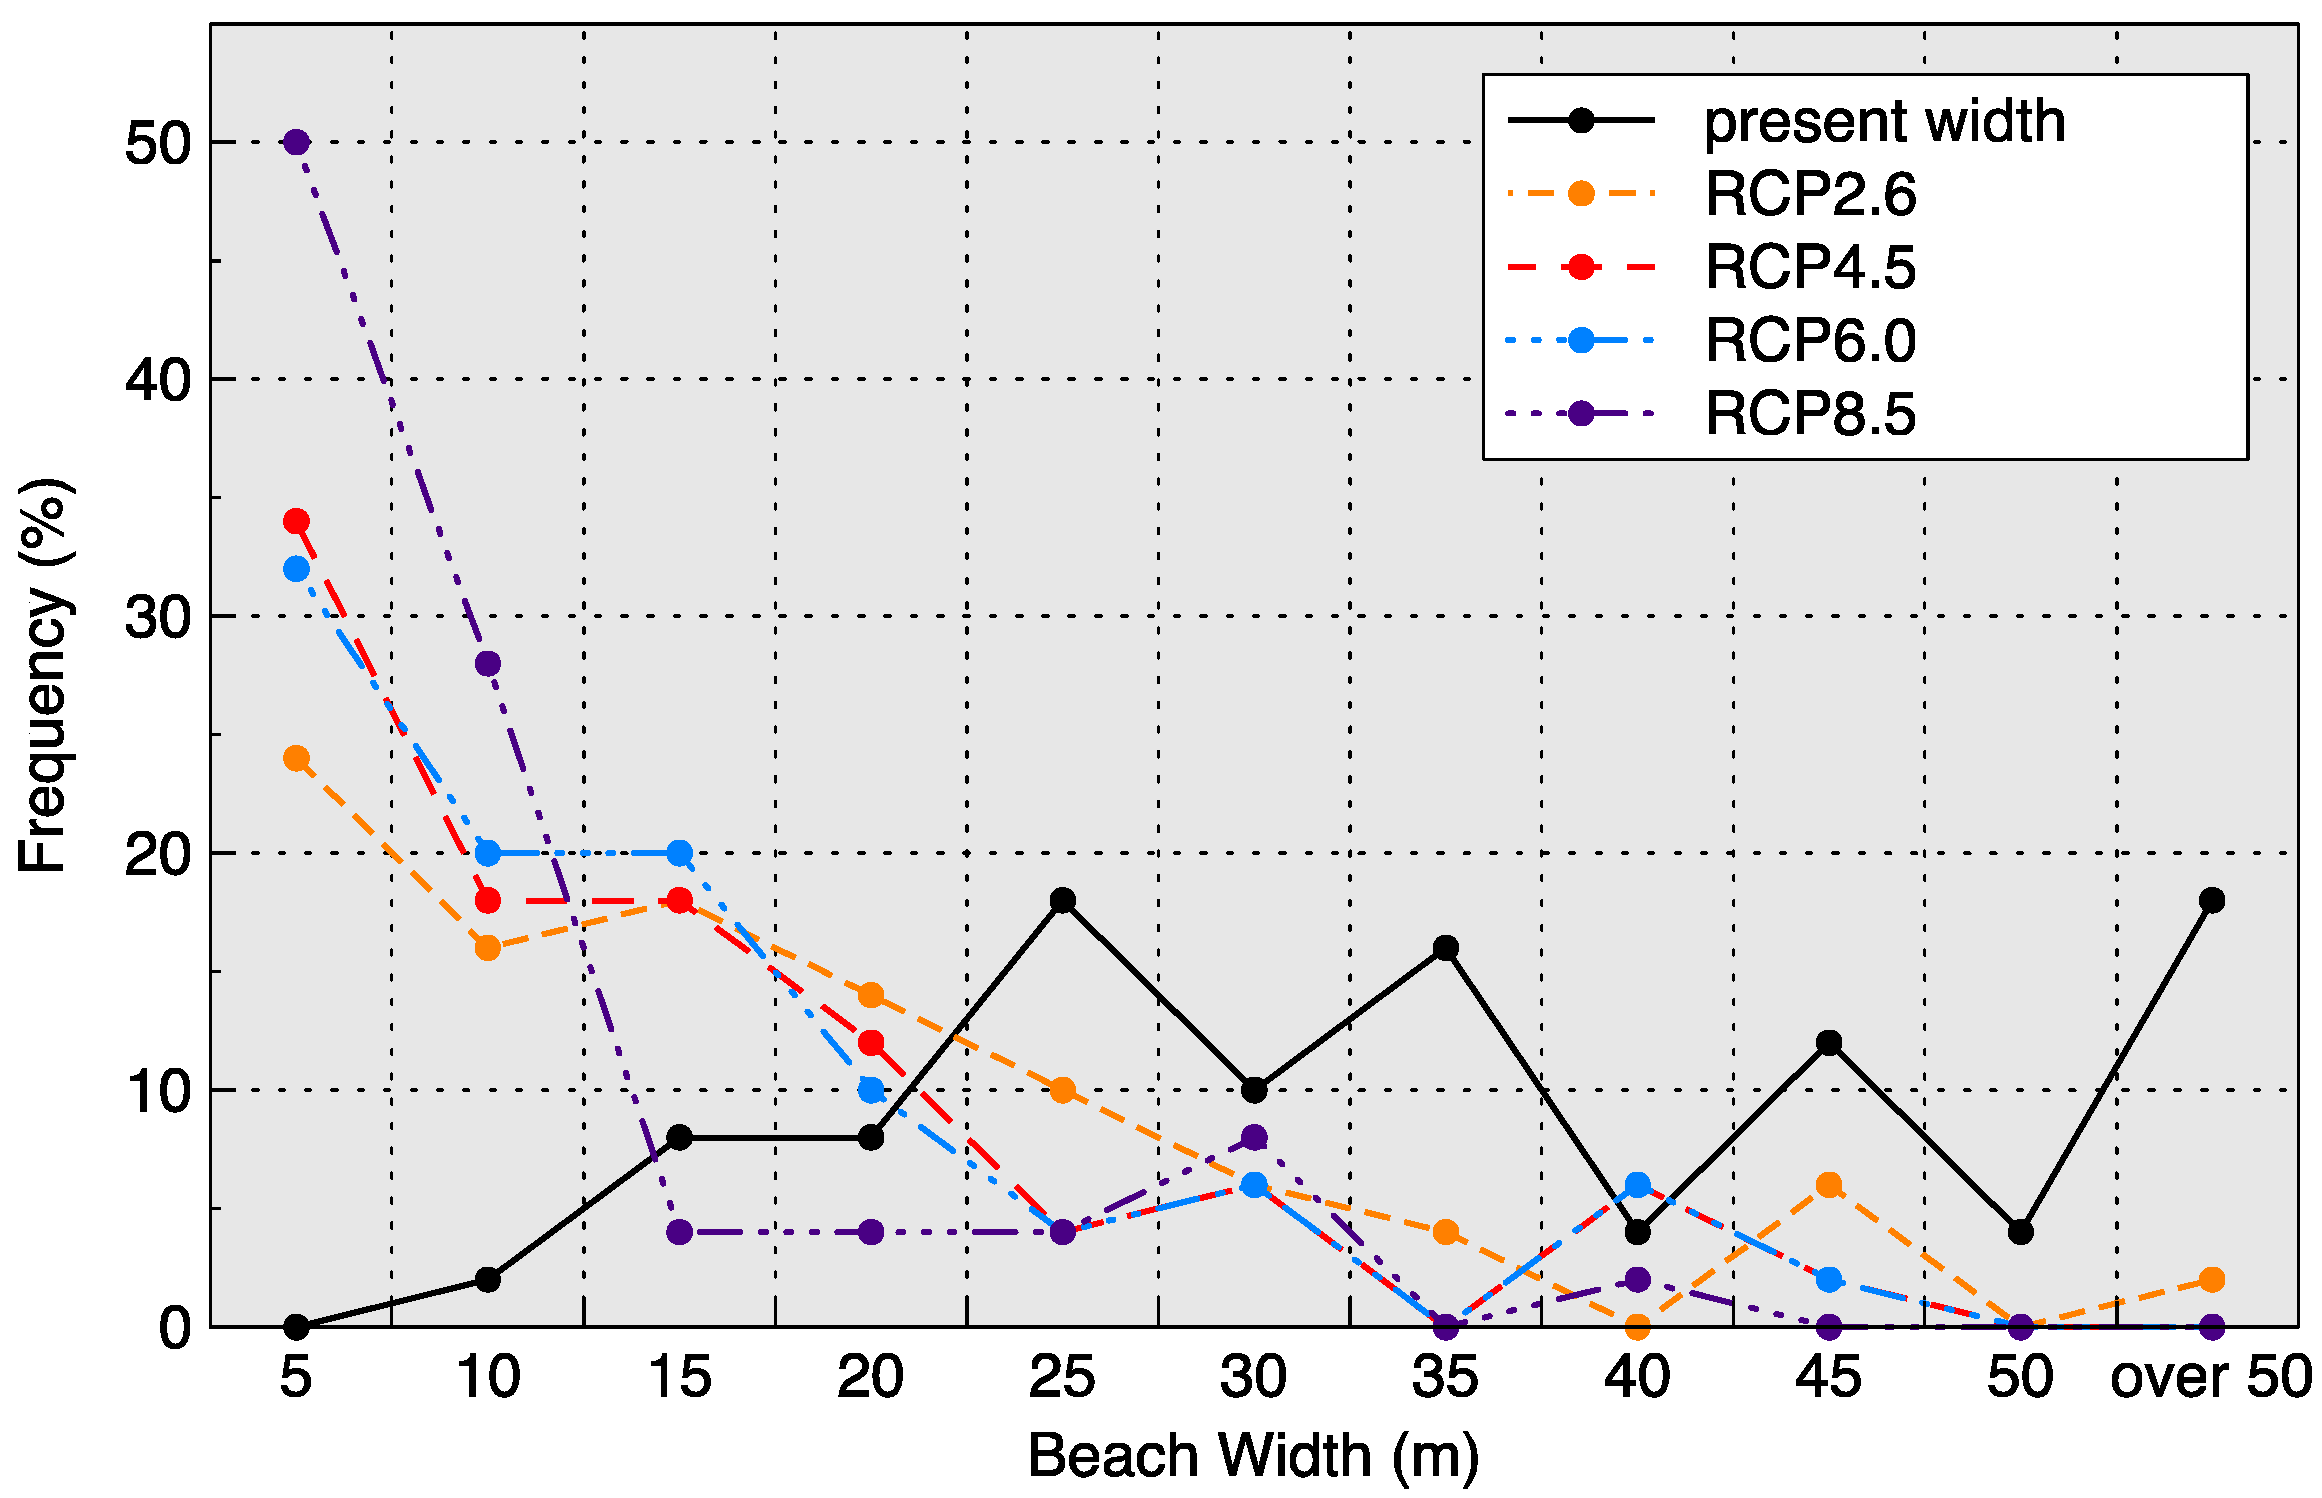
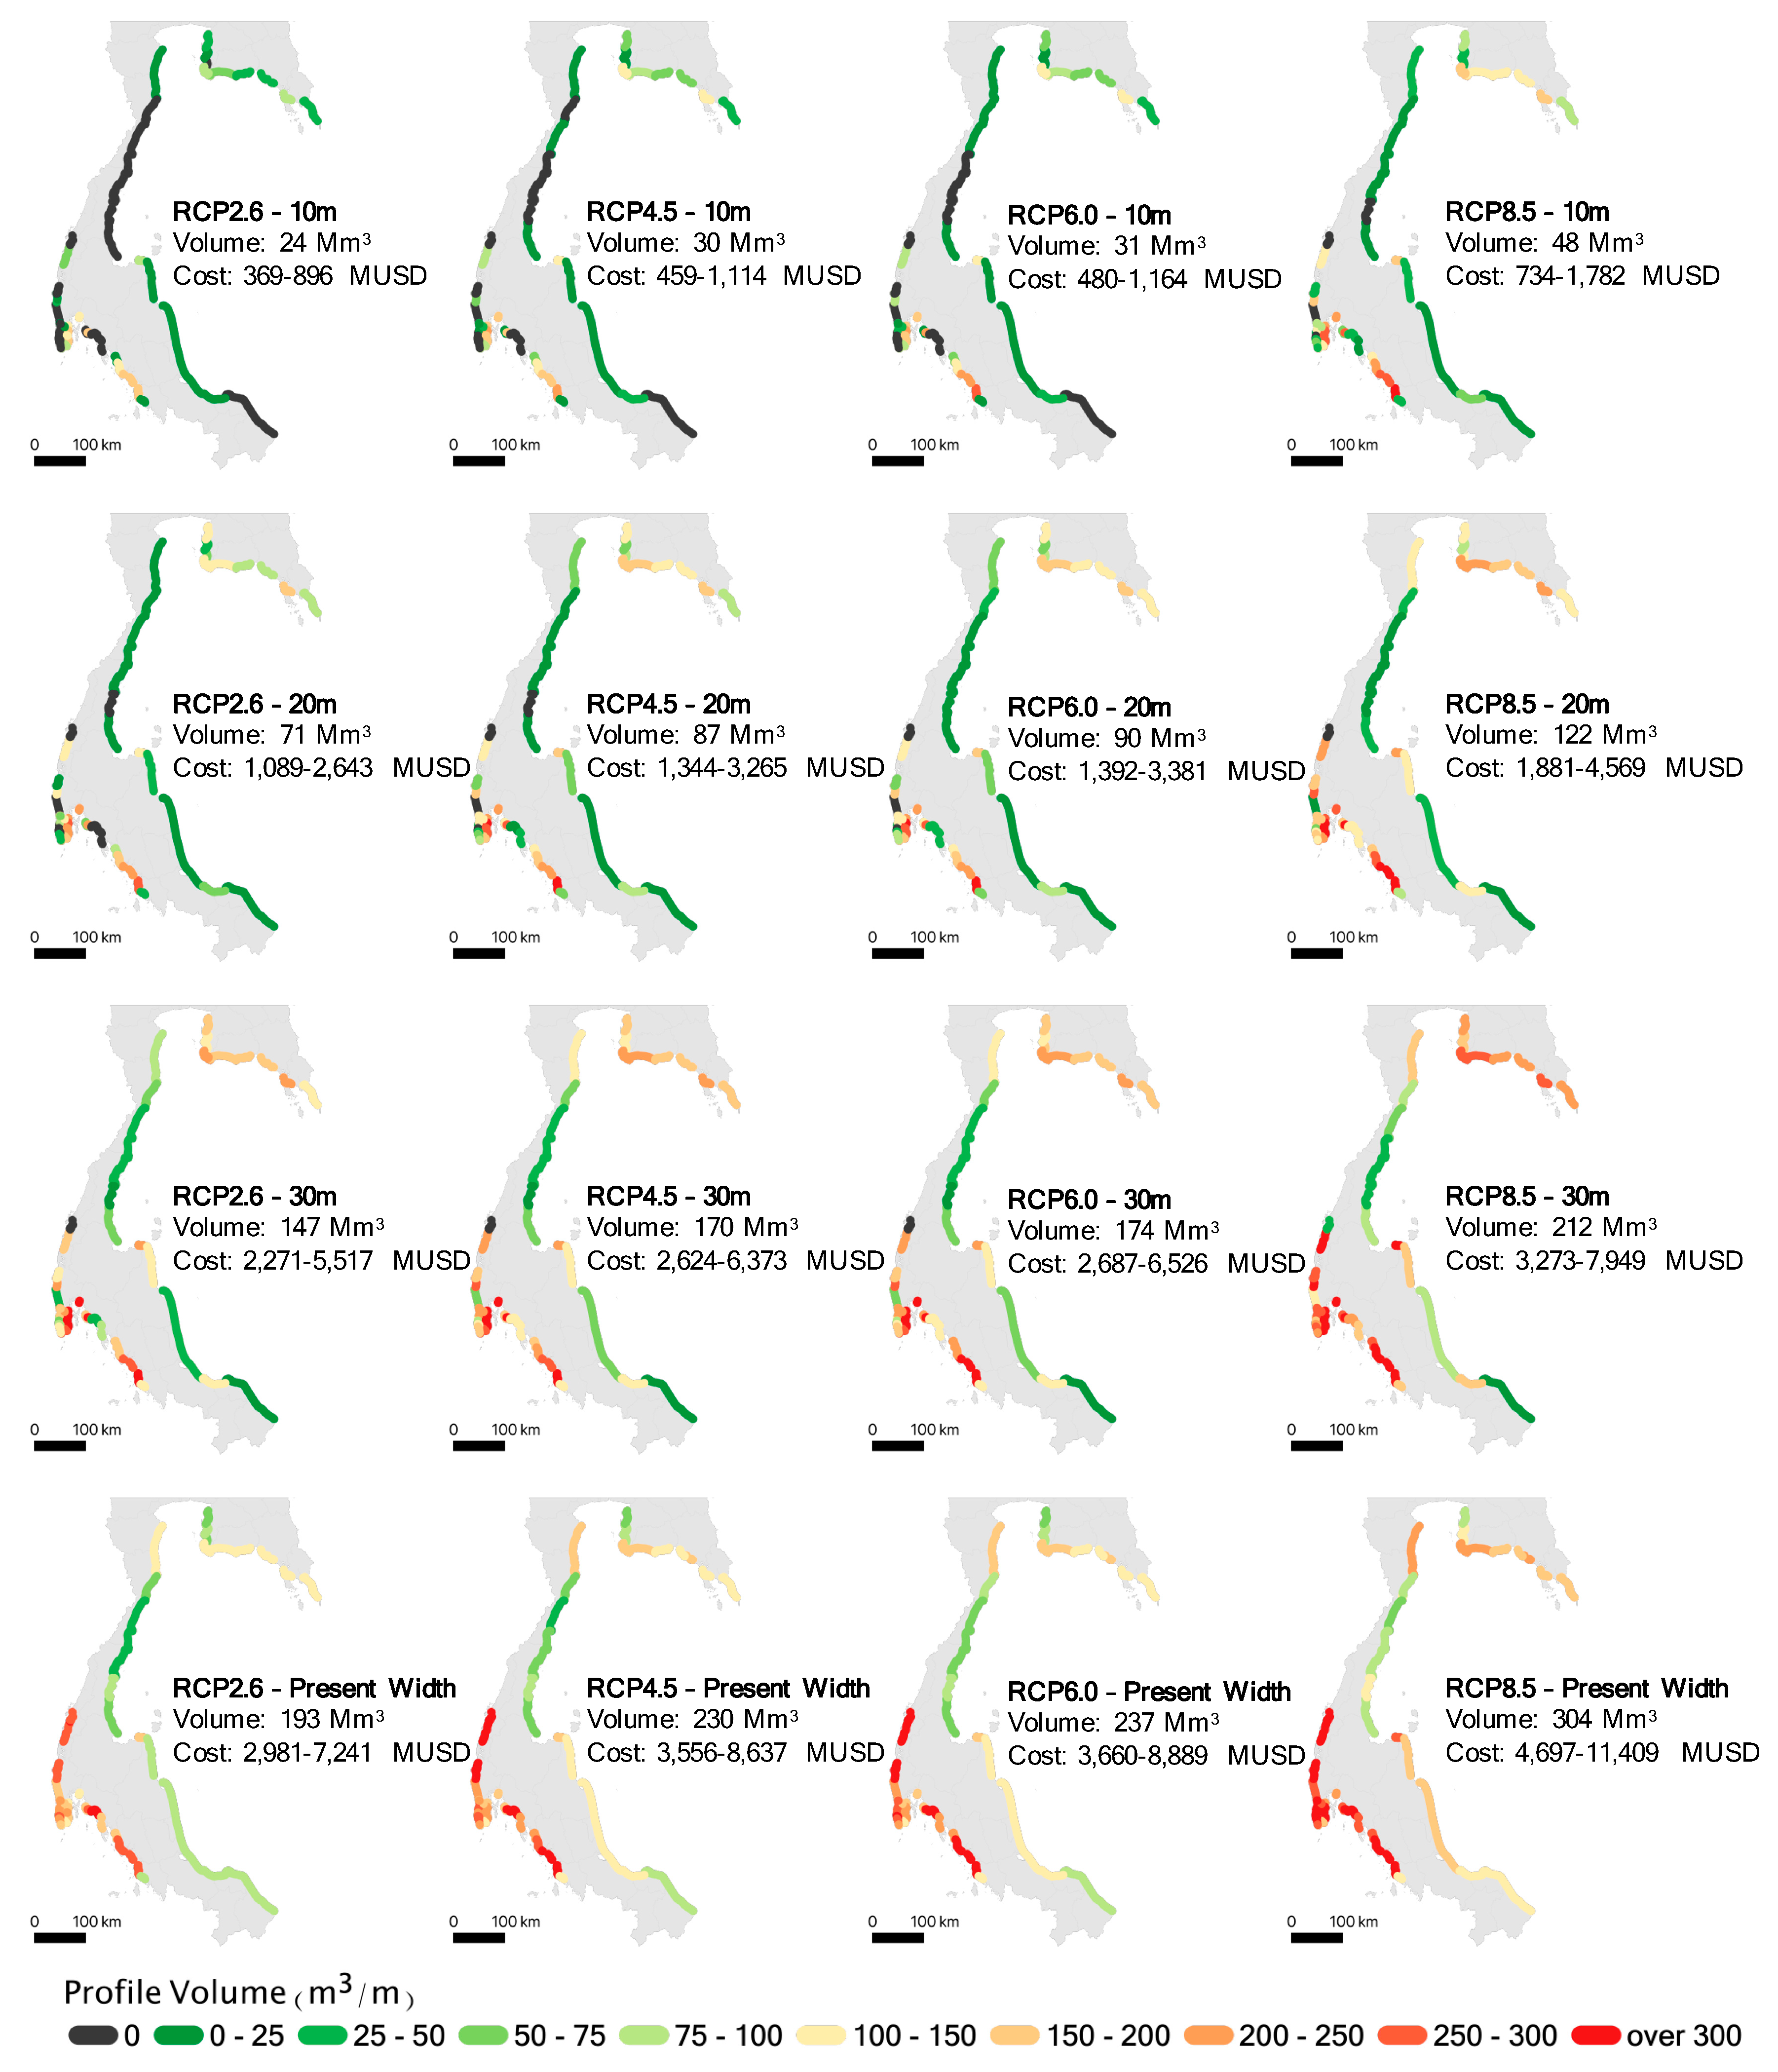
3.2. A Zonal Sand Volume Map for 51 Sandy Beach Zones
3.3. The Feasibility of the Beach Nourishment Project in Thailand
3.4. The Limitations and Recommendations for Future Research
4. Conclusions
Author Contributions
Funding
Acknowledgments
Conflicts of Interest
Abbreviations
| CMIP5 | Coupled Model Intercomparison Project Phase 5 |
| DMCR | Department of Coastal and Marine Resources of Thailand |
| DoC | Depth of Closure |
| ECMWF | European Centre for Medium-Range Weather Forecasts |
| GoT | Gulf of Thailand |
| IPCC | Intergovernmental Panel on Climate Change |
| MUSD | Million United State Dollar |
| RCP | Representative Concentration Pathway |
| SLR | Sea-Level Rise |
| USD | United States Dollars |
References
- Ranasinghe, R.; Callaghan, D.; Stive, M.J.F. Estimating coastal recession due to sea-level rise: Beyond the Bruun rule. Clim. Chang. 2012, 110, 561–574. [Google Scholar] [CrossRef]
- Yoshida, J.; Udo, K.; Takeda, Y.; Mano, A. Framework for proper beach nourishment as an adaptation to beach erosion due to sea-level rise, Proceedings 13th International Coastal Symposium (Durban, South Africa). J. Coast. Res. 2014, 70, 467–472. [Google Scholar] [CrossRef]
- Saengsupavanich, C.; Chonwattana, S.; Naimsampao, T. Coastal erosion through integrated management: A case of Southern Thailand. Ocean Coast. Manag. 2009, 52, 307–316. [Google Scholar] [CrossRef]
- Barbier, E.B. Climate change impacts on rural poverty in low-elevation coastal zones. Estuar. Coast. Shelf Sci. 2015, 165, A1–A13. [Google Scholar] [CrossRef]
- Dasgupta, S.; Laplante, B.; Murray, S.; Wheeler, D. Exposure of developing countries to sea-level rise and storm surges. Clim. Chang. 2011, 106, 567–579. [Google Scholar] [CrossRef]
- Diaz, D.B. Estimating Global Damages from Sea Level Rise with the Coastal Impact and Adaptation Model (CIAM). Clim. Chang. 2016, 137, 143–156. [Google Scholar] [CrossRef]
- IPCC. Working Group I Contribution to the Ipcc Fifth Assessment Report Climate Change 2013, the Physical Science Basis; Final draft underlying scientific-technical assessment; IPCC: Stockholm, Sweden; Cambridge University Press: Cambridge, UK, 2013. [Google Scholar]
- Putcharapitchakon, K.; Ritphring, S. Sea-level Change in Thailand. Ladkrabang Eng. J. 2012, 29, 55–60. (In Thai) [Google Scholar]
- Sojisuporn, P.; Sangmanee, C.; Wattayakorn, G. Recent estimate of sea-level rise in the Gulf of Thailand. Maejo Int. J. Sci. Technolgy 2013, 7, 106–113. [Google Scholar]
- Ritphring, S.; Somphong, C.; Udo, K.; Kazama, S. Projections of future beach loss due to sea-level rise for sandy beaches along Thailand’s coastlines, Proceedings from the International Coastal Symposium (ICS) 2018 (Busan, Republic of Korea). J. Coast. Res. 2018, 85, 16–20. [Google Scholar]
- Boonsiritomachai, W.; Phonthanukitithaworn, C. Residents’ Support for Sports Events Tourism Development in Beach City: The Role of Community’s Participation and Tourism Impacts. Sage Open 2019, 4–6, 1–15. [Google Scholar] [CrossRef]
- Nidhinarangkoon, P.; Ritphring, S.; Udo, K. Impact of sea level rise on tourism carrying capacity in Thailand. J. Mar. Sci. Eng. 2020, 8, 104. [Google Scholar] [CrossRef]
- Seenprachawong, U. An Economic Valuation of Coastal Ecosystems in Phang Nga Bay, Thailand. Dev. Econ. Rev. 2008, 3, 27. [Google Scholar]
- Barbier, E.B.; Hacker, S.D.; Kennedy, C.; Koch, E.W.; Stier, A.C.; Silliman, B.R. The value of estuarine and coastal ecosystem services. Ecol. Monogr. 2011, 81, 169–193. [Google Scholar] [CrossRef]
- Hinkel, J.; Lincke, D.; Vafeidis, A.T.; Perrette, M.; Nicholls, R.J.; Tol, R.S.J.; Marzeion, B.; Fettweis, X.; Ionescu, C.; Levermann, A. Coastal flood damage and adaptation costs under 21st century sea-level rise. Proc. Natl. Acad. Sci. USA 2014, 111, 3292–3297. [Google Scholar] [CrossRef]
- Tsoukala, V.K.; Katsardi, V.; Hadjibiros, K.; Moutzouris, C.I. Beach Erosion and Consequential Impacts Due to the Presence of Harbours in Sandy Beaches in Greece and Cyprus. Environ. Process. 2015, 2, 55–71. [Google Scholar] [CrossRef]
- Saengsupavanich, C. Unwelcome environmental impact assessment for coastal protection along a 7-km shoreline in Southern Thailand. Ocean Coast. Manag. 2012, 61, 20–29. [Google Scholar] [CrossRef]
- Finkl, C.W.; Walker, H.J. Beach nourishment. In Encyclopedia of Coastal Science; Finkl, C.W., Makowski, C., Eds.; Springer: Cham, Switzerland, 2019; pp. 147–161. [Google Scholar]
- Cooke, B.C.; Jones, A.R.; Goodwin, I.D.; Bishop, M.J. Nourishment practices on Australian sandy beaches: A review. J. Environ. Manag. 2012, 113, 319–327. [Google Scholar] [CrossRef] [PubMed]
- Udo, K.; Takeda, Y. Projections of Future Beach Loss in Japan Due to Sea-level Rise and Uncertainties in Projected Beach Loss. Coast. Eng. J. 2017, 59, 1740006. [Google Scholar] [CrossRef]
- Dean, R.G. Equilibrium beach Profiles: Characteristics and applications. J. Coast. Res. 1991, 7, 53–84. [Google Scholar]
- Bruun, P. Sea-level rise as a cause of shore erosion. J. Waterw. Habors Div. 1962, 88, 117–132. [Google Scholar]
- Hallermeier, R.J. A profile zonation for seasonal sand beach from wave climate. Coast. Eng. 1981, 4, 253–277. [Google Scholar] [CrossRef]
- Takeda, I.; Sunamura, T. Formation and spacing of beach cusps. Coast. Eng. 1983, 26, 121–135. (In Japanese) [Google Scholar] [CrossRef]
- Sunamura, T. Coastal and beach changes by waves. Transactions. Jpn. Geomorphol. Union 1983, 4, 179–188. (In Japanese) [Google Scholar]
- Department of Coastal and Marine Resources Staff. Thailand’s Coastal Erosion: Circumstances and Management; Department of Coastal and Marine Publication: Prathumthani, Thailand, 2014; pp. 100–188. ISBN 978-616-91902-3-3. (In Thai) [Google Scholar]
- Pupattanapong, C. Restored Pattaya Beach Lures Tourists. Available online: https://www.bangkokpost.com/travel/1516086/restored-pattaya-beach-lures-tourists#cxrecs_s (accessed on 25 March 2020).
- Spodar, A.; Héquette, A.; Ruz, M.; Cartier, A.; Grégoire, P.; Sipka, V.; Forain, N. Evolution of a beach nourishment project using dredged sand from navigation channel, Dunkirk, northern France. J. Coast. Conserv. 2018, 22, 457–474. [Google Scholar] [CrossRef]
- Silveira, T.M.; Frazão Santos, C.; Andrade, F. Beneficial use of dredged sand for beach nourishment and coastal landform enhancement—The case study of Tróia, Portugal. J. Coast. Conserv. 2013, 17, 825–832. [Google Scholar] [CrossRef]
- Chaiwongsaen, N.; Nimnate, P.; Choowong, M. Morphological Changes of the Lower Ping and Chao Phraya Rivers, North and Central Thailand: Flood and Coastal Equilibrium Analyses. Open Geosci. 2019, 11, 152–171. [Google Scholar] [CrossRef]
- Budget Bureau. Annual Budget Document No. 3—Expenditure Budget for Annual Budget Year 2020 Volume 5: Ministry of Transportation and Communications, Ministry of Digital Economy and Society; Budget Bureau: Bangkok, Thailand, 2019. (In Thai) [Google Scholar]
- Budget Bureau. Annual Budget Document No. 3—Expenditure Budget for Annual Budget Year 2020 Volume 6: Ministry of Natural Resources and Environment; Budget Bureau: Bangkok, Thailand, 2019. (In Thai) [Google Scholar]
- Budget Bureau. Annual Budget Document No. 3—Expenditure Budget for Annual Budget Year 2020 Volume 8: Ministry Interior; Budget Bureau: Bangkok, Thailand, 2019. (In Thai) [Google Scholar]
- Cooper, J.A.G.; Pilkey, O.H. Sea-level rise and shoreline retreat: Time to abandon the Bruun Rule. Glob. Planet. Chang. 2004, 43, 157–171. [Google Scholar] [CrossRef]
- Udo, K.; Ranasinghe, R.; Takeda, Y. An assessment of measured and computed depth of closure around Japan. Sci. Rep. 2020, 10, 2987. [Google Scholar] [CrossRef]
- Dean, R.G.; Houston, J.R. Determining shoreline response to sea level rise. Coast. Eng. 2016, 114, 1–8. [Google Scholar] [CrossRef]
- Saramul, S.; Ezer, T. Spatial variations of sea level along the coast of Thailand: Impacts of extreme land subsidence, earthquakes and the seasonal monsoon. Glob. Planet. Chang. 2014, 122, 70–81. [Google Scholar] [CrossRef]
- Jin, D.; Hoagland, P.; Au, D.K.; Qiu, J. Shoreline change, seawalls, and coastal property values. Ocean Coast. Manag. 2015, 114, 185–193. [Google Scholar] [CrossRef]
- Saengsupavanich, C. Willingness to restore jetty-created erosion at a famous tourism beach. Ocean Coast. Manag. 2018, 178, 104817. [Google Scholar] [CrossRef]


© 2020 by the authors. Licensee MDPI, Basel, Switzerland. This article is an open access article distributed under the terms and conditions of the Creative Commons Attribution (CC BY) license (http://creativecommons.org/licenses/by/4.0/).
Share and Cite
Somphong, C.; Udo, K.; Ritphring, S.; Shirakawa, H. Beach Nourishment as an Adaptation to Future Sandy Beach Loss Owing to Sea-Level Rise in Thailand. J. Mar. Sci. Eng. 2020, 8, 659. https://doi.org/10.3390/jmse8090659
Somphong C, Udo K, Ritphring S, Shirakawa H. Beach Nourishment as an Adaptation to Future Sandy Beach Loss Owing to Sea-Level Rise in Thailand. Journal of Marine Science and Engineering. 2020; 8(9):659. https://doi.org/10.3390/jmse8090659
Chicago/Turabian StyleSomphong, Chatuphorn, Keiko Udo, Sompratana Ritphring, and Hiroaki Shirakawa. 2020. "Beach Nourishment as an Adaptation to Future Sandy Beach Loss Owing to Sea-Level Rise in Thailand" Journal of Marine Science and Engineering 8, no. 9: 659. https://doi.org/10.3390/jmse8090659
APA StyleSomphong, C., Udo, K., Ritphring, S., & Shirakawa, H. (2020). Beach Nourishment as an Adaptation to Future Sandy Beach Loss Owing to Sea-Level Rise in Thailand. Journal of Marine Science and Engineering, 8(9), 659. https://doi.org/10.3390/jmse8090659