Phytoplankton Distribution in Mar Menor Coastal Lagoon (SE Spain) during 2017
by
 ,
,
Juan Soria
1,* ,
,
Gema Caniego
1, 
Nuria Hernández-Sáez
1,
Jose Antonio Dominguez-Gomez
2 and
Manuel Erena
2
1
Cavanilles Institute of Biodiversity and Evolutionary Biology, University of Valencia, 46980 Paterna, Spain
2
GIS and Remote Sensing, Instituto Murciano de Investigación y Desarrollo Agrario (IMIDA), 30150 La Alberca, Murcia, Spain
*
Author to whom correspondence should be addressed.
J. Mar. Sci. Eng. 2020, 8(8), 600; https://doi.org/10.3390/jmse8080600
Submission received: 20 May 2020
/
Revised: 18 July 2020
/
Accepted: 6 August 2020
/
Published: 12 August 2020
(This article belongs to the Special Issue Long-term Phytoplankton Dynamics in Ecosystem)
Abstract
:The Mar Menor is a Spanish coastal lagoon of great ecological and economic interest. The agricultural and tourist activities developed in the surroundings of the lagoon, together with the modifications in its channels of connection with the Mediterranean Sea, have notably affected the quality of its waters, which is altering the natural balance of the ecosystem. In this work, an analysis of the density of phytoplankton present in the lagoon between the months of May to December 2017 was carried out. The results indicate a significant increase in phytoplankton density between 2500 and 67,300 cells/mL compared to previous data of 1981 (between 10 and 500 cells/mL). Concentration of Chlorophyll-a arrives to 13 µg/L and transparency of water reduces to 1.3 m according to Secchi disk depth. The presence of Chlorophyceae, Chrysophyceae, and nanoplanktonic Cryptophyceae stands out, while species diversity drops significantly. Observing the evolution of the lagoon, we can deduce that eutrophication process could increase. To avoid this, it would be necessary to implement control measures for the use of fertilizers in nearby growing areas and to study water treatment techniques to reduce nitrogen inputs so that phytoplankton densities can decrease.
1. Introduction
The Mar Menor is a coastal lagoon located in the Region of Murcia, Spain, connected to the Mediterranean Sea by five channels [1], through which there is a negative estuary-type water exchange [2]. Its salinity is higher than that of seawater, since the input of continental water does not compensate for the evaporation losses suffered by this lagoon [3].
In recent years, this coastal lagoon has undergone numerous modifications for the use of the environment for tourism purposes [4] which, together with the discharge of fertilizers that filter through surface and underground runoff [5] and the constant increase in temperatures, are altering the natural balance of the ecosystem, resulting in a notable loss of biodiversity [6]. One of the main changes that have been made is the extension of the Estacio canal for the construction of a marina [2], a modification that has brought the salinity conditions of the lagoon closer to those of the Mediterranean Sea [4].
Due to the interest, ecological [7], social, and economic, of this inland water, it is necessary to analyze the quality of its waters and the state of the ecosystem in order to know its current state, be able to predict its evolution and plan conservation strategies.
To understand the ecological status of a coastal lagoon, such as the Mar Menor, it is necessary to measure abiotic parameters, such as temperature, salinity, or dissolved oxygen, as well as biotic parameters [8]. To comprehend the influence of physicochemical parameters on the living organisms present in the lagoon, we can use the study of the variations suffered by a specific group of organisms that could be used as biomarkers, the phytoplankton. The group includes all those photosynthetic microorganisms adapted to life in suspension in the water column [9]. Being organisms sensitive to changes, with short life cycles and easy to manipulate, they are perfect as bioindicators of water quality [10] and have been used in numerous studies [11].
Phytoplankton undergoes seasonal changes due to the usual variations in weather conditions [12,13]. These changes are part of the natural dynamics of the ecosystem. However, the global increase in average annual temperatures and the anthropogenic modification of the channels [2] and the environment can affect the usual parameters of water temperature, dissolved oxygen, or salinity, among others, which can affect its distribution in the water column [14].
The spatial distribution of phytoplankton also depends on the distribution of dissolved nutrients that can be found in the water column [15], with the presence of dissolved nitrogen and phosphorus in the water being especially important for their proliferation [16]. Many studies have shown that the presence of dissolved nitrogen and nitrogen products in large quantities favors the proliferation of algae [17], both macroscopic and microscopic, as is the case with phytoplankton.
With regard to the accumulation of these nutrients, in 2001, the Government of the Region of Murcia declared the Mar Menor as a “sensitive area to eutrophication” according to Directive 91/271/EEC [18] due to the increase in agricultural activity in the whole area known as the Campo de Cartagena. This increase was produced from the construction of the Tagus-Segura transfer [19] and has favored the filtration of irrigation water with a high content of fertilizers and phytosanitary products into the aquifer located below the Campo de Cartagena area and which, through underground runoff, makes the greatest contribution of fresh water to the lagoon. This type of product also contributes a high content of nitrogen and phosphorus through surface runoff [20]. This is the reason why the Mar Menor lagoon was declared a “vulnerable area to pollution by nitrates from agricultural sources” on the basis of Directive 91/676/EEC in 2002 [21].
The amount of nutrients and particles entering the Mar Menor lagoon in the period from September 2002 to October 2003 were studied [22]. The total annual discharge of nutrients into the lagoon was estimated at 27.4 hm3 /year, of which 73.5% passed through Rambla del Albujón gully. In addition, for that period, the total input to the lagoon from the Rambla del Albujón gully and its drainage effluents was 10,142 tons/year of suspended sediments (SS), 390 tons/year of particulate organic matter (POM), 2010 tons/year of dissolved inorganic nitrogen (DIN) (93% as nitrate NO3−), and 178 tons/year of soluble reactive phosphorus (SRP).
With the increase in agricultural activity in recent years, these figures have increased and promotes in the lagoon the proliferation of phytoplankton, so that the turbidity of the water increases, and this increase prevents the penetration of sunlight to the bottom of the lagoon. When not receiving sunlight, macrophytes present at the bottom of the lagoon die, which decreases the fixation of nutrients to the substrate, and increases the suspended dead organic matter. This causes an uncontrolled increase in phytoplankton populations in the lagoon, a process known as eutrophy [23].
While some species proliferate notably, they invade the niche of others, so the process of eutrophication results in a significant loss of biodiversity. Nanoplanktonic species [24] and bacterioplankton species are often favored [25]. One of the most obvious effects of eutrophication processes is the massive proliferation (especially of dinoflagellate species) that results in the formation of algal blooms, commonly known as “red tides” [16] or “green soup”. These blooms, in addition to the ecological risks they pose, can be formed by species that can produce toxins and be harmful to the flora and fauna of the lagoon [26].
The aim of this study was to evaluate the current status of the Mar Menor lagoon, to compare the data collected with previous studies [1,27], and thus be able to draw up action plans to promote the recovery of the lagoon and try to reverse the negative effects of the anthropogenic activities that have been carried out in the lagoon and its surroundings, especially over the last fifty years.
2. Materials and Methods
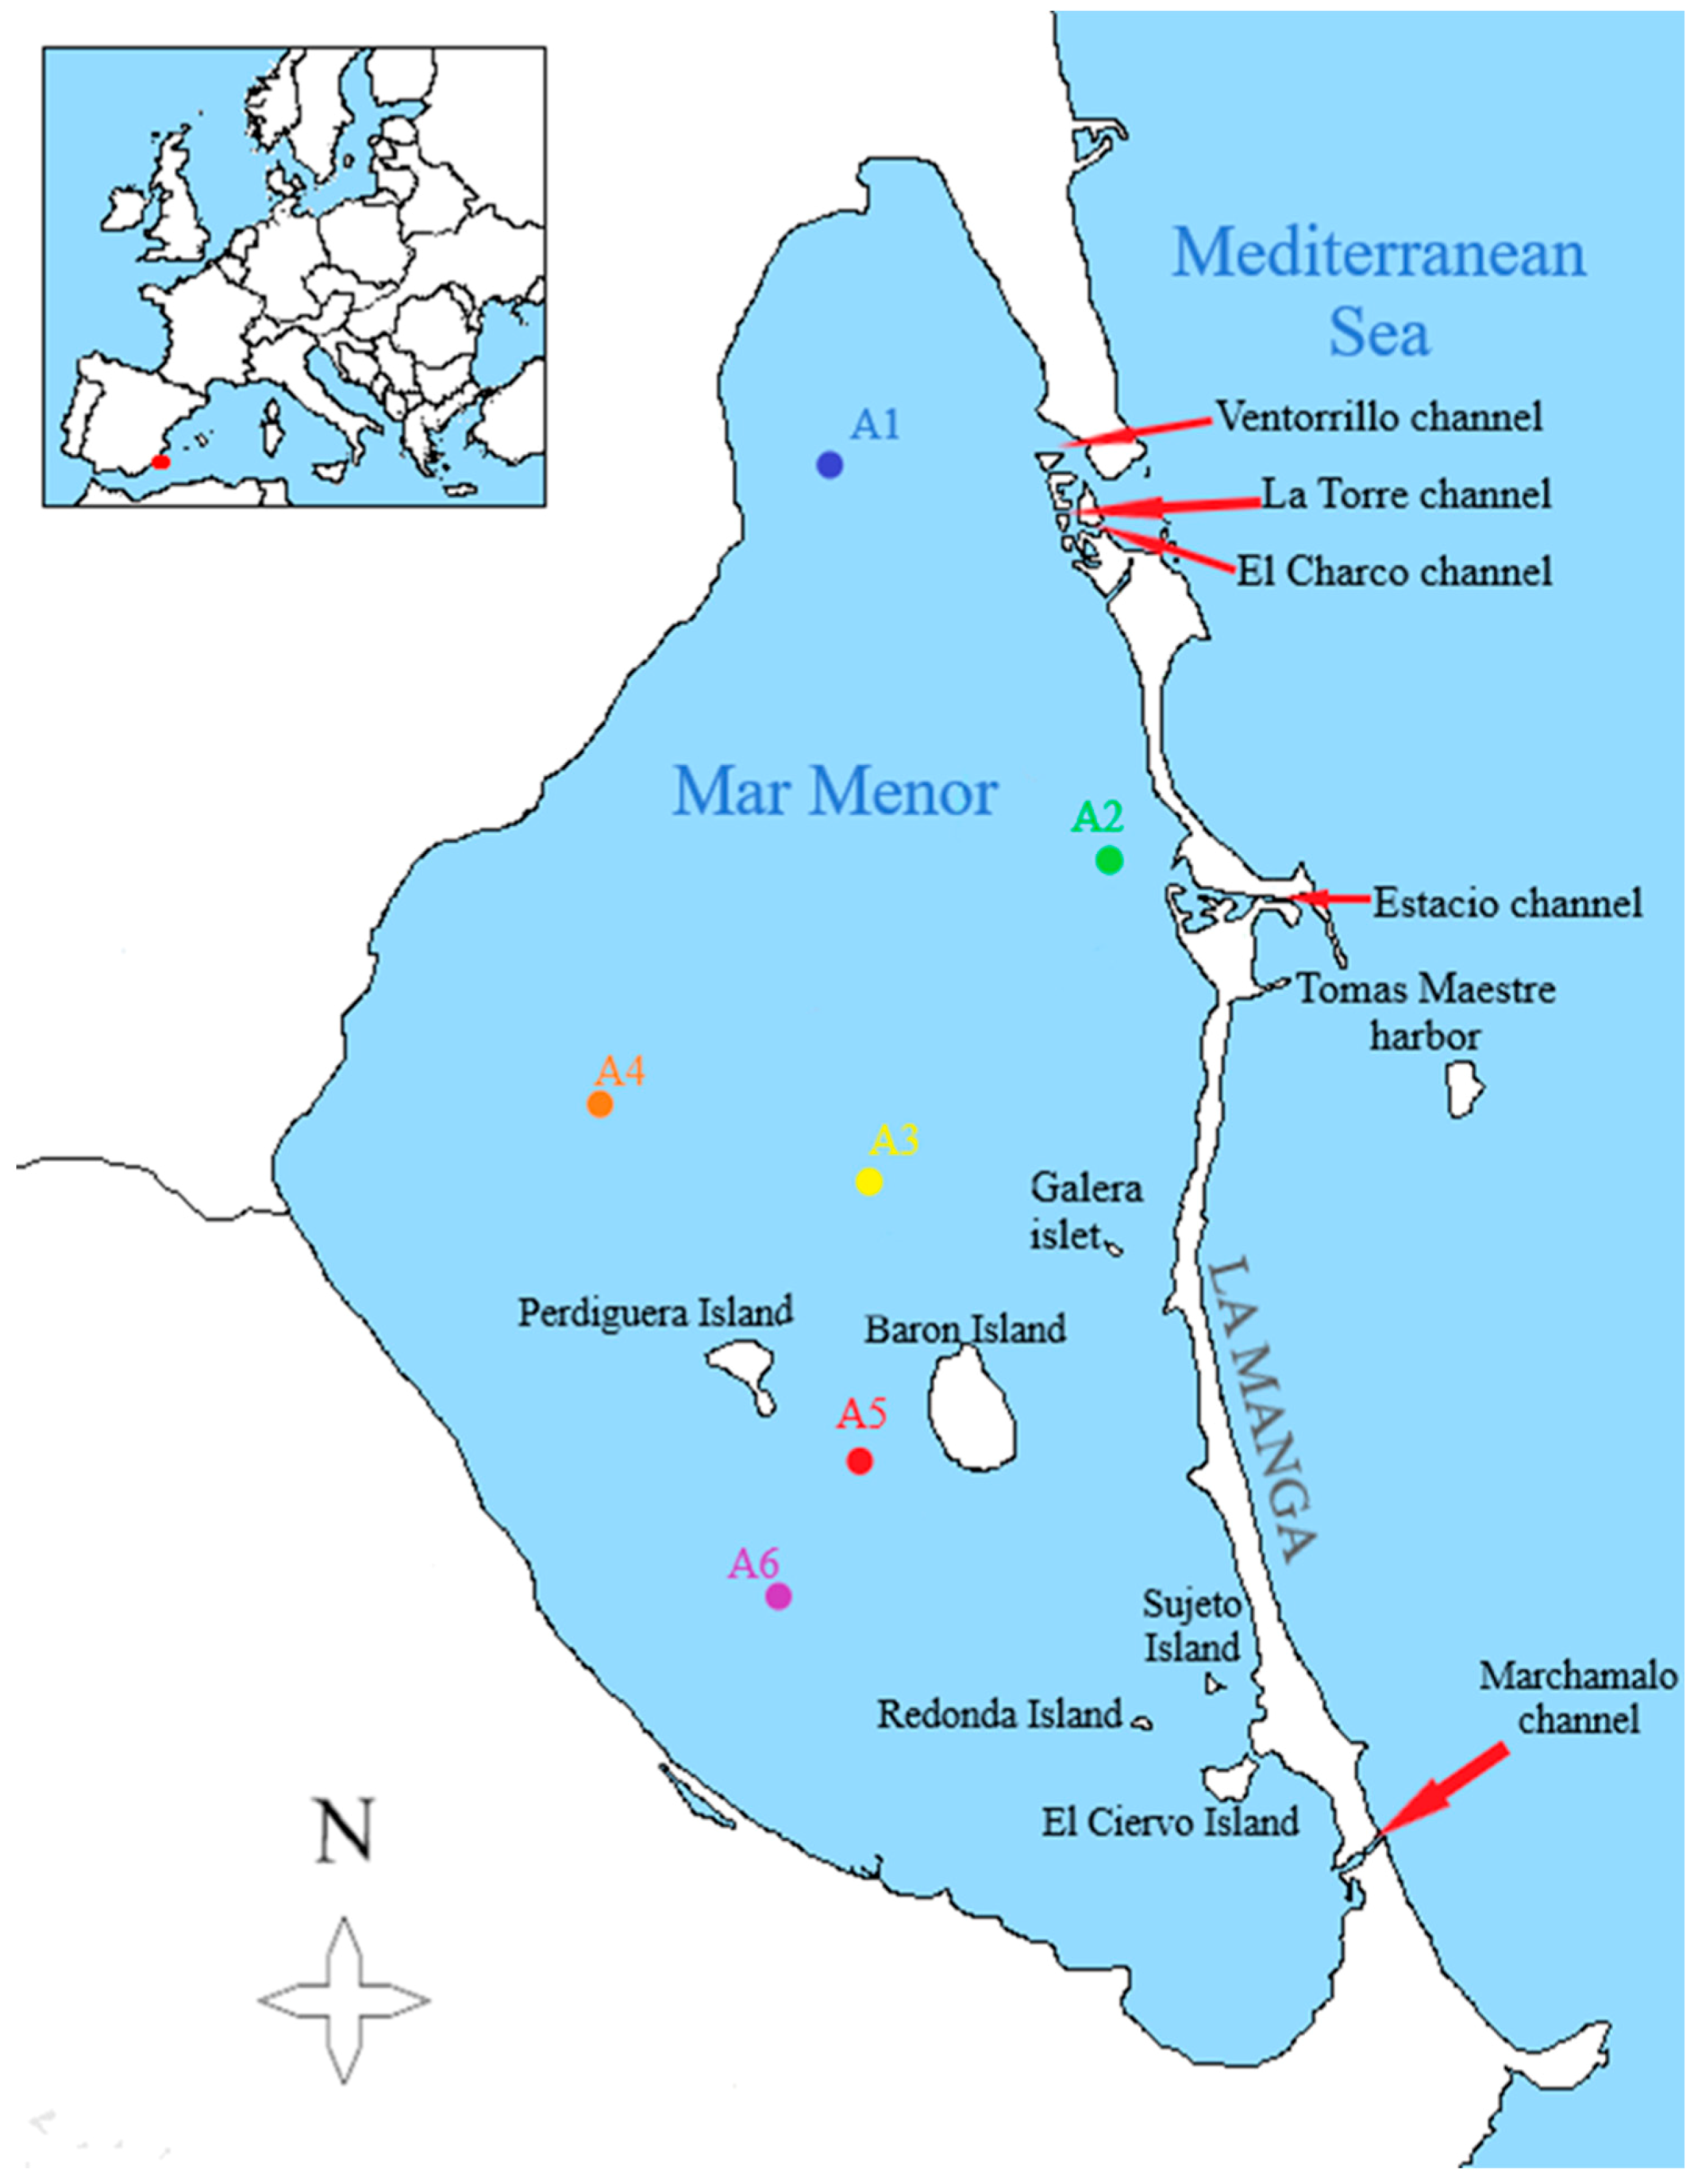
Regional Government carry out the measurement of the environmental variables weekly in some points with a multiparametric profiler conductivity-temperature-depth CTD Sea·Bird Electronics SBE-19 (Bellevue, WA, USA). Variables measured are temperature, turbidity, chlorophyll-a concentration, dissolved oxygen, and salinity. For the biological sampling, the first sampling was carried out in May 2017 and the last one in December 2017. Due to logistical problems, this samples could not be collected regularly, so we only have them for the months of May, June, September, October (the month in which two samples were taken), and December. During the months of July, August, and November, there was no available boat to carry out the samplings. All the sampling started from the Tomás Maestre harbor in La Manga in the morning, and each sampling station was marked with UTM (Universal Transversal de Mercator) coordinates. These points are represented in the following map (Figure 1).
Temperature and depth are measured “in situ” at each sampling point with the Turner C3 TD Temperature Deep fluorometer (San Jose, CA, USA) which also contains chlorophyll and phycocyanin fluorimeters (measured in µg/L) and a turbidity meter (measured as Formacine Turbidity Units, FTU). These measurements were taken by manually submerging the device, so that measurements are taken every four seconds to produce a vertical profile of each of the variables to be measured. The transparency is measured using the Secchi disc depth (30 cm diameter).
The spatial distribution of chlorophyll-a concentration (Chl-a) in the lagoon and its relationship to phytoplankton density has been studied by the Ocean and Land Color Instrument (OLCI) images. The OLCI sensor is installed at Sentinel-3 satellite (European Space Agency, Paris, France). The Chl-a maps have been obtained by means of the Sentinel Application Platform (SNAP, Brockmann Consult, Germany) and the optical processing by means of the Sentinel-3 Toolbox using the Case-2 Regional Coast Colour (C2RCC) algorithm for OLCI sensor.
Composition and abundance phytoplankton have been studied through water samples that were collected at a depth of about 4 m using a 2.5 L Ruttner hydrographic bottle. This depth was selected because this point was the maximum of chlorophyll-a measured with fluorometer in situ. Samples was used to fill, at each sampling point, a 250 mL topaz glass bottle, fixing the sample with Lugol at 5% in a ratio of 1:100 with a Pasteur pipette for post-analysis in the laboratory.
The analysis of phytoplankton is carried out using inverted microscope for samples collected by hydrographic bottle (phytoplankton count) and the Utermöhl method collected as indicated by European Committee for Standardization—Technical Committee in CEN TC 230/WG 2/TG 3/N83 [28] has been followed.
For counting, 50 mL of the sample bottles fixed with Lugol were homogenized and poured into one of the chambers with a sedimentation column. This sample is left to settle for approximately 24 h to allow the algae to settle at the bottom of the chamber. Then, the column with the supernatant of the sample is removed laterally, leaving in the chamber the phytoplankton content of 50 mL of sample concentrated in a few milliliters. This facilitates counting in samples with low organism density [29]. If the sample contains a high density, it will measure a specific volume of sample (slightly less than the capacity of the chamber), and it is fulfilled with distilled water [30] and allowed to settle.
An inverted Nikon Eclipse Ti-U microscope (Nikon Corp., Tokyo, Japan) with 10× eyepieces is used to observe and count the sample, one of which includes an ocular micrometer [30]. Most observations were made using the 60× objective, although some were made with the 40× and 20× objectives perfectly calibrated. For more detailed observations, the camera attached to the microscope in clear field or the Nomarski differential contrast (Figure 2) was used to identify specimens.
Numerous guides and web resources [31,32,33,34,35,36,37,38,39,40,41,42] were used to identify the species. The count of organisms was carried out until we had a representative percentage of specimens for each preparation in order to reduce as much as possible the standard deviation of the obtained data. With a few exceptions, a minimum of 100 fields per camera were counted to obtain the most reliable cell density per milliliter (cel./mL) [30].
Statistical analysis of the data was performed using PAleontological STatistics (PAST, University of Oslo, Oslo, Norway)) version 3.25 [43]. A descriptive analysis of the data was carried out to obtain the total of algae per sample, minimum and maximum density values, mean and standard deviation of the taxa found. We also calculated the species richness (S) of each sample, the diversity according to the Shannon-Weaver index (H′) and the equitability (J) in the presence of each species [44,45]. In order to be able to compare between samples the diversity value according to the Shannon-Weaver index (H′), the program calculates the maximum diversity value by making the logarithm of the richness (S) of each sample. From these values, the value of the equitability (J) is obtained, which oscillates between 0 to 1 (or between 0% and 100%), where 1 indicates that all the species are in the same proportion in the sample [46].
From the obtained data, the distribution of phytoplankton by samples and classes is presented by means of maps, where, in each sampling point, circular graphs were included to show the density and proportion in which each class of phytoplankton is found in the different places. On the phytoplankton density matrix, a Principal Component Analysis (PCA) was performed. First, the data were standardized by transforming them with neperian logarithmic, eliminating those species or taxa of phytoplankton that were found only in one sample and with a density below 3 cells/mL. From the correlation matrix, a clustering was made by the unweighted pair group method with arithmetic mean (UPGMA) method.
3. Results
3.1. Changes in Environmental Variables
The irrigated agricultural area has increased considerably since 1981 (when the first studies were carried out [1]) until today. According to data of Regional Agriculture Statistic, the irrigated agricultural area in Campo de Cartagena increased from 24,357 ha in 1981, to 37,296 ha in 2003, and in 2017 to 47,431 ha.
As regards nutrient concentrations, the 2003 studies show that the results in the waters of the two main gullies (Albujón and Alcázares) were between 10 and 55 mg/L for nitrate, while those for total phosphorus (TP) were between 2 and 12 µg/L [27]. Today, values for 2017 were 170 to 240 mg/L for nitrate and, for TP, between 6–10 µg/L.
Weekly variation data for central sampling point (A3 site, Figure 1) has been obtained for the five environmental variables considered in the continuous sampling during the year 2017, the result of which is shown in Figure 3. It should be noted that the dissolved oxygen values presented the lowest values from the beginning of August to mid-September, with an average value of 4.6 mg/L, and the highest values during January and February with an average of 7.9 mg/L, also coinciding with the maximum values of chlorophyll-a, which, on 12th January, was 37.8 µg/L and presented a downward trend until reaching 5.1 µg/L on 8th March; from mid-May to the end of August, the average value was 1.5 µg/L; between September and October, the average was 5.0 µg/L and was falling to values close to 2 µg/L at the end of the year. Turbidity has followed a similar pattern to chlorophyll-a, with a minimum of 1.2 FTU in June and a maximum of 6.5 FTU in September. Finally, salinity has followed an upward trend, from average minimum in March, with 40.4 PSU (Practical Salinity Units), to maximum in October–November, with an average value of 44.6 PSU.
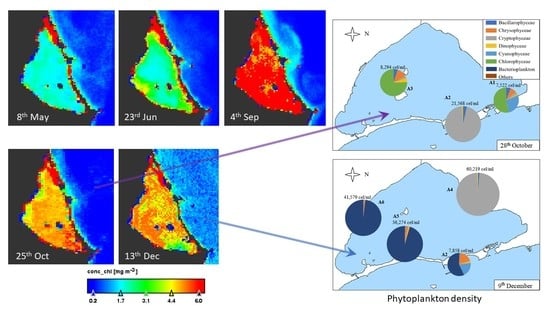
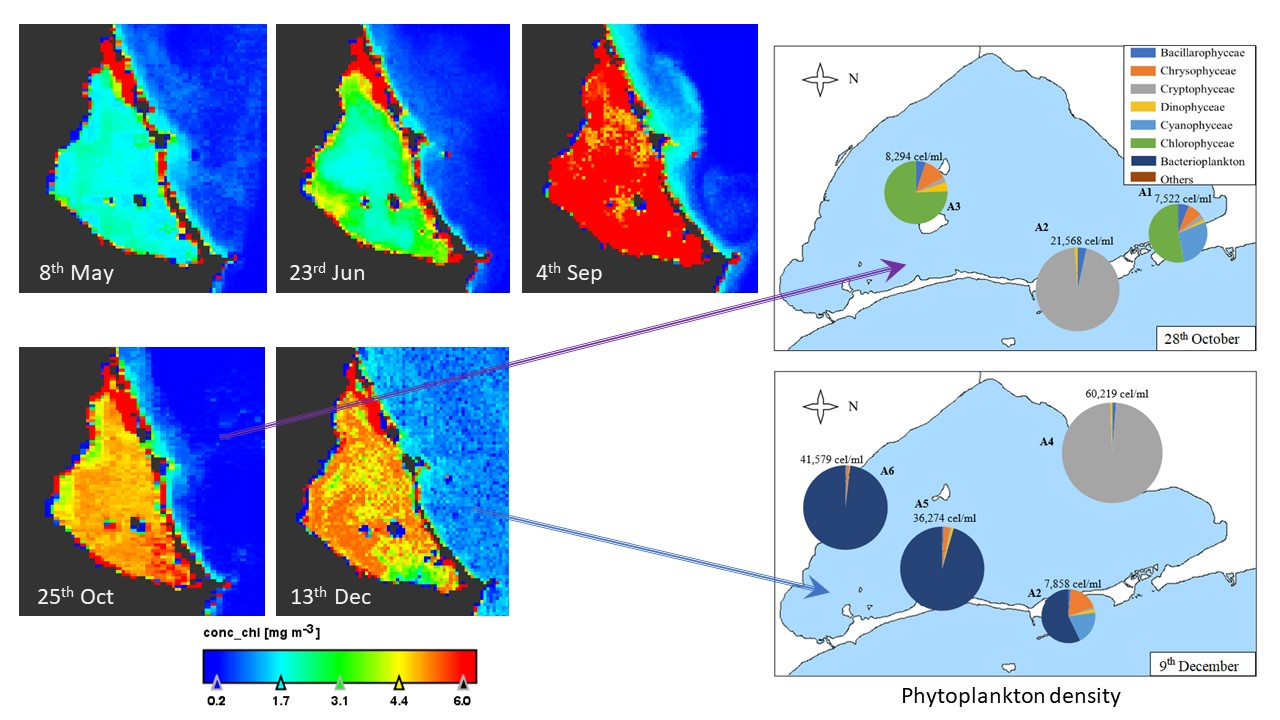
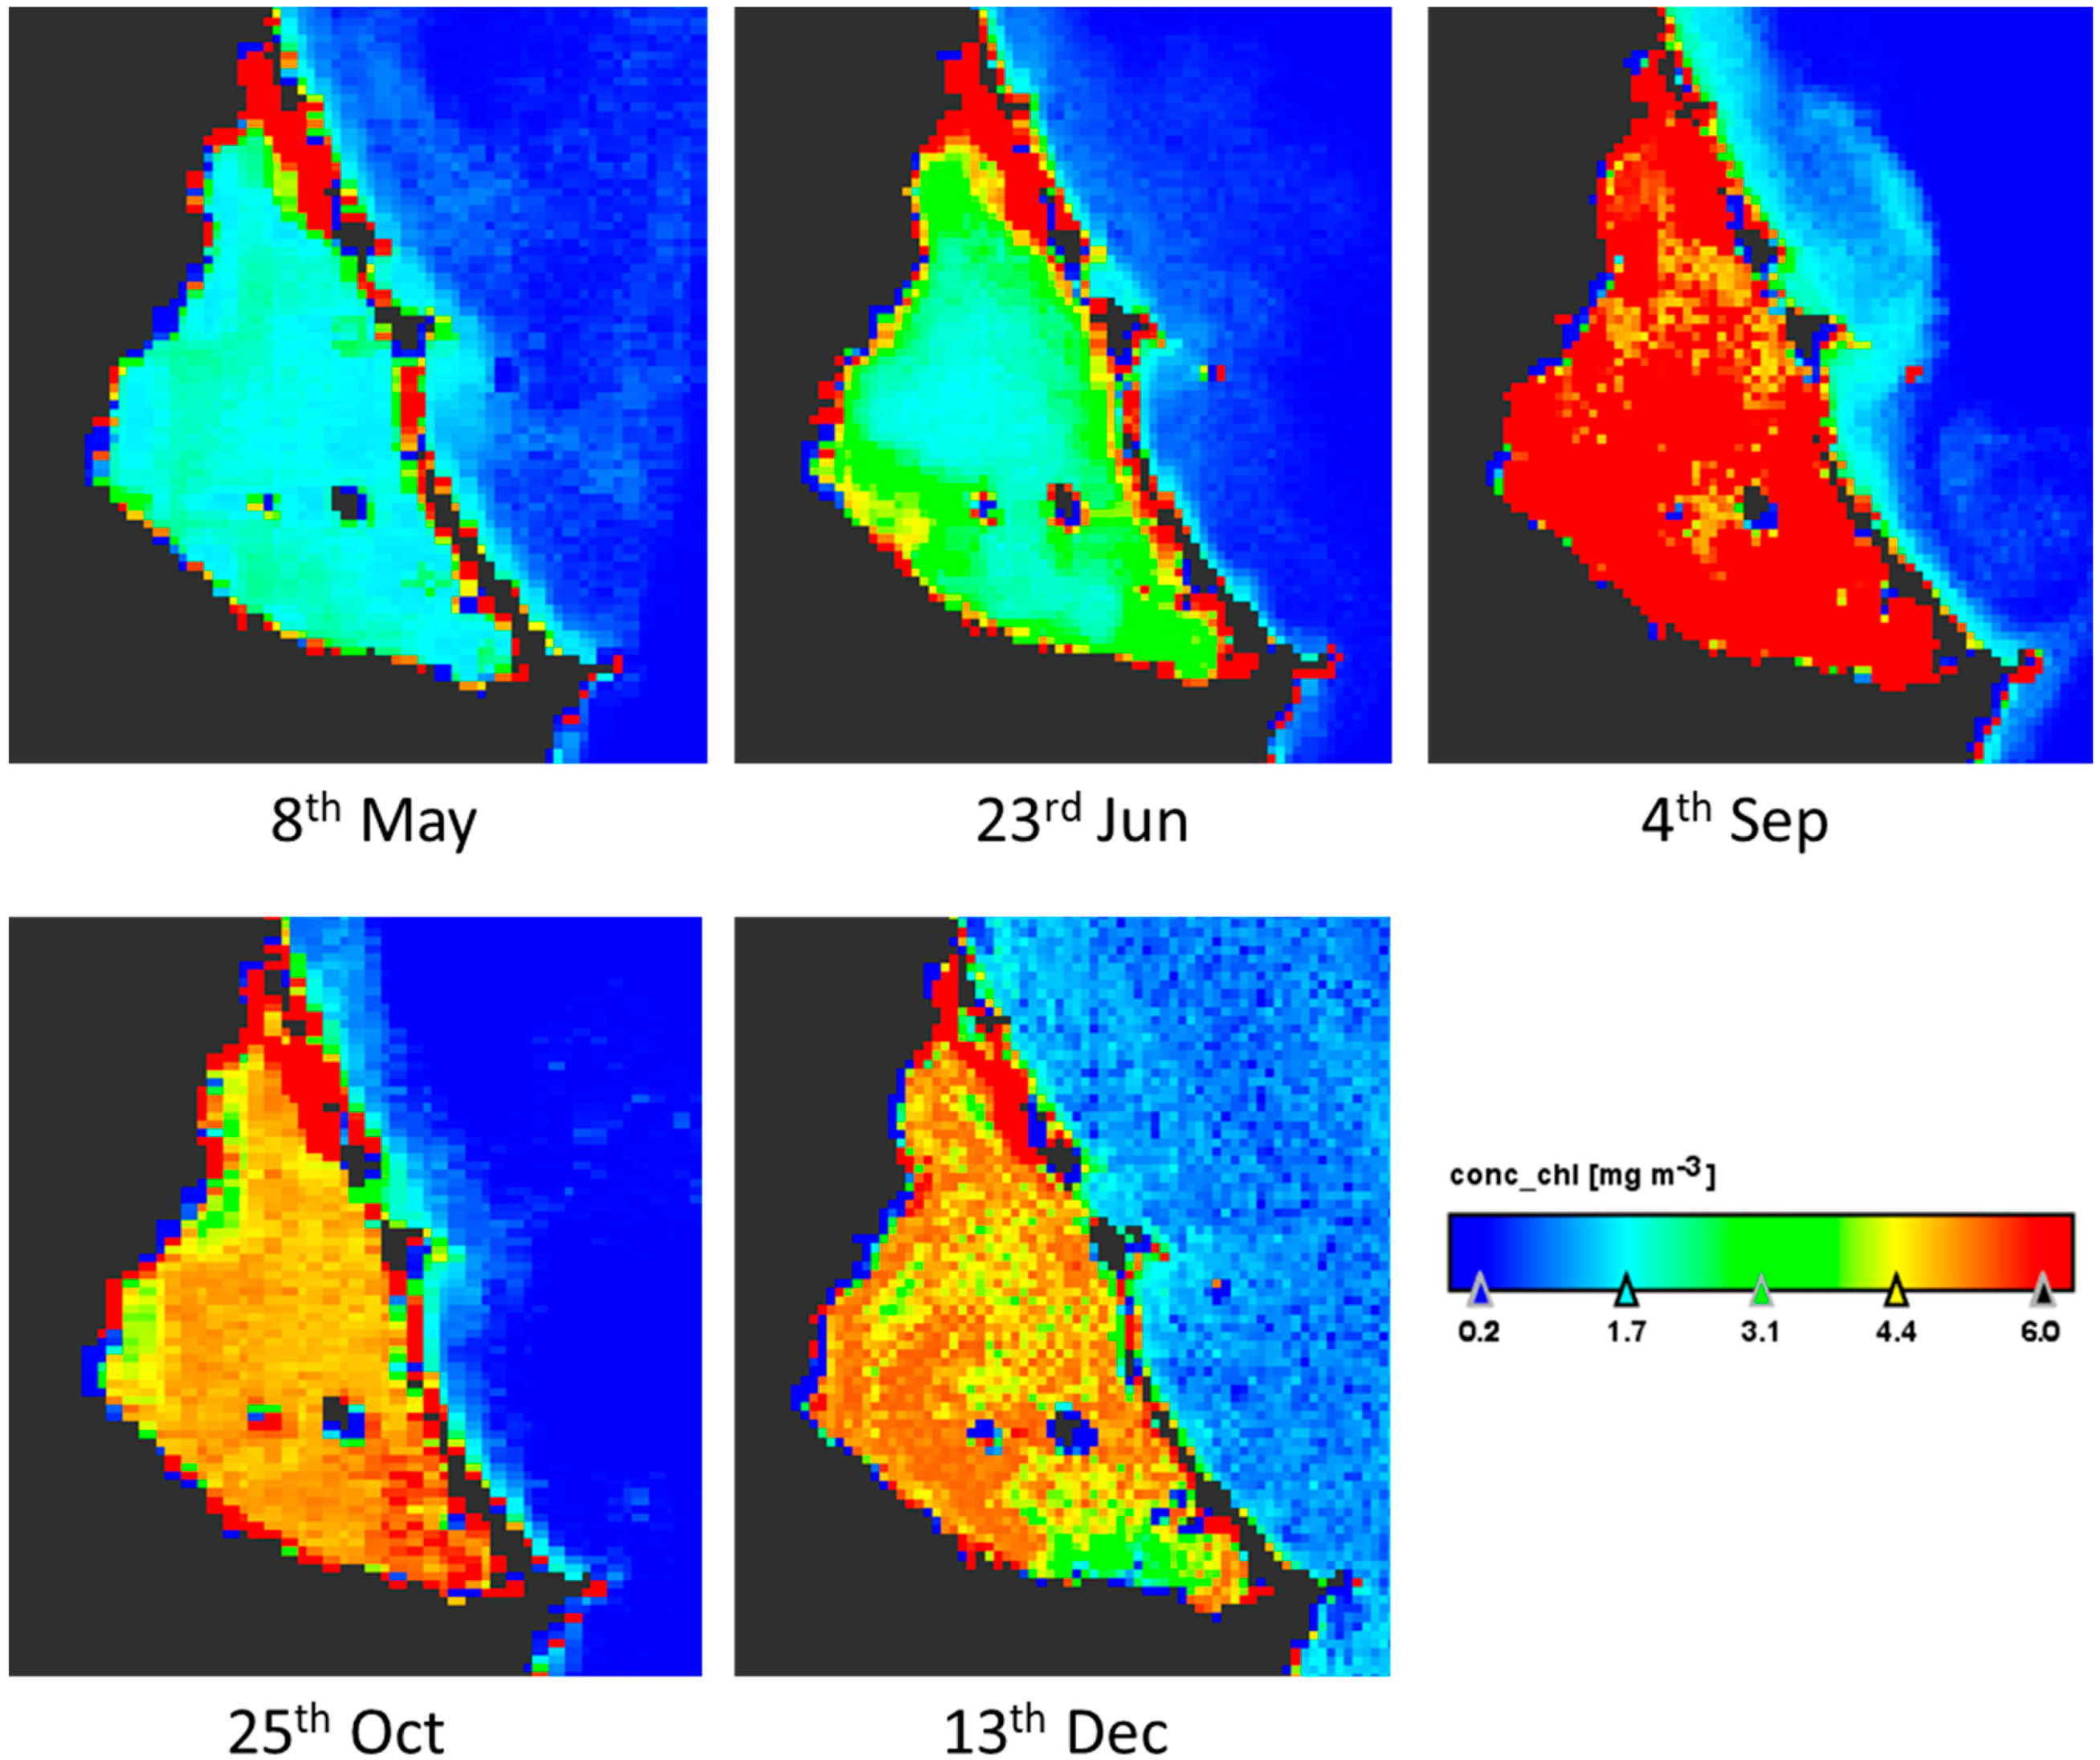
Sentinel-3 satellite OLCI images for five dates up to four days near to the field works were downloaded and processed. Results are according to the data measured in situ at A3 site sampling during the year (Figure 3). The maximum values in the lagoon are in September and the minimum between May and June (Figure 4). There is a bottom effect in the margins of the lagoon because the low depth and the vision by satellite of the subaquatic vegetation appearing some pixels in red color. The concentration of chlorophyll-a is homogeneous throughout the lagoon in the five images studied, with variations of 2 µg/L. On the west coast there are always lower values. The image also shows that the Mediterranean Sea always presents low values, between zero and one, and a distribution on the near coast linked to the water currents.
From the data of each sample of phytoplankton (see Supplementary Materials), we obtained their densities, and a descriptive analysis was made by date and by sample (Table 1). In addition, the indices of species richness (S), diversity (H′), and equitability (J) were included.
It is observed that the highest density of 67,335 cells per milliliter is reached in the sample A1 of 1st September (where 13.0 µg/L Chl-a was registered), both in total density and in its maximum density with 65,634 in one taxa. In the samples collected on 9th December in A4 and A6 (60,219 cell/mL and 41,579 cells/mL, respectively, with Chl-a values of 6.1 µg/L and 5.2 µg/L) high densities were also observed with very high maximums and a strong standard deviation, indicating notable differences between densities of some species and others. On the other side, we found the lowest densities in the months prior to summer, in the samples collected on 8th May in A5 and A6 (with Chl-a values of 1.2 µg/L and 2.2 µg/L) and on 25th June in A4 (Chl-a 0.1 µg/L). However, chlorophyll-a values from studies conducted in 1981 [1] ranged from 0.3 to 0.9 µg/L.
Regarding the study of taxa, in sample A1 of 1st September, we also found the greatest richness (39 taxa) and the lowest richness was found in sample A4 of December (with 14 taxa). The diversity index (H′) is below the usual (between 2–3) in most samples [46], with the A6 sample of 8th May having the maximum value of 1.87, and the samplings of December in the same point having a lower diversity of 0.12. Finally, if we look at the equitability index (J), the trend of the diversity index (H′) confirms us: most of the samples are below the percentage of normal equitability (between 50–75%), the greatest equitability is found in the A2 sample of 1st September (57%), and the lowest percentages are found in the samples collected in December (4% in A6, 9% in A4 and A5).
3.2. Geographical Distribution of Taxa
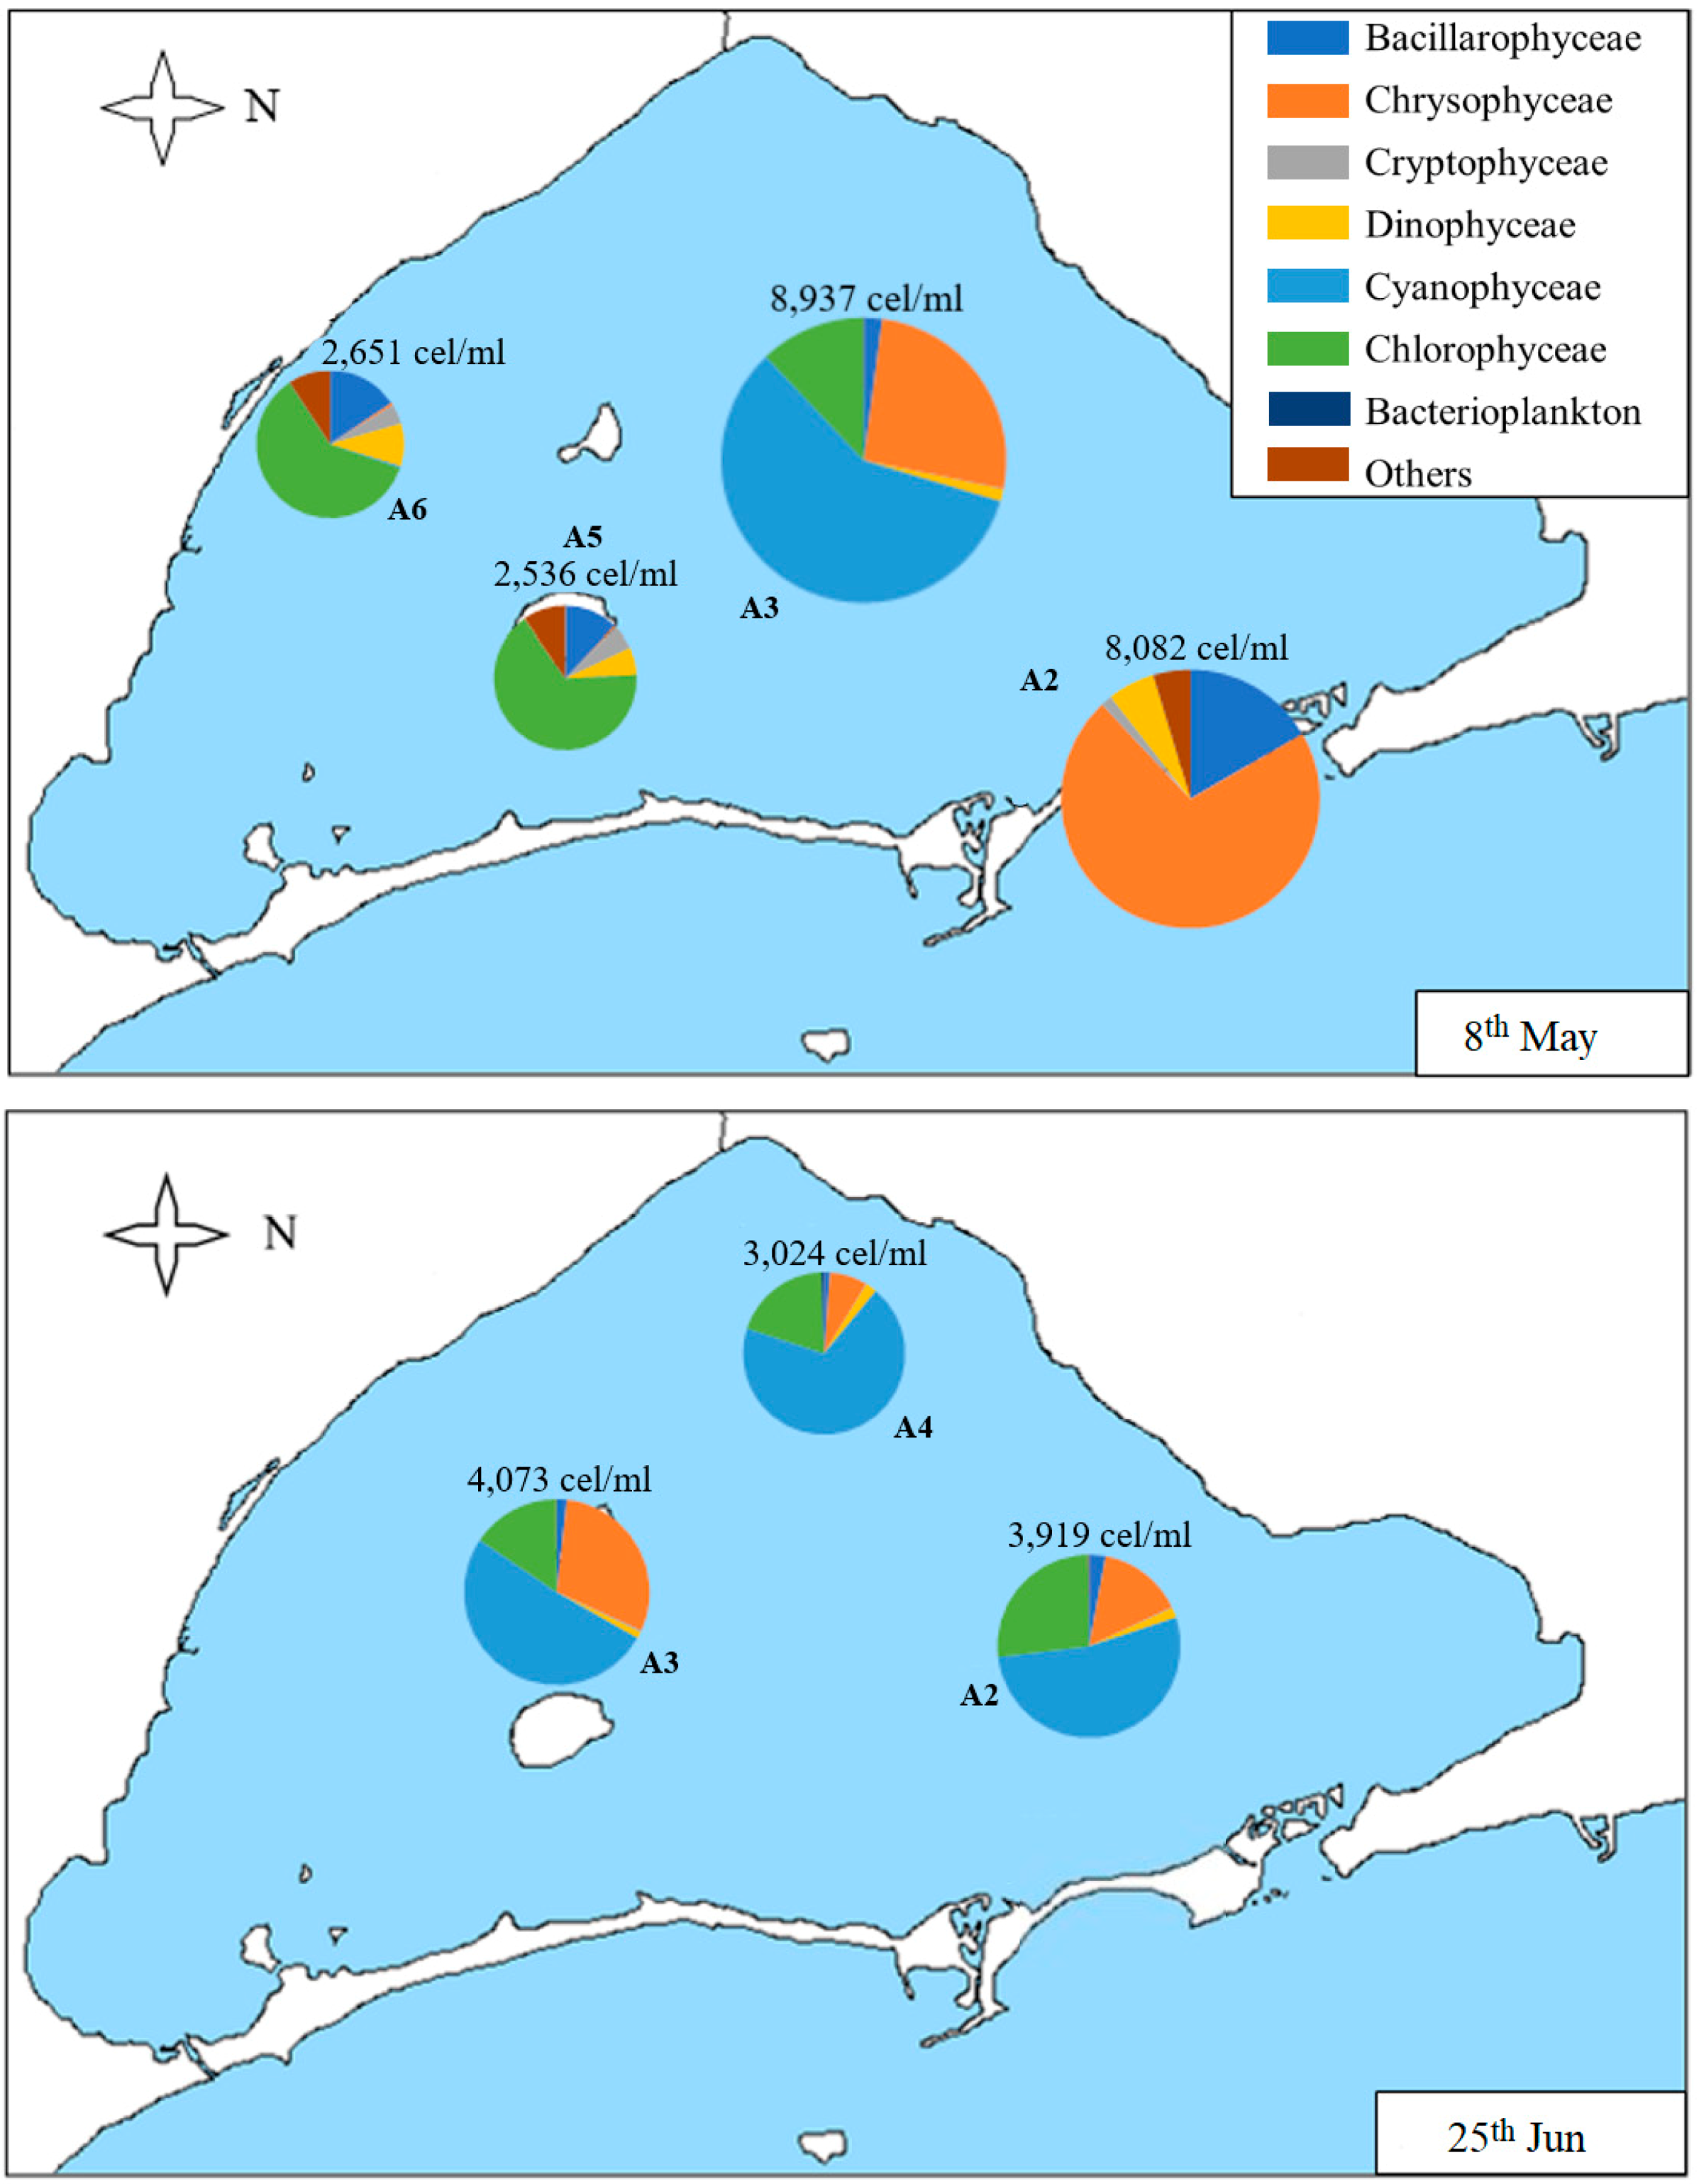
In order to show the distribution of the different classes of phytoplankton within the samples, Figure 5, Figure 6 and Figure 7 represent the distribution of algae located at the sampling point corresponding to each sample studied. In the first sample corresponding to 8th May (Figure 5), the densities of samples A2 and A3 are similar (more than 8000 cells/mL) between them. However, Chrysophyceae are predominant in the first sample (A2), followed by diatoms and dinoflagellates (being the nanoplanktonic Chrysophyceae, Cyclotella glomerata, and Katodinium fungiforme, the most abundant taxa in each class, respectively), while, in A3, there is a higher density of Cyanophyceae, followed by Chrysophyceae and Cryptophyceae (with Synechococcus sp., nanoplanktonic Chrysophyceae, and Plagioselmis lacustris as the most abundant taxa of each class). The densities of A5 and A6 samples are similar, both in density (more than 2000 cells/mL) and in composition. The most abundant classes are Chlorophyceae, Bacillariophyceae, Dinophyceae, and algae belonging to other groups. The most abundant species are nanoplanktonic Chlorophyceae and Phaeocystis sp.; Cyclotella glomerata, Chaetoceros muelleri, and Nitzchia longissima in diatoms; and Katodinium fungiforme and Prorocentrum micans in dinoflagellates. Outside these groups, we can highlight Scourfieldia complanata (Pedinophyceae), which is well represented in the category “Others”.
In the sample carried out on 25th June (Figure 5), A2 is the sample with the lowest density (just over 500 cells/mL), and A3 and A4 have similar densities (3024 and 4073 cells/mL). Its composition is also very similar, with Cyanophyceae being the most abundant class, followed by Chlorophyceae and Chrisophyceae; Synechococcus sp. and nanoplanktonic Chlorophyceae are the most abundant taxa of Cyanophyceae and Chlorophyceae, while, in Chrysophyceae, the nanoplanktonic cells, Calycomonas sp. and Ollicola vangoorii, stand out. In contrast, in the A2 sample diatoms, such as Chaetoceros muelleri, Cryptophyceae, such as Plagioselmis sp. and dinoflagellates, such as Gymnodinium sp. and Prorocentrum compressum, predominate.
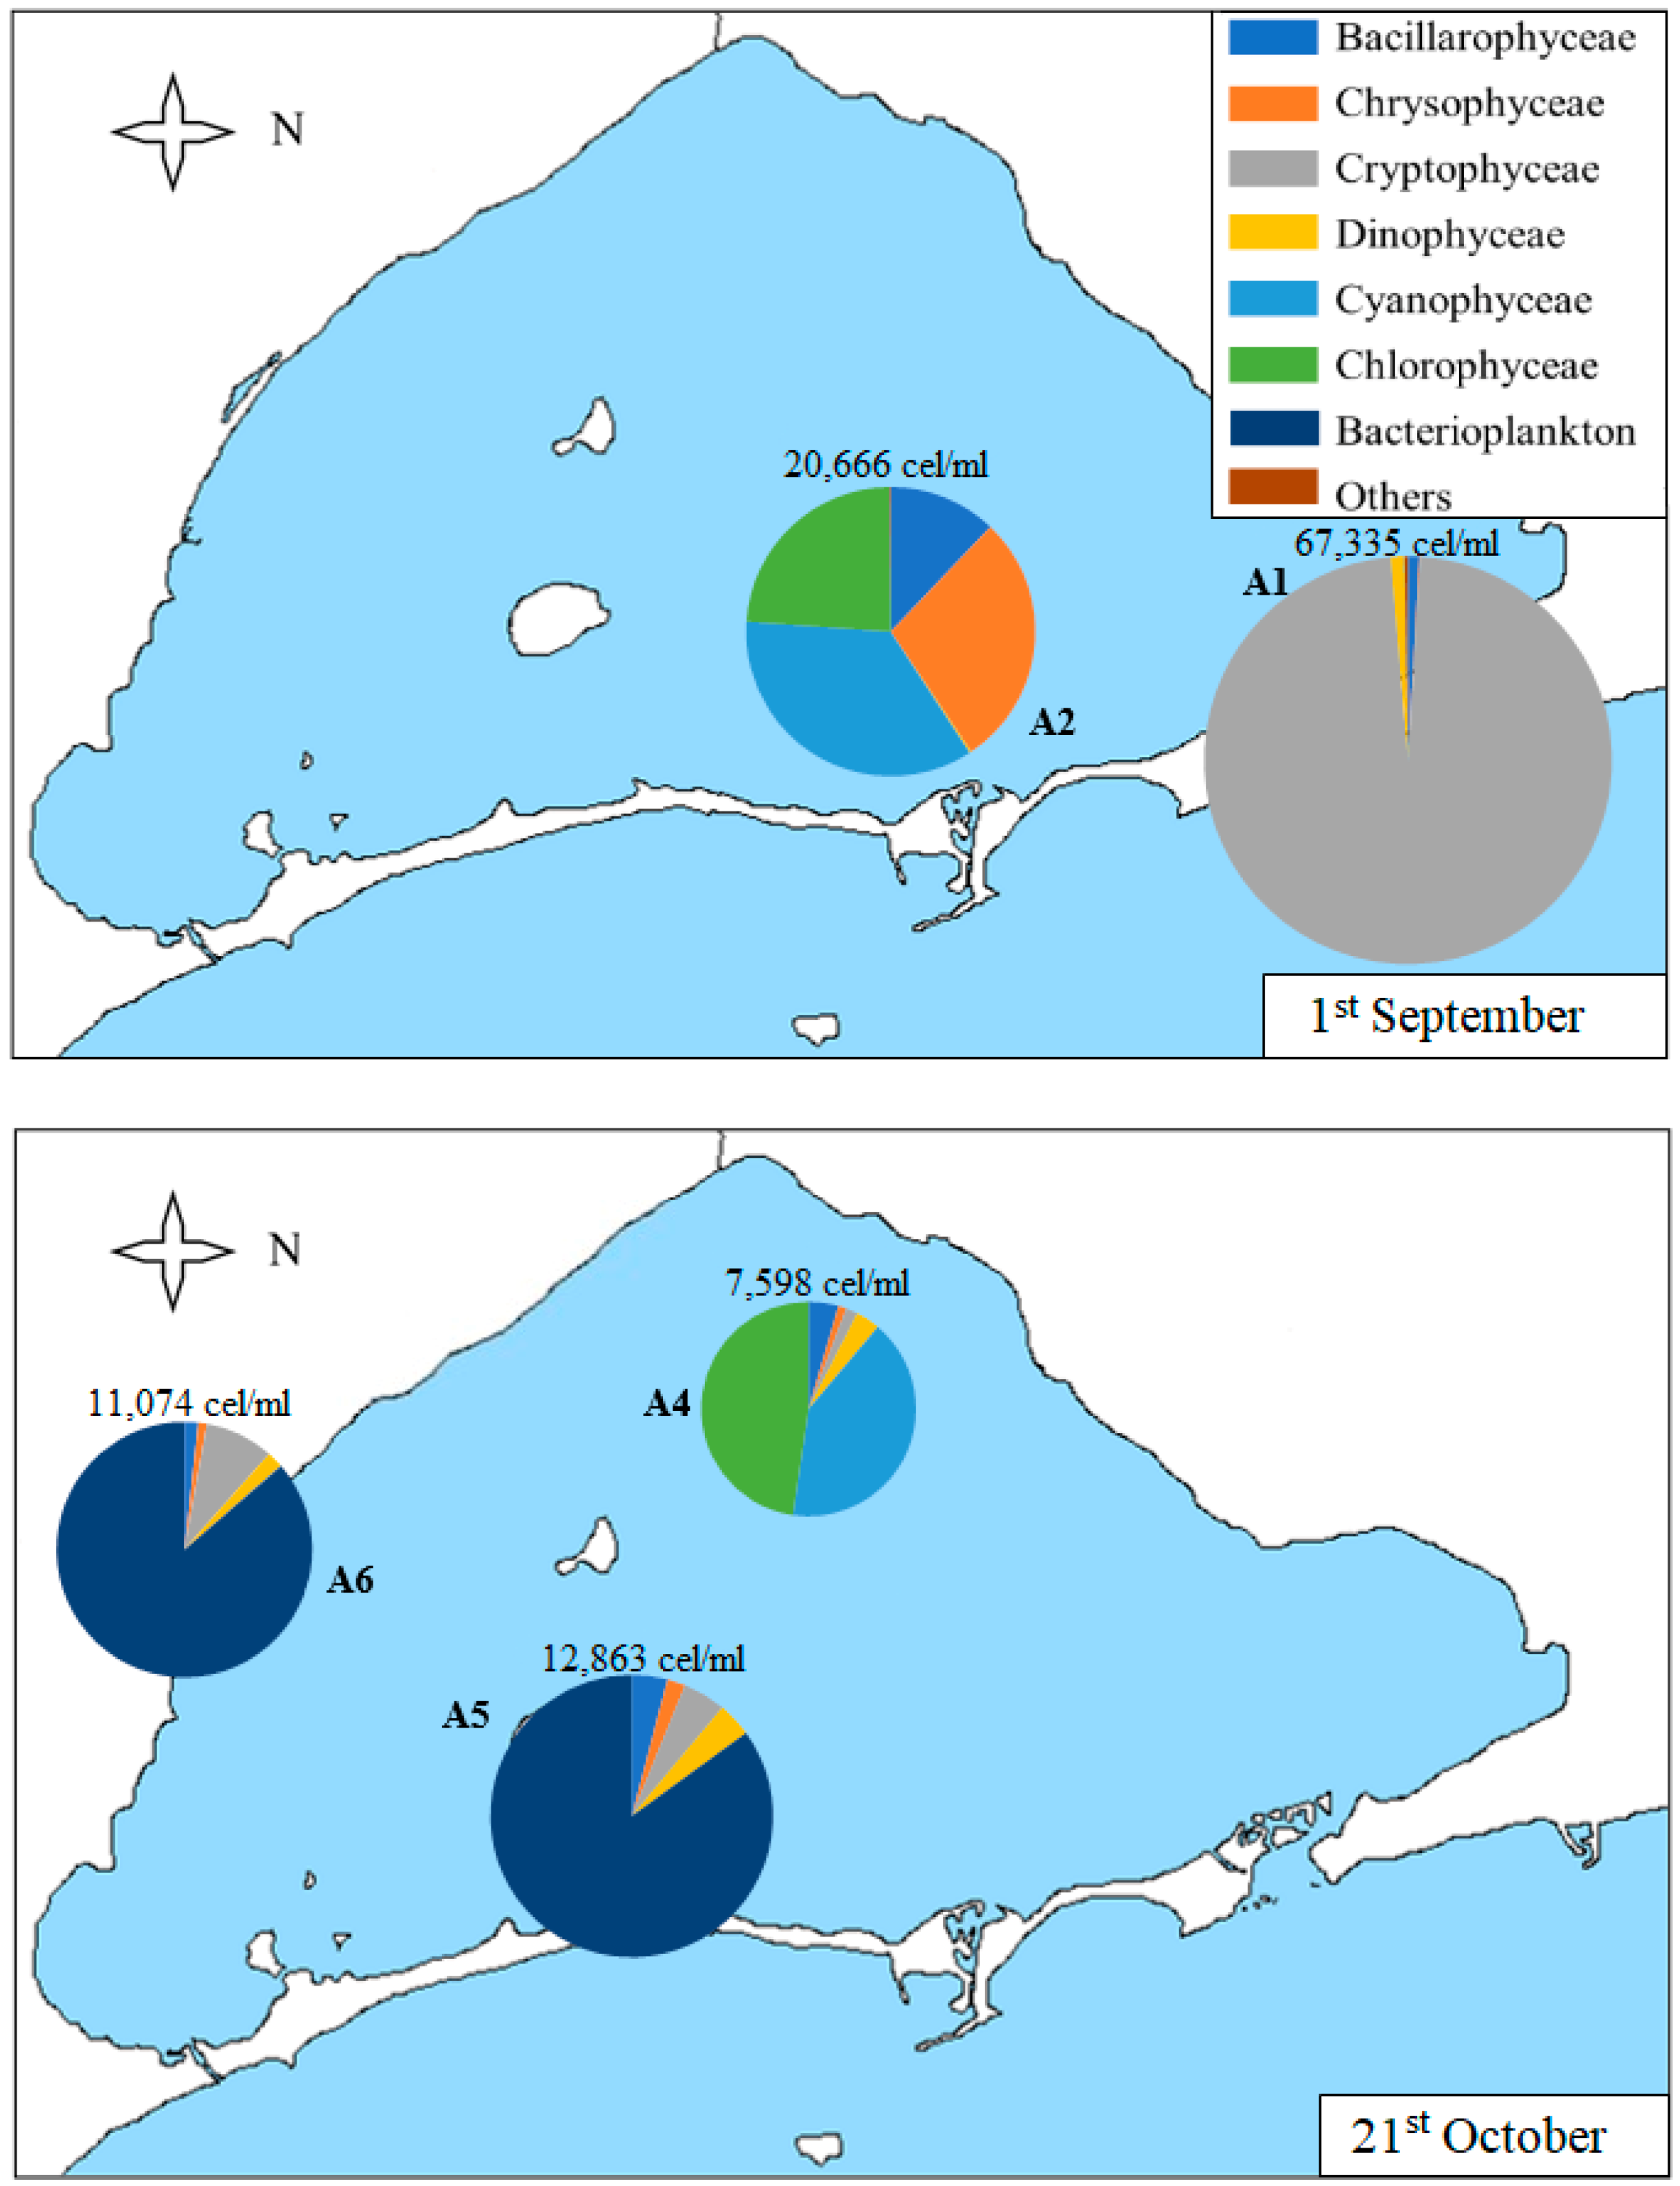
As shown in Table 1 and Figure 6, sample A1 collected on 1st September is the most abundant of all the samples (although, on average, the densities of the samples collected on 9th December are also high, as will be shown later in Figure 7). In this sample, 98% of the algae counted correspond to the Cryptophyceae group, with nanoplanktonic cells being the most abundant (with a density of 65,534 cells/mL), followed by Plagioselmis sp. and Leucocryptos marina, although in lower density.
In percentages lower than 1%, we can find diatoms, such as Navicula sp., Chaetoceros sp., and Nitzchia longissima, and dinoflagellates, such as Gymnodinium sp., Protoperidinium sp., and Prorocentrum compressum. The other sample collected on 1st September (A2) does not have such a high density of algae, but it is much higher than the densities of the May and June samples and, unlike A1, is much more diverse in composition. It presents Cyanophyceae, Chrysophyceae, and Chlorophyceae classes and diatoms in similar proportions. The most noteworthy taxa are Synechococcus sp., Chrysophyceae, and nanoplanktonic Chlorophyceae and diatoms of the species Cyclotella glomerata.
The samples collected on 21st October (Figure 6) show lower densities than in September but are still higher than in previous months. The A4 sample predominates the classes Chlorophyceae and Cyanophyceae, followed by Bacillarophyceae, Dinophyceae, and Cryptophyceae classes. The most abundant classes include Synechococcus sp. in Cyanophyceae and nanoplanktonic Chlorophyceae. The most abundant diatoms are Cylindrotheca closterium, Cyclotella glomerata, and Nitzchia longissima. The A5 and A6 samples are similar, both in total density and composition. In these samples, bacterioplankton predominates. It is a group that includes both spherical unicellular bacteria (which constitute the totality of bacterioplankton in these samples) and bacteria of the genus Flavobacterium sp. (which only appears in this sample of December). Other taxa found are Cryptophyceae class, such as Plagioselmis lacustris and Rhodomonas salina, dinoflagellates, such as Gymnodinium sp., and diatoms, such as Chaetoceros muelleri, Nitzchia longissimi, and Cyclotella glomerata.
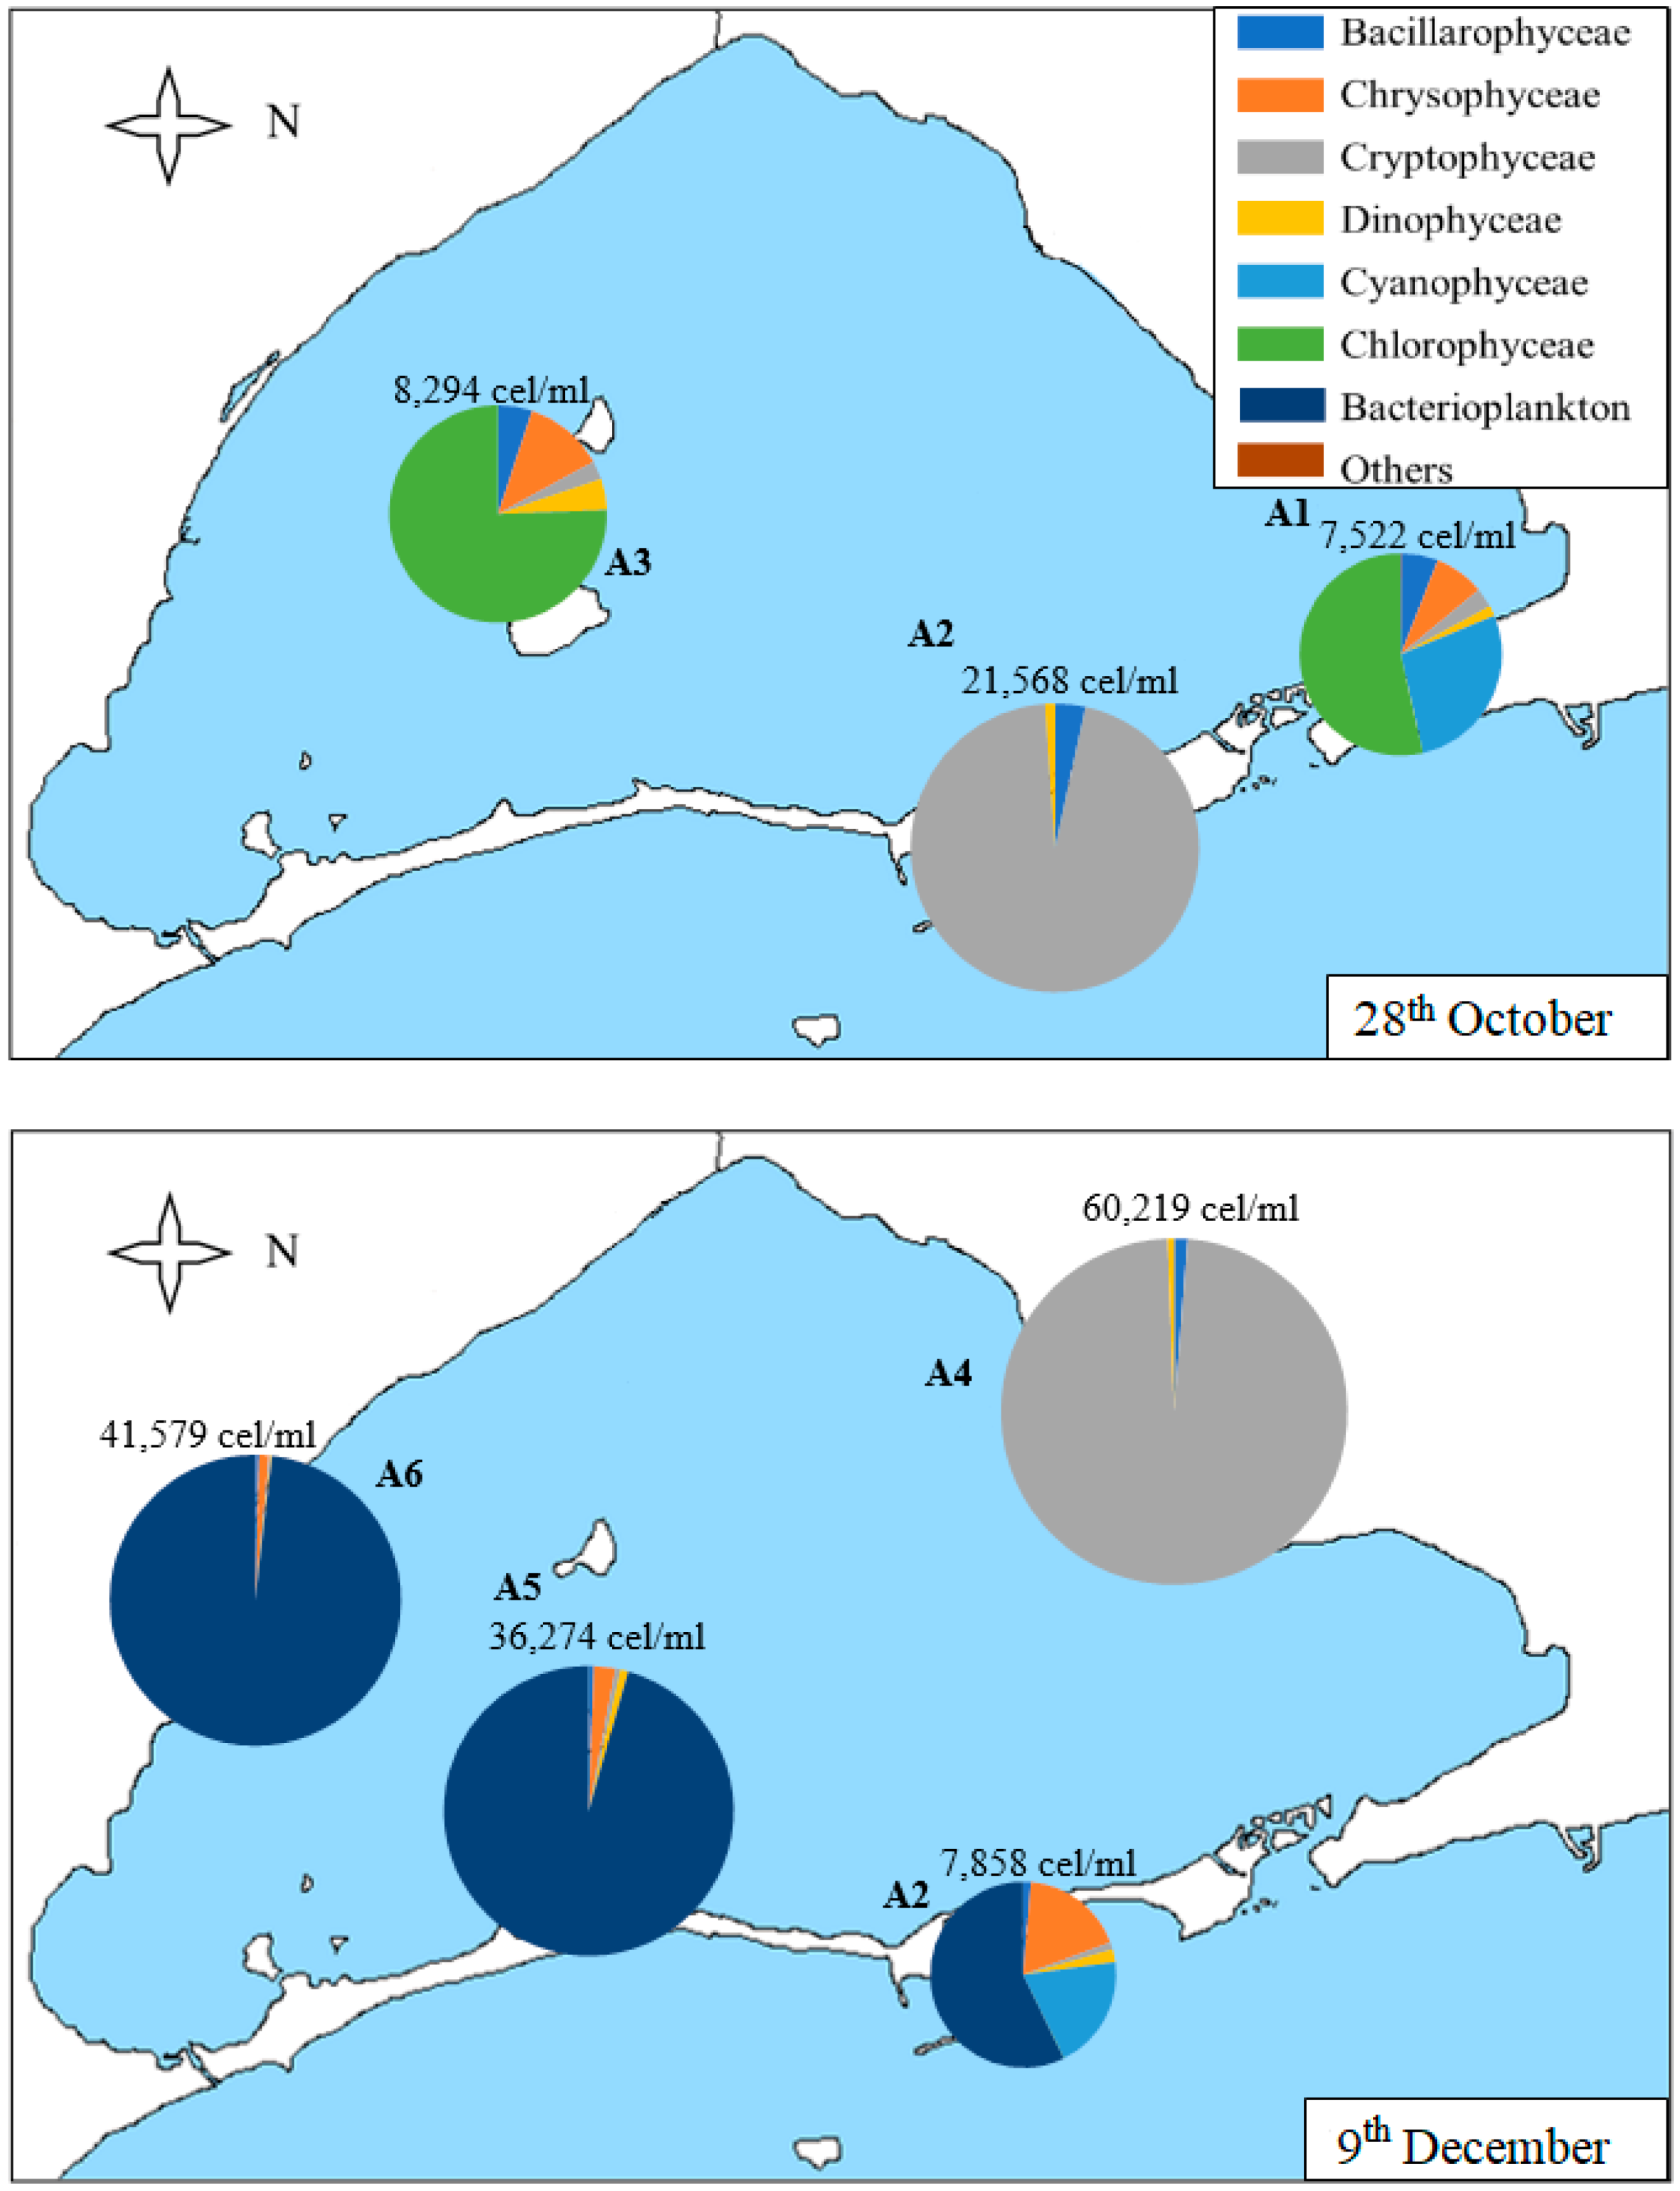
In Figure 7, we can observe that the density of the samples collected in the samples of 28th October and 9th December is higher than those of the samples collected in May and June, although somewhat lower than those of the sample collected in September.
On 28th October (Figure 7), Chlorophyceae predominate in A1 and A3 samples, with nanoplanktonic Chlorophyceae predominating. However, the Cryptophyceae class predominated in the A2 sample (96% of the sample), with both nanoplanktonic Cryptophyceae and Plagioselmis lacustris and Rhodomonas salina species standing out. In the A2 sample, we can also find diatoms, predominantly the species Nitzchia longissima, and dinoflagellates, with Gymnodinium sp. Being the most abundant species of this group. In the A1 sample, the class of Chlorophyceae is followed by the Cyanophyceae class, such as Synechococcus sp.; Chrysophyceae, such as Calycomonas sp.; diatoms, such as Cyclotella glomerata and Cylindrotheca closterium; Plagioselmis lacustris in Cryptophyceae class and Gymnodinium sp.; and Katodinium fungiforme and Peridinium sp. in dinoflagellates. In sample A3, the most abundant species are the same as in samples A1, except for the class of Cyanophyceae, which does not appear.
The last samples, collected on 9th December, are the densest of the year. The A4 sample is the most different in its composition, predominantly contained in nanoplanktonic Cryptophaceae and Plagioselmis sp., holding 98% of the sample in which only 2% is composed of diatoms, such as Chaetoceros sp. and Gymnodinial dinoflagellates. The A2 sample is very similar in density and diversity, with bacterioplankton (Flavobacterium sp.), Cyanophyceae (Synechococcus sp.), and Chrysophyceae (Calycomonas sp.) being the most abundant categories, although we can also find some Gymnodinial dinoflagellates. Finally, A5 and A6 samples are very similar in density and composition. They are dominated by bacterioplankton (which accounts for between 96 and 98% of the density of the sample), followed by nanoplanktonic Chrysophyceae, dinoflagellates, such as Gymnodinium sp., and Cryptophyceae, such as Plagioselmis lacustris and Rhodomonas salina.
3.3. Multivariate Analysis
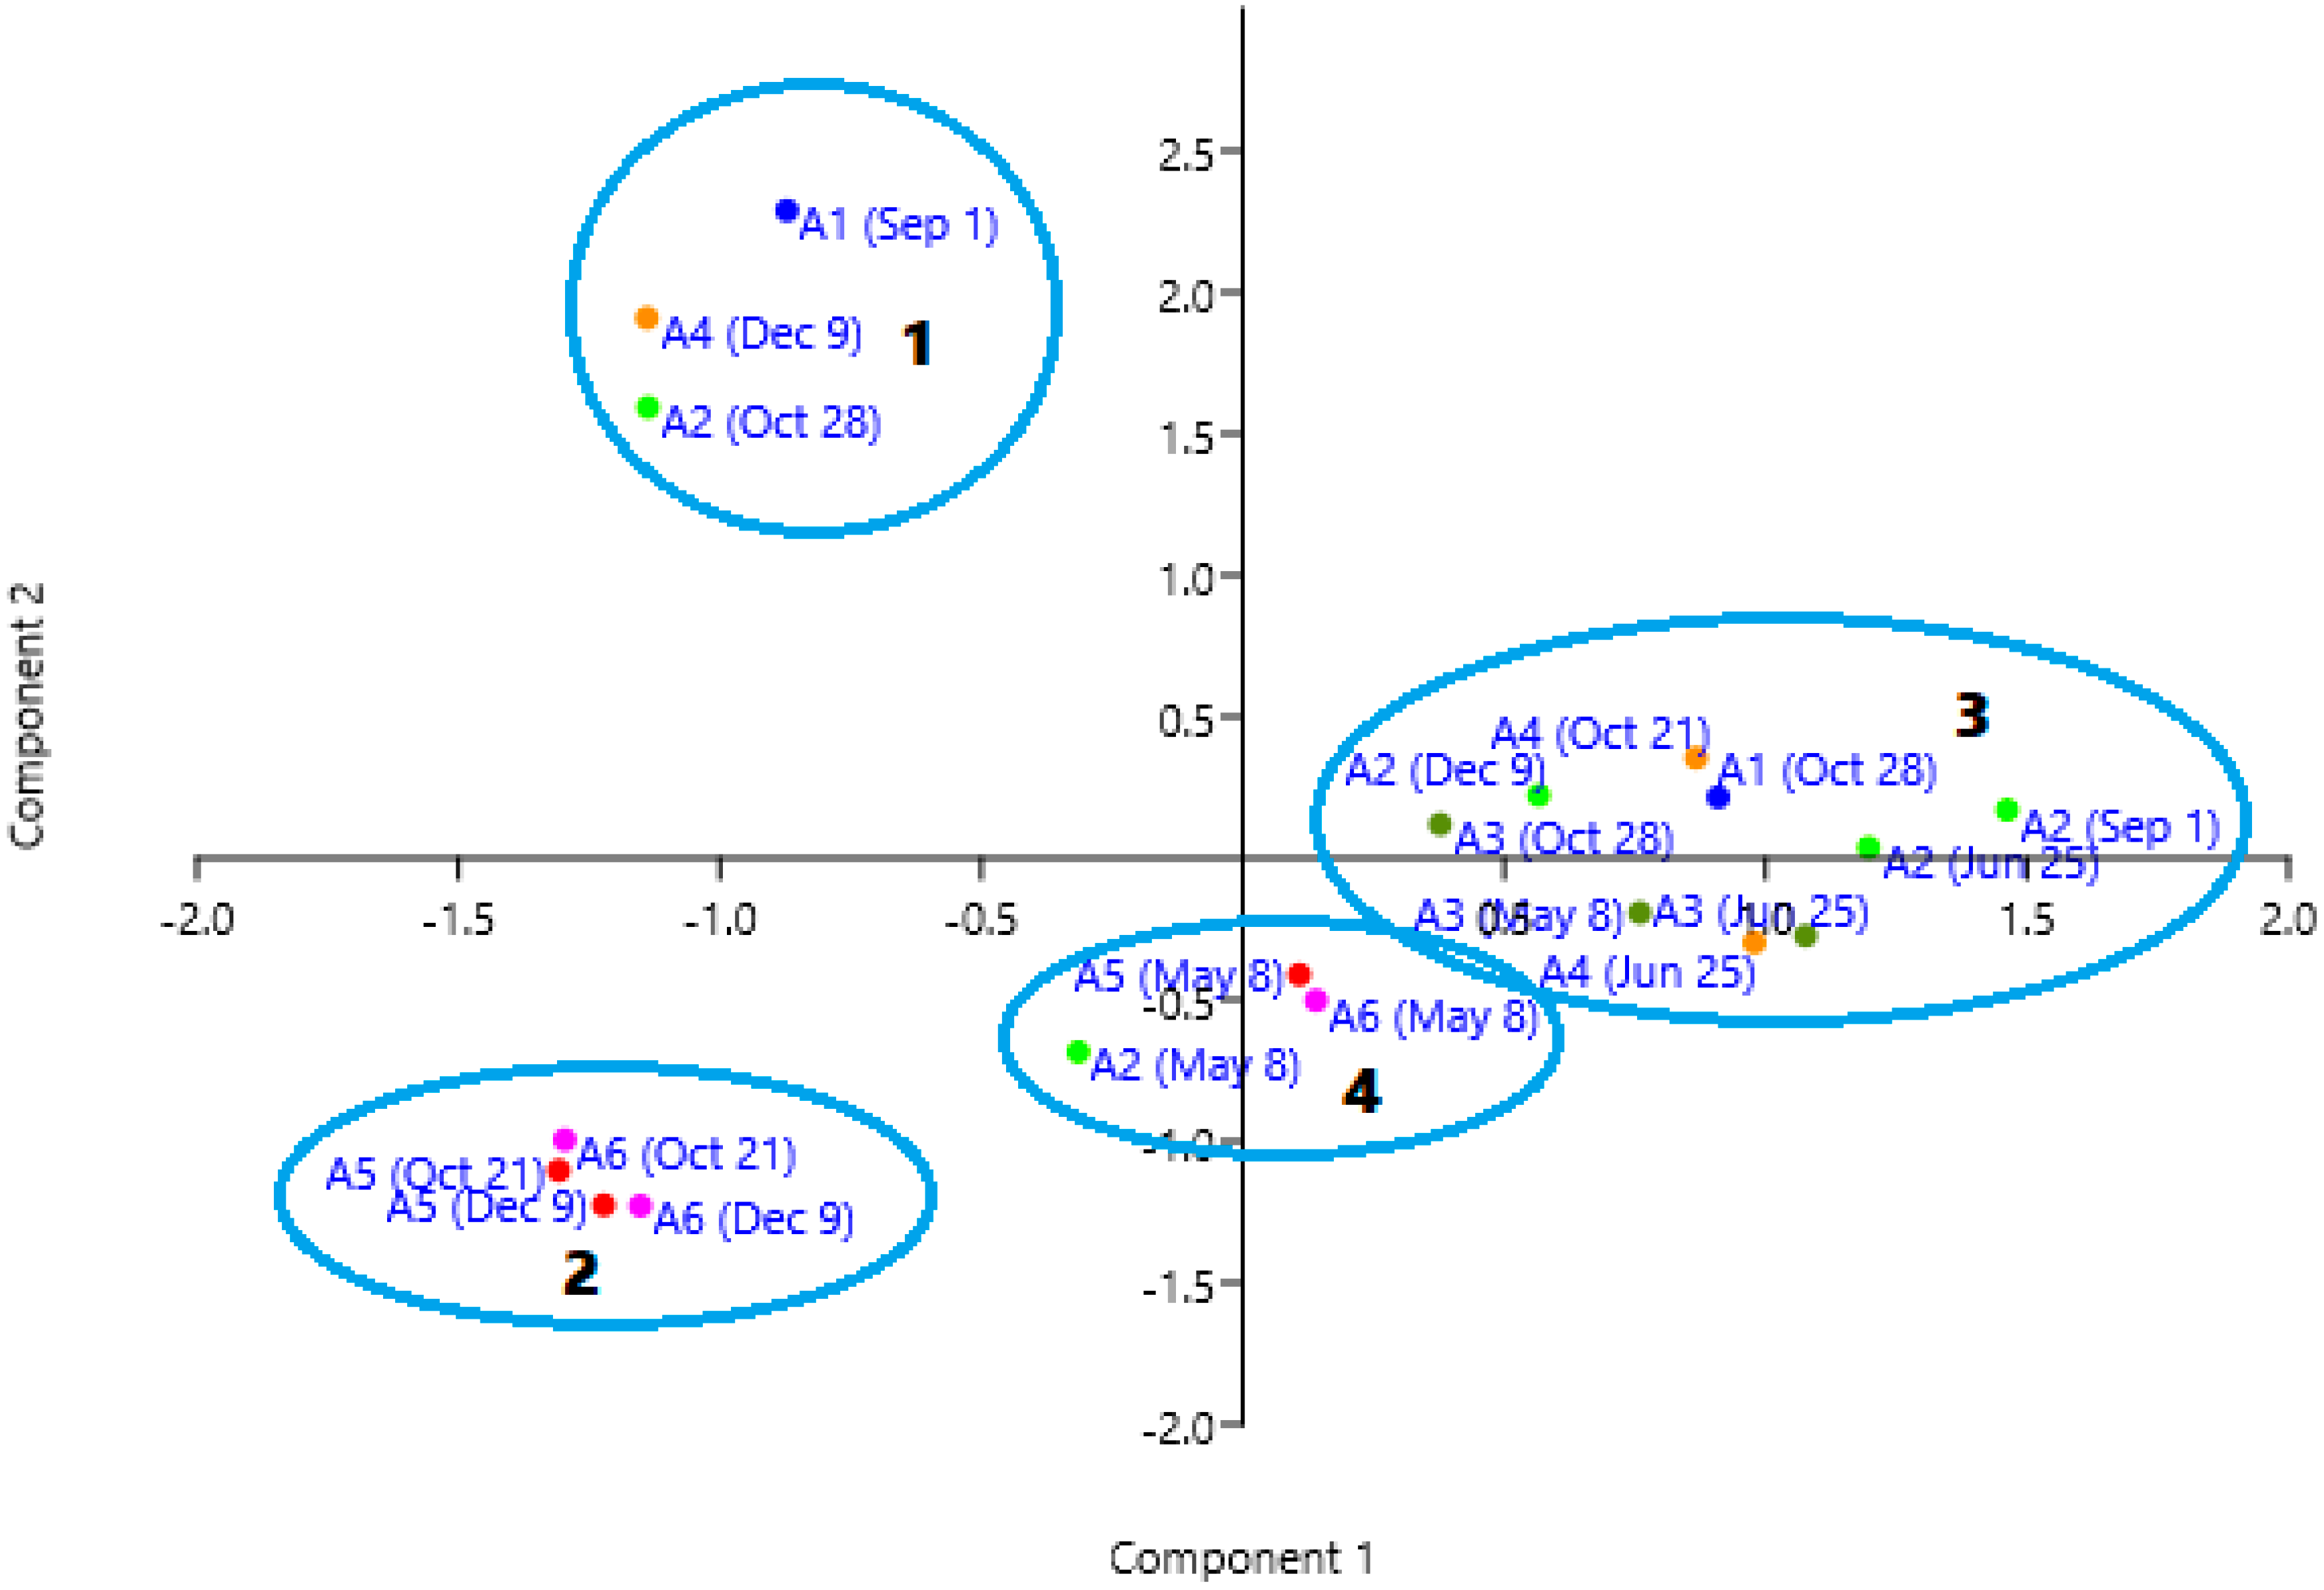
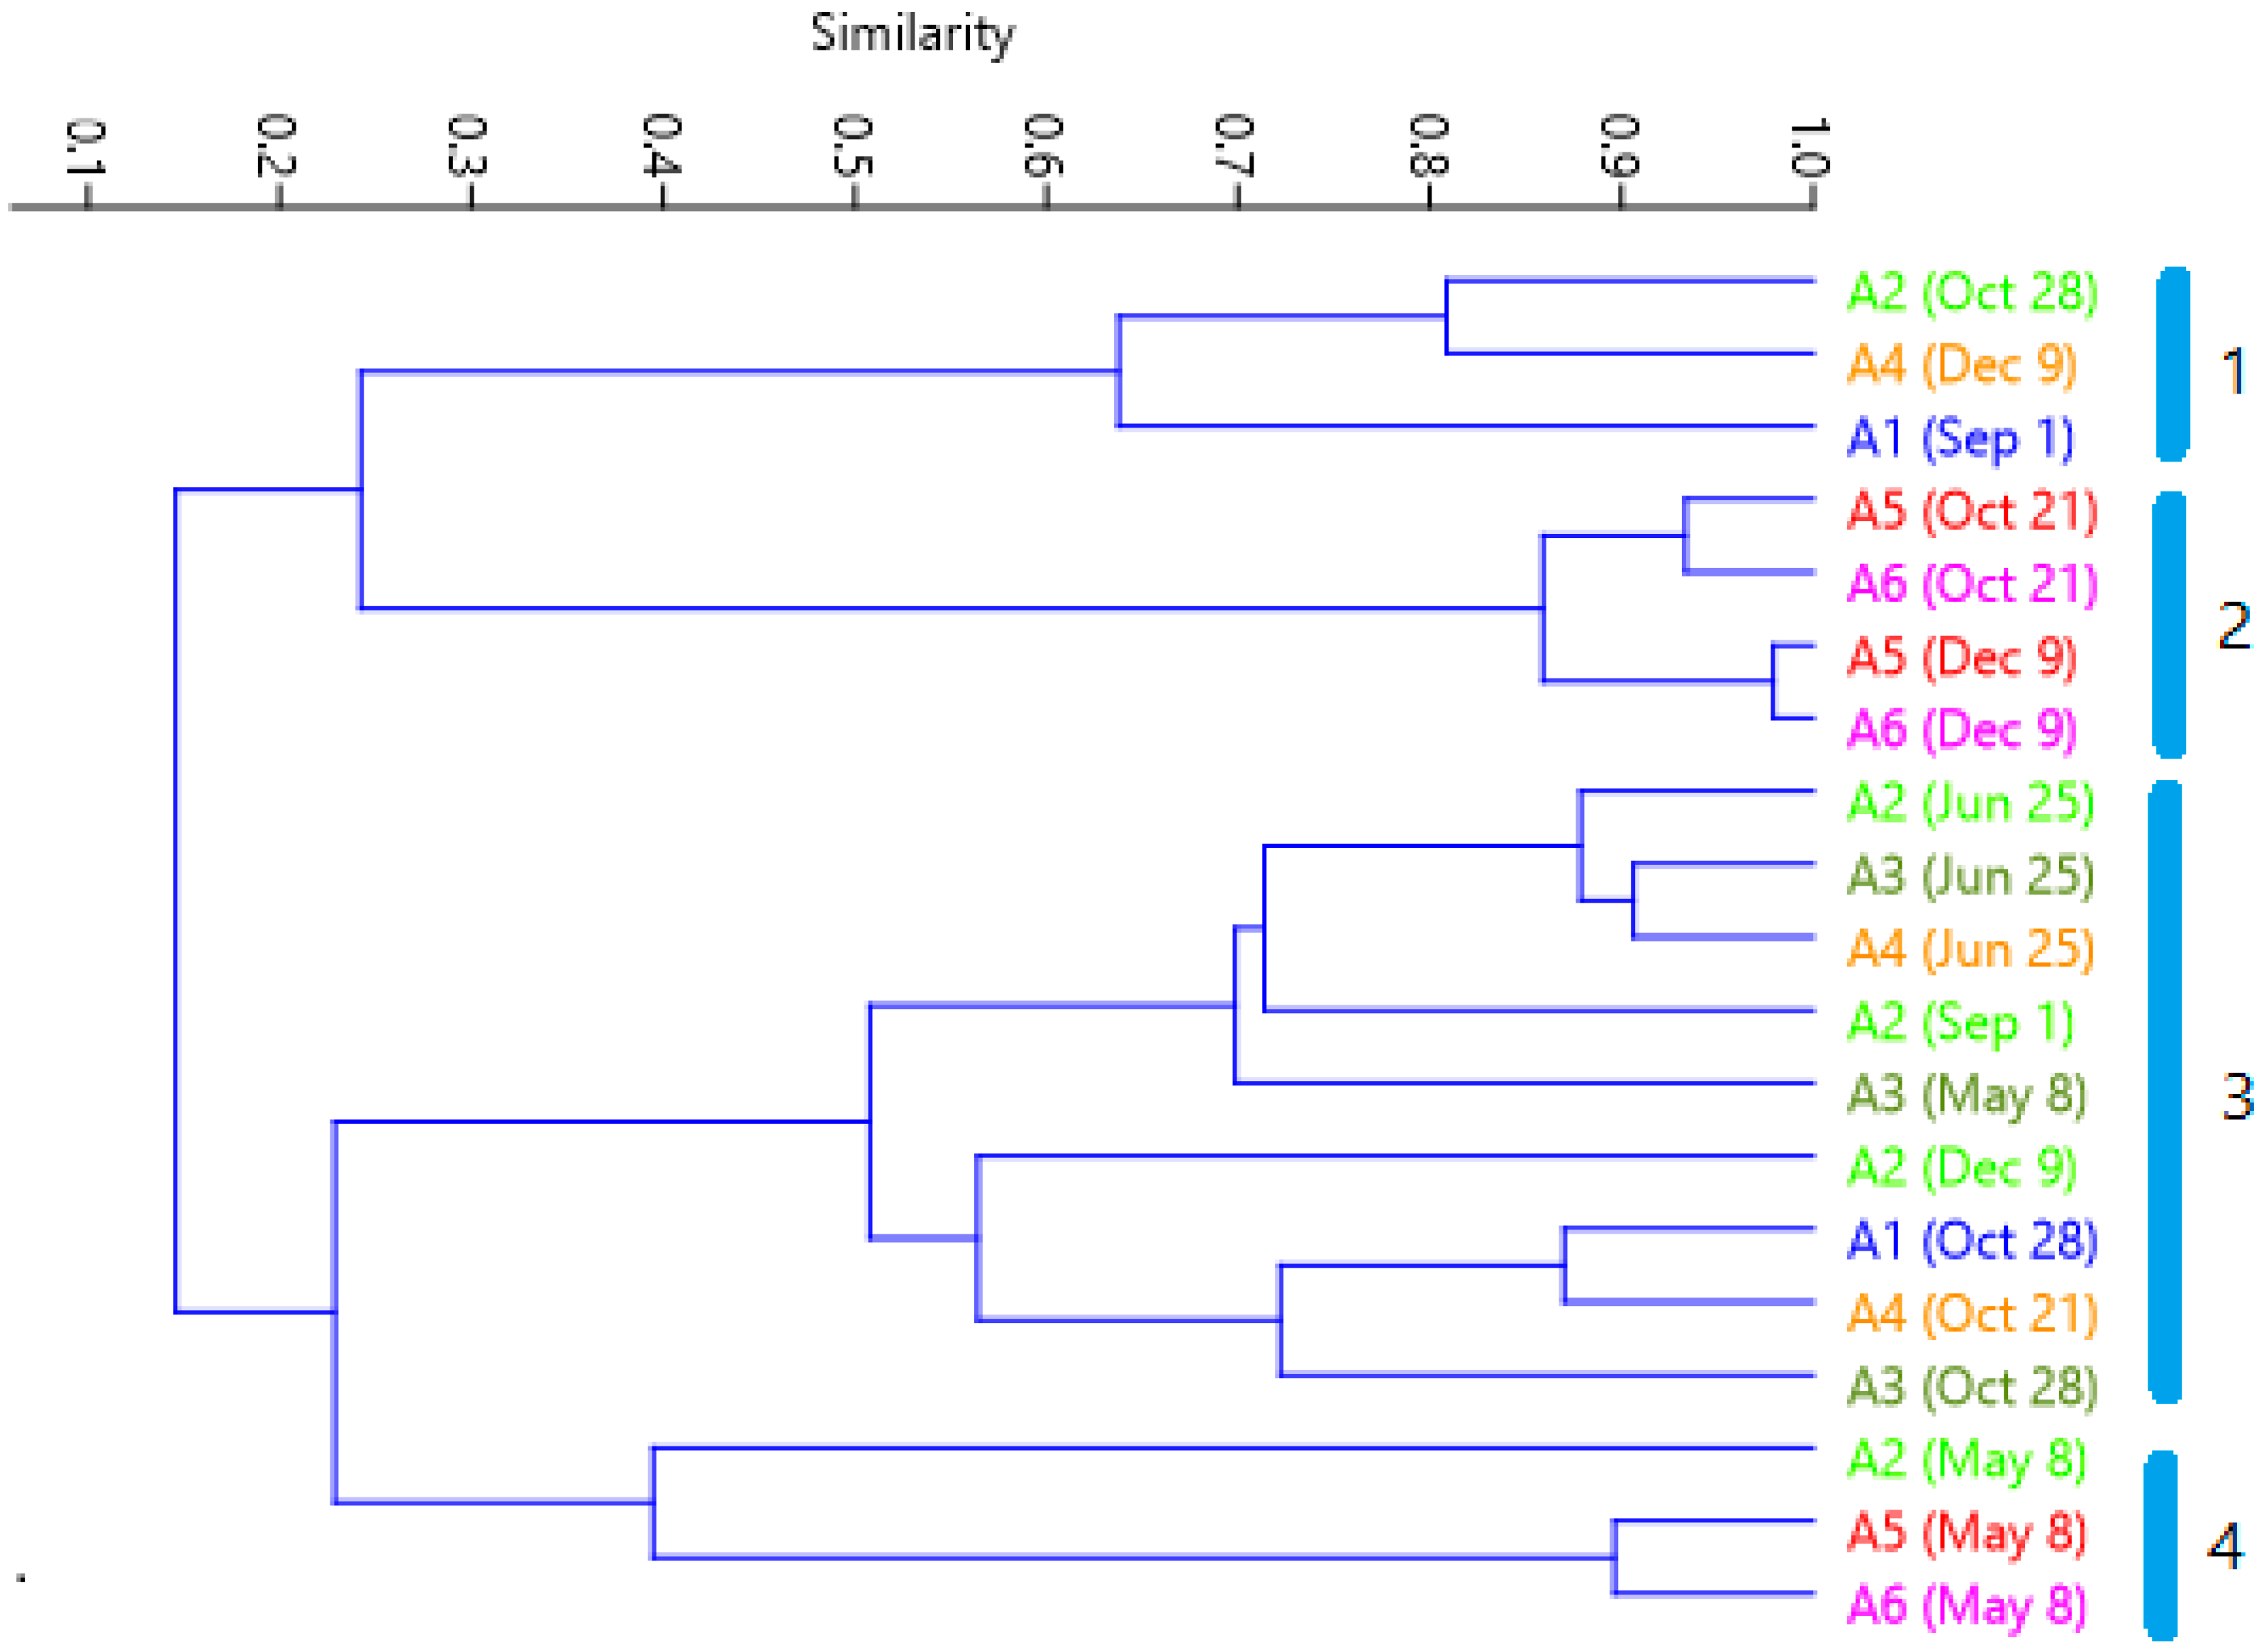
Cluster analysis of similarity (Figure 8) gives the first group being formed by the samples where nano-planktonic Cryptophyceae dominate; group 2 gathers the samples dominated by bacterioplankton (Figure 6 and Figure 7). Group 4 groups the May samples characterized by the presence of Bacillariophyceae in the three points, and with important presence of Chlorophyceae in points A5 and A6. Group 3 consists of all the other samples, in which the phytoplankton density is lower than average, and their diversity is higher.
In the Canonical Components Analysis (CCA) between the three environmental variables and the taxa (Figure 9), the first axis explains 68% of the variance and is correlated with transparency on the positive side, while turbidity and chlorophyll are on the negative side. The second axis explains 32% of the variance and shows the samples from the southern zone in the positive part, while those from the northern zone remain in the negative part, indicating the spatial heterogeneity of the lagoon.
Likewise, we can observe a tendency to place the samples with less diversity (H) and equitability (J) in the negative part of the first axis (Figure 9), while those samples in which diversity and equitability are greater tend to be grouped in the positive part (Table 1). In this sense, the first component is giving more weight to the diversity in the samples; the second component gives more weight to certain algal groups that occur in these two areas of the Mar Menor (Chrysophyceae and Dinophyceae to the north and bacterioplankton to the south).
The PCA among the taxa explains 50% of the variance (Figure 10). Component 1 explains 31%, and component 2 explains 19%. The first component is related to phytoplankton density, approximately ordering the samples from lowest to highest (positive to negative). The taxa are distributed the presence of nanoplanktonic Chlorophyceae and Synechoccus sp. in the positive zone, as opposed to the presence of nanoplanktonic Cryptophyceae and bacterioplankton. These two planktonic groups are separated by the second component, the first one at the positive component 2 and at the negative part the samples with higher density of bacterioplankton (points A5 and A6 of October and December).
4. Discussion
The highest phytoplankton densities are associated with the samples in which the smaller size taxa (bacterioplankton and nanoplankton cells) were observed. It appeared in the samples from September to December, while the lowest densities were recorded during the samples in this year.
Dzierzbicka-Głowacka’s study [47] indicates that phytoplanktonic populations are affected by the effect of solar energy on the surface of the lagoon, the dynamics of water movement, and the distribution of nutrients in the water column. If we observe temperature variations, we can see that, as in our work, temperature increases favor the proliferation of phytoplankton [48,49]. These increases tend to occur in the summer months, so that, in subsequent months, the highest phytoplankton densities are usually recorded [50], and, in the transition between spring and summer, a significant increase in the density of Cyanophyceae and diatoms with respect to other times of the year should be noted [51]. An example of this effect can be found in the research of Siegel and Gerth [52], where a significant increase in the density of Cyanobacteria was recorded in August 1997, one of the warmest of the 20th century. This is not always the case. In the study of Alves de Souza et al. [53], we find that, in the Chilean Reloncaví fjord, while the species Protoceratium reticulatum has a peak maximum density in warmer years (coinciding with the El Niño phenomenon), the species Dinophysis acuminata predominates in the colder years (coinciding with the La Niña phenomenon).
On the other hand, the Campo de Cartagena constitutes an important system of aquifers in the Mediterranean basin, in which most of the water is used for irrigation and other agricultural activities in the area. This agricultural activity causes the aquifers to be recharged, firstly, with useful rainwater (without taking into account that which is lost through surface runoff and that which evaporates) and, secondly, with the water that has been used in the irrigation of crops, whether extracted from the aquifer itself or from the Tagus-Segura transfer. Recently, desalinated water has begun to be used. This use has favored a reduction in the pollution of the aquifer system, especially the Quaternary aquifer, by nitrates and other compounds used in agriculture [54]. It should be noted that, while the actual concentrations of TP reaching the Mar Menor remain at similar values to those of 2003, the concentration of nitrate has increased significantly by a factor of four, reaching values above the recommended environmental maxima.
Due to the importance of nitrogen in the nutrition of plant species, when these compounds reach the waters of the lagoon they favor the massive proliferation of plant species (especially phytoplankton, as we can see in the results of our study) so that there is an increasingly eutrophy process of the lagoon, as reflected in the dynamic model of Martínez and Esteve [54]. The renewal of the aquifer waters is a slow process (progress through the pores is a few meters a day) until they reach the Mar Menor, so the accumulation of nitrates is very favored [5]. This increase in the nutrients in suspension is also due to the loss of meadows of macrophytes and aquatic plants that fix these nutrients to the soil [55], so the average density of phytoplankton in the Mar Menor is increasing [1].
Regarding the composition of the samples, we can say that the predominant phytoplankton groups are Chrysophyceae, Cryptophyceae, Chlorophyceae, and Cyanophyceae. We can also highlight bacterioplankton in four of the samples collected on December. However, these are not the groups with the greatest number of species. Of a total of 109 identified taxa, the groups with the highest number of species are dinoflagellates (Dinophyceae), with 45 registered taxa and diatoms (Bacillarophyceae) with 28 registered taxa, similar to the work of Ros et al. [28]. If we observe their distribution in the maps (Figure 5, Figure 6 and Figure 7), we can see that we find higher density of diatoms in samples taken closer to channels of west side, while dinoflagellates are distributed in central open areas. The diatoms lack structures that allow them to move unlike the dinoflagellates that possess flagella, so they tend to proliferate in areas where water movements favor the renewal of nutrients and dissolved oxygen [56]. We can also find 8 species of Chrysophyceae and 8 others of Cryptophyceae, followed by 6 taxa of Cyanophyceae, 5 of Chlorophyceae, and 2 groups of bacterioplankton. The other 5 species recorded correspond to other classes, such as Conjugatophyceae, Pedinophyceae, Euglenophyceae, Diphylleida, and Thecofilosea. Of particular note is the increase in density of the dinoflagellates Gymnodinium sp., a genus characterized by the production of toxins from some of its species [57] and which favors the formation of the so-called “red tides”. Another concern is the possible accumulation of toxic metabolites due to the proliferation of green and blue algae [58].
Finally, we can observe that the phytoplankton taxa that have the greatest proliferation are those that can be included in the category of nanoplankton with a high reproduction rate, such as the cyanophytes of the genus Synechococcus sp. or any of the identified nanoplanktonic organisms (see Supplementary Materials). Apart from these groups, we can highlight the diatoms Cyclotella glomerata, Cylindrotheca Closterium, or Nitzchia longissima. Cyclotella glomerata is characterized by being a freshwater species [40] and appears, surely, from surface waters draining over the Mar Menor; Cylindrotheca closterium is a species typical of marine environments [1], and Nitzchia longissima can be found in hypersaline environments [59]. With the data from these species we can see that, although the Mar Menor receives considerable amounts of fresh water, its waters maintain a salinity that is specific to or superior to that of a marine ecosystem.
Our results have been compared with the studies conducted at the same point in 1981 [1], with salinity between 43 and 46 PSU, and in our study period, they are very similar, between 41 and 45 PSU. However, there is a big difference in the density of phytoplankton, since the values in 1981 ranged from 10 to 500 cells/mL, and currently these values are between 220 and 5700 cells/mL. In these values, we have not considered the counts of small cells because we note that, in that study, the sample was collected with a plankton net and was lacking in the ability to detect small pico and nanoplankton, and they were not counted [1]. The maximum density values were in winter and now they are in autumn. There is a coincidence in the dominance of Chrysophyceae in the spring. But the rest of the year the abundance of the nanoplankton reduces the importance in terms of density of the other groups, such as Bacillariophyceae and Dinophyceae. The presence of certain taxa is coincidental in the two studies. We point out among them Cyclotella, Nitzschia, Calycomonas, Prorocentrum, Gymnodinium, and Peridinium. However, we now highlight the presence of Cryptophyceae and nanoplankton, which were not observed in 1981. This is an indicator of moving the trophic state from mesotrophy to eutrophy as observed in Lesina lagoon (Italy) [60] and Toulon bay (France) [61]. The increase of nitrate concentration in the inflow freshwater to Mar Menor arises from mean value of 32 mg/L in 2003 [62] to 210 mg/L in 2017.
These results show that the main ecologic problems of the lagoon are the nitrogen and phosphorus discharges derived from the contamination of the aquifers of the zone due to the agriculture of the surroundings and the discharges coming from the tourist zone. To remedy this situation, it is essential to design and implement environmental policies and strategies, especially those that focus on limiting suspended nutrients to regulate the massive proliferation of phytoplankton [63]. In the integral report on the ecological state of the Mar Menor in 2017 [64], different methods of water purification are described to reduce its nitrogen content, such as anionic exchange, reverse osmosis, electrodialysis, bioelectrogenesis, and denitrification (whether chemical, catalytic, or biological). On the other hand, in works, such as Dimitrieva and Semenova [65], we can see that the proliferation of phytoplankton can trigger a proliferation of zooplankton, which may be useful in future plans for the recovery of the lagoon.
5. Conclusions
The results of our study indicate a significant increase in phytoplankton density in the marine lagoon compared to previous data, according to the eutrophication pressure favored by agricultural dumping and waste derived from touristic exploitation in which the lagoon is involved.
In terms of composition, the greatest diversity of species is found in the spring and early summer months. However, the notable increase in density in the summer and autumn months occurs in species, such as Synechococcus sp., and groups of Chlorophyceae, Chrysophyceae, and nanoplanktonic Cryptophyceae, while species diversity drops significantly. In spring, we find more diversity with the presence of diatoms and dinoflagellates, among other groups.
Comparing the evolution of the lagoon with previous works, we can conclude that this eutrophication process could increase. To avoid this, it would be necessary to implement control measures for the use of fertilizers in nearby growing areas and to study water treatment techniques so that phytoplankton densities can be reduced.
Supplementary Materials
The following are available online at https://www.mdpi.com/2077-1312/8/8/600/s1, Table S1: Main table of density (cells/mL) of the phytoplankton in all the samples studied.
Author Contributions
Conceptualization, J.S. and N.H.-S.; methodology, N.H.-S.; formal analysis, M.E.; investigation, J.A.D.-G., N.H.-S. and G.C.; data curation, N.H.-S. and G.C.; writing—original draft preparation, G.C.; writing—review and editing, J.S.; supervision, M.E.; project administration, J.S.; funding acquisition, J.S. and M.E. All authors have read and agree to the published version of the manuscript.
Funding
This research was funded by IMIDA, contract number 24819-2017.
Conflicts of Interest
The authors declare no conflict of interest. The funders had no role in the design of the study; in the collection, analyses, or interpretation of data; in the writing of the manuscript, or in the decision to publish the results.
References
- Ros, M.; Miracle, M.R. Variación estacional del fitoplancton del Mar Menor y su relación con las de un punto próximo del Mediterráneo. Limnetica 1984, 1, 32–42. [Google Scholar]
- Díaz del Río, V. Estudio Geoambiental del Mar. Menor; Instituto Español de Oceanografía: Madrid, Spain, 1993. [Google Scholar]
- Derruau, M. Geomorfología; Editorial Ariel: Barcelona, Spain, 1981. [Google Scholar]
- Pérez-Ruzafa, A.; Marcos, C.; Pérez-Ruzafa, I.M.; Domenec Ros, J. Evolución de las características ambientales y de los poblamientos del Mar Menor (Murcia, SE de España). An. Biol. 1987, 12, 53–65. [Google Scholar]
- García Aróstegui, J.L.; Marín Arnaldos, F.; Martínez Vicente, D. 1. Hidrogeología. In Informe Integral Sobre el Estado Ecológico del Mar. Menor; Comité de Asesoramiento Científico del Mar. Menor: Madrid, Spain, 2017; pp. 7–22. [Google Scholar]
- Bonilla, S.; Conde, D.; Aubriot, L.; Pérez, M.C. Influence of hydrology on phytoplankton species composition and life strategies in a subtropical coastal lagoon periodically connected with the Atlantic Ocean. Estuaries 2005, 28, 884–895. [Google Scholar] [CrossRef]
- Morote Seguido, A.F.; Rico Amorós, A.M. Perspectivas de funcionamiento del Trasvase Tajo-Segura (España): Efectos de las nuevas reglas de explotación e impulso de la desalinización como recurso sustitutivo. Bol. Asoc. Geogr. Esp. 2018, 79, 1–43. [Google Scholar] [CrossRef]
- Hanley, N.; Bell, D.; Alvarez-Farizo, B. Valuing the benefits of coastal water quality improvements using contingent and real behaviour. Environ. Res. Econ. 2003, 24, 273–285. [Google Scholar] [CrossRef]
- Álvarez Rogel, J.; García Alonso, C.; Gilavert Cervera, F.J.; Gómez Cerezo, R.; León León, V.M.; Marcos Diego, C.; Pérez-Ruzafa, A. 3. Oceanografía Física y Química. In Informe Integral Sobre el Estado Ecológico del Mar. Menor; Comité de Asesoramiento Científico del Mar. Menor: Madrid, Spain, 2017; pp. 71–86. [Google Scholar]
- Phlips, E.J.; Badylak, S. Spatial variability in phytoplankton standing crop and composition in a shallow inner-shelf lagoon, Florida Bay, Florida. Bull. Mar. Sci. 1996, 58, 203–216. [Google Scholar]
- Macedo, M.F.; Duarte, P.; Mendes, P. Annual variation of environmental variables, phytoplankton species composition and photosynthetic parameters in a coastal lagoon. J. Plankton Res. 2001, 23, 719–732. [Google Scholar] [CrossRef]
- Gimenez Casalduero, M.F.; Marcos Diego, C.; Oliva Paterna, F.J.; Pérez-Ruzafa, A.; Robledano Aymerich, F.; Torralva Forero, M.M. 2. Ecología Lagunar. In Informe Integral Sobre el Estado Ecológico del Mar. Menor; Comité de Asesoramiento Científico del Mar. Menor: Madrid, Spain, 2017; pp. 23–69. [Google Scholar]
- Jacquet, S.; Delesalle, B.; Torréton, J.P.; Blanchot, J. Response of phytoplankton communities to increased anthropogenic influences (southwestern lagoon, New Caledonia). Mar. Ecol. Prog. Ser. 2006, 320, 65–78. [Google Scholar] [CrossRef] [Green Version]
- Bec, B.; Husseini-Ratrema, J.; Collos, Y.; Souchu, P.; Vaquer, A. Phytoplankton seasonal dynamics in a Mediterranean coastal lagoon: Emphasis on the picoeukaryote community. J. Plankton Res. 2005, 27, 881–894. [Google Scholar] [CrossRef] [Green Version]
- Sakka Hlaili, A.; Grami, B.; Hadj Mabrouk, H.; Gosselin, M.; Hamel, D. Phytoplankton growth and microzooplankton grazing rates in a restricted Mediterranean lagoon (Bizerte Lagoon, Tunisia). Mar. Biol. 2006, 151, 767–783. [Google Scholar] [CrossRef]
- Carrasco Palma, D.; Floraciones Algales Nocivas (FAN), un Fenómeno Natural Presente en Nuestras Costas. Labtox: Facultad de Medicina, Universidad de Chile. 2015. Available online: http://labtox.cl/?p=984 (accessed on 22 May 2019).
- European Union. Council Directive 91/271/EEC of 21 May 1991 Concerning Urban Waste-Water Treatment. 1991. Available online: http://data.europa.eu/eli/dir/1991/271/oj (accessed on 22 May 2019).
- European Union. Council Directive 91/676/EEC of 12 December 1991 Concerning the Protection of Waters Against Pollution Caused by Nitrates from Agricultural Sources. Available online: http://data.europa.eu/eli/dir/1991/676/oj (accessed on 22 May 2019).
- European Union. Directive 2000/60/EC of the European Parliament and of the Council of 23 October 2000 Establishing a Framework for Community Action in the Field of Water Policy. Available online: http://data.europa.eu/eli/dir/2000/60/oj (accessed on 22 May 2019).
- De la Lanza Espino, G. Criterios generales para la elección de bioindicadores. In Organismos Indicadores de la Calidad del Agua y de la Contaminación (Bioindicadores); De la Lanza Espino, G., Hernández Pulido, S., Carbajal Pérez, J.L., Eds.; Plaza y Valdés, S.A.: Mexico City, Mexico, 2000; pp. 17–41. [Google Scholar]
- Loureiro, S.; Newton, A.; Icely, J. Boundary conditions for the European Water Framework Directive in the Ria Formosa lagoon, Portugal (physico-chemical and phytoplankton quality elements). Estuar. Coast. Shelf Sci. 2006, 67, 382–398. [Google Scholar] [CrossRef]
- Velasco, J.; Lloret, J.; Millán, A.; Marin, A.; Barahona, J.; Abellán, P.; Sánchez-Fernández, D. Nutrient and particulate inputs into the Mar Menor lagoon (SE Spain) from an intensive agricultural watershed. Water Air Soil Pollut. 2006, 176, 37–56. [Google Scholar] [CrossRef]
- Reynolds, C.S. The Ecology of Phytoplankton; Cambridge University Press: New York, NY, USA, 2006. [Google Scholar]
- Nienhuis, H.; Guerrero Caballero, R. A quantitative analysis of the annual phytoplankton cycle of the Magdalena lagoon complex (Mexico). J. Plankton Res. 1985, 7, 427–441. [Google Scholar] [CrossRef]
- Webster, I.T.; Ford, P.W.; Hodgson, B. Microphytobenthos contribution to nutrient-phytoplankton dynamics in a shallow coastal lagoon. Estuaries 2002, 25, 540–551. [Google Scholar] [CrossRef]
- Sarno, D.; Zingone, A.; Saggiomo, V.; Carrada, G.C. Phytoplankton biomass and species composition in a Mediterranean coastal lagoon. Hydrobiologia 1993, 271, 27–40. [Google Scholar] [CrossRef]
- Ros, M.; Miracle, M.R.; Serra, M. Análisis estadístico de las comunidades del fitoplancton de Mar Menor y su relación con el de la zona costera marina. Limnetica 1987, 3, 35–46. [Google Scholar]
- European Committee for Standardization. European Standard. EN 15204 2007. Water Quality—Guidance Standard on the Enumeration of Phytoplankton Using Inverted Microscopy (Utermöhl Technique); European Committee for Standardization: Brussels, Belgium, 2007; pp. 1–46. [Google Scholar]
- Vicente, E.; De Hoyos, C.; Sánchez, P.; Cambra, J. Protocolos de muestreo y análisis para fitoplancton. In Confederación Hidrográfica del Ebro. Metodología Para el Establecimiento del Estado Ecológico Según la Directiva del Marco del Agua; Ministerio de Medio Ambiente: Madrid, Spain, 2015. [Google Scholar]
- Lund, J.W.G.; Kipling, C.; Le Cren, E.D. The inverted microscope method of estimating algal numbers and the statistical basis of estimations by counting. Hydrobiologia 1958, 11, 143–170. [Google Scholar] [CrossRef]
- Bourrelly, P. Les Algues D’eau Douce. 3. Algues Bleues et Rouges; Éditions N. Boubée & Cie: París, France, 1970; p. 512. [Google Scholar]
- Bourrelly, P. Les Algues D’eau Douce. 1. Algues Vertes; Éditions N. Boubée & Cie: París, France, 1972; p. 572. [Google Scholar]
- Delgado, M.; Fortuño, J.M. Atlas de fitoplancton del Mar Mediterráneo. Sci. Mar. 1991, 55, 1–133. [Google Scholar]
- Krammer, K.; Lange-Bertalot, H. Süβwasserflora von Mitteleuropa. Bacillariophyceae. 1. Teil: Naviculaceae; VEB Gustav Fischer Verlag: Jena, Germany, 1986; p. 876. [Google Scholar]
- Krammer, K.; Lange-Bertalot, H. Süβwasserflora von Mitteleuropa. Bacillariophyceae. 2 Teil: Bacillariaceae, Epithemiaceae, Surirellaceae; VEB Gustav Fischer Verlag: Jena, Germany, 1986; p. 596. [Google Scholar]
- Krammer, K.; Lange-Bertalot, H. Süβwasserflora von Mitteleuropa H. Bacillariophyceae. 3. Teil: Centrales, Fragilariaceae, Eunotiaceae; VEB Gustav Fischer Verlag: Jena, Germany, 1986; p. 576. [Google Scholar]
- Krammer, K.; Lange-Bertalot, H. Süβwasserflora von Mitteleuropa. Bacillariophyceae. 4. Teil: Achnanthaceae, Kritische Ergänzungen zu Navicula (Lineolatae) und Gomphonema; VEB Gustav Fischer Verlag: Jena, Germany, 1986; p. 436. [Google Scholar]
- Schiller, J. Rabenhorst’s L. Kryptogamen-Flora von Deutschelad, Österreich un der Schweiz: Dinoflagellatae (Peridineaceae). 1. Teil; Akademische Verlagsgesellchaft M.B.M.: Leipzig, Germany, 1933. [Google Scholar]
- Schiller, J. Rabenhorst’s L. Kryptogamen-Flora von Deutschelad, Österreich un der Schweiz: Dinoflagellatae (Peridineaceae). 2. Teil; Akademische Verlagsgesellchaft M.B.M.: Leipzig, Germany, 1937. [Google Scholar]
- Streble, H.; Krauter, D. Atlas de los Microorganismos de Agua Dulce; Ediciones Omega S.A.: Barcelona, Spain, 1987. [Google Scholar]
- Witkowski, A.; Lange-Bertalot, H.; Metzeltin, D. Diatom Flora of Marine Costas I; A.R.G. Ganter Verlag Kommanditgesellschaft: Munich, Germany, 2000. [Google Scholar]
- WoRMS Editorial Board. World Register of Marine Species. Available online: http://www.marinespecies.org (accessed on 22 May 2019).
- Hammer, Ø.; Harper, D.A.T.; Ryan, P.D. PAST: Paleontological statistics software package for education and data analysis. Palaeontol. Electron. 2001, 4, 9. [Google Scholar]
- Peet, R.K. The Measurement of species diversity. Annu. Rev. Ecol. Syst. 2003, 5, 285–307. [Google Scholar] [CrossRef]
- Reyes, P.R.; Torres-Florez, J.P. Diversidad, distribución, riqueza y abundancia de condrictios de aguas profundas a través del archipiélago patagónico austral, Cabo de Hornos, Islas Diego Ramírez y el sector norte del paso Drake. Rev. Biol. Mar. Oceanogr. 2009, 44, 243–251. [Google Scholar] [CrossRef]
- Magurran, A.E. Measuring Biological Diversity; Blackwell: Hoboken, NJ, USA, 2004. [Google Scholar]
- Dzierzbicka-Głowacka, L. Modelling the seasonal dynamics of marine plankton in the southern Baltic Sea. Part 1. A coupled ecosystem model. Oceanologia 2005, 47, 591–619. [Google Scholar]
- Bąk, M.; Witkowski, A.; Lange-Bertalot, H.; Dadał, A. Ecology of the Szczecin Lagoon diatom flora with reference to the utility of diatom indices in assessing water quality. Diatom 2004, 20, 23–31. [Google Scholar]
- Witak, M. A review of the diatom research in the Gulf of Gdańsk and Vistula Lagoon (southern Baltic Sea). Oceanol. Hydrobiol. Stud. 2013, 44, 336–346. [Google Scholar] [CrossRef]
- Pilkaitytë, R.; Razinkovas, A. Seasonal changes in phytoplankton composition and nutrient limitation in a shallow Baltic lagoon. Boreal Environ. Res. 2007, 12, 551–559. [Google Scholar]
- Pilkaitytë, R. Spring-Summer transition in the Curonian lagoon (SE Baltic Sea) phytoplankton community. Transit. Waters Bull. 2007, 1, 39–47. [Google Scholar] [CrossRef]
- Siegel, H.; Gerth, M. Remote-Sensing studies of the exceptional summer of 1997 in the Baltic Sea: The warmest August of the century, the Oder flood, and phytoplankton blooms. Elsevier Oceanogr. Ser. 2000, 63, 239–255. [Google Scholar] [CrossRef]
- Alves-de-Souza, C.; Iriarte, J.L.; Mardones, J.I. Interannual variability of Dinophysis acuminata and Protoceratium reticulatum in a Chilean Fjord: Insights from the realized niche analysis. Toxins 2019, 11, 19. [Google Scholar] [CrossRef] [Green Version]
- Martínez Fernández, J.; Esteve Selma, M.A. Gestión integrada de cuencas costeras: Dinámica de los nutrientes en la cuenca del Mar Menor (sudeste de España). Rev. Din. Sist. 2007, 3, 2–23. [Google Scholar]
- Stramska, M.; Aniskiewicz, P. Recent large scale environmental changes in the Mediterranean sea and their potential impacts on Posidonia oceanica. Remote Sens. 2019, 11, 110. [Google Scholar] [CrossRef] [Green Version]
- Thamm, R.; Schernewski, G.; Wasmund, N.; Neumann, T. Spatial phytoplankton pattern in the Baltic Sea. In Coastline Reports. Baltic Sea Typology; Schernewski, G., Wielgat, M., Eds.; EUCC: Leiden, The Netherlands, 2004; pp. 85–109. [Google Scholar]
- Bustillos–Guzmán, J.J.; Band–Schmidt, C.J.; López–Cortés, D.J.; Gárate–Lizárraga, I.; Núñez–Vázquez, E.J.; Hernández–Sandoval, F.E. Variaciones en el crecimiento y toxicidad en Gymnodinium catenatum Graham del golfo de California bajo diferentes proporciones de nitrógeno y fósforo. Cienc. Mar. 2012, 38, 101–117. [Google Scholar]
- Paldaviciene, A.; Mazur-Marzec, H.; Razinkovas, A. Toxic cyanobacteria blooms in the Lithuanian part of the Curonian Lagoon. Oceanologia 2009, 51, 203–216. [Google Scholar] [CrossRef] [Green Version]
- Santoyo, H.; Signoret, M. Fitoplancton de la Laguna del Mar Muerto en el sur del Pacífico de México. Anales del Centro de Ciencias del Mar. y Limnología. 1978. Available online: http://biblioweb.tic.unam.mx/cienciasdelmar/centro/1979-2/articulo72.html (accessed on 18 June 2019).
- Vadrucci, M.R.; Fiocca, A.; Vignes, F.; Fabbrocini, A.; Roselli, L.; D’Adamo, R.; Basset, A. Dynamics of phytoplankton guilds under dystrophic pressures in Lesina lagoon. Trans. Waters Bull. 2010, 3, 33–46. [Google Scholar] [CrossRef]
- Delpy, F.; Serranito, B.; Jamet, J.; Grégori, G.J.; LePoupon, C.; Jamet, D. Pico- and Nanophytoplankton Dynamics in Two Coupled but Contrasting Coastal Bays in the NW Mediterranean Sea (France). Estuaries Coasts 2012, 41, 2039–2055. [Google Scholar] [CrossRef]
- García-Pintado, J.; Martínez-Mena, M.; González-Barberá, G.; Albaladejo, J.; Castillo, V.M. Anthropogenic nutrient sources and loads from a Mediterranean catchment into a coastal lagoon: Mar Menor, Spain. Sci. Total Environ. 2007, 373, 220–239. [Google Scholar] [CrossRef] [PubMed]
- Pilkaitytë, R.; Razinkovas, A. Factors controlling phytoplankton blooms in a temperate estuary: Nutrient limitation and physical forcing. In Marine Biodiversity. Developments in Hydrobiology; Martens, K., Queiroga, H., Cunha, M.R., Cunha, A., Moreira, M.H., Quintino, V., Rodrigues, A.M., Seroôdio, J., Warwick, R.M., Eds.; Springer: Dordrecht, The Netherlands, 2006; pp. 41–48. [Google Scholar]
- Faz Cano, A.; Lobera Lössel, J.B.; Mora Navarro, J.; Simón Andreu, P. 5. Depuración y descontaminación de aguas. In Informe Integral Sobre el Estado Ecológico del Mar Menor; Comité de Asesoramiento Científico del Mar Menor: Madrid, Spain, 2017; pp. 113–125. [Google Scholar]
- Dimitrieva, O.A.; Semenova, A.S. Seasonal dynamics and trophic interactions of phytoplankton and zooplankton in the Vistula Lagoon of the Baltic Sea. Oceanology 2012, 52, 785–789. [Google Scholar] [CrossRef]
Figure 1.
Map of the Mar Menor lagoon with the location of the sampling points, on a scale of 1/152,000 (own elaboration).
Figure 1.
Map of the Mar Menor lagoon with the location of the sampling points, on a scale of 1/152,000 (own elaboration).

Figure 2.
Microscopic images of a specimen of Tripos furca. Left, normal vision; right, Nomarski differential contrast.
Figure 2.
Microscopic images of a specimen of Tripos furca. Left, normal vision; right, Nomarski differential contrast.
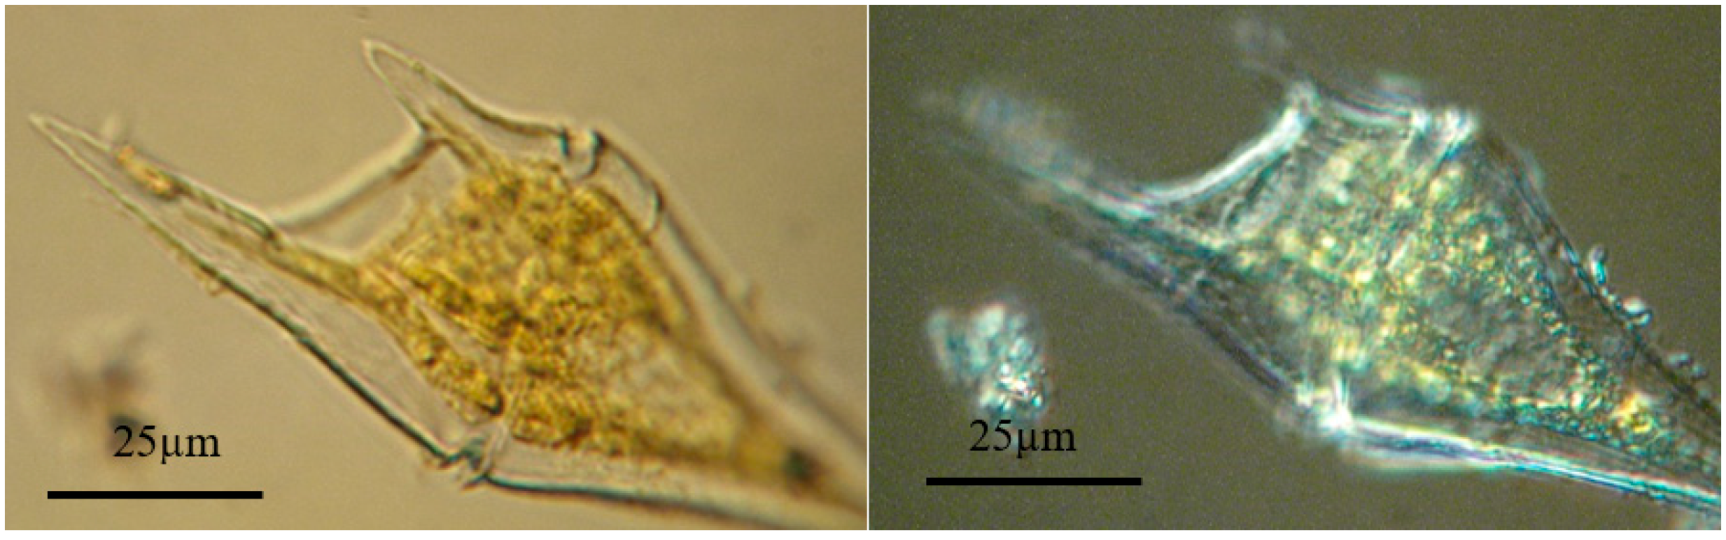
Figure 3.
Annual evolution during 2017 at central site A3 of environmental variables: Temperature (Temp, °C), Turbidity (Turb, FTU), Chlorophyll-a concentration (Chl-a, µg/L), Dissolved Oxygen (Oxig, mg/L), and Salinity (Sal, PSU).
Figure 3.
Annual evolution during 2017 at central site A3 of environmental variables: Temperature (Temp, °C), Turbidity (Turb, FTU), Chlorophyll-a concentration (Chl-a, µg/L), Dissolved Oxygen (Oxig, mg/L), and Salinity (Sal, PSU).
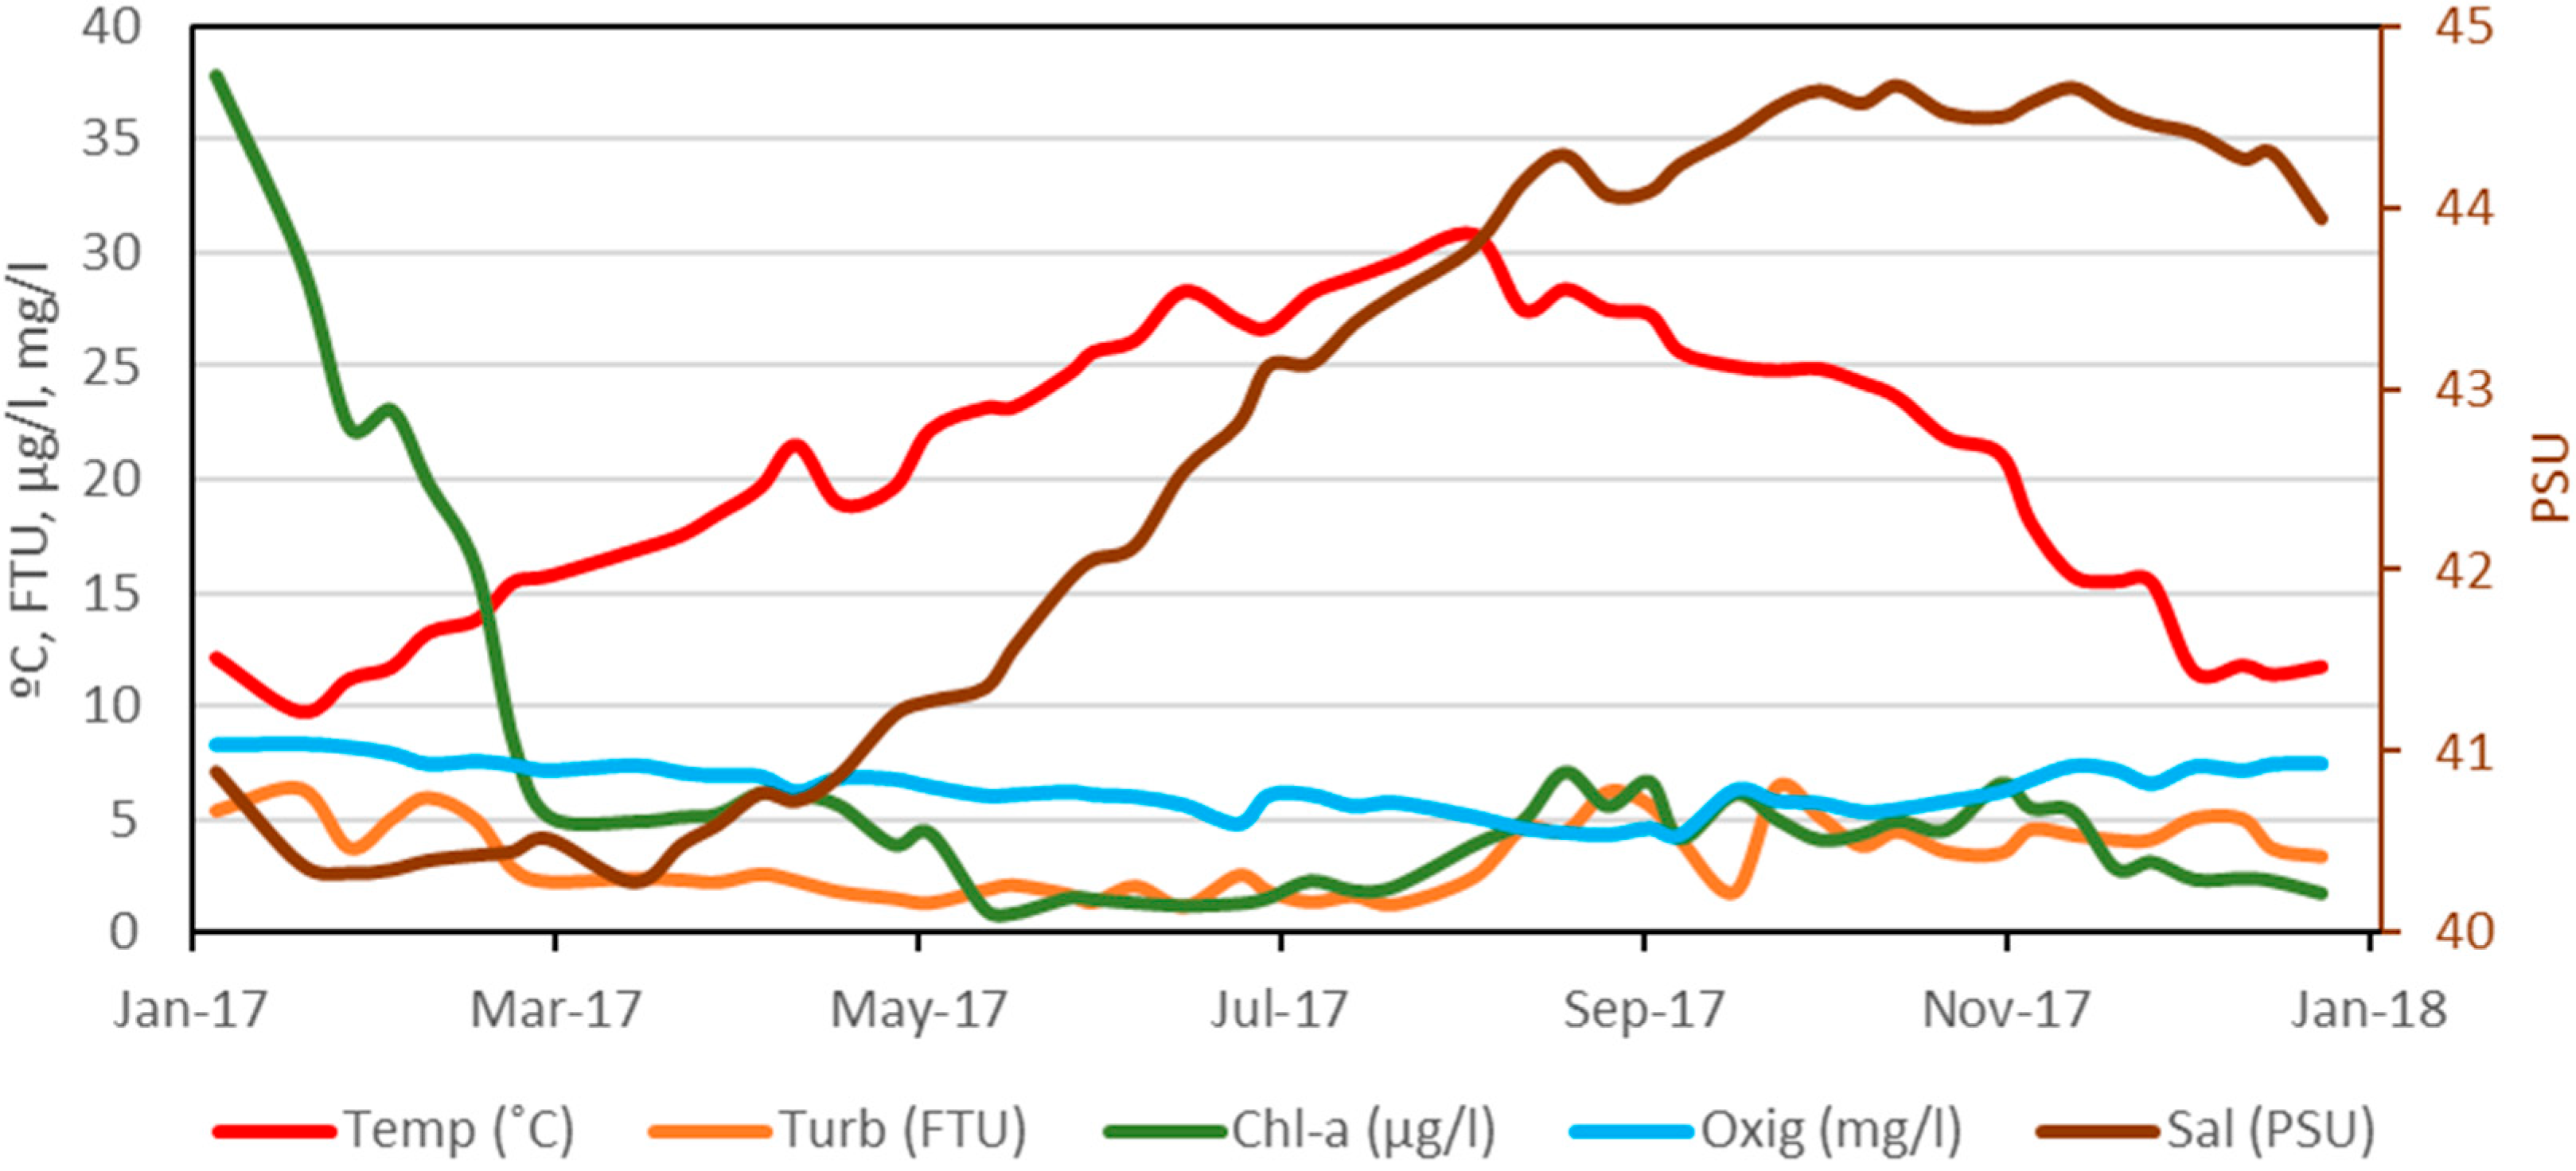
Figure 4.
Thematic maps of Chlorophyll-a concentration (µg/L) in surface of Mar Menor lagoon in the dates of 2017 indicated below each image. Note that the red area in North corresponds to the salt evaporation ponds of San Pedro del Pinatar.
Figure 4.
Thematic maps of Chlorophyll-a concentration (µg/L) in surface of Mar Menor lagoon in the dates of 2017 indicated below each image. Note that the red area in North corresponds to the salt evaporation ponds of San Pedro del Pinatar.

Figure 5.
Map of the Mar Menor lagoon with the density graphs of the different classes of phytoplankton found in each sample on 8th May and 25th June. The total density of the sample is annotated on each graph. “Others” includes the classes Conjugatophyceae, Pedinophyceae, Euglenophyceae, Diphylleida, and Thecofilosea, which appear in very low densities.

Figure 6.
Map of the Mar Menor lagoon with the density graphs of the different classes of phytoplankton found in each sample on 1st September and 21st October. The total density of the sample is annotated on each graph.
Figure 6.
Map of the Mar Menor lagoon with the density graphs of the different classes of phytoplankton found in each sample on 1st September and 21st October. The total density of the sample is annotated on each graph.

Figure 7.
Map of the Mar Menor lagoon with the density graphs of the different classes of phytoplankton found in each sample on 28th October and 9th December. The total density of the sample is annotated on each graph.
Figure 7.
Map of the Mar Menor lagoon with the density graphs of the different classes of phytoplankton found in each sample on 28th October and 9th December. The total density of the sample is annotated on each graph.

Figure 8.
Cluster of correlations between site sampling points. Groups are labeled as 1 to 4. Each color corresponds to the same sampling site as Figure 1.
Figure 8.
Cluster of correlations between site sampling points. Groups are labeled as 1 to 4. Each color corresponds to the same sampling site as Figure 1.

Figure 9.
Scatter plot of the sampling points on axes 1 and 2, obtained with the CCA among taxa and environmental variables: Turbidity (Turb), Chlorophyll-a (Chl-a), and Transparency (Secchi). Each sampling point is identified with its location and date according to Figure 1.
Figure 9.
Scatter plot of the sampling points on axes 1 and 2, obtained with the CCA among taxa and environmental variables: Turbidity (Turb), Chlorophyll-a (Chl-a), and Transparency (Secchi). Each sampling point is identified with its location and date according to Figure 1.
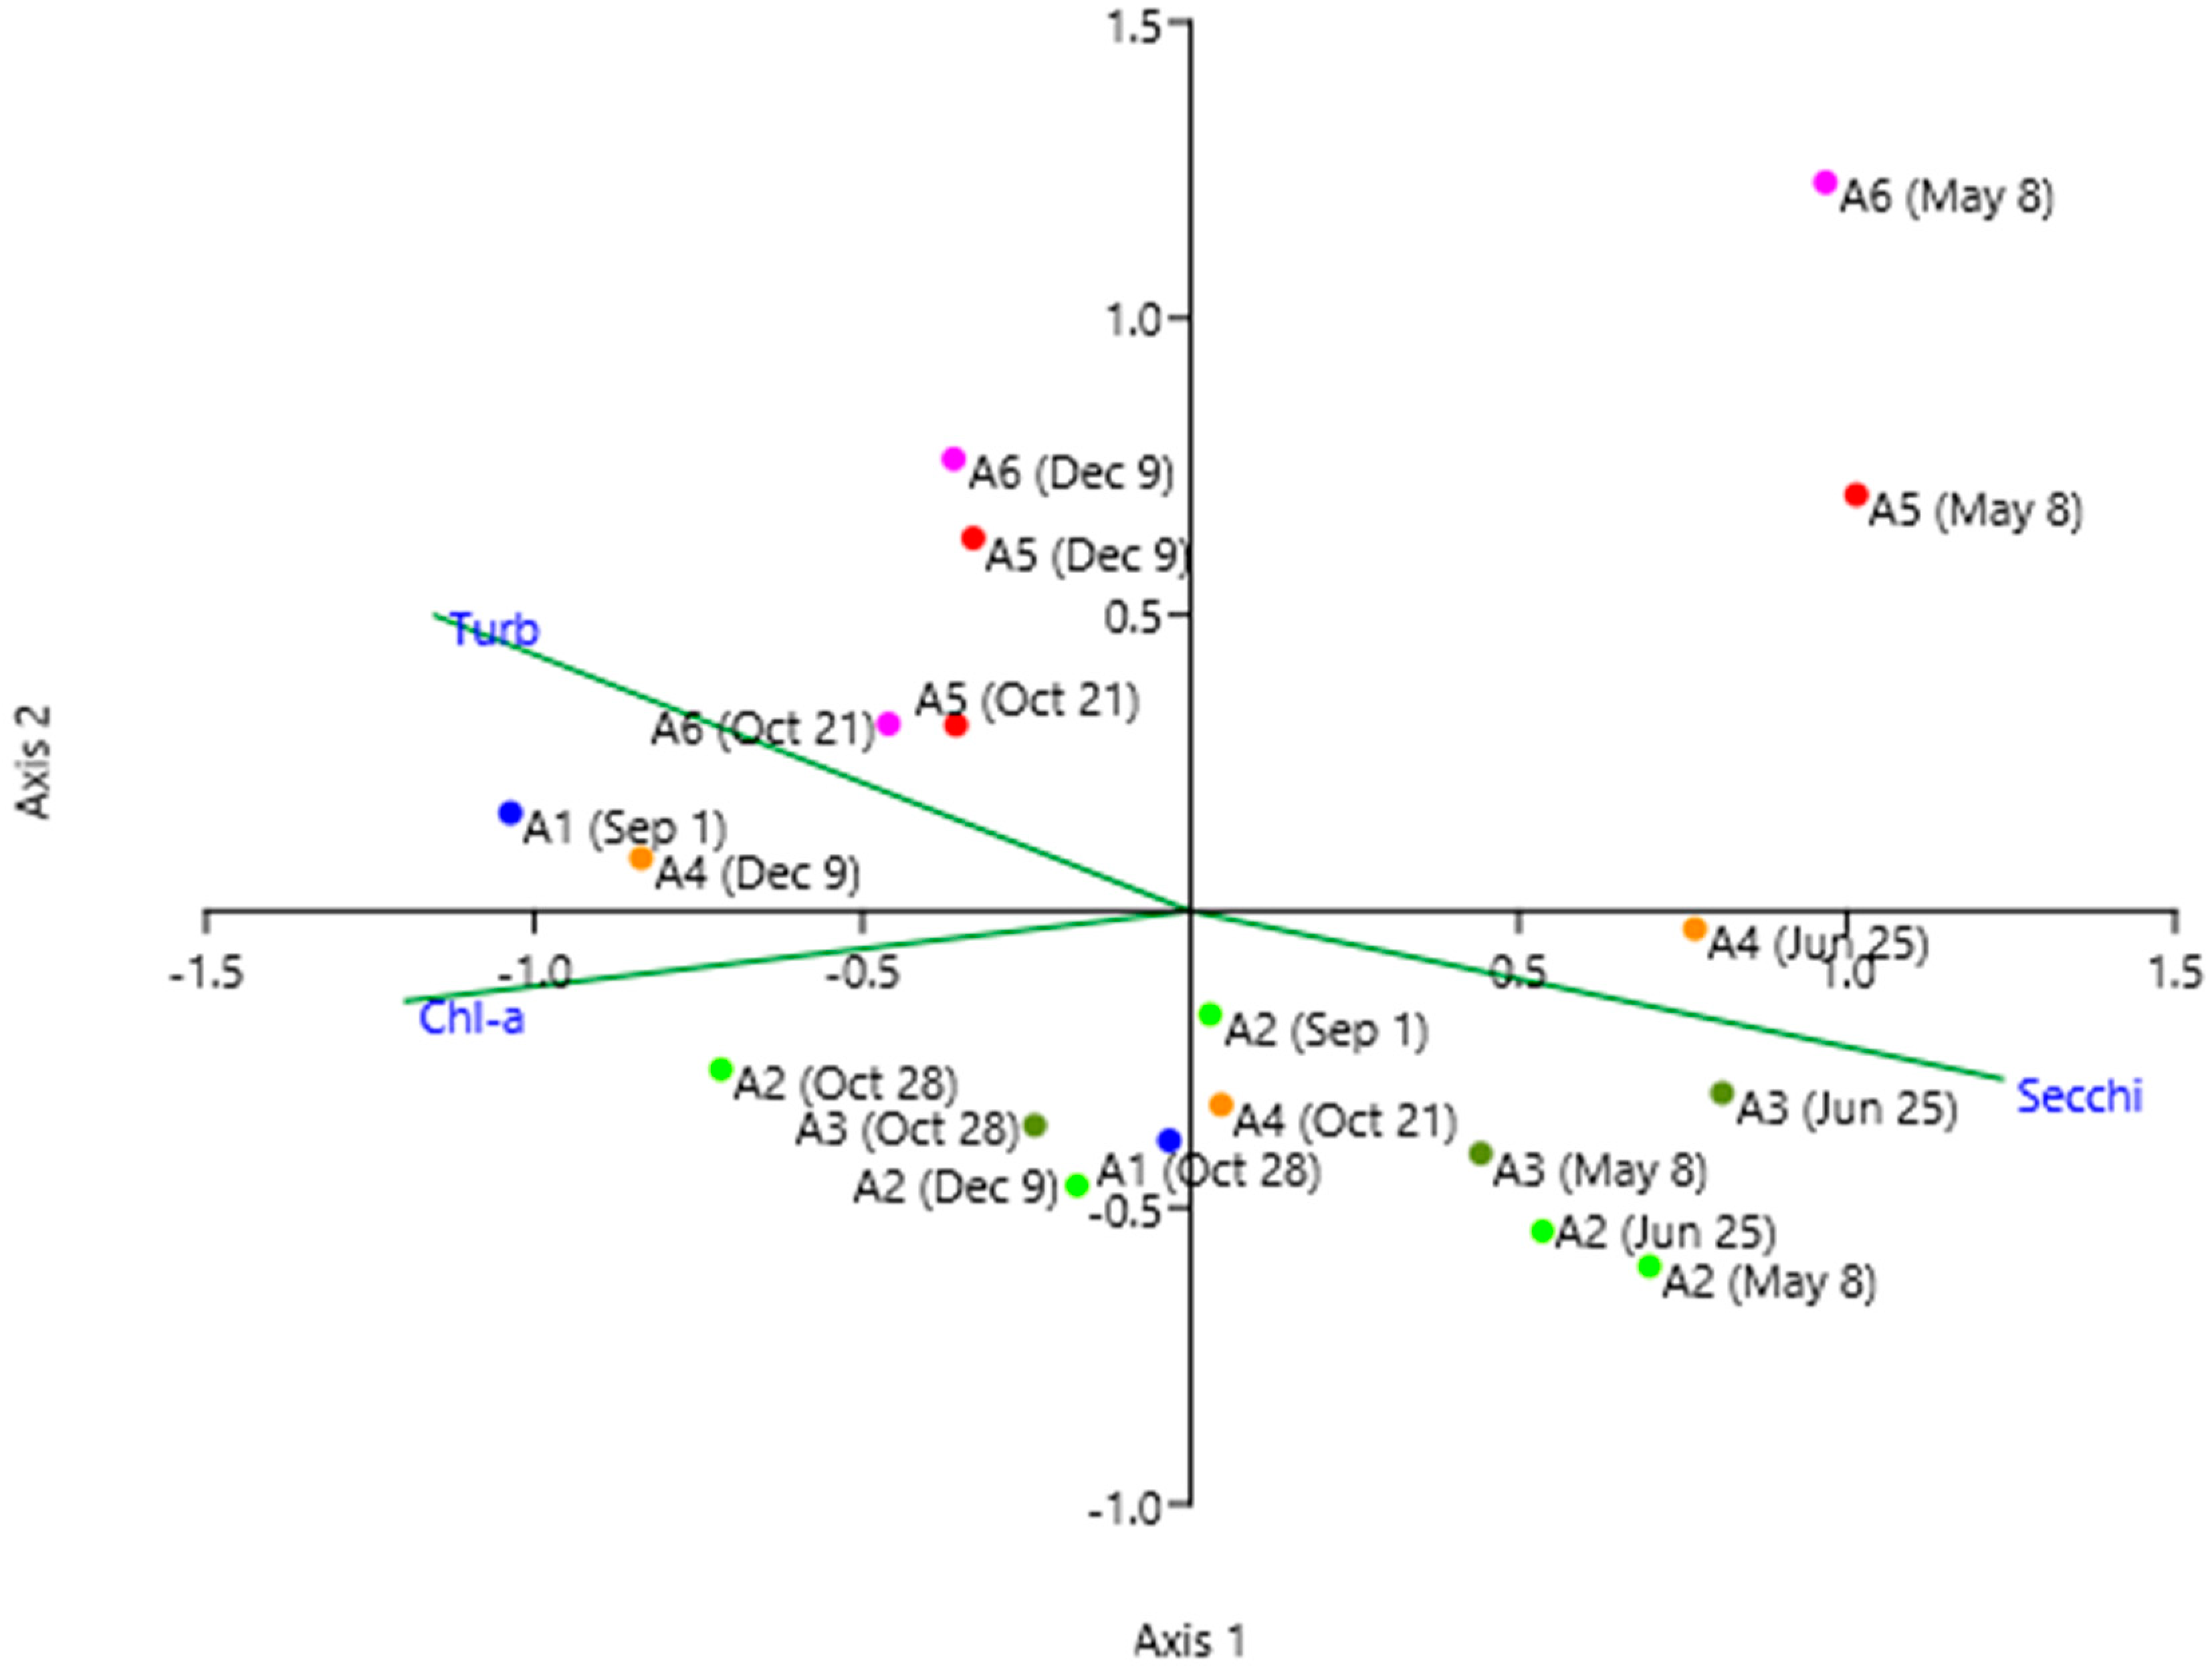
Figure 10.
Scatter plot of the sampling points in the space of the principal components 1 and 2. Each sampling point is identified with its location and date according to Figure 1. Groups are labeled according to Figure 8.

Table 1.
Descriptive and diversity analysis. Values of chlorophyll-a (Chl-a) concentration, transparency (Secchi disk depth), phytoplankton density of the sample (Density). For the analysis of diversity, data on the richness (S), diversity (H′), and equitability (J) have been included. Sampling points as indicated in Figure 1.
| Sample | Date | Chl-a (µg/L) | Secchi Disk Depth (m) | Density (cells/mL) | S | H’ | J |
|---|---|---|---|---|---|---|---|
| A1 | 1st Sep | 13.0 | 1.3 | 67,335 | 39 | 0.19 | 0.05 |
| 28th Oct | 7.0 | 2.3 | 7522 | 26 | 1.39 | 0.43 | |
| A2 | 8th May | 4.5 | 5.3 | 8082 | 31 | 1.21 | 0.35 |
| 25th Jun | 2.4 | 3.6 | 3919 | 24 | 1.40 | 0.44 | |
| 1st Sep | 9.0 | 1.3 | 20,666 | 17 | 1.61 | 0.57 | |
| 28th Oct | 7.9 | 2.1 | 21,568 | 20 | 0.52 | 0.17 | |
| 9th Dec | 6.2 | 1.9 | 7857 | 23 | 1.23 | 0.39 | |
| A3 | 8th May | 2.0 | 4.4 | 8937 | 37 | 1.12 | 0.31 |
| 25th Jun | 0.3 | 4.5 | 4073 | 19 | 1.29 | 0.44 | |
| 28th Oct | 10.7 | 1.6 | 8294 | 31 | 1.03 | 0.30 | |
| A4 | 25th Jun | 0.1 | 4.7 | 3024 | 26 | 1.08 | 0.33 |
| 21st Oct | 7.9 | 1.9 | 7598 | 22 | 1.22 | 0.39 | |
| 9th Dec | 6.1 | 1.9 | 60,219 | 14 | 0.23 | 0.09 | |
| A5 | 8th May | 1.2 | 3.7 | 2536 | 28 | 1.49 | 0.45 |
| 21st Oct | 7.7 | 1.5 | 12,863 | 18 | 0.74 | 0.25 | |
| 9th Dec | 4.3 | 1.7 | 36,274 | 17 | 0.26 | 0.09 | |
| A6 | 8th May | 2.2 | 3.1 | 2651 | 28 | 1.87 | 0.56 |
| 21st Oct | 8.1 | 1.8 | 11,074 | 25 | 0.65 | 0.20 | |
| 9th Dec | 5.2 | 1.8 | 41,579 | 15 | 0.12 | 0.04 |
© 2020 by the authors. Licensee MDPI, Basel, Switzerland. This article is an open access article distributed under the terms and conditions of the Creative Commons Attribution (CC BY) license (http://creativecommons.org/licenses/by/4.0/).
Share and Cite
MDPI and ACS Style
Soria, J.; Caniego, G.; Hernández-Sáez, N.; Dominguez-Gomez, J.A.; Erena, M. Phytoplankton Distribution in Mar Menor Coastal Lagoon (SE Spain) during 2017. J. Mar. Sci. Eng. 2020, 8, 600. https://doi.org/10.3390/jmse8080600
AMA Style
Soria J, Caniego G, Hernández-Sáez N, Dominguez-Gomez JA, Erena M. Phytoplankton Distribution in Mar Menor Coastal Lagoon (SE Spain) during 2017. Journal of Marine Science and Engineering. 2020; 8(8):600. https://doi.org/10.3390/jmse8080600
Chicago/Turabian StyleSoria, Juan, Gema Caniego, Nuria Hernández-Sáez, Jose Antonio Dominguez-Gomez, and Manuel Erena. 2020. "Phytoplankton Distribution in Mar Menor Coastal Lagoon (SE Spain) during 2017" Journal of Marine Science and Engineering 8, no. 8: 600. https://doi.org/10.3390/jmse8080600
Note that from the first issue of 2016, this journal uses article numbers instead of page numbers. See further details here.