Combined Floating Offshore Wind and Solar PV


Abstract
1. Introduction
2. Materials and Methods
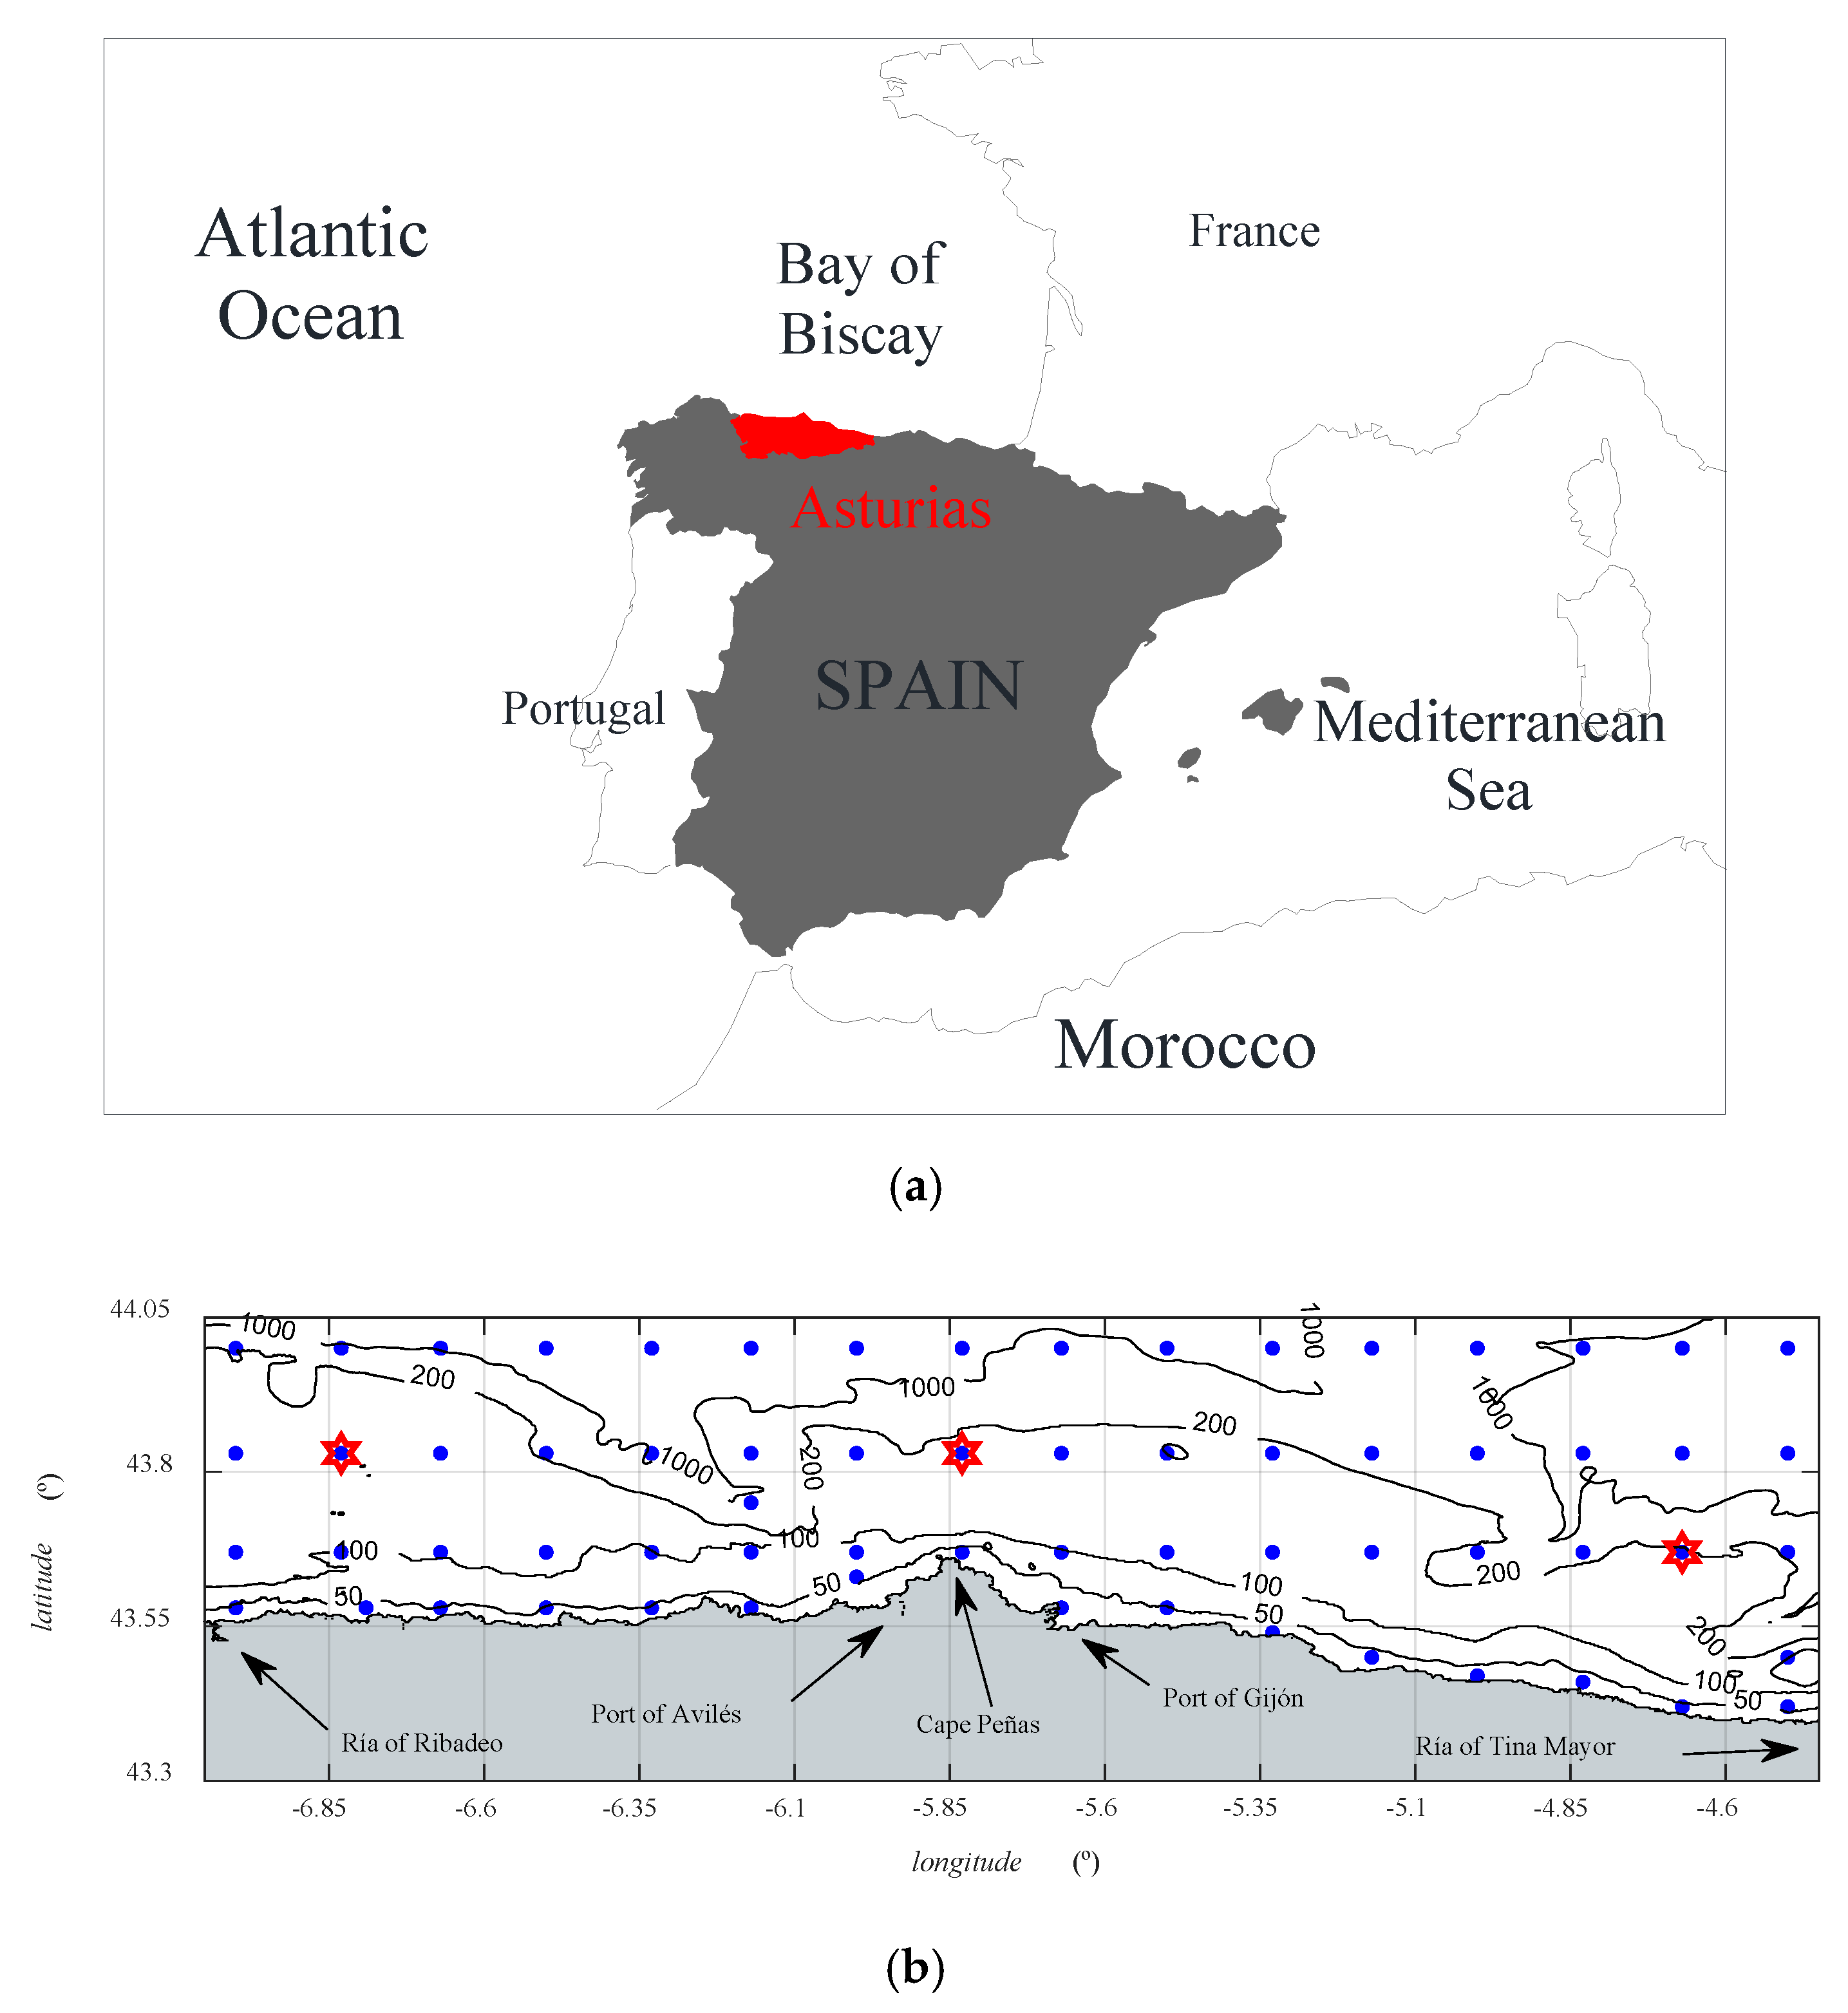
2.1. Study Area
2.2. Spatial Data
2.2.1. SIMAR Dataset
2.2.2. POWER Dataset
2.3. Conversion Technology Overview
2.3.1. Offshore Wind Energy
- tension leg platforms (or simply TLPs), in which a light structure is semi-submerged and anchored to the seabed through tensioned mooring lines for stability;
- spar buoys, in which a very large cylindrical buoy stabilizes the wind turbine using ballast (the center of gravity is much lower than the center of buoyancy), e.g., Hywind; and
- semi-submersible, in which the main principles of the two previous designs are combined, i.e., a semi-submerged structure is added to reach the necessary stability (e.g., Wind-Float).
2.3.2. Offshore FPV Energy
2.4. Parameter Estimation and Definition
2.4.1. Wind Energy Assessment
2.4.2. Solar Energy Assessment
2.4.3. Specific Yield
2.4.4. Power Output Variability and Power Smoothing (PS) Index
3. Results and Discussion
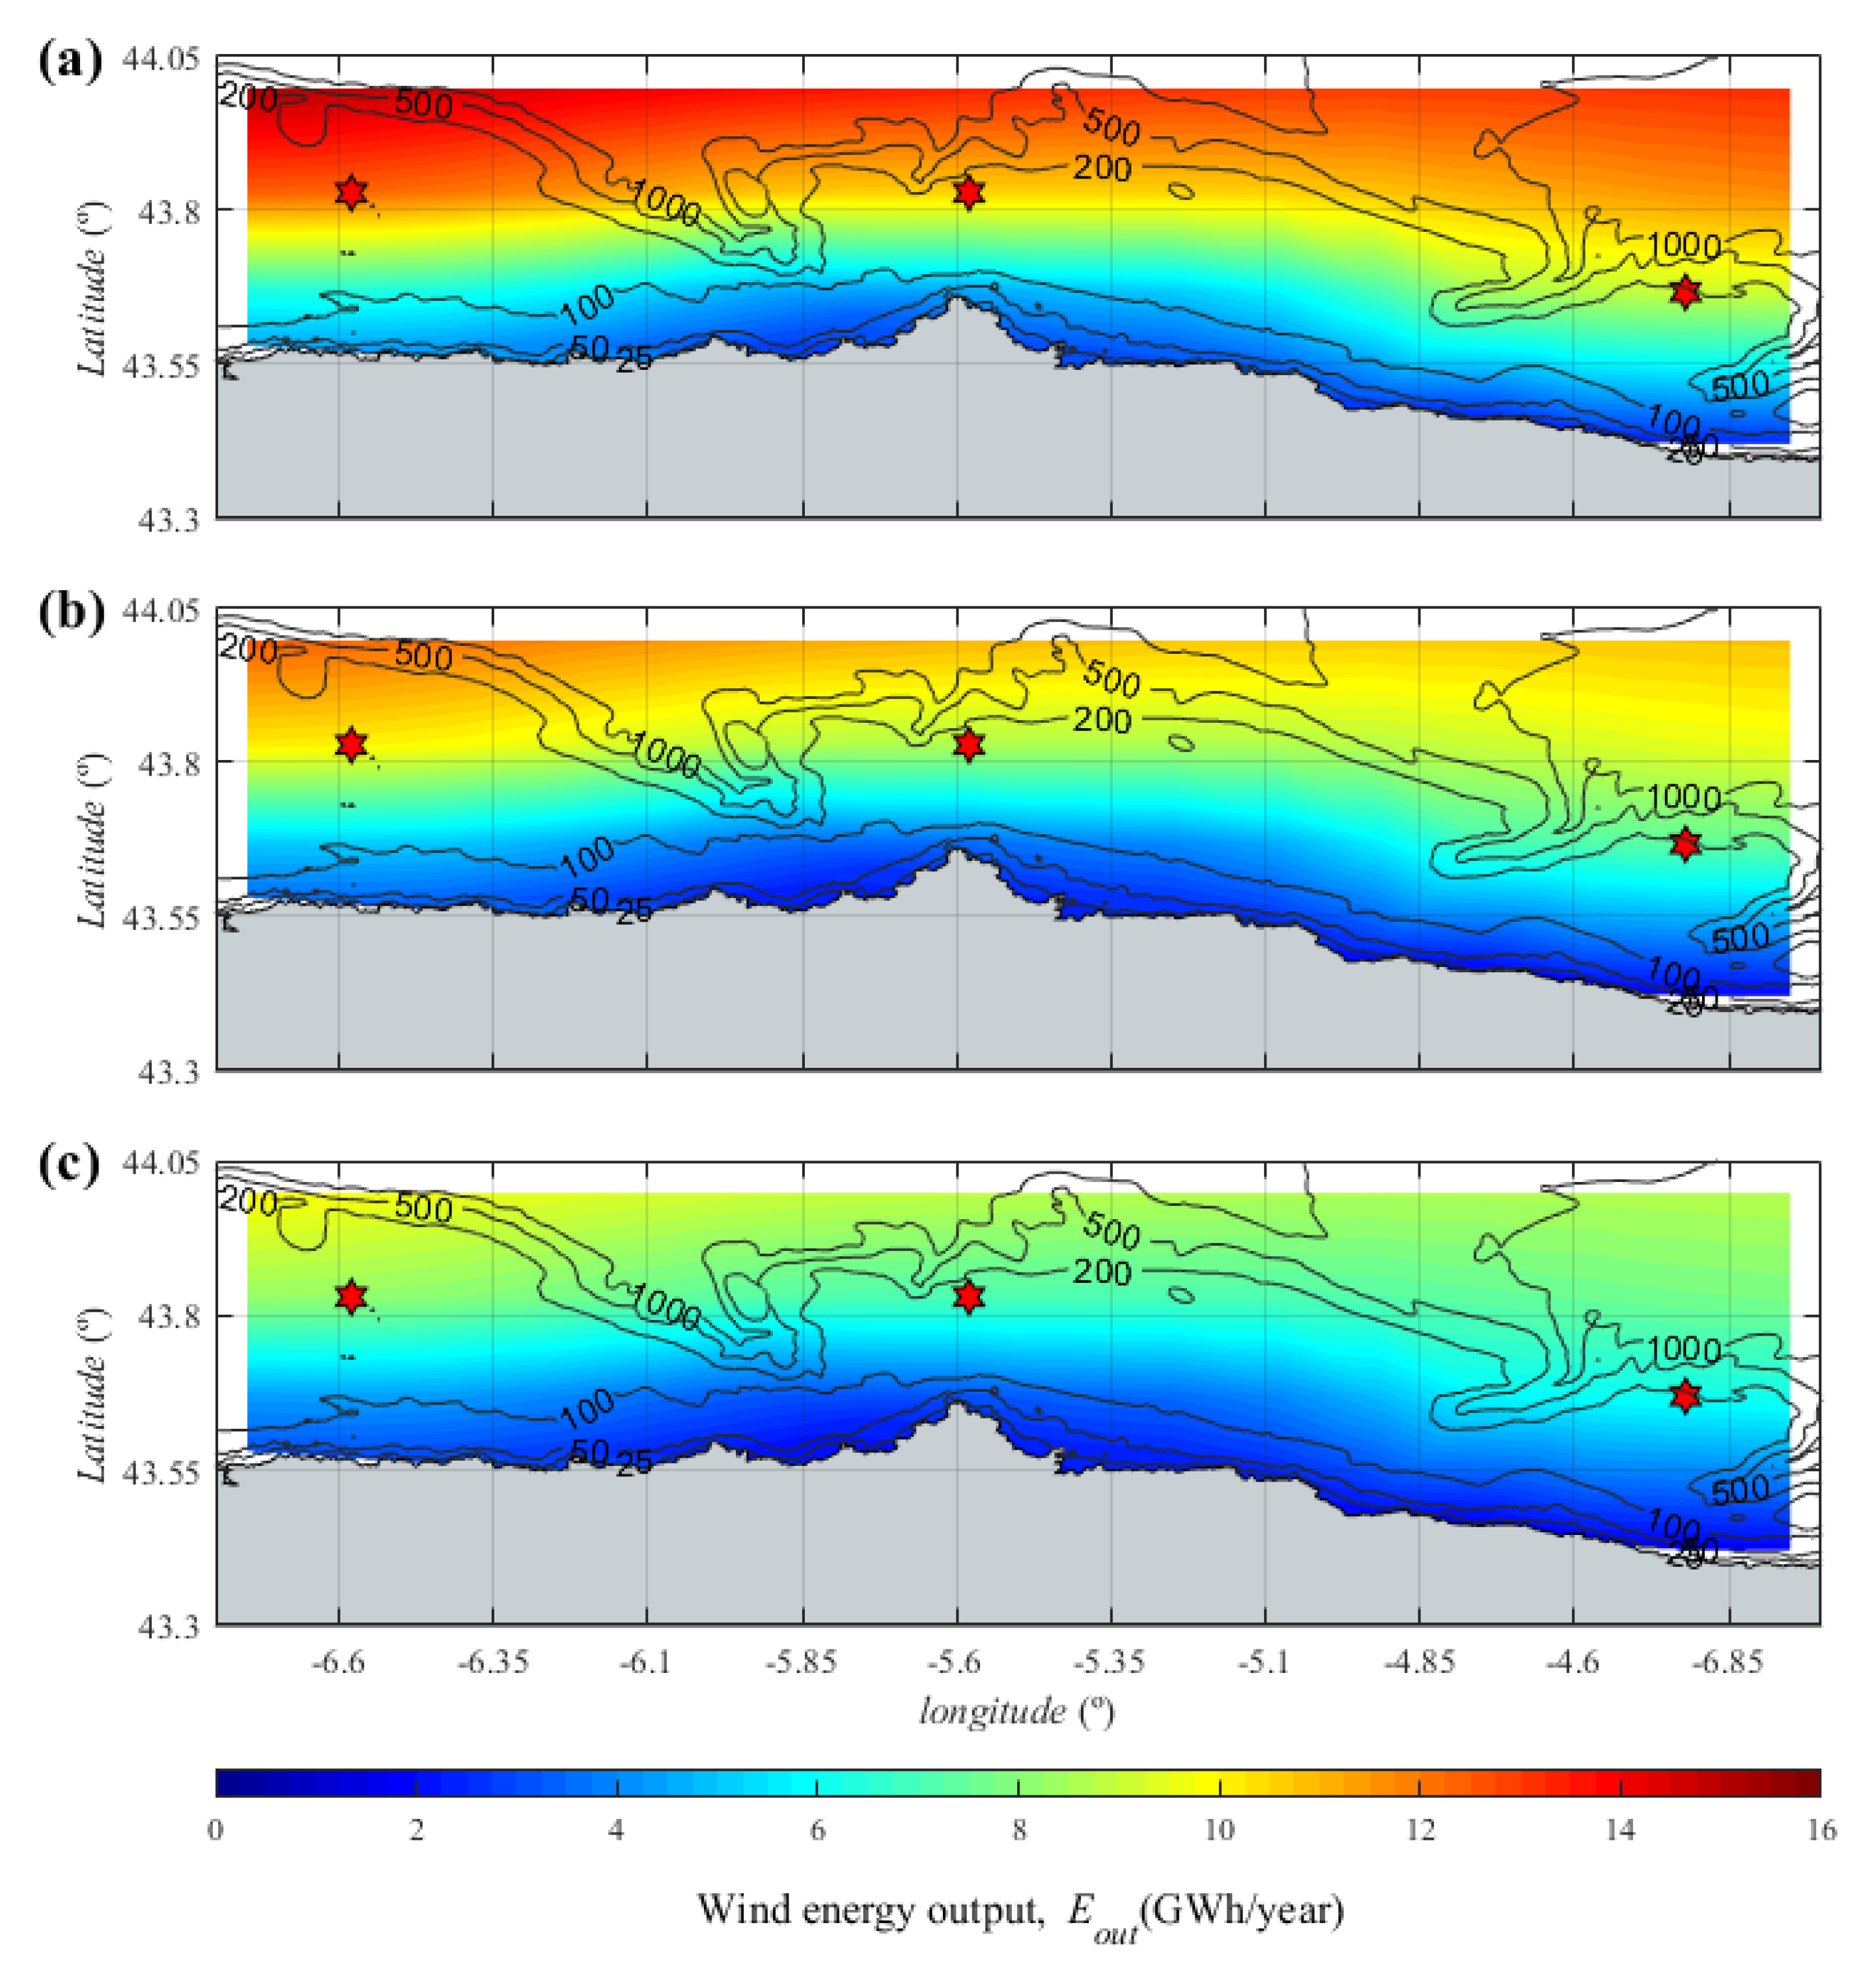
3.1. Offshore Wind Energy
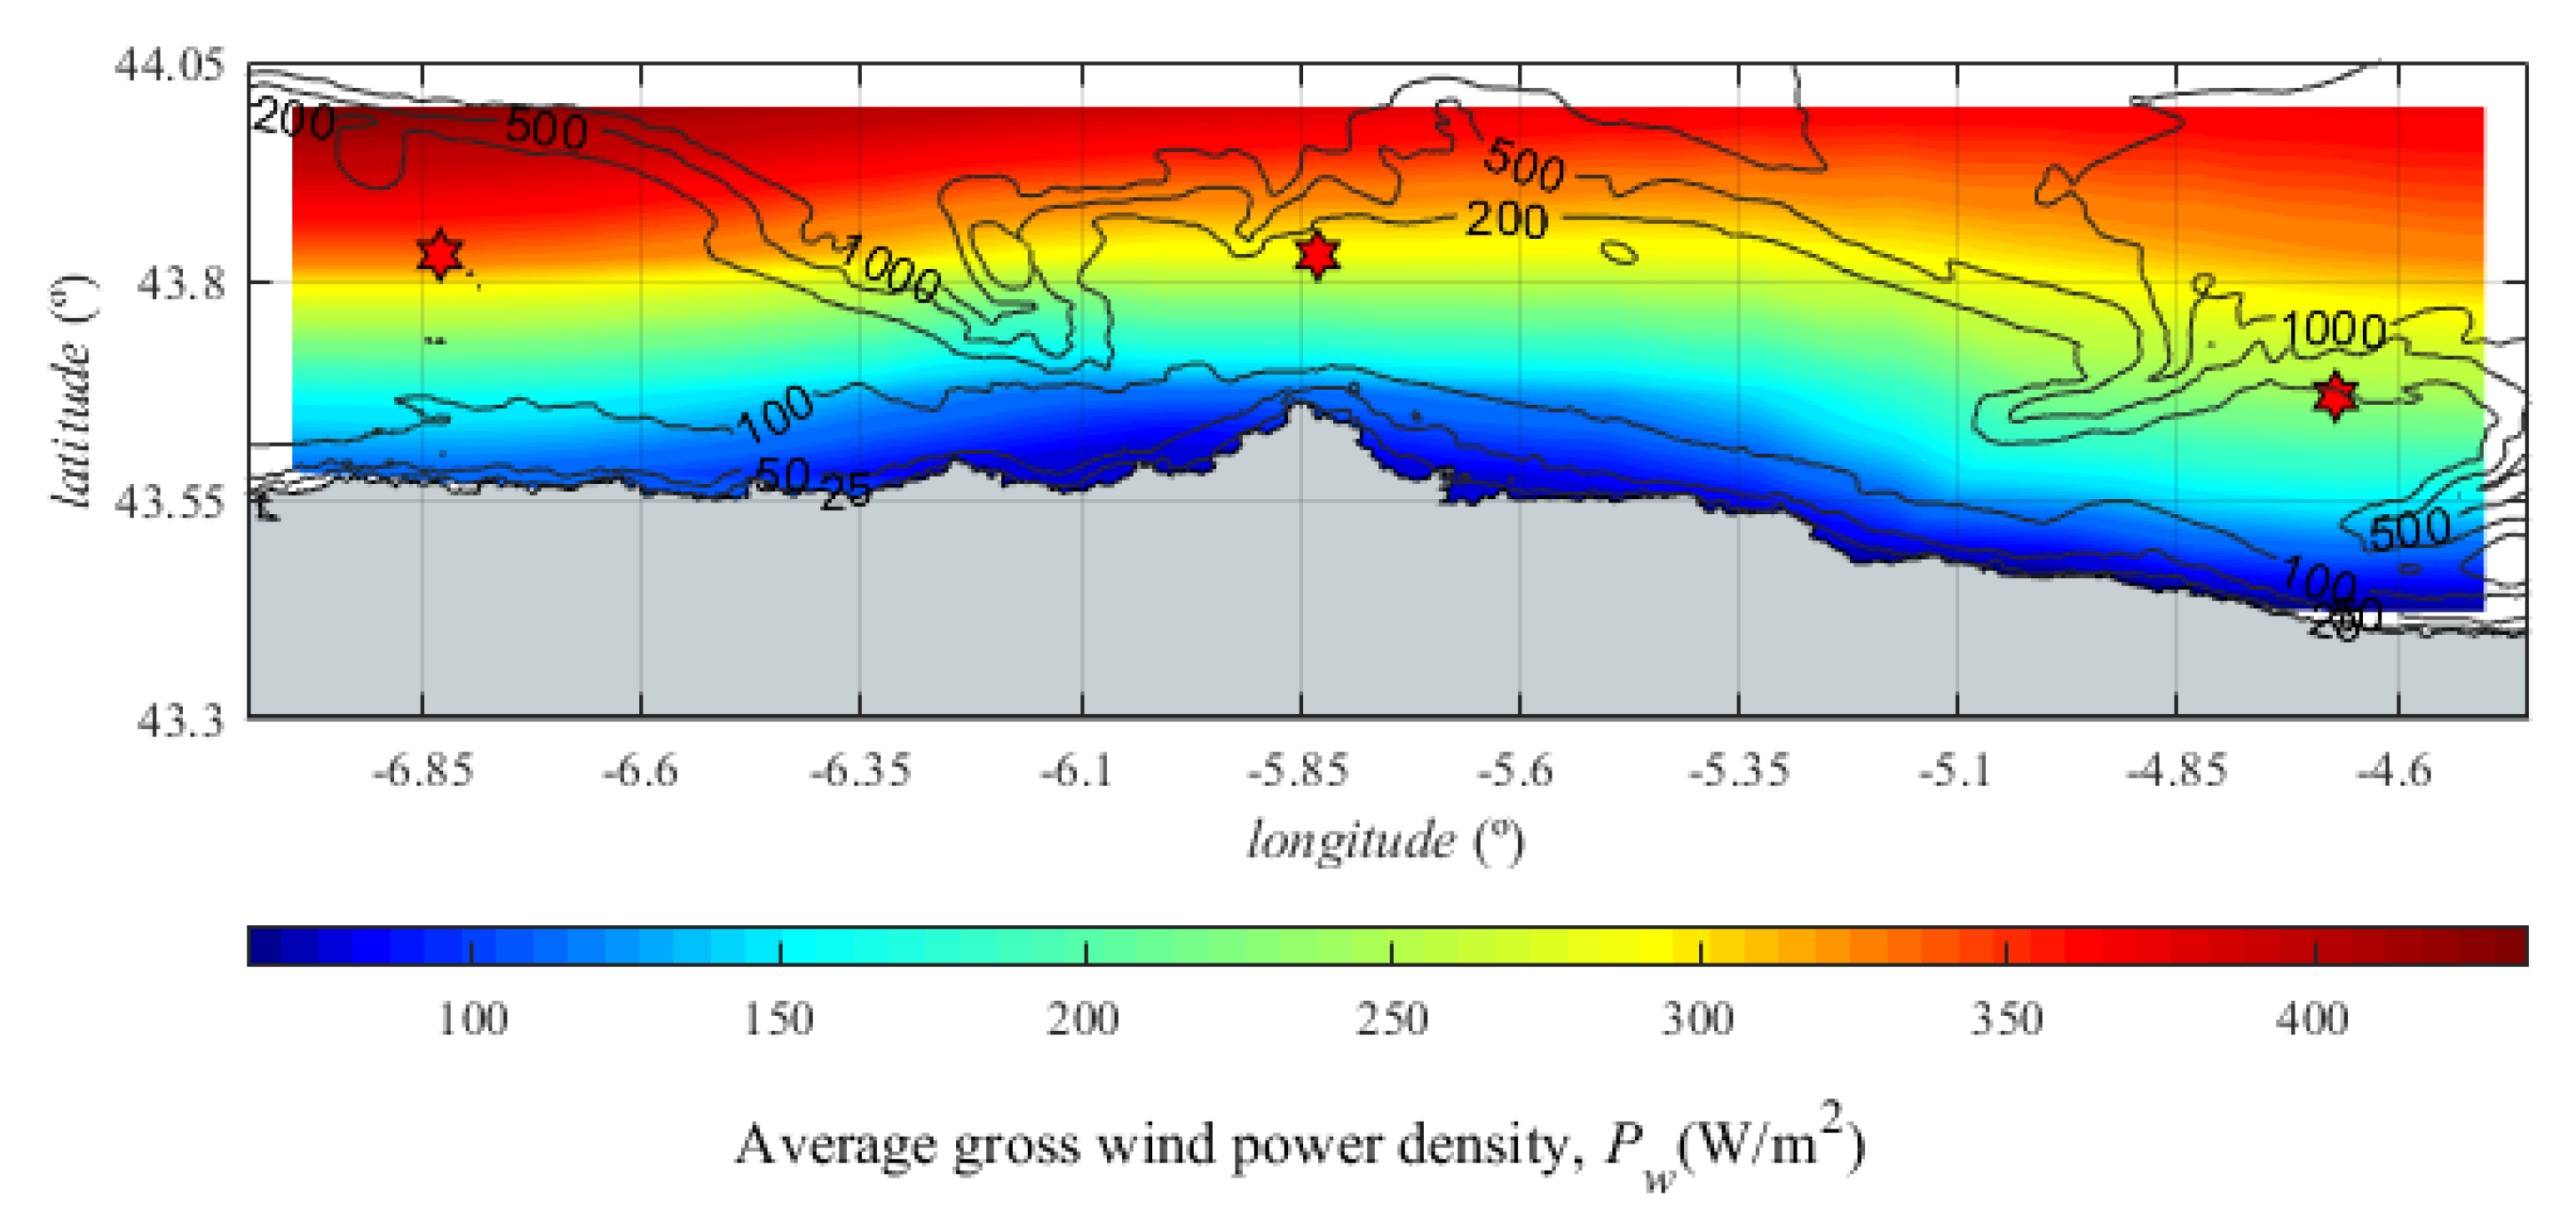
3.1.1. Gross Resource
3.1.2. Performance Analysis
3.2. Offshore FPV Energy
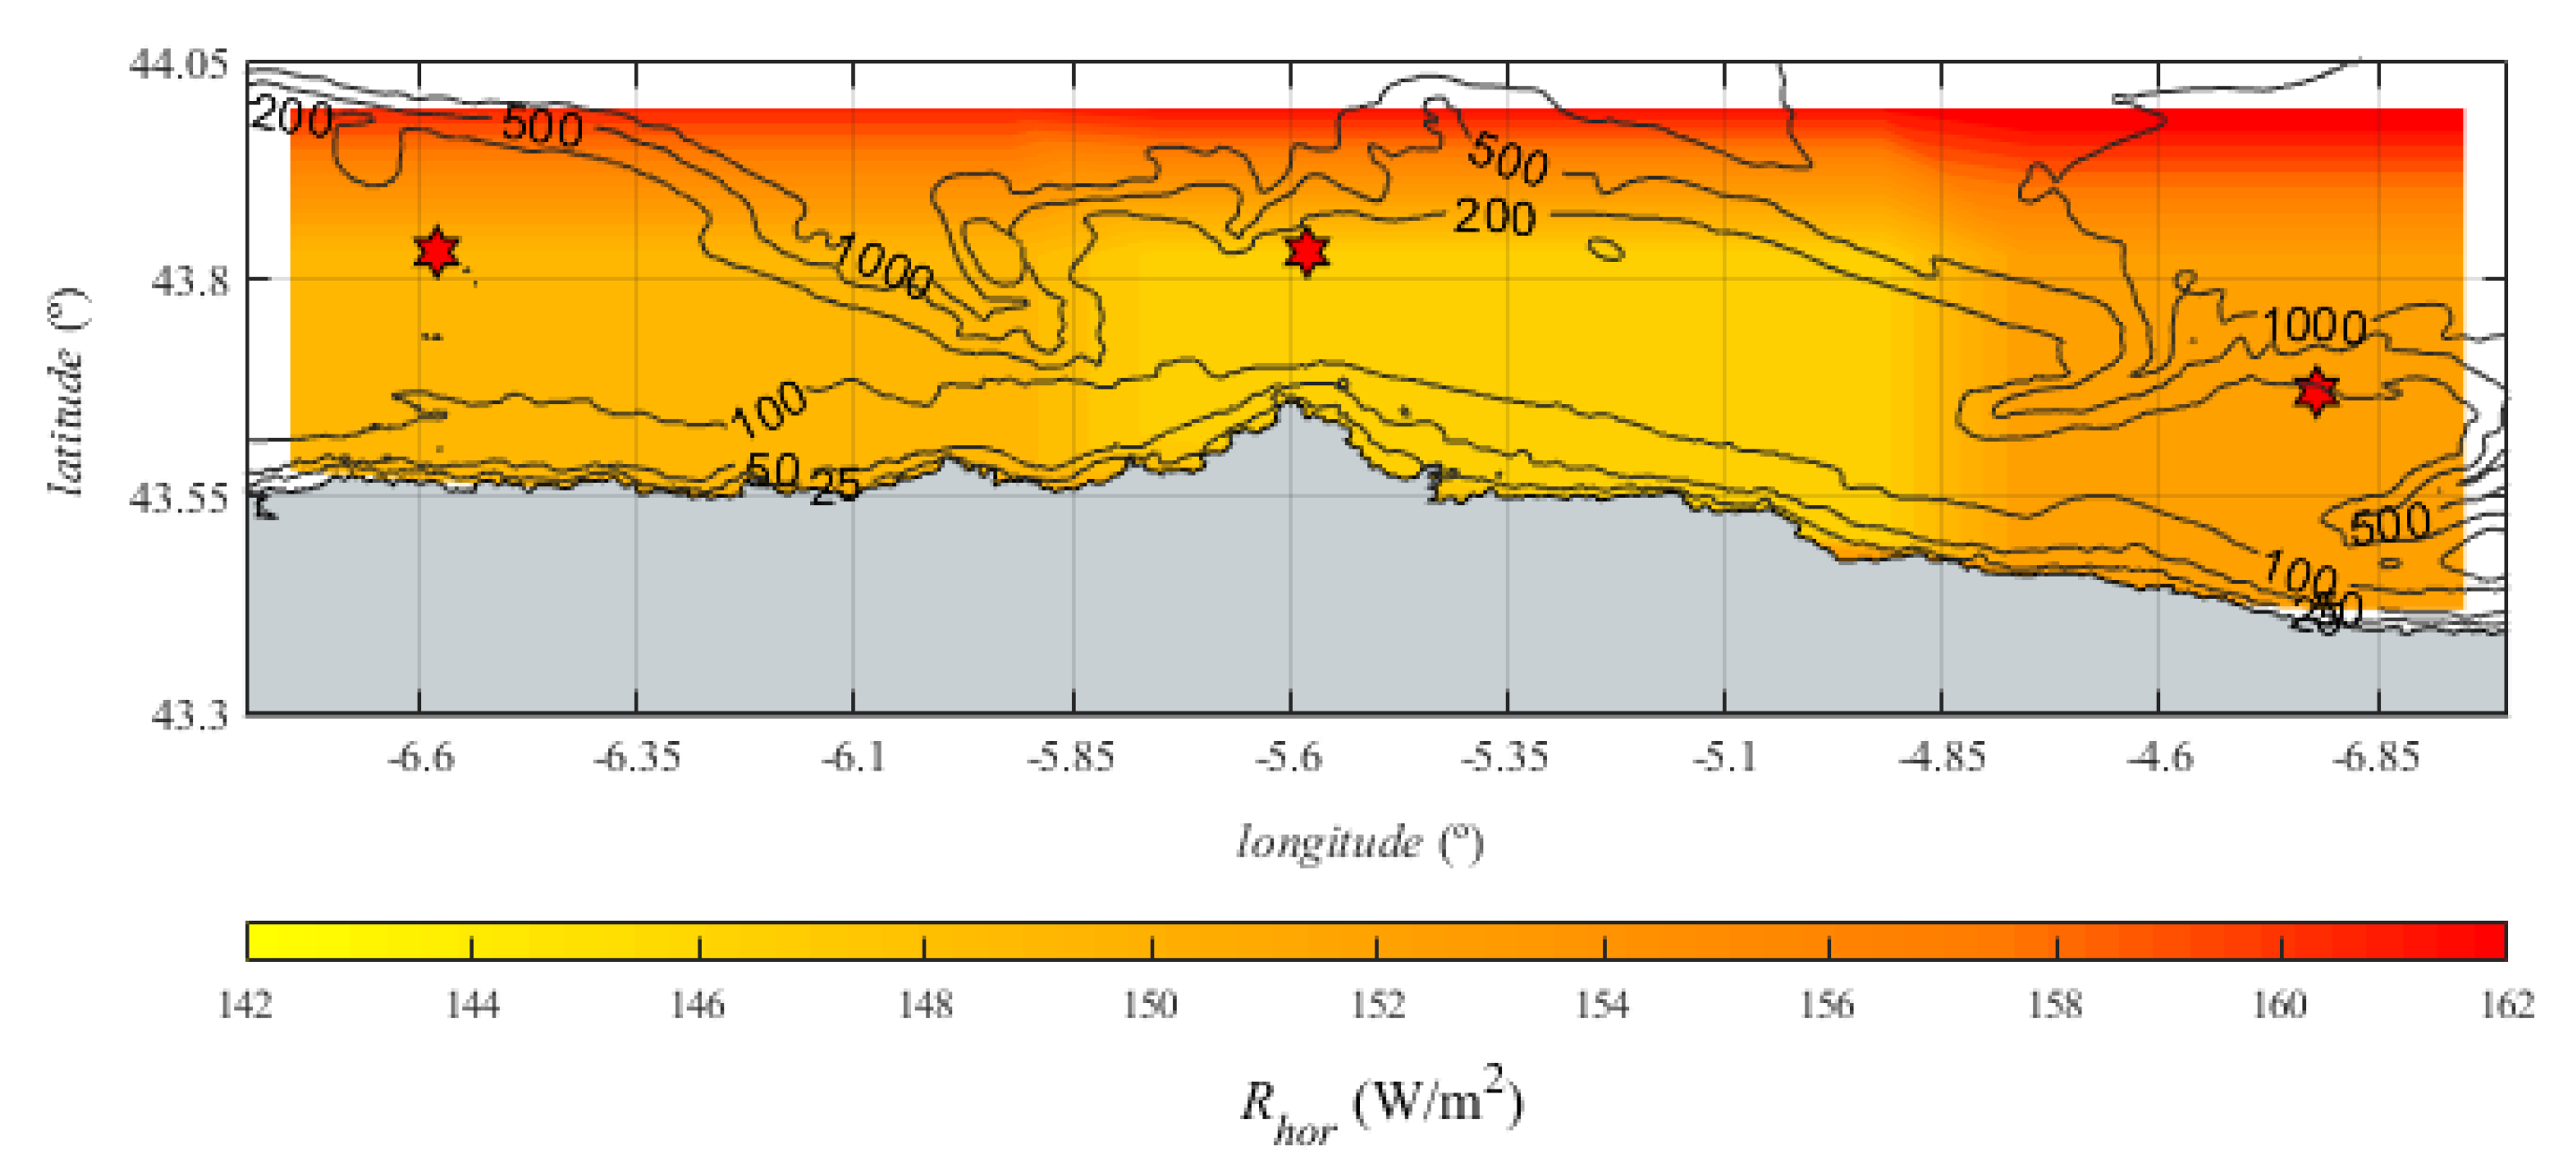
3.2.1. Gross Resource
3.2.2. Performance Analysis
3.3. Comparative Analysis
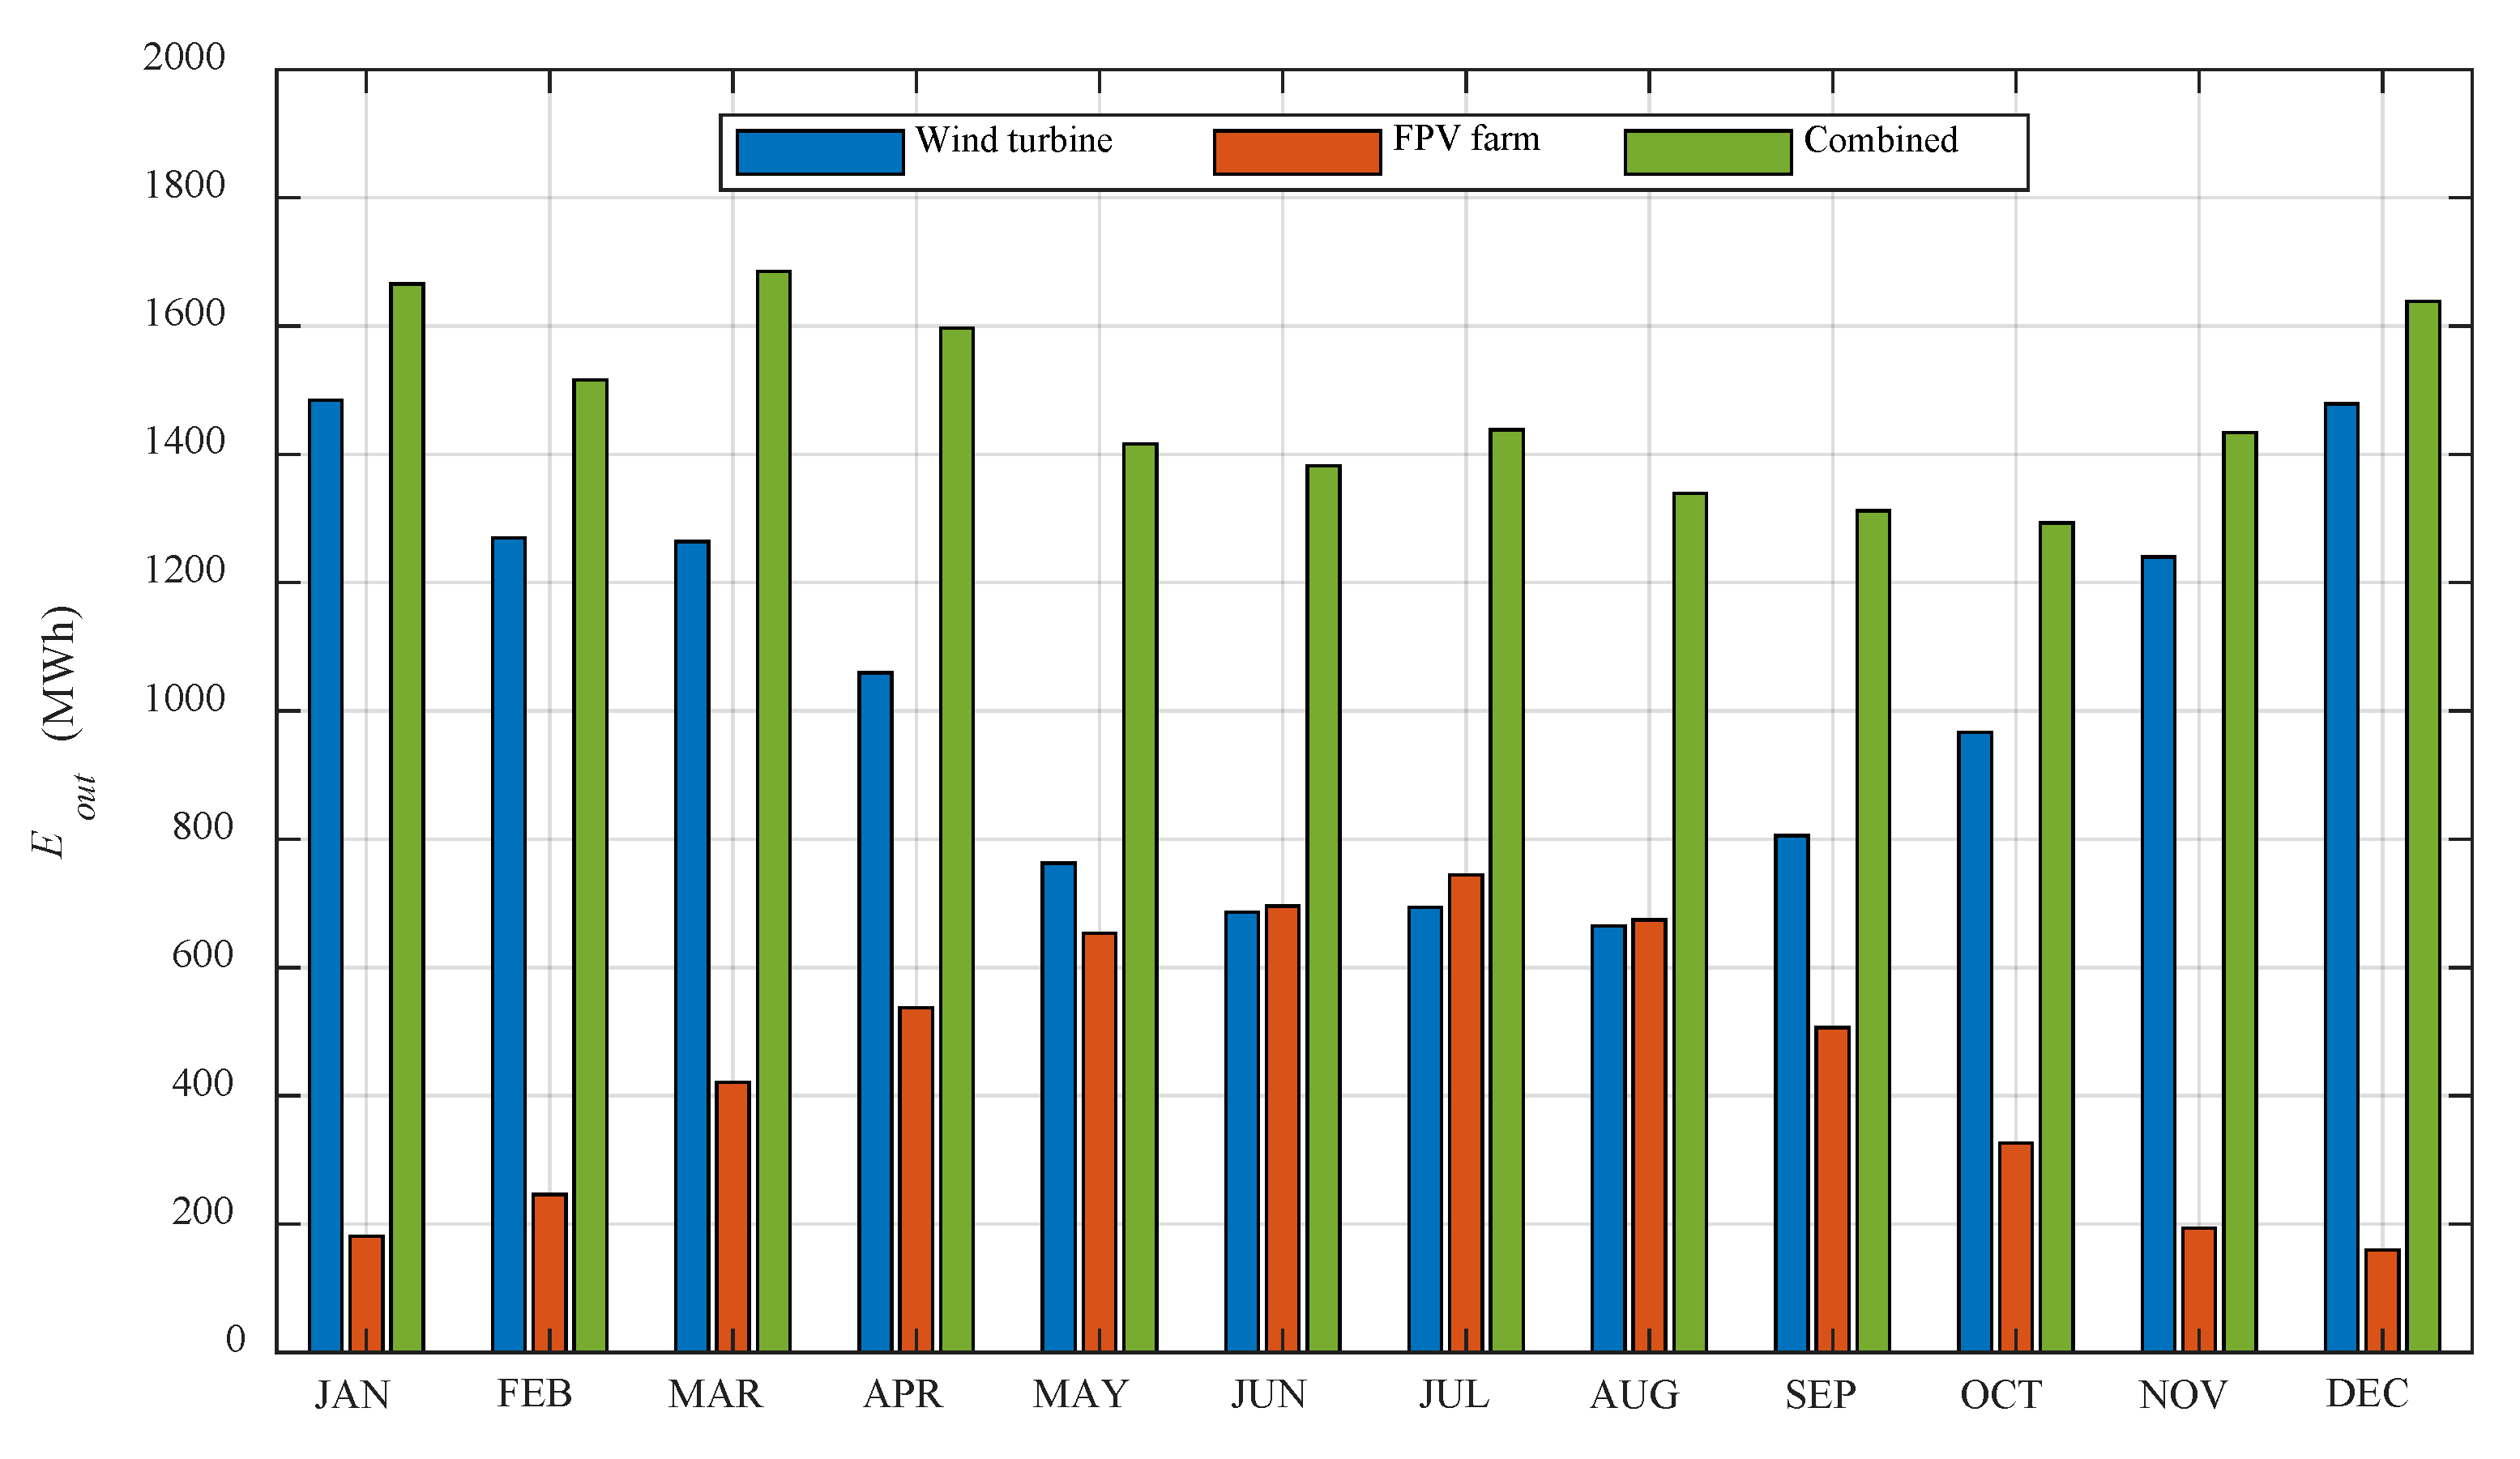
3.4. Combined Offshore Wind and FPV Farm
4. Conclusions
Author Contributions
Funding
Acknowledgments
Conflicts of Interest
References
- Pedersen, P.T. Marine Structures: Future Trends and the Role of Universities. Engineering 2015, 1, 131–138. [Google Scholar] [CrossRef][Green Version]
- Taveira-Pinto, F.F.; Iglesias, G.; Rosa-Santos, P.; Deng, Z.D. Preface to Special Topic: Marine Renewable Energy. J. Renew. Sustain. Energy 2015, 7, 5. [Google Scholar] [CrossRef]
- Iglesias, G.; López, M.; Carballo, R.; Castro, A.; Fraguela, J.A.; Frigaard, P. Wave energy potential in Galicia (NW Spain). Renew. Energy 2009, 34, 2323–2333. [Google Scholar] [CrossRef]
- López, M.; Taveira-Pinto, F.; Rosa-Santos, P. Numerical modelling of the CECO wave energy converter. Renew. Energy 2017, 113, 202–210. [Google Scholar] [CrossRef]
- Fernandez, H.; Iglesias, G.; Carballo, R.; Castro, A.; Fraguela, J.A.; Taveira-Pinto, F.; Sanchez, M. The new wave energy converter WaveCat: Concept and laboratory tests. Mar. Struct. 2012, 29, 58–70. [Google Scholar] [CrossRef]
- Veigas, M.; López, M.; Romillo, P.; Carballo, R.; Castro, A.; Iglesias, G. A proposed wave farm on the Galician coast. Energy Convers. Manag. 2015, 99, 102–111. [Google Scholar] [CrossRef]
- Antonio, F.D.O. Wave energy utilization: A review of the technologies. Renew. Sustain. Energy Rev. 2010, 14, 899–918. [Google Scholar] [CrossRef]
- Pacheco, A.; Ferreira, Ó.; Carballo, R.; Iglesias, G. Evaluation of the production of tidal stream energy in an inlet channel by coupling field data and numerical modelling. Energy 2014, 71, 104–117. [Google Scholar] [CrossRef]
- Alvarez, E.A.; Rico-Secades, M.; Suárez, D.F.; Gutiérrez-Trashorras, A.J.; Fernández-Francos, J. Obtaining energy from tidal microturbines: A practical example in the Nalón River. Appl. Energy 2016, 183, 100–112. [Google Scholar] [CrossRef]
- Esteban, M.D.; Diez, J.J.; López, J.S.; Negro, V. Why offshore wind energy? Renew. Energy 2011, 36. [Google Scholar] [CrossRef]
- Esteban, M.D.; López-Gutiérrez, J.S.; Negro, V.; Matutano, C.; García-Flores, F.M.; Millán, M.Á. Offshore wind foundation design: Some key issues. J. Environ. Eng. 2015, 141, 1–6. [Google Scholar] [CrossRef]
- Pacheco, A.; Gorbeña, E.; Sequeira, C.; Jerez, S. An evaluation of offshore wind power production by floatable systems: A case study from SW Portugal. Energy 2017, 131, 239–250. [Google Scholar] [CrossRef]
- Kim, H.C.; Kim, M.H.; Lee, J.Y.; Kim, E.S.; Zhang, Z. Global Performance Analysis of 5MW WindFloat and OC4 Semi-Submersible Floating Offshore Wind Turbines (FOWT) by Numerical Simulations. In Proceedings of the 27th International Ocean and Polar Engineering Conference, San Francisco, CA, USA, 25–30 June 2017. [Google Scholar]
- Kumar, V.; Shrivastava, R.L.; Untawale, S.P. Solar Energy: Review of Potential Green & Clean Energy for Coastal and Offshore Applications. Aquat. Procedia 2015, 4, 473–480. [Google Scholar] [CrossRef]
- Santafé, M.R.; Ferrer Gisbert, P.S.; Sánchez Romero, F.J.; Torregrosa Soler, J.B.; Ferrán Gozálvez, J.J.; Ferrer Gisbert, C.M. Implementation of a photovoltaic floating cover for irrigation reservoirs. J. Clean. Prod. 2014, 66, 568–570. [Google Scholar] [CrossRef]
- Skoplaki, E.; Palyvos, J.A. On the temperature dependence of photovoltaic module electrical performance: A review of efficiency/power correlations. Sol. Energy 2009, 83, 614–624. [Google Scholar] [CrossRef]
- Kamuyu, W.C.L.; Lim, J.R.; Won, C.S.; Ahn, H.K. Prediction model of photovoltaic module temperature for power performance of floating PVs. Energies 2018, 11, 447. [Google Scholar] [CrossRef]
- Trapani, K.; Millar, D.L.; Smith, H.C.M. Novel offshore application of photovoltaics in comparison to conventional marine renewable energy technologies. Renew. Energy 2013, 50, 879–888. [Google Scholar] [CrossRef]
- Wu, Y.; Li, L.; Song, Z.; Lin, X. Risk assessment on offshore photovoltaic power generation projects in China based on a fuzzy analysis framework. J. Clean. Prod. 2019, 215, 46–62. [Google Scholar] [CrossRef]
- Solanki, C.; Nagababu, G.; Kachhwaha, S.S. Assessment of offshore solar energy along the coast of India. Energy Procedia 2017, 138, 530–535. [Google Scholar] [CrossRef]
- Trapani, K.; Millar, D.L. Proposing offshore photovoltaic (PV) technology to the energy mix of the Maltese islands. Energy Convers. Manag. 2013, 67, 18–26. [Google Scholar] [CrossRef]
- Friel, D.; Karimirad, M.; Whittaker, T.; Doran, W.J.; Howlin, E. A review of floating photovoltaic design concepts and installed variations. In Proceedings of the 4th International Conference Offshore Renew Energy CORE 2019, Glasgow, UK, 30 August 2019; pp. 1–10. [Google Scholar]
- Pérez-Collazo, C.; Greaves, D.; Iglesias, G.; Perez-Collazo, C.; Greaves, D.; Iglesias, G. A review of combined wave and offshore wind energy. Renew. Sustain. Energy Rev. 2015, 42, 141–153. [Google Scholar] [CrossRef]
- Astariz, S.; Perez-Collazo, C.; Abanades, J.; Iglesias, G. Towards the optimal design of a co-located wind-wave farm. Energy 2015, 84, 15–24. [Google Scholar] [CrossRef]
- Astariz, S.; Perez-Collazo, C.; Abanades, J.; Iglesias, G. Co-located wind-wave farm synergies (Operation & Maintenance): A case study. Energy Convers. Manag. 2015, 91, 63–75. [Google Scholar] [CrossRef]
- Zheng, X.; Zheng, H.; Lei, Y.; Li, Y.; Li, W. An offshore floating wind–solar–aquaculture system: Concept design and extreme response in survival conditions. Energies 2020, 13, 604. [Google Scholar] [CrossRef]
- Iglesias, G.; Carballo, R. Offshore and inshore wave energy assessment: Asturias (N Spain). Energy 2010, 35, 1964–1972. [Google Scholar] [CrossRef]
- Abanades, J.; Flor-Blanco, G.; Flor, G.; Iglesias, G. Dual wave farms for energy production and coastal protection. Ocean. Coast. Manag. 2018, 160, 18–29. [Google Scholar] [CrossRef]
- Ramos, V.; Carballo, R.; Álvarez, M.; Sánchez, M.; Iglesias, G. Assessment of the impacts of tidal stream energy through high-resolution numerical modeling. Energy 2013, 61, 541–554. [Google Scholar] [CrossRef]
- Elliott, D.L.; Holladay, C.G.; Barchet, W.R.; Foote, H.P.; Sandusky, W.F. Wind energy resource atlas of the United States. STIN 1987, 87, 24819. [Google Scholar]
- Zheng, C.W.; Pan, J. Assessment of the global ocean wind energy resource. Renew. Sustain. Energy Rev. 2014, 33, 382–391. [Google Scholar] [CrossRef]
- Prieto, J.I.; Martínez García, J.C.; García, D.; Santoro, R. Notes on the solar map of Asturias. Renew. Energy Power Qual. J. 2011, 1273–1277. [Google Scholar] [CrossRef]
- Vázquez, M.V.; Varela, M.P.; Belmonte, P.I.; Cerqueira, M.T.P. Zonas climáticas de radiación solar de Galicia. In Proceedings of the Construyendo el Futuro Sostenible: Libro de Actas del XIV Congreso Ibérico y IX Congreso Iberoamericano de Energía Solar, Vigo, Galicia, España, 17–21 June 2008; pp. 255–260. [Google Scholar]
- Samuelsson, P.; Jones, C.G.; Will’ En, U.; Ullerstig, A.; Gollvik, S.; Hansson, U.L.; Jansson, E.; Kjellstro, M.C.; Nikulin, G.; Wyser, K. The Rossby Centre Regional Climate model RCA3: Model description and performance. Tellus A Dyn. Meteorol. Oceanogr. 2011, 63, 4–23. [Google Scholar] [CrossRef]
- Uppala, S.M.; Kållberg, P.W.; Simmons, A.J.; Andrae, U.; Bechtold, V.D.C.; Fiorino, M.; Gibson, J.K.; Haseler, J.; Hernandez, A.; Kelly, G.A.; et al. The ERA-40 re-analysis. Q. J. R. Meteorol. Soc. 2005, 131, 2961–3012. [Google Scholar] [CrossRef]
- Cats, G.; Wolters, L. The Hirlam project. IEEE Comput. Sci. Eng. 1996, 3, 4–7. [Google Scholar] [CrossRef]
- Iglesias, G.; Carballo, R. Wave energy and nearshore hot spots: The case of the SE Bay of Biscay. Renew. Energy 2010, 35, 2490–2500. [Google Scholar] [CrossRef]
- Stackhouse, P.W.; Zhang, T.; Westberg, D.; Barnett, A.J.; Bristow, T.; Macpherson, B.; Hoell, J.M. POWER Release 8 (with GIS Applications) Methodology (Data Parameters, Sources, & Validation) Documentation Date (All Previous Versions Are Obsolete) (Data Version 8.0.1); NASA: Washington, DC, USA, 2018.
- Zhang, T.; Stackhouse, P.W.; Chandler, W.S.; Hoell, J.M.; Westberg, D.; Whitlock, C.H. A global perspective on renewable energy resources: NASA’s Prediction of Worldwide Energy Resources (POWER) Project. In Proceedings of the 2007 ISES Solar World Congress, Beijing, China, 18–21 September 2007; Volume 4, pp. 2636–2640. [Google Scholar]
- Gelaro, R.; Mccarty, W.; Suárez, M.J.; Todling, R.; Molod, A.; Takacs, L.; Randles, C.; Darmenov, A.; Bosilovich, M.G.; Reichle, R.H.; et al. The modern-era retrospective analysis for research and applications, version 2 (MERRA-2). J. Clim. 2017, 30, 5419–5454. [Google Scholar] [CrossRef]
- Rienecker, M.M.; Suarez, M.J.; Todling, R.; Bacmeister, J.; Takacs, L.; Liu, H.C.; Gu, W.; Sienkiewicz, M.; Koster, R.D.; Gelaro, R.; et al. The GEOS-5 Data Assimilation System: Documentation of Versions 5.0.1, 5.1.0, and 5.2.0; NASA Goddard Space Flight Center: Greenbelt, MD, USA, 2008.
- Oh, K.Y.; Nam, W.; Ryu, M.S.; Kim, J.Y.; Epureanu, B.I. A review of foundations of offshore wind energy convertors: Current status and future perspectives. Renew. Sustain. Energy Rev. 2018, 88, 16–36. [Google Scholar] [CrossRef]
- EWEA European Wind Energy Association: Deep water—The next step for offshore wind energy. 2013.
- Carrillo, C.; Obando Montaño, A.F.; Cidrás, J.; Díaz-Dorado, E. Review of power curve modelling for windturbines. Renew. Sustain. Energy Rev. 2013, 21, 572–581. [Google Scholar] [CrossRef]
- Ranjbaran, P.; Yousefi, H.; Gharehpetian, G.B.; Astaraei, F.R. A review on floating photovoltaic (FPV) power generation units. Renew. Sustain. Energy Rev. 2019, 110, 332–347. [Google Scholar] [CrossRef]
- Patil, S.S.; Wagh, M.M.; Shinde, N.N. A Review on Floating Solar Photovoltaic Power Plants. Int. J. Sci. Eng. Res. 2017, 8, 789–794. [Google Scholar]
- Trapani, K.; Millar, D.L. The thin film flexible floating PV (T3F-PV) array: The concept and development of the prototype. Renew. Energy 2014, 71, 43–50. [Google Scholar] [CrossRef]
- Parida, B.; Iniyan, S.S.; Goic, R. A review of solar photovoltaic technologies. Renew. Sustain. Energy Rev. 2011, 15, 1625–1636. [Google Scholar] [CrossRef]
- Jinkosolar. Eagle 72P-V 320-340 Watt. 2017. Available online: https://jinkosolar.eu (accessed on 15 June 2019).
- Trinasolar. Tallmax Plus TSM-DE14A (II). 2017. Available online: https://www.trinasolar.com (accessed on 15 June 2019).
- Q-CELLS. Q.POWER-G5 260-280. 2017. Available online: https://www.q-cells.com (accessed on 15 June 2019).
- Del Jesus, F.; Menéndez, M.; Guanche, R.; Losada, I.J. A wind chart to characterize potential offshore wind energy sites. Comput. Geosci. 2014, 71, 62–72. [Google Scholar] [CrossRef]
- Ramos, V.; Iglesias, G. Wind power viability on a small island. Int. J. Green Energy 2014, 11, 741–760. [Google Scholar] [CrossRef]
- Wind Europe. Offshore Wind in Europe. Key Trends and Statistics 2017; Wind Europe: Brussels, Belgium, 2018. [Google Scholar]
- Weaver, T. Financial appraisal of operational offshore wind energy projects. Renew. Sustain. Energy Rev. 2012, 16, 5110–5120. [Google Scholar] [CrossRef]
- Sukarso, A.P.; Kim, K.N. Cooling effect on the floating solar PV: Performance and economic analysis on the case of west Java province in Indonesia. Energies 2020, 13, 2126. [Google Scholar] [CrossRef]
- Gao, X.; Yang, H.; Lu, L. Investigation into the optimal wind turbine layout patterns for a Hong Kong offshore wind farm. Energy 2014, 73, 430–442. [Google Scholar] [CrossRef]
- Hundleby, G.; Freeman, K. Unleashing Europe’s Offshore Wind Potential: A New Resource Assessment; BVG Associates: Swindon, UK, 2017. [Google Scholar]
- Astariz, S.; Iglesias, G. Output power smoothing and reduced downtime period by combined wind and wave energy farms. Energy 2016, 97, 69–81. [Google Scholar] [CrossRef]
- Carballo, R.; Sanchez, M.; Ramos, V.; Fraguela, J.A.; Iglesias, G. The intra-annual variability in the performance of wave energy converters: A comparative study in N Galicia (Spain). Energy 2015, 82, 138–146. [Google Scholar] [CrossRef]


| Parameter | Units | Wind Turbine | ||
|---|---|---|---|---|
| Repower 6.2M | M5000 | SWT 3.6 | ||
| PR | MW | 6.15 | 5.00 | 3.60 |
| Rotor diameter | m | 126.0 | 116.0 | 107.0 |
| Hub height | m | 95.0 | 90.0 | 88.0 |
| Cut-in wind speed | m/s | 3.5 | 4.0 | 4.0 |
| Cut-off wind speed | m/s | 30.0 | 25.0 | 25.0 |
| Manufacturer | - | Senvion | Areva | Siemens |
| Parameter | Units | Panel Model | ||
|---|---|---|---|---|
| JKM 325PP-72V | Tallmax TSM-DE | Q-Power-G5 280 | ||
| PSTC | W | 325 | 365 | 280 |
| Efficiency | % | 16.75 | 18.8 | 17.1 |
| αP | °C−1 | −0.4 | −0.39 | −0.40 |
| Length | m | 1.96 | 1.96 | 1.65 |
| Width | m | 0.99 | 0.99 | 0.99 |
| Surface | m2 | 1.94 | 1.95 | 1.94 |
| Weight | kg | 26.5 | 26.0 | 22.2 |
| Material | - | Si polycrystalline | Si monocrystalline | Si polycrystalline |
| Manufacturer | - | Jinko Solar | Trina Solar | Hanwa Q CELLS |
| Study Site | |||
|---|---|---|---|
| W | C | E | |
| Senvion RE Power 6.2M | 23.1 | 19.2 | 16.2 |
| Areva M5000 | 23.0 | 19.7 | 16.8 |
| Siemens SWT 3.6 | 25.9 | 22.4 | 19.4 |
| Q-Power-G5 280 | 12.8 | 12.6 | 13.2 |
| Tallmax TSM-DE | 11.7 | 11.5 | 12.1 |
| JKM 325PP-72V | 12.2 | 12.0 | 12.5 |
| Parameter | Units | Study Site | |||
|---|---|---|---|---|---|
| W | C | E | |||
| 6.2 MW offshore wind turbine | EW,out | GWh/year | 12.4 | 10.6 | 9.0 |
| CVW | - | 1.3 | 1.4 | 1.6 | |
| YW,out | GWh/(km2·year) | 10.6 | 9.2 | 7.8 | |
| CFW | % | 23.1 | 19.2 | 16.2 | |
| 5 MW offshore FPV farm | ES,out | GWh/year | 5.3 | 5.2 | 5.5 |
| CVS | - | 0.6 | 0.6 | 0.6 | |
| YS,out | GWh/(km2·year) | 69.4 | 67.6 | 71.5 | |
| CFS | % | 11.7 | 11.5 | 12.1 | |
© 2020 by the authors. Licensee MDPI, Basel, Switzerland. This article is an open access article distributed under the terms and conditions of the Creative Commons Attribution (CC BY) license (http://creativecommons.org/licenses/by/4.0/).
Share and Cite
López, M.; Rodríguez, N.; Iglesias, G. Combined Floating Offshore Wind and Solar PV. J. Mar. Sci. Eng. 2020, 8, 576. https://doi.org/10.3390/jmse8080576
López M, Rodríguez N, Iglesias G. Combined Floating Offshore Wind and Solar PV. Journal of Marine Science and Engineering. 2020; 8(8):576. https://doi.org/10.3390/jmse8080576
Chicago/Turabian StyleLópez, Mario, Noel Rodríguez, and Gregorio Iglesias. 2020. "Combined Floating Offshore Wind and Solar PV" Journal of Marine Science and Engineering 8, no. 8: 576. https://doi.org/10.3390/jmse8080576
APA StyleLópez, M., Rodríguez, N., & Iglesias, G. (2020). Combined Floating Offshore Wind and Solar PV. Journal of Marine Science and Engineering, 8(8), 576. https://doi.org/10.3390/jmse8080576