Article

Wave Energy Converter Power Take-Off System Scaling and Physical Modelling

1
Department of Civil Engineering, Faculty of Engineering of the University of Porto (FEUP), 4200-465 Porto, Portugal
2
Interdisciplinary Centre of Marine and Environmental Research of the University of Porto (CIIMAR), 4200-465 Porto, Portugal
3
Department of Electrical Engineering, Uppsala University, P.O. Box 256, SE-751 05 Uppsala, Sweden
4
Department of Naval Architecture, Ocean and Marine Engineering, University of Strathclyde, Glasgow G4 0LZ, UK
*
Author to whom correspondence should be addressed.
J. Mar. Sci. Eng. 2020, 8(9), 632; https://doi.org/10.3390/jmse8090632
Submission received: 28 July 2020 / Revised: 11 August 2020 / Accepted: 13 August 2020 / Published: 20 August 2020
(This article belongs to the Special Issue Hybrid Systems for Marine Energy Harvesting)

Abstract

:
Absorbing wave power from oceans for producing a usable form of energy represents an attractive challenge, which for the most part concerns the development and integration, in a wave energy device, of a reliable, efficient and cost-effective power take-off mechanism. During the various stages of progress, for assessing a wave energy device, it is convenient to carry out experimental testing that, opportunely, takes into account the realistic behaviour of the power take-off mechanism at a small scale. To successfully replicate and assess the power take-off, good practices need to be implemented aiming to correctly scale and evaluate the power take-off mechanism and its behaviour. The present paper aims to explore and propose solutions that can be applied for reproducing and assessing the power take-off element during experimental studies, namely experimental set-ups enhancements, calibration practices, and error estimation methods. A series of recommendations on how to practically organize and carry out experiments were identified and three case studies are briefly covered. It was found that, despite specific options that can be strictly technology-dependent, various recommendations could be universally applicable.

1. Introduction

Harvesting power from ocean waves represents a fascinating challenge. Over the years, many wave energy converter (WEC) concepts have been proposed [1,2]. Figure 1 summarizes different examples of the most successful WECs projects. WECs can be categorized depending on how the power take-off (PTO) system is activated. In general, a PTO requires a counter-reaction force to work; thus, two main groups of devices can be defined: Earth-reacting and self-reacting. Moreover, devices can be subdivided in fixed structures, floating, and submerged. For all WECs, the PTO system is the most important component, which needs to be developed as an integral part. The PTO influences the dynamics of a WEC and its reliability, performance and cost are critical factors. Consequently, early experimental testing of the PTO at laboratory scale becomes essential for validation of WEC development. Therefore, it is very important to consolidate guidelines and theory for WEC scaling [3] with particular attention to the PTO system.
Reproducing the effect of the PTO system at laboratory scale is a challenging task. A first idea would be related to using a complex miniaturized PTO mechanism, which could realistically produce little amounts of electricity. Optionally, PTO systems are often physically implemented as an active damper element, which simulates the PTO reaction forces (PTO simulator) [4]. In all cases, it is worth noting that the results obtained could present high uncertainties, owing to different factors such as unpredictable friction losses between moving parts, signal noise, instrument resolution, accuracy and repeatability. In general, the PTO is monitored by a set of sensors and the absorbed power is assessed by multiple measurements. In this situation, uncertainties from multiple sensors have to be combined and the global uncertainty related to the power estimation further amplifies.
To limit and correctly quantify uncertainties related to model-scale PTOs, three types of actions can be implemented. The firsts, concern following good practices and recommendations on how to construct laboratory-scale PTO systems. The second set of actions relates to essential calibration procedures needed at the beginning of experimental tests. In this sense, correct calibration and characterization of the PTO damping with early tests becomes indispensable before moving to the actual tests in water. Finally, the third type of action concerns a correct quantification of uncertainties following common practice and known theory.
In particular, regarding the PTO forces and damping values, limited literature deals with the procedures to assess uncertainties related to empirical quantities. Existing documentation mainly focuses on wave tank testing of conventional floating structures or ships models, e.g., International Towing Tank Conference (ITTC) guidelines [5,6]. Nevertheless, requirements of wave energy testing are dissimilar from conventional structures [3]. For the case of marine renewable energy devices, introductory guidance is provided by [7,8,9]. Similarly, few first general standards for experimental testing of marine renewable energy systems are available, e.g., European Marine Energy Centre [10]. Nevertheless, all published guidance mostly applies to real scale experimental tests and only little focuses on the specific problem of scaling PTO components for laboratory testing. Moreover, many PTO control methodologies have been proposed, but experiments at laboratory dealing with PTO control, due to scaling reasons, are rather difficult to be performed accurately [4].
Against this backdrop, the present paper focuses on reviewing basic theory and good scientific practices for reproducing PTO systems at the laboratory (Section 2 and Section 3). Three case studies on direct-drive electrical and mechanical types of PTO are also analysed, to provide examples of possible experimental arrangements for laboratory-scale PTO testing (Section 4). Finally, brief concluding remarks based on learnings are provided (Section 5).

2. State-Of-The-Art

2.1. Types of PTO Systems

Different types of PTOs exist, and depending on the category, these can be easier to scale, more difficult, or at cases, may not be scalable. The most common PTOs are based on air turbines, hydraulic, electrical direct-drive, and mechanical systems.
Air turbines systems are implemented in WECs operating under the principle of oscillating water columns (OWCs). This type of PTO is often tested with 1:5 to 1:9 model scales [11]. Dealing with OWC PTOs at smaller scales is a problematic task since it must take into account complex wave-structure interaction phenomena, such as air compressibility and, fluid and PTO dynamics [3,12]. Therefore, different approaches have been adopted, either by modifying proportions of the OWC chamber with respect to the real scale or by keeping the same ratio between width, height and length [11]. As an alternative, deformable air chambers can be used [13]. In most cases, the PTO is simulated at model scale by using an orifice or porous media [14]. The pressure drop due to the orifice is monitored by internal and external pressure sensors. Due to scaling reasons, as explained in detail in [12], external air pressure at model scale should be increased for allowing physical similarities. This aspect may be resolved by connecting an external air reservoir to the OWC. For fixed OWC models, this solution could be easy to implement. However, given the dimensions and weight of the air reservoir required, the solution may not be simple to implement in floating OWCs. Assuming that the model set-up correctly represents the real scale OWC device (“physically”), the power from the simulated orifice PTO can be estimated from measuring the pressure drop ( Δ p ), according to the following expression:
P p t o = Δ p   Q
where Q is the volumetric flow rate of the air passing through the orifice. An orifice-based PTO simulator can be calibrated with preliminary regular wave tests in water through measuring the internal free surface elevation with wave probes [15]. In particular, measuring Q is difficult because flow meters introduce head losses that are of the same magnitude of PTO damping. As a solution, Q can be characterized preliminarily as a function of the pressure drop. Thus, Q became a known entity in Equation (1).
Hydraulic systems, in general, are only scalable until a certain extent. Small scale hydraulic PTOs are unfeasible due to the requirement of impractical high fluid pressure. Concerning these systems, there are a series of extra issues to be considered, for instance, friction drag of seals and viscous drag due to small holes. These issues are very significant and may radically affect PTO efficiency [16].
Conversely, direct-drive electrical and mechanical types of PTO are normally better scalable. These types of systems are applied to WECs that have moving components, normally, of relatively large dimensions and mass. In this situation, Froude similitudes are typically readily applicable. However, depending on the complexity of the PTO, the mechanical friction (dynamic and static) and the inertial effects, the scaling of such PTOs could still be a laborious process. Overall, direct-drive electrical and mechanical PTOs are among the most widely used type and can be better scaled than other PTO systems. As such PTOs are implemented in the later discussed case studies, the rest of the paper mainly focuses on these.

2.2. Scaling Laws

Small-scale models of WECs should represent reliably real scale physics. To achieve so a series of approaches can be followed. In theory, a previous dimensional analysis should be carried out to design the scaled model for ensuring similarities. In practice, for PTO modelling dimensional analysis can be rather complex and unsuitable to be implemented. Thus, other solutions for designing the model can be implemented, for instance involving the adoption of assumptions and the application of specific direct scaling laws. To achieve consistency between the laboratory model and its real scale version geometrical, kinematic, and dynamic similitudes should be fulfilled. Focusing on offshore structure testing it may be useful to calculate, for instance, the dimensionless numbers referred as Froude (Fr), Reynolds (Re), Mach’s (Mn), Weber’s (Wn), Keulegan-Carpenter (KC) and Strouhall (St), which represent force ratios of inertia/gravity (Fr), inertia/viscous (Re), inertia/elasticity (Mn), inertia/surface tension (Wn), drag/inertia (KC) and the non-dimensional vortex shedding frequency (St), respectively. The first two dimensionless numbers are the most common and relevant for the PTO of the case studies later described thus only these are covered with some details next.
Froude and Reynolds numbers relative to the real scale prototype and its model scaled version should be kept as much as constant as possible. Keeping both these numbers constant at the same time, is not possible because it would imply the use of a fluid that does not exist in reality, solutions may not be suitable for practical experimental testing or are excessively expensive. Thus, for practically scaling a WEC, a particular compromise should be established. The Froude number, F r and Reynolds number, R e , are defined as:
F r = U g L
R e = ρ U L μ
where U represents the characteristic velocity of the fluid, L the characteristic length of the device, g the acceleration of gravity, ρ the fluid density and μ the dynamic viscosity of the fluid. The Froude number ( F r ) indicates the importance of inertial forces relative to gravity forces. The Reynolds number ( R e ), instead, provides a measure of the importance of inertial forces relative to the viscous forces. Depending on the scope of the experimental work, either the Froude number or the Reynolds number is normally kept analogous to the real scale case.
For wet WEC testing, if a suitable scale is selected, the gravity forces normally are significantly higher compared to viscous forces. The Reynold number can indicate the validity of Froude scaling. As a rough indication, a Reynolds number minimum of 105, for the real scale case, indicates good applicability of Froude scaling laws [3]. In such circumstance, for experimental studies on WECs, it is commonly accepted to use primarily Froude scaling laws, which are reported in Table 1. In this table, s represents the geometrical scaling factor. For Re lower than 105, viscous forces may be relevant and Froude scaling laws may not be directly applicable. In this case, viscous forces may be significant and need to be taken somehow into account, for instance with the aid of a numerical model as for [17]. To note that for comparing model scale results obtained at a hydrodynamics laboratory with ocean prototype results, it is required to consider as well a correction factor ( r = ρ o c e a n / ρ t a n k ) that takes into account the density difference between saltwater of the ocean and freshwater of the wave tank [18].
As can be observed in Table 1, the power scales by the s 3.5 law, meaning that for small model scales the multiplication factor (needed for converting laboratory-scale values into real scale quantities) can be very large, as shown in Figure 2. In consequence, the power produced by a WEC model (at small scale) is a significantly small quantity and uncertainties related to the simulation of the PTO may highly distort the expected PTO behaviour.

2.3. Experimental Scale Selection

In general, before obtaining the final design of a commercial WEC, extensive research must be carried out by using both numerical and experimental testing. Research and development results need to be regularly validated with data from experimental campaigns performed at different model scales due to budget reasons. Thus, experimental work is crucial for ensuring the validity of calculations, concepts proposed and make the proof of system functionalities. As proposed by the European Marine Energy Centre, at least 5 development phases are required [10], Table 2. During these phases, depending on the scope and economic resources available, a different type of PTO system can be used.
At phase 1, a geometrical scale ( λ = 1 / s ) within the range of λ = 1 : 25 100 can be adopted, e.g., [19,20,21]. At this stage, the main aim of the experimental work normally concerns a proof-of-concept, initial preliminary assessments on performances and numerical model validation. For such scales, rarely, a realistic PTO is implemented. In this case, a PTO simulator is normally used. This PTO simulator can be, for instance, an electric motor working as an active damper with a feedback control loop, mechanical breaks or hydraulic dampers.
For phases 2 and 3, model scales as λ = 1 : 3 25 can be used, e.g., [22,23,24]. In this case, the PTO can be either, a simulator or, as well, eventually a fully functional scaled generator. However, at this stage, the best scale to use is highly dependent on the type of technology proposed and technology readiness level (TRL), which for marine renewable devices is defined by [25]. By increasing the physical model size, the PTO scaling effects are progressively less relevant. For scales close to (and eventually less than) λ = 1 : 25 , a miniaturized PTO could be representative of the real scale counterpart, but only if high-quality industrial-grade experimental equipment is used. At phases 2 and 3, the realistic behaviour of the PTO system needs to be validated. Thus, the PTO electronics could be tested, eventually also implementing possible control methodologies. In this way, expected performances can be proved, in particular, using irregular sea states. In this occasion, it may be worth also testing the PTO survival control mode during a set of extreme sea states. Phases 4 and 5 involve prototype testing and, hence, are not very related to the scope of this paper.

3. Common Practices

3.1. Experimental Set-Ups

In particular, at small scales, friction losses within the PTO system can be the main source of uncertainties. Friction effects within moving components are neither easily scalable nor linear. Thus, unwanted friction in all cases needs to be reduced for the most. Each component of the experimental set-up needs to be selected by keeping in mind to reduce friction losses. Within the entire experimental rig, friction losses, if substantial, can significantly modify the motion of the WEC even more than the expected PTO damping effect. To reduce friction between moving components, it is advisable to use very low friction bearings such as hydrostatic [8] or ceramic bearings [26]. Besides, choosing bearings of larger radius could allow a further reduction of friction losses.
Different options for the reproduction of the PTO system on a laboratory scale exist. Apart from using miniaturized PTO systems, which can be feasible at larger experimental scales (greater than 1:25), PTO simulators may be a feasible solution. The lasts allow for reproducing a realistic PTO behaviour, at least from the theoretical standpoint, skipping errors relative to friction losses. In this case, representative PTO forces are targeted. A review of the topic is provided by Beatty et al. [4]. There are various advantages by physically model PTOs at laboratory scales by using active damper systems. The implementation of such PTO simulators allows for experimental flexibility. By using such options, the PTO force can be highly customized to specific needs. For instance, an active PTO simulator can be an electric motor working as an active damper with a feedback control loop [8,26] or electromagnetic type of system based on eddy currents [27,28]. While the last kind of system requires advanced electromechanical design, PTO systems based on the use of electric motors, instead, can be set up by using off-the-shelf components, for example as implemented by Zurkinden et al. [22], who used a feedback control loop and a PID set-up (close-control loop) for emulating the PTO force, e.g., as for Figure 3. To well represent the PTO force using a control loop approach, very low-latency control electronics are required. Dedicated computer resources for the PTO control should be used, thereby; latencies can be minimized, i.e., within orders of few milliseconds. A controller, connected as for Figure 3, corrects the PTO force by processing information (rotation speed and direction) provided by the encoder or tachometer element. Moreover, through a look-up function, it is possible to implement specific adjustments depending on previous calibration and characterization of the electric motor. Active PTO simulators, in theory, could allow testing at model scale any type of WEC’s PTO control strategy, and eventually, almost reproducing faithfully the behaviour of the real scale prototype.
Instead of using electronic-based arrangements, ‘pure’ mechanical systems can be used, for example as the one implemented by Troch et al. [29], where PTO simulators are mechanical brakes. This approach can be referred to as passive PTO simulator [4]. A pure mechanical option can be an attracting and easy solution to implement, during the early stages of WEC development. However, the use of mechanical dampers normally implies a nonlinear PTO force ( F P T O ) , which can be represented by means of Coulomb damping. For a heaving point absorber this can be found by [30]:
F P T O = μ F N s i g n ( z ˙ )
where μ is the coefficient of the mechanical friction used, F N the normal force that is given by the mechanical brake and s i g n ( z ˙ ) the sign of the heave velocity of the floater.
In general, when constructing a PTO experimental set-up, the following recommendations can be provided:
  • Minimize unwanted friction;
  • Minimize inertia of PTO components;
  • Minimize tolerances between components;
  • Use high quality industrial experimental equipment;
  • Ensure rigidity of fixed components, unless flexibility/deformation is assessed;
  • Use parts that are machine built and, eventually, are made of mechanically advantageous materials such as carbon fibre, aluminium or stainless steel;
  • Reduce complexities.

3.2. Calibration Procedures

Once a PTO set-up is defined, a precise PTO calibration methodology is required to regulate and analyse the PTO force. Through calibration, a force magnitude close to the target PTO force can be obtained. Besides, the PTO force can be as well characterized, determining its relationship with the displacement and velocity of the PTO driving elements. For this purpose, different calibration methodologies can be implemented.
Normally, calibration is performed by running a series of dry-tests, which do not involve water and waves. If possible, it would be best to calibrate and assess the PTO behaviour, before adding further complexities, related to the full waves-structure interaction problem. Besides, at this stage, the sensors to be used for monitoring the PTO system must be accurately configured and calibrated. All PTO control units and sensors should be preliminarily tested, preferably taking into account circumstances, as for actual tests, in water, e.g., data acquisition equipment and loggers connections, which will be later used and may determine signal noise. It is advisable to set up a PTO simulator rig where all sensors are installed. The rig can be extensively calibrated during dry-tests and successively transferred, as it is, to the wave tank for later tests, with the entire WEC in water. Following this approach, later modifications can be reduced and, therefore, the calibration of the PTO and relative sensors can be preserved. Later calibration checks are always beneficial, but these not always can be done once the WEC model is in water.
PTOs for oscillating WECs, initially, can be calibrated with drop-weights tests. For instance, if the PTO simulator is an electric motor, a worm drive can be installed on the motor’s shaft. Weights attached to a wire can be used to drive the motor used as a damper. Given a specific weight value, and the falling speed, the PTO damping constant relative to a specific setting (current and voltage) can be inferred. The PTO force in this way can be tuned for several values within the desired range.
However, by only using drop tests, the effect of varying motor direction of rotation and its acceleration may not be sufficient. For this reason, it may be opportune to perform further PTO tuning by oscillations type of tests. For this purpose, spring elements can be temporarily added to the PTO rig set-up. Oscillations at target frequencies can be achieved by choosing a combination of correct weights and springs having suitable stiffness. Besides, to understand better uncertainties related to the PTO, it is of fundamental importance to run calibration tests several times. The more repetitions are conducted, the better level of confidence can be assumed for later calculations of the expanded uncertainty value. In later case studies section (Section 4), examples of PTO physical models set-up and calibration methodologies are presented.
In general, for calibration of PTO systems, it can be recommended to:
  • Explore target PTO force values and velocities ranges;
  • Apart from linear velocity, PTO’s oscillation motion should be assessed;
  • Perform as many as feasible repetitions;
  • Test, disassemble, reassemble and re-test;
  • Keep the PTO rig unchanged when it is needed to be transferred from a dry-test facility to the wave tank;
  • Possibly, daily re-check of sensors’ calibration (during actual tests in water).

3.3. Experimental Errors Evaluation

Experimental error evaluation practices can be divided into informal and formal. In informal approaches, the assessment of the accuracy of experimental tests can be limited to the description of experiments, mainly concerning the qualitative comparison of results. In this case, experimental errors can be roughly estimated by expert judgement without following a specific standard method. An expert opinion/evaluation may be based on previous experience or observations. Such informal approaches may be reported by a description of the methodology implemented and may only apply to specific experiments for which no standard error estimation procedures are implemented or can be identified (e.g., new PTO concepts). This kind of approach can be adopted for initial research stages, for instance, when proof-of-concept is investigated and only coarse calculations are undertaken.
As informal approaches for estimating errors could be very dependent on individual awareness, these may not be always well accepted at more advanced stages of development. Formal uncertainty analysis methods should instead be preferred to informal approaches. It could be good practice to include a full uncertainty analysis section within a report or publication for supporting experimental results. Confidence intervals relative to direct and indirect, empirical measurements can be reported within independent tables and/or as error bars inside graphs of experimental results.
Practical guidance on formal uncertainty analysis that can be applied during experimental works on WECs is provided by ITTC [5,9] and EquiMar [31]. For what concerns direct measurements related to the PTO system, the standard uncertainty u s should be evaluated using:
u s = ( u s A ) 2 + ( u s B ) 2
where u s A and u s B are the Type A and Type B uncertainties, respectively. u s A reflects the repeatability of the experiment and statistical errors, and can be calculated as follows:
u s A = s n
where n is the number of repetitions of tests and s is the standard deviation, which may be defined as:
s = k = 1 n ( q k q ¯ ) n 1
where q k is the empirical measurement associated with a specific k test and q ¯ is the average value of all taken measurements. The quantity ( q k q ¯ ) is the relative error of a specific sample.
Differently, the uncertainty Type B ( u s B ) is estimated by prior experience, calibration of equipment, manufacturers’ specifications and other relevant information.
Methods based on regression analysis (e.g., linear regression), as mentioned in [5], can be used to estimate u s B . These methods concern about fitting a known curve into calibration data to calculate residuals. For linear regression analysis, residuals R i can be calculated as:
R i = y i a b x i
which represents a difference between the measured values y i and a straight line y = ( a + b x i ) .
The uncertainty Type B value ( u s B ) can then be calculated as:
u s B = S S R n 2
where S S R is the sum of residuals ( R i ) squared.
Apart from the standard uncertainty ( u s ) that indicates the quality of direct measurements (e.g., the PTO displacement measured by a laser sensor), it is important to estimate the uncertainty relative to combined measurements, for example assessing the global uncertainty relative to the case of assessing the absorbed mechanical power by the PTO system, which is measured by multiple sensors. For this scope, the combined uncertainty u b can be used.
The u b value can be estimated firstly by defining a data reduction equation (DRE), which is an equation describing the indirect quantity evaluated. Then u b can be found by applying a first-order Taylor series approximation. Depending on the specific PTO system used, a correspondent formulation of u c ( P ) can be obtained by implementing the theory described in [9,31], where examples for calculating u c ( P ) relative to an OWC and a tidal turbine are provided, respectively.
The combined uncertainty ( u b ) can be converted into the expanded uncertainty if a specific confidence level needs to be assumed [31]. The expanded uncertainty, U , can be calculated as:
U = k · u c
where u c is the combined uncertainty and k the coverage factor corresponding to a confidence level/interval percentage value that can be identified from the Student’s distribution table on a specific number of tests repetitions carried out. The Student distribution is useful to be considered when few repetitions are available; otherwise, Gauss normal distribution shall be used for defining the confidence interval. In general, a minimum of 10 repetitions of specific testes is enough. This number of repetitions allows adopting a confidence interval equal to 95%, which corresponds to a relatively low k value (k = 2.23), as for standard Student’s t-distribution [32].
Overall, the following recommendations concerning the uncertainty analysis can be provided:
  • For reducing Type A uncertainty, as many repetitions as feasible of calibration and actual tests should be done;
  • For reducing Type B uncertainty, experimental set-up and equipment need to be improved or upgraded before carrying-out calibration;
  • The evaluation of Type B uncertainty can be done by gathering detailed specifications of the equipment used and/or regression analysis;
  • To assess uncertainties related to the PTO, typically, the combined uncertainty ( u c ), should be obtained. Following recognized formal practices, a specific formulation needs to be derived;
  • For allowing the smallest expanded uncertainty value ( U ), a certain minimum number of tests are required. It is recommended to choose a coverage factor f in advance so to better plan the number of repetitions required during calibration and actual tests.

4. Case Studies

Depending on the WEC technology, the PTO physical modelling work at laboratory scale may involve the implementation of diverse experimental set-ups, calibration and error estimation procedures. For this reason, this section aims to provide a brief overview of three different case studies, which positively may be of aid for future work on PTO physical modelling at the laboratory.

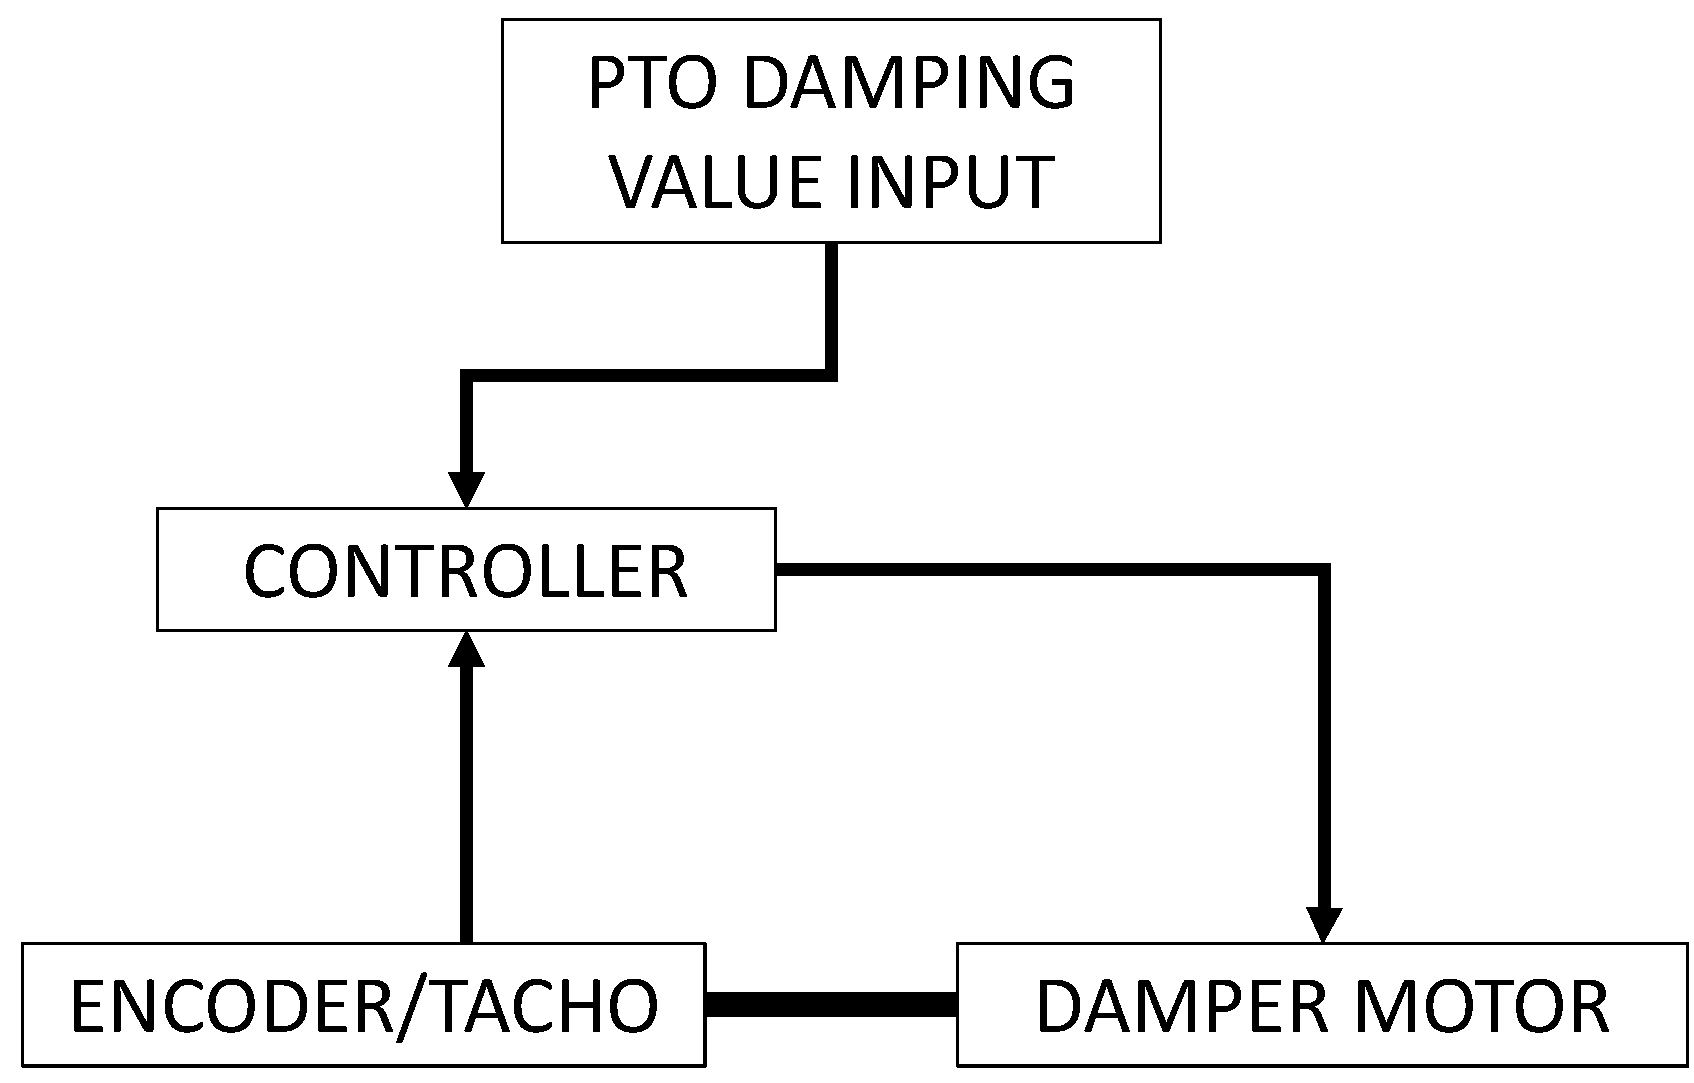
4.1. Case Study 1: Closed Control Loop PTO

An idealized point absorber WEC was studied with numerical models and through experimental campaigns at the Department of Naval, Ocean and Marine Engineering of the University of Strathclyde [26]. During experiments, a closed control loop type of PTO simulator was used. The theoretical point absorber device, illustrated in Figure 4, is composed by a spherical floater, a tether mooring line (pre-tensioned) and a PTO system, which can be represented by a spring and damper components.
Models of the point absorber were built and tested at 1:86 and 1:33 scales (Figure 5). For these models, the PTO system was represented by a stainless-steel spring and an electric servomotor with a tachometer, which functioned as a damper mechanism. As illustrated in Figure 6 (same for both models) the PTO simulator was installed outside of the water. The mooring line from the spherical buoy was passing through a bottom-mounted pulley, the motor worm (Figure 7) and attached to the spring. The PTO set-up included a load cell, for measuring the load at an upper point, and a laser sensor, measuring the axial displacement of the mooring line.
The calibration of the PTO was done in two stages. The first step consisted of dropping weights to drive the servomotor. By taking consideration of the falling speeds, measured over a vertical offset of 1 m and mass values of the weights, the damping forces exerted by the motor were calculated for a set of input current values. Following this stage, an initial calibration of the servomotor was obtained, Figure 8.
However, the first stage resulted in not being accurate enough. This result was probably due to static and dynamic frictions and due to the inertia effects of the servomotor stator. Therefore, a second step of the calibration methodology was required for accurate tuning and characterization of the PTO simulator. This further stage was carried out by considering an oscillatory motion. Such motion is closer to the realistic behaviour of the PTO when the model is under the action of wave loads, respect to the linear motion relative to unidirectional weights-drop tests, which instead does not take into consideration accelerations and decelerations of the system. Thus, at the second stage, a set of calibration (dry) tests using a different rig (Figure 9) were performed. This rig is almost identical to the one later used as the final PTO simulator during wave tank tests.
Before defining the actual experimental set-up, the PTO simulator was, for an extended time, calibrated and characterized. For such a task, dry calibration tests were performed by assembling and using a preliminary calibration rig, Figure 9.
Calibration with oscillatory motion (Figure 9) can be carried out by using a suitable set of springs and weights needed for obtaining a relevant range of decay periods, which were initialized by an offset at t = 0. The classic equation of motion of the spring-damper harmonic oscillator was used for analysing the system:
m z ¨ ( t ) + C z ˙ ( t ) + K z ( t ) = 0
where m is the mass, C the PTO damping coefficient, K the spring stiffness coefficient and z is the vertical displacement. By using a laser sensor, linked to a data-logging computer, it was possible to digitalize precisely the motion. Figure 10 shows an example of oscillations during an oscillatory calibration test.
With the decay results and the aid of a simplified time-domain model based on Equation (11), the PTO damping values can be finely calibrated and the PTO system could be characterized by a matrix, which can have the format reported in Figure 11. This matrix could be used as a look-up table during experimental tests for better reproducing the PTO damping force.
The final experimental set-up identified for the 1:33 scale model resulted to be appropriate for representing the dynamics and PTO behaviour of the point absorber. Besides, the two-stage calibration methodology developed allowed consistently reducing the uncertainties values [26].

4.2. Case Study 2: Eddy Current Based Electromagnetic PTOs

Two PTO models at a geometric scale of 1:30 have been designed at Uppsala University for a wave tank experiment. The main goals of the study were to develop a generic PTO testing solution, at a laboratory scale, and to study risks of failures and reliability of oscillatory types of WECs. Rotational and linear PTO models (Figure 12 and Figure 13) were defined and assembled [33]. The PTOs are meant to be used within an experimental set-up consisting of a floating surface buoy connected by a line and pulley system to the PTO model, which is situated on a gantry above the water surface (similar model as for the previous case treated in Section 4.1).
The rotatory PTO consists of a rotating aluminium disk mounted between two electromagnets that apply eddy current damping to the PTO. The magnetic field of the electromagnets is controlled by applying coil current in the range 0.2–1.4 A and the number of turns equal to 1200 for each coil. The motion of the buoy and line induces the rotational motion of the disk. During calibration procedures, clockwise and counter-clockwise rotations drop-weights tests have been conducted using weights in the range 0.2–1.2 kg. With the purpose of simplification, the end stop effect is not included in the rotatory PTO. In this set-up, a plastic block stand can be used to minimize the flux dissipation to the structure and for concentrating the flux in the air gap, as shown in Figure 12. The rotatory PTO employs eddy current braking for its damping force. The rotation of the disk in the electromagnetic field by the coils forms the eddy current on the disk resulting in a repulsive force (Lorenz force) between the disk and the coil [34]. The Lorenz force corresponds to the induced eddy current and magnitude of the magnetic field. The induced eddy current on the disk is proportional to the disk tangential velocity and magnitude of the magnetic field. Hence, the eddy current damping brake force relates to the square of the coil current. Increasing the current to enforce the magnetic field is applicable and effective only before the saturation of the coil core.
Similarly, in the linear PTO (Figure 13), the steel rod moves vertically in a magnetic field that is created by varying the coil current in the same range as rotatory PTO but with 800 turns coil. As for the rotatory PTO, variable weights are used; these are attached to the end of the rod for retraction as seen in Figure 13. For the linear PTO, the end stops effect is taken into consideration by two springs attached to the rod that confines the stroke displacement. A temporal magnet is formed in the rod due to the ferromagnetic properties of steel, i.e., resulting in non-permanent tension of the rod to one pole of the magnet (coil), which prompts pure damping force between the contact surface of the rod and one pole of the coil. A range of air gaps values was initially assessed for selecting the most suitable distance between the translating rod and the electromagnets (Figure 13b). This value allowed a wide range of desired damping forces. The linear PTO exerts a damping force, to the translatory motion of the buoy/line, which is proportional to the coil magnetic field.
For both PTOs, wire-draw-line position sensor with a spring constant of 0.6 N/m and linearity of ± 0.25 % of full-scale output (FSO) measured the vertical displacement of the rope attached to the PTOs and the weight. The data acquisition unit sampled the position data at 128 Hz.
To assess the performance of the two PTOs, dry tests with a range of attached weights can be performed. Depending on the mass of the attached weight, the dynamics of the system, the period of the drop and the number of data points varies. The heavier attached weight leads to higher inertia and a greater speed of the drop, resulting in a larger variance in damping estimation due to the few sampled data points available. On the other hand, the lighter attached weight results in friction domination due to the bearings, lower velocity. In this case a higher number of data points and, consequently, a lower variance in the estimation occur. Therefore, it emphasizes the importance of repetition of dry testing with a multitude of various weights to reach an appropriate level of bias and variance in estimating the damping value.
Figure 14 displays results of the damping for the rotatory PTO, where the damping coefficient rises by increasing the current and it reveals minor fluctuation with the mass of the weights. The maximum damping force attains 2.9 Ns/m in the scale model, which corresponds to a real scale value of 14.3 kNs/m. The converging increase of the pattern of the damping coefficient by the current to a constant value indicates the coil’s core saturation.
Figure 15 depicts the result of the dry testing for the linear PTO, where the highest friction force of 10.5 N is obtained for the scaled PTO model, corresponding to 283.5 kN in the full scale.
To achieve optimal damping for power maximizing purposes, a higher damping value is required. This can be accomplished by increasing the number of pairs of magnets. Increasing the number of winding or coil current would have minimal influence on the eddy damping since the coil cores seem to reach its saturation through the maximum magnetic field strength (H) obtained here. Saturated coil confines the enhancement of the damping coefficient by limiting the magnetic flux in the core.
The non-contact eddy current damper depicts satisfactory design characterization. Nonetheless, to achieve higher damping some change of practice as mentioned is necessary. The linear PTO damper represents a simple and robust system that can be useful as a PTO simulator in the wave tank environment. For more information about the experimental set-up, the reader can refer to Shahroozi et al. [33].

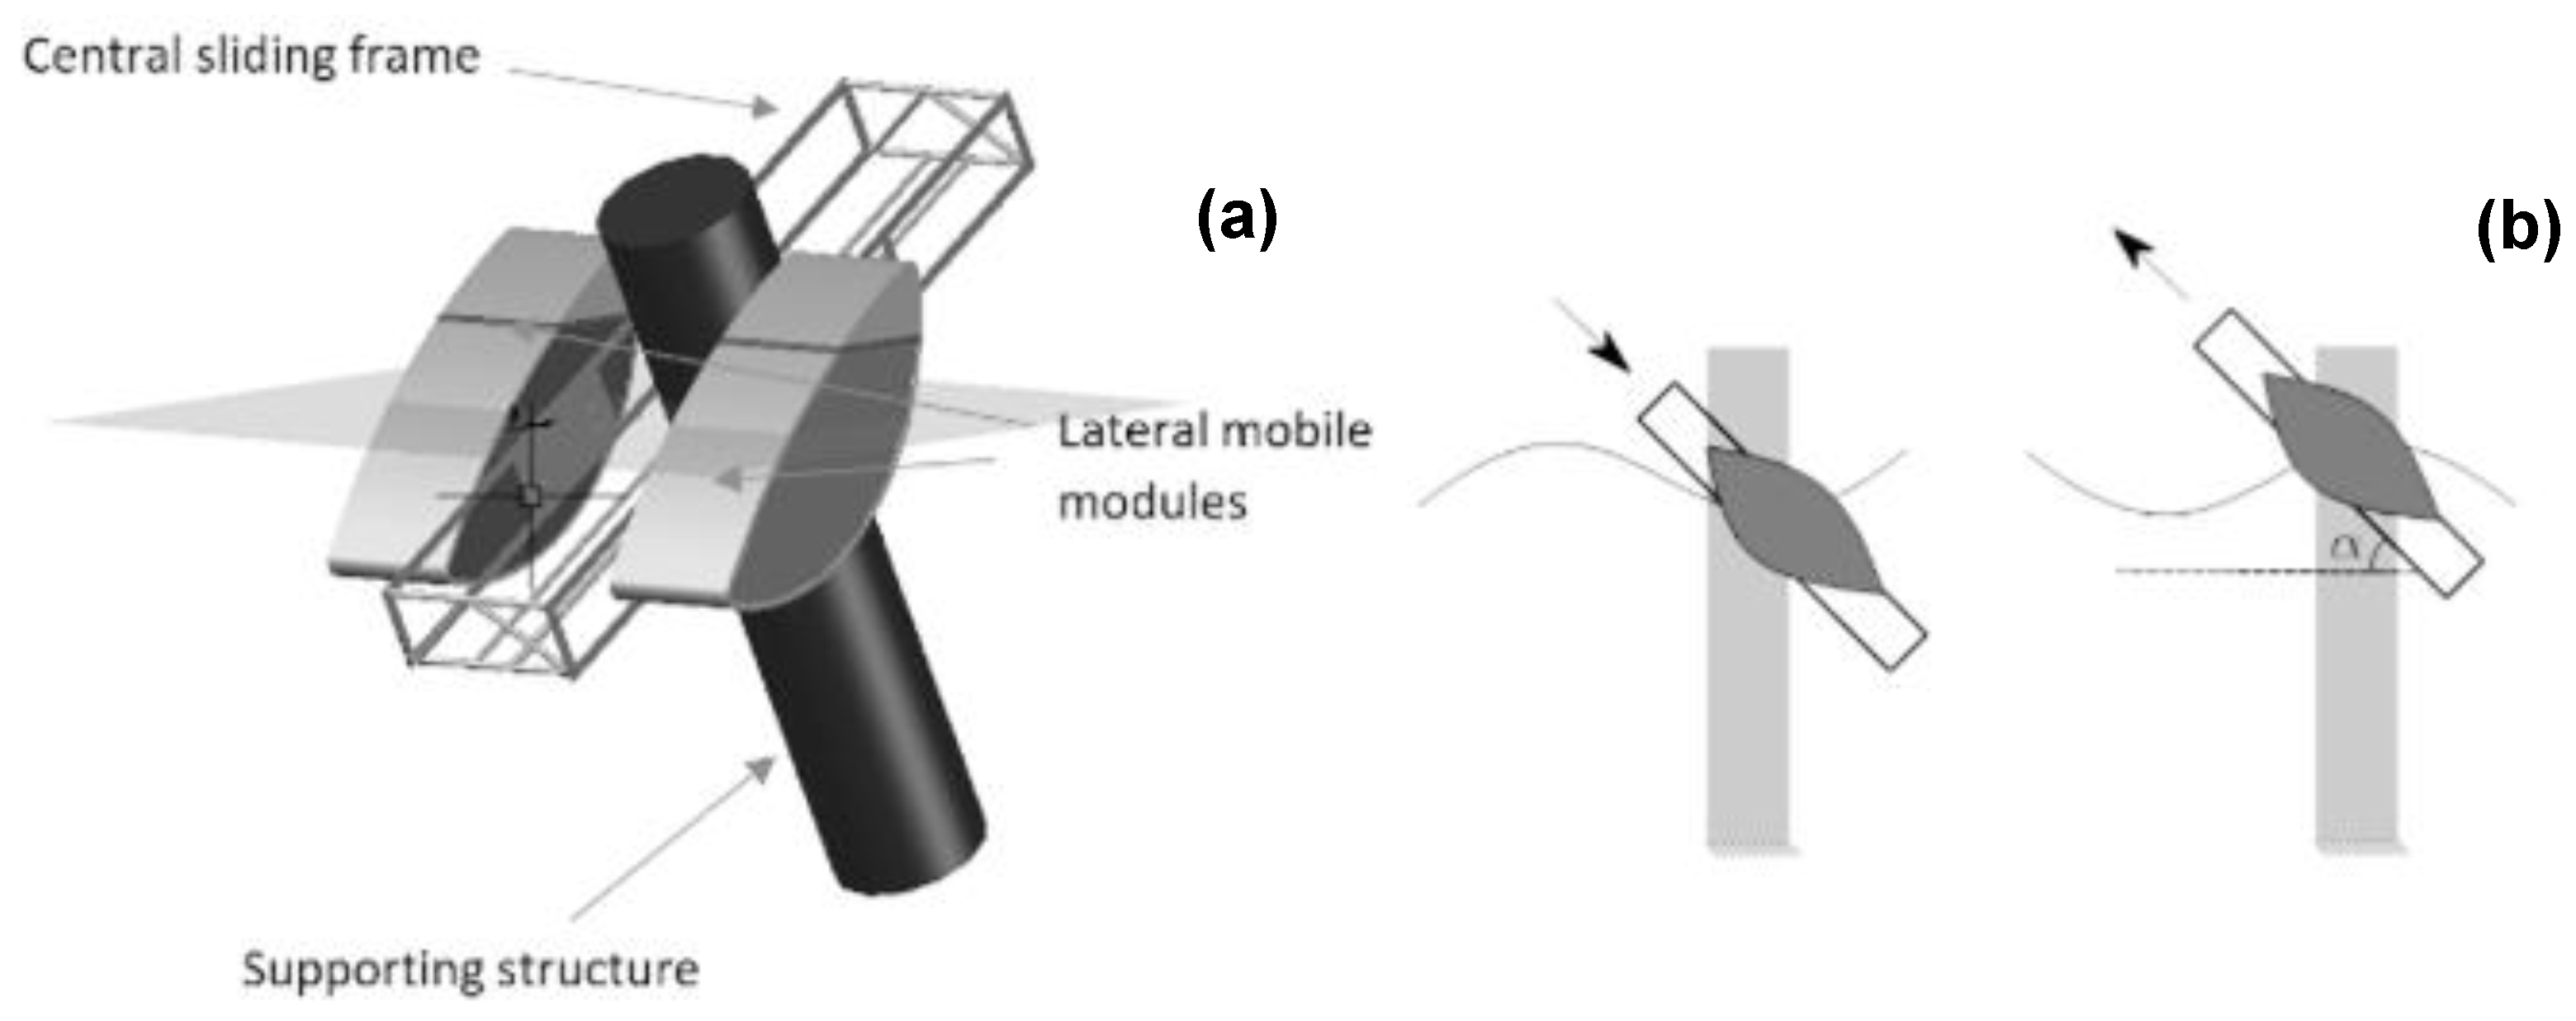
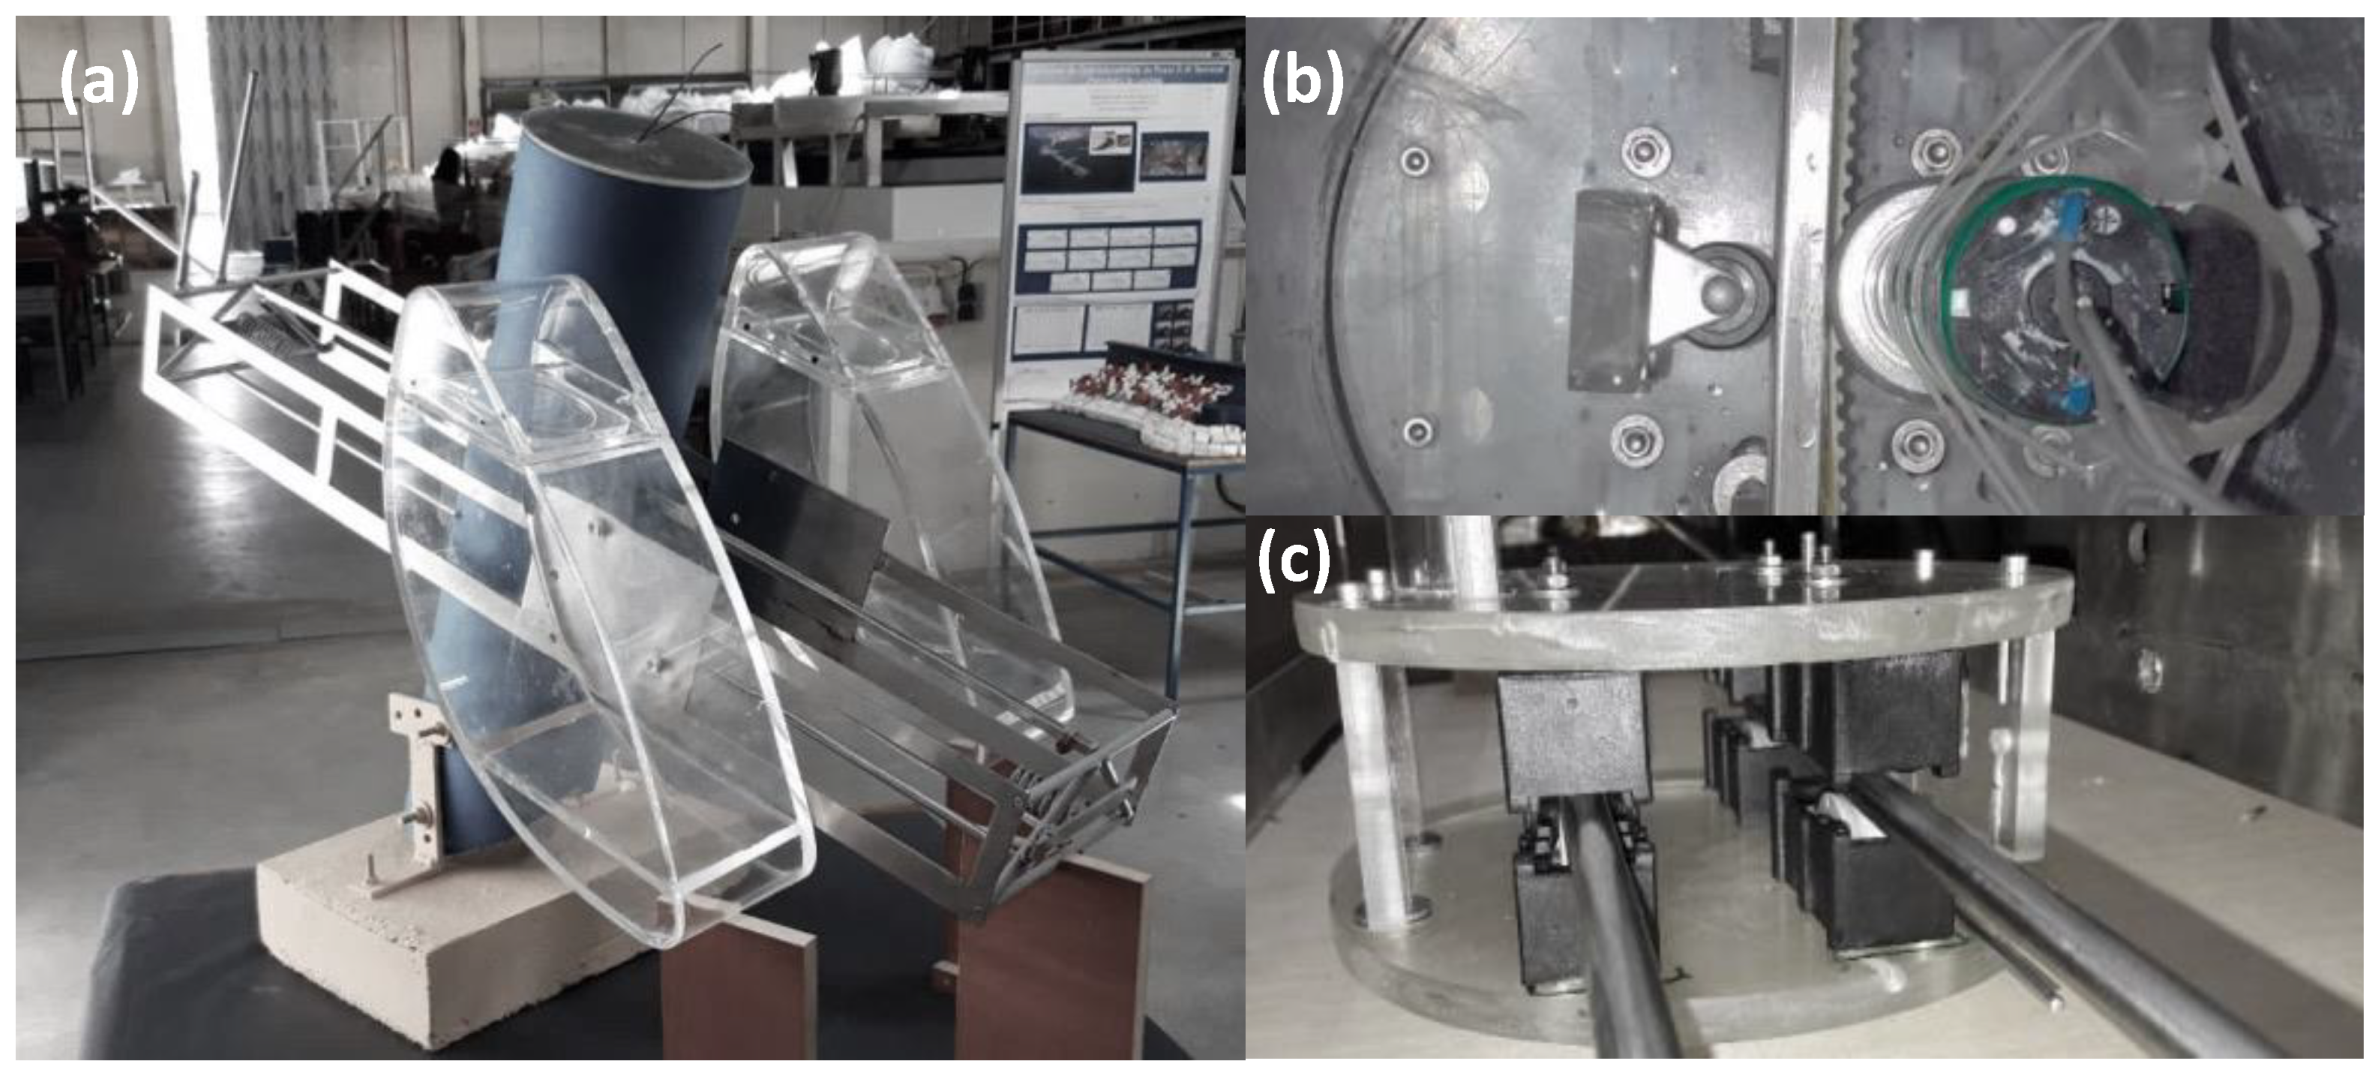
4.3. Case Study 3: CECO Experimental PTO Physical Model

The CECO device is a sloped type of oscillatory WEC having a direct drive type of PTO system. This device is composed of two lateral mobile modules (LMMs), a central frame, and a fixed supporting structure, Figure 16a. The block formed by the central frame connected to the two LMMs oscillates along an inclined direction of motion, Figure 16b. Different scaled models (1:20–25) of CECO were constructed and tested at the wave basin of the Hydraulics Laboratory of the Faculty of Engineering of the University of Porto [35,36,37]. As envisioned for the real-scale design, the frame motions activate the PTO system enclosed into a fixed or floating supporting structure [38,39].
The PTO of CECO mainly consists of a rack-pinion mechanism and an electric generator, Figure 17b. The frame is constrained to slide along the inclined direction by a set of low friction bearings, Figure 17c.
The experimental models of CECO were used in proof-of-concept testing. The PTO generator was able to simulate realistically the damping effect. For that purpose, an electric circuit was built and used for implementing different external resistances (in the range of 1 to 100 Ω) as generator load. The method for characterizing the PTO was based on the following equation [36]:
P ¯ p t o = P T _ 0   P T _ 1
where P T _ 0 and P T _ 1 represent the power absorbed without and with the PTO damping, respectively. The wave power absorption can then be assessed by considering the model-scale device as a kinetic energy harvester (KEH). Based on the results of regular wave tests, a series of PTO damping values can be defined ( C p t o ) associated with the resistance values applied to the PTO circuit. In combination, the response amplitude operators (RAO) and the energy spectrum of response can be calculated. Successively, assuming linearity, the power in irregular sea states can be estimated by integrating the following equation [36]:
d P ¯ p t o ( f ) = m ω 3 S ζ ( f ) ( S 0 ( f ) S 1 ( f ) ) d f
where m is the mass of the LMMs, ω the angular frequency of the LMMs oscillations and S ζ the sea spectrum. S 0 and S 1 are the energy spectrum of response for the device without and with the PTO simulator switched on, respectively.
The method applied for characterizing the PTO of CECO based on the KEH approach allows easily overcoming uncertainties due to the unwanted energy losses related to the dynamic or static friction existing between the moving components of the experimental set-up. The technique is valuable at an initial stage of research, for instance, during the preliminary studies, where pilot assessments of the device efficiency and the concept functionality have to be carried out.

4.4. Discussion

The case studies treated allowed to confirm that if certain recommendations and approaches are being followed the experimental testing can be improved and carried out successfully. Each case study had a different way of PTO modelling thus eventually some of the recommendations depending on a particular case may be less relevant to others. In Table 3 are summarized recommendations and approaches proposed. In this table, the symbol “V” indicates that the mentioned recommendation is documented within the correspondent case study and the “Na” symbol, instead, means that the recommendation is not explicitly adopted within the study or no information is available.
The three case studies address and attempt to overcome specific challenges related to PTO physical modelling. The first case study aimed at reducing friction by trying to improve calibration methods and the experimental set-up, including all its components, e.g., measurements sensors, the electric motor, the spring, the pulley, and mooring cable. During the study, the uncertainty analysis allowed us to perform valid improvements of the experimental set-up and PTO calibration. Differently, the second case study focused on an eddy current based PTO damping mechanisms. Such custom-made PTO simulators allow very low friction to occur and have the advantage that can be highly tailored to needs compared to using an electric motor (e.g., as for Case study 1). As with this type of PTO simulator high accuracy may be expected, the option could be optimal. On the other hand, dealing with tolerances, the PTO system design and tuning can be laborious processes. Lately, the third case study points out that a miniaturized type of PTO can still be used at small scales with some degree of uncertainties. This case study also showed that if a KEH approach is implemented in assessing experimental results obtained with the adopted type of PTO physical model, a good insight into the device performance characteristics could be achieved.

5. Conclusions

In this paper, an overview of PTO physical modelling for WEC testing at a small scale was presented. Efforts were directed towards providing basic theory, practical guidelines, recommendations and examples for planning PTO physical modelling.
To obtain reliable experimental results, attention should be paid towards adopting and choosing the correct experimental set-up, calibration and uncertainty analysis practices. Concerning the experimental set-up, particular focus should be oriented for reducing mechanical friction between moving parts. Once the experimental set-up is optimized, extended calibration, work is required. Eventually, the implementation of more than a single methodology for characterizing and calibrating the PTO system could lead to better results. This observation is supported by examples relative to previous experimental works, at model scale, concerning three different WECs, which were treated in the form of case studies. In general, depending on the type of system, reproducing the effect of the PTO at the laboratory may be done by implementing only customized solutions. Nevertheless, methodologies applied in the past by other authors (e.g., those covered in the case studies presented) can be eventually be adopted in future experiments. In general, it is also of utmost relevance to plan well, with some anticipation, the experimental work and carefully document the experimental set-up, procedures, and calibration methodologies undertaken. Finally, to support results it is important to assess accurately PTO related uncertainty. In this context, a formal uncertainty analysis is highly suggested at the different stages of progress.

Author Contributions

Conceptualization, G.G., I.T. and P.R.-S.; methodology, G.G.; formal analysis, G.G.; investigation, G.G. and Z.S.; resources, G.G., Z.S. and P.R.-S.; data curation, G.G. and Z.S.; writing—original draft preparation, G.G. and Z.S.; writing—review and editing, P.R.-S., I.T., M.G., J.E. and V.R.; visualization, G.G. and Z.S.; supervision, P.R.-S., I.T., M.G., S.D. and J.E.; project administration, P.R.-S. and F.T.-P.; funding acquisition, G.G., P.R.-S. and F.T.-P. All authors have read and agreed to the published version of the manuscript.

Funding

This work was performed as part of a Short Term Scientific Mission (STSM) at Uppsala University, Sweden, undertaken by the first author, thank the WECANet COST Action (CA17105). The authors would like also to thank the support from: the Project OPWEC (POCI-01-0145-FEDER-016882, PTDC/MAR-TEC/6984/2014) funded/co-funded by FEDER through COMPETE 2020–Programa Operacional Competitividade e Internacionalização (POCI) and by Portuguese national funds, through the FCT-Fundacão para a Ciência e a Tecnologia, IP; the project PORTOS–Ports Towards Energy Self-Sufficiency (EAPA 784/2018), co-financed by the Interreg Atlantic Area Programme through the European Regional Development Fund; and the project WEC4Ports–A hybrid Wave Energy Converter for Ports (OCEANERA-NET COFUND) funded under the frame of FCT. The authors would like to further acknowledge the project STandUP for Energy and Project 47264-1 funded by the Swedish Energy Authority, and the support provided by the Uppsala University.

Acknowledgments

The first author would like to acknowledge the Department of Naval, Architecture, Ocean and Marine Engineering of the University of Strathclyde for the support during his PhD.

Conflicts of Interest

The authors declare no conflict of interest.

References

  1. De O. Falcão, A.F. Wave energy utilization: A review of the technologies. Renew. Sustain. Energy Rev. 2010, 14, 899–918. [Google Scholar] [CrossRef]
  2. Cruz, J. Ocean Wave Energy Current Status and Future Perspectives; Springer Science & Business Media: Bristol, UK, 2008. [Google Scholar]
  3. Sheng, W.; Alcorn, R.; Lewis, T. Physical modelling of wave energy converters. Ocean Eng. 2014, 84, 29–36. [Google Scholar] [CrossRef]
  4. Beatty, S.; Ferri, F.; Bocking, B.; Kofoed, P.J.; Buckham, B. Power Take-Off Simulation for Scale Model Testing of Wave Energy Converters. Energies 2017, 10, 973. [Google Scholar] [CrossRef] [Green Version]
  5. International Towing Tank Conference. Uncertainty Analysis, Instrument Calibration. Available online: https://www.ittc.info/media/7979/75-01-03-01.pdf (accessed on 24 March 2020).
  6. International Towing Tank Conference. Testing and Extrapolation Methods Resistance Test. Available online: https://ittc.info/media/2019/75-02-02-01.pdf (accessed on 24 March 2020).
  7. Marine Renewables Infrastructure Network. WP2: Marine Energy System Testing—Standardisation and Best Practice Deliverable 2.11 Best Practice Manual for PTO Testing. 2015. Available online: http://www.marinet2.eu/wp-content/uploads/2017/04/D2.11-best-practice-manual-for-PTO-testing.pdf (accessed on 24 March 2020).
  8. Payne, G. Guidance for the Experimental Tank Testing of Wave Energy Converters. Available online: https://www.supergen-marine.org.uk/sites/supergen-marine.org.uk/files/publications/WEC_tank_testing.pdf (accessed on 24 March 2020).
  9. International Towing Tank Conference. Uncertainty Analysis for a Wave Energy Converter. Available online: https://www.ittc.info/media/8135/75-02-07-0312.pdf (accessed on 24 March 2020).
  10. European Marine Energy Cetre. Tank Testing on Wave Energy Conversion Systems. 2009. Available online: http://www.emec.org.uk/ (accessed on 2 March 2020).
  11. Viviano, A.; Naty, S.; Foti, E. Scale effects in physical modelling of a generalized OWC. Ocean Eng. 2018, 162, 248–258. [Google Scholar] [CrossRef] [Green Version]
  12. Falcão, A.F.O.; Henriques, J.C.C. Model-prototype similarity of oscillating-water-column wave energy converters. Int. J. Mar. Energy 2014, 6, 18–34. [Google Scholar] [CrossRef]
  13. Benreguig, P.; Murphy, J. Modelling Air Compressibility in OWC Devices with Deformable Air Chambers. J. Mar. Sci. Eng. 2019, 7, 268. [Google Scholar] [CrossRef] [Green Version]
  14. Falcão, A.F.O.; Henriques, J.C.C. Oscillating-water-column wave energy converters and air turbines: A review. Renew. Energy 2016, 85, 1391–1424. [Google Scholar] [CrossRef]
  15. Fleming, A.; Macfarlane, G. In-situ orifice calibration for reversing oscillating flow and improved performance prediction for oscillating water column model test experiments. Int. J. Mar. Energy 2017, 17, 147–155. [Google Scholar] [CrossRef]
  16. Xia, J.; Durfee, W.K. Analysis of Small-Scale Hydraulic Actuation Systems. J. Mech. Des. 2013, 135, 091001. [Google Scholar] [CrossRef] [Green Version]
  17. Jin, S.; Patton, R.J.; Guo, B. Viscosity effect on a point absorber wave energy converter hydrodynamics validated by simulation and experiment. Renew. Energy 2018, 129, 500–512. [Google Scholar] [CrossRef]
  18. Hinostroza, M.A.; Xu, H.T.; Guedes Soares, C. Manouvring test for a self-running ship model in various water depth conditions. In Proceedings of the 18th International Congress of the Maritme Association of the Mediterranean (IMAM 2019), Varna, Bulgaria, 9–11 September 2019. [Google Scholar]
  19. Payne, G.S.; Taylor, J.R.M.; Bruce, T.; Parkin, P. Assessment of boundary-element method for modelling a free-floating sloped wave energy device. Part 2: Experimental validation. Ocean Eng. 2008, 35, 342–357. [Google Scholar] [CrossRef] [Green Version]
  20. Beatty, S.J.; Hall, M.; Buckham, B.J.; Wild, P.; Bocking, B. Experimental and numerical comparisons of self-reacting point absorber wave energy converters in regular waves. Ocean Eng. 2015, 104, 370–386. [Google Scholar] [CrossRef]
  21. Ruehl, K.; Forbush, D.D.; Yu, Y.-H.; Tom, N. Experimental and numerical comparisons of a dual-flap floating oscillating surge wave energy converter in regular waves. Ocean Eng. 2020, 196, 106575. [Google Scholar] [CrossRef]
  22. Zurkinden, A.S.; Ferri, F.; Beatty, S.; Kofoed, J.P.; Kramer, M.M. Non-linear numerical modeling and experimental testing of a point absorber wave energy converter. Ocean Eng. 2014, 78, 11–21. [Google Scholar] [CrossRef]
  23. Vijayakrishna Rapaka, E.; Natarajan, R.; Neelamani, S. Experimental investigation on the dynamic response of a moored wave energy device under regular sea waves. Ocean Eng. 2004, 31, 725–743. [Google Scholar] [CrossRef]
  24. Chaplin, R.V. Seaweaver: A new surge-resonant wave energy converter. Renew. Energy 2013, 57, 662–670. [Google Scholar] [CrossRef]
  25. Neill, S.P.; Hashemi, M.R. Chapter 1-Introduction. In Fundamentals of Ocean Renewable Energy; Neill, S.P., Hashemi, M.R., Eds.; Academic Press: London, UK, 2018; pp. 1–30. ISBN 978-0-12-810448-4. [Google Scholar] [CrossRef]
  26. Giannini, G. Mooring Analysis and Design for Wave Energy Converters; University of Strathclyde Online Library: Glasgow, UK, 2018. [Google Scholar]
  27. Taylor, J.R.M.; Mackay, I. The Design of an Eddy Current Dynamometer for a Free-Floating Sloped IPS Buoy. Available online: https://pdfs.semanticscholar.org/4cb4/8aa54cd7bfb8583245e3f3d05cefd36d84a1.pdf (accessed on 24 July 2020).
  28. Lopes, M.F.P.; Henriques, J.C.C.; Lopes, M.C.; Gato, L.M.C.; Dente, A. Design of a non-linear power take-off simulator for model testing of rotating wave energy devices. In Proceedings of the 8th European Wave and Tidal Energy Conference (EWTEC), Uppsala, Sweden, 7–10 September 2009. [Google Scholar]
  29. Troch, P.; Stratigaki, V.; Stallard, T.; Forehand, D.; Folley, M.; Kofoed, J.P.; Benoit, M.; Babarit, A.; Gallach-Sánchez, D.; De Bosscher, L.; et al. Physical Modelling of an Array of 25 Heaving Wave Energy Converters to Quantify Variation of Response and Wave Conditions. In Proceedings of the 10th European Wave and Tidal Energy Conference, Aalborg, Denmark, 2–5 September 2013. [Google Scholar]
  30. Stratigaki, V.; Troch, P.; Stallard, T.; Forehand, D.; Kofoed, P.J.; Folley, M.; Benoit, M.; Babarit, A.; Kirkegaard, J. Wave Basin Experiments with Large Wave Energy Converter Arrays to Study Interactions between the Converters and Effects on Other Users in the Sea and the Coastal Area. Energies 2014, 7, 701–734. [Google Scholar] [CrossRef]
  31. EquiMar. Equitable Testing and Evaluation of Marine Energy Extraction Devices in terms of Performance, Cost and Environmental Impact. Available online: https://tethys.pnnl.gov/publications/equitable-testing-evaluation-marine-energy-extraction-devices-terms-performance-cost (accessed on 24 July 2020).
  32. Beyer, W. Handbook of Tables for Probability and Statistics, 2nd ed.; CRC Press: Boca Raton, FL, USA, 2017. [Google Scholar]
  33. Shahroozi, Z.; Eriksson, M.; Göteman, M.; Engström, J. Design and evaluation of linear and rotational generator scale models for wave tank testing. In Proceedings of the 4th International Conference on Renewable Energies Offshore (RENEW), Lisbon, Portugal, 12–15 October 2020. [Google Scholar]
  34. Sodano, H.A.; Bae, J.-S. Eddy Current Damping in Structures. Shock Vib. Dig. 2004, 36, 469. [Google Scholar] [CrossRef] [Green Version]
  35. Rodríguez, C.A.; Rosa-Santos, P.; Taveira-Pinto, F. Hydrodynamic optimization of the geometry of a sloped-motion wave energy converter. Ocean Eng. 2020, 199, 1070468. [Google Scholar] [CrossRef]
  36. Rodríguez, C.A.; Rosa-Santos, P.; Taveira-Pinto, F. Experimental Assessment of the Performance of CECO Wave Energy Converter in Irregular Waves. J. Offshore Mech. Arct. Eng. 2019, 141. [Google Scholar] [CrossRef]
  37. Rosa-Santos, P.; Taveira-Pinto, F.; Teixeira, L.; Ribeiro, J. CECO wave energy converter: Experimental proof of concept. J. Renew. Sustain. Energy 2015, 7, 061704. [Google Scholar] [CrossRef]
  38. Marinheiro, J.; Rosa-Santos, P.; Taveira-Pinto, F.; Ribeiro, J. Feasibility study of the CECO wave energy converter. In Maritime Technology and Engineering; Informa UK Limited: London, UK, 2014; pp. 1259–1267. ISBN 978-1-138-02727-5. [Google Scholar] [CrossRef]
  39. Giannini, G.; Rosa-Santos, P.; Ramos, V.; Taveira-Pinto, F. On the Development of an Offshore Version of the CECO Wave Energy Converter. Energies 2020, 13, 1036. [Google Scholar] [CrossRef] [Green Version]
Figure 1. Types of wave energy converters and examples.
Jmse 08 00632 g001
Figure 2. Froude scaling factor for power (note: vertical axis has a logarithmic scale).
Jmse 08 00632 g002
Figure 3. Scheme of connections for closed-loop control of an electric motor PTO simulator.
Jmse 08 00632 g003
Figure 4. Spherical point absorber considered.
Jmse 08 00632 g004
Figure 5. Point absorber devices tested at: (a) 1:86 and (b) 1:33 model scales.
Jmse 08 00632 g005
Figure 6. Experimental set-up for the point absorber experiments. The dashed red oval indicates the PTO simulator.
Jmse 08 00632 g006
Figure 7. Electric servomotor and its worm damping the mooring line.
Jmse 08 00632 g007
Figure 8. Initial calibration of PTO damping with weights drop-tests for the two directions of rotation of the servomotor.
Jmse 08 00632 g008
Figure 9. Calibration set-up for PTO simulator, adapted from [26].
Jmse 08 00632 g009
Figure 10. Example of decay test for servomotor calibration.
Jmse 08 00632 g010
Figure 11. Calibration matrix of PTO simulator.
Jmse 08 00632 g011
Figure 12. Rotational PTO, including the disk, the pulleys and the coils, (a) front and (b) lateral views.
Jmse 08 00632 g012
Figure 13. Linear PTO including the rod, the end-stop and the coil, (a) front and (b) lateral views.
Jmse 08 00632 g013
Figure 14. Results of rotatory PTO for scale 1:30. To the right is the damping versus the mass of the weight for different coil current. To the left is the damping versus current for a different mass of the weight.
Jmse 08 00632 g014
Figure 15. Results of linear PTO for 1:30 scale. To the right is the friction force versus the mass of the weight for different coil current. To the left is the damping versus current for a different mass of the weight.
Jmse 08 00632 g015
Figure 16. CECO wave energy converter: (a) main components and (b) working concept.
Jmse 08 00632 g016
Figure 17. CECO wave energy converter: (a) 1:25 physical model, (b) rack-pinion system, (c) sliding frame fittings.
Jmse 08 00632 g017
Table 1. Common scaling factors used in WEC experimental testing campaigns.
QuantityScaling Law
Linear displacement s
Angular displacement 1
Translational velocity s 0.5
Angular velocity s 0.5
Translational acceleration 1
Angular acceleration s 1
Mass s 3
Force s 3
Torque s 4
Power s 3.5
Linear stiffness s 2
Angular stiffness s 4
Linear damping s 2.5
Angular damping s 4.5
Wave height and length s
Wave period s 0.5
Wave frequency s 0.5
Power density s 2.5
Table 2. Phases for WEC development, adapted from the European Marine Energy Centre [10].
Phase 1
Validation Model
Phase 2
Design Model
Phase 3
Process Model
Phase 4
Prototype
Phase 5
Full Size
Scale ( λ ) 1:25–1001:10–251:3–101:21:1
Technology readiness level (TRL)1–34–56–78–9
Testing environment2D flume and 3D wave tanks3D basinSheltered sea site (benign)Exposed sea siteOpen sea location
Duration of tests including analysis1–3 weeks1–3 months1–3 months6–12 months6–18 months12–36 months1–5 years
Typical no. of tests50–500250–500100–250100–25050–250continuousstatistical sample
Indicative budget (€,000)1–525–7525–5050–2501000–25005000–10,0002500–7500
Conditions to testRegular waves
Up to 5 irregular sea states tests (unidirectional)
Irregular sea states (short and log crested, multidirectional sea states)Pilot site sea spectra
Long and short crested classical seas
(multidirectional sea states)
Extended test at sea to ensure all seaways are includedFull evaluationFull evaluation
PTO systemPTO simulatorMiniaturized PTOReal PTOCertified PTO
Table 3. Recommendations implemented during case studies.
Recommendation or ApproachCase Study 1Case Study 2Case Study 3
Experimental set-upMinimize frictionVVV
Minimize inertia of PTO componentsNaNaV
Use of industrial-grade equipmentVVNa
Ensure rigidityVNaNa
Use machined parts and advanced materialsVVV
Reduce complexitiesVVNa
CalibrationExplore target PTO force and velocities valuesVVV
PTO oscillation testsVNaNa
Test, disassemble, reassemble, and re-testVNaV
Keep the PTO rig as it is when moving in the wave tankVNaV
Errors estimat.Informal error estimationNaNaV
Formal uncertainty analysis methodsVNaNa

