Article

The Contribution of Forerunner to Storm Surges along the Vietnam Coast

1
Vietnam National Centre for Hydro-Meteorological Forecasting, No. 8 Phao Dai Lang Street, Lang Thuong Commune, Dong Da District, Hanoi 11512, Vietnam
2
Oceans Graduate School and the UWA Oceans Institute, The University of Western Australia, 35 Stirling Highway, Perth WA 6009, Australia
3
Faculty of Marine Sciences, Hanoi University of Natural Resource and Environment, No. 41A Phu Dien Road, Phu Dien Commune, North-Tu Liem District 11916, Hanoi, Vietnam
*
Author to whom correspondence should be addressed.
J. Mar. Sci. Eng. 2020, 8(7), 508; https://doi.org/10.3390/jmse8070508
Submission received: 3 May 2020 / Revised: 6 July 2020 / Accepted: 7 July 2020 / Published: 10 July 2020
(This article belongs to the Section Physical Oceanography)

Abstract

:
Vietnam, located in the tropical region of the northwest Pacific Ocean, is frequently impacted by tropical storms. Occurrence of extreme water level events associated with tropical storms are often unpredicted and put coastal infrastructure and safety of coastal populations at risk. Hence, an improved understanding of the nature of storm surges and their components along the Vietnam coast is required. For example, a higher than expected extreme storm surge during Typhoon Kalmegi (2014) highlighted the lack of understanding on the characteristics of storm surges in Vietnam. Physical processes that influence the non-tidal water level associated with tropical storms can persist for up to 14 days, beginning 3–4 days prior to storm landfall and cease up to 10 days after the landfall of the typhoon. This includes the forerunner, ‘direct’ storm surge, and coastally trapped waves. This study used a continuous record of six sea level time series collected over a 5-year period (2013–2017) from along the Vietnam coast and Hong Kong to examine the contribution of the forerunner to non-tidal water level. The forerunner is defined as the gradual increase in mean water level, 2–3 days prior to typhoon landfall and generated by shore parallel winds and currents that result in a mean higher water level at the coast. Results indicated that a forerunner was generated by almost all typhoons, at least at one station, with a range between 20 and 50 cm. The forerunner contributed up to 50% of the water level change due to the storm. Combination of forerunner and onshore winds generated storm surges that were much higher (to 70 cm). It was also found that the characteristics of the typhoon (e.g., path, speed, severity and size) significantly influenced the generation of the forerunner. It is recommended that the forerunner that is not currently well defined in predictive models should be included in storm surge forecasts.

1. Introduction

Potential impacts of extreme water level events on global coastlines are increasing as populations grow and mean sea levels rise. To better prepare for the future, coastal engineers and managers require accurate estimates of extreme water levels. Occurrence of extreme water levels along low-lying, highly populated and/or developed coastlines can lead to considerable loss of life and billions of dollars of damage to coastal infrastructure [1,2]. For countries located along tropical and sub-tropical regions, the most extreme events are generated through tropical storm systems referred to as tropical cyclones, hurricanes, and typhoons, depending on the region (here we adopt the term ‘typhoon’, the relevant term for the study region). These storm systems are among the most energetic forcing agents for the coastal ocean and are associated with extreme winds and rainfall that result in severe damages to property and lives not only in coastal regions but also in the hinterland. Extreme high-water levels and surface gravity waves are also associated with typhoons, resulting in additional damage to coastlines through erosion and inundation [3,4]. In recent years, many typhoons have had severe impacts on coastal regions and through climate change it is expected that the severity and frequency of these events will increase. Recent notable storms include: Typhoon Haiyan (known in the Philippines as Super Typhoon Yolanda); Typhoon Doksuri in Vietnam; Tropical Cyclones Kyarr and Gonu in the Arabian Sea; Tropical Cyclones Hudhud in Bay of Bengal; Tropical Cyclone Enawo in Madagascar; Hurricanes Sandy, Katrina and Harvey in the US; and Hurricane Irma in the Caribbean. Recently, under the impact of global warming and climate change, concerns about such storm surges and other extreme weather events have raised the awareness in scientists, conservationists, and governments [1,2,4,5,6].
Vietnam is one of the most vulnerable countries impacted from the extreme sea levels associated with storm surges due to a high proportion of low-lying coastal areas and being in a typhoon basin. Risks associated with storm surges were highlighted in public and scientific communities in Vietnam because of the devastating storm surge caused by Typhoon Haiyan (2013) in the Philippines, a country is also located in the same typhoon region as Vietnam. Very few studies addressing storm surges in Vietnam have been conducted, especially in terms of engineering and planning perspectives. A recent study by Thai et al. [7] examined the interaction of tide, surge, and waves on storm surges by using the SuWAT model. Others mainly focused on the general character and social impacts of storm surges in specific parts, for example, the vulnerability, experience or risk management in the southern part or Red River delta. This indicates a lack of understanding of storm surges particularly physical processes that contribute to the mechanisms of storm surge generation in Vietnam.
The use of numerical models in predicting storm surges to provide early warnings and potential risks for coastal communities has become more popular in operational forecasting due to many advantages like their ability, power, and accuracy. Some storm surge models are well-developed such as the Sea, Lake, and Overland Surges from Hurricanes model (SLOSH); the Mike21 and Mike Flood models; the Delft3D coastal surge model; and the Japan Meteorological Agency (JMA) storm surge model [8]. However, these models have not considered all the physical processes that contribute to generating the non-tidal sea level (defined as the residual component of the water level subsequent to removal of the tidal component) 2–3 days prior to storm landfall or forerunner. This can be the reason why forecasters in the United States of America (USA) were not able to predict a high surge along the western Louisiana and the northern Texas coasts before Hurricane Ike (2008) made landfall [9]. Similarly, forecasters in Vietnam did not provide any flood warnings regarding an abnormal increase in sea level for coastal regions due to Typhoon Kalmaegi (in 2014) when it made landfall in the north of Vietnam [10]. This indicates a major shortcoming of existing storm surge models in Vietnam and an urgent need to improve them for better future forecasting.
Forerunner is defined as an increase in the mean water level up to several days prior to storm landfall. When the typhoon is far offshore (>500 km), the wind direction usually has a shore parallel component that generates alongshore currents bounded by the shoreline. This leads to an approximate geostrophic balance between the Coriolis force generated by the alongshore current and the across shelf pressure gradient (Figure 1). The increase in water level at the coast is defined as Ekman set-up and expressed as [9,11,12,13]:
ζ E K =   f U g d x
where f is the Coriolis parameter (= 2Ωsinϕ; Ω is angular velocity of the Earth and ϕ is the latitude), U is the alongshore ocean current speed, g is the gravitational acceleration, and x-axis aligned in the cross-shore direction. Thus, the factors that control timing and magnitude of forerunner are the Coriolis parameter; alongshore-current speed U and the cross-shore width of the current; the offshore limit of the integration is in Equation (1). Usually, at the beginning of the forerunner, the typhoon is located usually far (500–1000 km) from land, and thus, the atmospheric pressure effect (inverted barometric effect) does not have a significant contribution. Due to the scale of the storm system, the wind action on the continental shelf is present a few days prior to typhoon landfall, resulting in an increase in the mean water level, adding to the total water level at the peak of the storm surge. Under strong alongshore currents (~1 ms−1), the sea level gradients can be ~1 cm per km of cross-shelf distance that can be significant for storm systems that have diameters ~100 km or greater [14]. This is illustrated through the example of Hurricane Ike (2008), where it caused a large and unpredicted increase in water levels along western Louisiana and northern Texas coasts (USA) with water levels reaching 3 m above mean sea level, 12–24 h prior to hurricane landfall [9].
The main aim of this paper is to examine, through analysis of tide gauge records, the contribution of forerunner to the non-tidal water level along the Vietnam coast. The results will contribute to an understanding of processes and the improvement of storm surge forecasting in Vietnam and other locations that are impacted by tropical storms (TCs).
This paper is arranged as follows: the study region (bathymetry, historical storm characteristics, and tidal regime) is described in Section 2; the methodology is presented in Section 3. Results and discussion are given in Section 4 and Section 5, respectively; and conclusions in Section 6.

2. Study Region

Vietnam is an S-shaped strip of land, stretching from 23°23′N to 8°27′N latitude in Southeast Asia bordering the Northwest Pacific Ocean (Figure 2). It is in one of the most active Typhoon basins in the world (~30% of the world′s annual tropical storms occur in this region). On average, 11 typhoons impact the East Sea of Vietnam (also called the South China Sea) annually, with ~6 typhoons directly affecting the Vietnam coast [15,16]. Under climate change, the number and intensity of typhoons are expected to increase [1,15]. With 3260 km of coastline and a high population density, Vietnam is one of the most vulnerable regions to be impacted by typhoons and associated storm surges. During Typhoon Linda (in 1997), 788 people died, 1142 were injured, 2541 people were missing, and 2789 boats and ships were sunk [16]. Deadly Typhoon Doksuri (2017) was the most destructive typhoon to impact the region and caused widespread localized flooding with a severe storm surge (>2 m) [17].

2.1. Bathymetry

There are contrasting topographic and bathymetric features between the northern and southern regions of the Vietnam coast. The ‘S’ shape coastline is bounded by two shallow Gulfs: Gulf of Tonkin in the north and Gulf of Thailand in the south. The central region consists of a relatively narrow continental shelf. There are two main delta regions: Red River delta in the north and the Mekong delta in south. These regions consist of low coastal topography (from 1 to 10 m above mean sea level), are associated with mega cities (e.g., population of Ho Chi Minh > 5 million) and are vulnerable coastal regions to storm surge impacts. The Vietnam coast can be separated into three sections based on the topographic characteristics of the continental shelf: (1) Northern section from 17°N to 22°N, including the Gulf of Tonkin, which is relatively shallow with 50 m depth contour located far away from the coastline (Figure 2) and which is semi-enclosed with many estuaries, islands, and lowland areas; (2) Central section is from 11°N to 17°N with many mountains along the coast with narrow coastal plains, and where the continental shelf is very narrow and steep with the 50 m depth contour located close to the coastline (Figure 2); and (3) Southern section is a large tidal-flat with mild slopes and shallow depths, and which is the downstream area of the Mekong River with many estuaries to the East Sea.

2.2. Storm Characteristics

Typhoons impact the East Sea mainly between June and November (northern summer) with ~11 typhoons impacting the coast annually. However, their influence on each of the three sections of coast is different: The Northern coast experiences the highest number (~58%), followed by the Central coast (~37%) and the Southern coasts (~5%) [16]. Therefore, the northern and central sections are the most vulnerable impacts from typhoons and storm surges. The maximum storm surge height (3.6 m) was recorded in Ha Tinh province in Typhoon Dan (1989) along the northern section [15]. According to the results of the study of Takagi et al. [18], the potential maximum of the storm surge for the southern sections is ~1 m, which has a close relationship with potential disaster risks from TCs and storm surges for this coastal region. The frequency of typhoons and super-typhoons have increased in recent years by 28% from 1951 to 2014 for typhoons over level 12, and 47% for typhoons over level 10 [15].

2.3. Tidal Regime

The tidal regime along the coast includes both diurnal and semi-diurnal tides with transitions between the two regimes (Table 1). This is due to the tidal waves originating from both the Pacific and Indian Oceans propagating through narrow straits influenced by the complex topography of the East Sea [19]. The semi-diurnal tides from the Pacific Ocean entering the East Sea become predominantly diurnal with significant increasing amplitudes. Tidal amplitudes at the Hon Dau in the Northern Gulf of Tonkin are the largest with tidal amplitudes over 4 m (Figure 2). Along the Vietnam coast, the tidal regime is diverse with different amplitudes that can be divided into four types: dominantly diurnal, mixed diurnal, semi-diurnal, and mixed semi-diurnal (Table 1).

3. Methodology

3.1. Data

Water level data, at hourly intervals, from 1 January 2013 to 31 December 2017, were obtained from the Hydro-meteorological and Environmental Station Network Center (the Hymenet, Vietnam) for five tide gauge stations along the Vietnam coast (Figure 2). These data were augmented by the record at Hong Kong from the research quality dataset available through the NOAA National Centers for Environmental Information joint archive for sea level [20]. Although the Hong Kong station does not belong to the Vietnam coast, it was included because forerunner or storm surges at this location could propagate to the south, influencing sea levels along the northern coast of Vietnam. The locations of the tide gauges used in the analysis are (see Figure 2 and Table 2): Hong Kong, Hon Dau, Hon Ngu, Son Tra, Quy Nhon, and Vung Tau, spanning a distance ~2330 km.
Information on historic typhoon events were extracted from the Japan Meteorological Agency (JMA), which provided details on time histories of storm parameters such as longitude and latitude of central pressure, storm intensity, maximum sustained wind, wind direction, and radius for maximum winds. The u and v components of wind at 10 m were obtained from ERA5 observations ECMWF reanalysis (ERA5) at hourly intervals. These databases were used to identify the characteristics of each typhoon that included its path, intensity, size, and wind field.
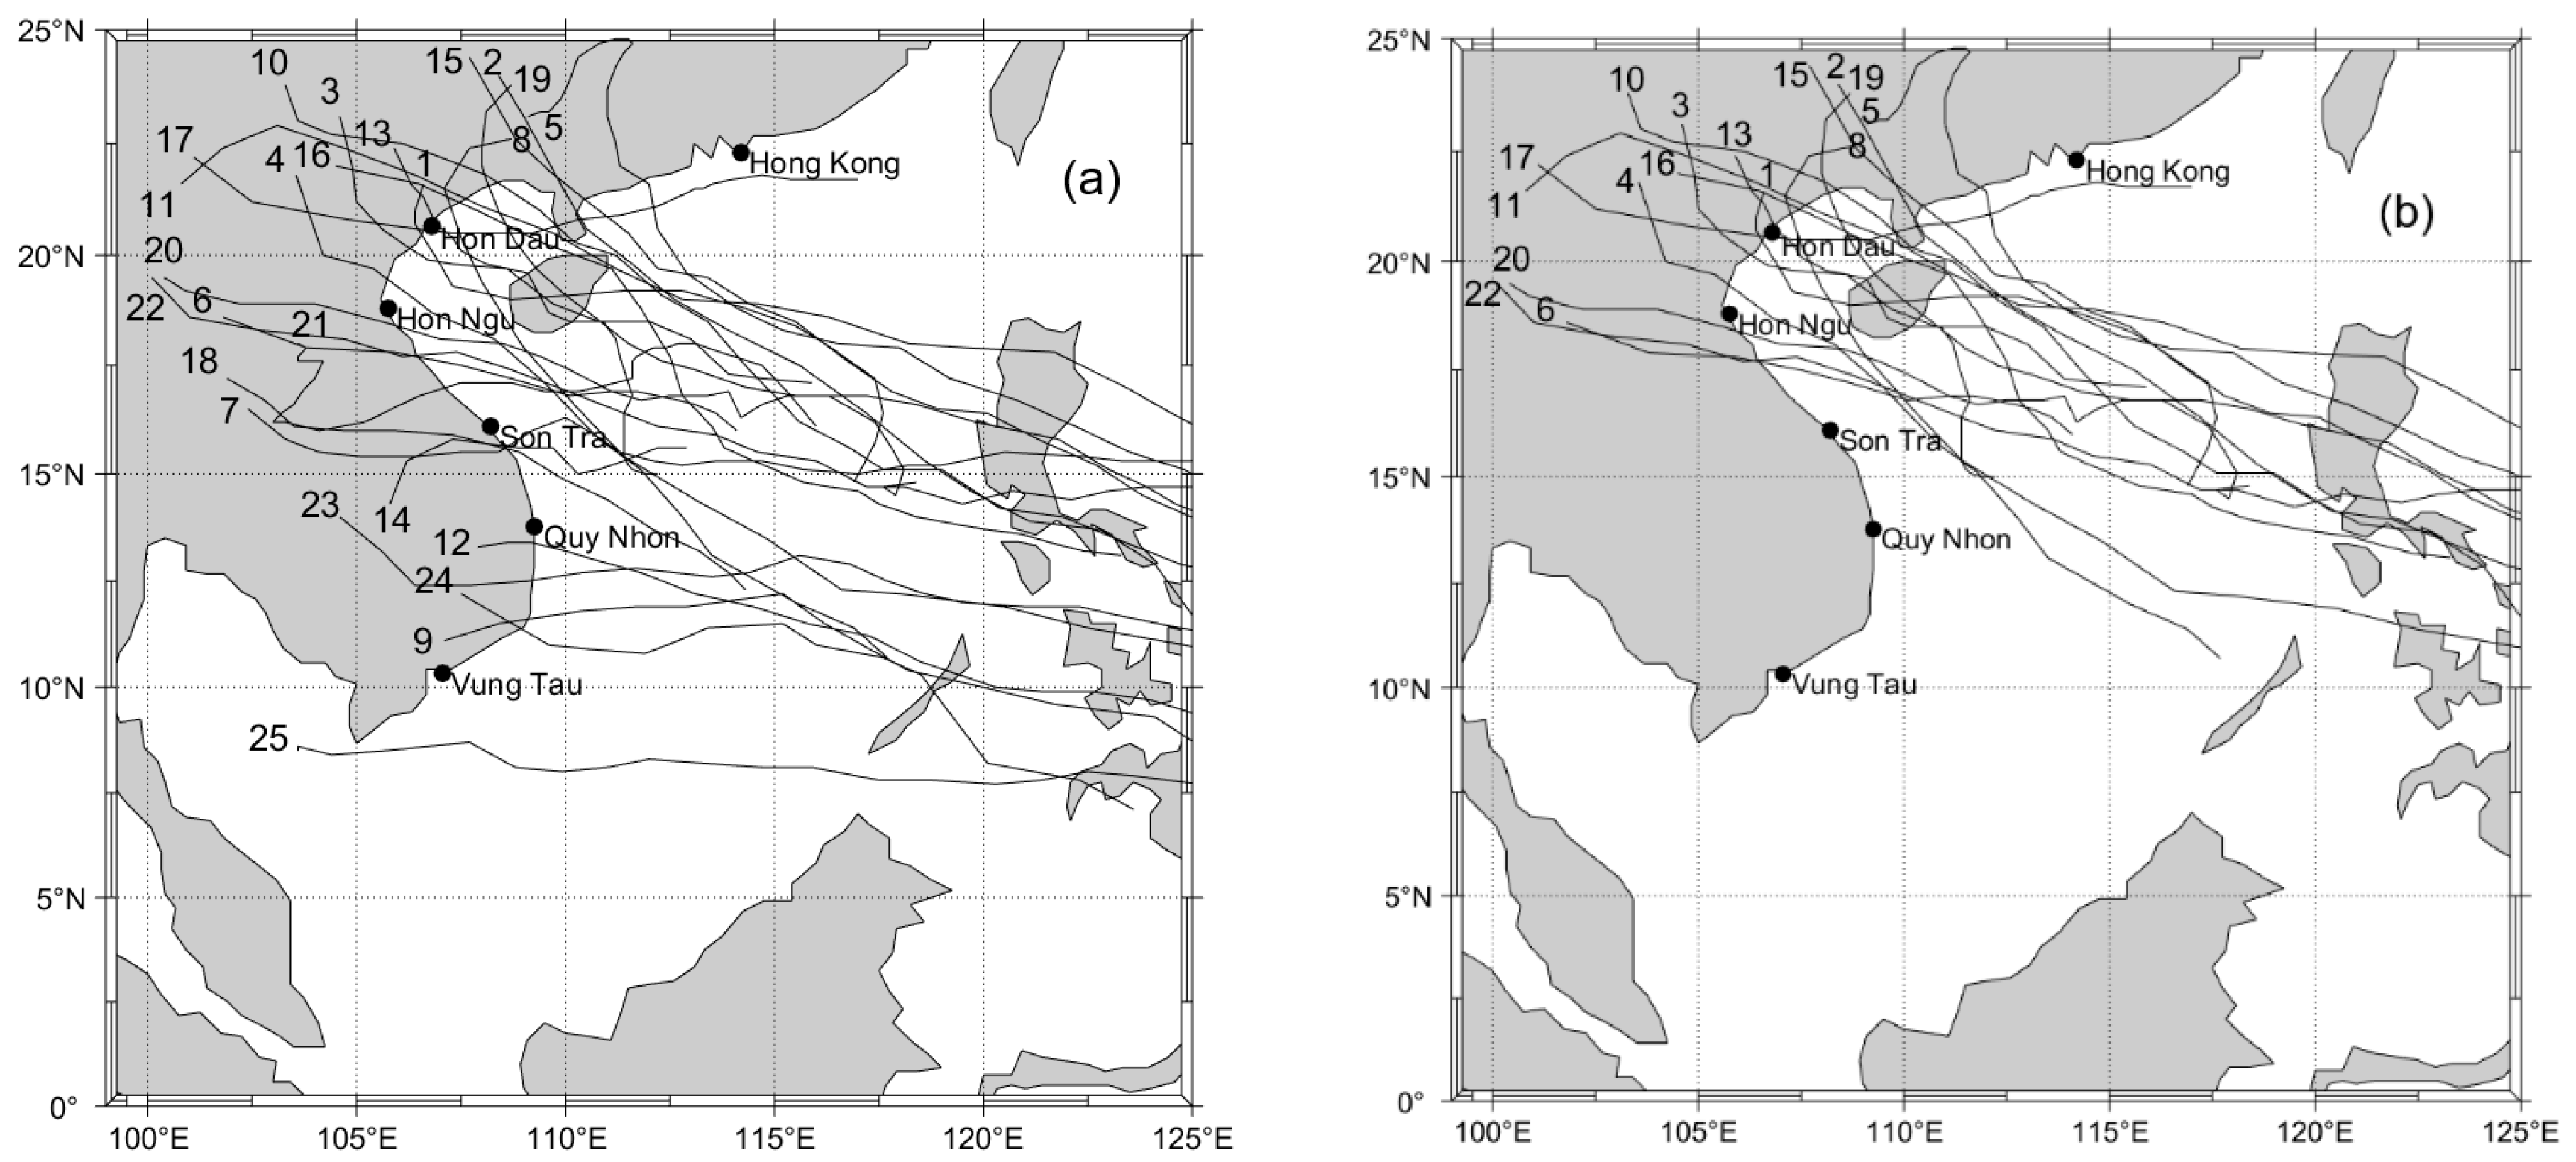
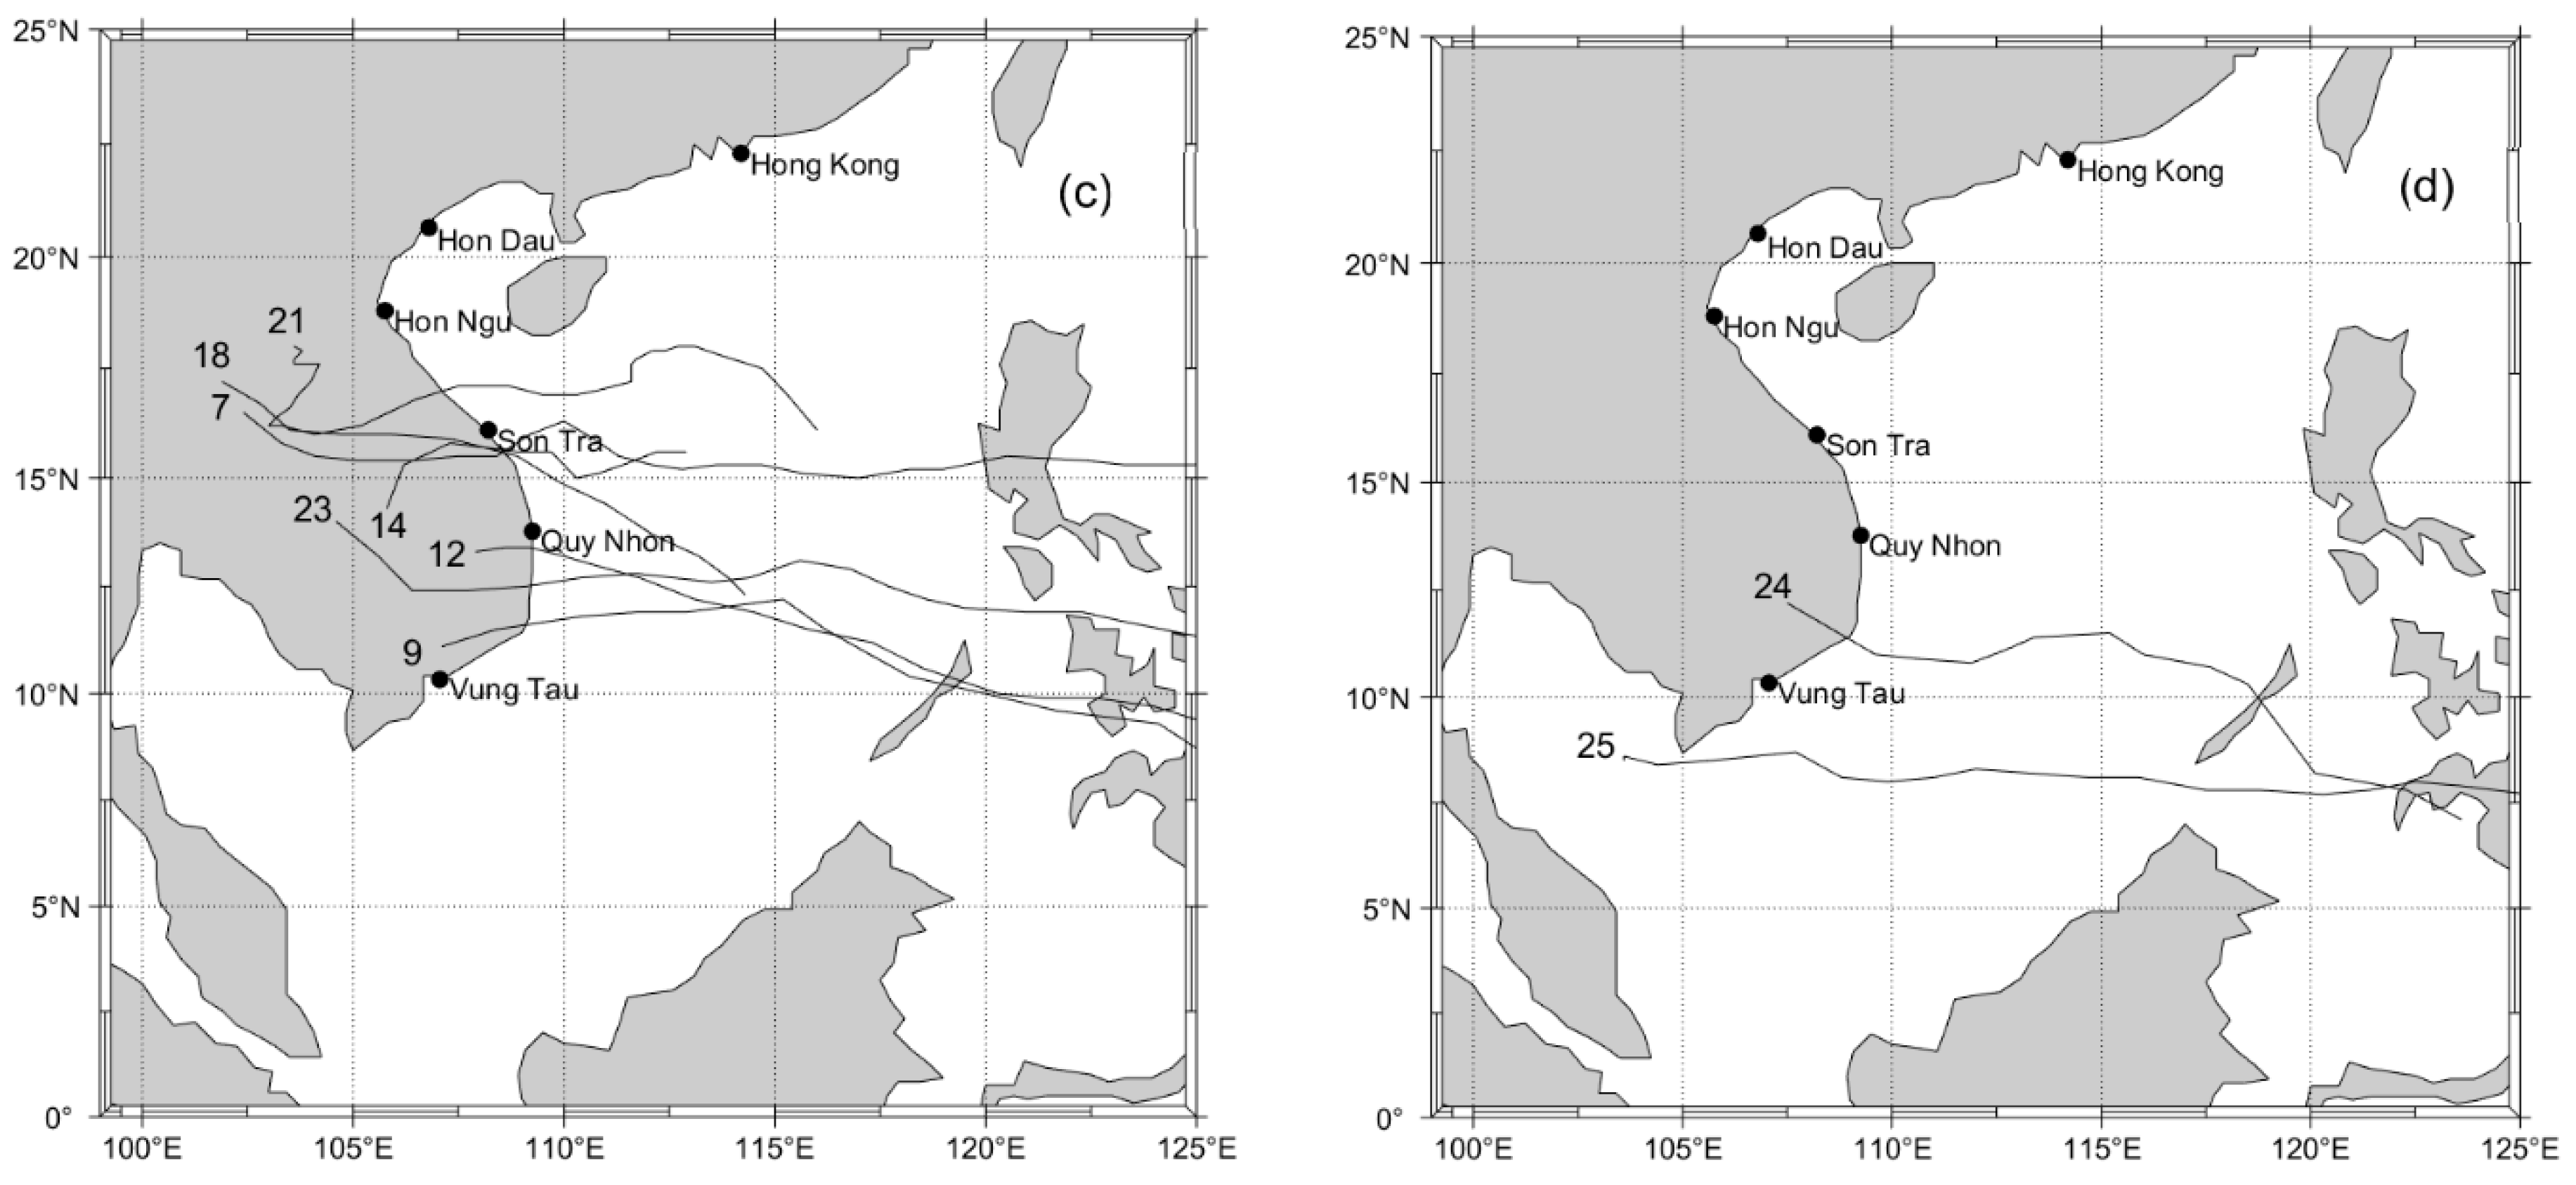
Over the study period (2013 and 2017), ~25 typhoons from a total 59 typhoons in the region propagated into the East Sea of Vietnam, and directly affected the Vietnam coast with strong winds, heavy rains, large waves, and high storm surges. This study focused only on typhoons that were categorized as tropical storms (TS) and higher in severity according to Categorization of TCs in the western North Pacific with the max wind speed from 34 kt and higher (i.e., severe tropical storm (STS) and typhoon (TY)) and made landfall either along the Vietnam coast and along the southern China coast, which also affected the water levels along the Vietnam coast through direct storm surge and forerunner. Based on preliminary analysis and typhoon information, 14 tropical storms, including severe tropical storms, and 11 typhoons were chosen for analysis (Figure 3a).

3.2. Data Analysis

Time series data at hourly intervals, obtained from the six different stations (Figure 2) between January 2013 and December 2017, were all very high quality with no missing data along the Vietnam coast. All the time series were subjected to different analyses to extract information on the direct storm surge and forerunner.

3.2.1. Tidal Harmonic and Fourier Analysis

The storm surge is defined as the non-tidal component of the water level. Thus, the initial step of the analysis was to remove the tidal component from the observed time series. This was undertaken through standard harmonic analysis that used a least squares analysis technique to extract information on the amplitude and phase of the major tidal constituents in the time series [21,22]. The T_TIDE package developed and implemented for MATLAB by Pawlowicz, et al. [23] was used for extracting the tidal constituents. A total of 35 tidal constituents were used in the analysis. T_TIDE output also includes the residual time series (the storm surge component) as the difference between the observed water level and the predicted tide.
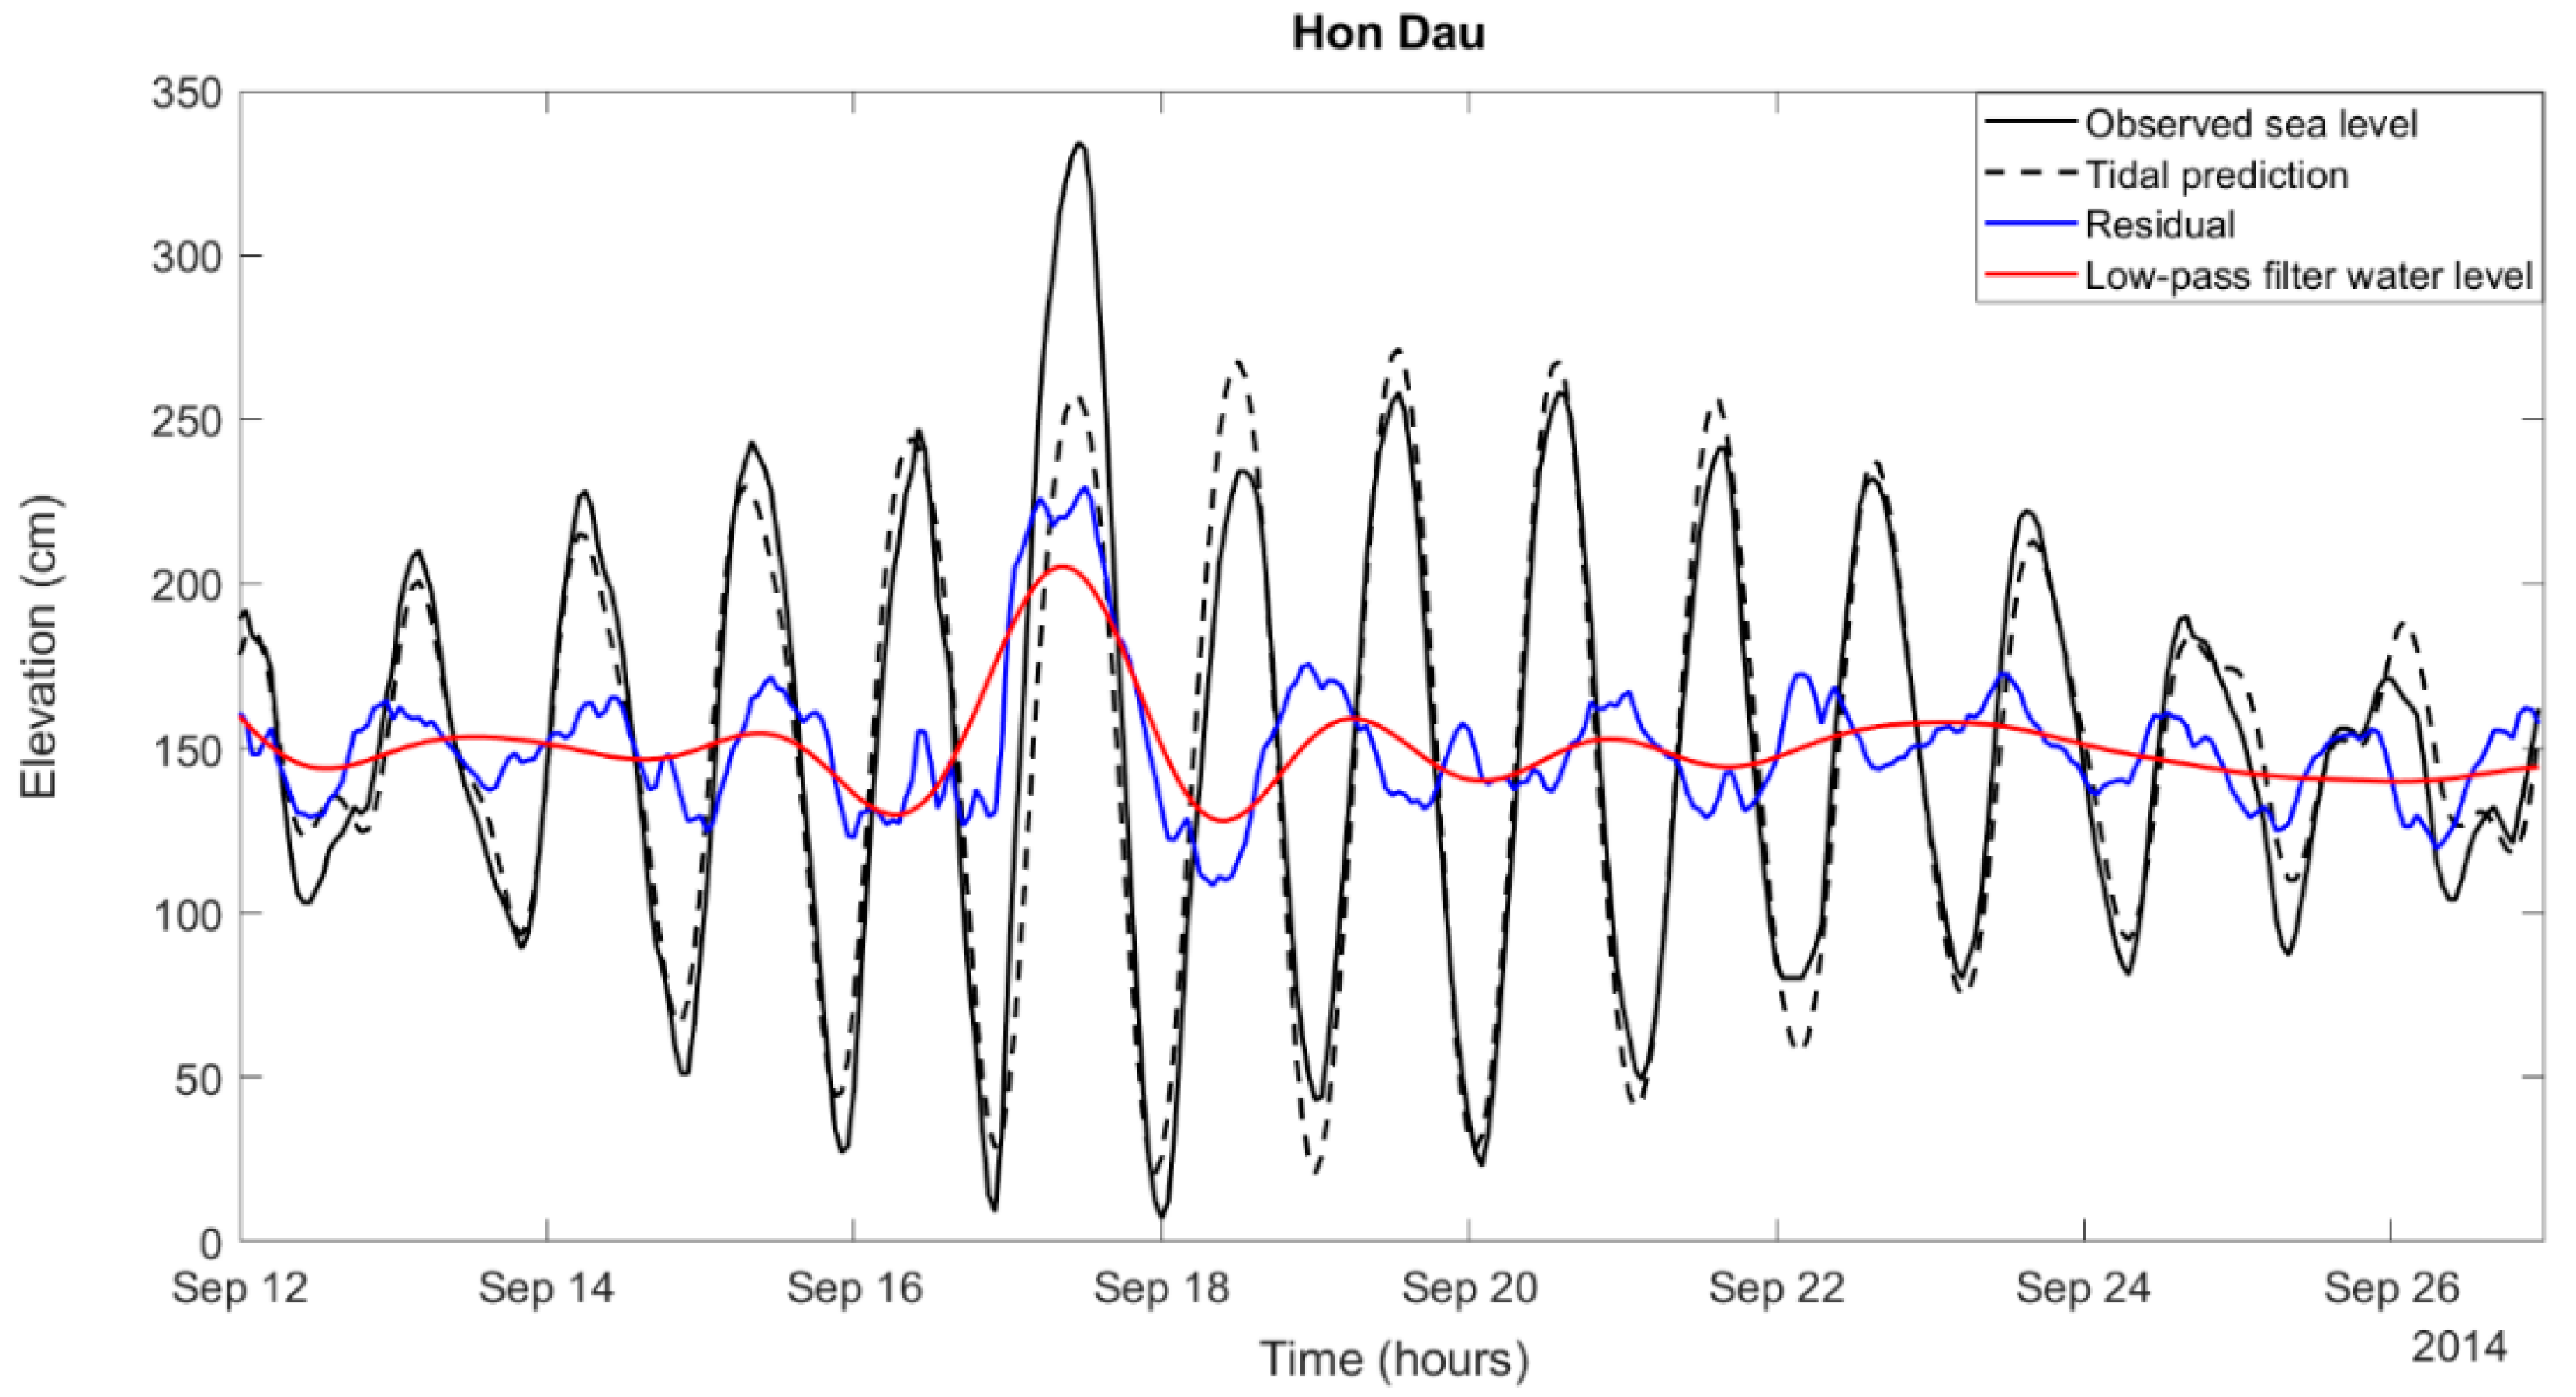
Although classical harmonic analysis has been developed and widely accepted to analyze and predict tides, it still has some shortcomings. Tidal effects in shallow coastal regions may be affected by a variety of nonlinear effects when tides on the deep ocean propagate through shallower coastal waters [23]. These effects may include interaction between tides and varying topography, a combination of tide and wave, and seasonal changes in salinity and flow near estuaries [24,25]. Of relevance to this study is the role of tide/surge interaction. With strong forces, such as that experienced during a typhoon, the timing of low/high water can shift in relation to the predicted timing of low/high water. Thus, when the difference between the observed water levels and predicted tide is calculated to obtain the residual time series, a component of the tidal energy is contained in the residual time series [26]. As an example, the residual time series for Typhoon Kalmaegi indicated a diurnal signal at Hon Dau as shown by the blue line in Figure 4.
Tidal time series were subjected to Fourier analysis to identify the dominant frequencies in the records. Here, the power spectrum was constructed using the hourly data over the 5-year period using the Welch method as implemented in MATLAB.

3.2.2. Low-Pass Filtering

A low-pass filter was used to minimize the issues associated with harmonic analysis, particularly the tide/surge interaction. The low-pass filtering has the effect of removing higher frequency signals including tides in the observed sea levels [27]. In this study, the 72-h filter proposed by Pugh [13] specifically for the analysis of hourly tidal records was used and has the characteristic of removing periods less than 36 h [6,13]. According to Pugh [13], the filter is “a good compromise between minimizing the loss of data at the beginning and end of each record and maximizing the sharpness of the cut-off at frequencies just below the diurnal tidal band”. After filtering, the low-pass water level time series of 16 days extent was used for each storm that included 6 days before and 10 days after landfall (Figure 4). To identify the signals associated with the storm on sea level, the low-pass water level was compared at all stations. The purpose of this task was to identify and eliminate the local influence of synoptic systems on sea level observations at a single station [6]. In addition, the propagation of a water level signal can be examined by using the trough and crest points for a signal. The trough point precedes a larger water level peak, which is a marker of a positive surge formed due to TC at the nearest tide station [6].

3.2.3. Influence of Local Features and Storm Parameters

To assess the influence of local features on the forerunner, the selected storms were divided based on their landfall locations along the three coastal sections described in Section 2.1: northern (including the southern coast of China, Figure 3b), central (Figure 3c) and southern (Figure 3d) sections. Similar storm paths were considered to examine the role of local features based on the difference in water levels due to typhoons [7].
Storm parameters were also considered to provide the intensity of typhoons on the generation and propagation of forerunner as well as to extract forerunner surge from the water level time series. According to Liu & Irish [11], storm track parameters influence the generation of forerunner surge, especially a rapid and large forerunner. They reported that sea level pressure, radius, and speed were the most significant parameters because slow-moving, large, intense storms can generate and sustain strong alongshore currents. Intense typhoons may create higher forerunner and storm surges. In contrast, this may not be accurate for all the cases of higher storm surges due to the dependence on many other factors, for example, angle of approach of the typhoon, radius of maximum winds and the slope of the continental shelf may also have an influence [28]. Some historical typhoons in Vietnam indicated that not every severe typhoon generated a high storm surge. For example, typhoon Damrey (2017), the strongest storm in the last 16 years that impacted the central part of the Vietnam coast, had no record on high storm surges during the typhoon. Storm size is a significant factor that contributes to the generation of forerunner [9,11] through the effects of Ekman setup (Figure 1; Equation (1)). Storm size can indicate the spatial region influenced by the typhoon. Therefore, wind field will be used to determine wind direction and the size of the storm. Moreover, with tide gauge on the right side of the storm in the northern hemisphere, the difference between the forerunner and direct storm surge due to onshore wind was difficult to distinguish. Therefore, it was necessary to use the storm size to assess the spatial extent of the storm as well as wind field to make a better estimate. The speed of storm was also considered during the period 4–6 days before it made landfall. The storm speed was estimated using longitude and latitude information on the location of the central pressure at specific times.

4. Results

4.1. Sea Level Time Series

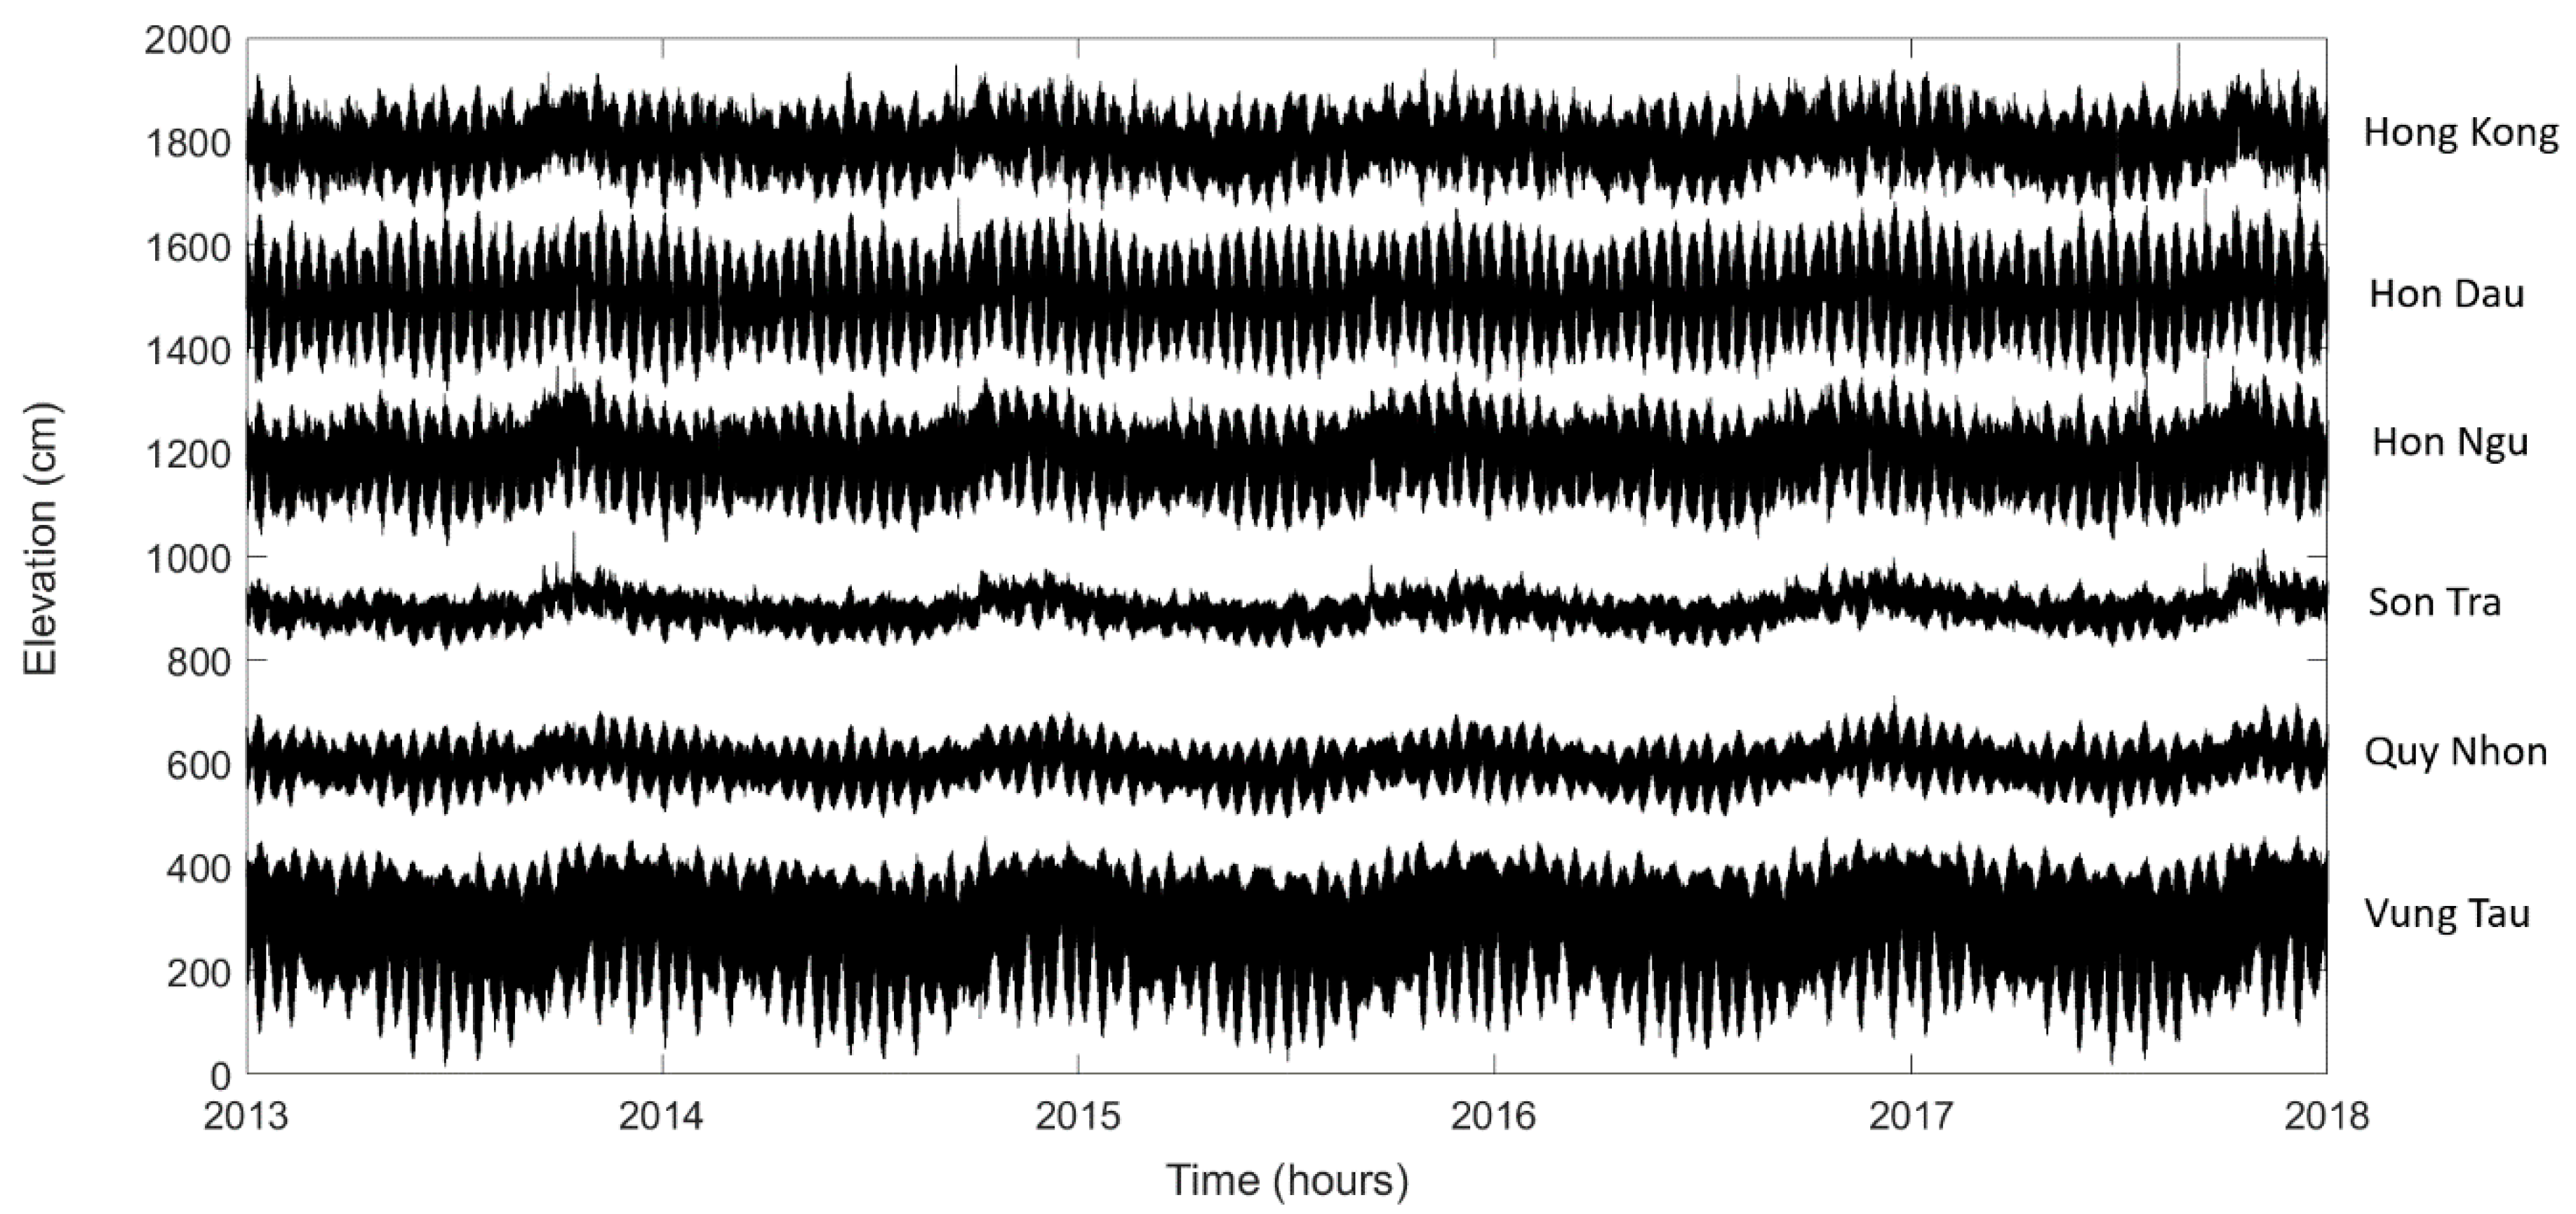
Time series of sea level at the two stations located at the two extremes, in the north and south, Hon Dau (HD) and Vung Tau (VT), recorded the highest water level range of ~4.0 m whilst the range at Son Tra (ST) was the smallest with a range 2.0–2.5 m (Figure 5). Thus, the tidal range decreases from north to the central section and then increases to the south. The increase in tidal range in the north and south may be related to the presence of relatively shallow water in these regions (Figure 2). Also, Hon Dau has mainly diurnal tides whilst Vung Tau experiences semi-diurnal tides and thus there is also a transition in the tidal character from north to south (Table 1).
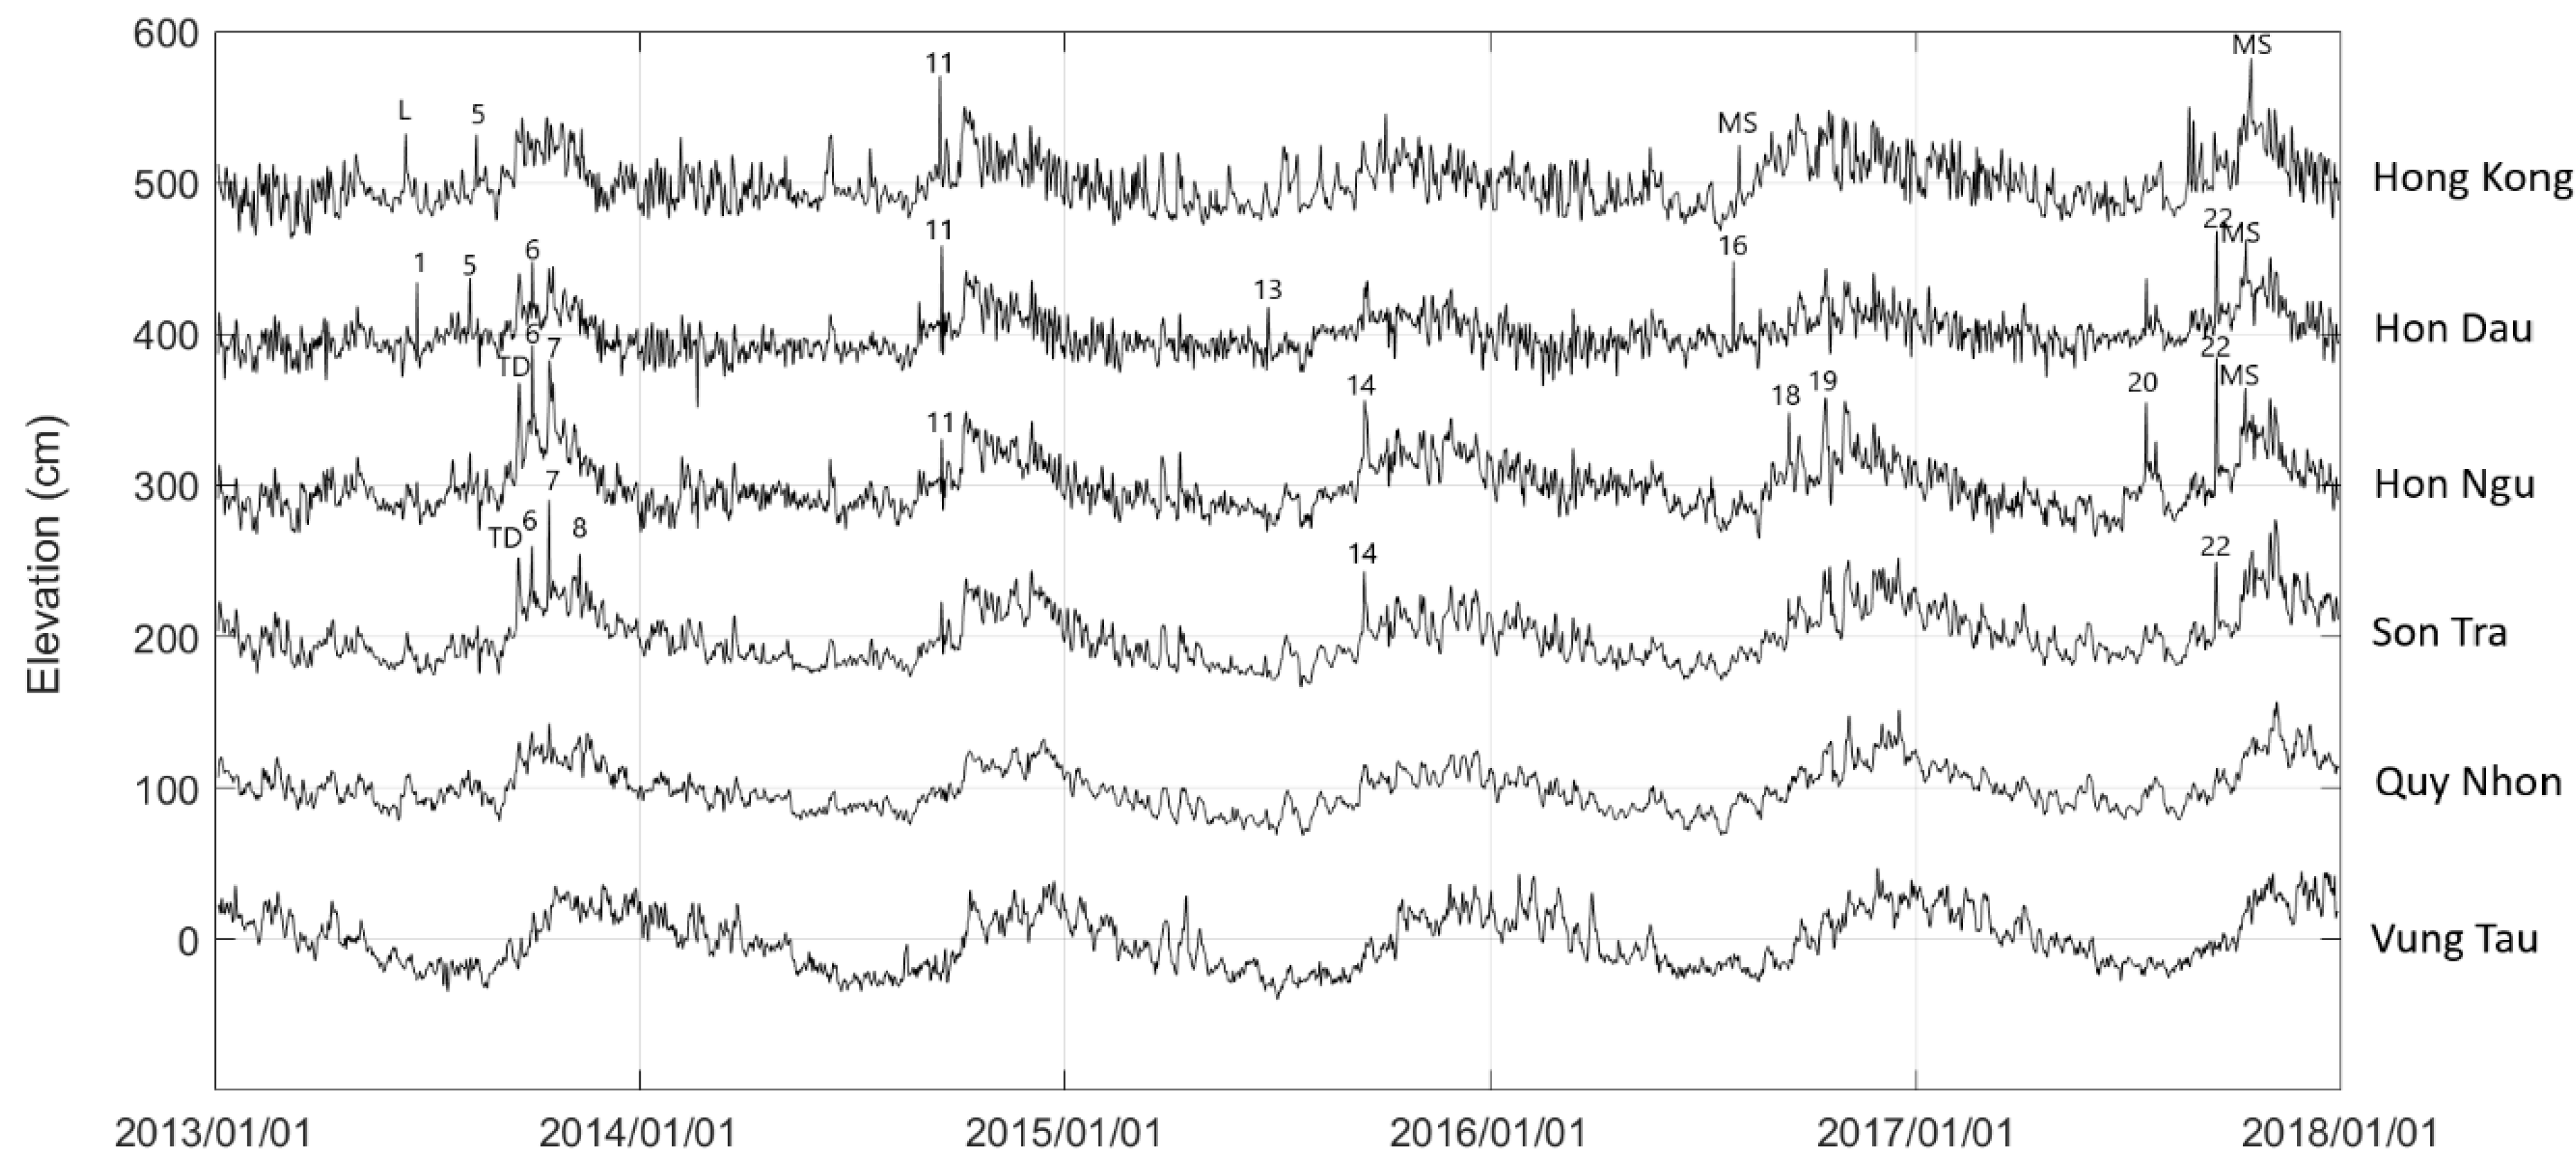
Low-pass filtered sea level time series, constructed using the 72-h filter [13], indicated two main features (Figure 6): (1) the seasonal cycle with higher mean water levels towards the end of the year during winter (November/December) and lower water levels during the summer (July/August); and, (2) isolated peaks in water level relating to storm surges generated from typhoon forcing. Some other peaks may reflect an increase in water level due to localised changes in atmospheric conditions and/or tropical depression. The northern stations (Hong Kong, Hon Dau, Hon Ngu and Son Tra) indicated a higher number of surges compared to the two southern stations (Quy Nhon and Vung Tau), indicating a higher number of storm impacts on the northern and central coasts compared to the southern coast. In addition, there were a higher number of surges between June and December (Figure 6). In fact, the strongest typhoons recorded during the study period occurred during the second half of the year. These include, Typhoon Utor (August 2013)—number 5, Typhoon Wutip (September 2013)—number 6, Typhoon Nari (October 2013)—number 7, Typhoon Haiyan (November 2013)—number 8, Typhoon Kalmaegi (September 2014)—number 11, and Typhoon Doksuri (September 2017)—number 22. In combination with higher mean seasonal water level, the storm surges occurring later in the year resulted in higher total water levels. There was also an inter-annual variability: during 2013 and 2017 there were more storm surges compared to other years (Figure 6).
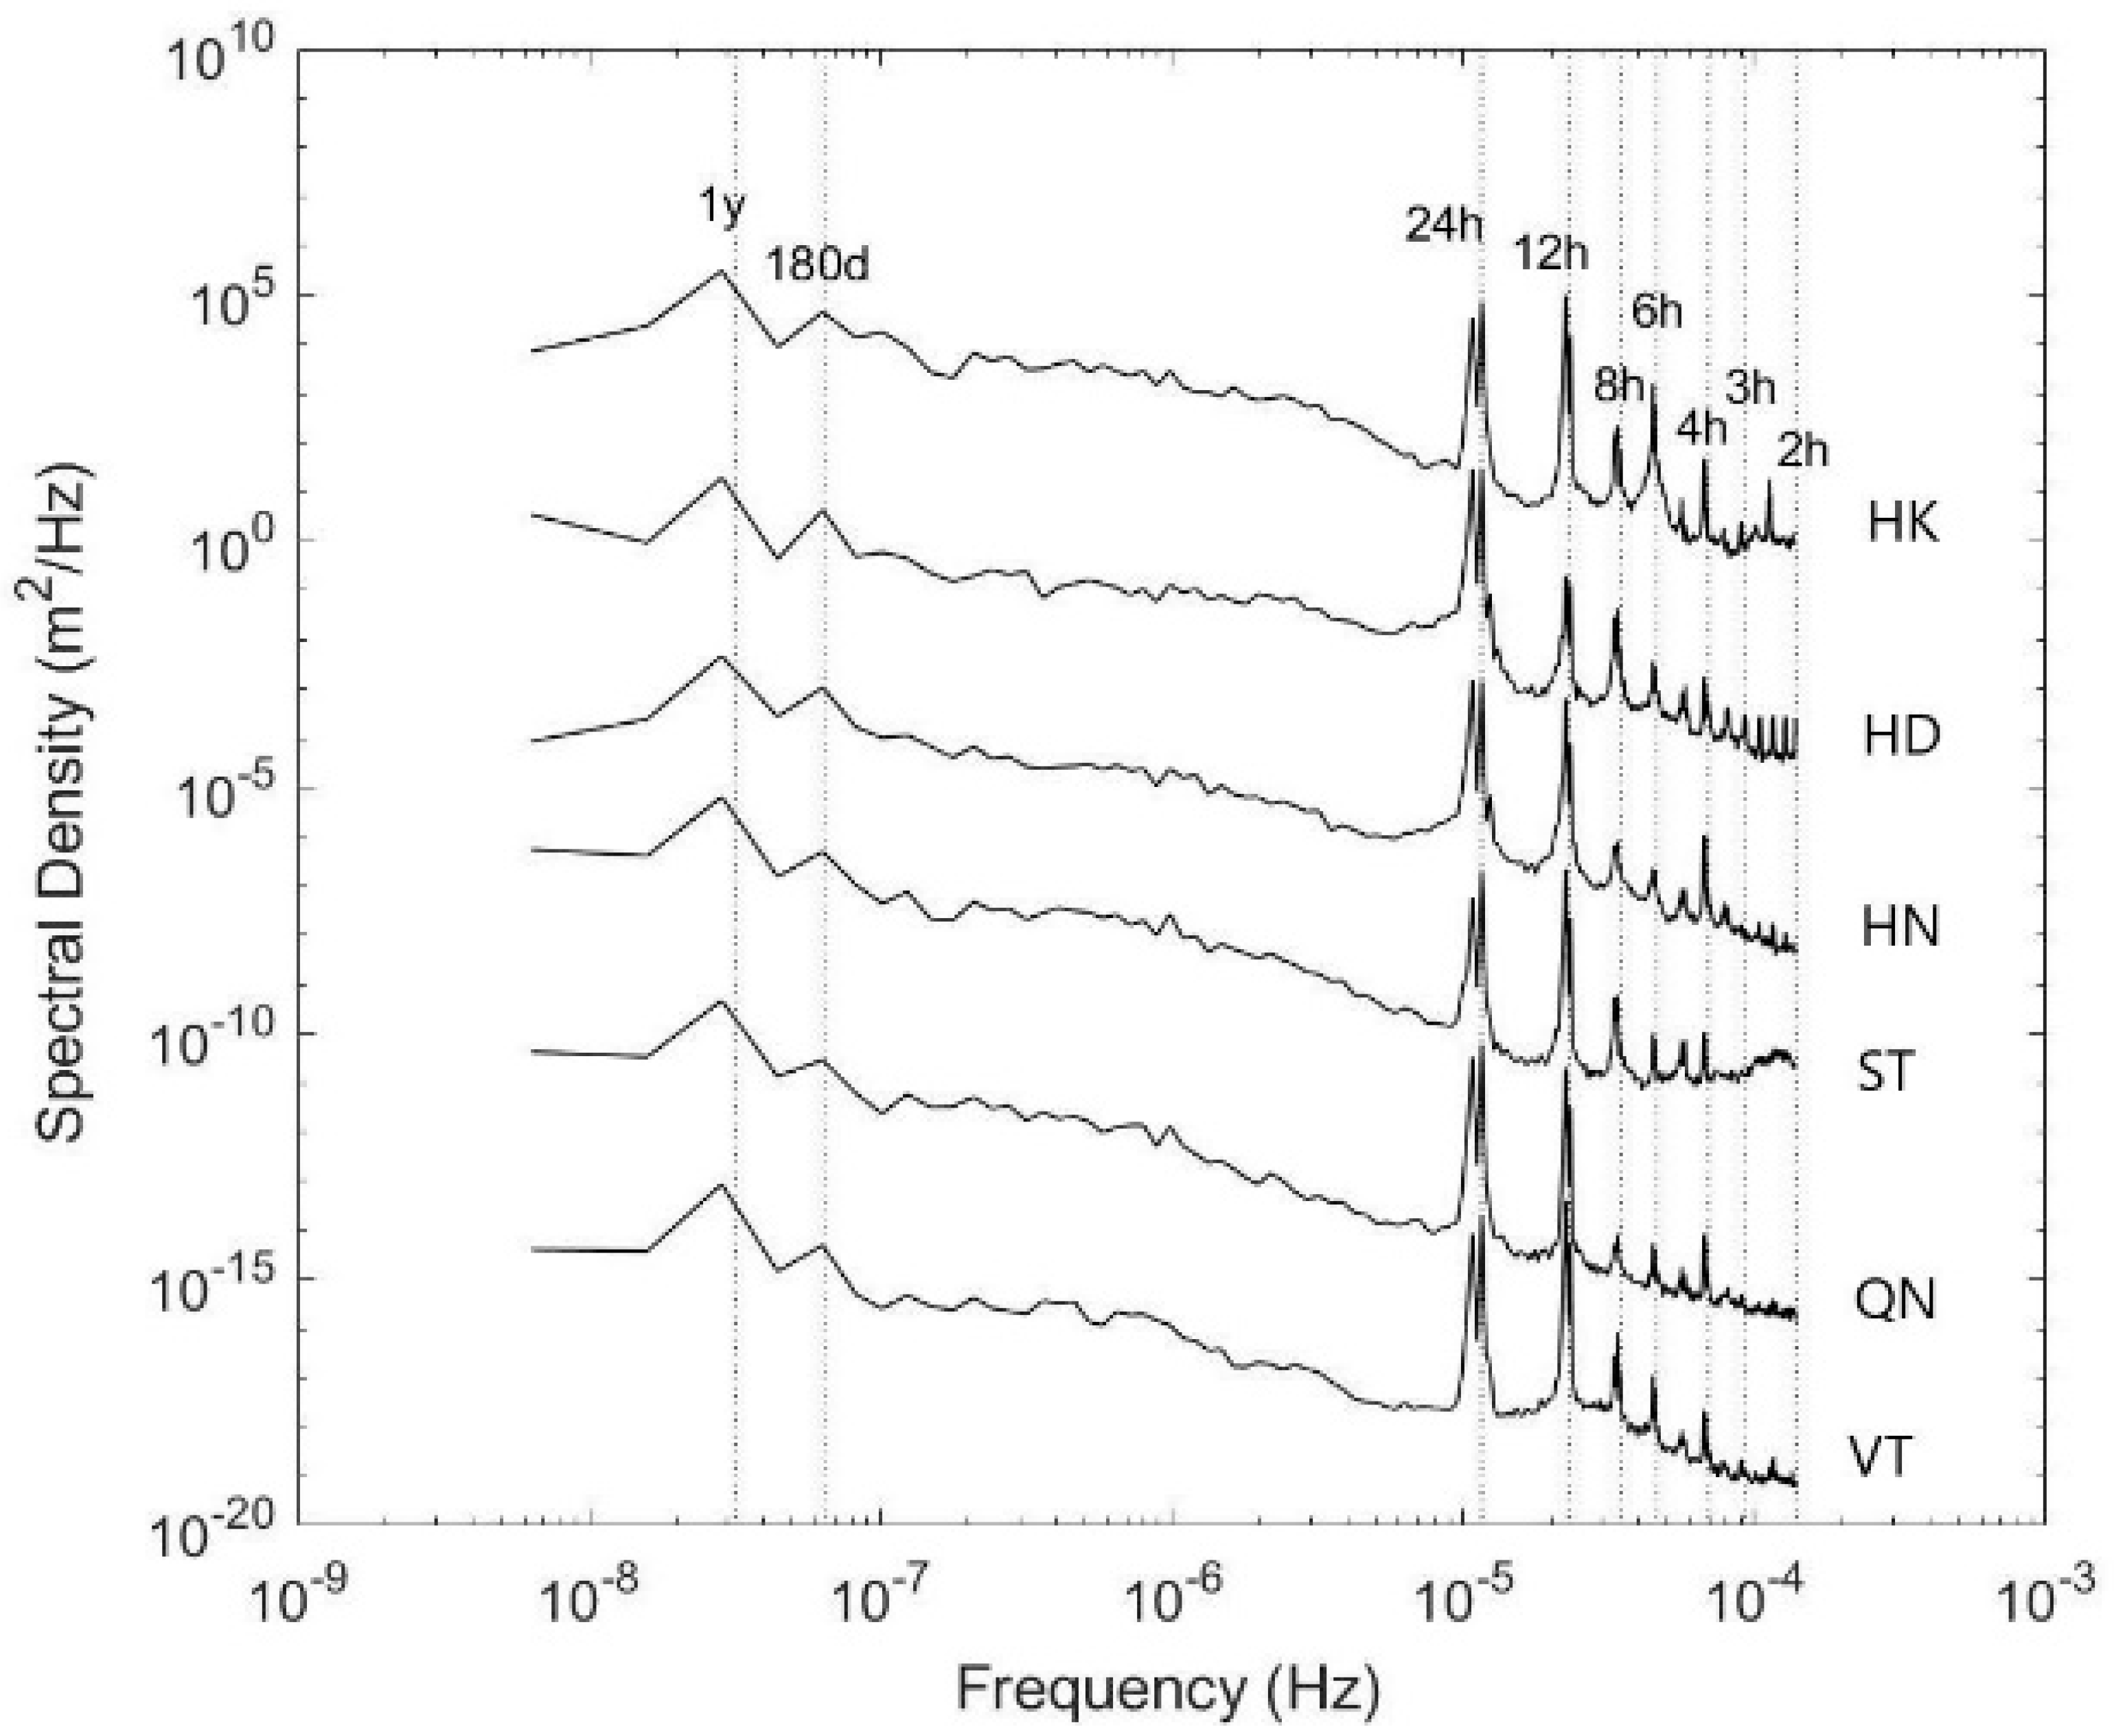
Results of Fourier spectral analysis to the observed time series indicated the highest spectral energy at the diurnal and semi-diurnal frequencies (Figure 7). The seasonal cycle was reflected with peaks at 180 days and 1 year. The domination of the diurnal tides at Hon Dau station was reflected with the diurnal peak larger than the semi-diurnal peak; whilst at Vung Tau, the semi-diurnal peak was dominant. At other stations, the characteristics of tidal regime indicated a mix of diurnal and semi-diurnal frequencies (Figure 7). There were also peaks at intra-tidal frequencies (<12 h), reflecting the shallow water tides at 8, 6 and 4 h. The 6 h peak was highest at Hong Kong whilst there appeared to be a broad peak at Son Tra station between 2 h and 3 h that may be related to continental shelf seiches [29].

4.2. Forerunner

4.2.1. Forerunner Generated by Alongshore Wind

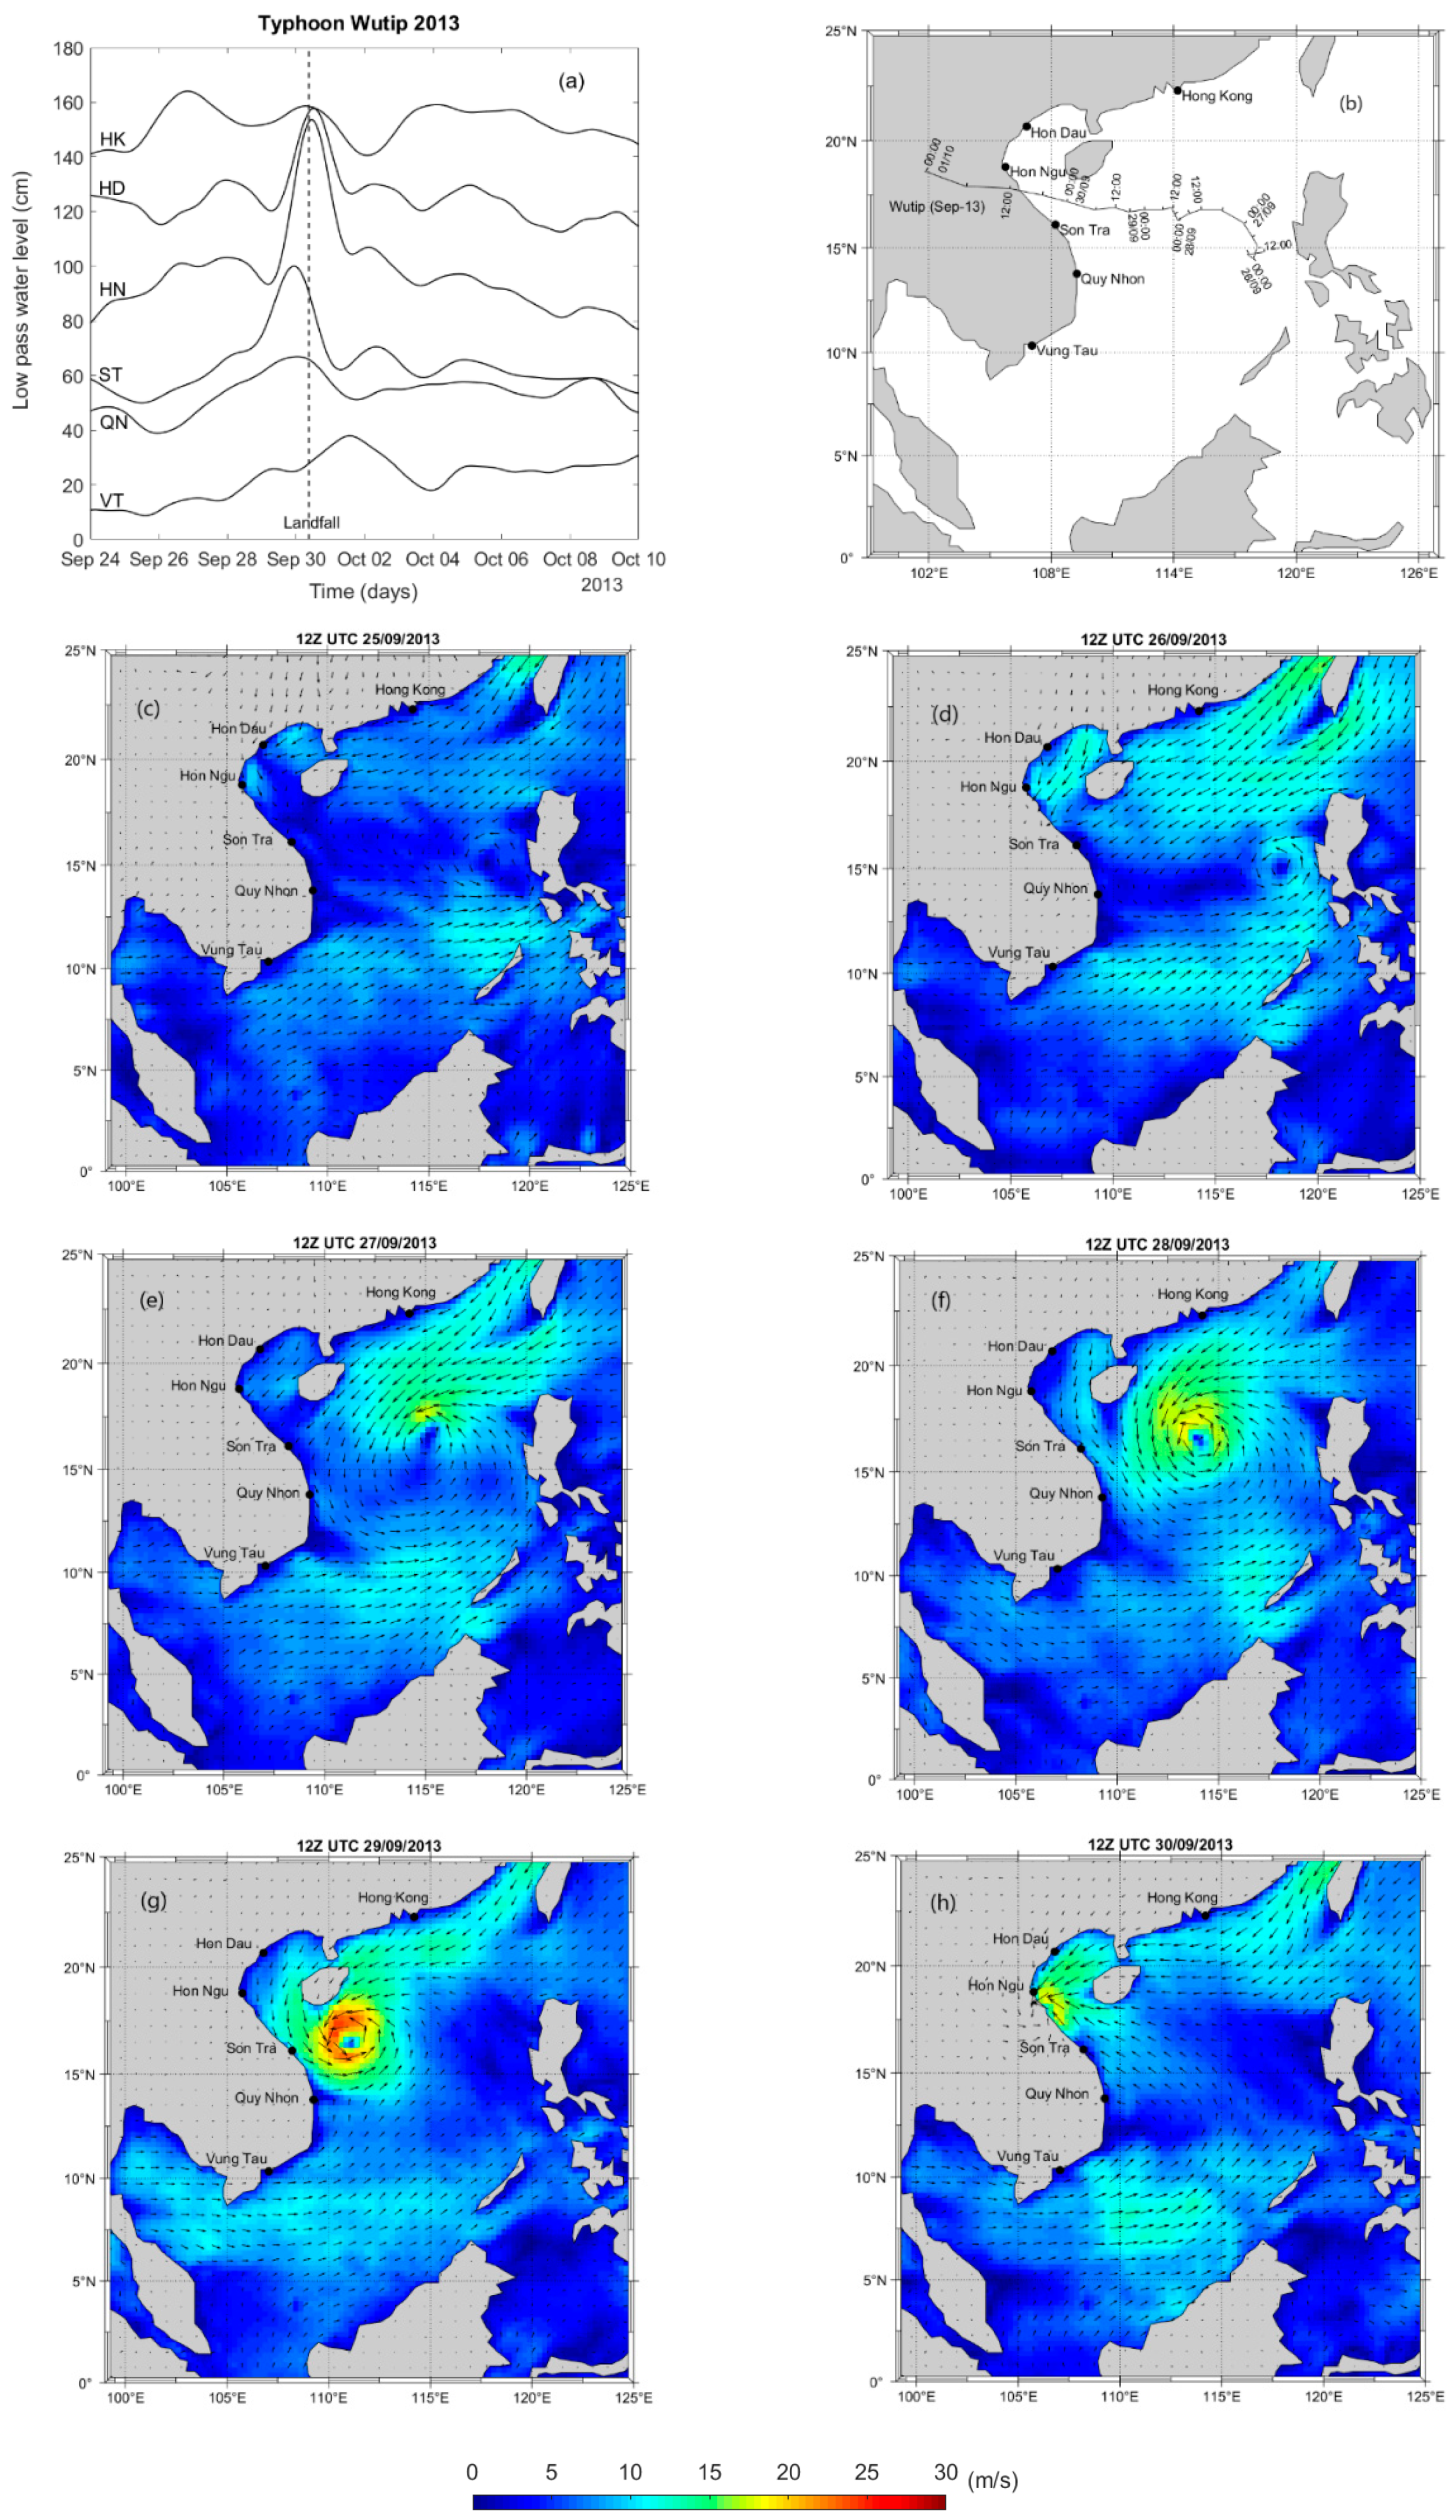
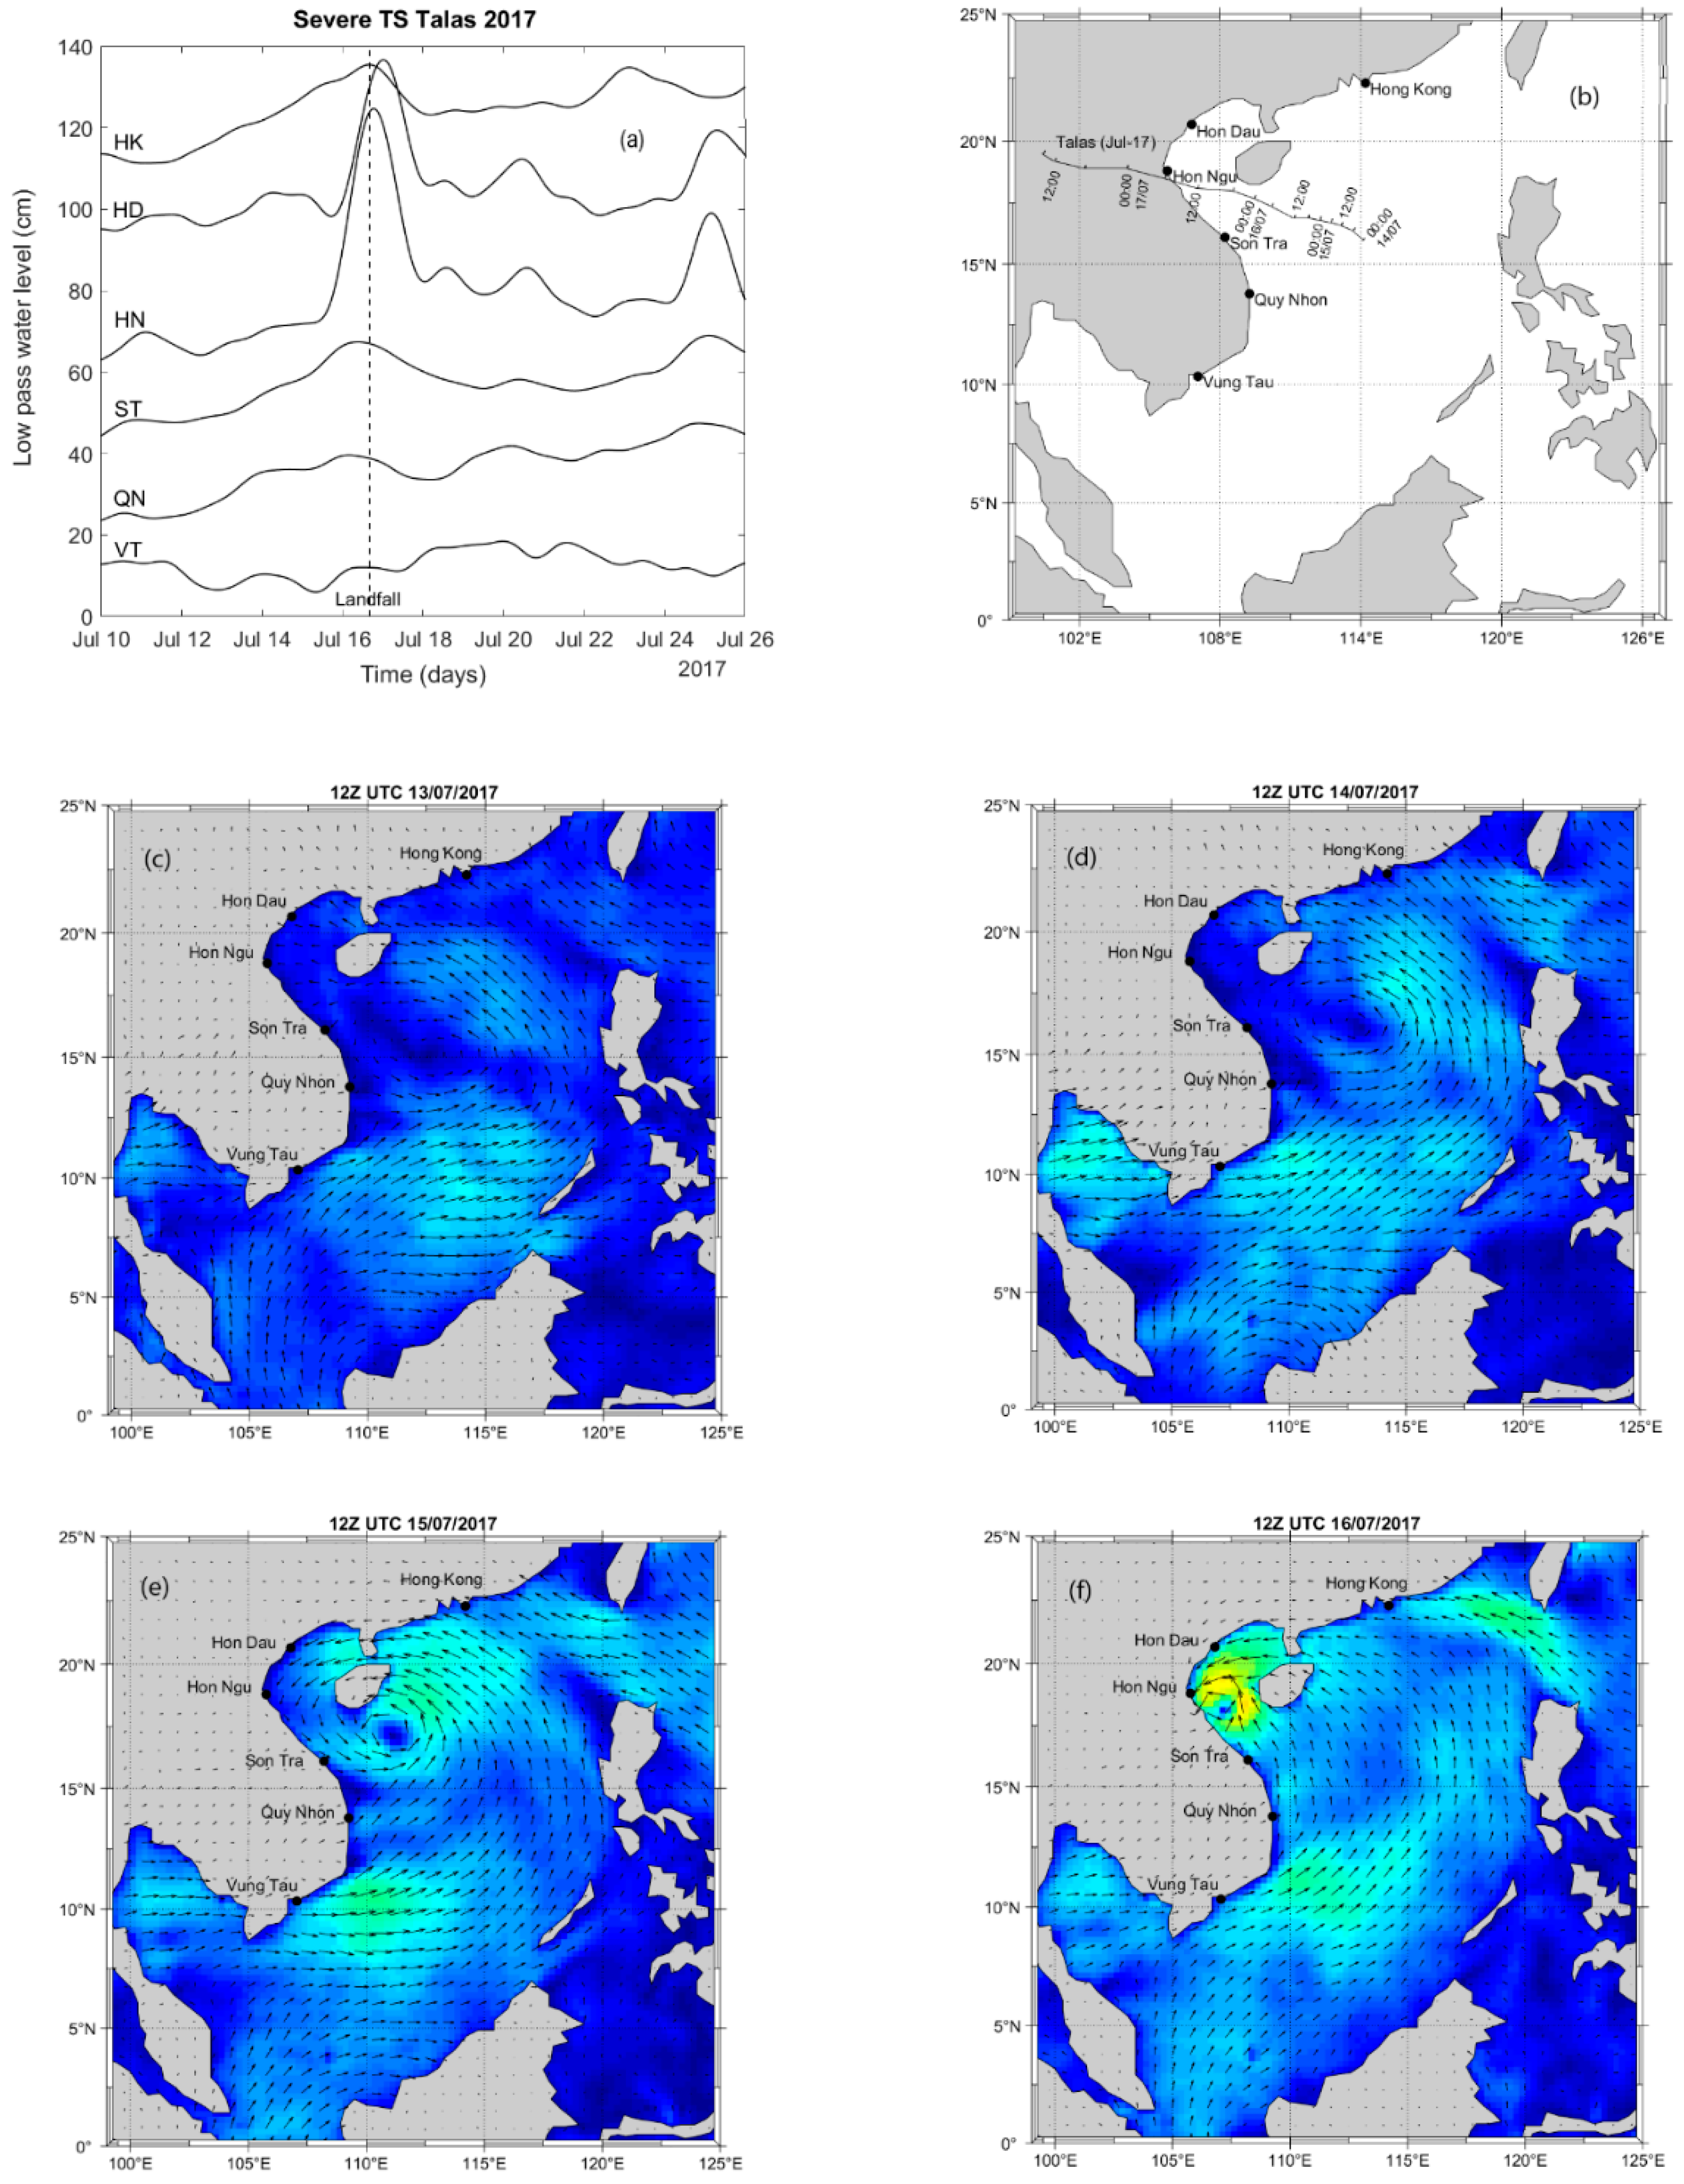
The forerunner is generated through the combination of alongshore winds and currents that induces an Ekman set-up at the coast (Figure 1). In general, for all typhoons, a gradual increase in water level at the coast occurred several days prior to landfall of the typhoon (i.e., when the typhoon was far away from the coast). As an example, during Typhoon Wutip (September 2013), the forerunner may be clearly identified in the time series (Figure 8). On 25 September 2013, a tropical depression started to intensify off the west coast of the Philippines. The system tracked towards the west and strengthened to a tropical storm that was named Wutip on 27 September. Tropical storm Wutip strengthened further to a severe tropical storm as it moved westwards on 28 September, and rapidly became a typhoon and made landfall at 16:00 local time (09Z UTC) on 30 September to the north of Son Tra (Figure 9b). The time-series indicated that the mean sea level started to increase around 19:00 local time (12Z UTC) on 25 September when the storm was located close to the Philippines and continued to increase linearly until 6:00 local time on 29 September 2013 (23Z UTC 28 September), followed by a more rapid increase in the water level (Figure 8). The initial increase in the water level was ~50 cm and this is the forerunner (Figure 8). All the coastal stations, except Hong Kong, indicated an increase in mean sea level over this period (Figure 9a). The wind field associated with a typhoon in the northern hemisphere rotates anti-clockwise around the eye and as the typhoon approaches the Vietnam coast there is onshore (offshore) winds to the north (south) of the landfall. This allows for an increase (decrease) in water level to regions to the north (south) of the typhoon landfall due to onshore (offshore) winds. In the case of Typhoon Wutip, stations Hon Dau and Hon Ngu recorded an increase in water level (positive storm surge, +0.75 m) as expected (Figure 9a). However, station Son Tra located to the south of the landfall also recorded a positive storm surge (Figure 8 and Figure 9a) and this is the forerunner. During Severe Tropical Storm Talas (in 2017), a similar situation occurred with the forerunner contributing to an increase in water level at all stations before landfall (Figure 10). Tracks for both these typhoons were very similar (Figure 9b or Figure 10b). The track for Typhoon Utor (in 2013) was located further to the north such that Hong Kong recorded a positive storm surge due to onshore winds. In contrast, stations located in Vietnam recorded the forerunner, prior to landfall (Figure 11a), and after landfall there was a rapid decrease in the water level as the offshore winds transported water away from the coast (Figure 11a).
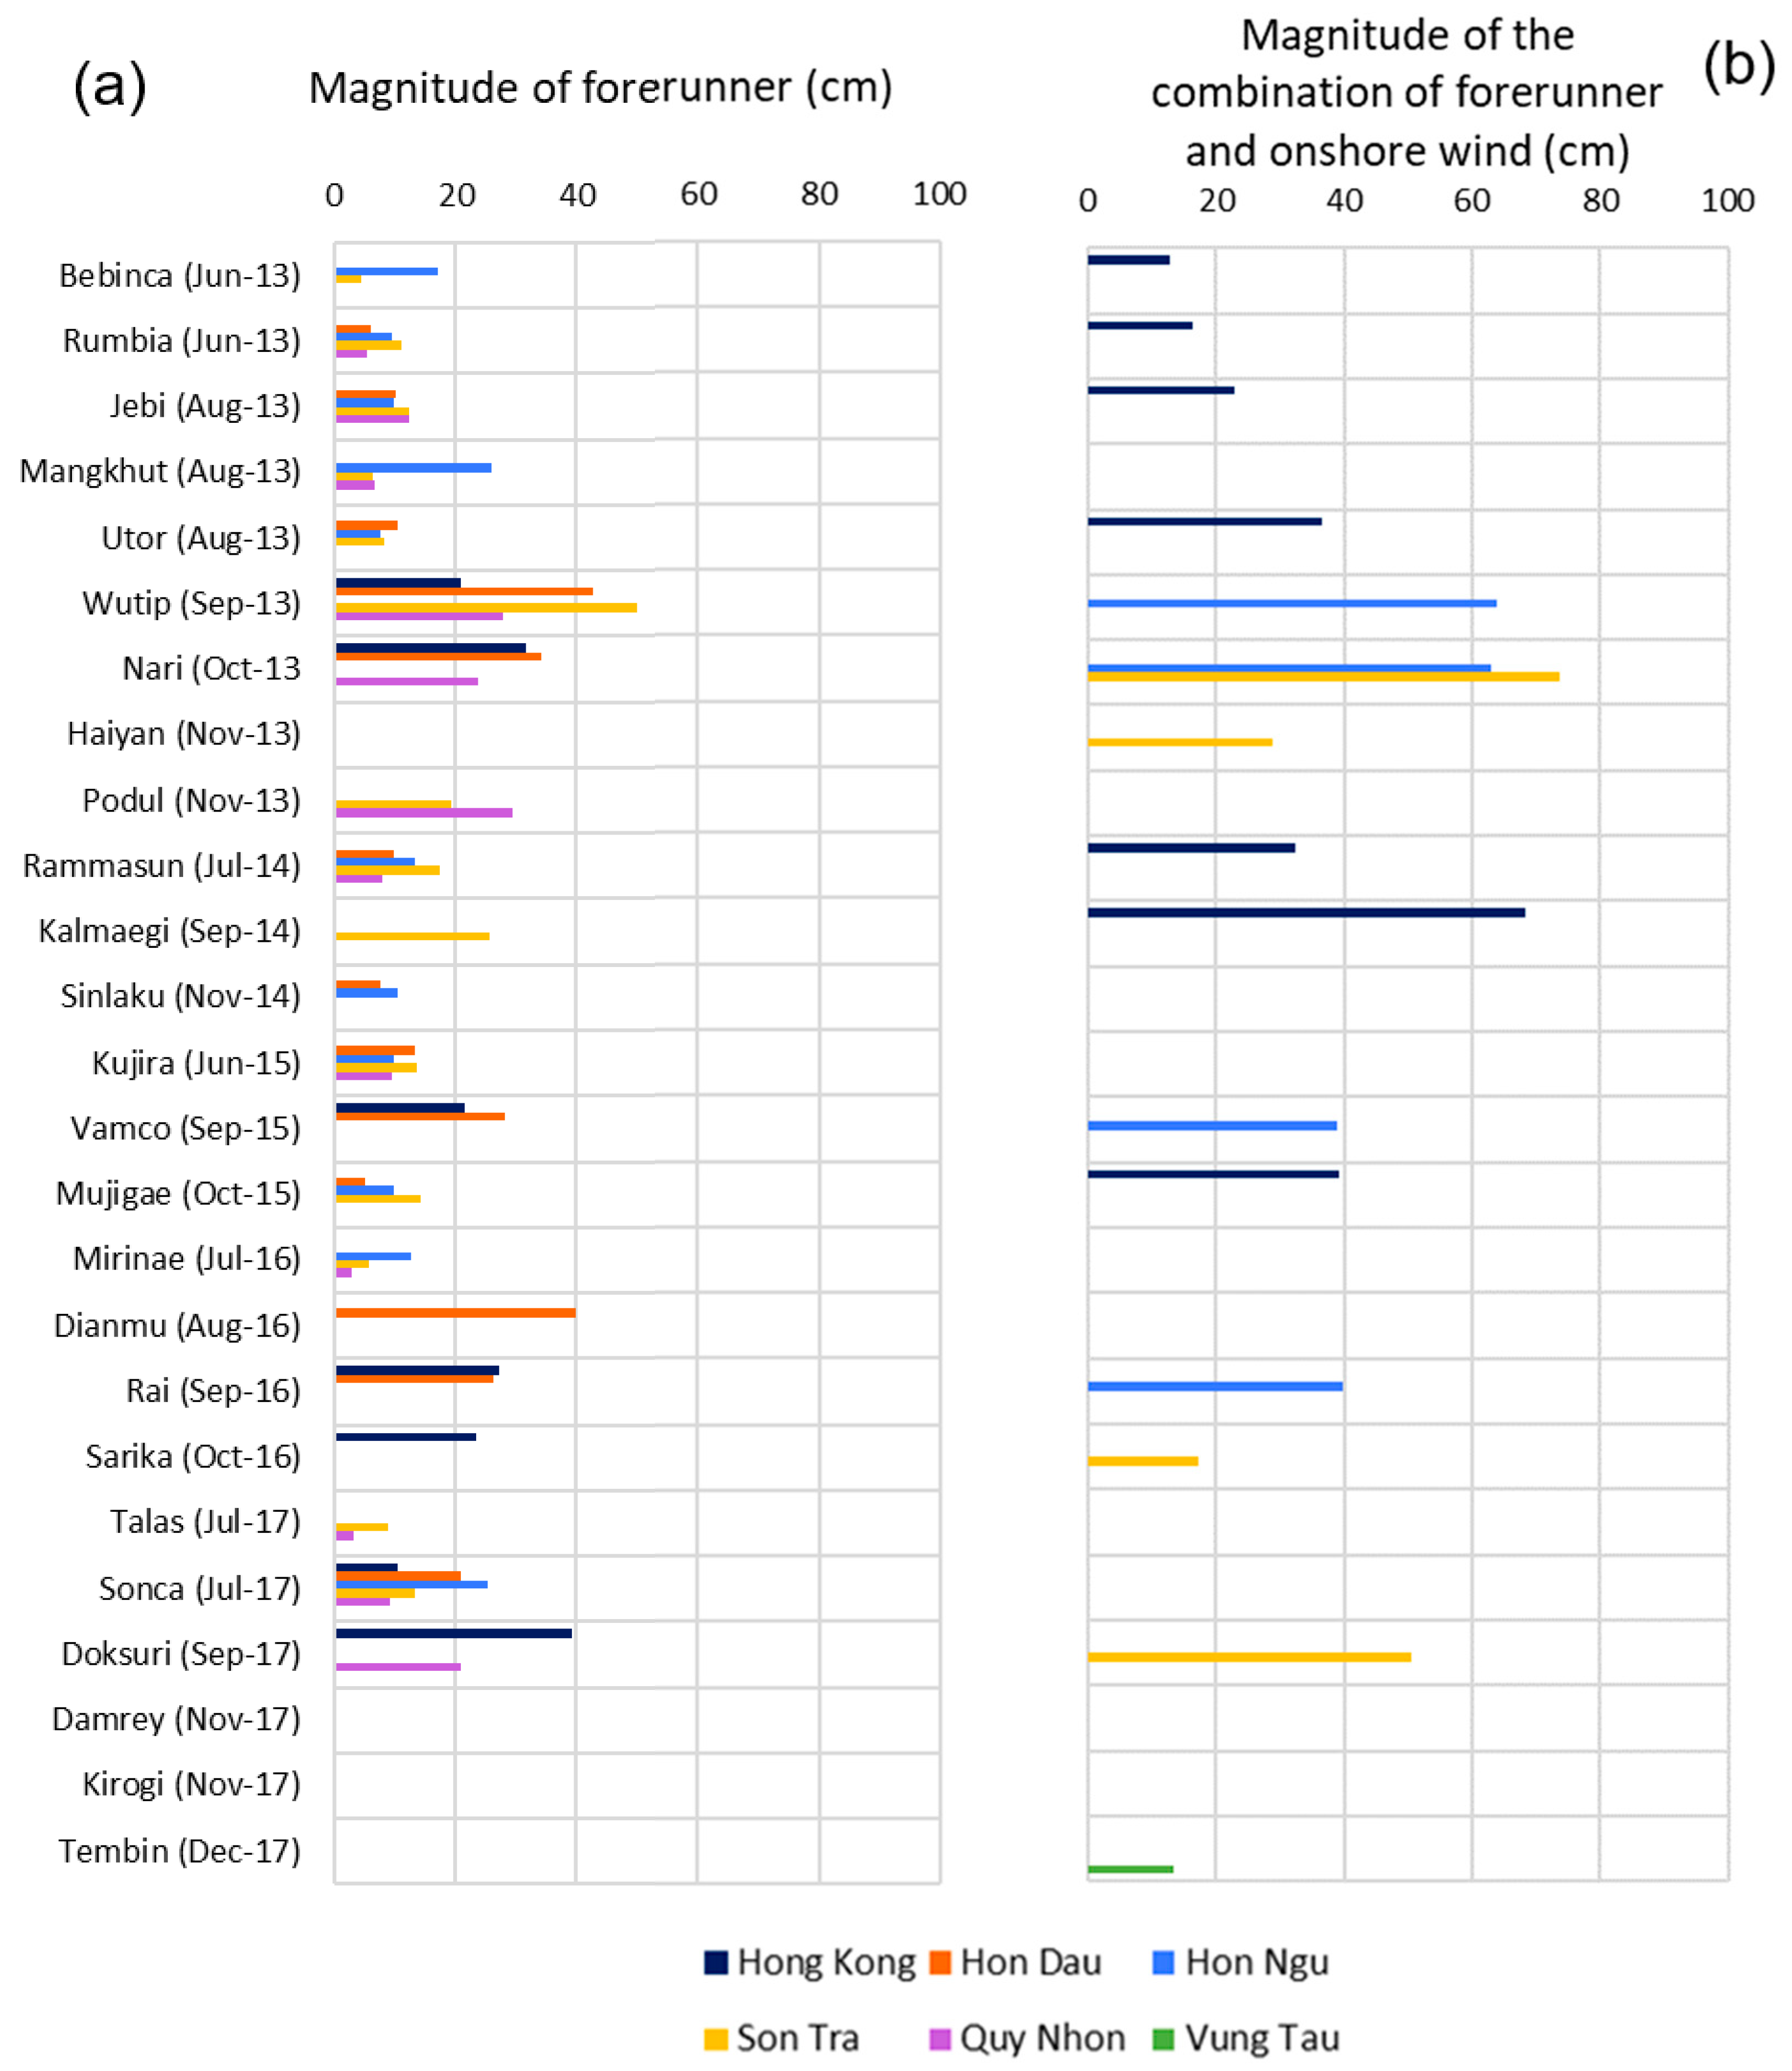
Analysis of the low passed filtered time series from 2013 to 2017 at each of the six stations indicated that most of the selected storms indicated the presence of a forerunner (Figure 12a). The mean height of the forerunner at all typhoons during 5 years was 0.20 m. The highest forerunner magnitudes were recorded at Hon Dau and Son Tra with 40–50 cm (Figure 12a) with Hon Ngu, Quy Nhon and Hong Kong recording maximum forerunners between 20 and 30 cm.

4.2.2. Forerunner in Combination with Onshore Wind

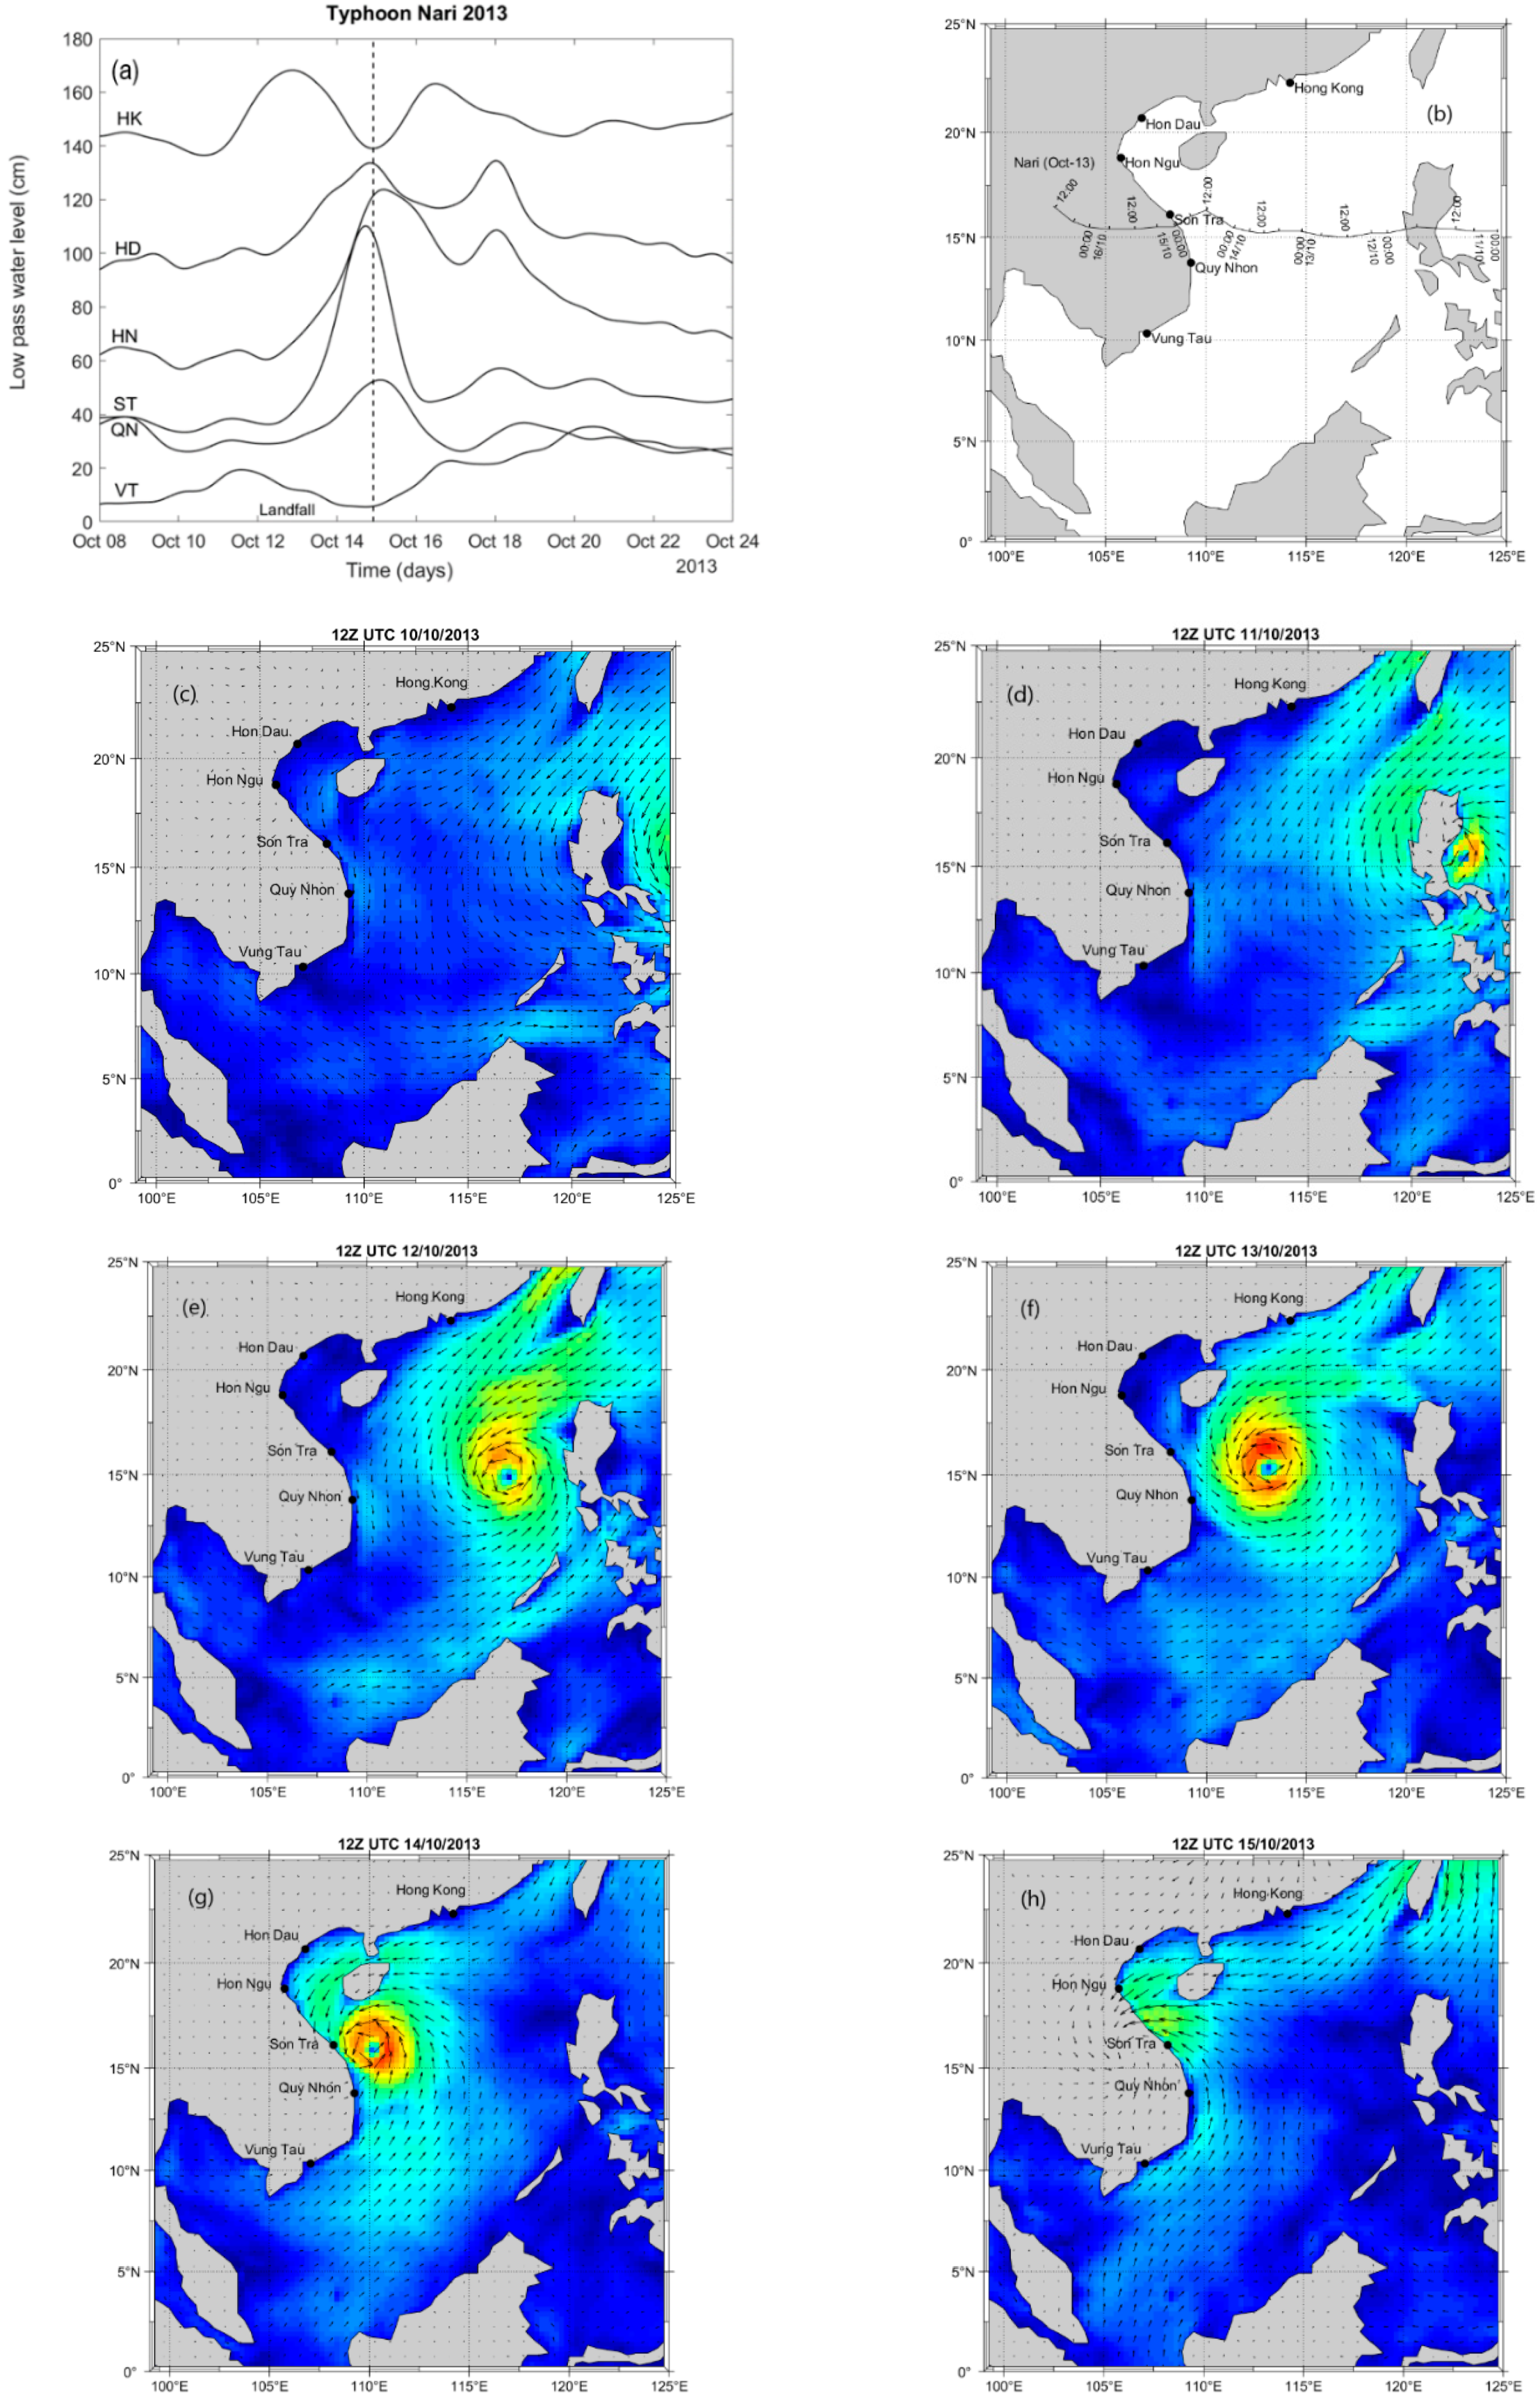
An increase of water level prior to landfall was caused not only by the forerunner (generated by alongshore wind), but there were instances where onshore wind (wind set-up) was also a contributing factor. When a typhoon is far from the coast, its wind field is alongshore, generating the forerunner to increase the water level at the station closest to its location. When the typhoon moves closer to the coast, the distance between typhoon centre and tide station becomes shorter. Stations to the north of the typhoon track will experience an onshore component of wind that will increase the water level at the coast. In this situation, it was difficult to separate, using the observations, the contribution of alongshore and onshore wind components. Therefore, a category that combined both mechanisms was created. Station Son Tra in typhoon Nari (October 2013) is an example. The mean sea level began increasing around 19:00 local time from (12Z UTC) on 10 October 2013 when the typhoon was approaching the Philippines, and then it continued to increase significantly until 17Z UTC 14 October with the highest forerunner magnitude peak of about 74 cm (Figure 13a). The wind vector maps indicated that wind direction near Son Tra island station was always parallel to the shore, even when the typhoon was close to this station (Figure 13c–f). In addition, Son Tra is located to the right of the typhoon track, because onshore wind will transport water onshore (Figure 13g,h). This combined with storm intensity created an extremely high surge that included both the forerunner and direct storm surge.
Results of the magnitude surge generated by the combined action of the forerunner and onshore wind indicated, as expected, higher surges than the forerunner alone (Figure 12). The highest magnitude was at Son Tra, 74 cm during Typhoon Nari (October 2013); followed by Hong Kong, 68 cm during Typhoon Kalmaegi (September 2014); and, Hon Ngu, 63 cm during Typhoons Wutip (September 2013) and Nari (Figure 12b). Under other storms, the magnitudes of the combined surge were 20–40 cm. It was also noticeable that Vung Tau observed a combined surge with onshore wind during Typhoon Tembin (December 2017) with a magnitude of 13 cm. Consequently, the mean sea level during this Typhoon increased compared to similar storms in previous years. This event was significant at the regional level because it occurred later in the year when the mean sea level was higher and experienced higher spring tides, which usually cause flooding to the Southern coast of Vietnam.
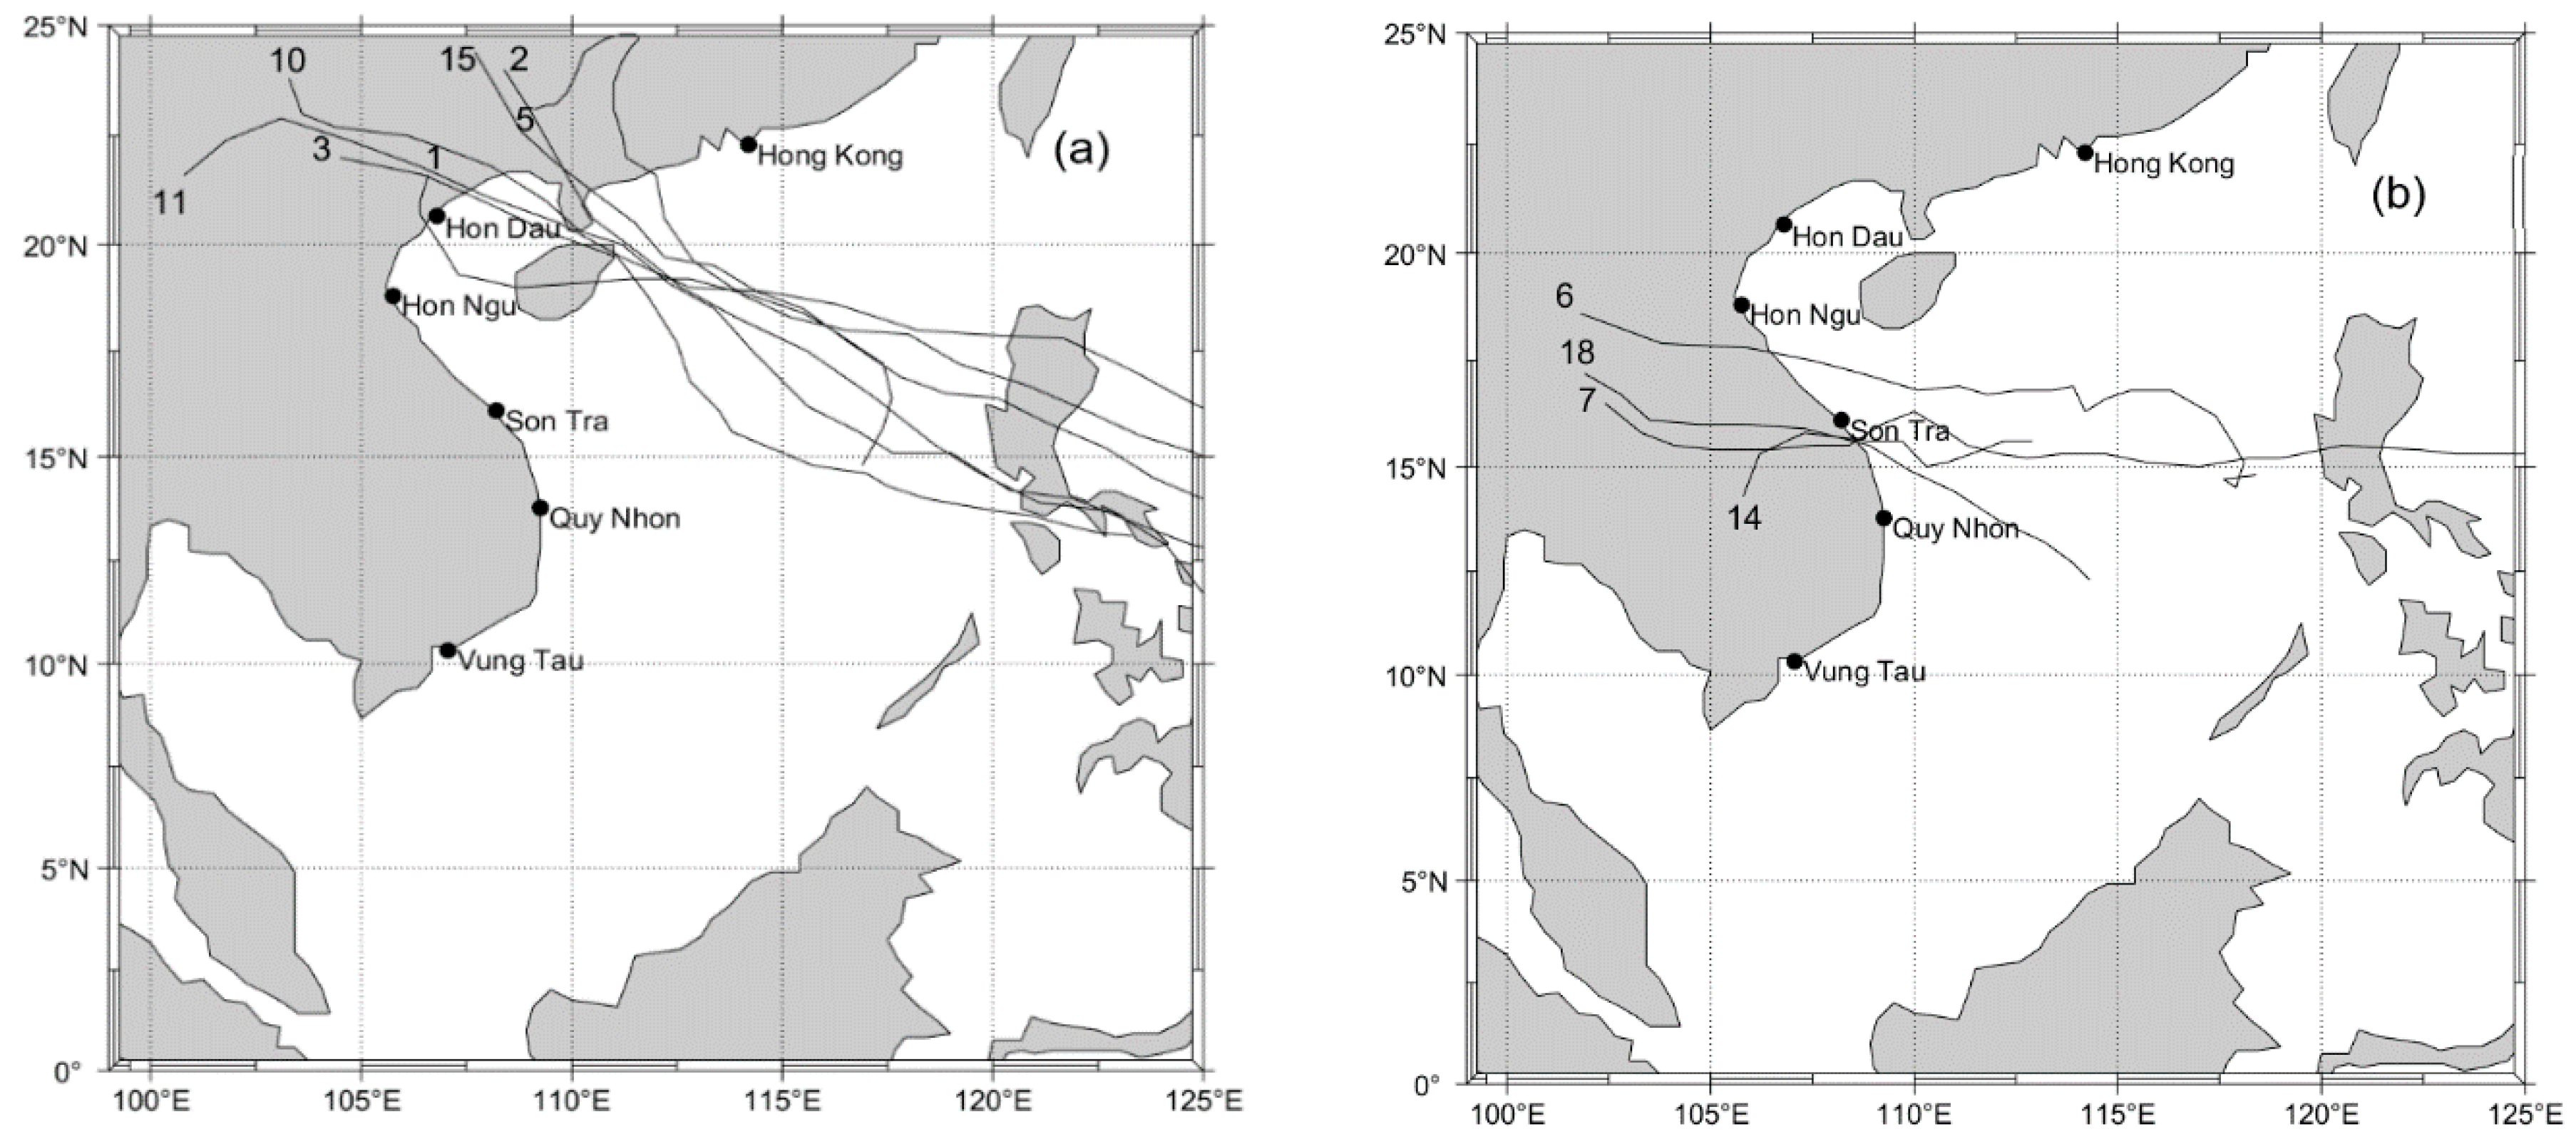
Examination of the storm tracks, which generated the combined surge at Hong Kong, revealed that they all have very similar travel paths (Figure 14). These tracks originated in the Pacific Ocean or in the Northeast of the East Sea, and then moved toward the Northwest (Figure 14a). The high combined surges at Hon Ngu were due to typhoons that made landfall along the Central part and included Typhoons Wutip (September 2013), Nari (October 2013) and TS Vamco (September 2015) and Rai (September 2016) (Figure 14b).

4.2.3. Frequency of Forerunner and the Combination Surge

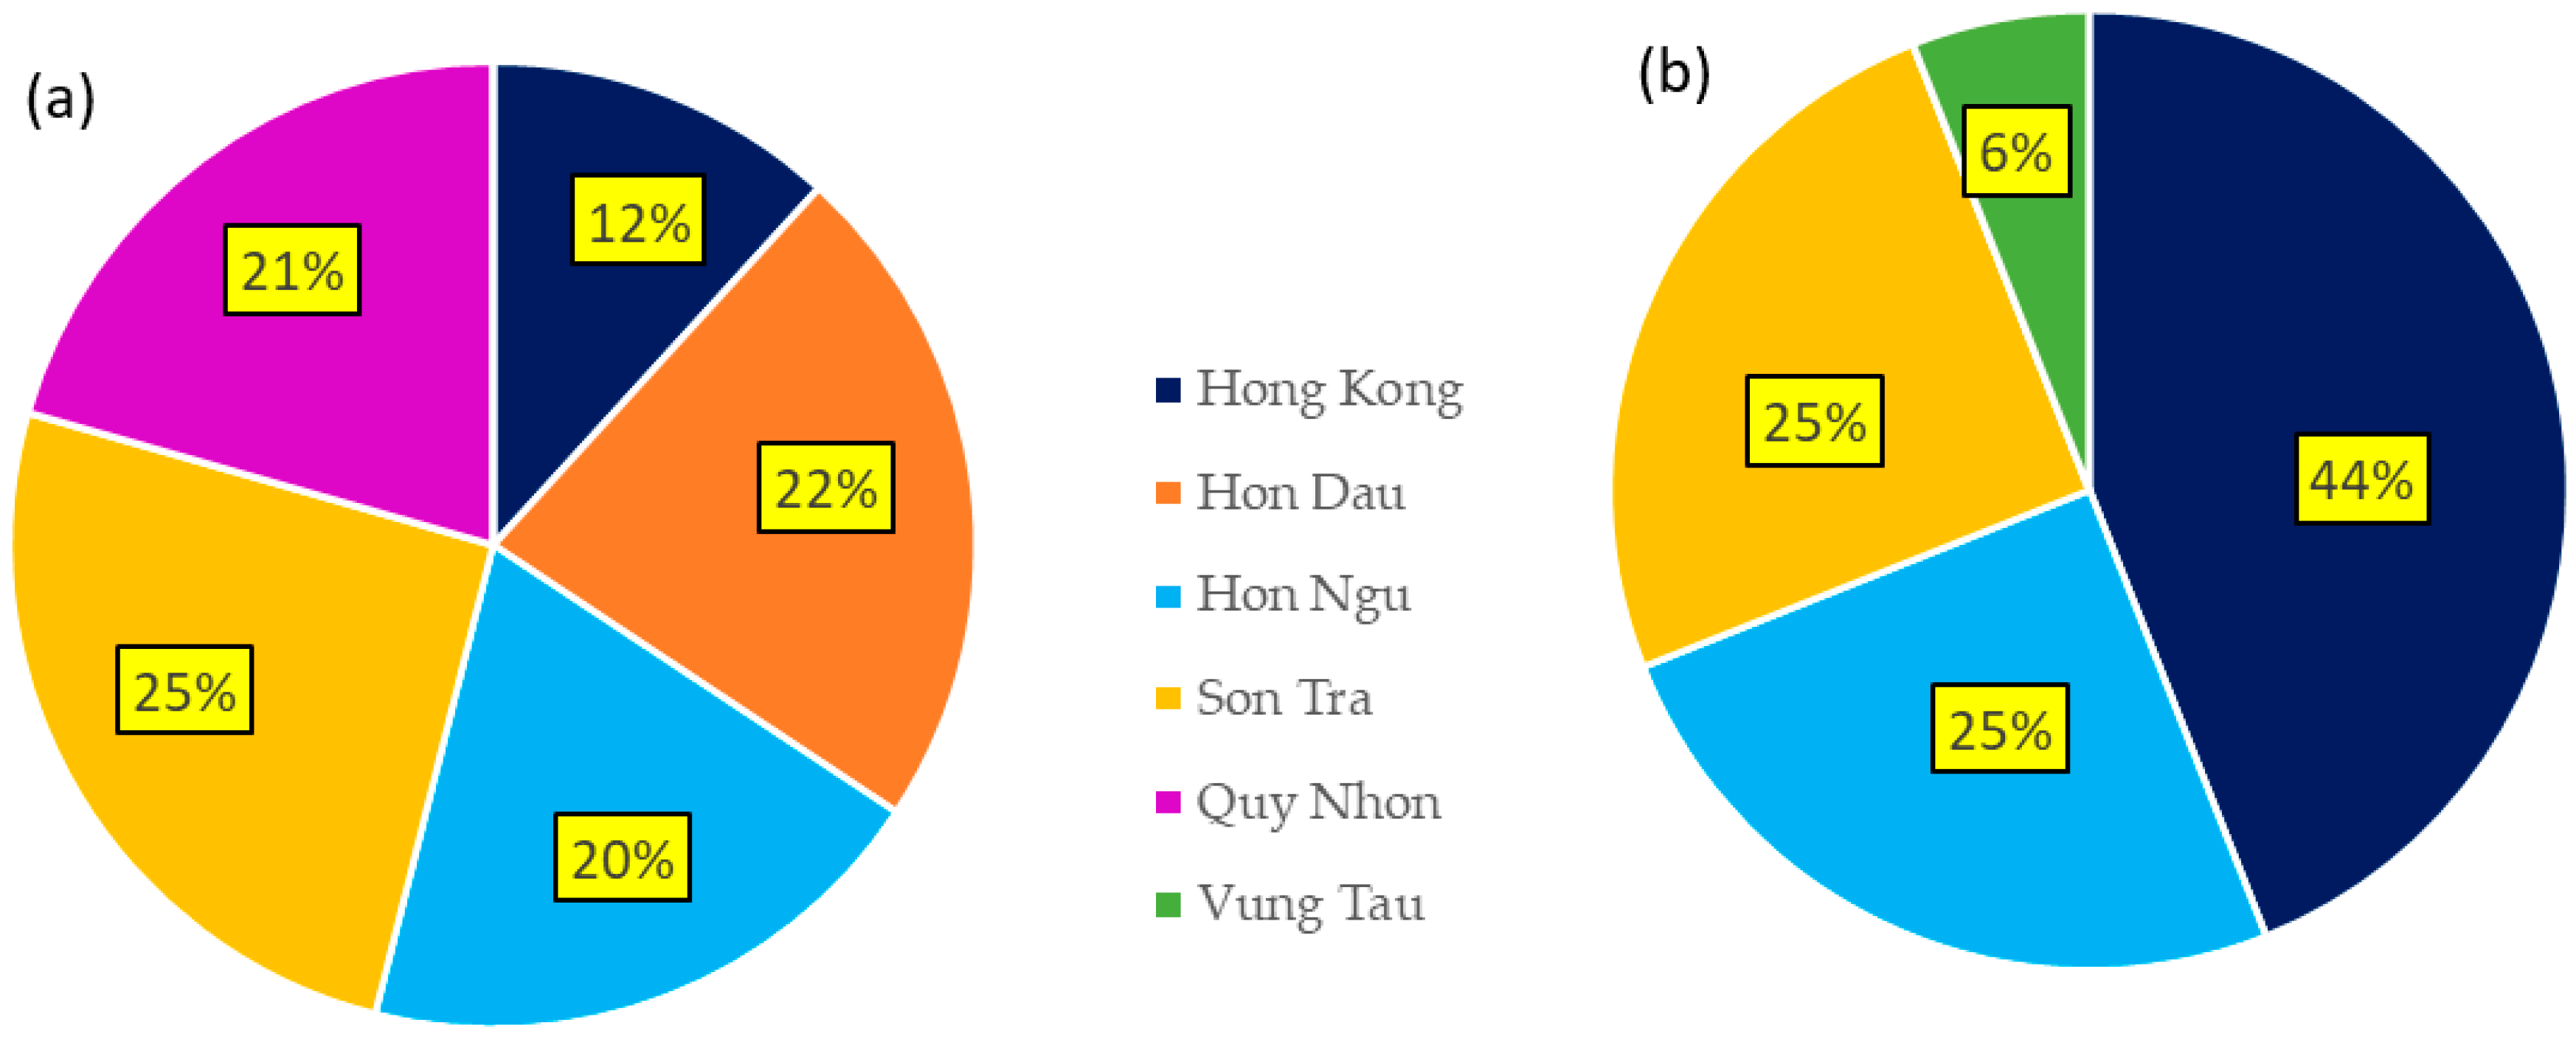
Analysis of the low pass filtered time series at each of the six stations indicated that at least one station recorded a forerunner or a combined surge during all of the storms analysed, except Typhoon Damrey and TS Kirogi. Forerunner surges were observed at all stations along the Vietnam coast with frequency 20–25% at Hon Dau, Hon Ngu, Son Tra, and Quy Nhon (Figure 15a). There was no forerunner observed at Vung Tau because of a rare occurrence of storms (Figure 15a). For combined surge due to forerunner and onshore wind, Vung Tau recorded 6%, whilst there are no such surges at Hon Dau and Quy Nhon, and about 25% at Hon Ngu and Son Tra (Figure 15b). At Hong Kong, the only station not on the Vietnam coast, the forerunner surge occurred ~12%, with the combined surge being the maximum at 44% (Figure 15).

5. Discussion

Storm surge (or residual) is usually defined as the non-tidal component of water level when the predicted astronomical tide is subtracted from the observed time series [12]. However, there are many processes with different time scales that contribute to the non-tidal component that include seiches, tsunamis, coastally trapped waves, and seasonal and inter-annual variability in sea level [29]. Extreme storm surges are usually associated with severe tropical storm systems (hurricanes, typhoons and tropical cyclones depending on the geographic region) where extreme winds and changes in atmospheric pressure contribute to the ‘direct’ storm surge that occurs within hours for the case when the storm makes landfall as in this study. However, the influence of the storm on the coastal sea levels begin 2–3 days prior to landfall due to the forerunner [9,11] and can last up to 10 days after landfall due to coastally trapped waves (e.g., continental shelf and edge waves, [6]). In this paper, we examined the characteristics of the forerunner along the Vietnam coast using a 5-year (2013–2017) record of hourly sea levels records. Over this period, 25 typhoons directly and indirectly affected the Vietnam coast.
The observations indicated that the maximum total water level range decreased from north to the central section and then increased to the south. The maximum range was ~4.0 m at Hon Dau (northern section) and Vung Tau (southern section). There was also a transition from mainly diurnal tides in the north and semi-diurnal tides in the south.

5.1. Seasonal Sea Level Variation

Features of the seasonal mean sea level time series, with higher mean water level in winter and lower mean water level in summer, is consistent with previous studies [30,31]. This variability has been attributed to monsoon winds: the southwest monsoon in summer and the northeast monsoon in winter. Offshore winds during the summer decrease the mean level whilst onshore winds during winter increase the water level with an annual range of 20 cm [30]. Seasonal changes were presented at all the stations (Figure 5 and Figure 6) as well in the spectral analysis (Figure 7). The main feature of the seasonal sea level variability was that storms that occurred later in the year will have higher total water level and thus higher potential for extreme coastal flooding. For example, if we consider two storms: TS Kujira (June 2015) and TS Vamco (September 2015) created the same storm surge (~40 cm) but the latter storms had higher total water level due to the mean seasonal sea level being higher (Figure 6).

5.2. Role of Forerunner

The results of the analysis of time series indicated that the forerunner was a common feature associated with storms that impact the Vietnam coast. The maximum height for the forerunner was 50 cm at Son Tra (in Typhoon Wutip), whilst for the case of the combined forerunner and onshore wind, the highest height was 74 cm, which was also at Son Tra (in Typhoon Nari) (Figure 12). The magnitudes of forerunner were similar to that observed in the Yellow Sea of 50 cm [12]. However, these values were not as high as those recorded during Hurricane Ike (2008) in the United States that reached 1.0 m [9]. The mean forerunner height was ~20 cm at all the stations for all typhoons. Thus, the forerunner formed a significant component (up to ~50%) of the total storm surge. As the forerunner occurs prior to storm landfall, it acts as a pre-conditioning of the water level before the generation of the main storm surge. Therefore, the contribution of forerunner is an important component that contributes to flooding and inundation of coastal areas of Vietnam.
It was impossible to separate the contribution of forerunner in a storm surge that was formed by the combination of forerunner and onshore wind at stations to the right of the storm path. For stations on its left and near landfall location, the contribution of forerunner could be identified as water levels at these stations would be negative due to offshore wind. A good example is Typhoon Wutip that made landfall at Quang Binh province, belonging to the Northern part. Son Tra was on the left of storm path; Hon Dau and Hon Ngu were on the right. It was expected that a high storm surge would occur at Hon Ngu and Hon Dau, and a negative storm surge would occur at Son Tra due to offshore winds with a decrease in water level. However, there was a large increase in mean water levels, and it is clearly a forerunner. Therefore, in this case, because of the forerunner, a positive storm surge was present at Son Tra station (Figure 9). Similarly, Quy Nhon is the station that was usually on the left of typhoons, but the mean water levels at this station increased during almost all typhoons.

5.3. Influence of Local Features and Storm Characteristics

The “S” shape of the Vietnam coastline is another interesting feature relating to the typhoon’s path and formation of forerunner. In the Northern section, Tonkin Gulf has crescent shape, so it is easy to generate a geostrophic current when there is a low-pressure area or a typhoon approaching the East of Hainan Island. This can be the reason why three stations, Hon Dau, Hon Ngu and Son Tra, usually observed the forerunner with the frequency of 20–25% (Figure 15). In addition, as most typhoons originating from the Pacific Ocean have made landfall on the Northern section, its northwest path easily generates a combination of forerunner and onshore wind that causes high sea levels at Son Tra station located at the mouth of Tonkin Gulf, and the coastal areas along central provinces. Another station located at the central part of Vietnam coastline is Quy Nhon, which also had a high frequency of forerunner with 21% (Figure 15). Its location is near the open sea (Central East Sea) where there are many favorable conditions for forming and maintaining the strength of storms, so it was easy to observe a forerunner at this station when a storm moved/formed in Central East Sea.
The intensity of typhoons relates to the maximum sustained wind speed and central pressure change, which is believed to contribute significantly to the increase of water level during typhoons [3,6,15]. In general, a large radius and more intense storm creates higher storm surges, forerunner, and coastal inundation [32,33]. However, this assumption may not be correct for all cases particularly along the Vietnam coast. Typhoon Damrey, for example, generated a low storm surge at Quy Nhon station and no forerunner surges at other stations, although it was one of the strongest typhoons when making landfall (centre pressure of 970 hPa and maximum sustained wind speeds > 150 kmhr−1). On the other hand, the intensity and size are important for the generation of forerunner when the typhoon is far offshore. For example, Typhoons Utor or Nari (both in 2013), when the centre was near the Philippines, >1000 km away from the Vietnam coast, the mean sea level at some stations along the Northern section indicated an increase in water levels (Figure 11 and Figure 13). Examining the wind fields at the start of these typhoons, the wind speed was not very strong whilst the wind direction was coast parallel. This indicated the significant influence of intense typhoons to the atmosphere and ocean at the regional scale. In addition, for the surge generated by a combination of forerunner and onshore wind, the intensity via wind speed pushed more water onshore (wind set-up), which increased the water level higher than the forerunner alone.
The size of a typhoon is determined through the wind’s field with its radius, which is the distance between the center of a typhoon and its band of strongest wind (i.e., the largest radius of 30 kn winds), and is classified by the radius of the area in which the wind speed exceeds 15 m/s The typhoon size shows how large an area is influenced by the typhoon. According to Liu & Irish [11], when a typhoon is large, it generates a higher surge. The results of time series analysis of 25 storms indicated that typhoon’s size can be a first factor to predict the forerunner, even when the center of the typhoon is far from the coast and its intensity is weak. If the typhoon was intense, it was easy to observe a large forerunner on the coastal area. Severe Tropical Storm Talas (July 2017) was not very strong as Typhoons Wutip, Nari (in 2013), with its centre pressure of 985 hPa and maximum sustained wind speeds of 95 kmhr−1 (51 kt). However, its size (~340–390 km) was similar to Typhoon Wutip or Nari and it generated a 10 cm high forerunner at Son Tra (Figure 10).
The path of the typhoon was important for sea level variations at the Tonkin Gulf. Four different storms (Tropical Depression 2013; Typhoon Nari; TS Vamco 2015; and TS Rai 2016) had similar paths, making landfall to the south of Son Tra (Figure 16). For each storm, the sea level changes inside the Tonkin Gulf were very similar (Figure 16). This indicates that a typhoon making landfall around Son Tra will result in high storm surges along the whole coast to the north of Son Tra, due to a combination of forerunner and onshore winds.

5.4. Implications

Sea level time series indicated that for each of the 25 tropical storms that were present in the record, a forerunner was present on at least one of the stations. The forerunner generated 2–3 days prior to storm impact, is due to a combination of shore parallel winds and currents that increase the mean water level at the coast due to Ekman set-up [9,11]. The forerunner signal was manifested when the center of the storm was up to 1000 km away (e.g., the coast of the Philippines). The model domain for many numerical prediction models for storm surges usually does not cover such a large area, mainly due to the availability of computer resources. Hence, these models are unable to predict the forerunner with some degree of accuracy. The results of this study indicated that the forerunner is a significant contribution to the total water level. For the future, it is recommended that the forerunner should be included in storm surge forecasts for Vietnam.

6. Conclusions

A 5-year, continuous time series of hourly sea levels at 5 stations along the Vietnam coast and Hong Kong was subjected to a variety of analysis techniques (tidal analysis, low-pass filtering and Fourier analysis) together with storm characteristics to examine the contribution of forerunner to sea level variations during the typhoon impact. The conclusions can be summarized as follows:
  • The forerunner contributed significantly to the increase of the mean sea level prior to landfall, with the largest magnitude being 50 cm and 74 cm; the latter being in combination with onshore wind. Almost all typhoons generated a forerunner at least at one station with the forerunner contributing up to 50% of the total storm surge. Stations on the right of the typhoon track were often observed to contain a forerunner combining with onshore wind due to the typhoon winds rotating anti-clockwise around the low pressure under the Coriolis Effect.
  • Similar typhoon paths often lead to similar signals of forerunners at certain stations. The size of the typhoon was more important than its intensity in the generation of the forerunner.
  • Seasonal variability in the mean level was such that storms occurring later in the year coincided with higher mean sea levels due to the monsoon and spring tides, and thus, potentially have a higher maximum total water level.

Author Contributions

This study was done as a part of master’s thesis by T.T.T. All data analysis and validation were done by T.T.T under the supervision of C.P., and the support of T.B. Conceptualization, T.T.T., C.P.; methodology, T.T.T., C.P.; software, C.P., T.B.; data analysis, T.T.T.; resources, C.P.; a part of data source, T.B.; writing—original draft preparation, T.T.T., C.P.; writing—review and editing, T.T.T., C.P.; visualization, T.T.T., C.P. All authors have read and agreed to the published version of the manuscript.

Funding

The research is funded by master’s dissertation at the University of Western Australia, and DFAT who sponsored Australia Awards Scholarships for the master’s course.

Acknowledgments

The observed hourly sea level data used in this research were sourced from the Hydro-meteorological and Environmental Station Network Center (the Hymenet) thanks to the support of Toan Bui. Data at Hong Kong tide gauge is available at the NOAA National Centres for Environmental Information as the Joint Archive for Sea Level at https://uhslc.soest.hawaii.edu/. The typhon information is available at the Japan Meteorological Agency (JMA) (https://www.jma.go.jp/en/typh/), the National Oceanic and Atmospheric Administration (NOAA) (https://www.coast.noaa.gov/hurricanes/). The Digital Typhoon database is available at http://agora.ex.nii.ac.jp/digital-typhoon/. The wind field was extracted from https://cds.climate.copernicus.eu/.

Conflicts of Interest

The authors declare no conflict of interest.

References

  1. Lin, N.; Emanuel, K.; Oppenheimer, M.; Vanmarcke, E. Physically based assessment of hurricane surge threat under climate change. Nat. Clim. Chang. 2012, 2, 462–467. [Google Scholar] [CrossRef] [Green Version]
  2. Haigh, I.D.; MacPherson, L.R.; Mason, M.; Wijeratne, E.M.S.; Pattiaratchi, C.; Crompton, R.P.; George, S. Estimating present day extreme water level exceedance probabilities around the coastline of Australia: Tropical cyclone-induced storm surges. Clim. Dyn. 2013, 42, 139–157. [Google Scholar] [CrossRef] [Green Version]
  3. Vecchi, G.A.; Soden, B.J. Effect of remote sea surface temperature change on tropical cyclone potential intensity. Nature 2007, 450, 1066–1070. [Google Scholar] [CrossRef] [PubMed]
  4. Le, T.A.; Takagi, H.; Heidarzadeh, M.; Takata, Y.; Takahashi, A. Field Surveys and Numerical Simulation of the 2018 Typhoon Jebi: Impact of High Waves and Storm Surge in Semi-enclosed Osaka Bay, Japan. Pure Appl. Geophys. 2019, 176, 4139–4160. [Google Scholar] [CrossRef]
  5. Heidarzadeh, M.; Teeuw, R.; Day, S.; Solana, C. Storm wave run ups and sea level variations for the September 2017 Hurricane Maria along the coast of Dominica, eastern Caribbean Sea: Evidence from field surveys and sea level data analysis. Coast. Eng. J. 2018, 60, 371–384. [Google Scholar] [CrossRef] [Green Version]
  6. Eliot, M.; Pattiaratchi, C. Remote forcing of water levels by tropical cyclones in southwest Australia. Cont. Shelf Res. 2010, 30, 1549–1561. [Google Scholar] [CrossRef]
  7. Thai, T.H.; Thuy, N.B.; Dang, V.H.; Kim, S.; Hole, L.R. Impact of the interaction of surge, wave and tide on a storm surge on the north coast of Vietnam. Procedia IUTAM 2017, 25, 82–91. [Google Scholar] [CrossRef]
  8. Dasallas, L.; Lee, S. Topographical Analysis of the 2013 Typhoon Haiyan Storm Surge Flooding by Combining the JMA Storm Surge Model and the FLO-2D Flood Inundation Model. Water 2019, 11, 144. [Google Scholar] [CrossRef] [Green Version]
  9. Kennedy, A.; Gravois, U.; Zachry, B.C.; Westerink, J.J.; Hope, M.E.; Dietrich, J.C.; Powell, M.; Cox, A.T.; Luettich, R.A.; Dean, R.G. Origin of the Hurricane Ike forerunner surge. Geophys. Res. Lett. 2011, 38. [Google Scholar] [CrossRef]
  10. Thuy, N.B.; Cuong, H.D.; Tien, D.D.; Chien, D.D.; Kim, S.Y. Assessment of changes in sea level caused by Typhoon No. 3 (Kalmaegi) in 2014 and forecast problems. Sci. Tech. Meteorol. J. 2014, 647, 16–20. (In Vietnamese) [Google Scholar]
  11. Liu, Y.; Irish, J.L. Characterization and prediction of tropical cyclone forerunner surge. Coast. Eng. 2019, 147, 34–42. [Google Scholar] [CrossRef] [Green Version]
  12. Suh, S.-W.; Lee, H.-Y. Forerunner storm surge under macro-tidal environmental conditions in shallow coastal zones of the Yellow Sea. Cont. Shelf Res. 2018, 169, 1–16. [Google Scholar] [CrossRef]
  13. Pugh, D.T. Tides, Surges and Mean Sea Level—A Handbook for Engineers and Scientists; John Wiley & Sons: Chichester, UK, 1987; p. 472. [Google Scholar]
  14. Janowitz, G.S.; Pietrafesa, L.J. Subtidal frequency fluctuations in coastal sea level in the mid and south Atlantic Bights: A prognostic for coastal flooding. J. Coast. Res. 1996, 12, 79–89. [Google Scholar]
  15. Thuy, N.B.; Kim, S.; Chien, D.D.; Dang, V.H.; Cuong, H.D.; Wettre, C.; Hole, L.R. Assessment of Storm Surge along the Coast of Central Vietnam. J. Coast. Res. 2016, 33, 518–530. [Google Scholar] [CrossRef]
  16. Thuy, V.T.T. Storm Surge Modeling for Vietnam’s Coast. Master’s Thesis, IHE Delft: Delft, The Nederlands, 2003; p. 140. [Google Scholar]
  17. Express.co.uk. Vietnam Lashed by Typhoon Doksuri—Flooding, Loss of Power and Houses Destroyed. Available online: https://www.express.co.uk/news/world/854559/Vietnam-Typhoon-Doksuri-2017-path-weather-flood-evacuation (accessed on 16 March 2019).
  18. Takagi, H.; Thao, N.D.; Esteban, M. Tropical Cyclones and Storm Surges in Southern Vietnam. In Coastal Disasters and Climate Change in Vietnam; Thao, N.D., Takagi, H., Esteban, M., Eds.; Elsevier: Amsterdam, The Netherlands, 2014; pp. 3–16. [Google Scholar]
  19. Fang, G.; Kwok, Y.K.; Yu, K.; Zhu, Y. Numerical simulation of principal tidal constituents in the South China Sea, Gulf of Tonkin and Gulf of Thailand. Cont. Shelf Res. 1999, 19, 845–869. [Google Scholar] [CrossRef]
  20. Caldwell, P.; Merrifield, M.; Thompson, P. Sea level measured by tide gauges from global oceans as part of the Joint Archive for Sea Level (JASL) from 1846-01-01 to 2015-07-31. Natl. Oceanogr. Data Center 2015, 10, V5V40S7W. [Google Scholar]
  21. Pugh, D.; Woodworth, P. Sea-Level Science: Understanding Tides, Surges, Tsunamis and Mean Sea-Level Changes; Cambridge University Press: Cambridge, UK, 2014. [Google Scholar]
  22. Jin, G.; Pan, H.; Zhang, Q.; Lv, X.; Zhao, W.; Gao, Y. Determination of Harmonic Parameters with Temporal Variations: An Enhanced Harmonic Analysis Algorithm and Application to Internal Tidal Currents in the South China Sea. J. Atmos. Ocean. Technol. 2018, 35, 1375–1398. [Google Scholar] [CrossRef]
  23. Pawlowicz, R.; Beardsley, B.; Lentz, S. Classical tidal harmonic analysis including error estimates in MATLAB using T_TIDE. Comput. Geosci. 2002, 28, 929–937. [Google Scholar] [CrossRef]
  24. Moftakhari, H.R.; Jay, D.A.; Talke, S.A.; Kukulka, T.; Bromirski, P.D. A novel approach to flow estimation in tidal rivers. Water Resour. Res. 2013, 49, 4817–4832. [Google Scholar] [CrossRef] [Green Version]
  25. Consoli, S.; Recupero, D.R.; Zavarella, V. A survey on tidal analysis and forecasting methods for Tsunami detection. arXiv 2014, arXiv:1403.0135. [Google Scholar]
  26. Wijeratne, E.; Pattiaratchi, C.; Eliot, M.; Haigh, I.D. Tidal characteristics in Bass Strait, south-east Australia. Estuar. Coast. Shelf Sci. 2012, 114, 156–165. [Google Scholar] [CrossRef]
  27. Thompson, R.O.R.Y. Low-Pass Filters to Suppress Inertial and Tidal Frequencies. J. Phys. Oceanogr. 1983, 13, 1077–1083. [Google Scholar] [CrossRef] [Green Version]
  28. Sebastian, M.; Behera, M.R.; Murty, P. Storm surge hydrodynamics at a concave coast due to varying approach angles of cyclone. Ocean Eng. 2019, 191, 106437. [Google Scholar] [CrossRef]
  29. Pattiaratchi, C. Coastal tide gauge observations: Dynamic processes present in the Fremantle record. In Operational Oceanography in the 21st Century; Springer: Berlin/Heidelberg, Germany, 2011; pp. 185–202. [Google Scholar]
  30. Amiruddin, A.M.; Haigh, I.D.; Tsimplis, M.; Calafat, F.M.; Dangendorf, S. The seasonal cycle and variability of sea level in the South China Sea. J. Geophys. Res. Oceans 2015, 120, 5490–5513. [Google Scholar] [CrossRef] [Green Version]
  31. Ho, C.-R.; Zheng, Q.; Soong, Y.S.; Kuo, N.-J.; Hu, J. Seasonal variability of sea surface height in the South China Sea observed with TOPEX/Poseidon altimeter data. J. Geophys. Res. Space Phys. 2000, 105, 13981–13990. [Google Scholar] [CrossRef]
  32. Orton, P.M.; Talke, S.A.; Jay, D.A.; Yin, L.; Blumberg, A.F.; Georgas, N.; Zhao, H.; Roberts, H.J.; MacManus, K. Channel Shallowing as Mitigation of Coastal Flooding. J. Mar. Sci. Eng. 2015, 3, 654–673. [Google Scholar] [CrossRef] [Green Version]
  33. Atkinson, J.; Smith, J.M.; Bender, C. Sea-Level Rise Effects on Storm Surge and Nearshore Waves on the Texas Coast: Influence of Landscape and Storm Characteristics. J. Waterw. Port Coast. Ocean Eng. 2013, 139, 98–117. [Google Scholar] [CrossRef]
Figure 1. (a) Schematic of the mechanics of forerunner formation in the northern hemisphere. When the typhoon is far from the coast, shore parallel winds and alongshore currents drive an onshore Ekman flow; and (b) a cross-shelf schematic of the Ekman set-up, ζ E K .
Jmse 08 00508 g001
Figure 2. Location of the study region showing the locations of sea level measuring stations. Bathymetry is in meters.
Jmse 08 00508 g002
Figure 3. Tracks of typhoons that made landfall on the Vietnam coast from 2013 to 2017: (a) all tracks; (b) typhoons making landfall on the Northern coast; (c) typhoons making landfall on the Central coast; (d) typhoons making landfall on the South coast. Key to the numbers referring to typhoons: 1–TS Bebinca (June-13), 2–STS Rumbia (June-13), 3–STS Jebi (August-13), 4–TS Mangkhut (August-13), 5–TY Utor (August-13), 6–TY Wutip (September-13), 7–TY Nari (October-13), 8–TY Haiyan (November-13), 9–TS Podul (November-13), 10–TY Rammasun (July-14), 11–TY Kalmaegi (September-14), 12–TS Sinlaku (November-14), 13–TS Kujira (June-15), 14–TS Vamco (September-15), 15–TY Mujigae (October-15), 16–STS Mirinae (July-16), 17–TS Dianmu (August-16), 18–TS Rai (September-16), 19–TY Sarika (October-16), 20–STS Talas (July-17), 21–TS Sonca (July-17), 22–TY Doksuri (September-17), 23–TY Damrey (November-17), 24–TS Kirogi (November-17), 25–TY Tembin (December-17). Abbreviations: TS: Tropical Storm, STS: Severe Tropical Storm, TY: Typhoon.
Jmse 08 00508 g003aJmse 08 00508 g003b
Figure 4. Combination between tidal analysis and low-pass filter at Hon Dau station in Typhoon Kalmaegi (September 2014).
Jmse 08 00508 g004
Figure 5. Observed water level time series at all stations. Note that each time is displaced by 300 cm.
Jmse 08 00508 g005
Figure 6. Time series of low frequency water levels from 2013 to 2017. Note that each time series is displaced by 100 cm. Key to numbers referring to typhoons: 1–TS Bebinca (June-13), 5–TY Utor (August-13), 6–TY Wutip (September-13), 7–TY Nari (October-13), 8–TY Haiyan (November-13), 11–TY Kalmaegi (September-14), 13–TS Kujira (June-15), 14–TS Vamco (September-15), 16–STS Mirinae (July-16), 18–TS Rai (September-16), 19–TY Sarika (October-16), 20–STS Talas (July-17), 22–TY Doksuri (September-17). Abbreviations: L: Low pressure, TD: Tropical Depression, TS: Tropical Storm, STS: Severe Tropical Storm, TY: Typhoon, MS: Monsoon Season (Northeast wind).
Jmse 08 00508 g006
Figure 7. Spectral analysis of water levels at six stations from 2013 to 2017. Key: HK: Hong Kong; HD: Hon Dau; HN: Hon Ngu; ST: Son Tra, QN: Quy Nhon; VT: Vung Tau.
Jmse 08 00508 g007
Figure 8. Time series of observed, residual and low-pass filtered water levels during Typhoon Wutip (24 September to 9 October 2013) at Son Tra tide gauge.
Jmse 08 00508 g008
Figure 9. (a) Time series of low-pass filtered water levels during Typhoon Wutip (24 September to 9 October 2013) at all stations; (b) the track of Typhoon Wutip; and (ch)—wind fields at 12Z UTC from 25 September to 30 September 2013. Key: HK: Hong Kong; HD: Hon Dau; HN: Hon Ngu; ST: Son Tra, QN: Quy Nhon; VT: Vung Tau.
Jmse 08 00508 g009
Figure 10. (a) Time series of observed, residual and low-pass filtered water levels during Severe Tropical Storm Talas (11–27 July 2017) at all stations; (b) the track of Severe Tropical Storm Talas; and (cf)—wind field at 12Z UTC from 13 to 16 July 2013. Key: HK: Hong Kong; HD: Hon Dau; HN: Hon Ngu; ST: Son Tra, QN: Quy Nhon; VT: Vung Tau. The wind speed colour scale is given on Figure 9.
Jmse 08 00508 g010
Figure 11. (a) Time series of observed, residual and low-pass filtered water levels during Typhoon Utor (9–23 August 2013) at all stations; (b) the track of Typhoon Utor; and (ch)—wind fields at 12Z UTC from 11 to 16 August 2013. Key: HK: Hong Kong; HD: Hon Dau; HN: Hon Ngu; ST: Son Tra, QN: Quy Nhon; VT: Vung Tau. The wind speed colour scale is given on Figure 9.
Jmse 08 00508 g011
Figure 12. Magnitude of typhoons induced: (a) forerunner surge; and (b) combination of forerunner and onshore wind.
Jmse 08 00508 g012
Figure 13. (a) Time series of observed, residual and low-pass filtered water levels during Typhoon Nari (8–24 October 2013) at all stations; (b) the track of Typhoon Nari and (ch)—wind fields at 12Z UTC from 10 to 15 October 2013. Key: HK: Hong Kong; HD: Hon Dau; HN: Hon Ngu; ST: Son Tra, QN: Quy Nhon; VT: Vung Tau. The wind speed colour scale is given in Figure 9.
Jmse 08 00508 g013
Figure 14. Similar storm paths when observing a high surge due to a combination between forerunner and onshore wind at: (a) Hong Kong; and (b) Hon Ngu and Son Tra. Numbers refer to typhoons listed in Figure 3.
Jmse 08 00508 g014
Figure 15. Percentage of frequency of forerunner (a) and the combination of forerunner and onshore wind (b).
Jmse 08 00508 g015
Figure 16. Low-pass water level at all station during Tropical Depression (September 2013) (a), Typhoon Nari (October 2013) (b), Tropical Storm Vamco (September 2013) (c), Tropical Storm Rai (September 2016) (d), and their paths (e). Numbers refer to typhoons listed on Figure 3.
Jmse 08 00508 g016
Table 1. Tidal characteristics along the coast of Vietnam [19].
Coastal SectionLocationAmplitude of Tidal ConstituentsTidal Character
(Form Factor)
Mean Tidal Range (m)
M2 (cm)S2 (cm)K1 (cm)O1 (cm)
Chinese coastHong Kong38153629Mixed, semi-diurnal (1.2)2.0–2.5
Northern CoastHon Dau
Hon Ngu
638525Diurnal tides (12.2)
Diurnal tides (4.1)
3–4
1.2–2.5
30910358
Central CoastSon Tra
Quy Nhon
1762013Mixed, semi-diurnal (1.4) Mixed diurnal regime (2.5)0.5
1.2–2.0
1863427
Southern CoastVung Tau79306146Mixed semi-diurnal (1.0)3–4
Table 2. Tide gauge information.
Station Name *LatitudeLongitudeCountry
Hong Kong22.30114.20Hong Kong
Hon Dau20.66106.80Vietnam
Hon Ngu18.80105.76Vietnam
Son Tra16.10108.21Vietnam
Quy Nhon13.77109.25Vietnam
Vung Tau10.34107.07Vietnam
* the sampling interval at all locations was 1 h.