Article

Springing Analysis of a Passenger Ship in Waves

1
Maritime Technology Group, Department of Mechanical Engineering, Aalto University, 02150 Espoo, Finland
2
Foreship Ltd., 00810 Helsinki, Finland
*
Author to whom correspondence should be addressed.
J. Mar. Sci. Eng. 2020, 8(7), 492; https://doi.org/10.3390/jmse8070492
Submission received: 1 June 2020 / Revised: 8 June 2020 / Accepted: 1 July 2020 / Published: 5 July 2020
(This article belongs to the Special Issue Ship Dynamics for Performance Based Design and Risk Averse Operations)

Abstract

:
Traditionally, the evaluation of global loads experienced by passenger ships has been based on closed-form Classification Society Rule formulae or quasi direct analysis procedures. These approaches do not account for the combined influence of hull flexibility, slenderness, and environmental actions on global dynamic response. This paper presents a procedure for the prediction of the global wave-induced loads of a medium-size passenger ship using a potential flow Flexible Fluid Structure Interaction (FFSI) model. The study compares results from direct long-term hydro-structural computations against Classification Society Rules. It is demonstrated that for the specific vessel under consideration: (a) the elastic contributions of the responses on loads are negligible as springing effects occur outside of the wave energy spectrum, (b) deviations of the order of 28% arise by way of amidships when comparing direct hydrodynamic analysis predictions encompassing IACS UR S11A hog/sag nonlinear correction factors and the longitudinal strength standard, and (c) the interpretation of the wave scatter diagram influences predictions by approximately 20%. Based on these indications, it is recommended that further parametric studies over a range of passenger ship designs could help draw unified conclusions on the total influence of global and local hydrodynamic actions on passenger ship loads and dynamic response.

1. Introduction

Over the last ten years, the average size of passenger ships increased by approximately 30%. This trend reflects the demands of the economies of scale and tourist market expectations that consistently exceeded available supply [1]. Modern passenger vessels comprise of large effective superstructures and slender hulls. These unique design features imply that hull flexibility could be important in terms of predicting wave-induced loads [2]. Classification Rules and design procedures with direct application to passenger vessels do not account for the influence of hull flexibility on global loads in waves [3] and the possible influence of hydroelasticity on global response has not been investigated before.
Today, the global strength of these ships is assessed by semi-empirical rules or quasi direct analysis methods [4,5]. In direct analysis procedures, hydrodynamic and structural modeling are usually uncoupled [2,6]. Fluid structure interaction (FSI) is implemented by assuming that the ship is a rigid body that balances on a trochoidal waveform. The hydrodynamic pressures by way of the wetted part of the hull are extracted from a hull panel method and then applied to the finite element analysis (FEA) model. Hydroelasticity bypasses rigid hull assumptions by providing a coupled solution where the ship is treated as a flexible body [7]. Accordingly, the dynamic response in waves can be evaluated by combining structural dynamics and potential flow hydrodynamics [2,8].
The foundations of hydroelasticity theory subject to steady-state or transient wave-induced loads have been established by Bishop, Price and their collaborators [7,8,9,10,11,12]. Hydroelastic modeling consists of two parts, namely dry- and wet-analysis, and can be applied in two- or three-dimensional FSI domains. The two-dimensional form of the theory can model the dynamic response (motions, distortions, bending moments, shear forces, and torsional moments) of beam-like ships by combining Timoshenko beam or Vlasov beam dynamics with strip theory methods [9]. On the other hand, three-dimensional hydroelasticity applies to both beam-like and non-beam-like structures [7,8,9,10,11]. In this case, dry analysis uses FEA and the fluid actions associated with the distorting wet structure are determined from a panel method. To date, comparisons of two- and three-dimensional predictions have shown good overall agreement for symmetric responses [7,8,9,10,11]. However, in the antisymmetric plane, deviations may emerge due to the existence of large openings and the lack of ability of the beam like theories to model out of plane distortions [8].
Since the early 2000s, significant research efforts have focused on the validation of theoretical predictions by segmented model tests and the development of design procedures or methods that account for linear and weakly nonlinear effects on the dynamic response of slender, beam-like floating structures in waves. For example, Malenica et al. [13] reported on the global hydroelastic response of a barge to impulsive and non-impulsive wave loads. Their numerical model was validated against dedicated model tests for a barge modeled with 12 pontoons interconnected by means of two elastic plates. Shin et al. [14] and Bigot et al. [15] presented satisfactory comparisons of springing and whipping responses against model tests for the case of an ultra-large container ship (ULCS). Derbanne et al. [16] conducted springing tests on a very elastic box-like ship model and symmetric load-induced whipping tests on a passenger ship. Shin et al. [17] and Malenica and Tuitman [18] presented fully coupled hydroelastic models with nonlinear corrections for steady-state and slamming analysis. Once again, their numerical models were applied to a ULCS. Their frequency- and time-domain comparisons revealed that hull flexibility might have a significant influence on container ship loading. Im et al. [19] utilized a fully coupled symmetric springing and whipping assessment to question the influence of hydroelasticity on the fatigue loads experienced by a 19,000 TEU ULCS.
To date, research on the combined influence of irregular waves on a global rigid body or flexible dynamic response has been limited. For example, Rajendran et al. [20] confirmed the significant effects of bow flare variation on the rigid response of a bulker, a container ship and a passenger ship sailing in extreme waves and irregular seaways. Kim and Kim [21] and Jiao et al. [22] predicted extreme loads by time-domain hydroelastic methods. Their work shows that: (a) the combination of rigid and flexible ship dynamics may influence the long-term vertical sagging and hogging moments amidships and (b) Classification Society Rules for ultimate strength assessment may be dependent on sea state variations and the associated cycle times of alternate loads.
There are no publications where three-dimensional hydroelasticity theories have been applied for the prediction of global long-term wave-induced loads on passenger ships. To close this gap in the literature, this paper presents a method for the prediction of springing induced wave loads of a modern medium size passenger ship. The approach is based on the FFSI of Bishop et al. [7] and is applied along the lines of the modeling procedures introduced by Hirdaris et al. [2,8], Malenica et al. [23] and Classification Societies [24,25,26]. It is noted that the influence of equivalent design wave on total response or slamming induced whipping loads and associated effects on hull stresses is not considered. Instead, the main objective has been to compare itemized steady state, i.e., springing induced loads with Classification Rules and accordingly examine their influence on global long-term ship dynamic response in waves [27,28,29].

2. Theoretical Background

The principles of linear hydroelasticity theory are broadly discussed in the literature (e.g., [2,6,8,10,23]). This section highlights key theoretical and modeling items of direct relevance to three-dimensional FFSI idealizations.
An overview of the coupling procedure is presented in Figure 1. In ‘dry analysis’ the ship’s structure can be modeled by the finite element method (FEM), and modal analysis effects (natural frequencies, mode shapes, and associated modal distortions) are evaluated in vacuo, i.e., in the absence of any damping effects, for mass and inertia properties corresponding to a typical load case. In ‘wet analysis’ ship hydrodynamics are modeled within the context of potential flow theory by a frequency domain ‘Green function’ panel method. Accordingly, hydrodynamic actions are evaluated by way of the wetted hull panels [10,20], and hydrodynamic pressures are integrated on the hull surface. FFSI is enabled by incorporating the influence of flexible ship distortions on hydrodynamic pressures. Structural responses are then separated into their rigid body and hydroelastic counterparts [18]. To predict the long-term loading of the ship, sea states the ship may encounter during her lifetime are considered. Thus, the long-term dynamic response accounting for cumulative short-term responses in sea states is defined by scatter diagrams [29] and transfer function (RAOs) are computed by spectral analysis.

2.1. Frequency Domain Hydroelastic Seakeeping Model

A fundamental principle of hydroelasticity theory is that it accounts for the influence of hull distortions on dynamic response. These hydroelastic distortions represent the influence of continuous or discontinuous structural deflections, and are incorporated in the FFSI mathematical model according to Newman’s generalized modal approach [30]. Within the context of linearity ship displacement is represented as the aggregate of modal displacements according to the Equation:
H ( x , y , z ,   t ) = i = 1 N ξ i ( t ) h i ( x , y , z ) = i = 1 N ξ i ( t ) [ h x i ( x , y , z ) i + h y i ( x , y , z ) j + h z i ( x , y , z ) k ]
where vector functions hi (x, y, z) are the modal displacements of the rigid and elastic modes, ξi are the corresponding modal amplitudes, and N is the number of modes considered. Implementation of the modal approach leads to additional radiation potentials with the body boundary condition:
φ R j n = h j n
where n is the unit normal vector and hj denotes the transferred modal displacements of rigid and elastic modes.
Hydrodynamic pressures are calculated after solving the boundary value problem. Integration of the pressures over the wetted body surface results in the Equation:
{ ω e 2 ( [ m ] + [ A ] ) i ω e ( [ B ] + [ b ] ) + ( [ k ] + [ C ] ) } { ξ } = { F D I }
where ωe is the wave encounter frequency; m represents the modal structural mass; A,B are the hydrodynamic added mass and damping; b andk are the structural damping and stiffness; C is the hydrostatic restoring force; ξ is the modal amplitude; FDI represents the vector of hydrodynamic excitations.
Equation (3) is essentially Newton’s 2nd law of motion for the case of a flexible ship moving in waves. It accounts for linear springing and may be used to solve the principal coordinate amplitudes, i.e., modal amplitudes, and the corresponding phase angles for six rigid body motions and n distortion modes in regular waves. These modal amplitudes may then be used to define a corresponding number of modal internal actions, namely loads and stresses [6,31]. For example, the modal vertical bending moment (My) along the length of the ship can be defined as:
M y ( x ,   t ) = i = 1 N ξ i ( t ) M y i ( x )
where Myi is the modal vertical bending moment for the ith mode of vibration. Respectively, the distribution of total stress can be defined as:
( x , y , z , ω ) = i = 1 N ξ i ( ω ) σ i ( x , y , z )
where σi (x, y, z) is the spatial distribution of the stresses (i.e., the stress tensor matrix) corresponding to each of the rigid and distortion modes. It is important to note that rigid body motions do not contribute to either the internal loads (see Equation (4)) or to the total stress (see Equation (5)). However, the number of considered distortion modes may influence the results. Generally, the first few lowest frequency global distortion modes may be considered enough to capture global responses [19]. Higher frequency dry distortion modes very often become localized, and it is believed that they do not significantly affect the global response [2,8].

2.2. Decomposition of Dynamic and Quasi-Static Responses

The influence of the flexibility or hydroelasticity of the hull can be captured by separating the quasi-static and dynamic part of the structural response through the decomposition method explained in this section.
By definition, the quasi-static part reflects the rigid body response. The dynamic part includes the influence of structural dynamics [18]. Therefore, the coupled dynamic equation can be expressed as:
( [ [ R R ] [ R E ] [ E R ] [ E E ] ] + [ [ 0 ] [ 0 ] [ 0 ] [ k ] ] ) { ξ R ξ E } = { F R F E }
where R represents the rigid body response and E the elastic structural dynamic response. In turn, the total response amplitudes for the rigid body responses are expressed as:
ξ R = ξ 0 R + ξ d R
where subscripts 0 and d denote the quasi-static and dynamic parts. Similarly, the total response amplitudes for dynamic response are expressed as:
ξ E = ξ 0 E + ξ d E
The quasi-static part of the response is defined as:
[ R R ] { ξ 0 R } = { F R }
[ k ] { ξ 0 E } = { F E } [ E R ] { ξ 0 R }
Substitution of Equations (7)–(10) into Equation (6), leads to the linear system of equations:
( [ [ R R ] [ R E ] [ E R ] [ E E ] ] + [ [ 0 ] [ 0 ] [ 0 ] [ k ] ] ) { ξ d R ξ d E } = { [ R E ] ξ 0 R [ E E ] ξ 0 E }
The decomposition method separates the dynamic part and identifies it as a correction or amplification of the quasi-static part. Thus, hydroelasticity effects (e.g., springing) can be captured and simultaneously separated from the response in order to clearly point out their influence on the total wave-induced loading of the ship.

2.3. Linear Spectral Approach

The spectral analysis helps to compute long-term maxima for different response amplitude operators (RAOs) and hence may be used to describe ship responses in regular waves of unit amplitude. The first order spectral density of the response can be solved according to the Equation:
S R ( ω ) = R A O 2 ( ω ) S W ( ω , β )
where ω and β represent the wave frequency and wave direction, SR represents the response spectrum, and SW is the wave spectrum. In turn, spectral moments are used to calculate short-term responses that correspond to a duration (typically 3 h) of one stationary sea state:
m n = 0 ω n S R ( ω ) d ω
where mn is the nth order spectral moment. Assuming a narrow-banded process, the probability density of the response follows Rayleigh’s distribution defined as [32]:
p ( R ) = R 4 m 0 e ( R 2 8 m 0 )
where p is the probability density of the response, and R is a random variable that represents the range of the response. Respectively, the cumulative distribution function, P, is defined as [32]:
P ( R ) = 1 e ( R 2 8 m 0 )
Long-term responses can be obtained by summing up the results from the short-term analysis. Accordingly, the long-term analysis accounts for the maxima of all responses over all sea states with corresponding probabilities in the form of a wave scatter diagram [32].

2.4. Rule-Based Wave Loads

Traditionally, the vertical wave-induced dynamic response is assumed to play the most significant part in the longitudinal strength of ships [4]. Thus, the Rule envelope curves of the wave-induced vertical bending moments (VBM) and vertical shear forces (VSF) follow the International Association of Class Societies (IACS) Unified Requirements for ship longitudinal Strength assessment (URS) [28]. Antisymmetric dynamic responses (i.e., horizontal bending moments, HBM; torsional moments, TM) follow individual Classification Society Rules and, if applicable, direct analysis procedures suitably backed up by Classification Society Notations (e.g., [27]).
Rule-based wave loads are expressed in empirical formulae, including the ship’s general particulars and empirical correction factors that allow for the influence of nonlinear hydrodynamic effects over a vessel’s lifetime (i.e., 25 years). For example, see IACS UR S11, UR S11A standards comparisons presented in Table 1. UR S11A Rule formulae include nonlinear correction factors for hogging (fNL-Hog) and sagging (fNL-Sag) conditions. These are dependent on the block and waterplane area coefficients; fNL-Hog considers the draught of the ship and is not be taken greater than 1.1 while fNL-Sag accounts for the bow flare shape and is not to be taken less than 1.0 [28]. UR S11 does not include a nonlinear correction factor for hogging [28], and the sagging nonlinear correction factor can be considered as 1.2 maximum [33]. Because the nonlinear correction factors implemented in the latest version of UR S11A are the most universally accepted and were derived by extensive parametric seakeeping analysis studies over a range of modern ship designs, for the sake of completion this paper also presents comparisons against both UR S11 and UR S11A [33].

3. Case Study

The analysis presented in this paper is based on a medium-size passenger ship with the principal particulars shown in Table 2. This is a conventional passenger ship that has been professionally designed. The superstructure and the main hull are clearly separated, and key naval architecture information (e.g., hull form, key structural drawings, scantlings, basic CAD model etc.) was made available, thus enabling the development of a suitable FFSI model.

3.1. Structural Model

The global FEA model of the ship was developed by software FEMAP (see Figure 2). According to the Classification Society’s structural strength assessment procedures for ship global strength analysis, a coarse mesh is considered adequate when FEA discretization accounts for the web frame spacing [24,27,34]. Based on these recommendations, the model included all primary longitudinal and transverse structural components contributing to the overall stiffness of the ship structure. It also accounted for ordinary stiffeners and large openings. Laminate elements were used to model the stiffened panels as equivalent shell elements [35]. Orthotropic plate elements were used to model the side shell openings [36]. Based on engineering experience, smaller openings and structures that do not contribute to longitudinal strength were omitted. This approach resulted in 34,545 elements and 16,239 nodes (see Table 3 and Figure 2).
The equivalent laminate elements consisted of three layers, namely: (1) deck plate, (2) stiffener web, and (3) stiffener flange [35]. Such layers have both iso- and orthotropic material properties and axial stiffness in the direction of the stiffeners. An isotropic material has equal Young’s modulus and Poisson’s ratio in all directions, whereas an orthotropic material has separate stiffness properties in different directions [36]. Accordingly, the deck plate layer was modeled with isotropic material properties, and the stiffener flange and web layers were suitably defined as orthotropic. The laminate elements also have out of plane shear stiffness [35]. Bulkhead structures without ordinary stiffening were modeled with plate elements having isotropic material properties. Plate elements with orthotropic material properties were used to represent superstructure side balcony bulkheads with large openings. The orthotropic plate elements followed the modeling approach presented in [36]. Thus, the side shell openings were homogenized by using equivalent stiffness properties.
Beam elements [37] were used to model the web frames and other primary structural elements such as pillars. These elements were uniaxial with tension, compression, and bending capabilities and associated properties specified for standard or arbitrary shapes. Liquids in tanks were modeled by FEMAP RBE3 elements connected to the tank boundaries’ corners via massless strings (i.e., massless line elements) [37]. It is noted that such interpolation elements do not introduce any additional stiffness in the structural model. However, they help to correct the mass distribution of the model when they are attached to the mass elements.
The mass distribution of the FE model was adjusted to correspond to the departure loading condition of the ship. Accordingly, all consumable tanks were considered full and all passengers onboard. The coarse mesh led to the omission of some key masses and thus lowered the overall ship lightweight. To overcome this problem, missing masses were modeled as non-structural mass elements applied on decks. Then the mass distribution was fine-tuned by correcting the shear force along the length of the ship to correspond to that given for the selected loading condition in the loading manual.

3.2. Hydrodynamic Model

A hydrodynamic mesh representing the wetted hull geometry by flat quadrilateral or triangular panels with a normal vector pointing towards the fluid was developed using NAPA software [38]. Along the lines of BV hydro-structure computation guidelines, the model ignored any openings by way of bow thrusters or stabilizer fins [24]. Hydrodynamic discretization accounted for six panels by way of the shortest wavelength encountered by the ship. Based on modeling experience, such idealization may restrict artificial numerical instabilities (e.g., irregular frequency effects). The final mesh was port-starboard symmetric and comprised of 1596 panels per side (see Figure 3). Such a model may be considered adequate for rigid body wave encounter frequencies up to 2.5 rad/s [24].
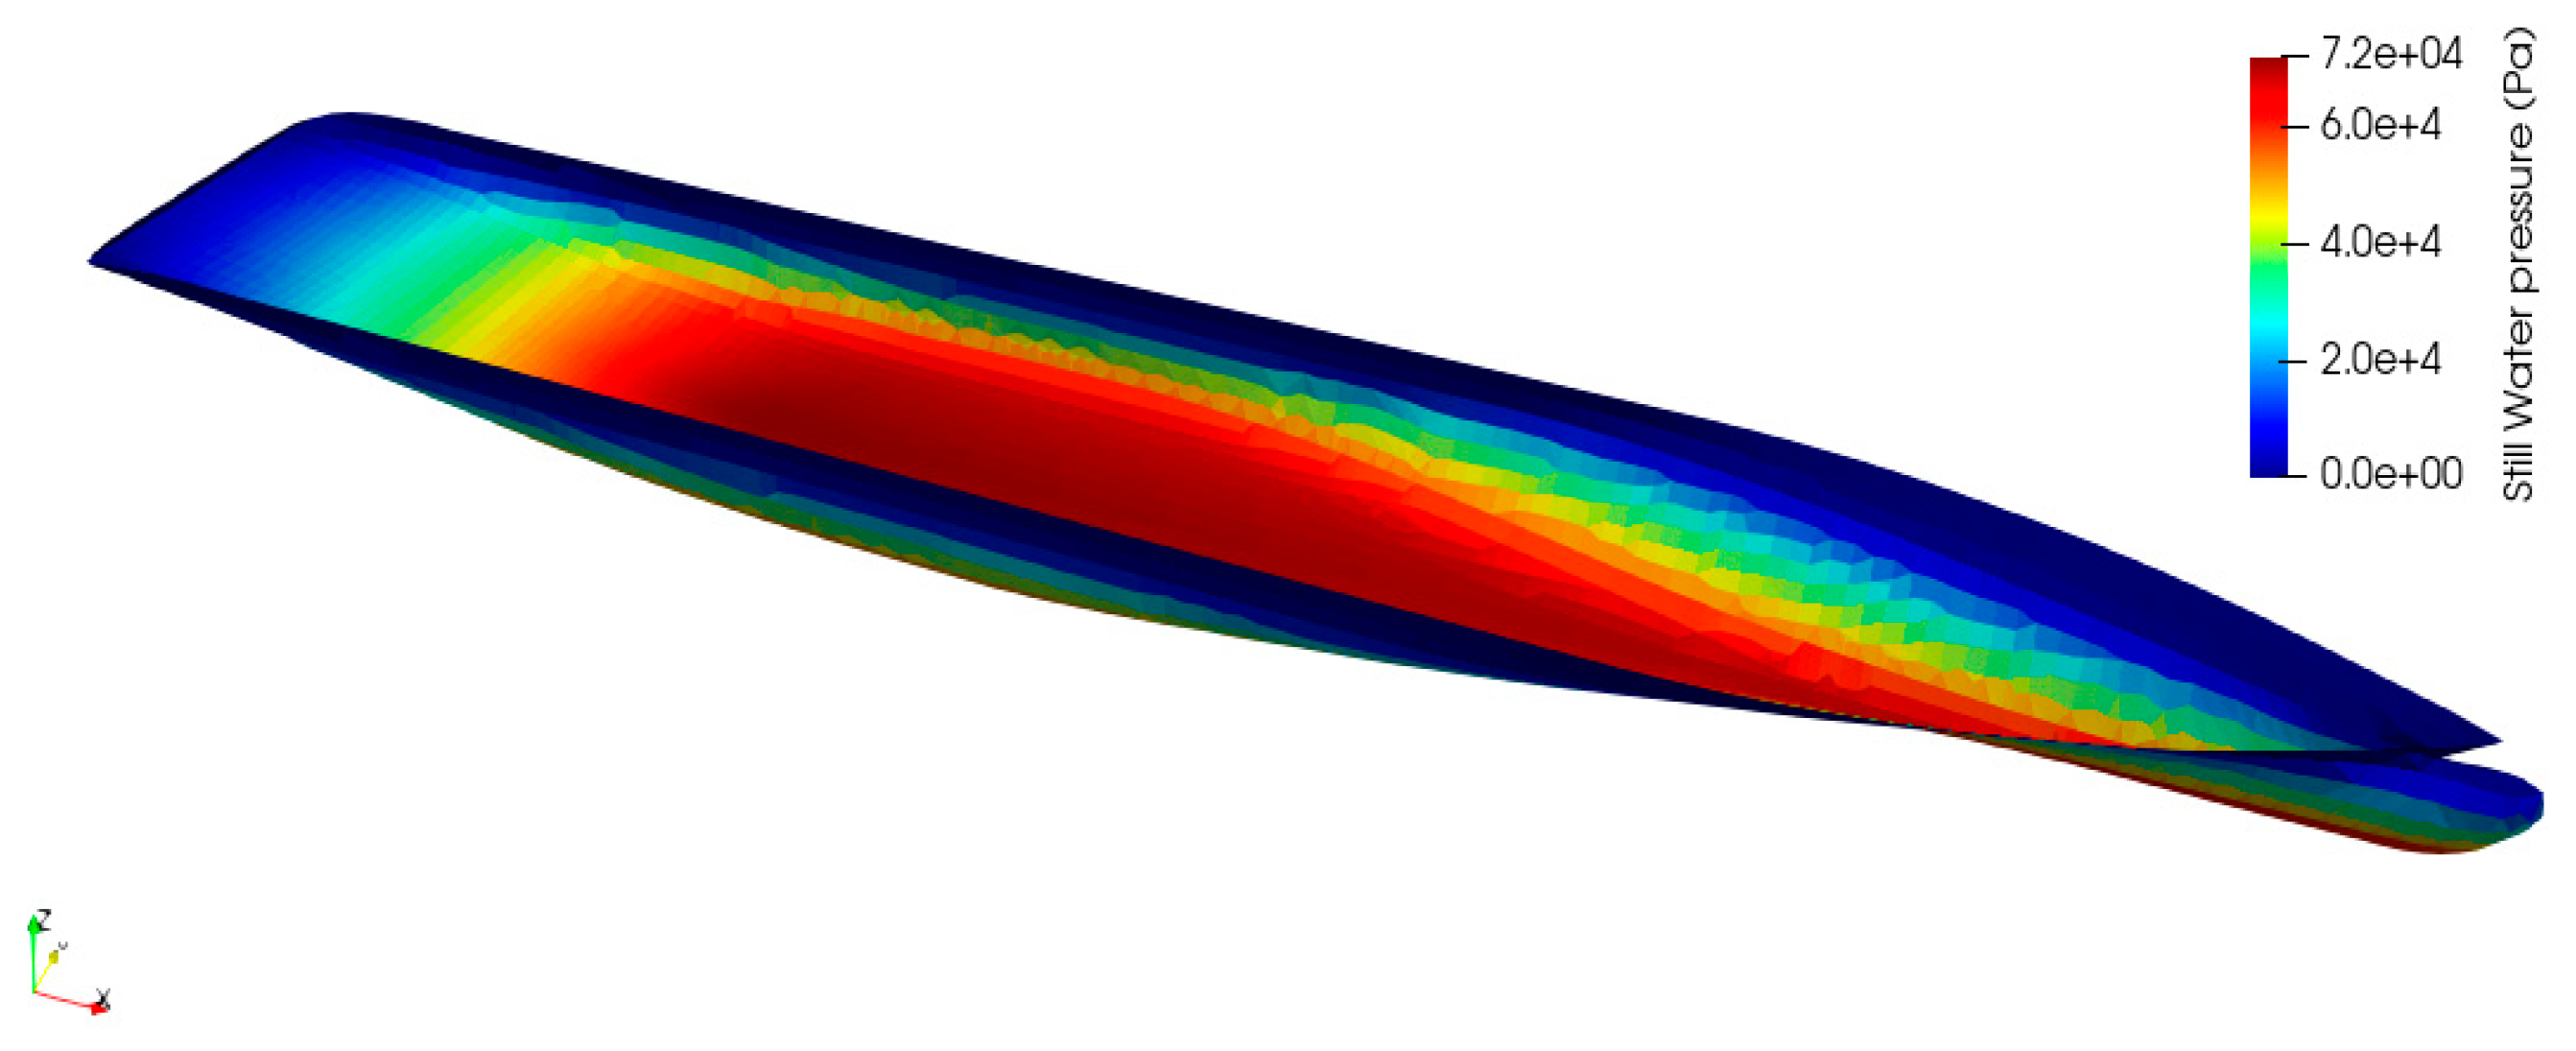
Ship balancing under still water conditions resulted in a trim angle of −0.184° and a heel angle of −0.089°. The resulting hull pressures under still water conditions are shown in Figure 4. Inconsistencies were checked by comparing the still water bending moments and shear forces with their counterparts defined in the loading manual of the ship for the loading condition shown in Figure 5.

4. Results

4.1. Dry Analysis

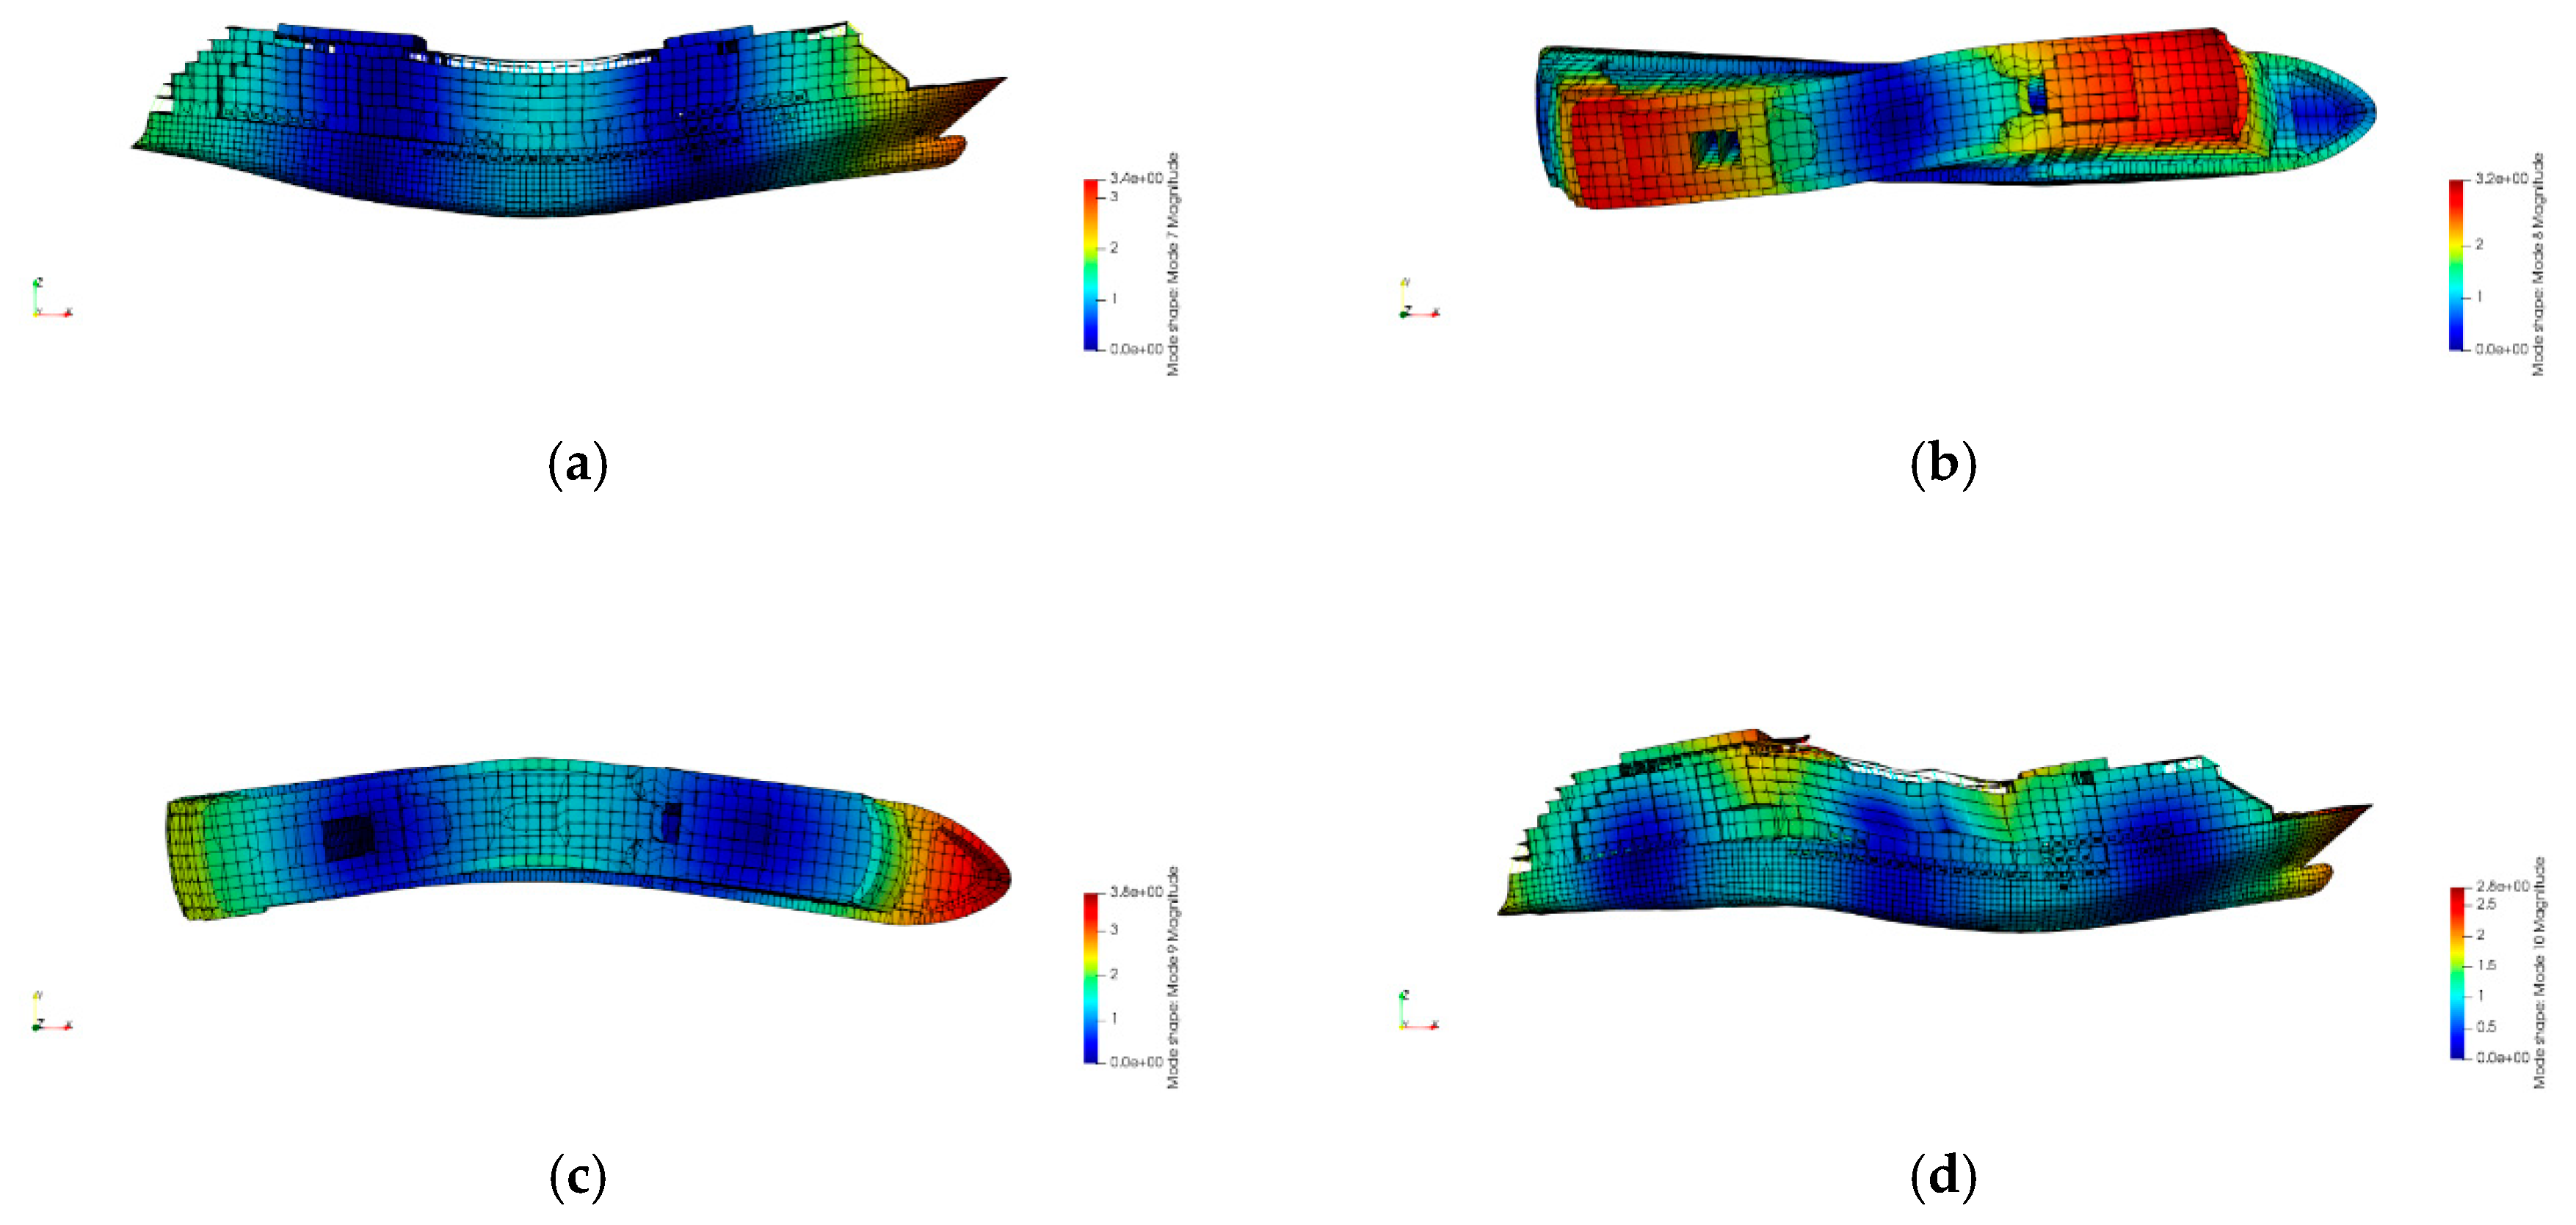
Six rigid body modes and four distortion modes were considered representative of the rigid body and hydroelasticity effects of the passenger vessel under consideration. Flexible distortions consisted of two symmetric and two antisymmetric modes (see Figure 6). A greater number of distortion modes could have been utilized, but the structural model of the ship introduced spurious higher-order modal behavior already at the fifth dry natural frequency. Based on hydroelastic modeling experience, such modes can be neglected as being non-representative of the real ship modal behavior, and four flexible distortion modes may be considered adequate in terms of accounting for the influence of flexible ship body dynamics on the response [11,24].

4.2. Wet Analysis

Hydrodynamic computations were carried out for zero speed, wave encounter frequencies from 0.0 to 20.0 rad/s in 0.1 rad/s steps (200 frequencies), and wave headings from 0 to 180 deg in 15 deg steps (13 headings in total). The zero-speed condition helped diminish possible numerical instability issues (e.g., irregular frequency effects). Before solving the wet resonance frequencies and the corresponding modal amplitudes, added hydrodynamic and structural damping were defined. The added hydrodynamic damping was defined for the roll motion to include the bilge keel roll damping effect. Based on modeling experience, roll damping was defined at a fraction corresponding to 7% of critical damping and was applied by way of 50% of the wetted hull nodes and 50% of the bilge keel nodes. Structural damping was defined according to Kumai empirical factors [39]. A summary of the dry and wet resonance characteristics is given in Table 4.
Figure 7 presents the RAOs of the modal amplitude values for regular unit amplitude waves in head and oblique (135 deg.) seas. By way of the first distortion mode, the ship appears to experience significant resonance peaks between 8–12 rad/s. Minor rigid body dominant responses can be found at the lower frequencies of the 1st distortion mode. The second distortion mode resonance peaks occur between 13–14 rad/s. The third distortion mode resonance peaks are between 12.5–14 rad/s. By way of the fourth distortion mode, the ship experiences her first resonance peak at 10 rad/s. The highest resonance peak occurs at 12 rad/s.

4.3. Steady State Load RAOs

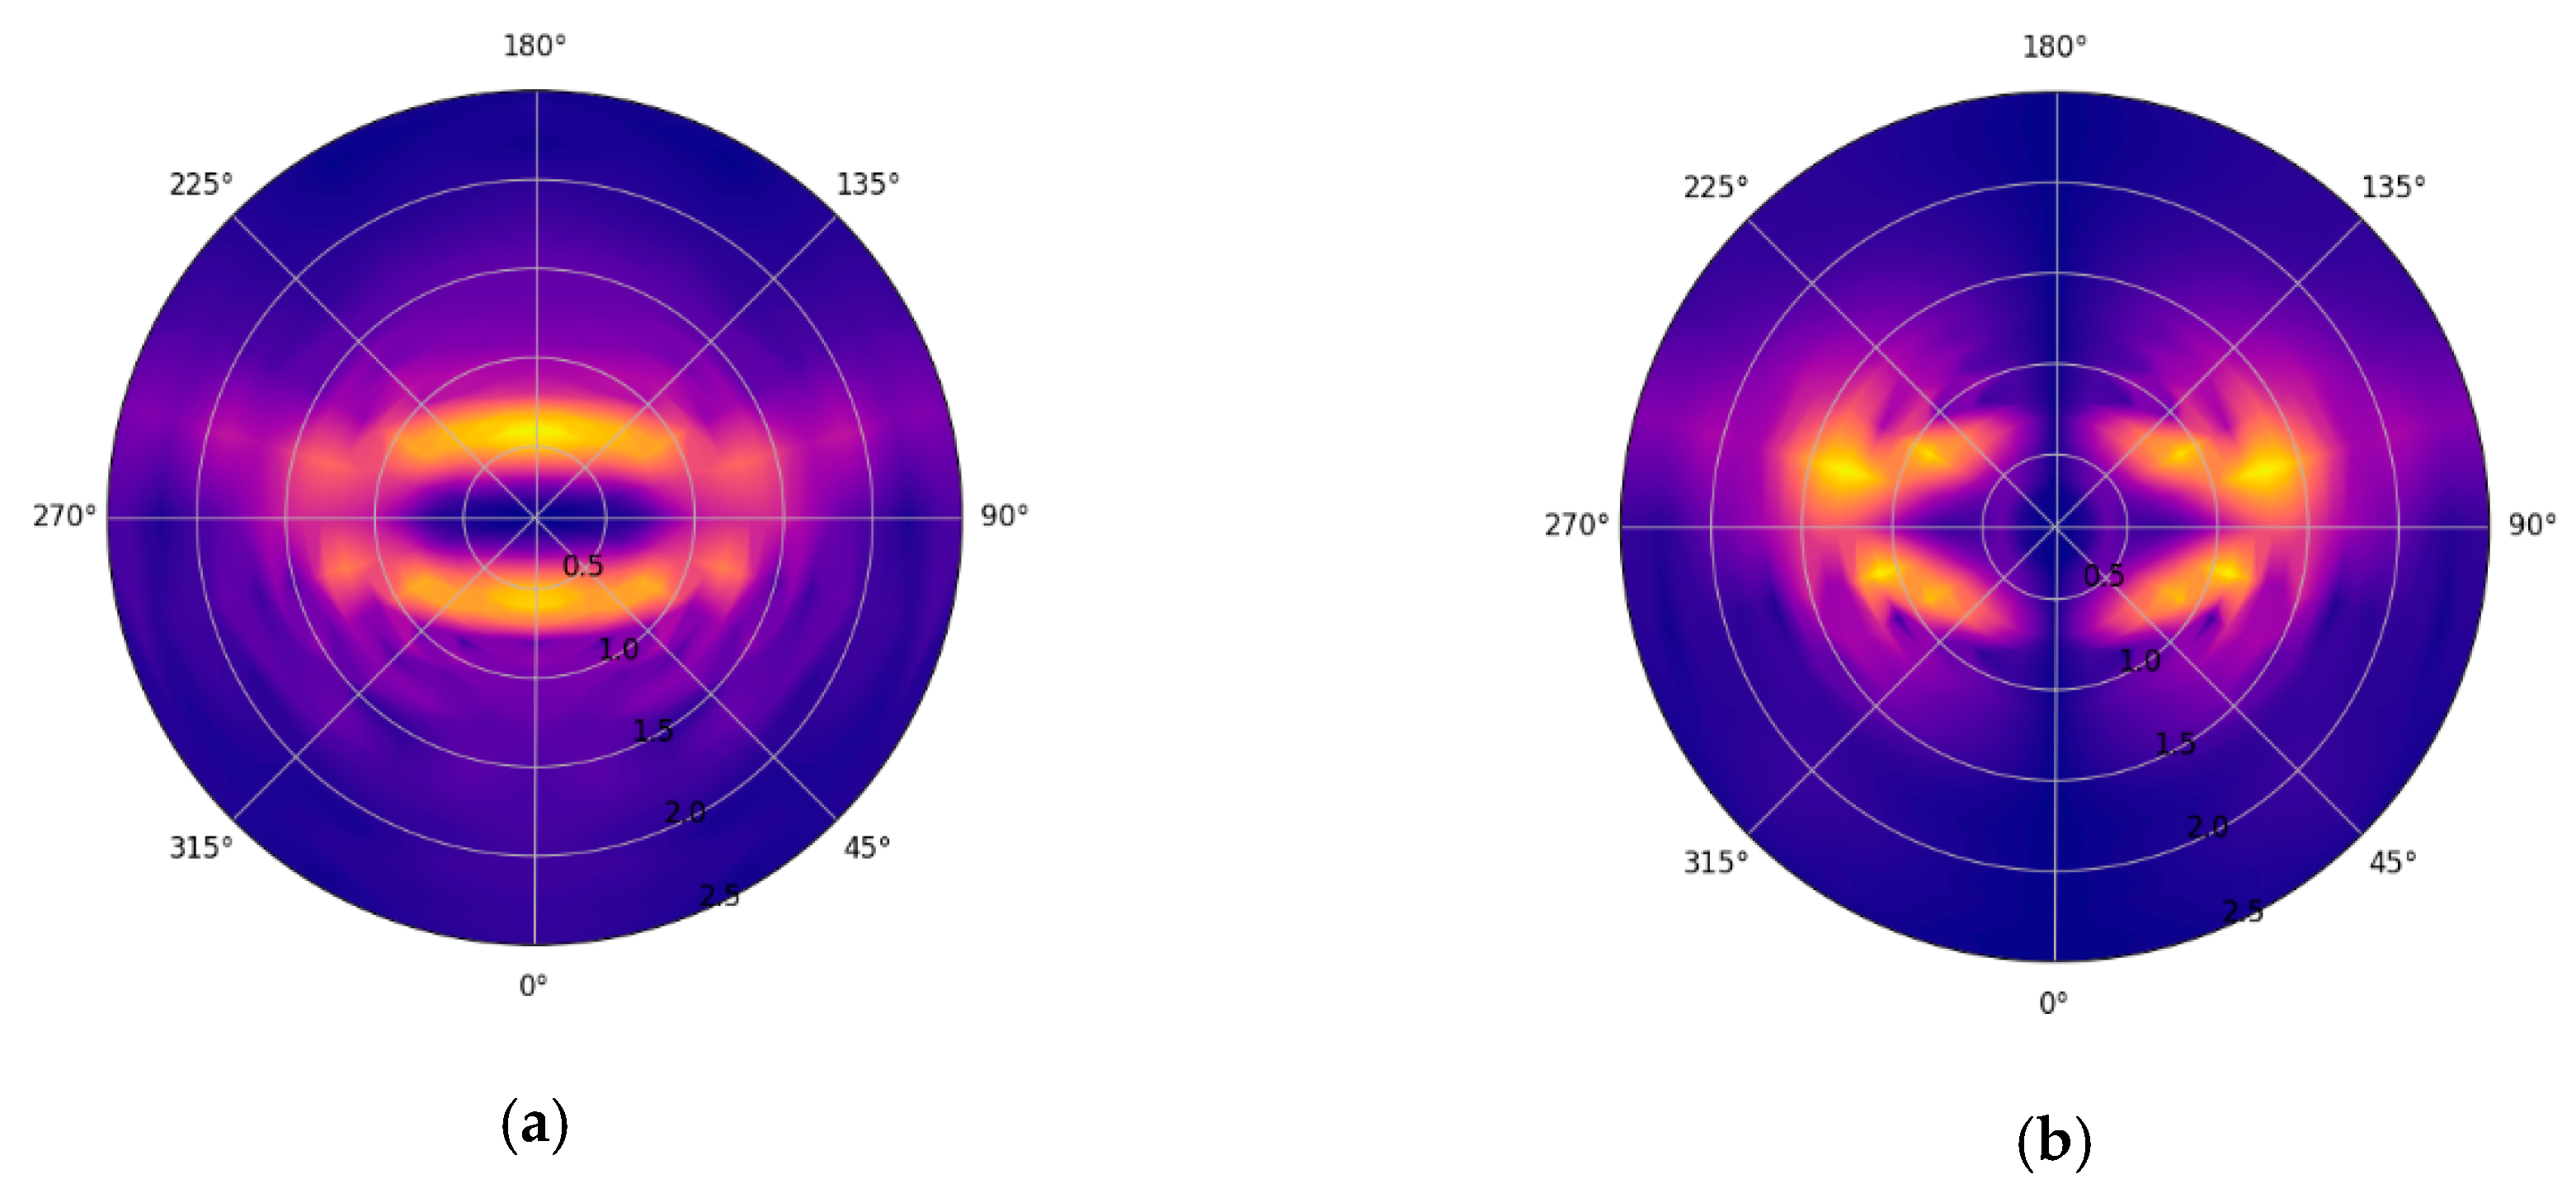
The VBM and HBM RAOs at amidships up to a rigid body frequency of 2.5 rad/s are presented in Figure 8. VBM reached a maximum in head waves at 0.6 rad/s. The response in oblique waves also seems to be of considerable magnitude for frequencies up to 1.0 rad/s. On the other hand, the HBM at amidships reached its maximum at 105 deg heading and frequency of 1.3 rad/s. Considerable responses can be found by way of wave headings ranging from 45–135 deg around the frequency of 1.0 rad/s.
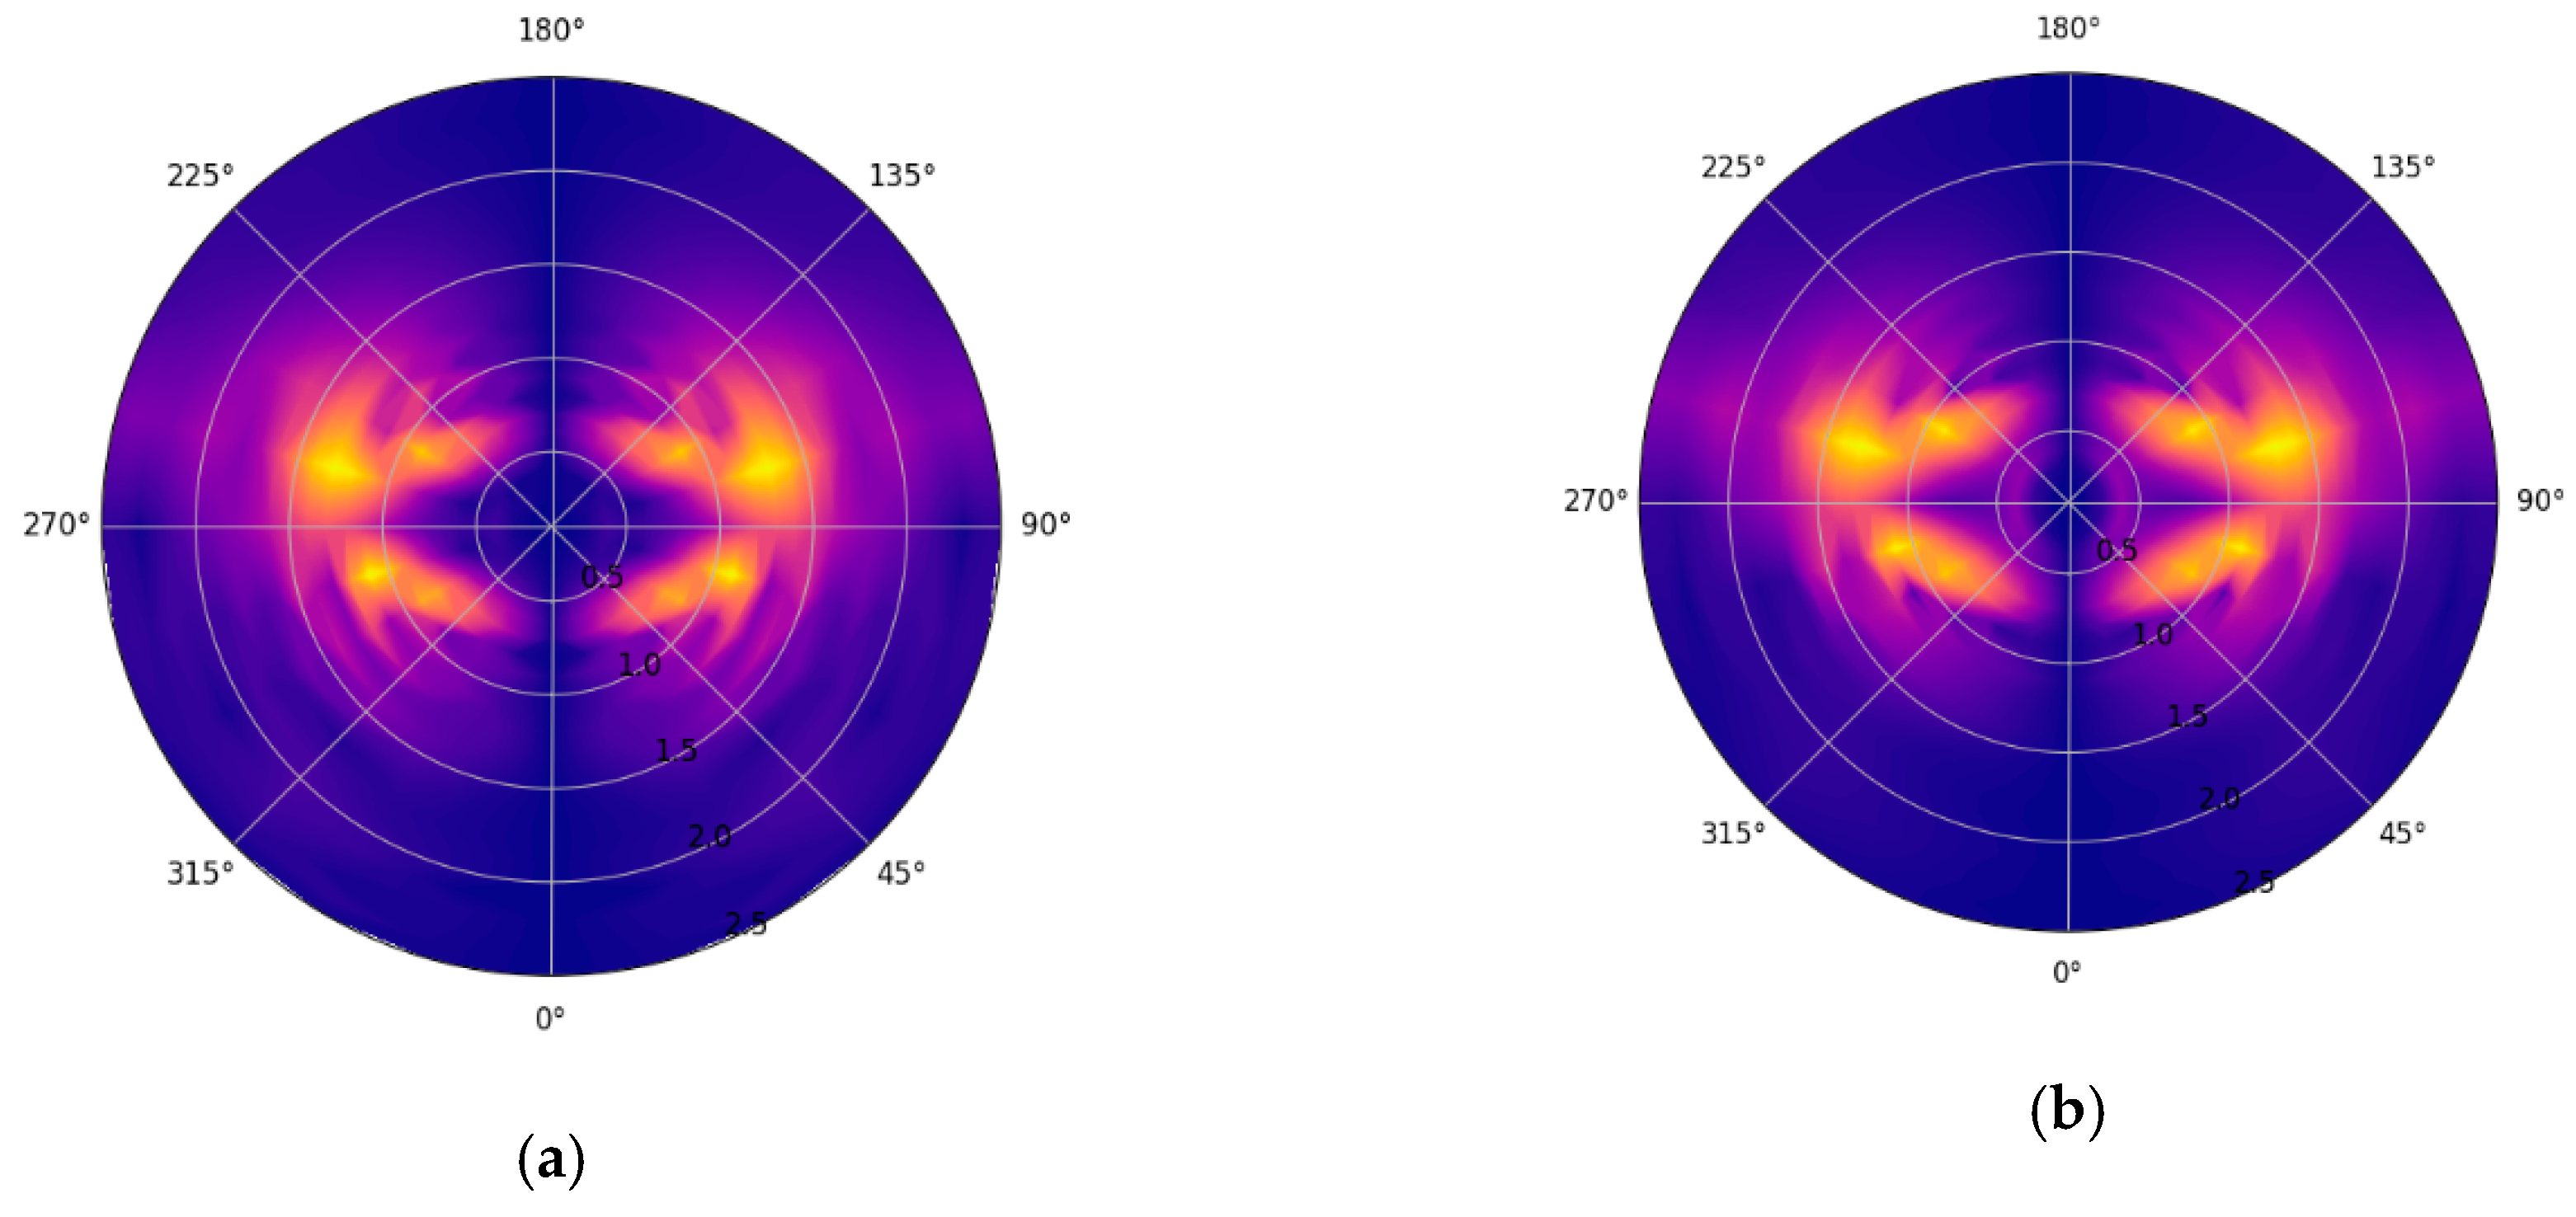
The TM RAOs, by way of the first and final quarter lengths of the hull (i.e., 0.25 L and 0.75 L) are shown in Figure 9. In both locations, they reach a maximum at a wave heading of 105 deg and frequency 1.3 rad/s. Significant torsional responses are also observed for wave headings 60 and 120 deg by way of the frequency of 1.0 rad/s.
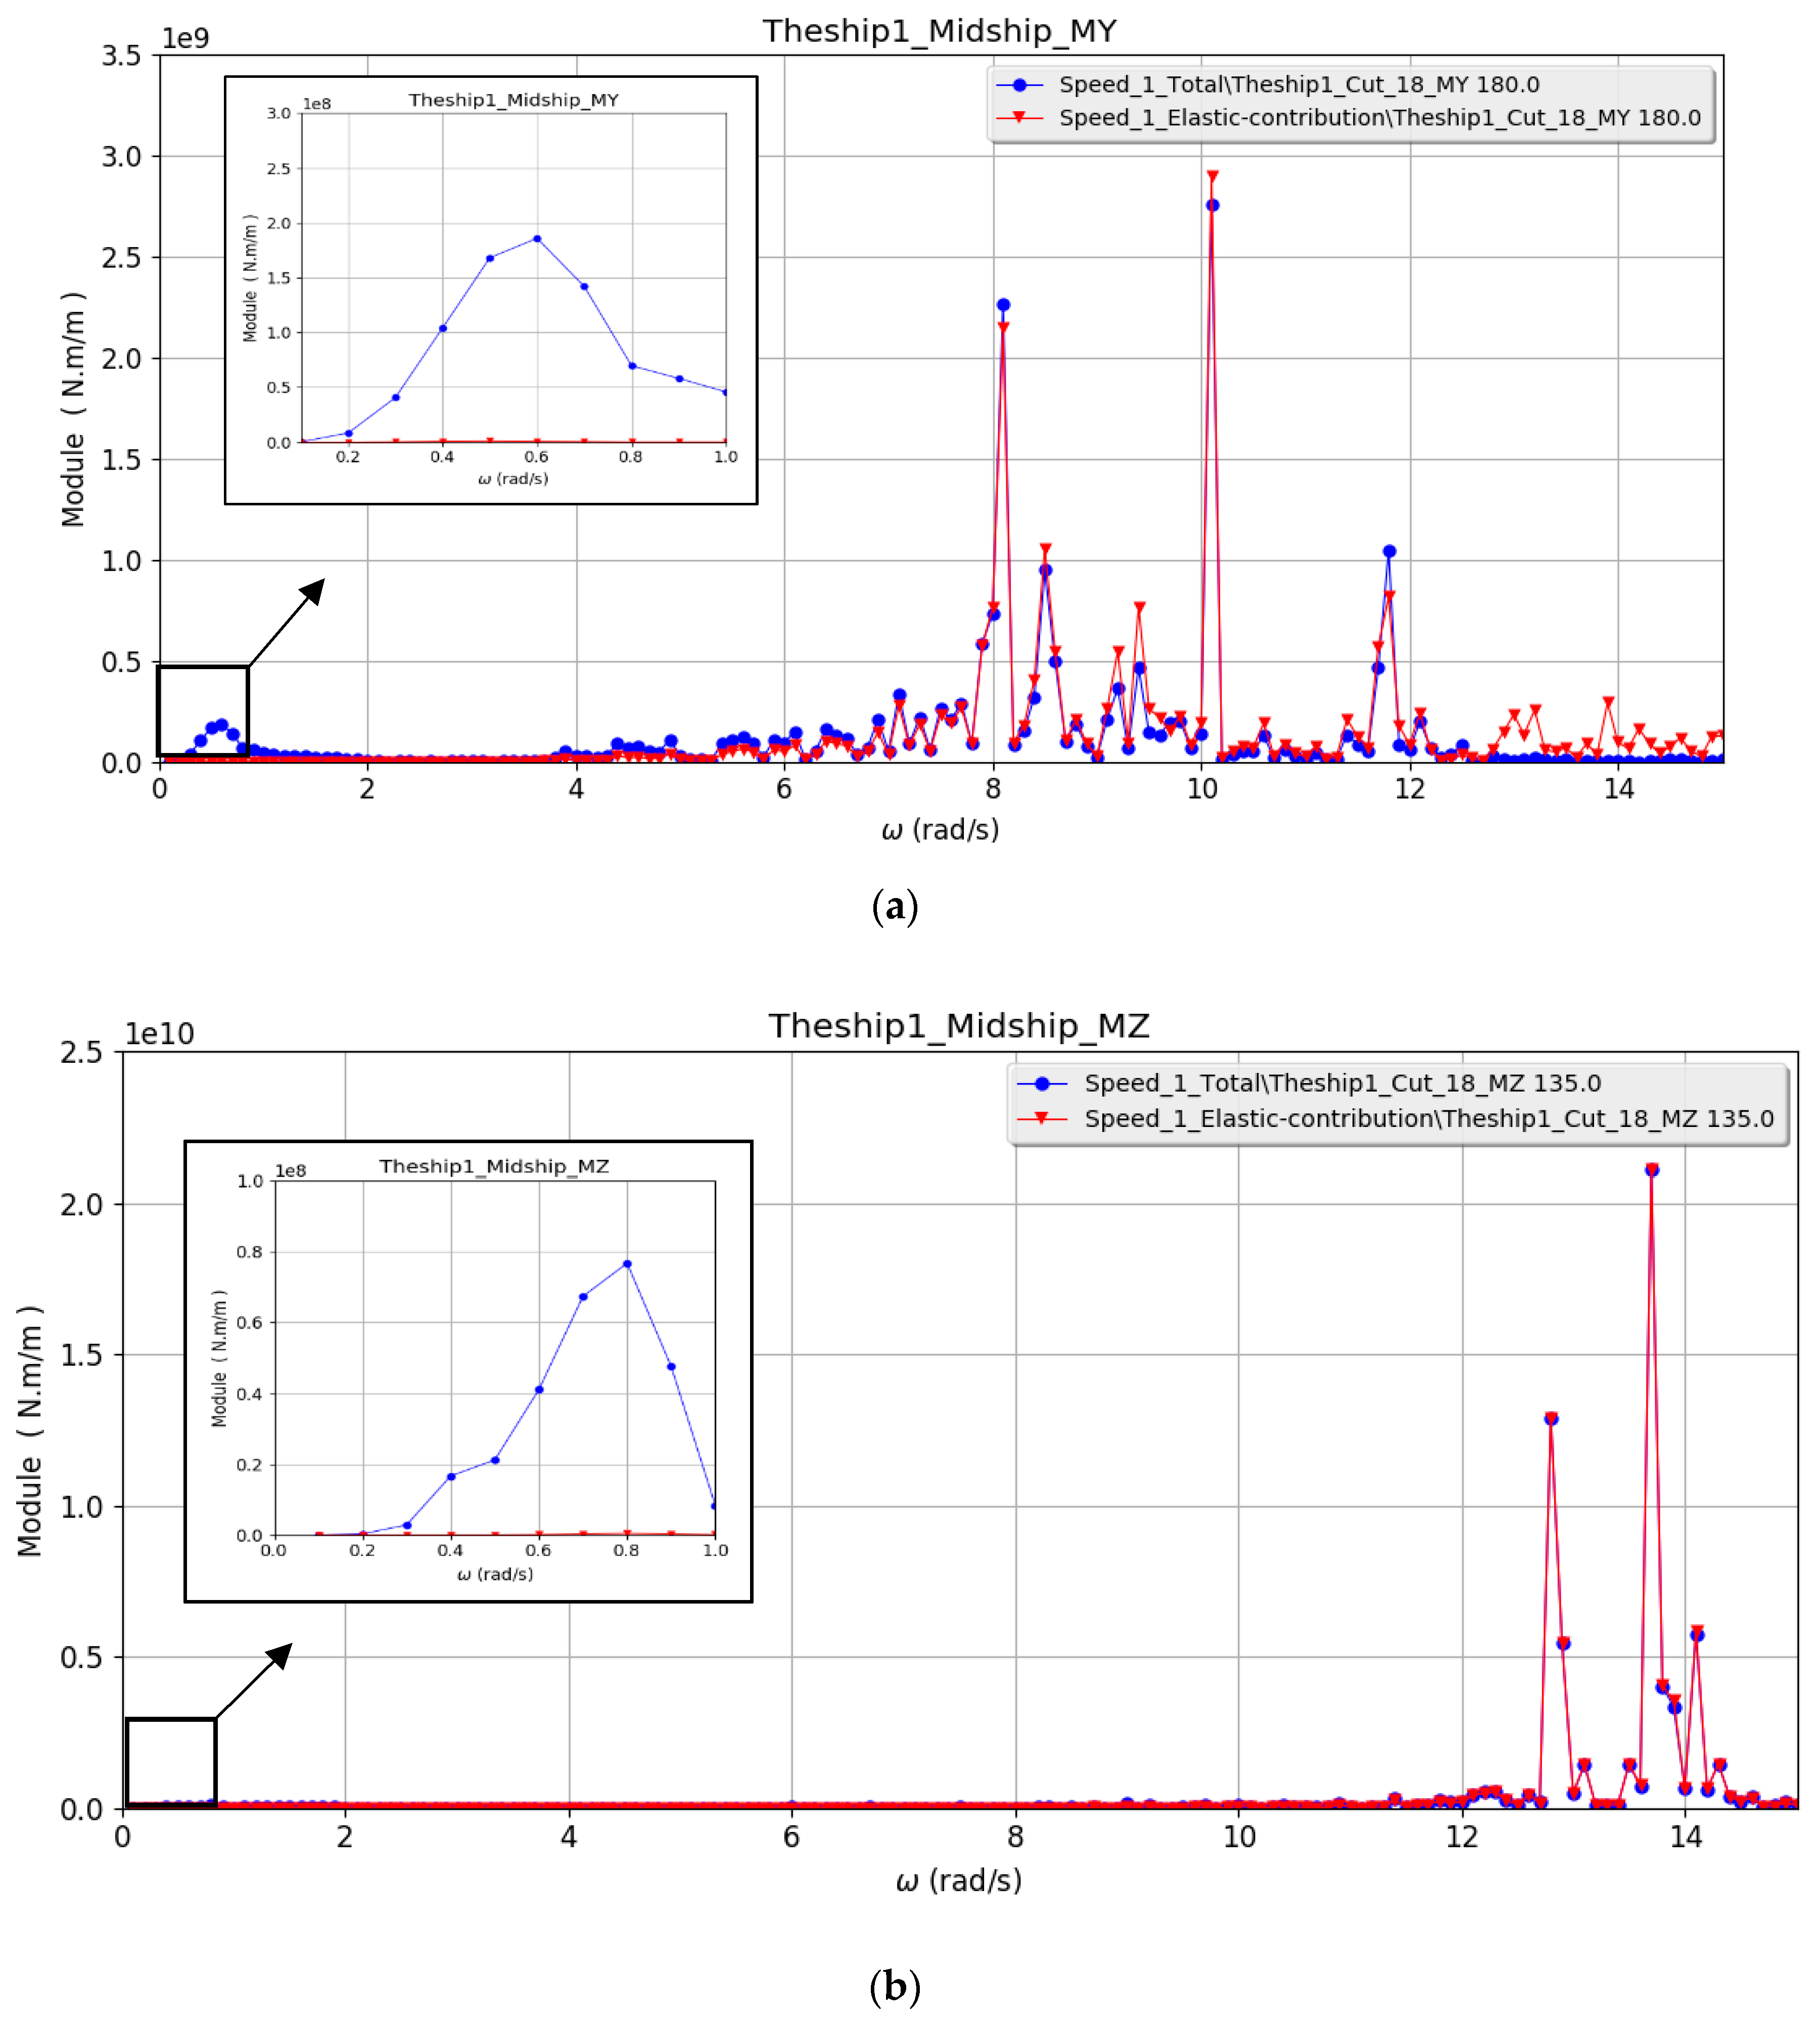
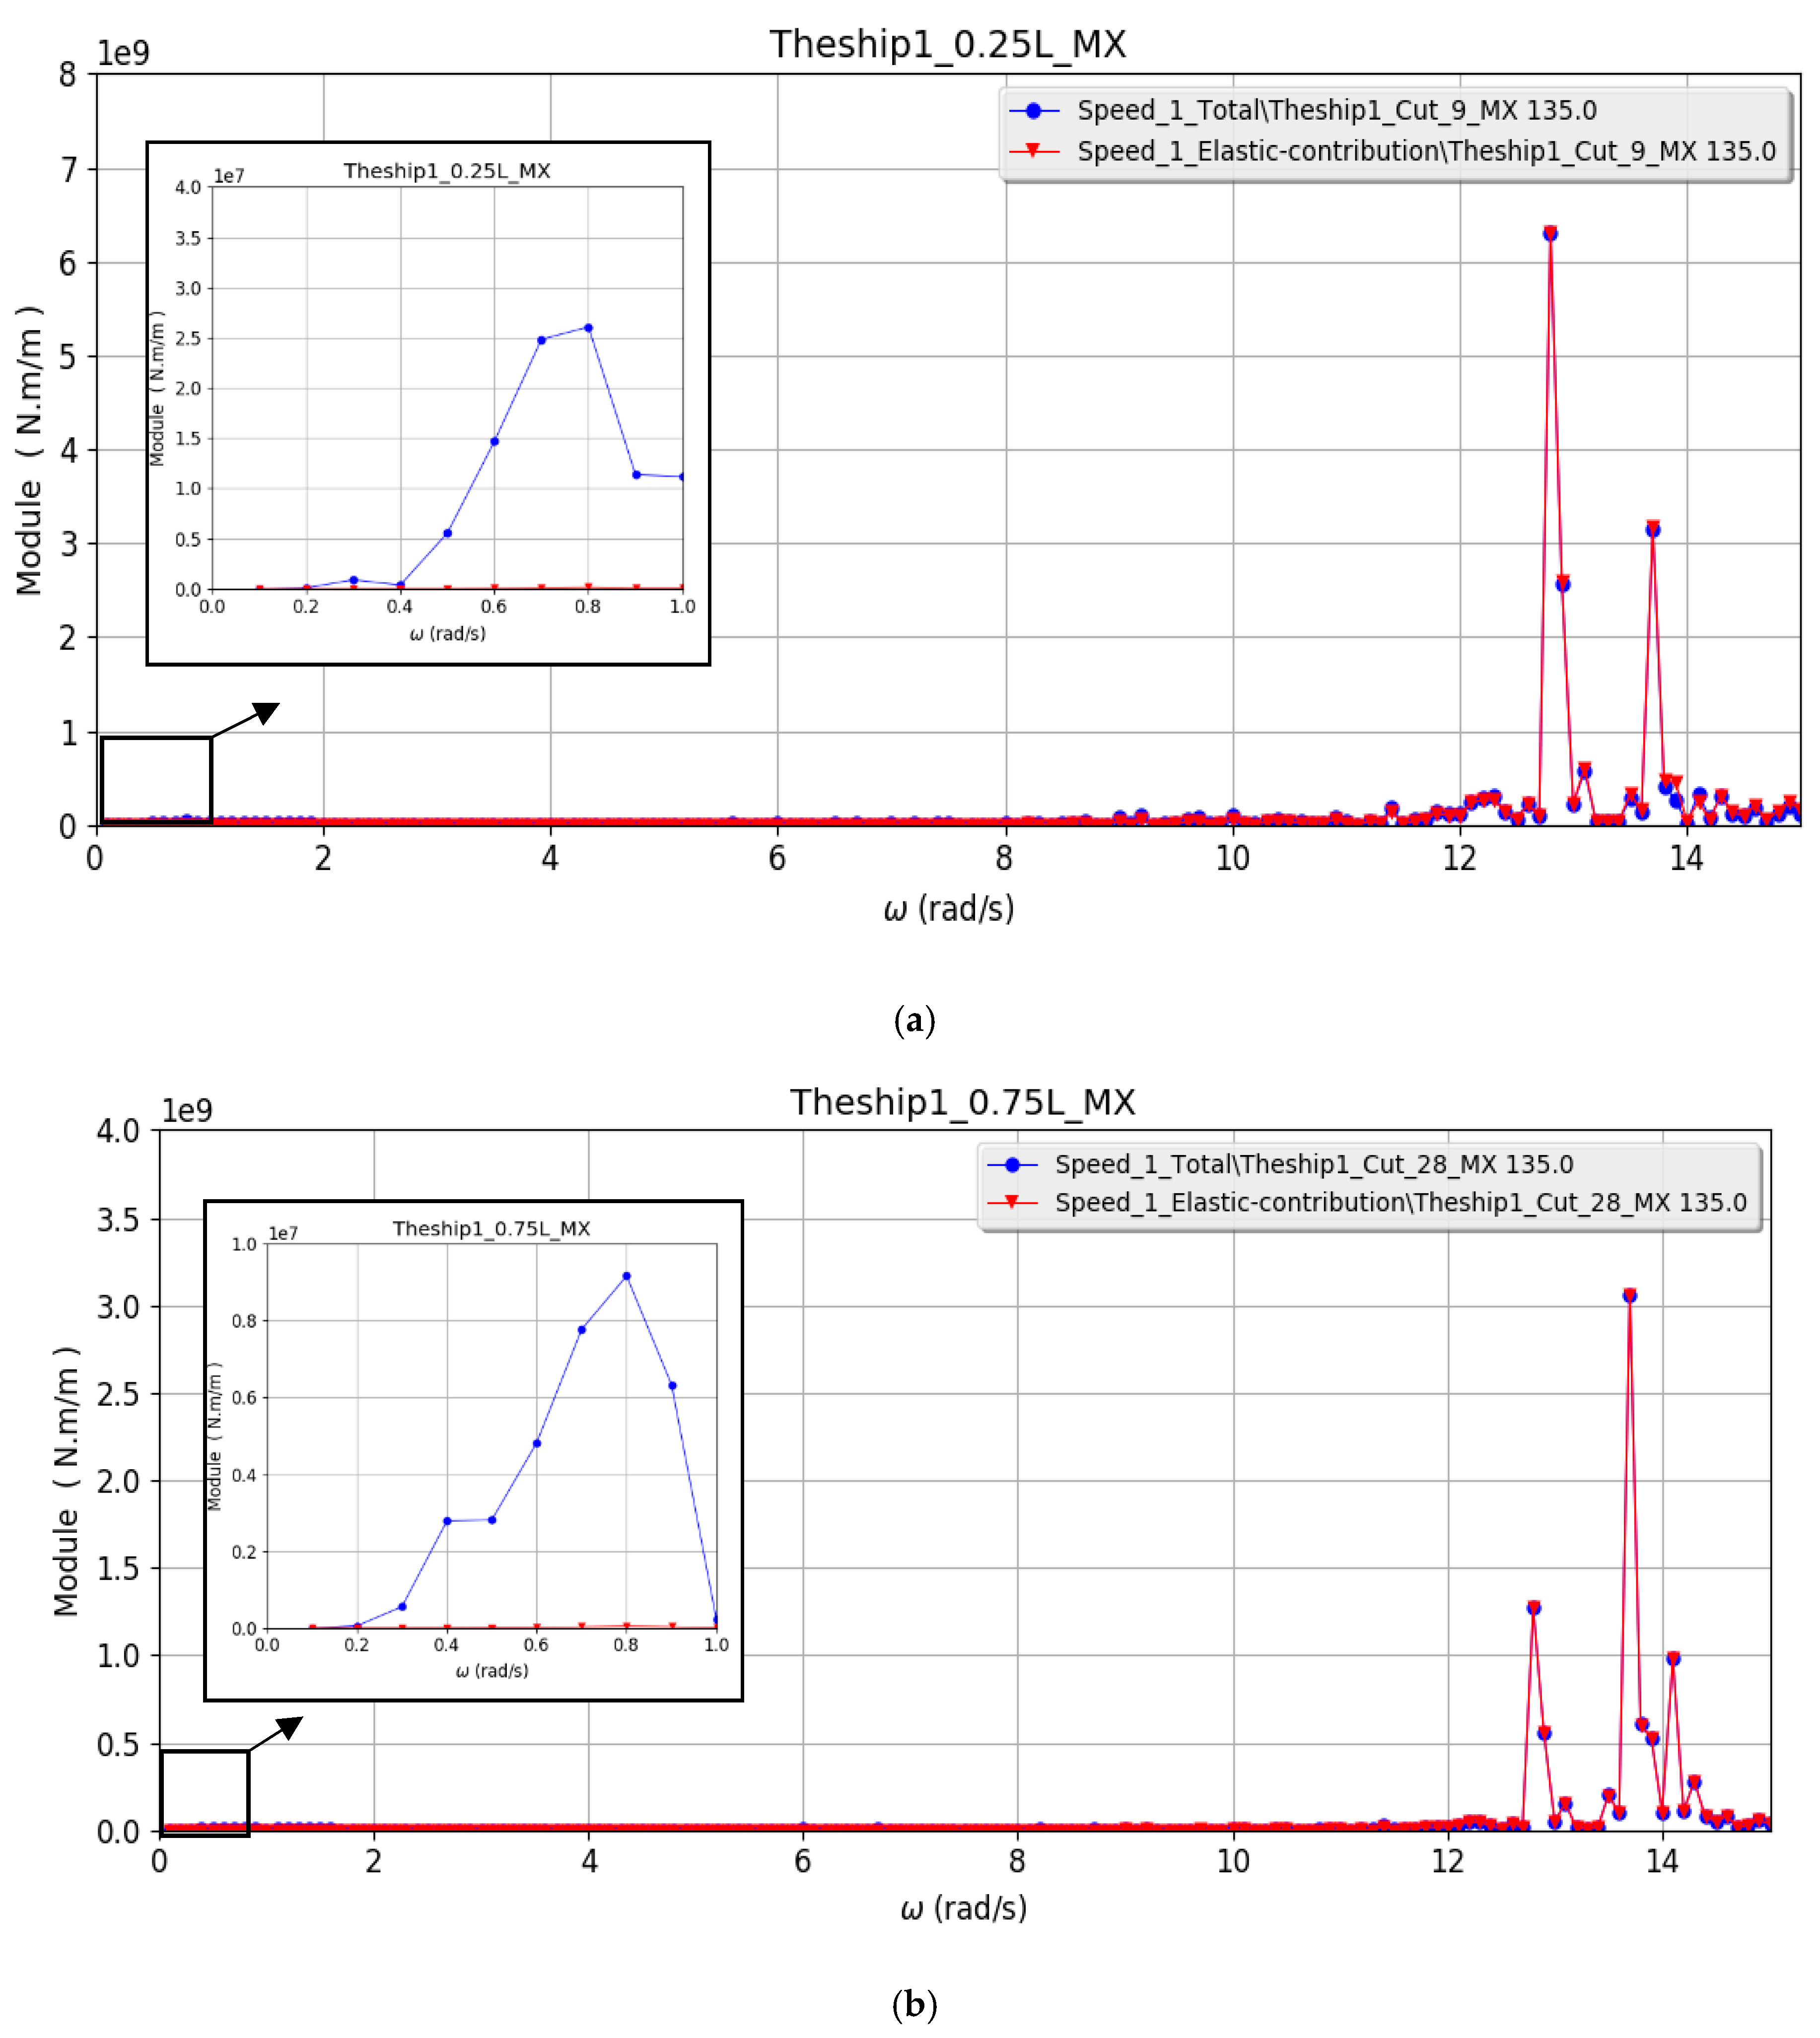
The VBM in head waves and the HBM in oblique waves at amidships up to a frequency of 15 rad/s are shown in Figure 10. The VBM has three narrow peaks between 8–12 rad/s, and the total response is dominated by the elastic response. The locations of peak responses match very well with the modal amplitude peaks of the first distortion mode (Figure 7). The rigid body dominant response can be seen occurring at lower frequencies below 1.0 rad/s where the total steady-state response is entirely dominated by the quasi-static effects. The HBM has similar resonance peaks occurring at 12.5–14.0 rad/s by way of the same locations as the modal amplitude peaks of the third distortion mode (Figure 7). The total steady-state HBM response is dominated by the elastic contribution. The TM at 0.25 L and 0.75 L in 135 deg wave heading are shown in Figure 11. Resonance peaks occur between 12.5–14.0 rad/s. The locations of the peaks correspond well to the modal amplitude peaks of the second distortion mode (Figure 7).

4.4. Spectral Analysis

This section presents comparisons of load envelope curves against BV Rules [27] and the IACS longitudinal strength standard requirements [28]. Long-term spectral analysis of the internal load RAOs was conducted by BV STARSPEC [32] and assumed IACS Recommendation 34 assumptions; i.e., (1) North Atlantic wave scatter diagram, (2) Jonswap spectrum with unit peak enhancement function, (3) second-order wave spreading, (4) azimuth angles from 0° to 360° in steps of 5° (equal probability of occurrence), and (4) return period of 25 years (10−8 probability level) [40,41].
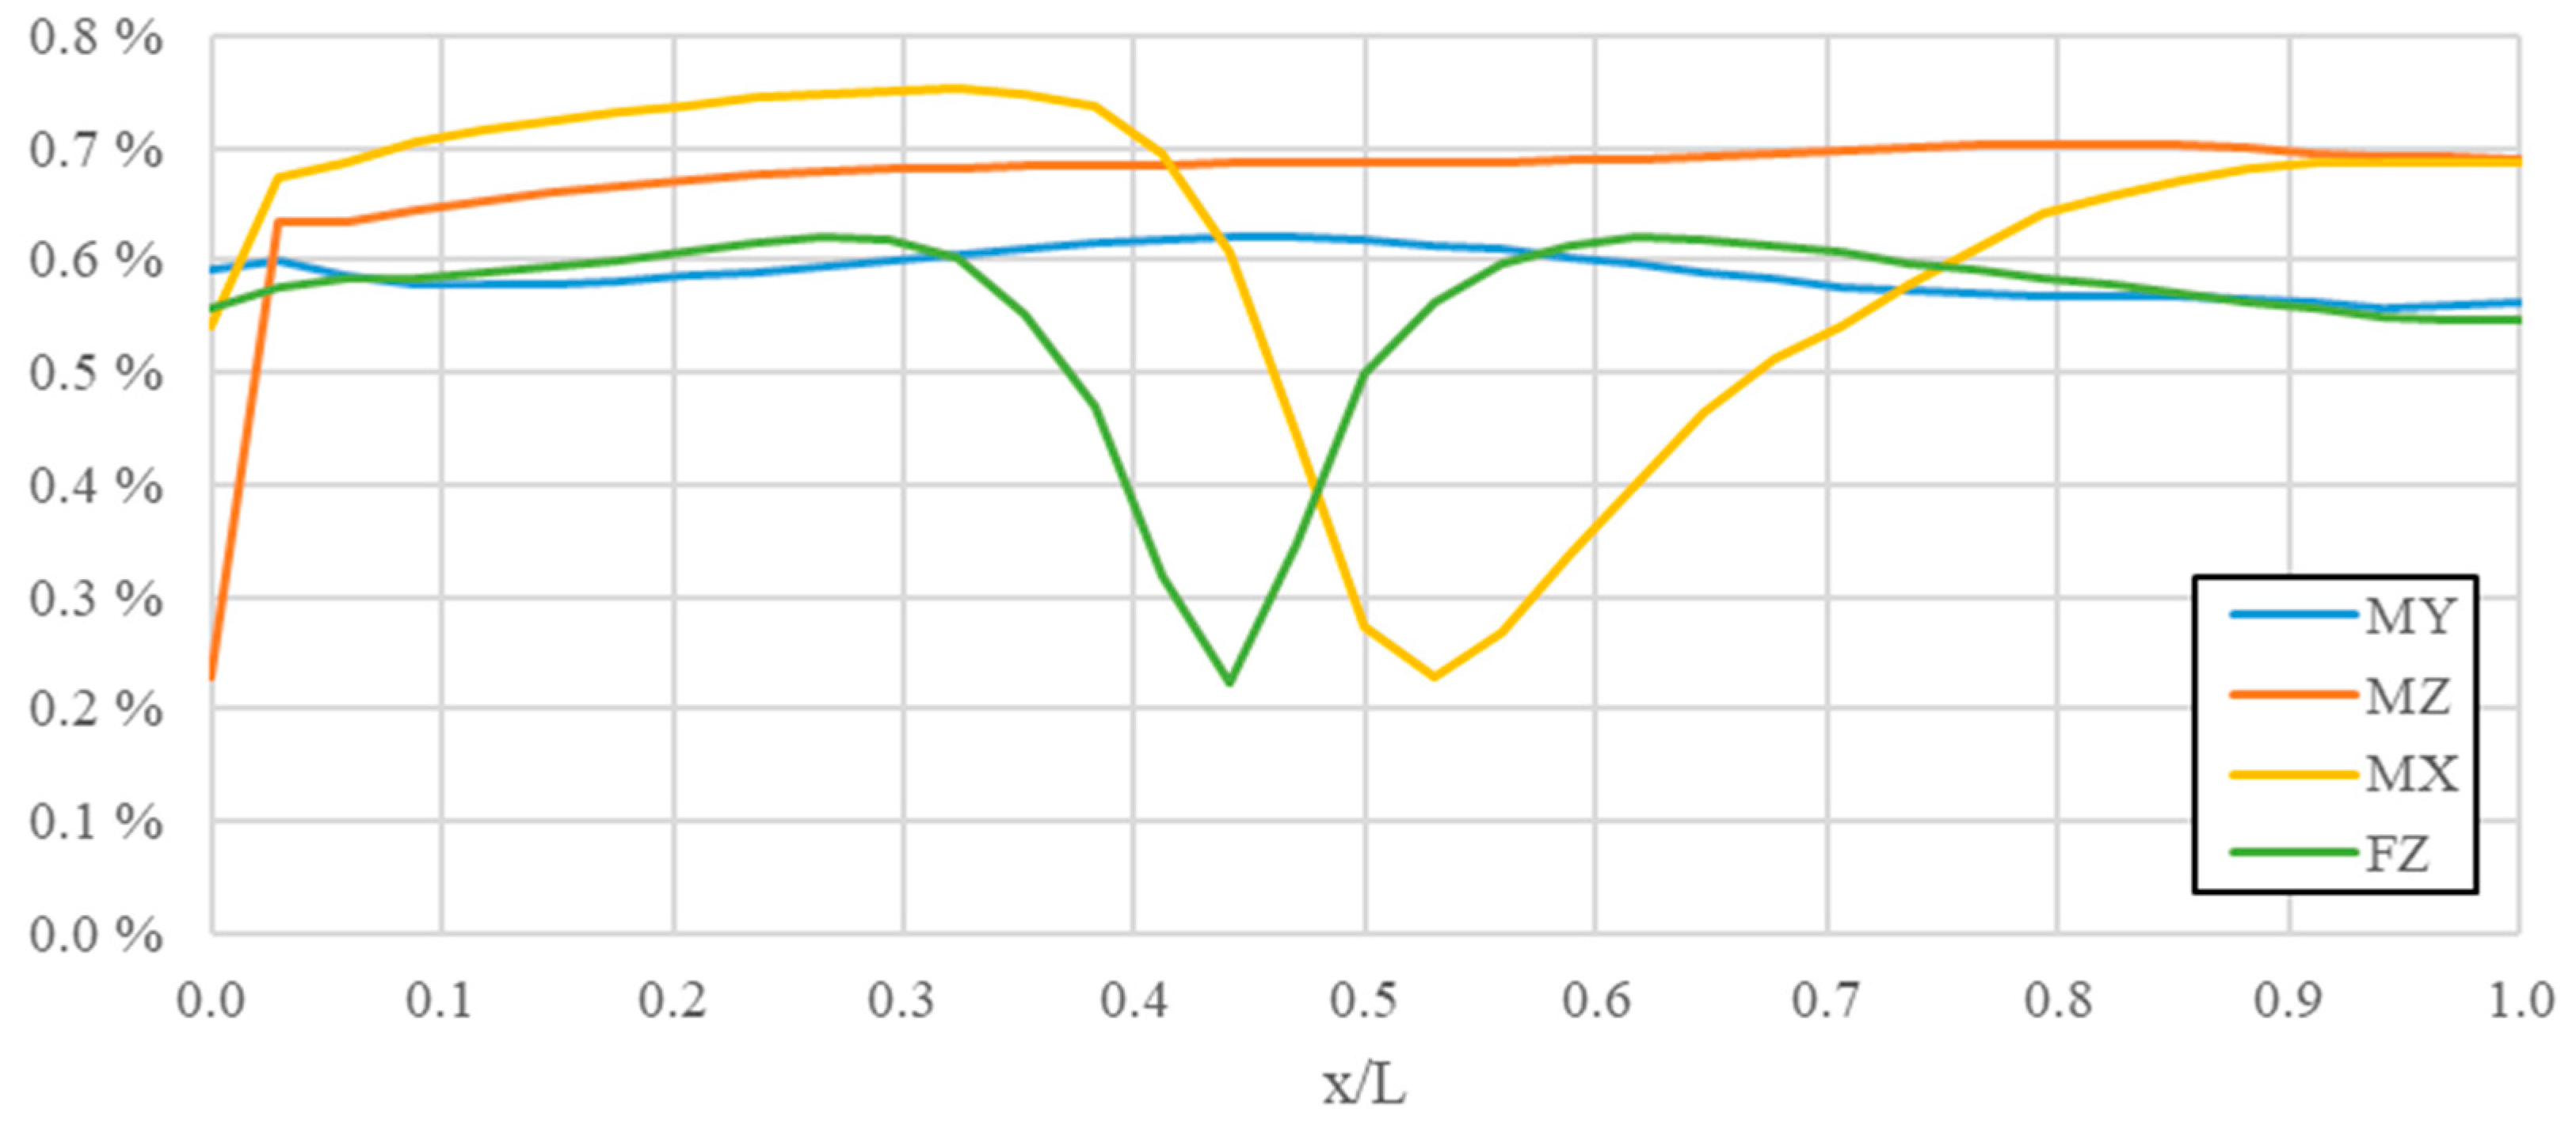
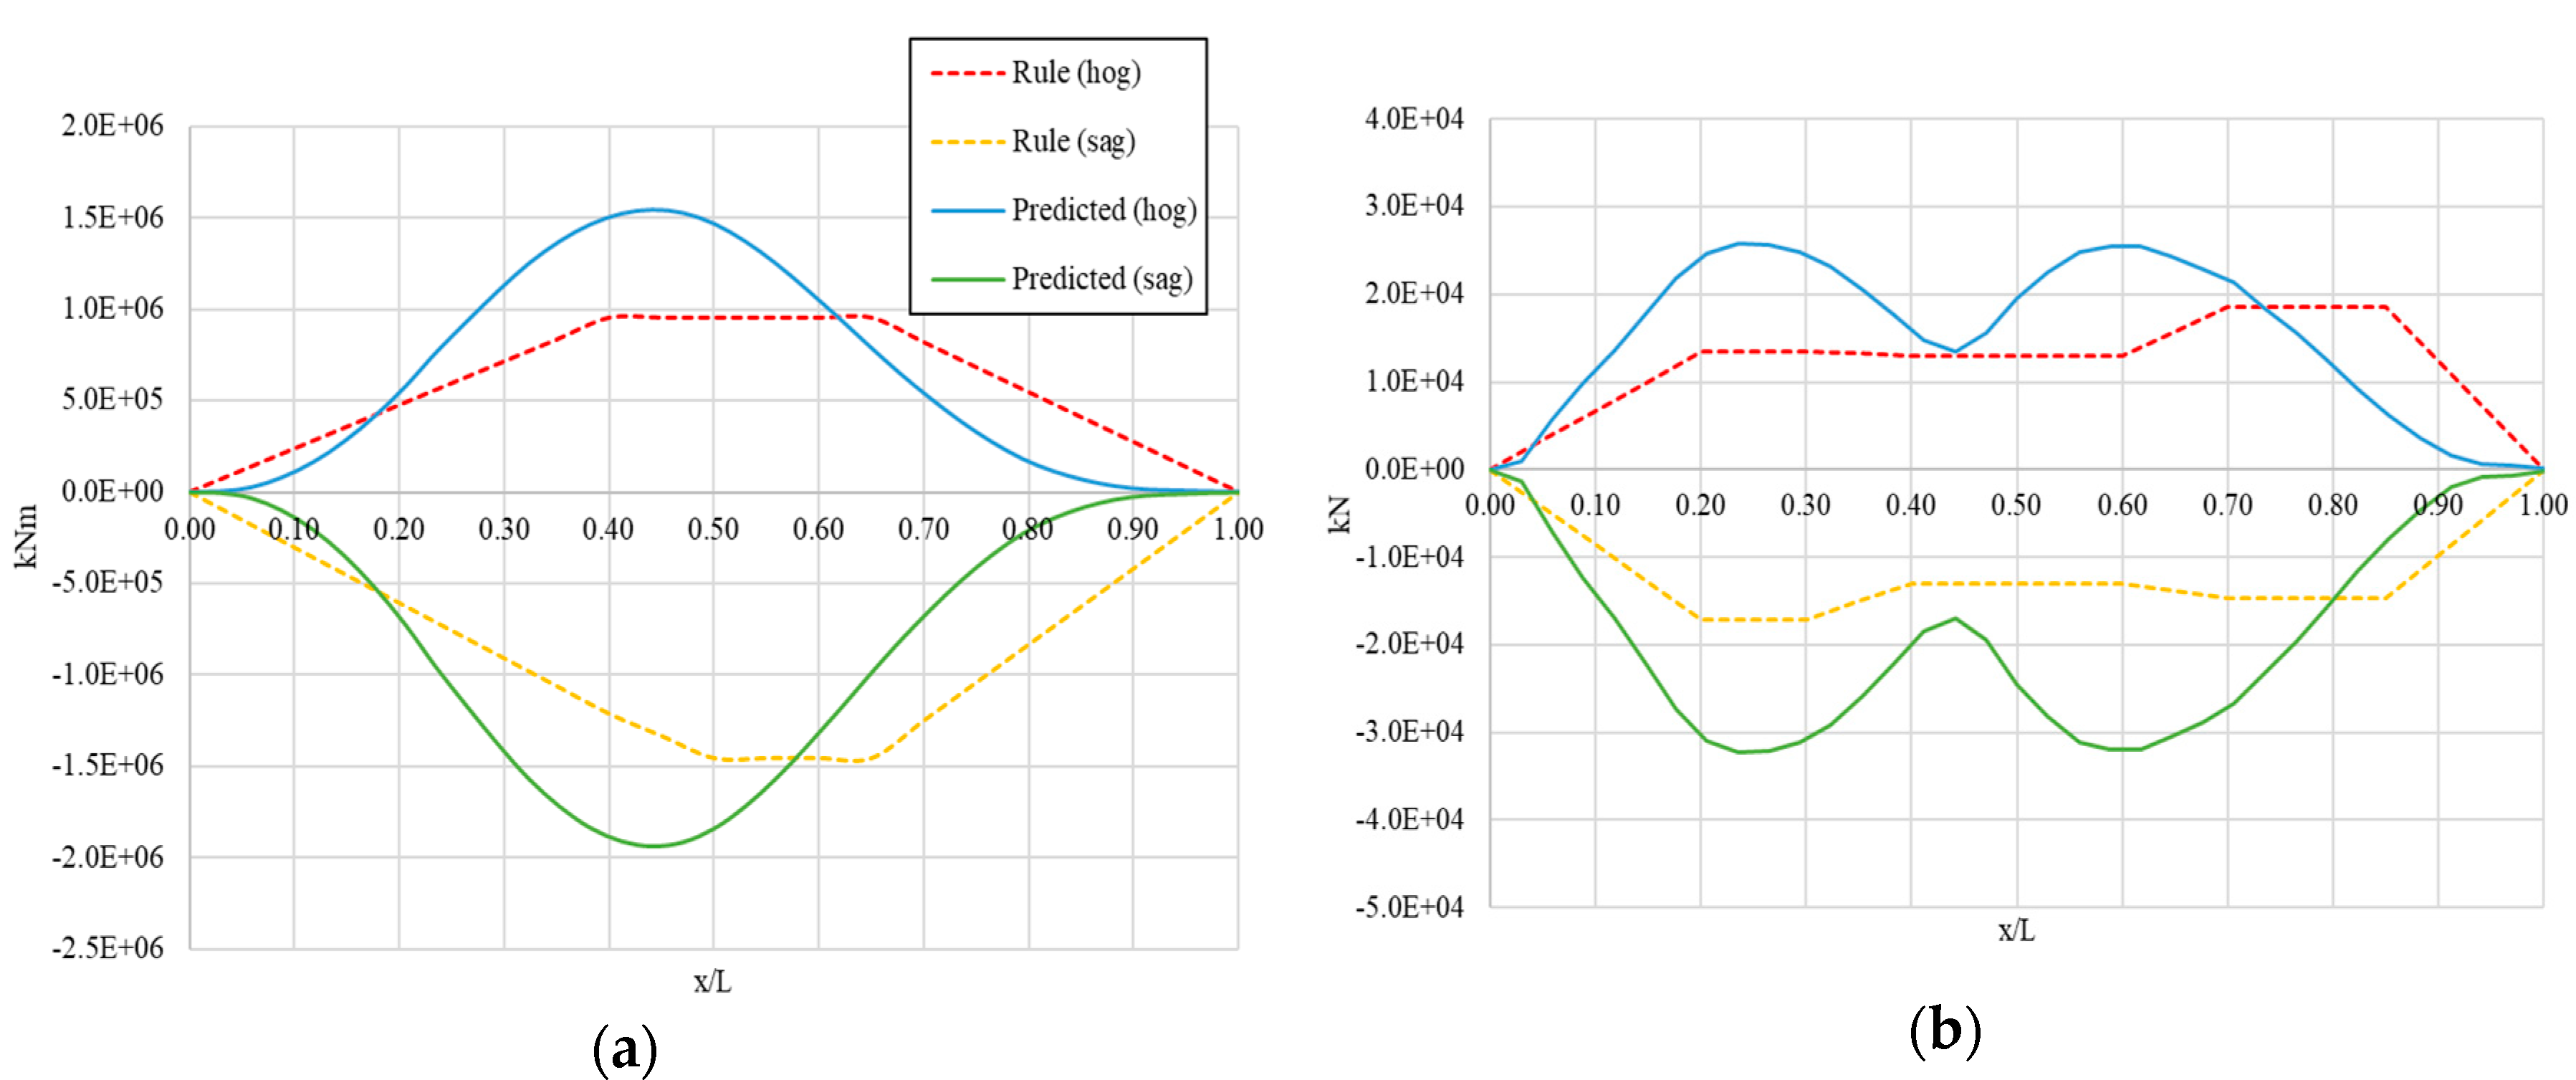
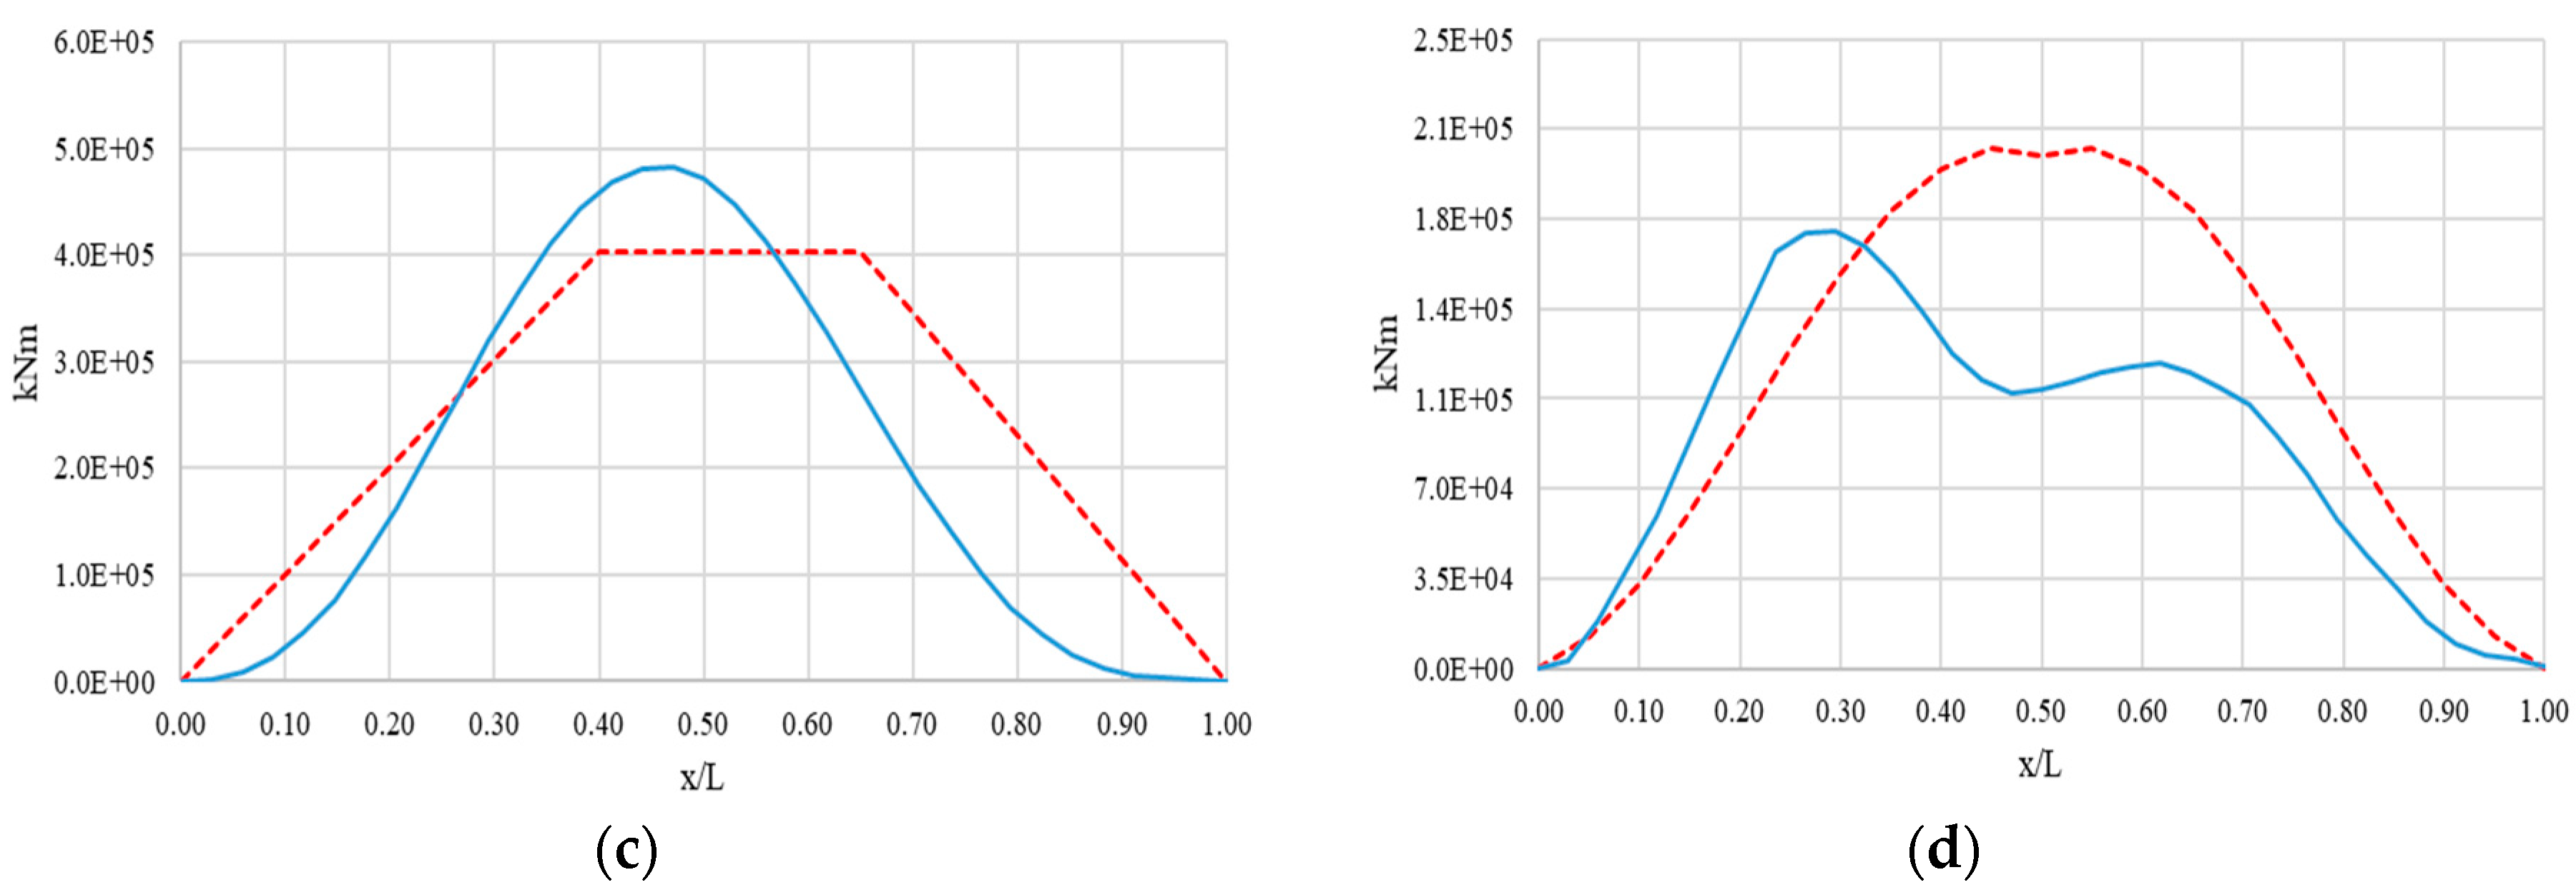
According to the decomposition method explained in Section 2.2, the contribution of elastic responses was investigated by using load RAOs containing the elastic part of the response and the total response. The analysis has shown that the influence of hydroelasticity is negligible as the contribution of elastic responses was less than 0.8% for all internal loads (Figure 12). Figure 13a,b demonstrate that symmetric load distributions along the length of the ship follow the trends of Rules [27,28,29,30]. Based on the nonlinear correction factors of 1.11 and 0.89 for sagging and hogging forces [27,28], the predicted hogging and sagging VBM distributions exceeded Rule values by up to 62% and 33% respectively at amidships. They also appear reduced by way of the extremities of the hull. The predicted hogging VSF exceeds rule values by 91% at 0.24 L, and the sagging shear force exceeded the rule value by 145% at 0.60 L. The predicted VSF longitudinal envelopes appear reduced by way of the forward end of the ship and very similar to Rule trends by way of the aft end. HBM and TM distributions follow the BV requirements [27] (see Figure 13c,d). However, the HBM envelope exceeded these Rule values by 20% at 0.45 L and fell below the Rule envelope margins by way of the extremities of the hull. The predicted TM exceeded the rule values by 11% at 0.26 L.
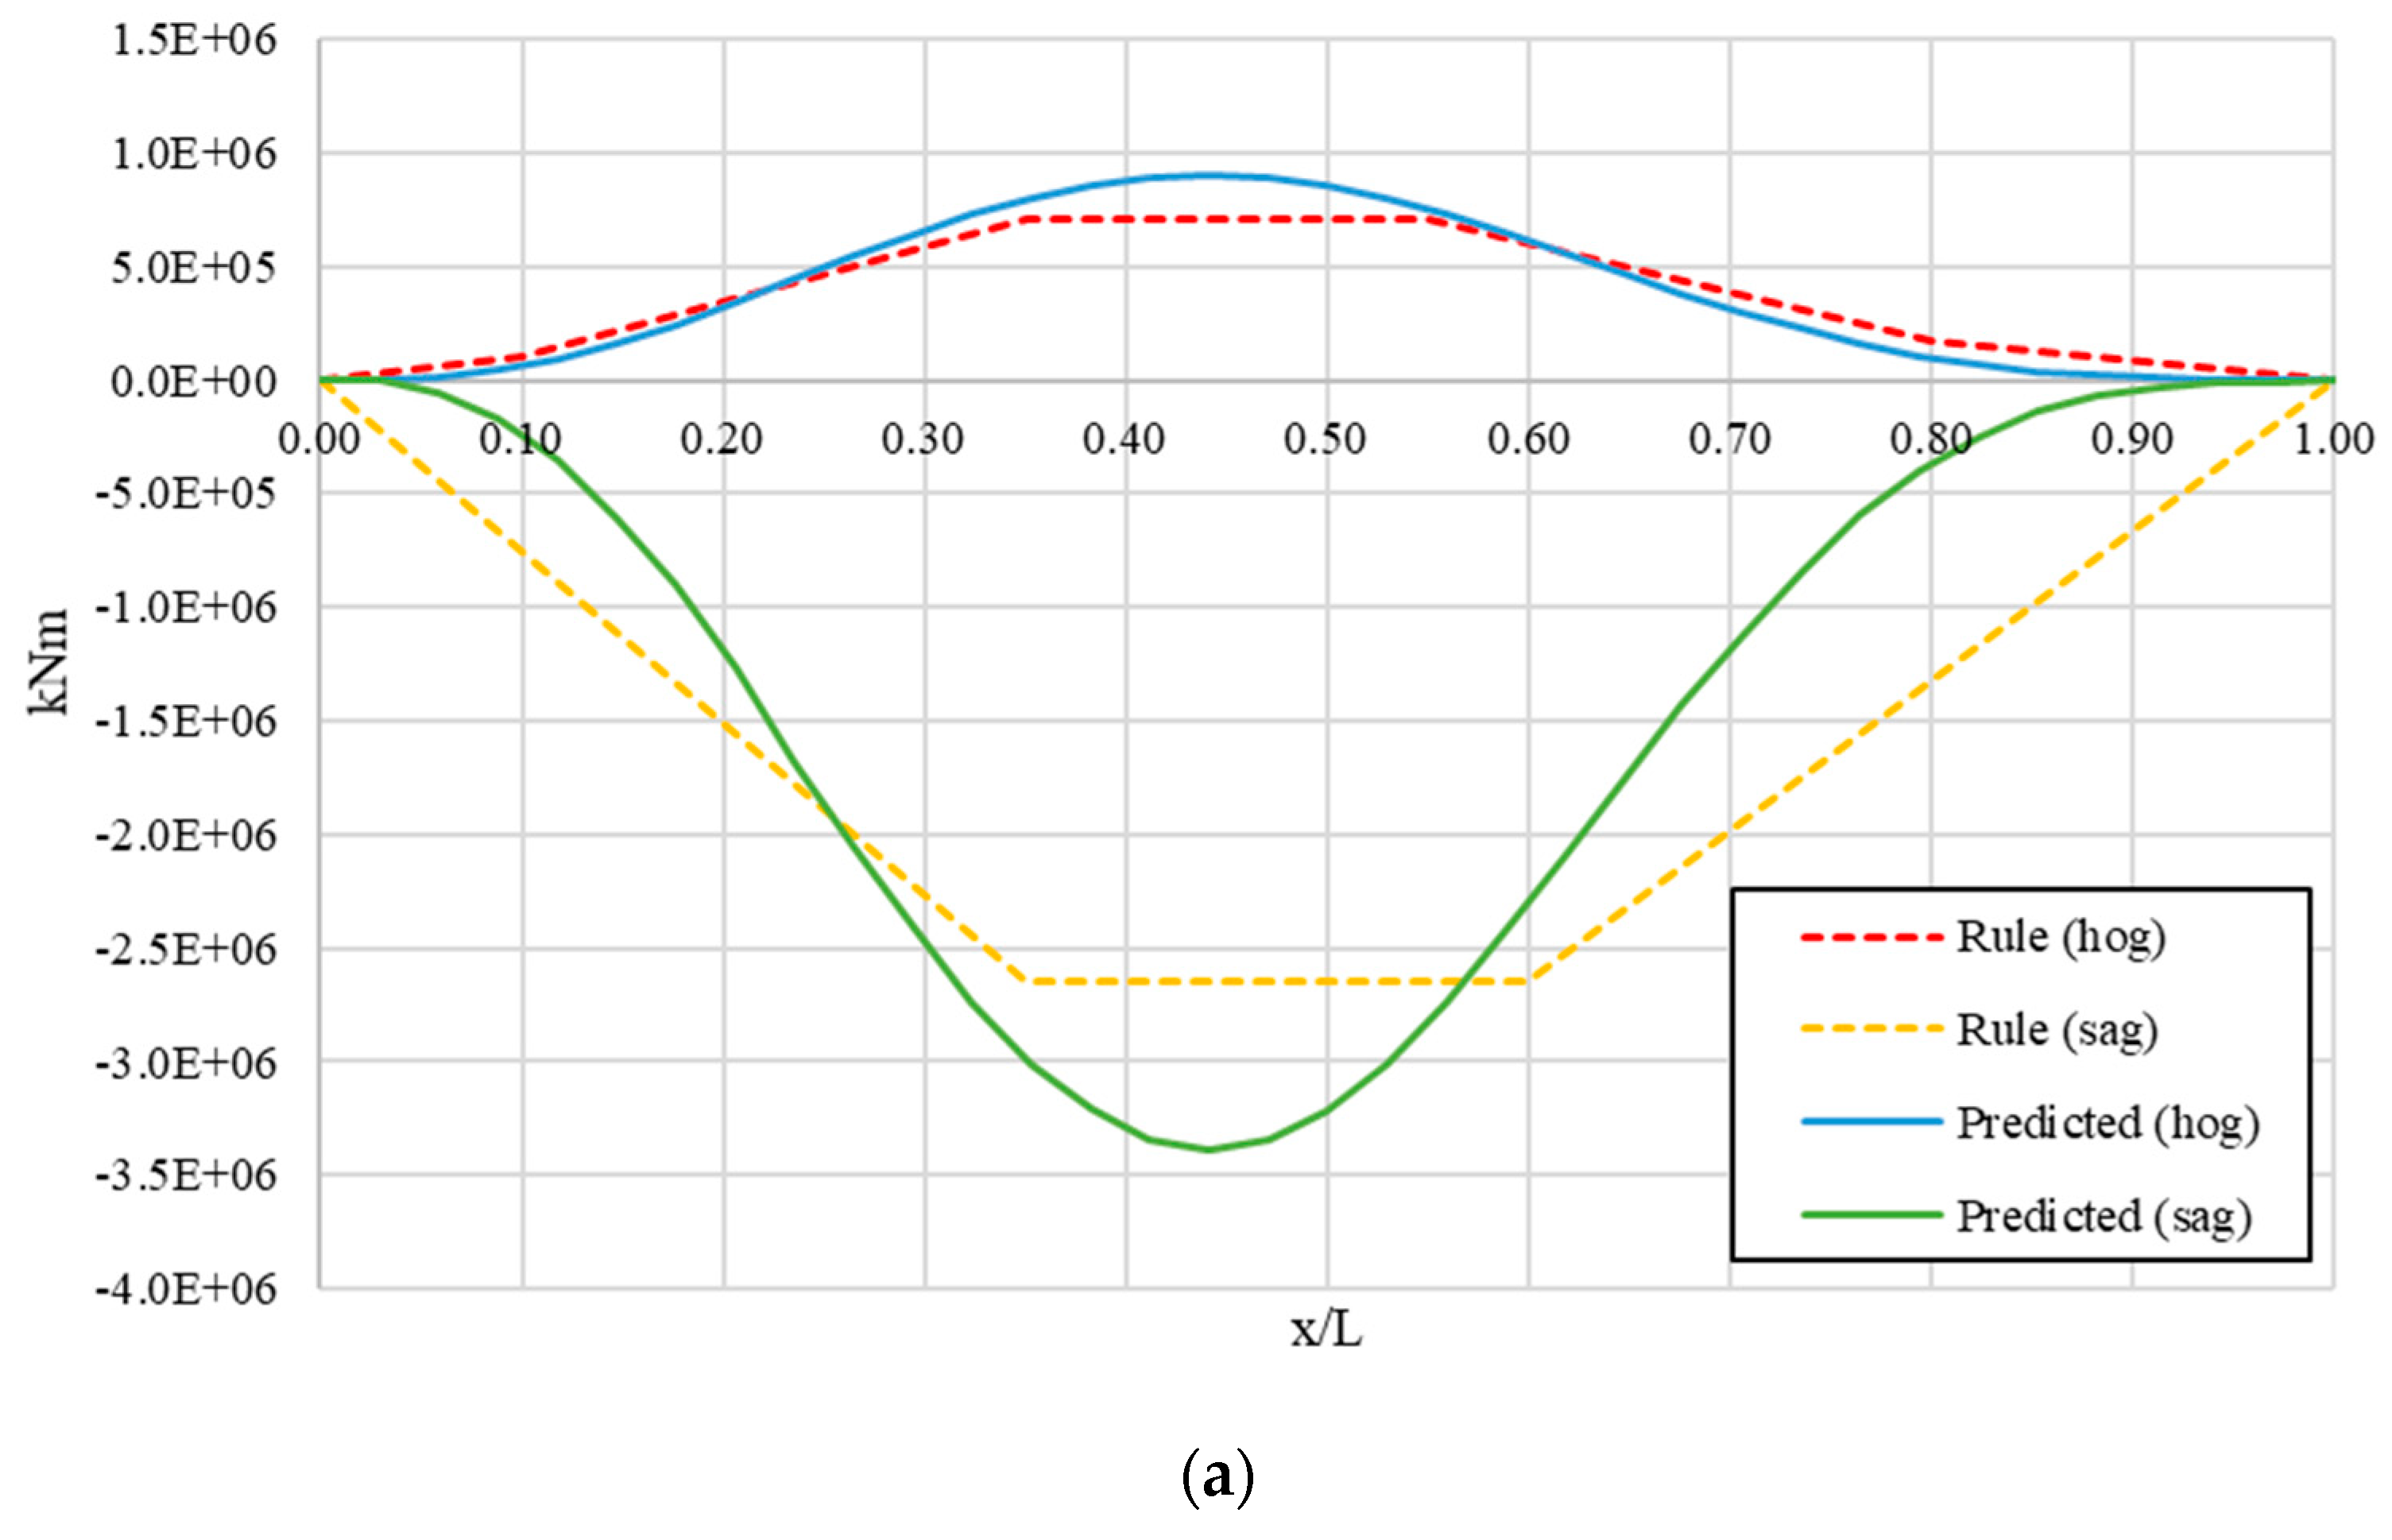
Comparisons of nonlinear and linearized long-term predictions of the hogging and sagging VBM and IACS UR S11 and S11A are shown in Figure 14 [28]. According to UR S11A requirements, the nonlinear correction factors were 0.52 for hogging and 1.94 for sagging. Figure 14a shows that predicted hogging and sagging VBM envelope curves exceeded the Rule values by 28% by way of amidships (0.47 L). However, towards the extremities of the hull the hogging VBM distribution was well contained by the Rule envelope curve with the predicted sagging envelope slightly shifted by way of the aft end of the ship. Figure 14b illustrates that total steady-state linear predictions in the North Atlantic exceeded amidships IACS UR S11 values by 61% and the renewed UR S11A requirements by 28%. The same figure shows that linear predictions for worldwide operation exceeded IACS UR S11 by 40% and UR S11A by 11%.

5. Conclusions

The first four global symmetric and antisymmetric distortion modes captured well the influence of dry hull characteristics on steady-state global dynamic response; this agrees with past studies [9,17,42]. It appears that the modal amplitude peaks of the distortion modes shown in Figure 6 are in good agreement with the wet mode frequencies shown in Table 4. This practically means that the ship hull tends to resonate when the wave encounter frequency gets closer to the wet natural frequencies, and once again, the trends observed are similar to the ones presented in previous studies [9,12,17]. However, the elastic contributions of the responses were negligible, as hydroelasticity effects become significant only outside of the wave energy spectrum (see Figure 12).
Comparisons of the long-term direct calculation results and the Rule loads revealed significant discrepancies in VBM and VSF (see Figure 13a,b and 14). Similar load distribution trends may also be found in [43,44]. From an overall perspective, the predictions for antisymmetric responses appear to be in better compliance to the Rule envelope curves, yet differences are still evident (see Figure 14c,d and Section 5). Similar torsional moment distributions observed for the case of ULCS confirm in general the adequacy of results presented in this paper [45].
Comparisons of the VBM envelope curves demonstrated in Figure 14 show that the nonlinear correction factors implemented in IACS UR S11A offer improvements in comparison to IACS UR S11. For the ship under consideration the ratio between the UR S11 and UR S11A rules for hogging is 0.74 and the ratio for sagging was 1.82. However, significant deviations still existed over parts of the ship between the Rule requirements and the direct steady-state hydrodynamic analysis predictions corrected with nonlinear hog/sag correction factors introduced in the rules. For example, maximum deviations of the order of 28% arise by way of amidships when comparing VBM predictions encompassing IACS UR S11A hogging/sagging nonlinear correction factors and the longitudinal strength standard. The interpretation of the wave scatter diagram also influences predictions by approximately 20% (see Figure 14b).
In conclusion, the results presented show that for the vessel under consideration, hydroelasticity does not influence long term global loads. However, the total influence of springing on local stress tensors has not been evaluated. In addition, it is believed that hydroelasticity may have severe influence if the analysis is conducted on confined and detailed portions of the vessel in extreme waves where nonlinear hydrodynamic effects and impact loads may also be significant [22,46]. Accordingly, future work could concentrate more on understanding the combined influence of nonlinear hydrodynamic effects such as large amplitude motions, local slamming loads, and hull whipping on both global and local ship dynamics and strength over a broad range of passenger ship designs.

Author Contributions

Conceptualization, J.T. and S.H.; methodology, J.T., S.H., and M.P.; software, J.T.; validation, S.H. and M.P.; formal analysis, J.T.; investigation, J.T.; resources, J.T. and M.P.; data curation, S.H.; writing—original draft preparation, J.T.; writing, review, and editing, J.T., S.H. and M.P.; visualization, J.T.; supervision, S.H. and M.P.; project administration, J.T.; funding acquisition, J.T. All authors have read and agreed to the published version of the manuscript.

Funding

Part of this research was in-kind funded by Foreship Ltd. Aalto University funded the open-access Journal of Marine Science and Engineering fees.

Acknowledgments

The work presented here forms part of the MSc thesis of J.T. at the Marine Technology Group of Aalto University. Both J.T and M.P acknowledge the in kind support of Foreship Ltd. S.H. acknowledges financial support from the Academy of Finland University competitive funding award (SA Profi 2-T20404).

Conflicts of Interest

The authors declare no conflict of interest.

References

  1. ILS. Shipping Statistics and Market Review, 61-No. 5/6; The Institute of Shipping Economics and Logistics (ILS): Bremen, Germany, 2017; ISSN 0947022. [Google Scholar]
  2. Hirdaris, S.E.; Temarel, P. Hydroelasticity of ships: Recent advances and future trends. Proc. Inst. Mech. Eng. Part M J. Eng. Marit. Environ. 2009, 223, 305–330. [Google Scholar] [CrossRef]
  3. Lloyd’s Register. Procedure for Strength Analysis of the Primary Structure of Passenger Ships; ShipRight Design and Construction, Structural Design Assessment (SDA), Lloyd’s Register Marine Business Stream: London, UK, 2017. [Google Scholar]
  4. Bajic, D. Structural design of passenger cruise ships—An introduction to classification requirements. Ships Offshore Struct. 2015, 10, 232–238. [Google Scholar] [CrossRef]
  5. Nitta, A.; Arai, H.; Magaino, A. Basis of IACS unified longitudinal strength standard. Mar. Struct. 1992, 5, 1–21. [Google Scholar] [CrossRef]
  6. Malenica, S. Hydrostructure interaction in seakeeping. In Proceedings of the International Workshop on Coupled Methods in Numerical Dynamics, Dubrovnik, Croatia, 19–21 September 2007; pp. 1–25. [Google Scholar]
  7. Bishop, R.E.D.; Price, W.G.; Tam, P.K.Y. A Unified Dynamic Analysis of Ship Response to Waves. Trans. R. Inst. Naval Archit. 1977, 119, 363–390. [Google Scholar]
  8. Hirdaris, S.E.; Price, W.G.; Temarel, P. Two- and three-dimensional hydroelastic modelling of a bulker in regular waves. Mar. Struct. 2003, 16, 627–658. [Google Scholar] [CrossRef]
  9. Bishop, R.E.D.; Price, W.G. An introduction to ship hydroelasticity. J. Sound Vib. 1983, 87, 391–407. [Google Scholar] [CrossRef]
  10. Bishop, R.E.D.; Price, W.G.; Wu, Y. A general linear hydroelasticity theory of floating structures moving in a seaway. Philos. Trans. R. Soc. Lond. Ser. A Math. Phys. Sci. 1986, 316, 375–426. [Google Scholar]
  11. Price, W.G.; Salas, M.; Temarel, P. The Dynamic Behavior of a Mono-hull in Oblique Waves Using Two- and Three-dimensional Fluid-structure Interaction Models. Trans. R. Inst. Naval Archit. 2002, 144, 1–26. [Google Scholar]
  12. Basaran, I.; Belik, O.; Temarel, P. Dynamic Behaviour of a Container Ship Using Two- and Three-Dimensional Hydroelasticity Analyses. In Proceedings of the 27th International Conference on Offshore Mechanics and Arctic Engineering, Estoril, Portugal, 15–20 June 2008; Volume 6, pp. 219–228. [Google Scholar]
  13. Malenica, S.; Molin, B.; Remy, F.; Senjanovic, I. Hydroelastic response of a barge to impulsive and non-impulsive wave loads. In Proceedings of the 3rd International Conference on Hydroelasticity in Marine Technology, The Oxford University, Oxford, UK, 15–17 September 2003; pp. 107–116, ISBN 0-952-62081-2. [Google Scholar]
  14. Lee, Y.; White, N.; Wang, Z.; Zhang, S.; Hirdaris, S.E. Comparison of springing and whipping responses of model tests with predicted nonlinear hydroelastic analyses. Int. J. Offshore Polar Eng. 2012, 22, 1–8. [Google Scholar]
  15. Bigot, F.; Derbanne, Q.; Sireta, F.X.; Malenica, S.; Tuitman, J.T. Global hydroelastic ship response comparison of numerical model and WILS model tests. In Proceedings of the 21st International Offshore and Polar Engineering Conference, Maui, HI, USA, 19–24 June 2011; ISOPE-I-11-138. [Google Scholar]
  16. Derbanne, Q.; Malenica, Š.; Tuitman, J.T.; Bigot, F.; Chen, X.B. Validation of the global hydroelastic model for springing & whipping of ships. In Proceedings of the 11th International Symposium on Practical Design of Ships and Other Floating Structures, Rio de Janeiro, Brazil, 19–24 September 2010; pp. 331–340, ISBN 9788528501407. [Google Scholar]
  17. Shin, K.; Jo, J.; Hirdaris, S.E.; Jeong, S.; Park, J.B.; Lin, F.; Wang, Z.; White, N. Two- and three-dimensional springing analysis of a 16,000 TEU container ship in regular waves. Ships Offshore Struct. Loads Ships Offshore Struct. 2015, 10, 498–509. [Google Scholar]
  18. Malenica, S.; Tuitman, J.T. 3DFEM-3DBEM Model for springing and whipping analyses of ships. In Proceedings of the International Conference on Design and Operation of Container Ships, The Royal Institution of Naval Architects, London, UK, 3–4 July 2008; pp. 13–22, ISBN 9781510885578. [Google Scholar]
  19. Im, H.I.; Vladimir, N.; Malenica, S.; Cho, D.S. Hydroelastic response of 19,000 TEU class ultra large container ship with novel mobile deckhouse for maximizing cargo capacity. Int. J. Naval Archit. Ocean Eng. 2017, 9, 339–349. [Google Scholar] [CrossRef] [Green Version]
  20. Rajendran, S.; Vasquez, G.; Soares, C.G. Effect of bow flare on the vertical ship responses in abnormal waves and extreme seas. Ocean Eng. 2016, 124, 49–436. [Google Scholar] [CrossRef]
  21. Kim, J.H.; Kim, Y. Prediction of extreme loads on ultra-large containerships with structural hydroelasticity. J. Mar. Sci. Technol. 2018, 23, 253–266. [Google Scholar] [CrossRef]
  22. Jiao, J.; Jiang, Y.; Zhang, H.; Li, C.; Chen, C. Predictions of Ship Extreme Hydroelastic Load Responses in Harsh Irregular Waves and Hull Girder Ultimate Strength Assessment. Appl. Sci. 2019, 9, 240. [Google Scholar] [CrossRef] [Green Version]
  23. Malenica, S.; Derbanne, Q. Hydro-structural issues in the design of ultra large container ships. Int. J. Naval Archit. Ocean Eng. 2014, 6, 983–999. [Google Scholar] [CrossRef] [Green Version]
  24. BV. Homer 2.1.9 User Guide; Bureau Veritas VeriSTAR: Paris, France, 2019. [Google Scholar]
  25. BV. NR 583. Whipping and Springing Assessment; Bureau Veritas: Paris, France, 2015; Available online: http://erules.veristar.com/dy/data/bv/pdf/583-NR_2015-07.pdf (accessed on 3 July 2020).
  26. Lloyd’s Register. Global Design Loads of Container Ships and Other Ships Prone to Whipping and Springing; ShipRight Design and Construction—Structural Design Assessment (SDA), Lloyd’s Register Marine Business Stream: London, UK, 2018; Available online: https://www.lr.org/en/shipright-procedures/#accordion-structuraldesignassessment(sda) (accessed on 3 July 2020).
  27. BV. Rules for the Classification of Steel Ships. Part B—Hull and Stability. Chapter 5 Design Loads, Section 2 Hull Girder Loads; Bureau Veritas: Paris, France, 2019. [Google Scholar]
  28. IACS. Longitudinal Strength Standard S11. 2015. Available online: http://www.iacs.org.uk/publications/unified-requirements/ur-s/ (accessed on 3 July 2020).
  29. BV. NI 638. Guidance for Long-term Hydro-structure Calculations; Bureau Veritas VeriSTAR: Paris, France, 2019; Available online: http://erules.veristar.com/dy/data/bv/pdf/638-NI_2019-02.pdf (accessed on 3 July 2020).
  30. Newman, J.N. Wave effects on deformable bodies. Appl. Ocean Res. 1994, 16, 47–59. [Google Scholar] [CrossRef]
  31. Harding, R.D.; Hirdaris, S.E.; Miao, S.H.; Pittilo, M.; Temarel, P. Use of Hydroelasticity analysis in design. In Proceedings of the 4th International Conference on Hydroelasticity in Marine Technology, Wuxi, China, 10–14 September 2006; pp. 1–12. [Google Scholar]
  32. BV. StarSpec User Guide; Bureau Veritas VeriSTAR: Paris, France, 2016. [Google Scholar]
  33. Derbanne, Q.; Storhaug, G.; Shigunov, V.; Xie, G.; Zheng, G. Rule formulation of vertical hull girder wave loads based on direct computation. In Proceedings of the 13th International Symposium on Practical design of Ships and other Floating Structures, Copenhagen, Denmark, 4–8 September 2016; ISBN 9788774754732. [Google Scholar]
  34. DNV GL. Classification Guideline CG-0127. Finite Element Analysis; DNV GL AS Rules and Standards: Oslo, Norway, 2016; Available online: https://rules.dnvgl.com/docs/pdf/DNVGL/CG/2016-02/DNVGL-CG-0127.pdf (accessed on 3 July 2020).
  35. Avi, E.; Lillemäe, I.; Romanoff, J.; Niemelä, A. Equivalent shell element for ship structural design. Ships Offshore Struct. 2015, 10, 239–255. [Google Scholar] [CrossRef]
  36. Kaldoja, M. Modeling of Ship’s Side Shell Openings in Global Finite Element Models. Master’s Thesis, Aalto University, Espoo, Finland, 25 September 2017. Available online: http://urn.fi/URN:NBN:fi:aalto-201710307320 (accessed on 3 July 2020).
  37. Siemens. Femap User Guide; Version 2019.1; Siemens Product Lifecycle Management Software Inc.: Plano, TX, USA, 2019.
  38. NAPA Manuals; Release 2019.2; NAPA: Helsinki, Finland, 2019.
  39. Kumai, T. Damping factors in higher modes of vibrations. Eur. Shipbuild. Prog. 1958, 111, 29–34. [Google Scholar] [CrossRef] [Green Version]
  40. IACS. Recommendation No.34 on Standard Wave Data. 2001. Available online: http://www.iacs.org.uk/publications/recommendations/21-40/ (accessed on 3 July 2020).
  41. DNV GL. Classification Guideline CG-0130. Wave Loads; DNV GL AS Rules and Standards: Oslo, Norway, 2018; Available online: https://rules.dnvgl.com/docs/pdf/DNVGL/CG/2018-01/DNVGL-CG-0130.pdf (accessed on 3 July 2020).
  42. Malenica, S.; Tuitman, J.T.; Bigot, F.; Sireta, F.X. Some aspects of 3D linear hydroelastic models of springing. In Proceedings of the 8th International Conference on Hydrodynamics, Nantes, France, 30 September–3 October 2008; pp. 529–538. [Google Scholar]
  43. Parunov, J.; Senjanovi, I.; Paviaeeviae, M. Use of Vertical Wave Bending Moments from Hydrodynamic Analysis in Design of Oil Tankers. Trans. R. Inst. Naval Archit. 2004, 146, 10. [Google Scholar] [CrossRef]
  44. Jensen, J.J.; Pedersen, P.; Shi, B.; Wang, S.; Petricic, M.; Mansour, A. Wave induced extreme hull girder loads on containerships. Trans. Soc. Naval Archit. Mar. Eng. 2009, 116, 128–151. [Google Scholar]
  45. Rörup, J.; Rathje, H.; Schellin, T. Status of Analysis Methods for Hull Girder Torsion of Containerships. In Proceedings of the 4th PAAMES and AMEC Conference, Singapore, 6–8 December 2010; pp. 1–6. [Google Scholar]
  46. Bennett, S.S.; Hudson, D.A.; Temarel, P. The influence of forward speed on ship motions in abnormal waves: Experimental measurements and numerical predictions. J. Fluids Struct. 2013, 39, 154–172. [Google Scholar] [CrossRef]
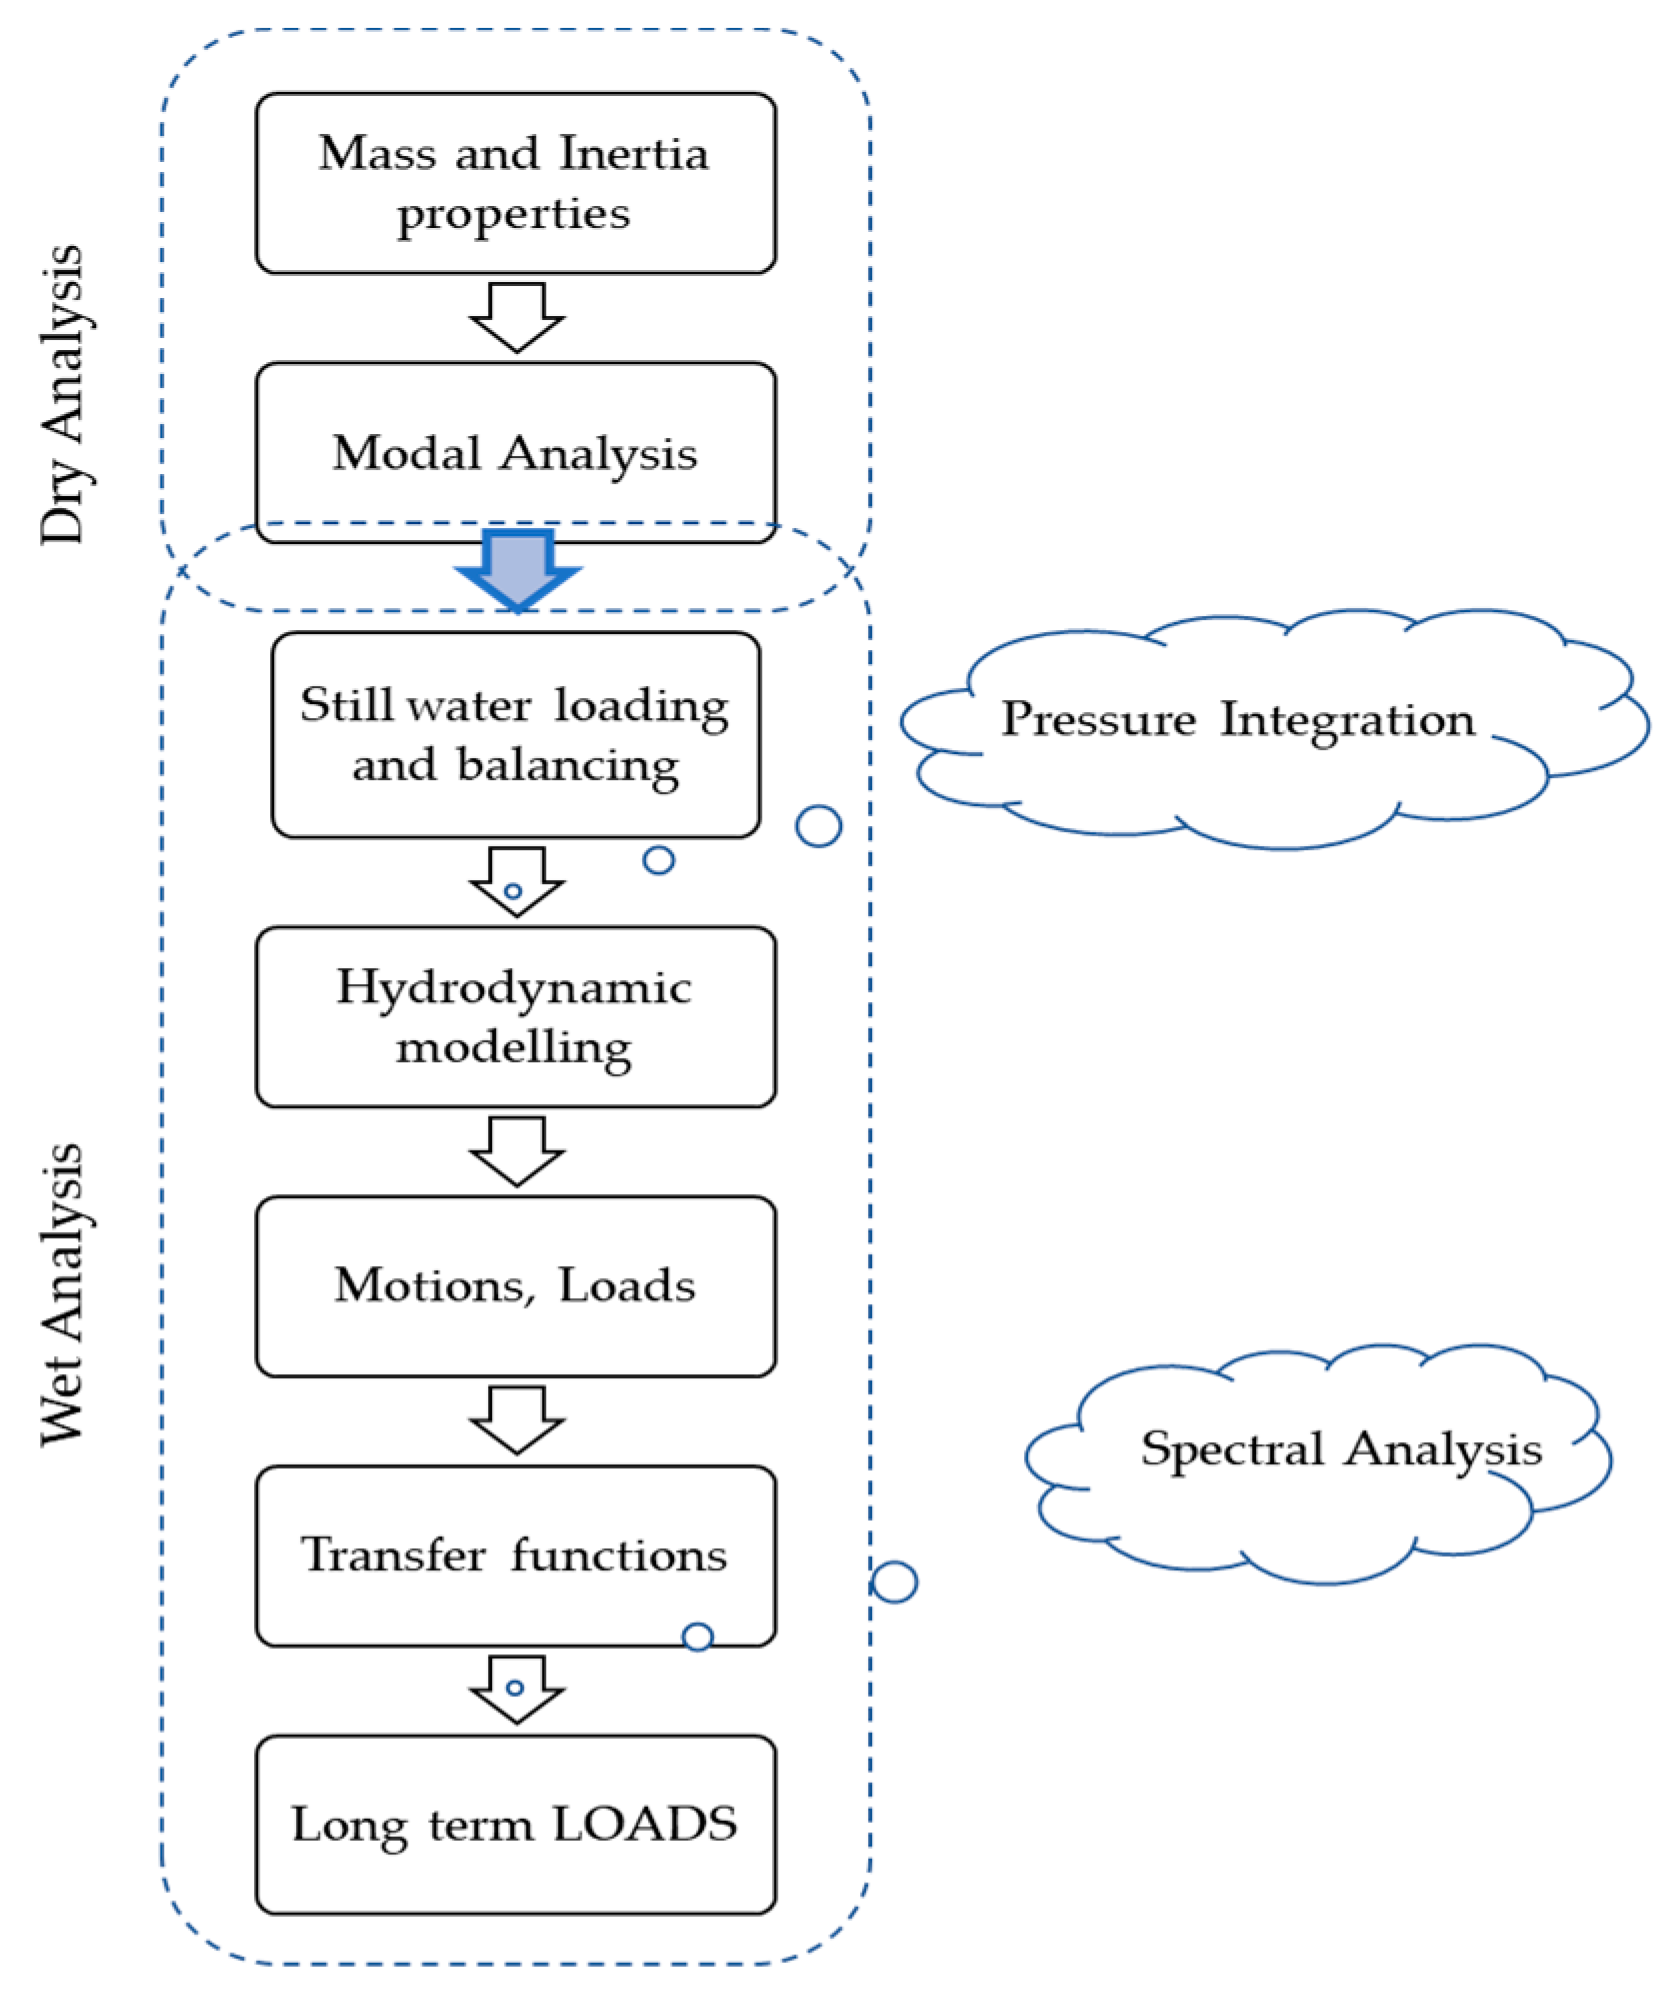
Figure 1. Hydroelastic fluid-structure interaction (FSI)-model analysis.
Jmse 08 00492 g001
Figure 2. Structural mesh (34,545 elements and 16,239 nodes).
Jmse 08 00492 g002
Figure 3. Hydrodynamic mesh (3192 hydrodynamic panels).
Jmse 08 00492 g003
Figure 4. Still water pressure on the hull.
Jmse 08 00492 g004
Figure 5. Still water bending moments and shear forces comparison.
Jmse 08 00492 g005
Figure 6. Dry mode shapes and eigenfrequencies. (a) 2-node VB mode at 12.56 rad/s (b) 1-node T+HB mode at 14.56 rad/s (c) 2-node HB+T mode at 14.92 rad/s (d) 3-node VB mode at 17.27 rad/s.
Jmse 08 00492 g006
Figure 7. Modal amplitudes of the distortion modes with the corresponding dry modes. (a) 2-node VBM mode at 12.56 rad/s (b) 1-node torsion mode at 14.56 rad/s (c) 2-node HBM mode at 14.92 rad/s (d) 3-node VBM mode at 17.27 rad/s.
Jmse 08 00492 g007
Figure 8. Bending moments at midship. (a) Vertical bending moment (b) Horizontal bending moment.
Jmse 08 00492 g008
Figure 9. Torsional moment at (a) 0.25 L, and (b) 0.75 L.
Jmse 08 00492 g009
Figure 10. Bending moments at midship. (a) VBM in head waves (b) HBM in oblique waves (135 deg.).
Jmse 08 00492 g010
Figure 11. Torsional moment in oblique waves at (a) 0.25 L and (b) 0.75 L.
Jmse 08 00492 g011
Figure 12. Elastic contribution on internal loads (MY, vertical bending moment; FZ, vertical shear force; MZ, horizontal bending moment; MX, torsional moment).
Jmse 08 00492 g012
Figure 13. Comparison of load envelope curves between predictions and Rule-based values (10−8 probability level, 25 years return period); (a) Vertical Bending Moment—VBM; (b) Vertical Shear Force VSF; (c) Horizontal Bending Moment—HBM; (d) Torsional Moment—TM.
Jmse 08 00492 g013aJmse 08 00492 g013b
Figure 14. Long term load comparisons of (a) nonlinear VBM corrected predictions and IACS UR S11A requirement and (b) linear VBM predictions against linearized IACS UR S11 and S11A -requirements (10−8 probability level, 25 years return period).
Jmse 08 00492 g014aJmse 08 00492 g014b
Table 1. Comparison of VBM rule load formulae according to IACS (L = ship length; B = ship breadth; CB = ship block coefficient; CW: water plane area coefficient; fR = operational factor typically taken as 0.85 [28], C = ship length dependent wave parameter.
IACS UR S11IACS UR S11A
Hogging VBM 190 C L 2 B C B 10 3 1.5 f R L 3 C C W ( B L ) 0.8 f N L H o g
Sagging VBM 110 C L 2 B ( C B + 0.7 ) 10 3 1.5 f R L 3 C C W ( B L ) 0.8 f N L S a g
Table 2. Principal particulars of the ship used in the analysis.
Ship particularSymbolValue
Length overall (m)LOA200
Gross tonnageGT41,500
Displacement (tonnes)Δ23,000
Table 3. FEA discretization
Element TypeElement Quantity
Laminate17,463
Plate6103
Beam10,877
Mass51
RBE3 (interpolation)51
Total34,545
Table 4. Dry and wet resonance characteristics.
ModeDry Frequency (rad/s)Wet Frequency (rad/s)Ratio (Wet/Dry)Structural Damping
712.567.940.630.002
814.5611.750.810.003
914.9212.790.860.007
1017.2714.290.830.005