Article

Investigation of Ship-Induced Hydrodynamics and Sediment Suspension in a Heavy Shipping Traffic Waterway

Department of Port, Waterway and Coastal Engineering, Southeast University, Nanjing 211189, China
*
Author to whom correspondence should be addressed.
J. Mar. Sci. Eng. 2020, 8(6), 424; https://doi.org/10.3390/jmse8060424
Submission received: 24 May 2020 / Revised: 4 June 2020 / Accepted: 8 June 2020 / Published: 10 June 2020

Abstract

:
In order to investigate the complex hydrodynamics and associated sediment movement resulting from the ship passages in heavy shipping traffic waterways, field measurements were performed in a heavy shipping traffic waterway. Based on the collected waves, flow velocity and water turbidity data, the analyses of the ship-induced hydrodynamics and associated sediment suspension phenomena were conducted. The low-frequency primary wave and high-frequency secondary wave were more pronounced for a barge and yacht in the wave structure, respectively, and contributed more to the flow velocity fluctuations and the bottom shear stress. The ship-induced bottom shear stress can cause significant suspended sediment concentration increase, and there is a correlation between the maximum suspended sediment concentration and maximum ship-induced drawdown height, which can provide a reference for the waterway management.

1. Introduction

For natural alluvial rivers, their morphological parameters will be adjusted under the constant incoming water flow and sediment, and eventually reach a dynamic or quasi-equilibrium state by altering the water flow, entraining and redepositing riverbed materials [1]. Unlike natural rivers, the navigation channels play a key role in transporting goods worldwide, no matter whether it is an inland waterway or coastal waterway. As the shipping traffic demands increase, the heavy shipping traffic puts much pressure on the hydrodynamic conditions and fluvial environment, by producing waves and associated currents, especially for the semi-enclosed or narrow waterways. As one of the major energy inputs in the semi-enclosed or narrow waterways, the ship passages cause the hydrodynamic field disturbances and can be the dominant force shaping the cross-sectional profile [2]. Ship-induced waves have been regarded as an important role in shoreline erosion and altering the sediment transport, e.g., (re)suspension and redistribution, in rivers [3,4,5,6,7], estuaries [8,9], and bays [10,11,12,13].
A ship passage through a water-surface results in the pressure variations at the water–air interface, and produces a series of waves [14]. In deep water, a moving ship creates a classical Kelvin wake wave, denoted as transverse and divergent waves, which is limited to a wedge-shaped region with a half-angle of 19.5°. In shallow water, e.g., estuaries or lagoons confined by tidal flats and marshlands, inland waterways, the key parameter depth Froude number is usually less than 1 due to the limited ship speed. This leads to the Kelvin wake wave being very small [2,15]. As the pressure is increased at the bow and stern, and water-level depression occurs along the ship hull and on the sides of the ship, this feature causes the depression wave (also called Bernoulli wave) [14], also referred to as the primary wave system or drawdown [16], which can propagate on the shallows as an asymmetric, non-linear V-shaped wave [17]. As the depression waves propagate and interact with the bed sediments, they cause high bottom current speed and shear stress for a long time [9,15,17,18]. When the bottom shear stress exceeds a critical threshold value, sediment entrainment, resuspension and transport processes will occur [19].
According to the long-term waterway surveys conducted in Jiangsu Province, China, the heavy shipping traffic has long-term and huge effects on the cross-sectional shapes of many channels. Some shapes, like parabolic-shape, asymmetric-shape, and V-shape, appear, so that the horizontal and vertical scales cannot meet the navigation requirements. Moreover, some riverbanks are severely destroyed due to the restricted width and depth of the channel. The combined action of ship-induced waves and river flow in the shipping waterways should be considered in river bank protection [20,21]. However, it is difficult to evaluate the bed and bank erosion due to the ship’s wave action from the long-term perspective. The short-term assessment of the sediment transport during the ship passages is therefore more practical. Some studies have focused on the effects of ship-induced waves on the sediment (re)suspension and transport [7,15,22,23,24], and established the relationship between the suspended sediment concentration and associated ship-induced wave parameters [15,25,26]. However, up to now, little attention has been given to the short-term impacts on sediment movement during the ship passages in shipping waterways in China.
The purpose of the present study is to clarify the short-term impacts of the ship’s wave action on the sediment movement in the heavy shipping traffic waterway. For this purpose, field measurements were performed at a straight section of the Changzhou segment of the Grand Canal to collect the water level elevations, current velocities and the turbidity levels during the ship passages. Then, the characteristics of ship-induced waves and the associated sediment suspension caused by navigating ships were investigated.

2. Materials and Methods

2.1. Study Site

Jiangsu Province is one of the most developed inland shipping traffic provinces in China. The Grand Canal flows through four provinces and two cities, of which the segment in Jiangsu Province is the one with the longest mileage, the highest cargo density and the best transportation efficiency, and its freight volume has increased by 10% annually in recent years. The Changzhou segment of the Grand Canal is located at the southern part of Jiangsu Province, which starts at the Heyuanli at the junction with Zhenjiang, and terminates at the Zhihu Port with a total length of 48.816 km.
The comprehensive improvement projects of the southern part of Jiangsu Province of the Grand Canal started in August 1992, and were completed in September 1997 with a designed bottom width of 40 m and a water depth of 2.5 m. As the shipping traffic demands increase, the dimensions of the waterways cannot meet the requirements of the freight volume, especially the urban part of the Changzhou segment of the Grand Canal. Then, the rerouted projects of the urban part of the Changzhou segment of the Grand Canal were conducted and completed in early 2008, adopting a designed water surface width of 90 m, a bottom width of 70 m, a water depth of 3.2 m and a minimum bending radius of 480 m. Figure 1 presents the location of the urban part of the Changzhou segment of the Grand Canal and a typical designed cross-section. As the navigable conditions improve, the shipping traffic in the urban part of the Changzhou segment of the Grand Canal has been characterized by an increase in the total tonnage, a decrease in the total number, and a significant increase in the average tonnage of a single ship according to the recorded ship data from 2006 to 2015. The canalization and construction of ship locks regulate the water level and result in very small water flow velocities in the urban part of the Changzhou segment of the Grand Canal. Except for the passage of a single ship, the phenomenon of ships following and crossing each other often occur, which leads to complex dynamic conditions.

2.2. Field Measurements

Field measurements were established at a straight section of the urban part of the Changzhou segment of the Grand Canal. All measurement instruments were deployed in a cross-sectional array, as shown in Figure 2. Water-level fluctuations, instantaneous current velocities and turbidity levels were measured during the ship passages under normal river flow conditions. Ship properties, i.e., ship types and loading conditions, on the one hand were recorded by taking photos, and on the other hand were collected from the monitoring station near the measuring site. Another key parameter, ship speed, was obtained from the distance divided by the time between the bow and stern passing two fixed points. The distance between the ship and the riverbank was measured by a laser rangefinder, mounted on the riverbank and perpendicular to the transect.
A wave height measurement system (CBY-II) was adopted to record the water-level fluctuations during the ship passage with a sampling frequency of 20 Hz. Ten wave gauges were installed in two rows with a distance of 2.0 m and the distances between every wave gauge are presented in Figure 2. Two acoustic Doppler velocimeters (Nortek, Norway) were installed on the fixed monitoring system using a bottom-resting tripod to measure the current velocities in three dimensions at a height of z   = 25 cm above the riverbed (where z is the distance to the riverbed) with the distances from the riverbank of y   = 6 m and 40 m (where y is the distance to the riverbank), respectively. The three-directional components of the current velocities were recorded at a sampling frequency of 8 Hz during the ship’s passage past the measurement transect. The suspended particle concentrations caused by the navigating ships were reflected by the turbidity levels. The measurements of the turbidity levels were carried out using the optical backscatter sensors (OBS) manufactured by D&A Instruments. Three OBSs were also deployed using the bottom-resting tripod at a height of z   = 10 and 15 cm below the ADV with y   = 6, 15 and 40 m, respectively. Water samples were collected for calibrating against the suspended sediment concentration (SSC) at the study site. Riverbed sediment samples were also taken in order to obtain spatial and detailed sediment features.

2.3. Analysis of Ship-Induced Hydrodynamics

During a ship passage in the water, the sailing ship transfers energy to the water body to overcome its resistance, resulting in a pressure and velocity distribution along the ship hull. Due to the limited width and depth of an inland waterway, the produced pressure and velocity distributions around the ship hull are more pronounced.
According to the different frequencies on the frequency scale, the ship-induced wave trains can be decomposed into two major components, the primary waves and secondary waves. The primary wave pattern is filtered out with a long period T L P   10 s, while the secondary wave pattern has a shorter period of 2 s < T S P < 10 s, where T L P and T S P are the primary wave and secondary wave periods, respectively. In this study, a low-pass filter (Frequency f < 0.1 Hz) based on the fast Fourier transform (FFT) can preserve the primary wave pattern, while a band-pass filter (0.1 Hz <   f   < 0.5 Hz) determines the secondary wave pattern. The same spectral analysis method was adopted for the velocity components caused by the ship passages. A low-pass filter of 0.1 Hz contributed to distinguishing the primary wave-induced velocity fluctuations, and a band-pass filter between 0.1 and 0.5 Hz was applied to separate the secondary wave-induced variances, and a high-pass filter of 0.5 Hz was used to extract the turbulence-induced velocity variances. Then, each velocity component caused by ship-induced waves could be decomposed into varying wave-induced and turbulence-induced contributions:
u X = u X L P + u X S P + u X
u Y = u Y L P + u Y S P + u Y
u Z = u Z L P + u Z S P + u Z
where u X , u Y , are the horizontal velocity components in the X and Y direction, respectively;   u Z is the vertical velocity component in the Z direction;   u X L P , u Y L P , u Z L P are the long period primary wave-induced contributions in the three directions; u X S P , u Y S P , u Z S P are the short period secondary wave-induced contributions in the three directions; u X , u Y , u Z are the fluctuating turbulent components in the three directions. The vertical velocity component u Z is usually very small compared to the horizontal components, and is often negligible.
The primary and secondary wave-induced velocity components U L P , U S P can be obtained by combining the wave-induced velocity components u X W and u Y W in the X and Y direction:
U L P = u X L P 2 + u Y L P 2
U S P = u X S P 2 + u Y S P 2

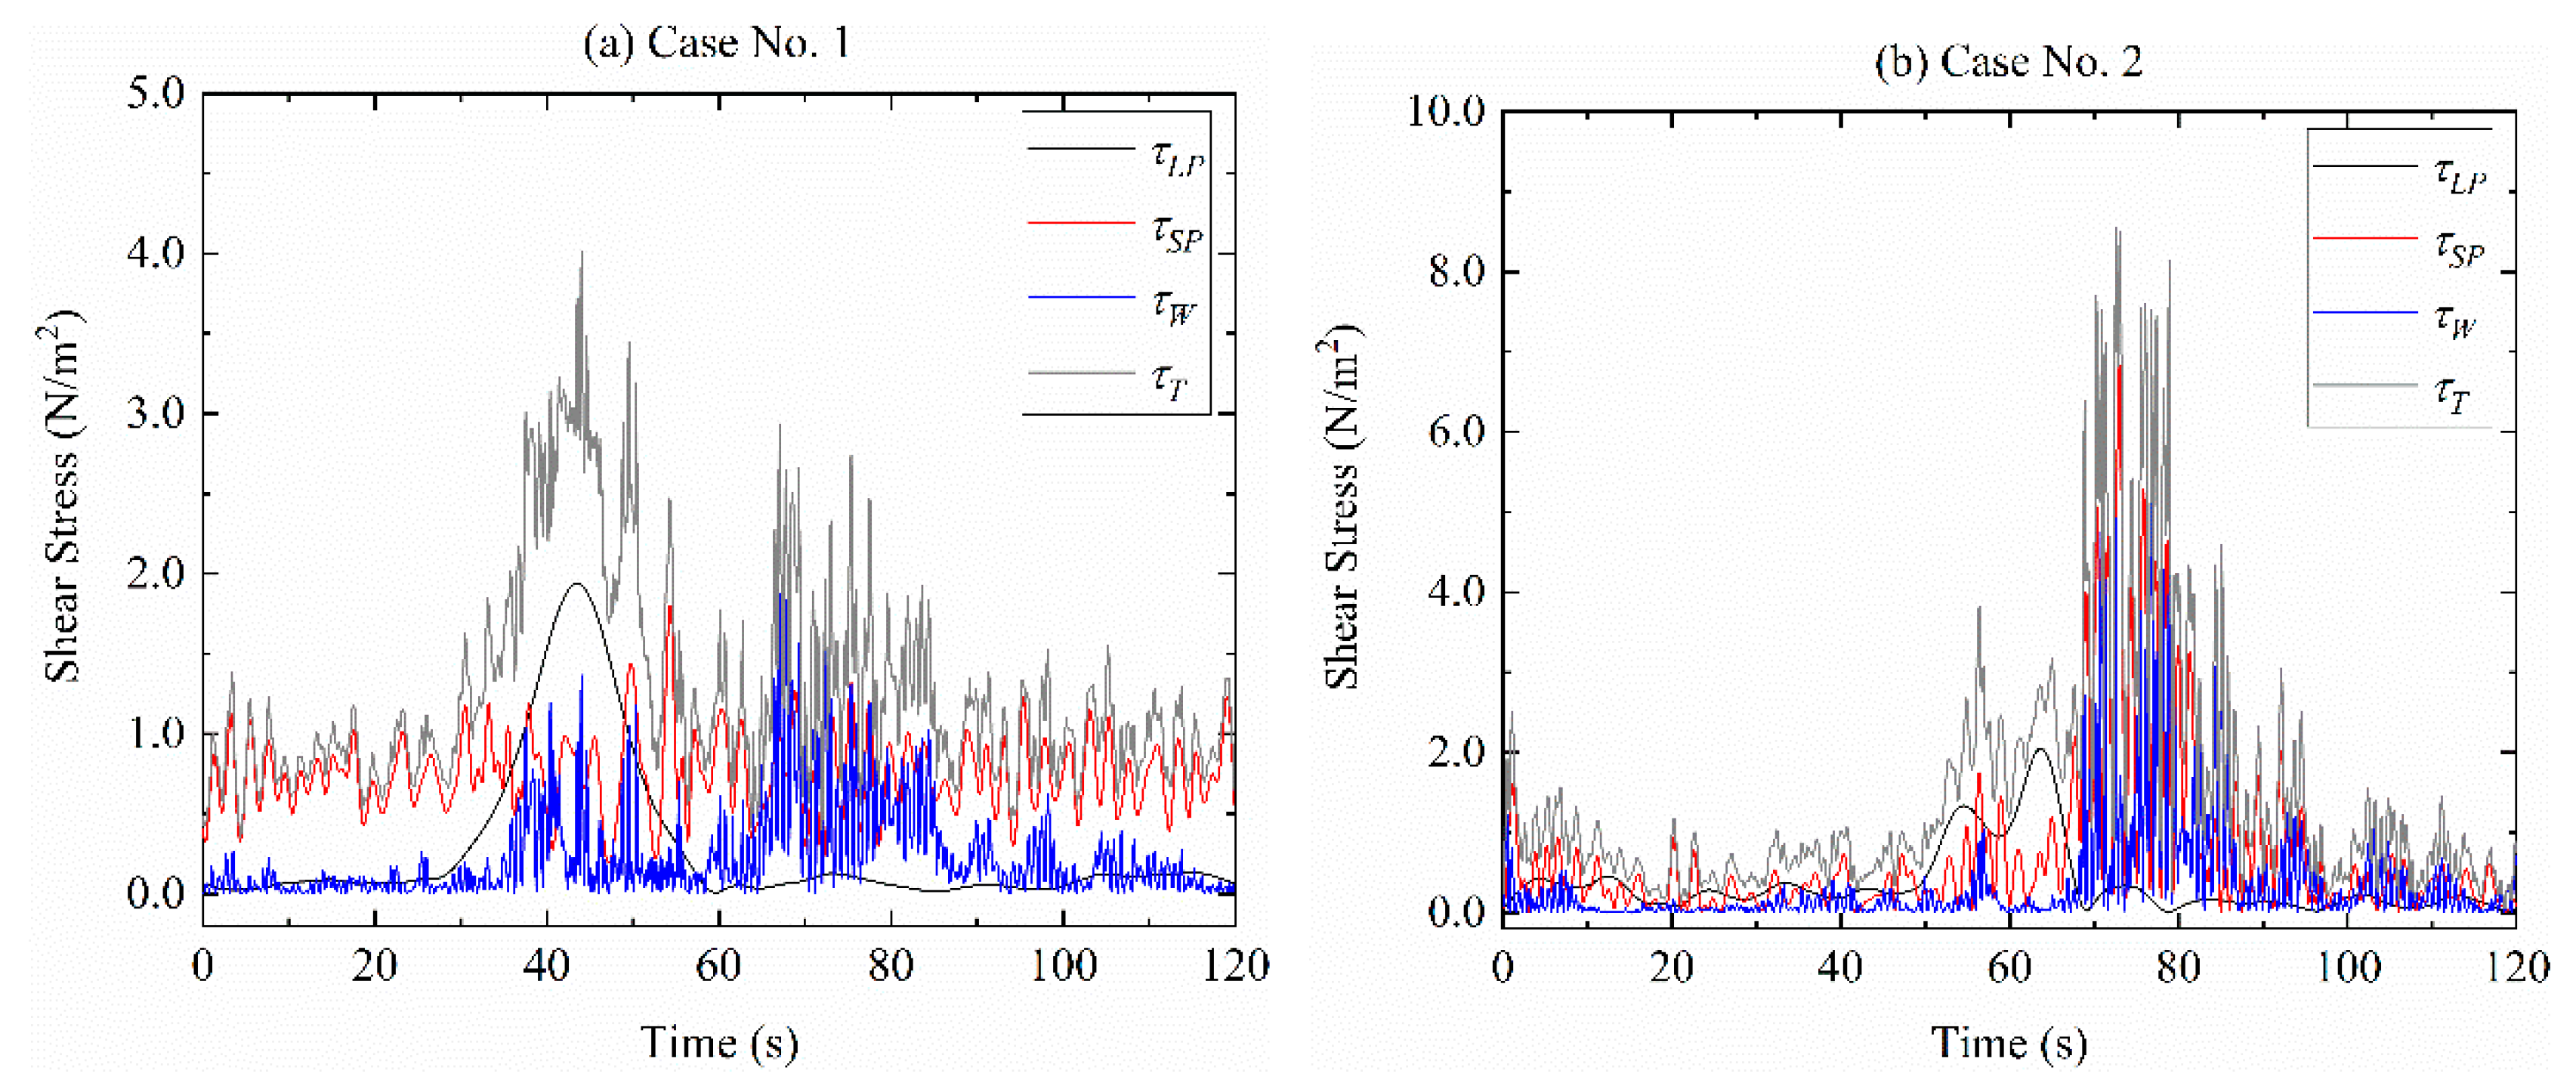
2.4. Calculation of Ship Induced Bottom Shear Stress

A ship passage can cause locally and temporarily higher current velocities, which is capable of producing sediment entrainment, suspension and transport. The frictional forces exerted on the riverbed are a combination of the ship-induced waves and the river flow. When the current velocity is very small without a ship passage, the contribution of the current to the shear stress is assumed to be negligible. In this study, the mobilization of sediment from the riverbed is determined by the magnitude of the critical shear stress τ c r and bottom shear stress τ D caused by the ship-induced hydrodynamics. The total bottom shear stress is the contribution of the primary and secondary wave-induced shear stress, and the turbulence-induced shear stress.
The primary and secondary wave-induced shear stress, τ L P and τ S P , can be calculated using the following expression:
τ L P = 1 2 ρ f W L P U L P 2
τ S P = 1 2 ρ f W S P U S P 2
where f W is the wave friction factor [27]. Due to the turbulent flow, the friction factor was obtained from the relation [27]:
f W L P = 1.39 ( U L P T L P 2 π z 0 ) 0.52
f W S P = 1.39 ( U S P T S P 2 π z 0 ) 0.52
where z 0 is the bed roughness length, taken as z 0 = 0.0004 m, which is advocated by Soulsby [27].
Due to the on-site wave-turbulence shear conditions, the turbulent kinetic energy (TKE) method was a suitable method for investigating the wave–current interactions [19], which is based on the separation of the wave-induced ( u W , v W , w W ) and turbulence-induced ( u T , v T , w T ) variances of each fluctuating velocity component u , v and w . The TKE shear stress τ T can be calculated from:
τ T = ρ · C TKE · T K E = 1 2 ρ C TKE ( u T 2 ¯ + v T 2 ¯ + w T 2 ¯ )
where C TKE is the best fit coefficient and ranges from 0.18 to 0.21 [19].
Another way of describing the bed shear stress caused by the ship-induced hydrodynamics focuses on the long-period primary wave patterns in inland waterways, since the boundary layer under a mean current is much larger than under an oscillatory current [7]. The bed shear stress τ D could be written as
τ D = 1 2 ρ f W u D 2
where u D is the maximum drawdown velocity, given by [7]:
u D = 1 2 s d g h
where s d is the drawdown height, h is the water depth.

3. Results and Discussion

3.1. Ship-Induced Wave Structure in the Time and Frequency Domain

According to [28], the most common navigation vessels can be divided into two types, displacement and planing vessels. In these field measurements, two kinds of vessels were observed: the barge with large underwater volume and the corresponding water displacement, and the yachts with small underwater volume and faster sailing speed, corresponding to the aforementioned two types. Two typical examples are presented to show the wave structures induced by the navigation ships in the time and frequency domain. Table 1 summarizes the properties of the two ship passages.

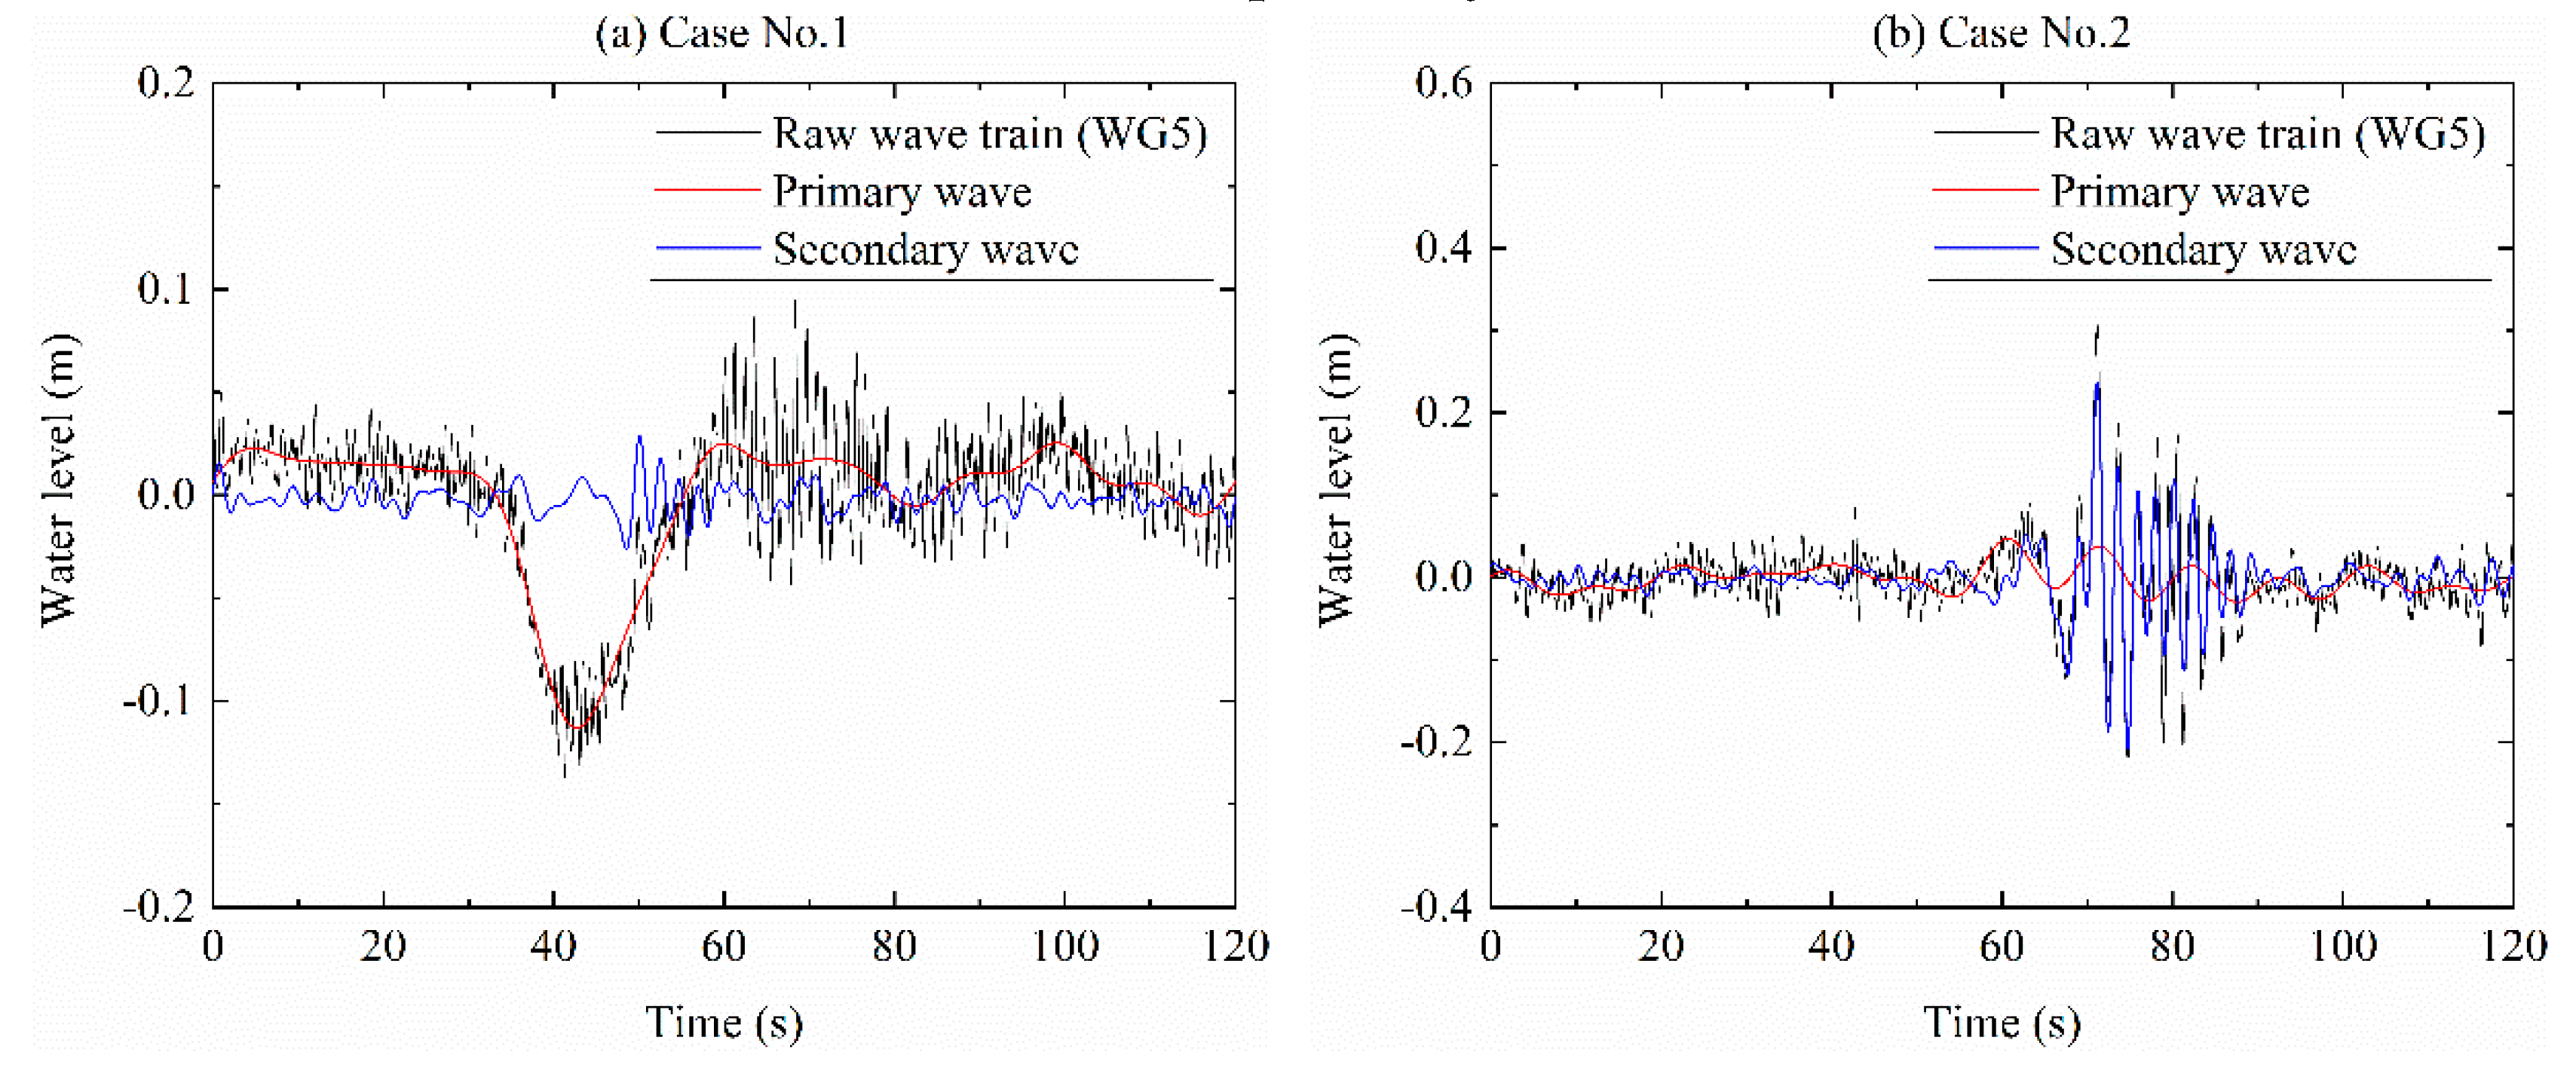
3.1.1. Primary and Secondary Waves

Figure 3 shows the raw wave structures and their filtered primary and secondary waves caused by the two cases. They present different characteristics of the water-level fluctuations caused by the two cases. In the time domain, the water-level fluctuations caused by Case No. 1 start with a small water-level oscillation, then follows a large water-level drop, and the significant water-level oscillation arrives. This water-level fluctuation process can be characterized by the small vessel bow wave, the dominate long-period primary wave (often regarded as the drawdown trough), and the short-period transverse and divergent waves (secondary wave). For Case No. 2, the water-level fluctuations start with small oscillations from the time 0 to 60 s and a small water-level rise between the time 60 and 65 s, then follows a small water-level drop, after which the significant water-level oscillations come. Thus, the wave structure caused by Case No. 2 is composed of the small bow wave, primary wave and pronounced secondary wave. The importance of the primary and secondary wave patterns depends on the different ship type, and the occurrence and amplitude of the primary and secondary wave are determined by the size of the navigation channel, the vessel size, speed and its hull form. In this study area, most of the navigable vessels are cargo ships, so the primary wave is often the major concern. Some wave parameters were adopted to describe the wave structure of the two cases. First, the maximum drawdown heights s d , m a x of Case No. 1 and 2 were 0.113 m and 0.030 m with primary wave periods of 20.95 and 3.00 s, respectively. Second, the maximum ship-induced wave heights were 0.171 m and 0.484 m for the two cases, respectively. Last, the secondary wave periods of the two cases were 1.10 and 2.95 s, respectively.

3.1.2. Ship-Induced Wave Spectrum

In addition to the ship-induced wave structure in the time domain, a spectral analysis can be adopted for the ship-induced waves to investigate the energy potential in the frequency domain. Compared to the FFT, wavelet analysis is suitable for quantifying the nonlinear and nonstationary spectral signal which varies over a range of temporal or spatial scales. Therefore, continuous wavelet transform (CWT) was used to analyze the ship-induced waves in this study, and defined as the convolution of the water-level time series with a scaled and translated version of the normalized mother wavelet function. The details about this method are described in [5]. Figure 4 shows the wavelet power spectrum and the global wavelet spectrum for the water-level time series caused by cases No.1 and No. 2. As the aforementioned characteristics of the ship-induced wave structure of the two cases indicate, the importance of the primary and secondary waves of the two cases is different, which makes two different wavelet spectrums. For Case No. 1, the peak spectral energy of the ship-induced waves occurs in the time range from 20 to 60 s and low-frequency range. This energy contribution corresponds to the primary waves. The value of the peak global spectral energy is 0.348, at the frequency of 0.015 Hz. For Case No. 2, the peak spectral energy lies in the time range of 60~90 s, and the frequency around 0.5 Hz, which reflects the effect of the secondary waves of the yacht. There are three obvious global spectral energy peaks for the yacht with the values of 0.048, 0.045 and 0.056 at the frequencies of 0.010, 0.122 and 0.439, respectively.

3.2. Hydrodynamics and Sediment Dynamic during a Ship Passage

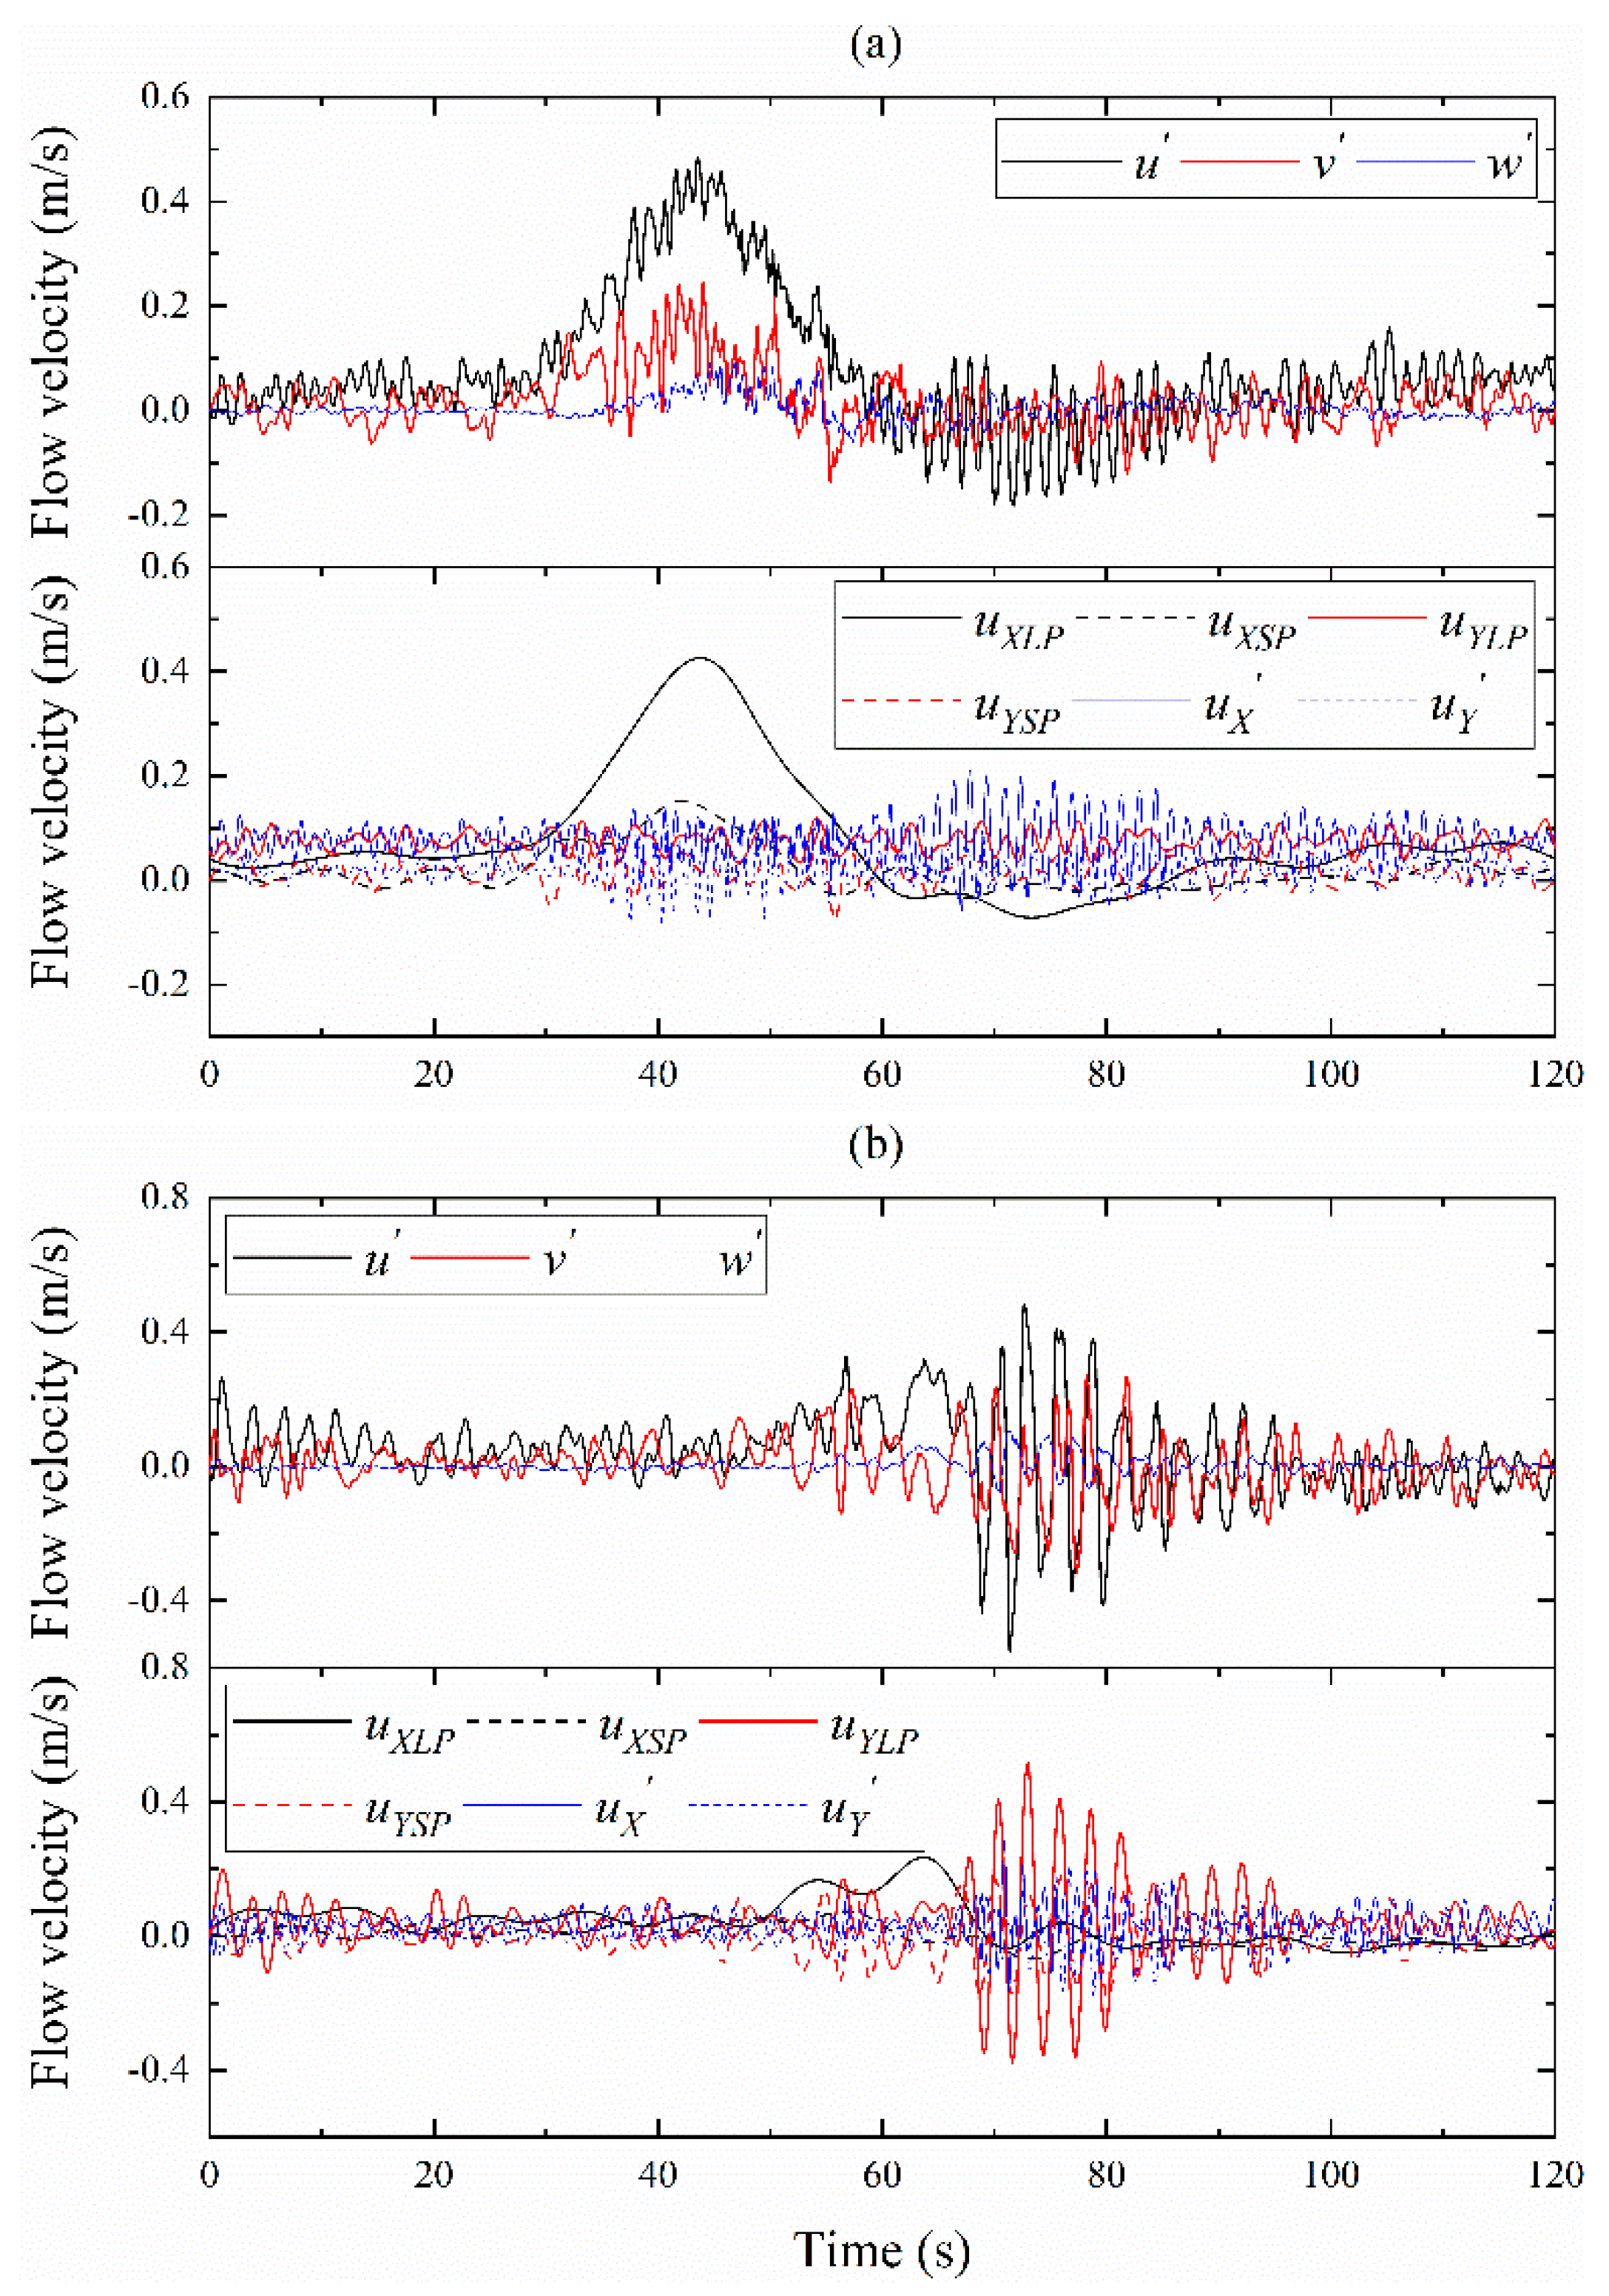
3.2.1. Ship-Induced Hydrodynamics

During the ship passage, as the water-level fluctuates, the flow velocities increase. Figure 5 presents the three-dimensional flow velocity variations caused by cases No. 1 and No. 2, and the velocity contributions of the primary wave, the secondary wave and the turbulence for the two cases. Compared to the horizontal components, the vertical velocity component w is very small for the two cases. As shown in Figure 5a, the horizontal flow velocity components have significant increases and reach the maximum u and v values of 0.485 and 0.256 m/s, respectively, as the ship-induced drawdown comes, which indicates that the primary wave alters the local flow velocities for the barge. It can be concluded that the primary wave-induced velocity for Case No. 1 was the key contributor to the ship-induced flow velocities compared to the flow velocities induced by the secondary wave and the turbulence. The maximum primary wave-induced velocity was reached, corresponding to the lowest water level when the maximum drawdown height was reached. The big difference in the flow velocity fluctuations between Case No. 1 and No. 2 was the time period of the velocity increases. The horizontal flow velocities increased within the high-frequency secondary wave packets, and the largest fluctuation amplitude was 0.553 m/s, as shown in Figure 5b. The secondary wave-induced velocities show significant oscillations with higher magnitude, while the primary wave-induced velocities are less pronounced.
If the ship-induced bottom shear stress exceeds the threshold value during the ship passage, the erosion and suspension process will occur. The aforementioned method was used to calculate the ship-induced bottom shear stress using Equations (6), (7) and (10) for the two cases. Figure 6 shows the total bottom shear stress and the contributions of the primary wave, the secondary wave and the turbulence. As shown in Figure 6a, the primary wave contributed the highest magnitude of the bottom shear stress with the maximum τ L P value of 1.938 N/m2, and the maximum τ W value caused by Case No. 1 was 4.013 N/m2. For Case No. 2, the bottom shear stress increased within the secondary wave packets with the maximum τ W value of 8.542 N/m2. The secondary wave-induced and turbulence-induced shear stresses contributed most of the bottom shear stress with the maximum τ S P and τ T values of 6.839 N/m2 and 6.333 N/m2, respectively.

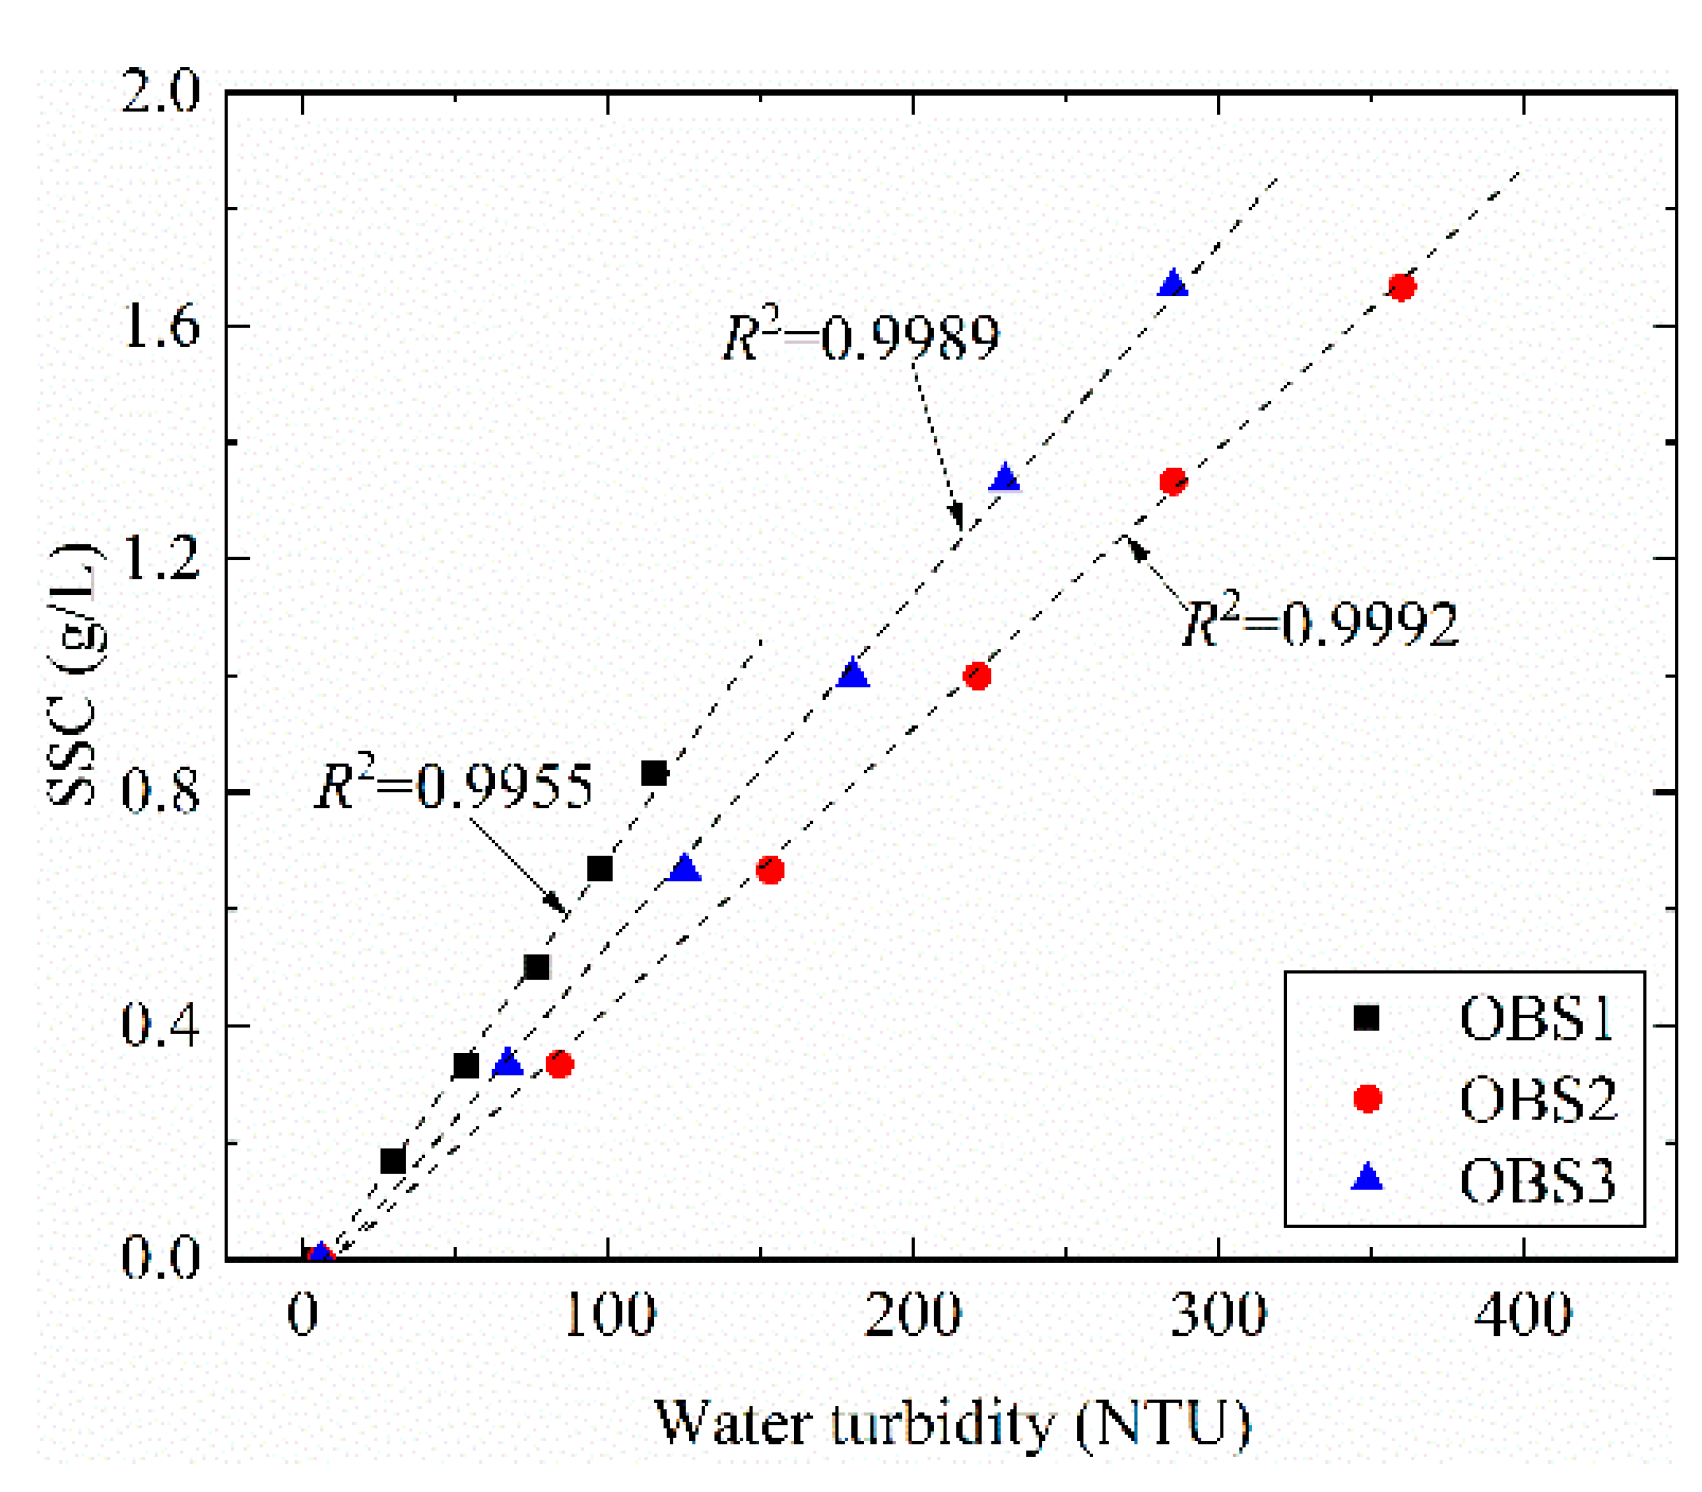
3.2.2. SSC Changes Caused by the Ship Passage

The particle size distribution of the collected sediment samples was measured by the high-resolution laser particle-size analyzer in the laboratory. The results show that 9.2% of the grain size were larger than 0.075 mm, 74.7% of the grain size ranged from 0.005 mm to 0.075 mm, and 16.1% were less than 0.005 mm. The effective grain size ( d 10 ), and median grain size ( d 50 ) of the particles at the study site were 0.002 and 0.023 mm, respectively. Moreover, the inhomogeneous coefficient ( C u ) and curvature coefficient ( C c ) were measured as 14.0 and 1.45, respectively. Water and sediment samples were used to calibrate against the suspended sediment concentration (SSC), as shown in Figure 7.
During the field measurements, the suspended sediment concentration changes caused by the different navigation vessels were observed. Due to the heavy shipping traffic in the study area, the situation of ships crossing or following each other often occur except for a single ship. The complex ship-induced hydrodynamic inputs bring significant impacts on the riverbed erosion and sediment suspension. For the three OBS sensors, the OBS 1 observes the higher magnitude of SSC due to the shallow water depth. Table 2 list the maximum SSC (OBS 1) caused by different ship passage situations obtained by the field measurements. The different ship passage conditions include the single ship passage (SSP), the two continuous ship passages (TCSP), the confluence of two ships (CTS), and the fleet passage (FP). During the whole measurement period, the SSC was not zero, but keeps at a specific level and has significant increases under some ship passages. As shown in Table 2, the maximum SSC can reach to a high magnitude for a single ship when it sails with higher speed and a closer distance to the riverbank. For the situation of the ships meeting or following each other, the SSC increases, however, it is difficult to clarify the effects of the complex ship-induced wave interactions. As for the fleet, the sailing speed is often very small, causing a small but lasting SSC increase.

3.2.3. Impacts of Ship-Induced Waves on Sediment Suspension

Generally, the higher magnitude of the ship-induced bottom shear stress is, the more sediment will be entrained and suspended. According to the Equations (11) and (12), the proposed method gives the relationship between the ship-induced bottom shear stress and the ship-induced wave parameters. Then, a similar method [7] is used in this study to establish the relationship between SSC and the ship-induced drawdown height. Figure 8 presents the obtained relationship between the maximum SSC and the maximum ship-induced drawdown height ( s d m ) at the different locations of the three OBS sensors. The results show that the suspended sediment concentration changes caused by the navigation ships have a correlation with the ship-induced drawdown height, and for OBS 1, the relationship shows the best agreement. It should be noticed that this relationship is related to the ship-induced primary wave height, therefore it is more suitable for the larger underwater volume barges.

4. Conclusions

In this paper, the investigation of the ship-induced waves and the associated sediment suspension were conducted based on the field measurements results. Some conclusions can be drawn here. Firstly, for the barge with a large underwater volume, the primary wave is more pronounced with a larger drawdown and contributes the most to the wave energy, the ship-induced flow velocity, and the bottom shear stress, compared to the secondary wave and the turbulence. Furthermore, for the yacht with a faster speed and a small underwater volume, the secondary wave was the key contributor to the wave energy. The secondary wave-induced velocities and bottom shear stress show significant oscillations with a higher magnitude. Moreover, during the ship passages, the suspended sediment concentration has great increases compared to the background condition without ship passages. There is a correlation between the maximum suspended sediment concentration and the maximum ship-induced drawdown height at different locations, which indicates the impacts of the ship-induced waves on the sediment movement.
Although this paper obtained some meaningful results, there are some limitations, as field measurements are affected by many factors. In order to obtain more accurate data, a laboratory experiment should be conducted. This will be done in our following research.

Author Contributions

Conceptualization, Y.C.; methodology, L.M.; writing—original draft preparation, L.M.; writing—review and editing, Y.C.; visualization, L.M.; supervision, Y.C.; funding acquisition, Y.C. All authors have read and agreed to the published version of the manuscript.

Funding

This research was funded by the National Natural Science Foundation of China, grant number 51479035 and the Scientific Research Foundation of Graduate School of Southeast University, grant number YBPY 1883.

Conflicts of Interest

The authors declare no conflict of interest.

References

  1. Ran, L.S.; Wang, S.J.; Lu, X.X. Hydraulic geometry change of a large river: A case study of the upper Yellow River. Environ. Earth. Sci. 2012, 66, 1247–1257. [Google Scholar] [CrossRef]
  2. Bellafiore, D.; Zaggia, L.; Broglia, R.; Ferrarin, C.; Barbariol, F.; Zaghi, S.; Lorenzetti, G.; Manfè, G.; De Pascalis, F.; Benetazzo, A. Modeling ship-induced waves in shallow water systems: The Venice experiment. Ocean Eng. 2018, 155, 227–239. [Google Scholar] [CrossRef]
  3. Nanson, G.C.; Krusenstierna, A.V.; Bryant, E.A.; Renilson, M.R. Experimental measurements of river-bank erosion caused by boat-generated waves on the Gordon River, Tasmania. River Res Appl. 1994, 9, 1–14. [Google Scholar] [CrossRef]
  4. Bauer, B.O.; Lorang, M.S.; Sherman, D.J. Estimating Boat-Wake-Induced Levee Erosion using Sediment Suspension Measurements. J. Waterw. Port Coast. Ocean Eng. 2002, 128, 152–162. [Google Scholar] [CrossRef] [Green Version]
  5. Houser, C. Sediment resuspension by vessel-generated waves along the Savannah River, Georgia. J. Waterw. Port Coast. Ocean Eng. 2011, 137, 246–257. [Google Scholar] [CrossRef]
  6. De Roo, S.; Troch, P. Field monitoring of ship wave action on environmentally friendly bank protection in a confined waterway. J. Waterw. Port Coast. Ocean Eng. 2013, 139, 527–534. [Google Scholar] [CrossRef]
  7. Göransson, G.; Larson, M.; Althage, J. Ship-Generated Waves and Induced Turbidity in the Göta Älv River in Sweden. J. Waterw. Port Coast. Ocean Eng. 2014, 140, 04014004. [Google Scholar] [CrossRef]
  8. Schoellhamer, D.H. Anthropogenic Sediment Resuspension Mechanisms in a Shallow Microtidal Estuary. Estuar. Coast. Shelf Sci. 1996, 43, 533–548. [Google Scholar] [CrossRef]
  9. Houser, C. Relative importance of vessel-generated and wind waves to salt marsh erosion in a restricted fetch environment. J. Coast. Res. 2010, 26, 230–240. [Google Scholar] [CrossRef]
  10. Osborne, P.D.; Boak, E.H. Sediment suspension and morphological response under vessel-generated wave groups: Torpedo Bay Auckland, New Zealand. J. Coast. Res. 1999, 15, 388–398. [Google Scholar]
  11. Ravens, T.M.; Thomas, R.C. Ship Wave-Induced Sedimentation of a Tidal Creek in Galveston Bay. J. Waterw. Port Coast. Ocean Eng. 2008, 134, 21–29. [Google Scholar] [CrossRef]
  12. Didenkulova, I.; Parnell, K.E.; Soomere, T.; Pelinovsky, E.; Kurennoy, D. Shoaling and Runup of Long Waves Induced By High-Speed Ferries in Tallinn Bay. J. Coast. Res. 2009, 56, 491–495. [Google Scholar]
  13. Didenkulova, I.; Pelinovsky, E.; Soomere, T.; Parnell, K.E. Beach profile change caused by vessel wakes and wind waves in Tallinn Bay, the Baltic Sea. J. Coast. Res. 2011, 64, 60–64. [Google Scholar]
  14. Soomere, T. Nonlinear Components of Ship Wake Waves. Appl. Mech. Rev. 2007, 60, 120–138. [Google Scholar] [CrossRef]
  15. Rapaglia, J.; Zaggia, L.; Ricklefs, K.; Gelinas, M.; Bokuniewicz, H. Characteristics of ships’ depression waves and associated sediment resuspension in Venice Lagoon, Italy. J. Mar. Syst. 2011, 85, 45–56. [Google Scholar] [CrossRef]
  16. Bertram, V. Practical Ship Hydrodynamics; Butterworth-Heinemann: Oxford, UK, 2014; p. 269. [Google Scholar]
  17. Rapaglia, J.; Zaggia, L.; Parnell, K.; Lorenzetti, G.; Vafeidis, A.T. Ship-wake induced sediment remobilization: Effects and proposed management strategies for the Venice Lagoon. Ocean Coast. Manag. 2015, 110, 1–11. [Google Scholar] [CrossRef]
  18. Ciavola, P. Sediment resuspension in the Lagoon of Venice Short-term observations of natural and anthropogenic processes. Z. Geomorph. 2005, 141, 1–15. [Google Scholar]
  19. Verney, R.; Deloffre, J.; Brun-Cottan, J.C.; Lafite, R. The effect of wave induced turbulence on intertidal mudflats: Impact of boat traffic and wind. Cont. Shelf. Res. 2007, 27, 594–612. [Google Scholar] [CrossRef] [Green Version]
  20. De Roo, S.; Vanhaute, L.; Troch, P. Impact of ship waves on the sediment transport in a nature friendly bank protection. In Proceedings of the International Conference on Fluvial Hydraulics, San Jose, Costa Rica, 5 September 2012; pp. 1309–1316. [Google Scholar]
  21. Kurdistani, S.M.; Tomasicchio, G.R.; D’Alessandro, F.; Hassanabadi, L. River bank protection from ship-induced waves and river flow. Water Sci. Technol. 2019, 12, 129–135. [Google Scholar] [CrossRef]
  22. De Roo, S.; Troch, P. Evaluation of the Effectiveness of a Living Shoreline in a Confined, Non-Tidal Waterway Subject to Heavy Shipping Traffic. River Res. Appl. 2015, 31, 1028–1039. [Google Scholar] [CrossRef]
  23. Clarke, D.; Reine, K.J.; Dickerson, C.; Alcoba, C.; Gallo, J.; Wisemiller, B.; Zappala, S. Sediment Resuspension by Ship Traffic in Newark Bay, New Jersey; No. ERDC/EL-TR-15-1; U.S. Army Engineer Research and Development Center: Vicksburg, MS, USA, 2015. [Google Scholar]
  24. Zaggia, L.; Lorenzetti, G.; Manfé, G.; Scarpa, G.M.; Molinaroli, E.; Parnell, K.E.; Rapaglia, J.P.; Gionta, M.; Soomere, T. Fast shoreline erosion induced by ship wakes in a coastal lagoon: Field evidence and remote sensing analysis. PLoS ONE 2017, 12, e0187210. [Google Scholar] [CrossRef] [PubMed] [Green Version]
  25. Ji, S.S.; Ouahsine, A.; Smaoui, H.; Sergent, P. 3D Modeling of sediment movement by ships-generated wakes in confined shipping channel. Int. J. Sediment Res. 2014, 29, 49–58. [Google Scholar] [CrossRef]
  26. Ji, S.S.; Ouahsine, A.; Smaoui, H.; Sergent, P. 3D Numerical Modeling of Sediment Resuspension Induced by the Compounding Effects of Ship-Generated Waves and the Ship Propeller. J. Eng. Mech. 2014, 140, 04014034. [Google Scholar] [CrossRef]
  27. Soulsby, R.L. Dynamics of Marine Sands; A Manual for Practical Applications; Thomas Telford: London, UK, 1997; p. 249. [Google Scholar]
  28. De Roo, S. Experimental study of the hydrodynamic performance of a nature-friendly bank protection subject to ship waves in a confined, non-tidal waterway. Ph.D. Thesis, Ghent University, Ghent, Belgium, January 2013. [Google Scholar]
Figure 1. Location of the urban part of the Changzhou segment of the Grand Canal and the typical designed cross-section.
Jmse 08 00424 g001
Figure 2. Layout of the equipment.
Jmse 08 00424 g002
Figure 3. Typical raw wave structures and the filtered primary and secondary waves during the passages of (a) Case No.1 and (b) Case No.2.
Jmse 08 00424 g003
Figure 4. Wavelet power spectrum (Left) and global wavelet spectrum (Right) for the water-level time series caused by (a) Case No. 1 (b) Case No. 2.
Jmse 08 00424 g004
Figure 5. Three-dimensional flow velocity variations and the velocity contributions of the primary wave, secondary wave and the turbulence caused by (a) Case No. 1 and (b) Case No. 2.
Jmse 08 00424 g005
Figure 6. Bottom shear stress and its contributions of the primary wave, secondary wave and the turbulence caused by (a) Case No. 1 and (b) Case No. 2.
Jmse 08 00424 g006
Figure 7. The correlation of the turbidity recorded by the OBS sensor against the suspended sediment concentration.
Jmse 08 00424 g007
Figure 8. Relationship between the maximum SSC and the maximum ship-induced drawdown height ( s d m ) at the different locations.
Jmse 08 00424 g008
Table 1. Properties of the two ship passages.
Case No.Ship NameDraft (m)Length (m)Width (m)Ship Speed (m/s)
1WTLH52693.249103.40
2SHZTD1060.8514.43.34.97
Table 2. SSC changes caused by the different ship passage situations.
Case. NoShip tTypeSailing SituationShip Speed (m/s)Distance to the Bank (m)Maximum SSC (g/L)
1BargeSP3.30400.72
2BargeSP2.95400.49
3BargeTCSP1.78500.69
Barge1.5255
4BargeTCSP2.07500.73
Barge2.4350
5BargeCTS2.18400.70
Barge2.6355
6BargeCTS2.10500.50
Barge2.2270
7BargeCTS2.53450.57
Barge2.5855
8BargeFP1.12600.78
9BargeFP1.12600.48
10BargeFP1.42500.39

