1. Introduction
Indonesia is a tropical country that consists of more than 17000 islands. The wet, hot, humid climate aggressively deteriorates bridges. This is particularly true for seaports, (a critical part of Indonesia’s infrastructure) and both the provision of new infrastructure and retrofitting aging assets has consumed greater than 5% of the country’s gross domestic product (GDP) [
1]. Based on the data obtained from Directorate General Bina Marga [
2], the total road network in Indonesia is 488,181 km in 2015. Moreover, it is expected that there will be a new road of 15,000 km in 2019 to support tourism, airports, seaports, and railways. In addition to building new infrastructure, it is also stated that there is approximately 47,000 km of roads and 446 km of the bridge that is needed to be retrofitted.
In addition to the high maintenance costs, there have been one to two major bridges collapse every year for each of the last eight years in Indonesia. For instance, Tenggarong bridge in Kutai on 2011, Cidua bridge in Bogor on 2012, Bangbayang bridge in Garut on 2014, Serang bridge in Banten on 2014, Lebak bridge in Banten on 2015, Bengkulu bridge in Bengkulu on 2016, Klungkung bridge in Bali on 2016, Tanipah bridge in South Kalimantan on 2017, Widang bridge in East Java on 2018 [
3,
4,
5]. These bridges include reasonably newly built structures, recently retrofitted facilities, and old bridges that have served their service life.
High bridge maintenance costs are not unique to Indonesia, e.g., existing infrastructure in Australia is requiring substantial additional funding for maintenance, renewal, and upgrade with growing population. Australian bridges that were built decades ago are now subject to an additional load of about 5.6% annually. The annual maintenance expense for the 33,500 bridges in Australia is around
$100 million, and the replacement cost of deficient bridges is estimated to run into billions of dollars [
6].
Degradation of concrete bridges happens due to overweight vehicles, corrosion of the reinforcement, increasing volume of traffic, and natural events such as earthquakes and tsunamis. Periodical assessment is therefore required to predict the service life prediction of the bridges. The main reasons for the collapse of the bridges are the overweight vehicle, corrosion, and inadequate maintenance practices. These are some of the new challenges to overcome when designing reinforced concrete (RC) bridges. Excessive cracking and displacement under service load and even failure of structure can happen as a result of the time-dependent reduction in strength and stiffness of concrete.
Creep, shrinkage, and relaxation can increase the deflection of the structure significantly over time. Extensive research in this area has been conducted since the 1970s. This includes experimental work on the effect of creep (time-dependent deformation) to the crack of the plain concrete [
7] and high strength concrete [
8]. The American Association of State Highway and Transportation Officials (AASHTO) [
9] included creep, shrinkage, and relaxation to obtain the total deformation of the member. Moreover, flexural creep tests were conducted on partially damaged concrete specimens [
9] and beams of various sizes [
10]. The inclusion of creep in the deflection calculation is crucial since the time-dependent deformation can induce microcracks. Hence, it will reduce the capacity and the service life of the structure.
Sea freight is the dominant means to deliver the goods internationally, and this is particularly true in Indonesia since it consists of thousands of islands, local sea freight has taken up to 90% of the local goods distribution. Seaports are critical to the Indonesian economy any downtime due to failure of critical infrastructure would cause significant economic loss. Moreover, once a seaport is damaged, it will usually take a long time to restore [
11]. For instance, the 1995 Kobe earthquake severely damaged numerous ports, and it caused long-term economic loss in Japan. Moreover, the closure of the ports in Haiti [
12] and Andaman [
13] caused access difficulty in delivering relief supplies.
Liquefaction and poor soil conditions are the main external factors affecting the seismic performance of the seaport’s structures. Moreover, substandard design and lack of routine maintenance are also other main factors affecting the structures’ performance of the seaports. When subjected to earthquakes or other unlikely events, these structures can be more at risk of collapse. For instance, the corrosion of the steel reinforcement, poor detailing, and deficient shear reinforcement become the main factors causing the damages of the structures supporting piles during the 2004 Sumatra earthquake in Andaman Islands [
13].
The main cause of deterioration in structural concrete exposed to the marine environment is the chloride penetration in the concrete. This phenomenon is strongly contingent on properties of concrete such as water content and porosity of the concrete cover. When conducting structural health assessment and durability diagnosis, non-destructive testing (NDT) of concrete cover provides important information about the condition of the concrete and is an indicator of durability. The authors have previously suggested a hybrid use of different types of NDT equipment in assessing in situ concrete such as that for concrete cover measurement and locating the arrangement of the reinforcements, air permeability, electrical resistivity and the half-cell potential [
14].
The existing condition of ports structures located in Indonesia has been subject of recent investigation. Several RC bridges of a high level of importance were investigated such that different exposure conditions and ages of structures could be investigated. This research specifically focused on the effect of corrosion and overweight loads on the bridge structural elements.
This paper presents the analysis of the precast reinforced concrete (RC) bridge located in Terminal Peti Kemas (TPS) Surabaya (Indonesia). The bridge connects the berth and the port with the hinterland and is a critical element for the transport of goods. Nine T-beams were integrated into a monolithic structure through a cast concrete slab on top of the beams. The resulting monolithic behavior increases the stiffness and capacity of the bridge over the simple sum of restraint provided by the T-beams, especially for point loads. Frequently bridge investigations do not fully consider the group effects when predicting deflections since the loading is assumed to be uniformly distributed. Effectively the analysis reverts to that of a single T-beam instead of the integrated analysis of a group of beams [
15,
16]. This study considers such group effects and has considered specific axle loads as well as the uniformly distributed such as self-weight. Influence lines were used to obtain the location of the maximum deflection and moment subjected to a moving truck.
The bridge was surveyed at two stages. The first stage involved field measurements performed 26 years after its construction and measured deflections prior to and after retrofitting works were undertaken. The company conducting the retrofitting works conducted the field survey to obtain the deflection. The second stage involved the use of NDT performed when the structure was 34 years old. This investigation focused on the initiation and propagation of cracks and corrosion [
17]. The NDT testing was conducted to determine the carbonation rate which combined with deflection data allows estimation of the service life of the structure. Four types of NDT equipment were used, and measurements were taken to obtain the concrete cover, concrete compressive strength, air permeability (related to carbonation rate and initiation time of corrosion) and electrical resistivity (related to corrosion rate or propagation time). Additional details of the NDT and results have been previously reported by the authors [
17]. Both carbonation and corrosion propagation rate were defined as a basis for determination of the total service life of the beams.
This research uses fiber element analysis to predict the behavior of the beam due to self-weight only. Moreover, finite element analysis is used to predict the deflection of a group of parallel beams under self-weight and wheel loading. Influence lines are incorporated into the finite element analysis to determine critical wheel-load patterns. Initially, the analytical results were compared to those obtained from the field measurements and then the model was extended to understand the influence of the addition of carbon fiber reinforced polymer (CFRP) layers used in the retrofitting works. Fiber element analysis is used to predict the non-linear behavior of RC sections [
18,
19]. The RC sections are divided into several discretized element and the behavior of each element is evaluated according to the predefined stress-strain relationship of each type of material This provided information on the levels of corrosion, and influence of specific vehicular loads on the behavior of the beam. Ultimately, the total service life of the bridge was estimated by using the additional information obtained from the NDT. This information is very useful for the stakeholder to make a strategic decision to maintain the performance of the bridge over its service life.
2. Case Study
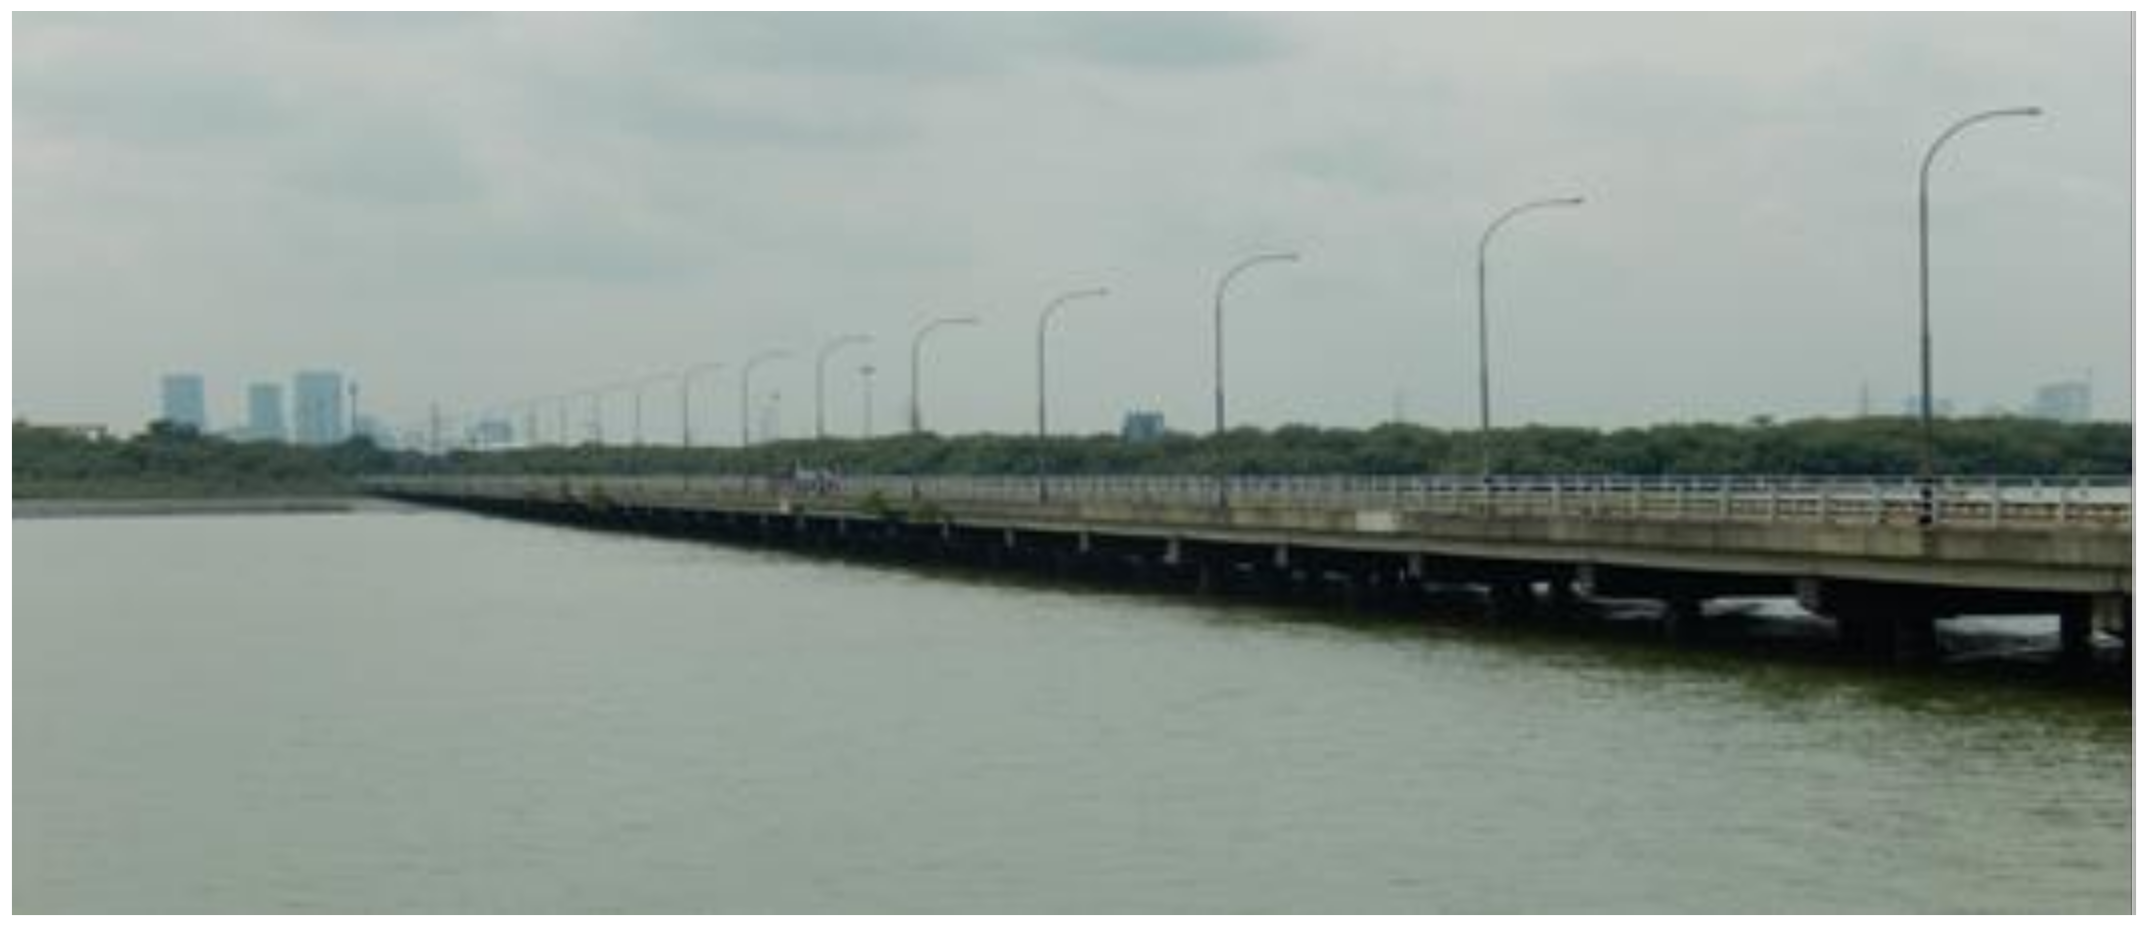
The RC trestle bridge at Terminal Peti Kemas (TPS) in the seaport of Tanjung Perak, Surabaya, Indonesia, is mainly used by trucks to transport the containers to and from the berth. The Port of Tanjung Perak is the busiest port in Indonesia. Hence, the failure of this bridge should be prevented to avoid a significant economic loss to the country due to the downtime period.
Figure 1 depicts the view of the RC bridge in TPS from the domestic harbor. The bridge consists of 100 spans with a length of 15 m for each span [
20]. Each span is simply sitting on an RC cross beam through a rubber bearing. Ultimately, the cross beam is supported by three circular steel piles which are protected with anti-corrosion wrap.
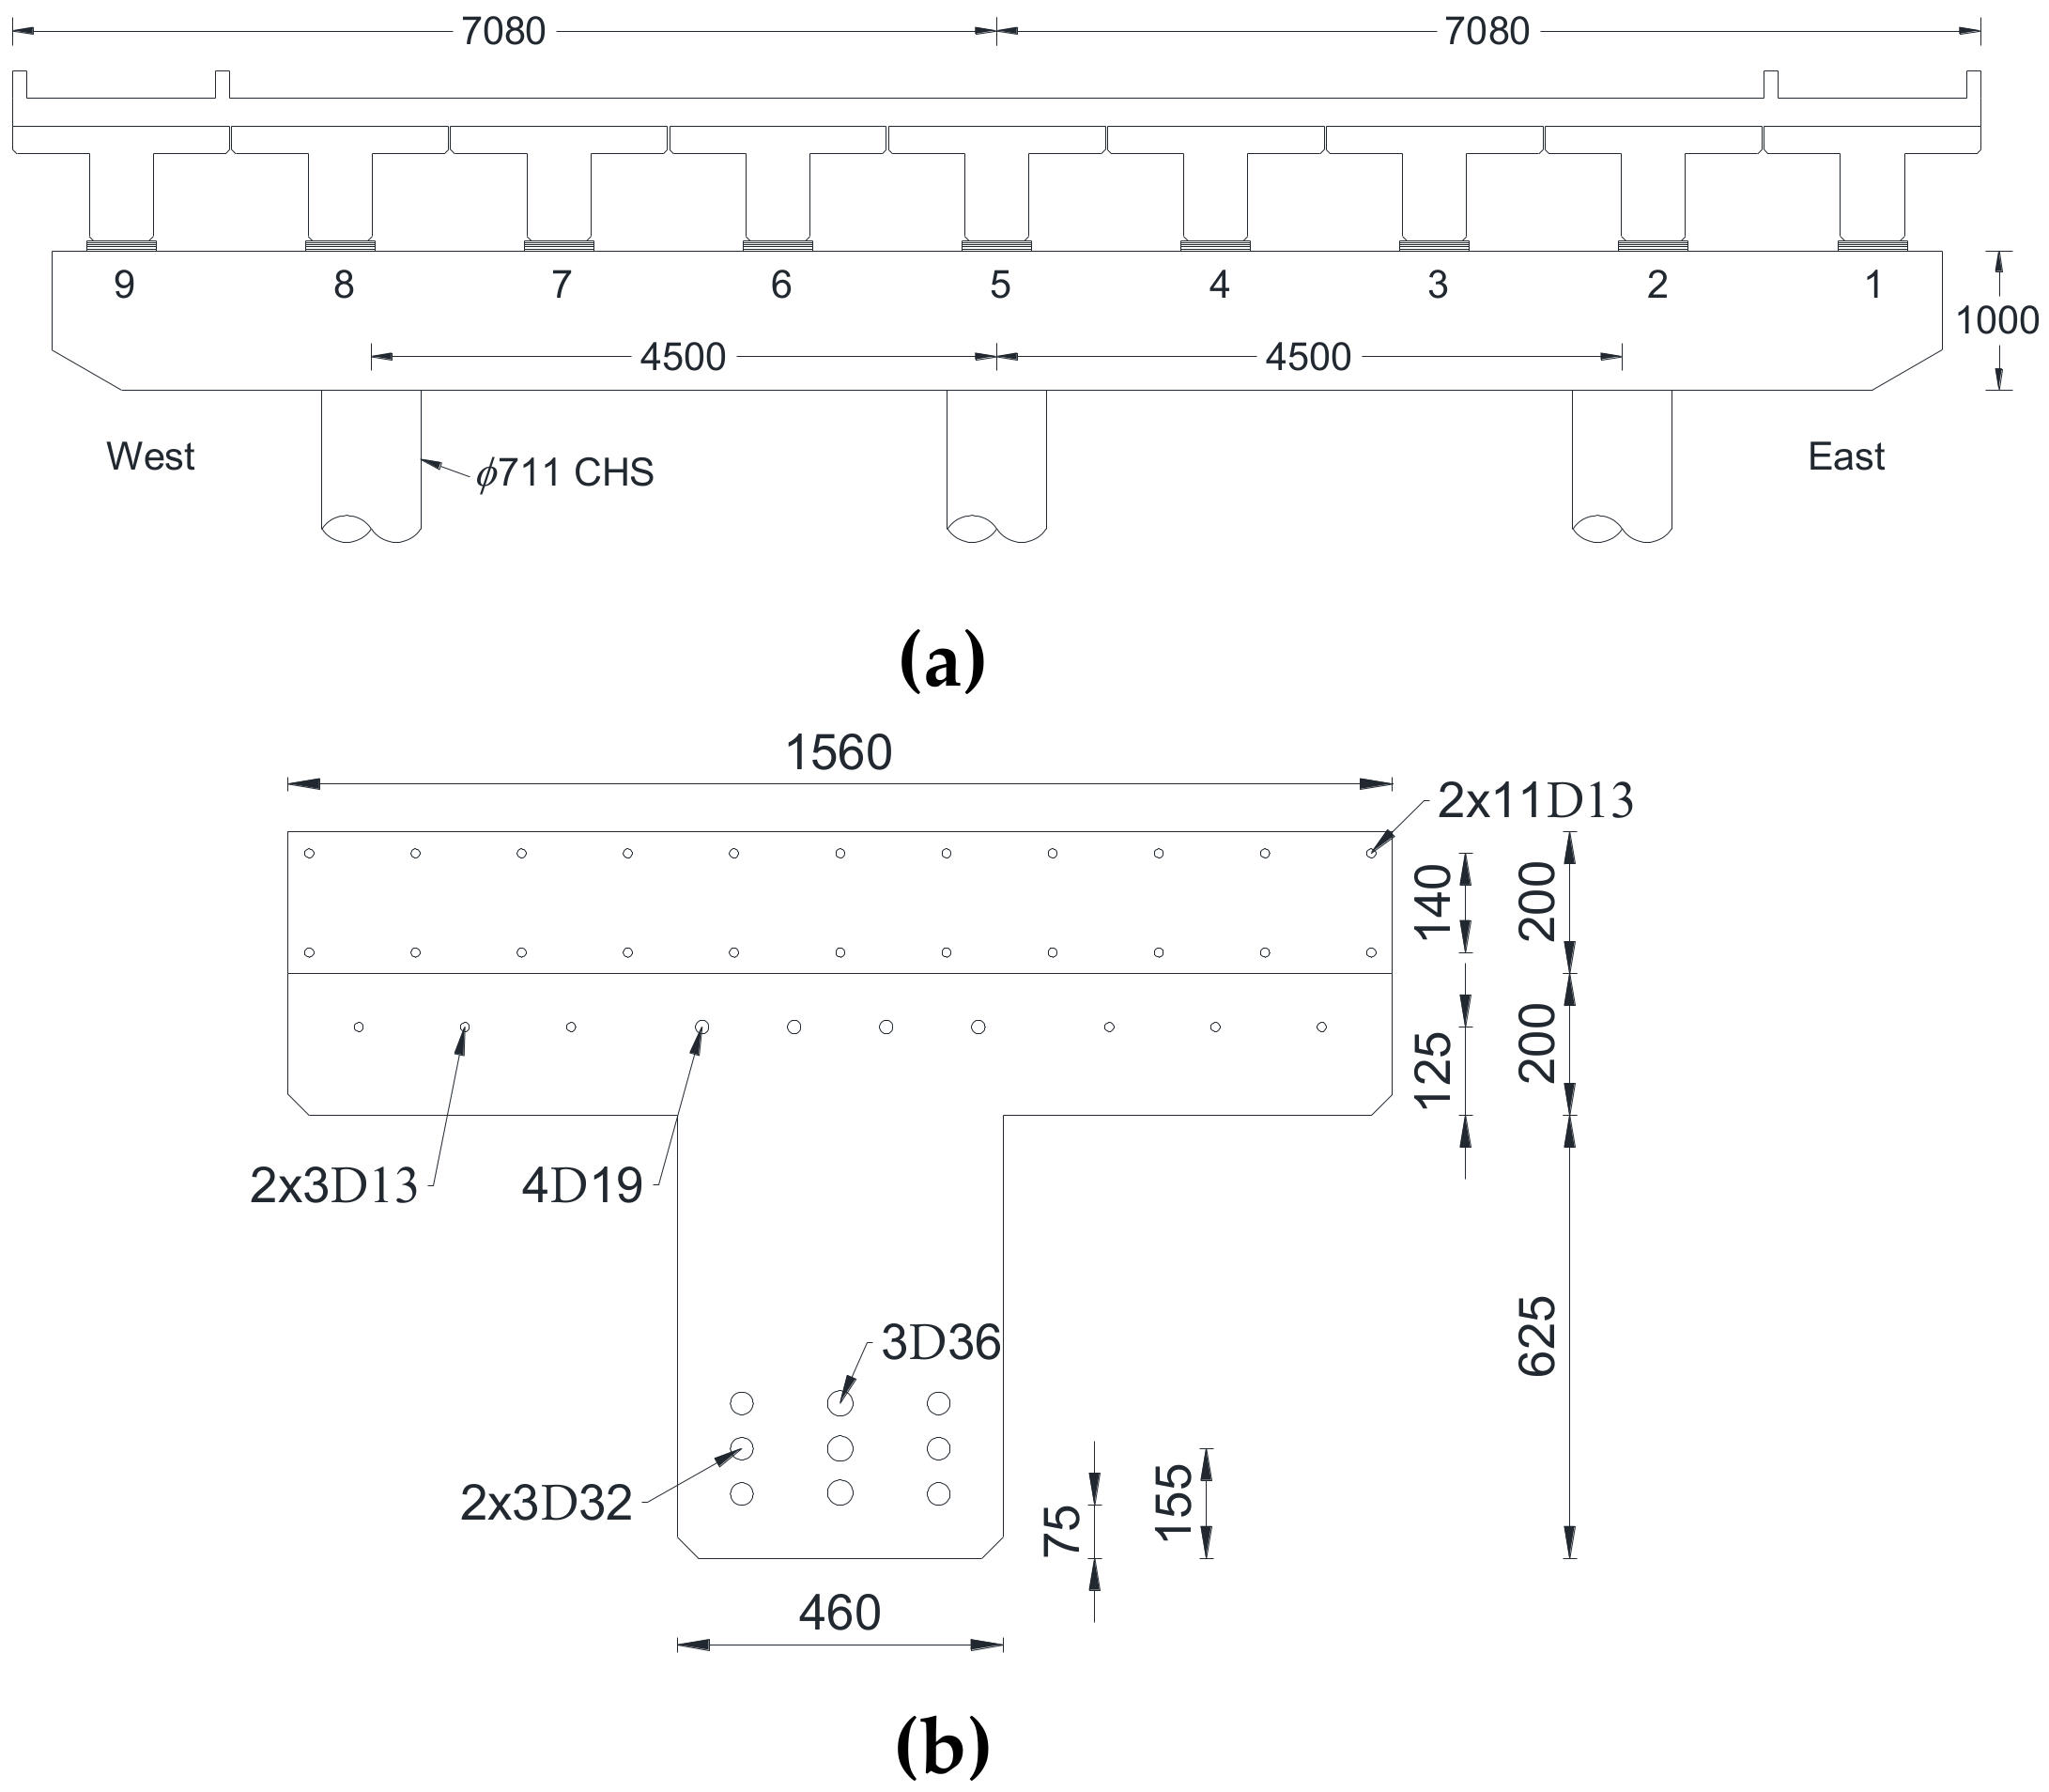
Figure 2 depicts the typical cross-section of the bridge, including the details of the RC deck beam (adapted from BGA [
21]).
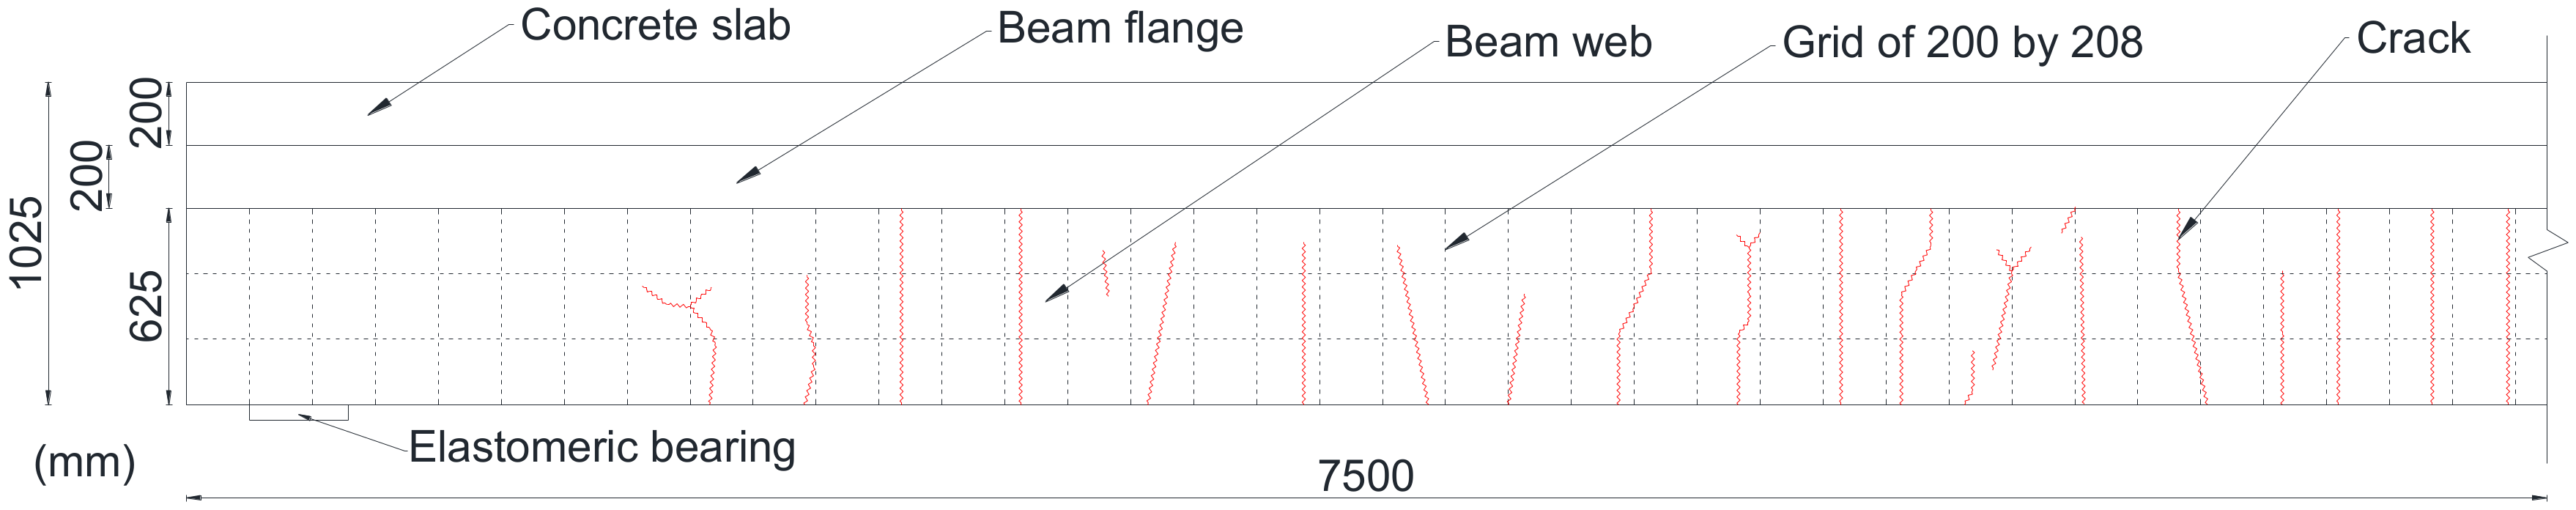
From the as-built-drawings, a design compressive strength of 40 MPa was obtained for the concrete. The yield and ultimate strength of 400 and 500 MPa for the main rebar and 250 and 320 MPa for the stirrups were also obtained from the as-built-drawing. The bridge is approximately 26 years old at the time of the first inspection in 2010. The cracking moment capacity of the cross-section of one T-beam is approximately equal to 400 kNm. However, the self-weight of the T-beam itself generates a moment of approximately 640 kNm. Moreover, a maximum truckload of approximately 48 tons distributed to two front wheels and two back wheels were used to observe the additional deflection of the beam. The distance between the front and the back wheels is approximately equal to 10 m. Hence, to simulate the worst-case scenario, either front wheel or back wheel will be positioned in the middle of the span. It will be equivalent to approximately 118 kN point load for each wheel with a track distance of 1.8 m, as shown in Figure 7. The service load (G + 1.15Q) exceeded the cracking moment capacity, and hence a lot of cracks were observed before the retrofitting work in 2010, as shown in
Figure 3. Further work was accomplished in
Section 3 to observe the group effect of the beams.
The T-beam was repaired in 2010 by grouting the cracks to protect the steel reinforcement from direct contact with the environment, which can cause corrosion. In addition, two strips of CFRPs Sika CarboDur type S10–12 was added along the bottom of the T-beam [
21]. One strip of CFRP has a width and a thickness of 100 and 1.2 mm, respectively. Therefore, the total cross-sectional area for two carbon fiber strips is equal to 240 mm
2. Moreover, it has a tensile strength of 2800 MPa and Young’s modulus of 165,000 MPa.
3. Fiber Element Analysis and Finite Element Analysis
Both fiber element analysis and finite element analysis were performed to observe the behavior of the cross-section of individual T-beam and the group behavior of the T-beam, respectively. Response 2000 developed in the University of Toronto [
22] was used to perform the fiber element analysis of the cross-section of individual T-beam due to the self-weight. In this case, there is no group effect since the self-weight of the beam is uniformly distributed throughout the slab.
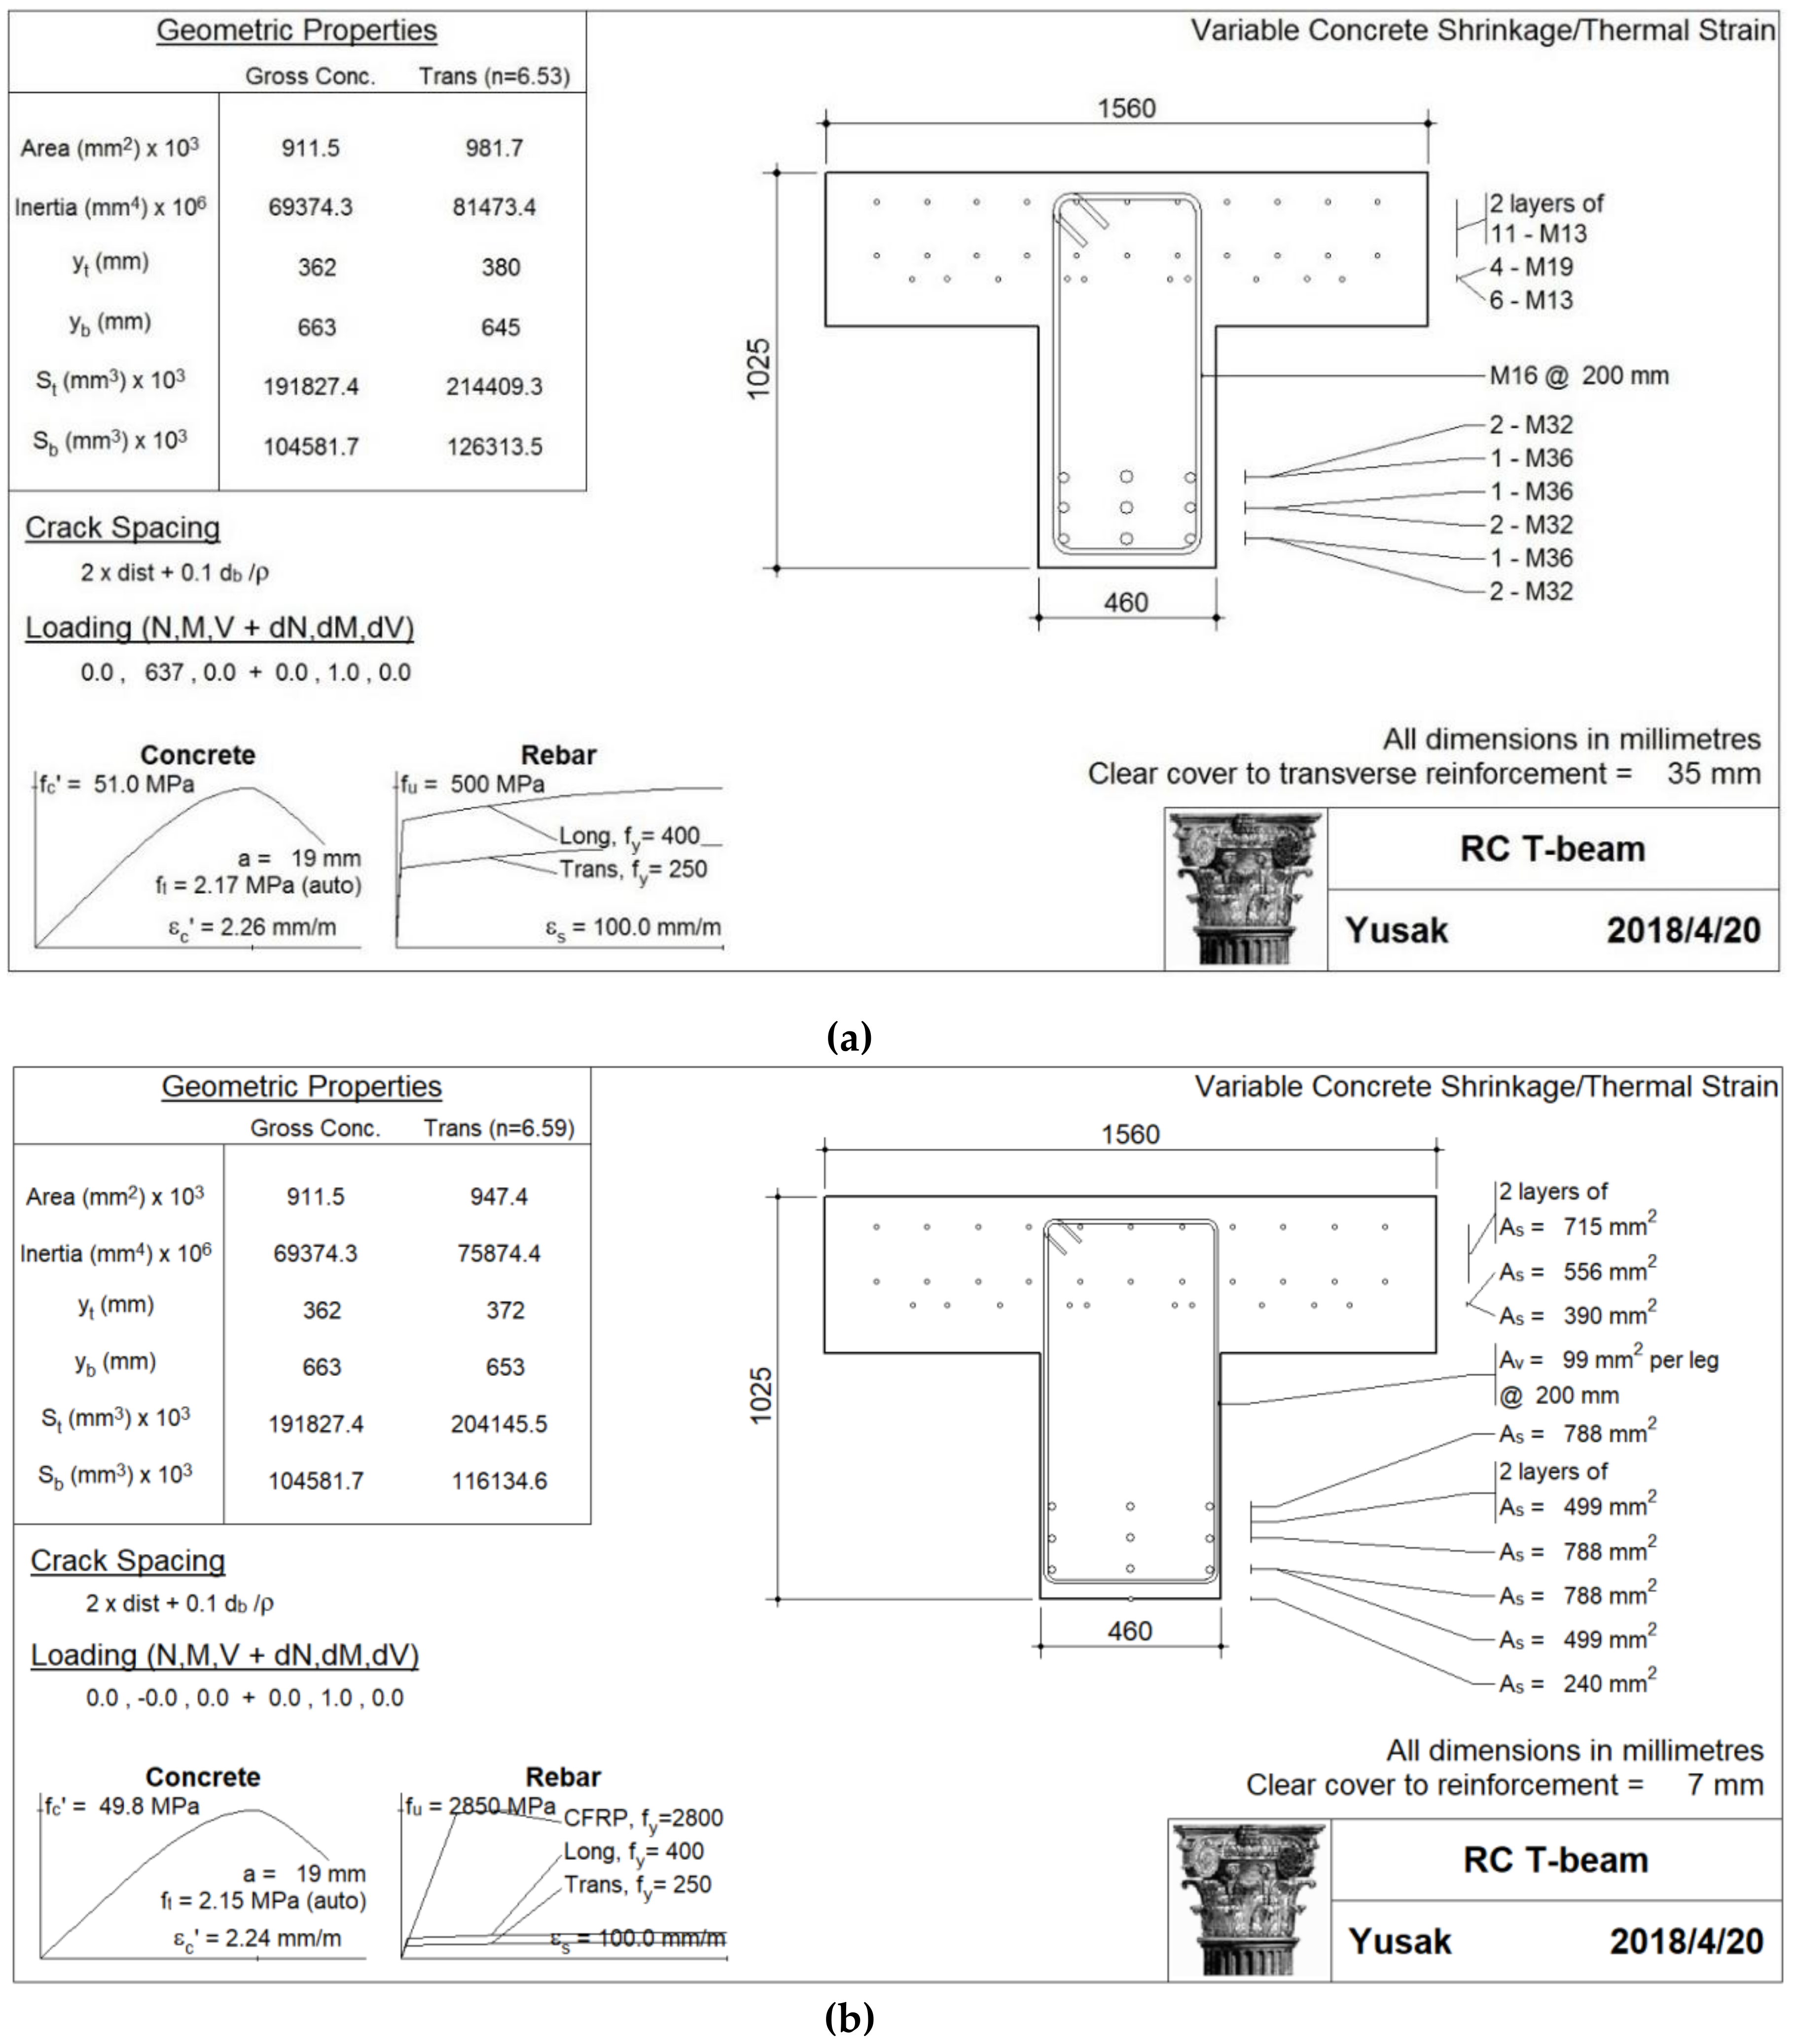
Figure 4a shows the input used to model the RC T-beam using Response 2000 following the details shown in
Figure 2b. In case of the beam that is reinforced with CFRP, an additional steel reinforcement at the bottom of the beam with an area of 240 mm
2 was added as shown in
Figure 4b. The stress-strain relationship of the concrete under compression was modelled using the modified base curve proposed by Popovics and Collins [
23,
24]. The compression stiffening for RC subjected to shear was modelled based on the work done by Vecchio and Collins [
25]. Moreover, the tension stiffening of the concrete was modelled following Bentz [
22] to consider the tensile resistance of cracked concrete. The concrete compressive strength obtained from the NDT measurement was used instead of using the value obtained from the as-built-drawing. This is equal to 51 and 7.6 MPa for the mean and the standard deviation of the concrete compressive strength. However, the yield and ultimate strength of the reinforcement (both for stirrups and the main rebar) still follow the value stated in the as-built-drawing due to limited information. The stress-strain relationship for the steel follows the default model suggested in Response 2000 by assuming the strain at strain-hardening and at rupture of 2 mm/m and 100 mm/m, respectively. For the CFRP, strain at strain-hardening and rupture of 17 mm/m and 35 mm/m, respectively, were used. This model can capture the elastic, post-yield plastic, and strain-hardening behavior of the steel.
As mentioned previously, when time-dependent deflection was considered, the creep and shrinkage model suggested by AASHTO [
9] was incorporated.
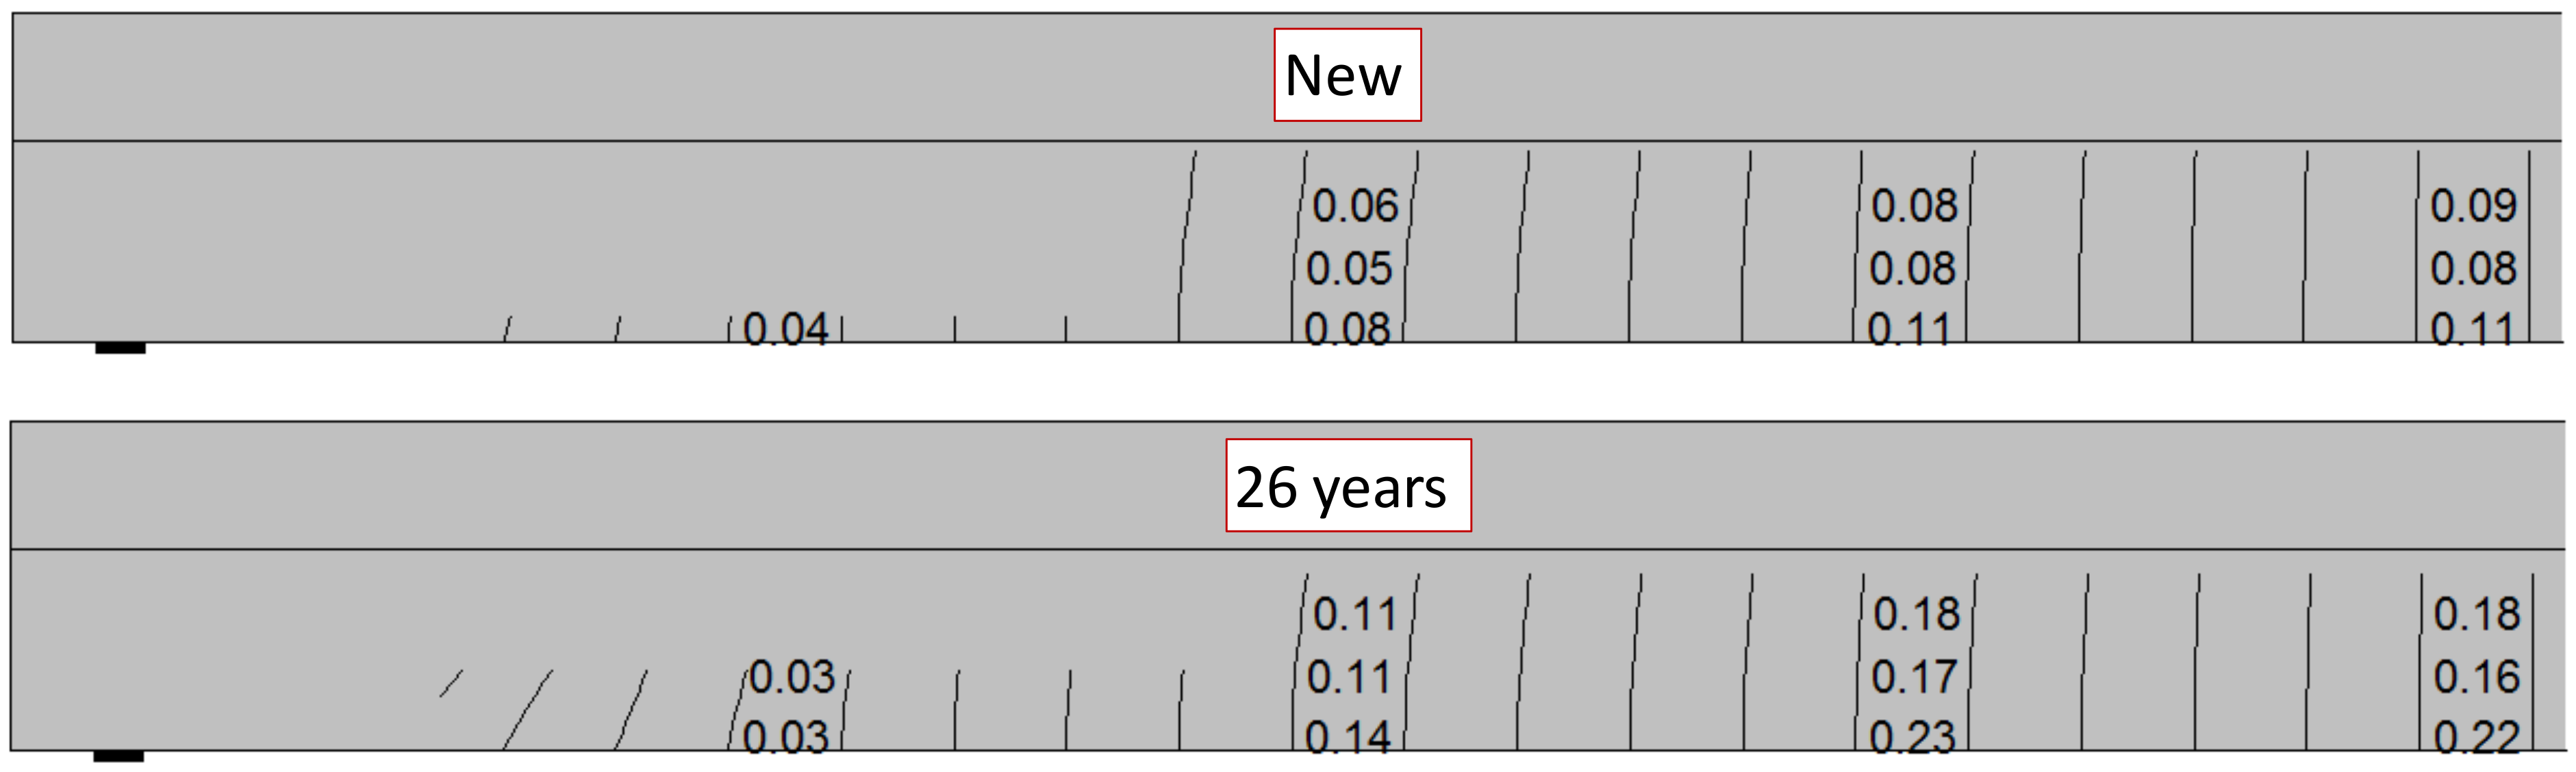
Figure 5 shows the crack distribution along the beam prior to the retrofitting work due to only the self-weight, which agrees well with the field observation shown in
Figure 3. The figure displays the difference of the crack distribution and deflection between the newly built and the 26-year old bridge.
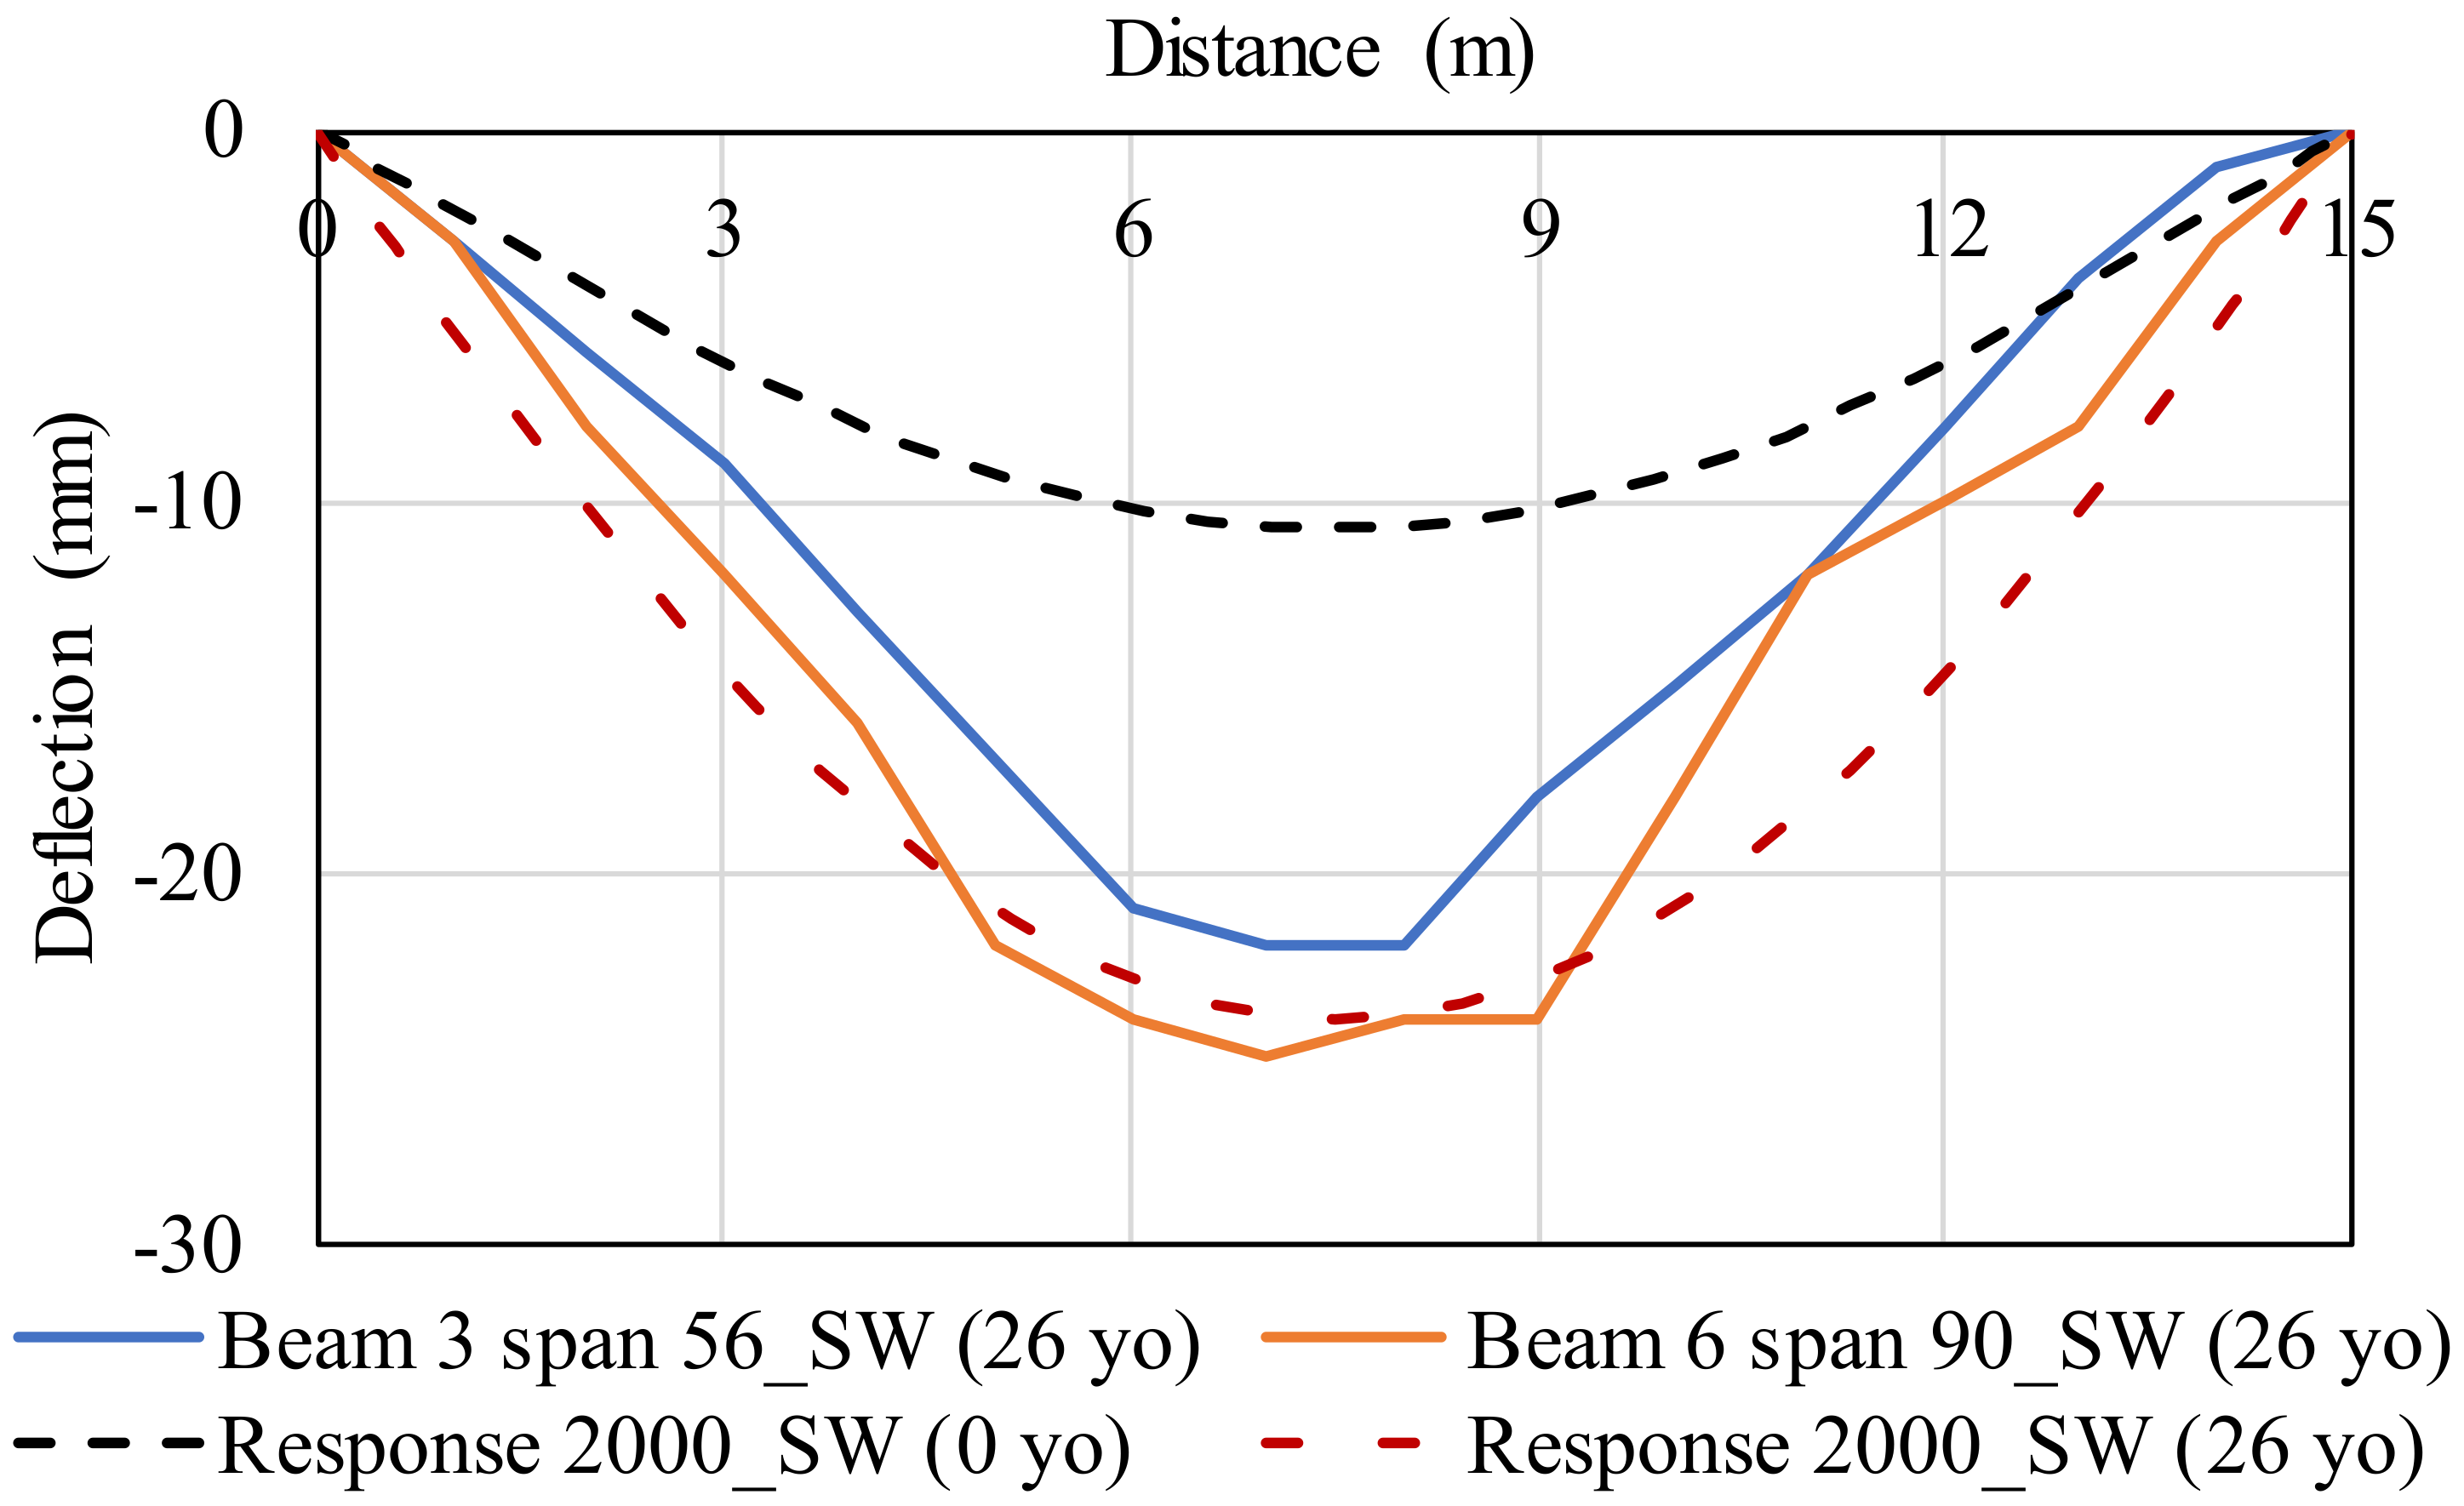
Figure 6 shows that the deflection predicted by Response 2000 also agrees well with the field measurement on two different beams with an error of 1 and 10% for Beam 6 and Beam 3, respectively. Please note that there were only two beams (beam 6 and beam 3) used in the field test. The result shows that AASHTO [
9] model was reasonably accurate and conservative to be used to include the effect of the creep, shrinkage, and relaxation. Moreover, it is also shown in
Figure 6 that by taking the creep for 26 years into account, it will increase the maximum midspan displacement due to self-weight to approximately 2.3 times of the immediate deflection.
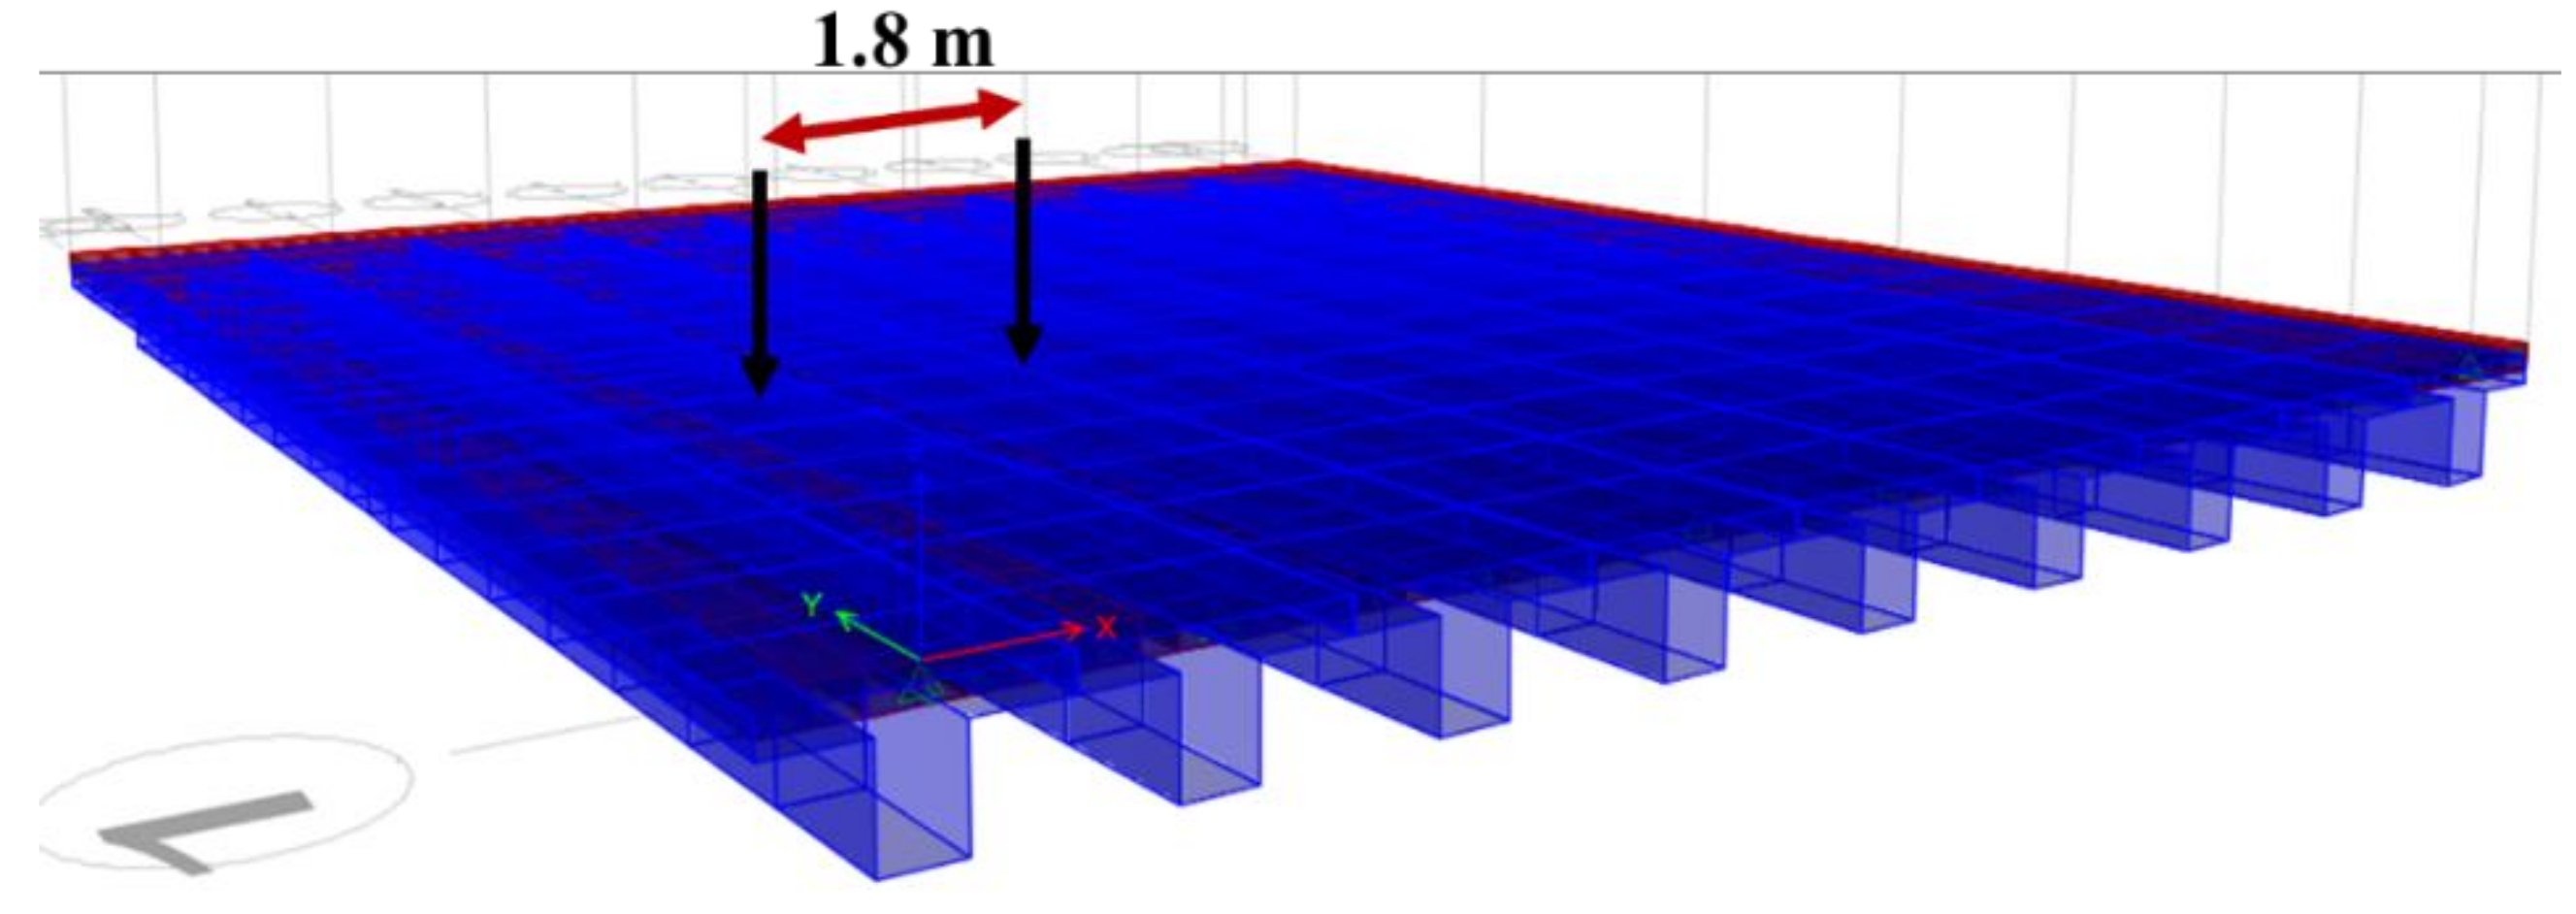
From the influence line theory, it is expected that the maximum bending moment and deflection of a simply supported beam will occur at the midspan due to the moving load either from the front or back wheel of the truck. Since the bridge provides two-way access, the worst case will be from two pairs of wheel load from the trucks when they are passing each other. However, during the field measurement, there is only one truck passing the observed span each time, and therefore, only one pair of wheel load will be acting in the middle of the span. In this case, analysis of a group of T-beams instead of the individual beam was performed, since the beam will act together as a group to carry the wheel loading from the truck. This was achieved by modelling a group of nine T-beams in one span using finite element software ETABS v13.2.2 [
26] as shown in
Figure 7 which shows that the bridge is subjected to front wheel loading of 2 × 118.21 kN (1.8 m apart) along the midspan. The back wheel was not modelled since it was acting on top of the adjacent span. As mentioned previously, and influence line analysis in the transverse direction was performed to obtain the most critical location of the wheel, which generates the maximum bending moment of the observed beam. The observed beam is beam number 4 from the left (refer to
Figure 7) or beam number 6 (refer to
Figure 2a) in span 90. From the finite element analysis (FEA), the most critical location of the wheel, which will generate the highest bending moment at beam 6, will be at 3.15 m and 4.95 m from the center of Beam 9 (refer to
Figure 2a). With a good match of the deflection due to the self-weight of the beam between the field measurement and Response 2000, the material properties of individual T-beam obtained from Response 2000 (such as the unit weight of the RC beam and slab and the effective flexural stiffness,
) were used in the group analysis. This was accomplished to represent the actual behavior of the beam.
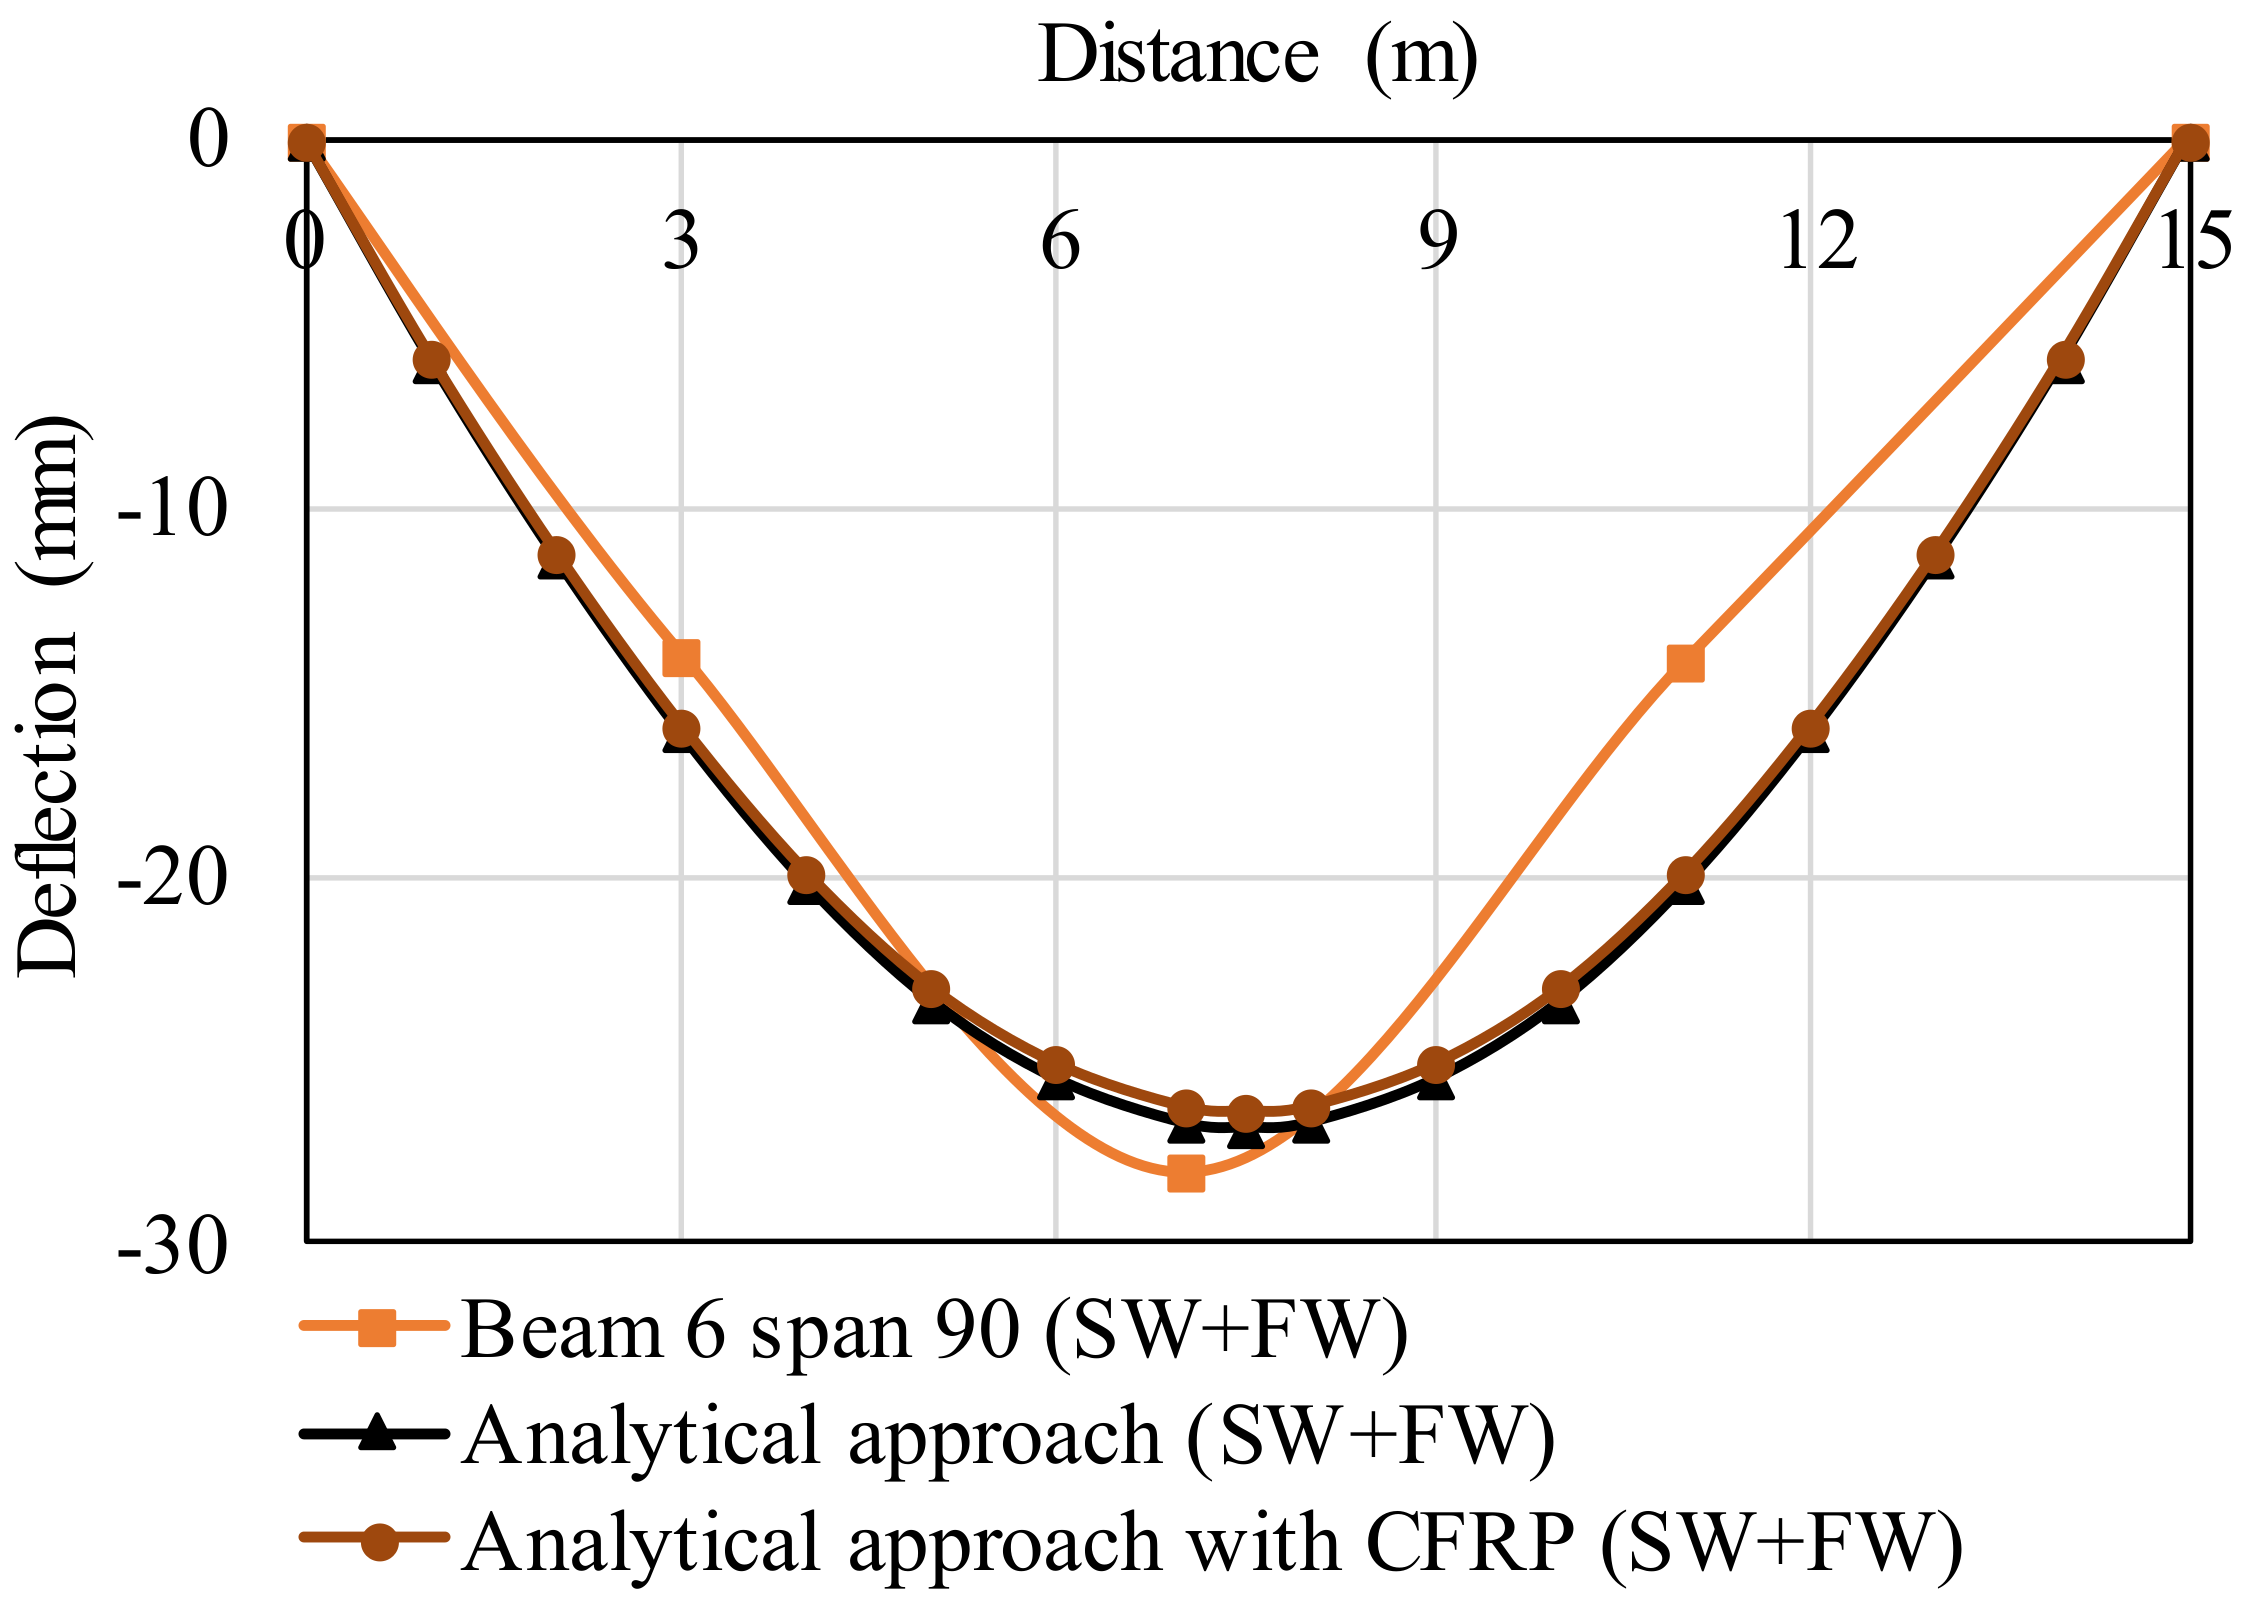
Figure 8 shows the comparison between the deflection obtained from the field measurement and that obtained from finite element analysis package ETABS v13.2.2 by using the material properties obtained from RESPONSE 2000. It is shown that the result obtained from the FEA agrees well with those obtained from the field measurement. The additional moment due to the front wheel load at the critical location is approximately equal to only 200 kNm. This value is approximately equal to 46% of the maximum moment generated at the midspan of individual T-beam subjected to a one-point load of 118 kN. It means that the group effect can reduce the maximum moment due to the wheel up to 54% compared with the case of individual T-beam. It is shown in
Figure 8 that the maximum deflection due to the combined long-term self-weight and the wheel load is approximately equal to 27 mm from the analytical approach and 28 mm from the field measurement. This maximum deflection at service is still less than the limit of the span on 480, which is equal to 31 mm. The discrepancy observed in deflection of Beam 6 is expected. It can be traced back to error sourced from the measuring devices, and, possibly the exact location where the deflection is measured is slightly off.
6. The Service Life of the T-beam
There is a time gap of approximately 26 years prior to the repair of the T-beam, which may have caused the rebar to corrode. Therefore, NDT was conducted in 2018 to understand the initiation and propagation time required for the corrosion to take place. The initiation time is the time required for concrete cover to carbonate, which will initiate the corrosion at the rebar. However, the propagation time is the time required for corrosion to propagate and corrode a certain part of the rebar. Ultimately, the total service life of the T-beam is calculated by summing up the initiation time and the propagation time.
The results of the NDT measurement have been reported elsewhere [
17]. The NDT tests were meant to be non-destructive and non-intrusive. The equipment, however, has been extensively tested under laboratory and outside environments [
14]. In summary, the average electrical resistivity of the concrete cover in the painted web is 374.3
which is higher than the unpainted surface at the flange. It means that simply by painting the surface, the electrical resistant of the concrete cover can be increased. Considering the low probability of exceedance of 5%, the electrical resistivity of the painted web is equal to 305.9
This value is still much higher than the limit for low corrosion rate of 20
This electrical resistivity can be converted to the corrosion rate by using the equations proposed by Andrade and Alonso [
32] which is equal to
when uniform corrosion is assumed (
and
when localized corrosion at midspan is assumed (
If the level of corrosion of 30% is used and given that the main rebar at the bottom web has a diameter of 32 mm, the time required for corrosion to propagate is approximately 2390 years and 480 years for uniform and localized corrosion, respectively. If the level of corrosion of 47% is used for the same rebar diameter, the time required for corrosion to propagate is approximately 3800 years and 760 years for uniform and localized corrosion, respectively.
Moreover, carbonation rate can be estimated by the equation proposed by Kropp and Hilsdorf [
33] which requires the value of the coefficient of air permeability
and the depth of the carbonation
The depth of the carbonation is assumed to be equal to the thickness of the concrete cover. The average kT value for the painted web is equal to 0.624 × 10
−16 m
2, which is smaller than the value for the unpainted flange. Again, it shows that the painted surface can provide a protection for the concrete from the carbonation. The average kT value obtained for the painted web corresponds to an initiation time of 890 years.
The service life of the T-beam can be estimated by considering the different level of corrosion and the weight of the vehicle. During the normal condition, i.e., maximum loading is as per the suggested value in the standard, the total service life of the T-beam can be estimated up to the level of corrosion of 30%. Therefore, the total service life is ranging from 1370 years for localized corrosion and 3280 for uniform corrosion. It should be noted that this estimation assumes that there are no cracks in the concrete. Once a crack occurs, as is the case in the existing bridges, the thickness of the concrete cover decreases and hence will reduce the initiation and propagation time of the corrosion that ultimately will reduce the total service life of the beam.
For instance, when the crack has reached the rebar, the initiation time should be assumed to be zero. Hence, the propagation time required to achieve a localized corrosion level of 30% is 480 years. Please note that the degree of corrosion may be limited to 19% if there is an increase in the weight of the truck by 20%. Therefore, the propagation time required to achieve a localized corrosion level of 19% is 280 years. It means that the stakeholders such as asset owners and port authorities must regularly inspect the bridge to ensure that there is no crack in the beam due to the overweight of the vehicle, earthquake, or differential displacement of the foundation. The interval of the inspection is typically three years. Moreover, the performance of the bonding material between the carbon fiber and the concrete should also be checked periodically.
Considering only creep and shrinkage according to AASHTO [
9], the total service life of the beam can be estimated by setting the maximum deflection at service to be span on 480 and changing the duration of the sustained loading. It was obtained that by further increasing the duration of the sustained loading to be larger than 26 years (it was tried up to 3000 years), the effect of creep and shrinkage seems to be similar to that at 26 years. It means that serviceability limit state (SLS) will be satisfied during the total service life of the structure and hence, ultimate limit state (ULS) will govern the design. This information is very useful for the stakeholder to make a strategic decision to maintain the performance of the bridge over its service life.
7. Conclusions
A high importance precast RC T-beam located in Terminal Peti Kemas (TPS) Surabaya was assessed 26 years after construction and then 34 years after construction to understand its long-term performance. At 26 years, the bridge was retrofitted by grouting the cracks, painting the web, and adding two strips of CFRP. The deflection of the beam prior to and after the retrofitting work was measured. At 34 years, the bridge was assessed using NDT equipment to understand the resistance of this beam towards carbonation and chloride-induced corrosion.
FEA was performed to understand the effect of the creep and shrinkage due to the self-weight of the structure to the deflection of the beam. The results obtained from the fEA and the field work were in good agreement. Finite element analysis (FEA) was also performed to incorporate the group effects of the bridge since each span of the bridge consists of 9 T-beams connected each other with a concrete slab on top of the beam. Again, good agreement was obtained between the measured deflections (due to both self-weight and the wheel load) from the field observations and the FEA was also obtained.
A further parametric study was performed by using the model used previously by changing several important parameters, such as the effect of additional CFRP, the effect of different level of corrosion, and the effect of the different magnitude of wheel load. The results obtained from the NDT were used in conjunction with the analytical result to obtain the total service life of the structure due to the ultimate capacity of the girder. Moreover, the total service life of the structure due to the service load was also determined.
The main findings obtained in the parametric study and total service load determination were summarized as follows:
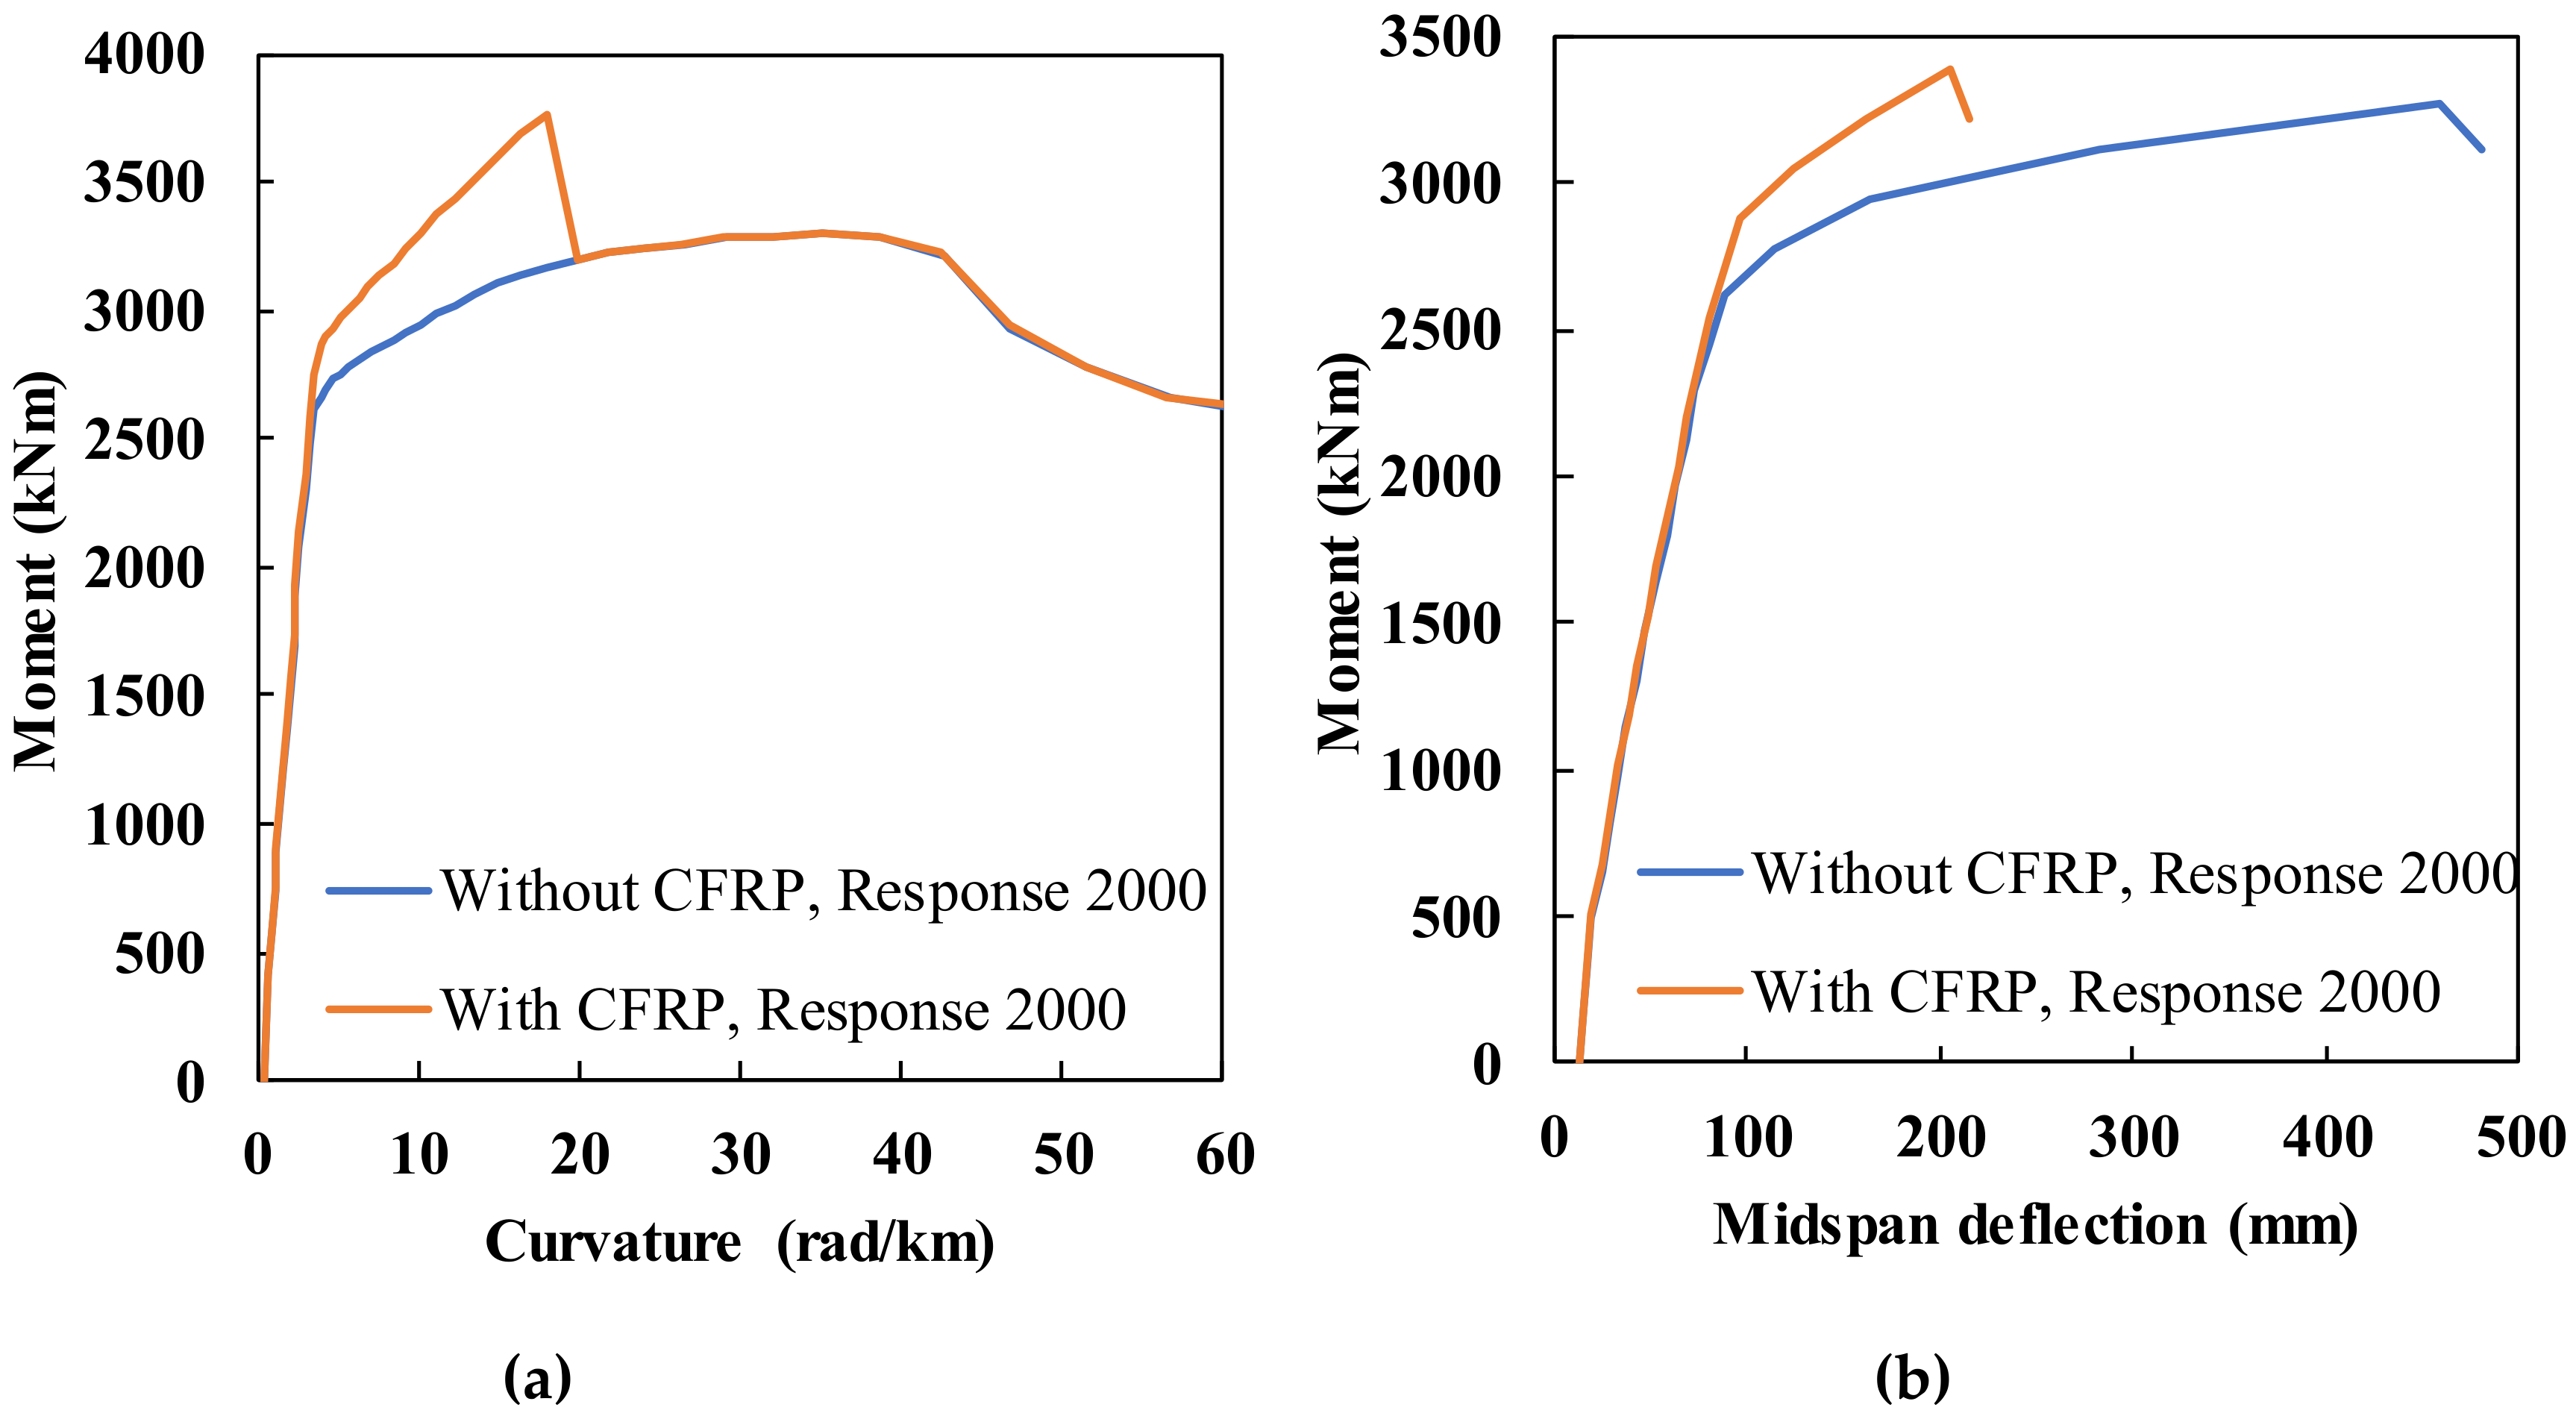
The addition of two strips of CFRP increases the member yield capacity of the beam by 11%. Once the CFRP yields and the cracks propagate, localized deformation of CFRP occurs, and hence it will accelerate the failure of the CFRP since the CFRP is quite brittle. Once the CFRP fails, the beam will also fail since the beam cannot carry the same amount of moment when it has the CFRP.
The group effect can reduce the maximum moment occurred in individual T-beam due to the wheel load from one truck by approximately 50%. By having two trucks (one truck from each direction), the maximum moment occurred in individual T-beam will be increased by 1.5 compared to the case with only one truck. Therefore, if individual T-beam is analyzed instead of a group of beams, then the maximum moment due to two trucks will be approximately equal to ; where is the maximum moment due to one wheel load at midspan of individual T-beam.
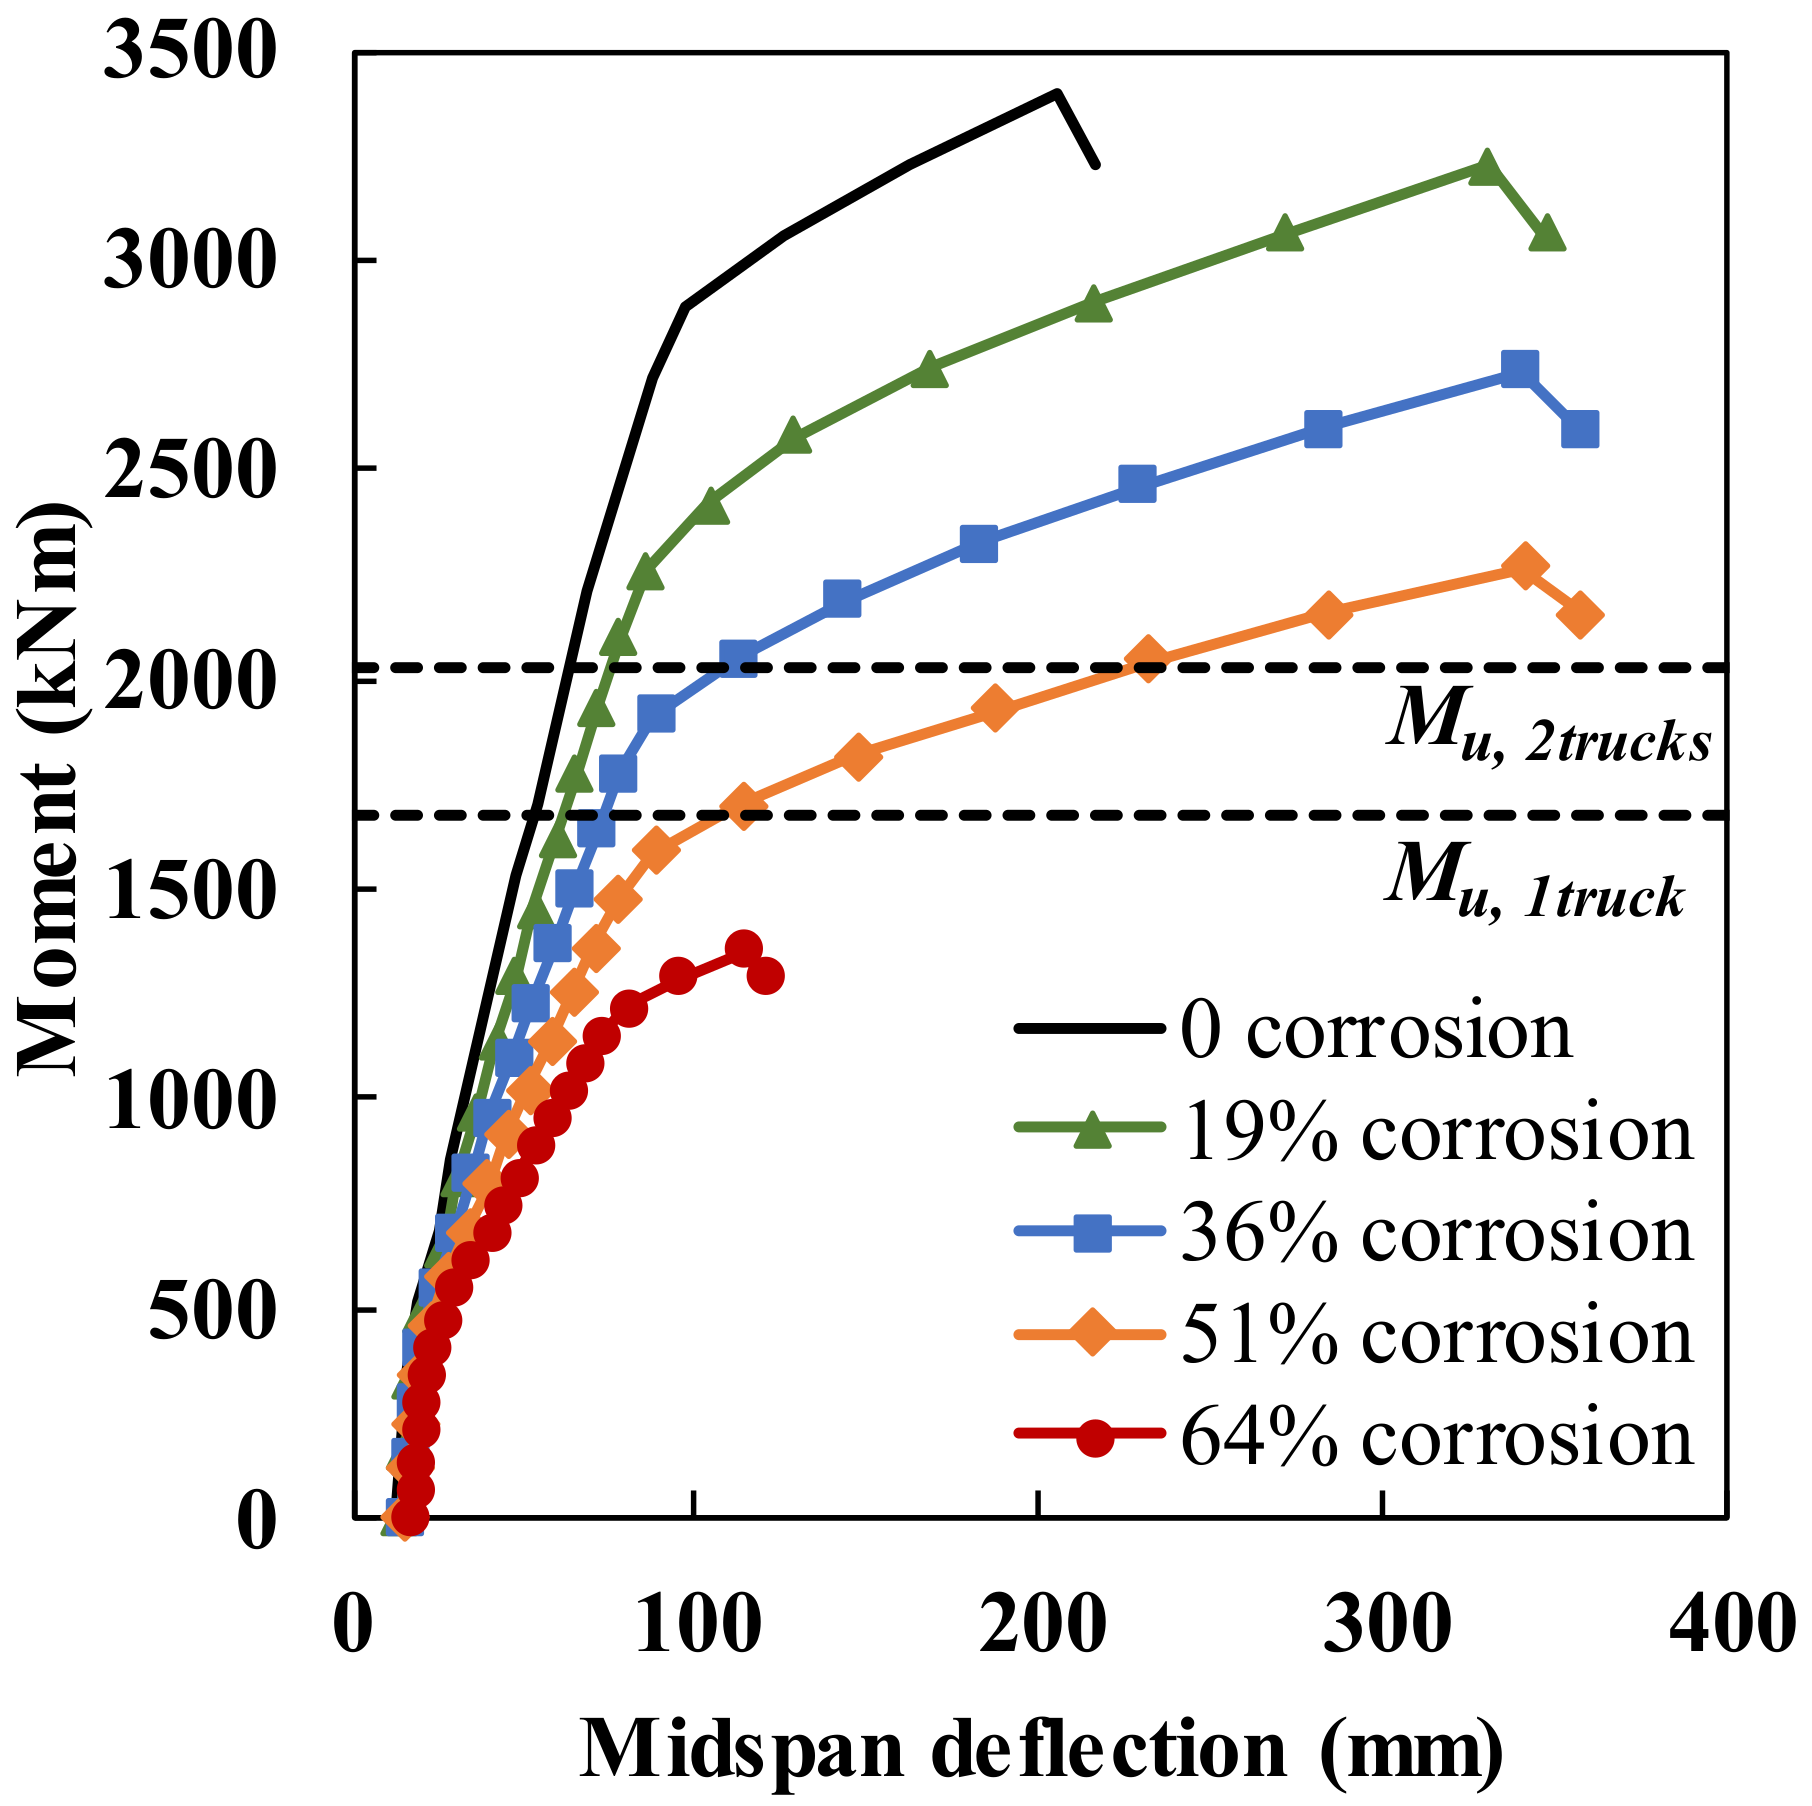
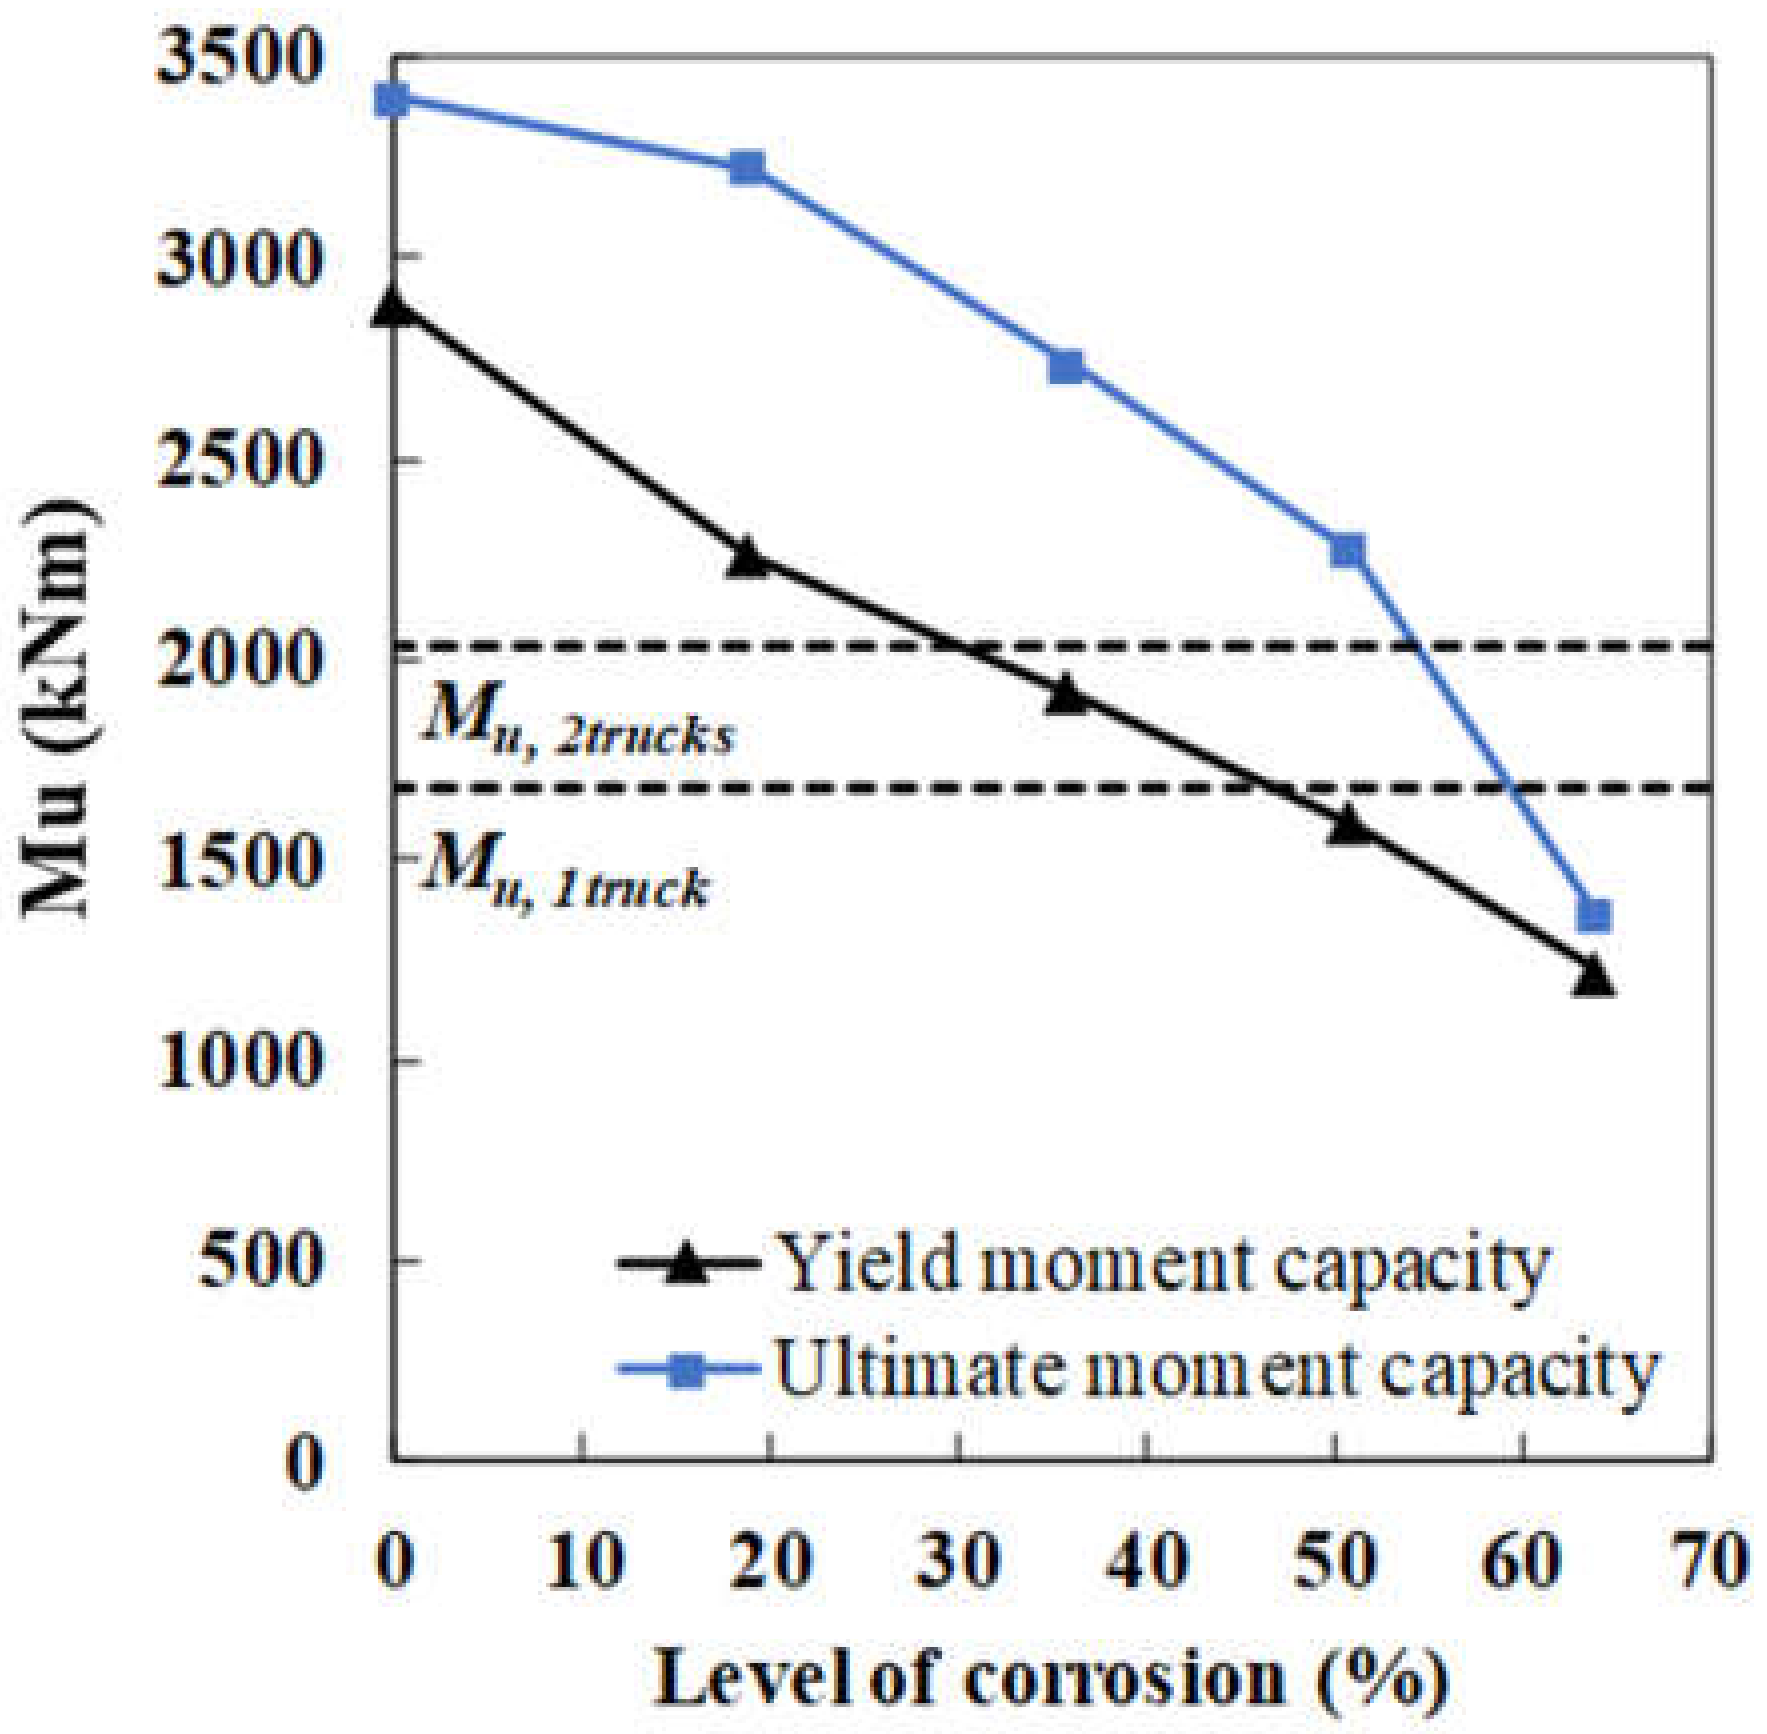
Corrosion reduces both the ultimate moment capacity and the stiffness of the beam after post the cracking moment. It is shown that the maximum level of corrosion that is allowed to occur is approximately 30% (by linear interpolation) considering the worst-case scenario (one truck from each direction passing the same span) and given the sufficient shear reinforcement is provided.
The effect of creep and shrinkage will not increase as the duration of the sustained load increases from 26 years to 3000 years. Therefore, if creep effect is constant throughout the entire service life of the structure is reasonable. In this study, the creep increases the maximum deflection due to the self-weight to 2.3 times the immediate deflection due to the self-weight.
Considering the worst-case scenario (one truck from each direction), the maximum wheel load can be increased to 1.8 of the maximum suggested value from the standard (144 kN) when there is no corrosion. Furthermore, the maximum wheel load can be increased to 1.2 times 144 kN when the level of corrosion is 19%.
The study reports on the service life of the structure. Assuming maximum wheel load on an uncracked beam and 30% corrosion level, the service life of the structure is estimated to be approximately 3280 years and 1370 years for uniform and localized corrosion, respectively.
The findings of the study highlight the importance of structural assessment based on the combination of condition assessment, structural analysis, and consideration of material properties as a strategy to improve the service life of the structure.


