Abstract
Research software is currently used by a large number of scientists on a daily basis, and everything indicates that this trend will continue to increase in the future. Most of this scientific software is very often developed by the researchers themselves, who usually make it available to the rest of the scientific community. Although the relationship between science and software is unquestionably useful, it is not always successful. Some of the critical problems that scientists face include a lack of training in software development, a shortage of time and resources, or difficulty in effectively cooperating with other colleagues. Additional challenges arise in the context of increasingly common cross-cutting and multidisciplinary research. This often results in the developed software and code being slow, not reusable, lacks visibility and dissemination, and in the worst cases it is defective and unreliable. Therefore, a multidisciplinary framework is needed to meet the demands of both scientists and software engineers and handle the situation successfully. However, a multidisciplinary team is not always sufficient to solve this problem, and it is necessary to have links between scientists and developers: software engineers with a solid scientific background. This paper presents the approach used in the framework of the PROTOCOL project, and more particularly in the development of its applied software, in which a tool for the characterization of climate agents has been developed. The main guidelines of the development process include, among others, modularity, distributed control version, unit testing, profiling, inline documentation and the use of best practices and tools.
1. Introduction
Scientific research at present is characterized by the application of new technologies. One illustrative example is the recent unveiling of an image of a supermassive black hole containing the same mass as 6.5 billion suns [1]. This was made possible by a global collaboration of more than 200 scientists using an array of observatories scattered around the world, acting like a telescope the size of Earth, called the Event Horizon Telescope (EHT). The telescope array collected five petabytes of data over two weeks. According to Dan Marrone, an astronomer and co-investigator of EHT [2], “The task of correlating huge amounts of data, sifting through the noise, calibrating information and creating a usable image was a very significant part of the project”.
While the work team was composed of astronomers, physicists, mathematicians and engineers, the development of the algorithms that made the image possible was led by Katie Bouman, a computer scientist [3]. It is worth mentioning that she had no experience studying black holes when becoming involved in the project, almost six years before the generation of the image. Now she is a postdoctoral fellow at the Harvard-Smithsonian Center for Astrophysics [4].
Researchers solve problems that are highly specific to their field of expertise. These problems cannot be solved by the straightforward application of off-the-shelf software, so researchers develop their own tools that are bound to their exact needs [5]. Thus, researchers are the prime producers of scientific software. Some decades ago, most of the computing work done by scientists was relatively straightforward. However, as computers and programming tools have grown more complex, scientists have hit a steep learning curve.
In Han [6], a survey of almost 2000 scientists was presented. Some of the main conclusions indicated that 91% of respondents acknowledged that using scientific software is important for their own research, 84% stated that developing scientific software is important for their own research, and 38% spent at least one-fifth of their time developing software. Nevertheless, the most notable finding was that the knowledge required to develop and use scientific software was primarily acquired from peers and through self-study, rather than from formal education and training. This may lead to problems in the future.
As an illustration, researchers do not generally test or document their programs rigorously, and they rarely release their codes, making it almost impossible to reproduce and verify published results generated by scientific software. At best, poorly written programs cause researchers to waste valuable time and energy. However, the coding problems can sometimes cause substantial harm and have even forced some scientists to retract papers [7,8].
When a researcher publishes an article with code in a scientific journal, other colleagues may adopt this code and build their own research upon this software. Many of these scientists rely on the fact that the software has appeared in a peer-reviewed article. This is scientifically misplaced, as the software code used to conduct the science is not formally peer-reviewed. This is especially important when a disconnection occurs between the equations and algorithms published in peer-reviewed literature and how they are actually implemented in the reportedly used software [9].
Despite the fact that these warnings have been sent before by some researchers [10,11,12], they are not having a visible effect. Software is pervasive in research, but its vital role is very often overlooked by funders, universities, assessment committees, and even the research community itself. It needs to be made clear that if scientific software is incorrect, so is the science derived from the software [7].
While this is a generalized problem in science, some scientific fields are more advanced than others. Some branches of science have spawned sub-disciplines. This is the case of bioinformatics, computational linguistics or computational statistics. They even have their own journals, some of them with significant scientific impact, such as the first quartile journal “Journal of Statistical Software”. However, this does not seem to be the case in Marine Engineering [13].
A possible solution to deal with these problems is hiring software engineers to perform the development of scientific software. While this approach will solve many issues related to the poor quality of scientific software, it usually lacks the physical interpretation or the correct validation of results. Pure software engineers suffer from a lack of expert knowledge in the scientific discipline of the software they are developing. Furthermore, the availability of massive datasets and the application of cutting-edge technologies, such as data mining or deep learning, does not in itself mean that reliable scientific software is being built.
To overcome these issues, a more appropriate proposal is the creation of a new academic professional designation, the Research Software Engineer (RSE), which is dedicated to complementing the existing postdoctoral career structure [14]. RSEs are both part of the scholarly community and professional software developers, who understand the scientific literature as well as research questions and have a professional attitude towards software development. Their work should be evaluated by both software and academic metrics.
2. Methodology
Regardless of the research field, developers of scientific software should have both strong scientific and software engineering background. In the following sections, we will briefly describe some of the skills that coastal engineers of the project “Protection of Coastal Urban Fronts against Global Warming (PROTOCOL)” have acquired to develop high-quality scientific software. The main aim of this project is the development of general technical recommendations to protect the coastal urban fronts against sea-level rise. A significant part of the project consists of developing a climate software tool to characterize the different atmospheric, maritime and fluvial forcings at different case study locations and generate automatic reports including the climate analyses.
2.1. PROTOCOL Project
Global warming associated with climate change is producing a progressive rising in the sea-level. The consequences of this sea-level rise lead to greater and more frequent floods, diseases and damage to property as well as a greater risk of loss of human lives. These effects will be amplified in the coastal fronts of cities and urban areas due to the high concentration of activities, services and population. This high concentration highlights the need to propose coastal protection measures whenever possible, mainly because it is not feasible to relocate the activities as a generalizable alternative.
The PROTOCOL project1 addresses this topic with the purpose of developing an assessment methodology and establishing technical recommendations for the design of coastal protection on urban fronts. The methodology is mainly based on the following components: (1) quantification of agents and actions considering their different scales of affection and the predicted scenarios (projections) of sea-level rise; (2) risk assessment at the coastal urban front; and (3) calculation of the overtopping based on the types of protection and the envisaged scenarios. This methodology will be applied to five study areas in Spain, Mexico, Portugal and Uruguay. The results obtained for the different sites will allow contrasting the effects of global warming in different parts of the world and will serve as valuable examples of the products derived from this project.
2.2. Modular Programming
Modular programming consists of organizing the source code of a program into different modules. Dividing the source code into modules (Python files) and packages (collections of modules) makes it possible to organize the program logically and minimizes the number of problems.
As the program grows and changes, it is often necessary to rewrite parts of the source code. Modular programming facilitates these changes by isolating where they should occur and minimizing side effects, keeping the code under control and making it scalable.
The goal of source code separation is to have modules without any or few dependencies on other modules. When a modular system is created, several modules are built separately and independently. The final application will be created by putting them together. Furthermore, many of these modules and packages could also be reused to build other applications, thus facilitating the reusability of the code.
Climate analysis constitutes the first step towards the assessment of climate change impacts and risk management. In the last few years, relevant advances have been done in this field [15,16,17]. However, tools and results are often excessively complicated and time-consuming for stakeholders and end-users; as a consequence, there is a need for developing simpler tools. This work fills this gap by developing a simple, modular and expandable climate tool composed of six modules that simplify the labor of analyzing the joint behavior of the concomitant climate drivers.
The tool consists of two main blocks, the first centered on data entry and pre-processing, and the second on data analysis. In turn, each of them is divided into three different modules, as shown in Figure 1. The first module of the pre-processing block allows the reading of data from various sources, from major European databases, such as Copernicus [18], to numerical model outputs, such as WAVEWATCH III [19]. The tool then performs a quality analysis of the data and makes use of processing functions that have been specifically designed and incorporated for gap-filling or null value detection, among others. Since the tool reads data from multiple sources with different formats, it is necessary to homogenize these formats into a standard one so that the rest of the modules can work independently from the source of the original data. The developed format, named MetOcean DataFrame, is composed of a Pandas DataFrame plus a series of attributes, such as location, depth or forcing agent, among others.
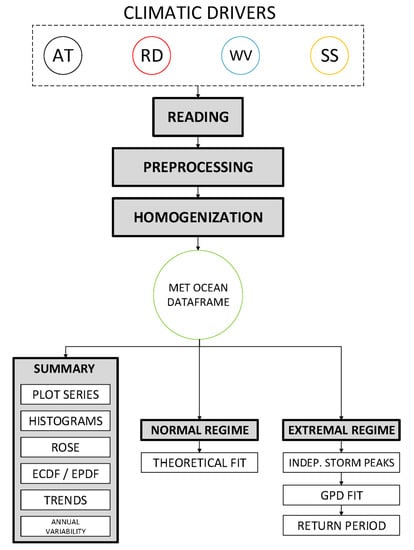
Figure 1.
Scheme of the different modules of the tool. AT, RD, WV and SS stand for Astronomical Tide, River Discharge, Wave and Storm Surge, respectively.
The analysis block is in turn composed of three other modules. The first module summarizes the basic climate analysis, including histograms and density functions of the main variables and their correlations, as well as a complete summary of the data. The tool allows both the automatic graphic representation of the results and the saving of this information with different output formats. The second module performs an average regime of the different variables, adjusting different theoretical distribution functions to the data. The tool gives the user flexibility to select different types of functions and to analyze the fit according to goodness-of-fit. Finally, the third module performs an extreme analysis of the variables using the “Peak Over Threshold” (POT) method. Figure 2 shows some of the results of the climate data analysis modules provided by the tool.
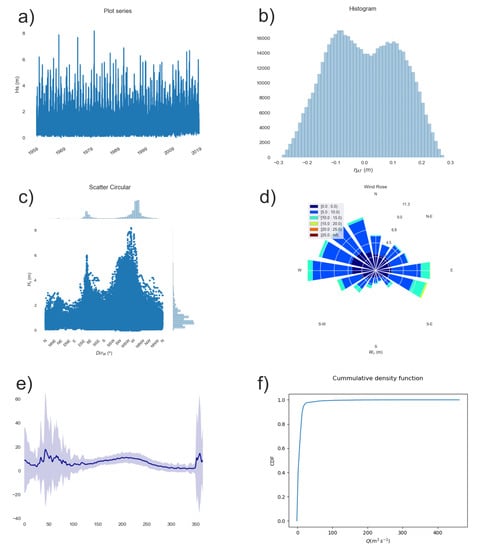
Figure 2.
Graphical outputs obtained by the climate tool. (a) Time series plot of significant wave height. (b) Histogram of the astronomical tide. (c) Scatter plot of significant wave height and peak period. (d) Wind rose. (e) River discharge annual variability. (f) Empirical cumulative density function of the river discharge.
2.3. Inline Code Documentation
In the same way that a well-documented experimental protocol makes research methods easier to reproduce, good documentation helps people understand code. This makes the code more reusable and lowers maintenance costs. The best way to create and maintain reference documentation is to embed the documentation for a piece of software in that software. Python makes this task easier by using documentation strings, also known as docstrings.
Unlike conventional source code comments or even format-specific comments, docstrings are not removed from the source code when analyzed and are retained throughout the program runtime. In contrast to traditional comments, reference documentation and descriptions of design decisions are key for improving code understandability. Scientists should use docstrings to document functions, modules or classes (why), and not concrete implementations (how).
Docstrings allow generating documentation into a wide range of output formats, including HTML, LaTeX (for printable PDF versions), manual pages, or plain text. This user-friendly documentation allows other researchers to understand the code, find errors, or even adapt it to their own needs.
2.4. Quality Control Process
Programs should be thoroughly tested according to the test plans developed in the design phase. Because of the modularity nature of our software, we can define unit tests to subject each piece to a series of tests. Well-designed unit tests may be used to address whether a particular module of code is working properly and allows testing to proceed piecemeal and iteratively throughout the development process. Robustness is greatly increased because it is easier to test and debug separate components before they are integrated into a larger software system.
Once the unit tests have been successfully passed, the integration tests verify the correct assemblage between the different components. The integration tests should focus on the interfaces and data flows between the different modules of the source code. When successfully completed, integration tests verify the data input, flow and output storage through a string of code modules.
2.5. Distributed Control Version
One of the most significant challenges scientists face when coding is keeping track of the changes and being able to revert them if something fails. When the software is built in a collaborative manner, this is even more challenging. It is difficult to find out which changes are in which versions or how exactly particular results were computed at a later date.
The standard solution in both industry and the open-source world is to use a distributed version control system. Programmers can modify their working copy of the project at will, then commit changes to the repository when they are satisfied with the results to share them with colleagues.
The fact that each developer has his own copy of the repository increases the robustness of the version control system, since integration is always done on the developers’ computers and never on the shared copy of the server. If a problem occurs, it has to be solved locally before changes can be uploaded to the server. This is a noticeable difference to the more common centralized version control systems of the past.
2.6. Code Performance Analysis
Although efficiency is a crucial concern in science, it is one of the most ignored facets of scientific software development. As a consequence of the fact that this task is carried out in advanced stages of software development, and usually due to lack of time and other resources, not all the necessary attention is devoted to it.
In scientific software development where computational efficiency is one of the main goals, running-time profiling is a necessary step. The key to speeding up applications often lies in understanding where the elapsed time is spent, and why. Profiling helps to extract this information and aid program optimization.
2.7. Software Development Methodology
The team consisted of about 5 to 10 researchers, most of them with a background in coastal engineering and with training in software development through self-study. Because of this, the software engineering techniques employed had to be trained at an early stage for researchers. Periodically, seminars were held to teach new techniques and to solve the questions raised.
The two main methodologies to organize software development are the waterfall model and the agile development model. Although neither of the two methodologies were formally followed so as to avoid additional training to the engineers, the development process is much closer to the agile approach, focusing on the main functionality and doing both unit and integration tests before moving to the next phases.
3. Results
Although the functionalities of the developed tool may seem limited, the following considerations should be made. The first one is that, as it has been demonstrated throughout this work, the tool is assembled in a modular way, which allows users, developers and scientists to add new functionalities according to their needs. Thus, it is possible to easily and directly incorporate new analysis functions, different graphic representations, or output formats of the results, among others. The second one is related to its versatility; it is important to highlight that the developed tool is capable of reading climate data from any point of the globe and generating a climate analysis in a totally automatic way with a low computational cost and for free. This can have a great impact on developing countries that do not have their own instruments or means to analyze their data, but require this information both for the development of their port infrastructures and for the protection and improvement of coastal management.
This methodology has enabled us to have a single source code to generate multiple products addressing different users (Figure 3). Moreover, a new addition to the source code is immediately available to all the products, and thus to every user. Deliverables currently available are tutorials in Jupyter notebooks, user-friendly automated reports or relational databases. Some of the potential users include public and private managers, specialized technicians, engineering students, stakeholders or other scientists.
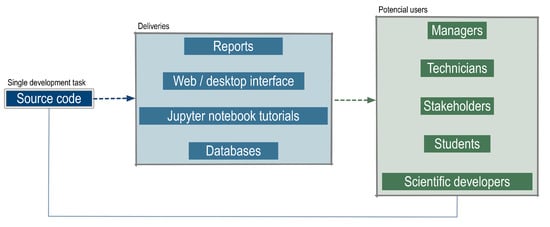
Figure 3.
Diagram of the climate tool.
The tool has been applied at different locations along the coast of the Iberian Peninsula (Spain). The software intends to help managers handle the impact of the environmental drivers on coastal urban fronts through the characterization and simulation of the main drivers and their variability. Therefore, this tool constitutes a preliminary and unavoidable step in the decision-making process of the assessment of flooding risk.
3.1. Reports
In Coastal Engineering, as in other fields of Engineering, we frequently have to carry out previous and specific studies whose methodology is similar, and in which the input data and the analysis of the results obtained vary. Particularly, the analysis of the maritime climate is essential in any project or study to be carried out on the coast.
The developed tool allows the automatic creation of elaborate reports (Figure 4) that can be customized according to the specific needs of the user (Code 1). Thus, for example, the output language, the sections to be included, or the types of analysis to be carried out can be chosen by the end-user. Empty blocks are also included, in which the user can write (e.g., to discuss the results), that are respected each time the program is run. So, for example, if a new analysis is included or the length of the data time series is increased, when the code is recompiled and a new version of the report is obtained, the writing is not deleted.
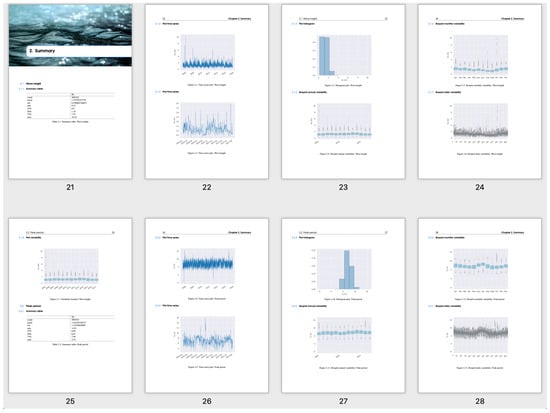
Figure 4.
User-friendly report generated automatically from the tool.
| Listing 1. Extract of a report template. |
[LANGUAGE] lang = ‘english’ [VARIABLES] title = ‘Cancun (Mexico)’ subtitle = ‘Astronomical tide’ author = ‘Environmental Fluid~Dynamics’ [METOCEAN] location = ‘cancun’ [DRIVERS] [[TIDE]] title = ‘Tide’ [[[Eta]]] title = ‘Astronomical tide level’ var_name = ‘$\eta$’ unit = ‘m’ ignore_sections = PLOT_GPD_FIT_PEAKS_OVER_THRESHOLD [[[TABLE_SUMMARY]]] [[[PLOT_SERIES]]] [[[PLOT_SERIES_PERIOD_TIME]]] initial_date = ‘2016-01-01’ final_date = ‘2018-01-01’ [[[PLOT_HISTOGRAM]]] bins = 10 kernel = False |
3.2. Jupyter Notebook Tutorials
One of the most interesting packages for scientists that is currently drawing much attention is the Jupyter notebook [20]. Jupyter is an interactive web tool that researchers can use to combine software code, computational output, explanatory text and multimedia resources in a single document. Although the use of Jupyter notebooks does not replace conventional development, it does simplify the accomplishment of certain interactive tasks. Its use is especially indicated for data exploration, communication of results and interactive tutorials. In addition, this tool facilitates reproducibility research.
The technological development that has taken place in recent years has challenged traditional teaching methods. While the theoretical foundations and concepts of the Coastal Engineering field should not be abandoned, the advanced tools currently available need to be integrated into the current teaching systems. To this respect, Ortega-Sánchez et al. [21] showed (1) the importance of implementing the use of the latest state-of-the-art technologies and (2) how these methods also help trigger student awareness towards a multidisciplinary, integrated and sustainable way of addressing real engineering problems. Although many advanced numerical models exist today (both commercial and free), technicians working in the field of Coastal Engineering still need to be able not only to analyze advanced data or interpret results, but also increasingly, to perform their own codes in an affordable way.
For this reason, several tutorial notebooks have been developed explaining the functionalities of the tool in an interactive way. Figure 5 shows an example that corresponds to the exploratory analysis of a circular variable.
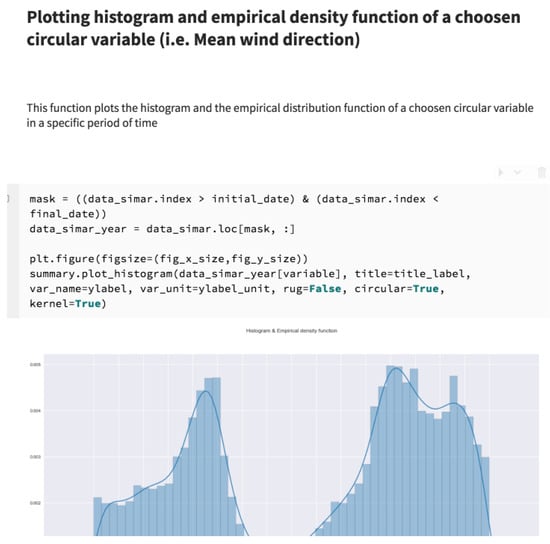
Figure 5.
Histogram and empirical density function of a circular variable in the form of a Jupyter notebook.
3.3. Web/Desktop Interface
The transfer of results and tools to users, administrations and stakeholders is one of the ultimate goals that applied research should have. Therefore, the development of methodologies, new calculation methods or advanced tools must guarantee their easy transfer and use by end-users.
The disparity of the operating systems used, the different prior training of end-users or even the difficulty of providing physical support has highlighted the importance of promoting applications via the web. This is what is known today as cloud computing, and applications developed within this framework have numerous advantages.
One of the most interesting features of scientific software is instantaneous support and deployment. The installation and maintenance of scientific software are complex, involving a large number of packages that may suffer at given time incompatibilities between versions. Cloud computing allows this maintenance to be conducted on the server in a way that is transparent to users.
Furthermore, no user requirements are necessary except for a web browser and an internet connection. The processing is done on the server, so it does not matter how powerful the end-users’ computers are. They can even access it from their different devices (desktop computer, laptop computer, smartphones or tablets) without any additional effort.
However, if it is necessary for different needs (privacy, or computing capacity) that the calculation is done locally, it is also possible to generate a desktop application without much additional technological effort. The development with web frameworks allows this type of local application with minimum adjustments.
Within the GDFA research group, some of these interfaces have already been developed. For instance, the Total Water Level tool that was developed for the Regional Government in [22]. This tool allows us to obtain, in different locations, the maximum water level for different conditions of the maritime climate. Its simplicity has enabled the practical use by managers; likewise, since the tool is located on GDFA’s servers, maintenance and updating of data are convenient, versatile and fast.
3.4. Databases
During the last decades, there has been a huge development of the technology related to the measurement, storage and analysis of massive data [23]. Thus, today, cloud computing methods and analysis tools, such as data mining [24], machine learning, and artificial intelligence, in general, are being applied in practically all areas of society.
In the field of coastal engineering and earth sciences, there has also been a strong development due to a greater computing capacity, which allows large datasets infrastructures [18] to be obtained at a global and regional level. At the local level, the measurement techniques and the implementation of detailed numerical models are also allowing to have large sources of data not only climatic, but also, for example, hydrodynamic or bathymetric. One of the key elements of all these data sources is their standardization and implementation in Geographic Information Systems for easy use by different users.
This tool has allowed the automatic creation of a database (Figure 6). By implementing a relational database, the applications can interact and integrate the information it stores so that it can be reused.
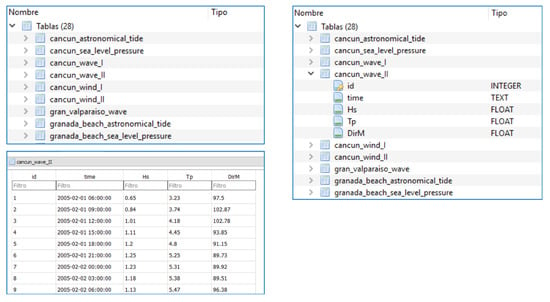
Figure 6.
Automatically-generated database.
4. Discussion
While most of the team members had experience with scientific platforms such as Matlab, one of the major decisions was the use of the programming language Python. The choice of programming language has many scientific and practical consequences. In particular, Matlab code can be quick to develop and is relatively easy to read. However, the language is proprietary and the source code is not available, so researchers do not have access to core algorithms making bugs in the core very difficult to find and fix. Many scientific developers prefer to write code that can be freely used on any computer and avoid proprietary languages.
Python is an increasingly popular and free programming language for scientists [25]. It combines simple syntax and abundant online resources. As a general-purpose programming language, it has no specific support for scientific data structures or algorithms, unlike scientific platforms like Matlab or R. However, it provides a rich ecosystem of science-focused toolkits with strong community support.
One of the most interesting features of Python for scientists is the possibility of directly running libraries coded in languages such as Fortran and C, without having to worry about programming in these low-level languages. This allows the reuse of numerous scientific packages implemented in these languages, such as BLAS or LAPACK. In addition, because Python is an interpreted language, and therefore slow compared to these compiled languages, this dramatically increases the efficiency, a key aspect in science. This is the main reason why most scientific Python packages are not written in Python itself, or at least in its most critical parts.
Nevertheless, one of the major downsides in the past for Python was its installation. Including parts of code in other languages, made the installation of Python for scientific tasks complex and tedious, and implied some advanced knowledge for the compilation of these packages.
This is currently solved by scientific distributions of Python, such as Anaconda, which have greatly facilitated the adoption of this language. Anaconda includes not only the general-purpose language interpreter, but a large number of ready-to-use scientific packages, including the SciPy ecosystem, and several code editors so that the scientist can start working with Python without having to install anything else.
Anaconda includes, among others, packages to perform data cleaning, aggregations and exploratory analysis (Pandas); numerical computation (NumPy); visualizing data (Matplotlib and Seaborn); domain-specific toolboxes (SciPy); machine learning (scikit-learn); organizing large amounts of data (netCDF4, h5py, pygrib); interactive data apps (Flask, Bokeh) or scientific dissemination and divulgation (Jupyter, PyLaTeX).
This framework has been developed with reproducibility in mind. This is particularly sensitive in all experimental disciplines. Some studies already claim that more than two-thirds of work in the earth and environmental sciences is not reproducible [26]. It is therefore necessary to improve the reproducibility and transparency of the results obtained.
5. Conclusions
A software tool has been built following some of the software engineering design guidelines in order to bridge the gap between coastal engineering and software development. This framework provides the tool with great robustness, versatility and the possibility of scalability and improvement in the future.
Once the framework has been developed and some of the basic modules have been implemented, the present work is a first step to continue adding more functionalities following the principles established in the methodology. Currently, the tool allows us to summarize the basic climate analysis, including histograms and density functions of the main variables and their correlations, as well as a complete summary of the data.
The developed tool allows the creation of different products oriented to different users: from managers to students, including also profiles such as researchers or developers. Some of the products already available from the tool include Jupyter notebooks and the automatic generation of elaborate reports and relational databases.
Other modules, such as the simulation of climate series, are in the process of development, as well as the completion of all documentation to make the tool publicly available. Once the source code of the tool is made public, feedback is expected for the improvement and implementation of new modules and features.
6. Future Work
The package is in a phase of refactoring and enhancement. Among the changes currently being made: (1) compatibility with Python 3 only; when development started it became compatible with Python 2/3 but this has required more development effort; (2) restructuring the package to follow a cookiecutter-generated template to improve its distribution, (3) completing the missing documentation; (4) adding a new module for data access from remote data sources such as Cordex or Copernicus (already completed but not integrated); (5) adding a new simulation module (already completed but in testing phase).
Author Contributions
Conceptualization, P.M.; funding acquisition, M.O.-S.; methodology, J.D.-R.-S.; software, P.M., J.D.-R.-S., M.C. and A.L.-L.; supervision, M.O.-S.; writing—original draft, P.M. and J.D.-R.-S.; writing—review and editing, M.C., A.L.-L. and M.O.-S. All authors have contributed substantially to the work and have read and agreed to the published version of the manuscript.
Funding
This project is supported by “Programa Iberoamericano de Ciencia y Tecnología para el Desarrollo”, CYTED (project PROTOCOL 917PTE0538) and the Spanish Ministry of Economy and Competitiveness (project PCIN-2017-108).
Conflicts of Interest
The authors declare no conflict of interest.
References
- Drake, N. First-Ever Picture of a Black Hole Unveiled. Available online: https://www.nationalgeographic.com/science/2019/04/first-picture-black-hole-revealed-m87-event-horizon-telescope-astrophysics/ (accessed on 13 May 2020).
- Chappell, B. Earth Sees First Image of a Black Hole. Available online: https://www.npr.org/2019/04/10/711723383/watch-earth-gets-its-first-look-at-a-black-hole (accessed on 13 May 2020).
- BBC. Katie Bouman: The Woman Behind the First Black Hole Image. Available online: https://www.bbc.com/news/science-environment-47891902 (accessed on 13 May 2020).
- Hess, A. 29-Year-Old Katie Bouman ‘Didn’T Know Anything About Black Holes’—Then She Helped Capture the First Photo of One. Available online: https://www.cnbc.com/2019/04/12/katie-bouman-helped-generate-the-first-ever-photo-of-a-black-hole.html (accessed on 13 May 2020).
- Brett, A.; Croucher, M.; Haines, R.; Hettrick, S.; Hetherington, J.; Stillwell, M.; Wyatt, C. Research Software Engineers: State of the Nation Report 2017. 2017. Available online: https://zenodo.org/record/495360#.Xryi4MCWrIW (accessed on 13 May 2020).
- Hannay, J.E.; MacLeod, C.; Singer, J.; Langtangen, H.P.; Pfahl, D.; Wilson, G. How do scientists develop and use scientific software? In Proceedings of the 2009 ICSE Workshop on Software Engineering for Computational Science and Engineering, Vancouver, BC, Canada, 23 May 2009. [Google Scholar]
- Miller, G. A scientist’s nightmare: Software problem leads to five retractions. Science 2006, 314, 1856–1857. [Google Scholar] [CrossRef] [PubMed]
- Merali, Z. Computational science.Error. Nature 2010, 467, 775–777. [Google Scholar] [CrossRef] [PubMed]
- Ince, D.; Hatton, L.; Graham-Cumming, J. The case for open computer programs. Nature 2012, 482, 485–488. [Google Scholar] [CrossRef]
- Peng, R. Reproducible research in computational science. Science 2011, 334, 1226–1227. [Google Scholar] [CrossRef] [PubMed]
- Goble, C. Better Software, Better Research. IEEE Internet Comput. 2014, 18, 4–8. [Google Scholar] [CrossRef]
- Baker, M. Scientific computing: Code alert. Nature 2017, 541, 563–565. [Google Scholar] [CrossRef]
- Hutton, C.; Wagener, T.; Freer, J.; Han, D.; Duffy, C.; Arheimer, B. Most computational hydrology is not reproducible, so is it really science? Water Resour. Res. 2016, 52, 7548–7555. [Google Scholar] [CrossRef]
- Baxter, R.; Hong, N.C.; Gorissen, D.; Hetherington, J.; Todorov, I. The research software engineer. In Proceedings of the Digital Research Conference, Oxford, UK, 10–12 September 2012. [Google Scholar]
- Rueda, A.; Gouldby, B.; Méndez, F.; Tomás, A.; Losada, I.; Lara, J.; Díaz-Simal, P. The use of wave propagation and reduced complexity inundation models and metamodels for coastal flood risk assessment. J. Flood Risk Manag. 2016, 9, 390–401. [Google Scholar] [CrossRef]
- Vousdoukas, M.I.; Mentaschi, L.; Voukouvalas, E.; Verlaan, M.; Jevrejeva, S.; Jackson, L.P.; Feyen, L. Global probabilistic projections of extreme sea levels show intensification of coastal flood hazard. Nat. Commun. 2018, 9, 1–12. [Google Scholar] [CrossRef] [PubMed]
- Del-Rosal-Salido, J.; Folgueras, P.; Ortega-Sánchez, M.; Losada, M.A. Beyond flood probability assessment: An integrated approach for characterizing extreme water levels along transitional environments. Coast. Eng. 2019, 152, 103512. [Google Scholar] [CrossRef]
- Hans, H.; Bell, W.; Berrisford, P.; Andras, H.; Muñoz-Sabater, J.; Nicolas, J.; Raluca, R.; Dinand, S.; Adrian, S.; Cornel, S.; et al. Global reanalysis: Goodbye ERA-Interim, hello ERA5. ECMWF Newsl. 2019, 159, 17–24. [Google Scholar]
- WW3DG (The WAVEWATCH III Development Group). User Manual and System Documentation of WAVEWATCH III Version 6.07; Tech. Note; NOAA/NWS/NCEP/MMAB: College Park, MD, USA, 2019; 326p. [Google Scholar]
- Perkel, J.M. Why Jupyter is data scientists’ computational notebook of choice. Nature 2018, 563, 145–146. [Google Scholar] [CrossRef] [PubMed]
- Ortega-Sánchez, M.; Moñino, A.; Bergillos, R.J.; Magaña, P.; Clavero, M.; Díez-Minguito, M.; Baquerizo, A. Confronting learning challenges in the field of maritime and coastal engineering: Towards an educational methodology for sustainable development. J. Clean. Prod. 2018, 171, 733–742. [Google Scholar] [CrossRef]
- Magaña, P.; Bergillos, R.J.; Del-Rosal-Salido, J.; Reyes-Merlo, M.A.; Díaz-Carrasco, P.; Ortega-Sánchez, M. Integrating complex numerical approaches into a user-friendly application for the management of coastal environments. Sci. Total Environ. 2018, 624, 979–990. [Google Scholar] [CrossRef] [PubMed]
- Bryant, R.E. Data-Intensive Scalable Computing for Scientific Applications. Comput. Sci. Eng. 2011, 13, 25–33. [Google Scholar] [CrossRef]
- Magaña, P.; López-Ruiz, A.; Lira, A.; Ortega-Sánchez, M.; Losada, M.A. A public, open Western Europe database of shoreline undulations based on imagery. Appl. Geogr. 2014, 55, 278–291. [Google Scholar] [CrossRef]
- Perkel, J.M. Programming: Pick up Python. Nature 2015, 518, 125–126. [Google Scholar] [CrossRef] [PubMed]
- Baker, M. 1,500 scientists lift the lid on reproducibility. Nature 2016, 533, 452–454. [Google Scholar] [CrossRef] [PubMed]
| 1. |
© 2020 by the authors. Licensee MDPI, Basel, Switzerland. This article is an open access article distributed under the terms and conditions of the Creative Commons Attribution (CC BY) license (http://creativecommons.org/licenses/by/4.0/).