Article

Coastal Phytoplankton Pigments Composition in Three Tropical Estuaries of Indonesia

1
Department of Aquatic Resources Management, Faculty of Fisheries and Marine Sciences, IPB University (Bogor Agricultural University), Jl. Agatis Darmaga Bogor, Bogor 16680, Indonesia
2
Center for Coastal and Marine Resources Studies, IPB University (Bogor Agricultural University), Kampus IPB Baranangsiang, Jl. Raya Pajajaran No. 1, Bogor 16127, Indonesia
3
Institute for Coastal Research, Centre for Material and Coastal Research, Helmholtz-Zentrum Geesthacht, Max-Planck-Strasse 1, 21502 Geesthacht, Germany
4
Forschungs-und Technologiezentrum, Westküste, Hafentörn, 25761 Büsum, Germany
*
Author to whom correspondence should be addressed.
J. Mar. Sci. Eng. 2020, 8(5), 311; https://doi.org/10.3390/jmse8050311
Submission received: 20 March 2020 / Revised: 22 April 2020 / Accepted: 28 April 2020 / Published: 29 April 2020
(This article belongs to the Section Marine Biology)

Abstract

:
In this study, the composition and distribution of phytoplankton pigments and its relation to nutrients and light was investigated, and an elaboration of using it as a proxy for phytoplankton group composition followed, in different nutrient-level tropical bays of Indonesia. Phytoplankton pigment analysis by using High Performance Liquid Chromatographer (HPLC) resulted in a set of pigments of chlorophyll-a (Chl-a), chlorophyll-b (Chl-b), chlorophyll-c (Chl-c), lutein, zeaxanthin, fucoxanthin, peridinin, diadinoxanthin, and ß-carotene. Linear multi regression and multivariate principal component analysis (PCA) showed that algae pigments correlate positively with nutrients and are not significantly correlated with underwater light and water transparency, suggesting important roles of nutrients for phytoplankton development in tropical estuaries. There were differences in total algae pigment concentration between bays (p < 0.005), showing that the eutrophic system of Jakarta Bay was the highest (mean of 10.55 μg L−1), Lampung Bay was the second highest (mean of 3.37 μg L−1), and the lowest were the oligotrophic waters of Semangka Bay (mean of 0.80 μg L−1). At all bays studied, high nutrient sites, which were located in the river mouths and inner part of the bay, were always characterized by high phytoplankton pigment concentration. Pigment composition had a high correlation with phytoplankton composition: diatoms with fucoxanthin, dinoflagellates with peridinin and Chl-c, and Chlorophyceae with Chl-b and lutein. This conformity suggests that algae pigments can be used as a biomarker for phytoplankton group determination along with microscopic species identification.

1. Introduction

Phytoplankton is a very important aquatic organism since they are producers in aquatic food chain, they can be used as indicators for coastal aquatic health and the ecological functioning of an estuary, and are the basic foundation for fisheries management [1,2]. The dynamics of phytoplankton species and abundance in coastal waters can be used as an indicator of the water quality, such as indicating organic and inorganic pollution (eutrophication) [3,4,5,6,7,8]. The diversity of the phytoplankton community reflects the levels of resource availability, such as nutrients and light [9,10,11].
As a producer, phytoplankton has pigments as the main driver for photosynthetic processes [12,13]. Photosynthetic pigments of phytoplankton are composed of chlorophyll-a (Chl-a), chlorophyll-b (Chl-b), chlorophyll-c (Chl-c), lutein, zeaxanthin, fucoxanthin, peridinin, diadinoxanthin, and ß-carotene [14,15,16]. Different to the Chl-a that is found in all phytoplankton groups, other photosynthetic pigments are not found in all phytoplankton groups [15,17]. Thus, their abundance is often used as a biomarker for certain phytoplankton groups [11,18,19,20].
In the waters, phytoplankton development is regulated by the availability of nutrients and light and other ecological parameters of the waters [21,22]. Tropical coastal waters are relatively more stable than temperate or sub-tropical coastal waters, especially in terms of solar illumination. In the tropical coastal waters where relatively stable in solar radiation and high in water turbidity, nutrients play important role for phytoplankton development [7,23,24,25]. This condition is very different from that of the sub-tropical and temperate coastal waters, which are experienced with huge temporal fluctuations of light and nutrients.
The study of the distribution of phytoplankton pigments in tropical waters is very rare and generally limited to the study of Chl-a only [24,26,27,28,29,30,31,32]. In fact, considering that the photosynthetic pigment is not only Chl-a in phytoplankton cells, but also includes various other pigments [15,19,33], the study of pigments composition and its ecological aspect in tropical waters is needed. This paper describes a distribution of the phytoplankton pigments in the different nutrient-loaded tropical bays of Indonesia and examines their correlation with some main controlling factors of nutrients and underwater light, as well as exploring the possibility to use phytoplankton pigments as a proxy for phytoplankton group taxonomy. The focus of this paper is limited to the role of nutrients and lights on phytoplankton development, while other controlling factors are not deeply discussed. The study hypothesizes that in the turbid water of tropical coastal waters, where nutrients are high, phytoplankton pigments concentration is mostly regulated by the variability of nutrients rather than by light. Another hypothesis is that phytoplankton pigments can be used as proxy for phytoplankton group composition. Thus, this paper is very beneficial, especially for the baseline and development of the phytoplankton ecology in tropical bays as well as for basic input related to coastal eutrophication management measures.

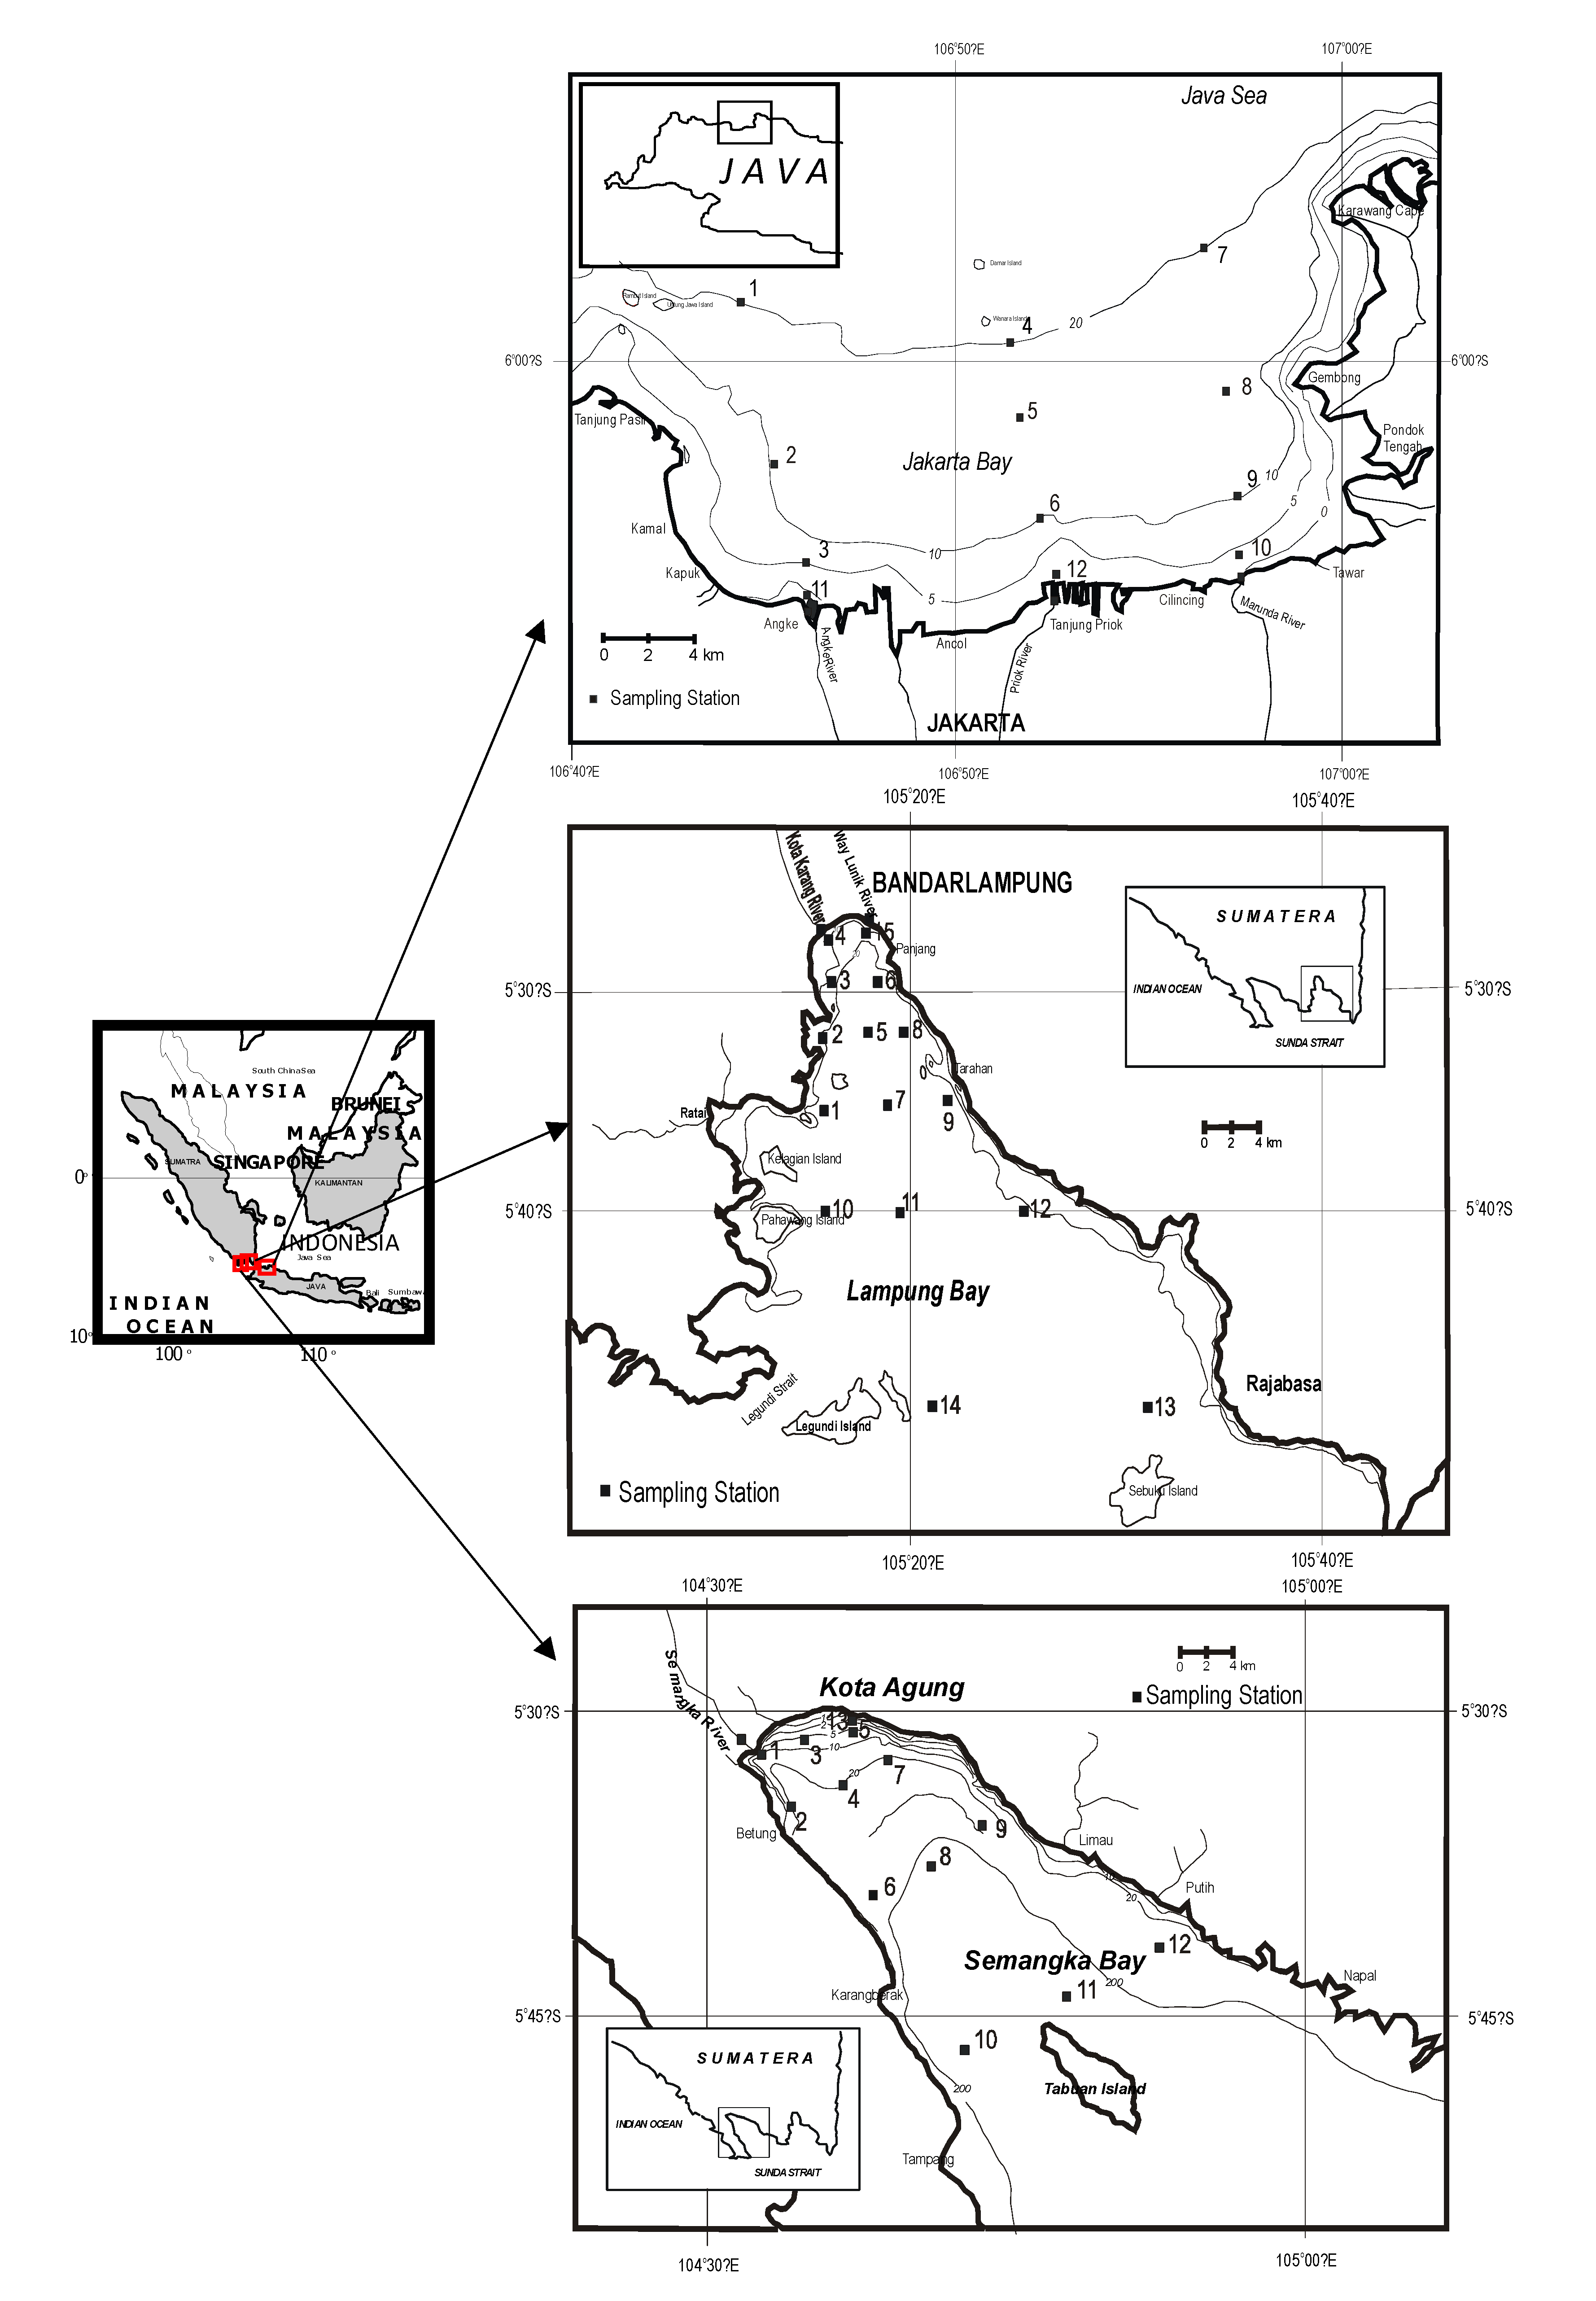
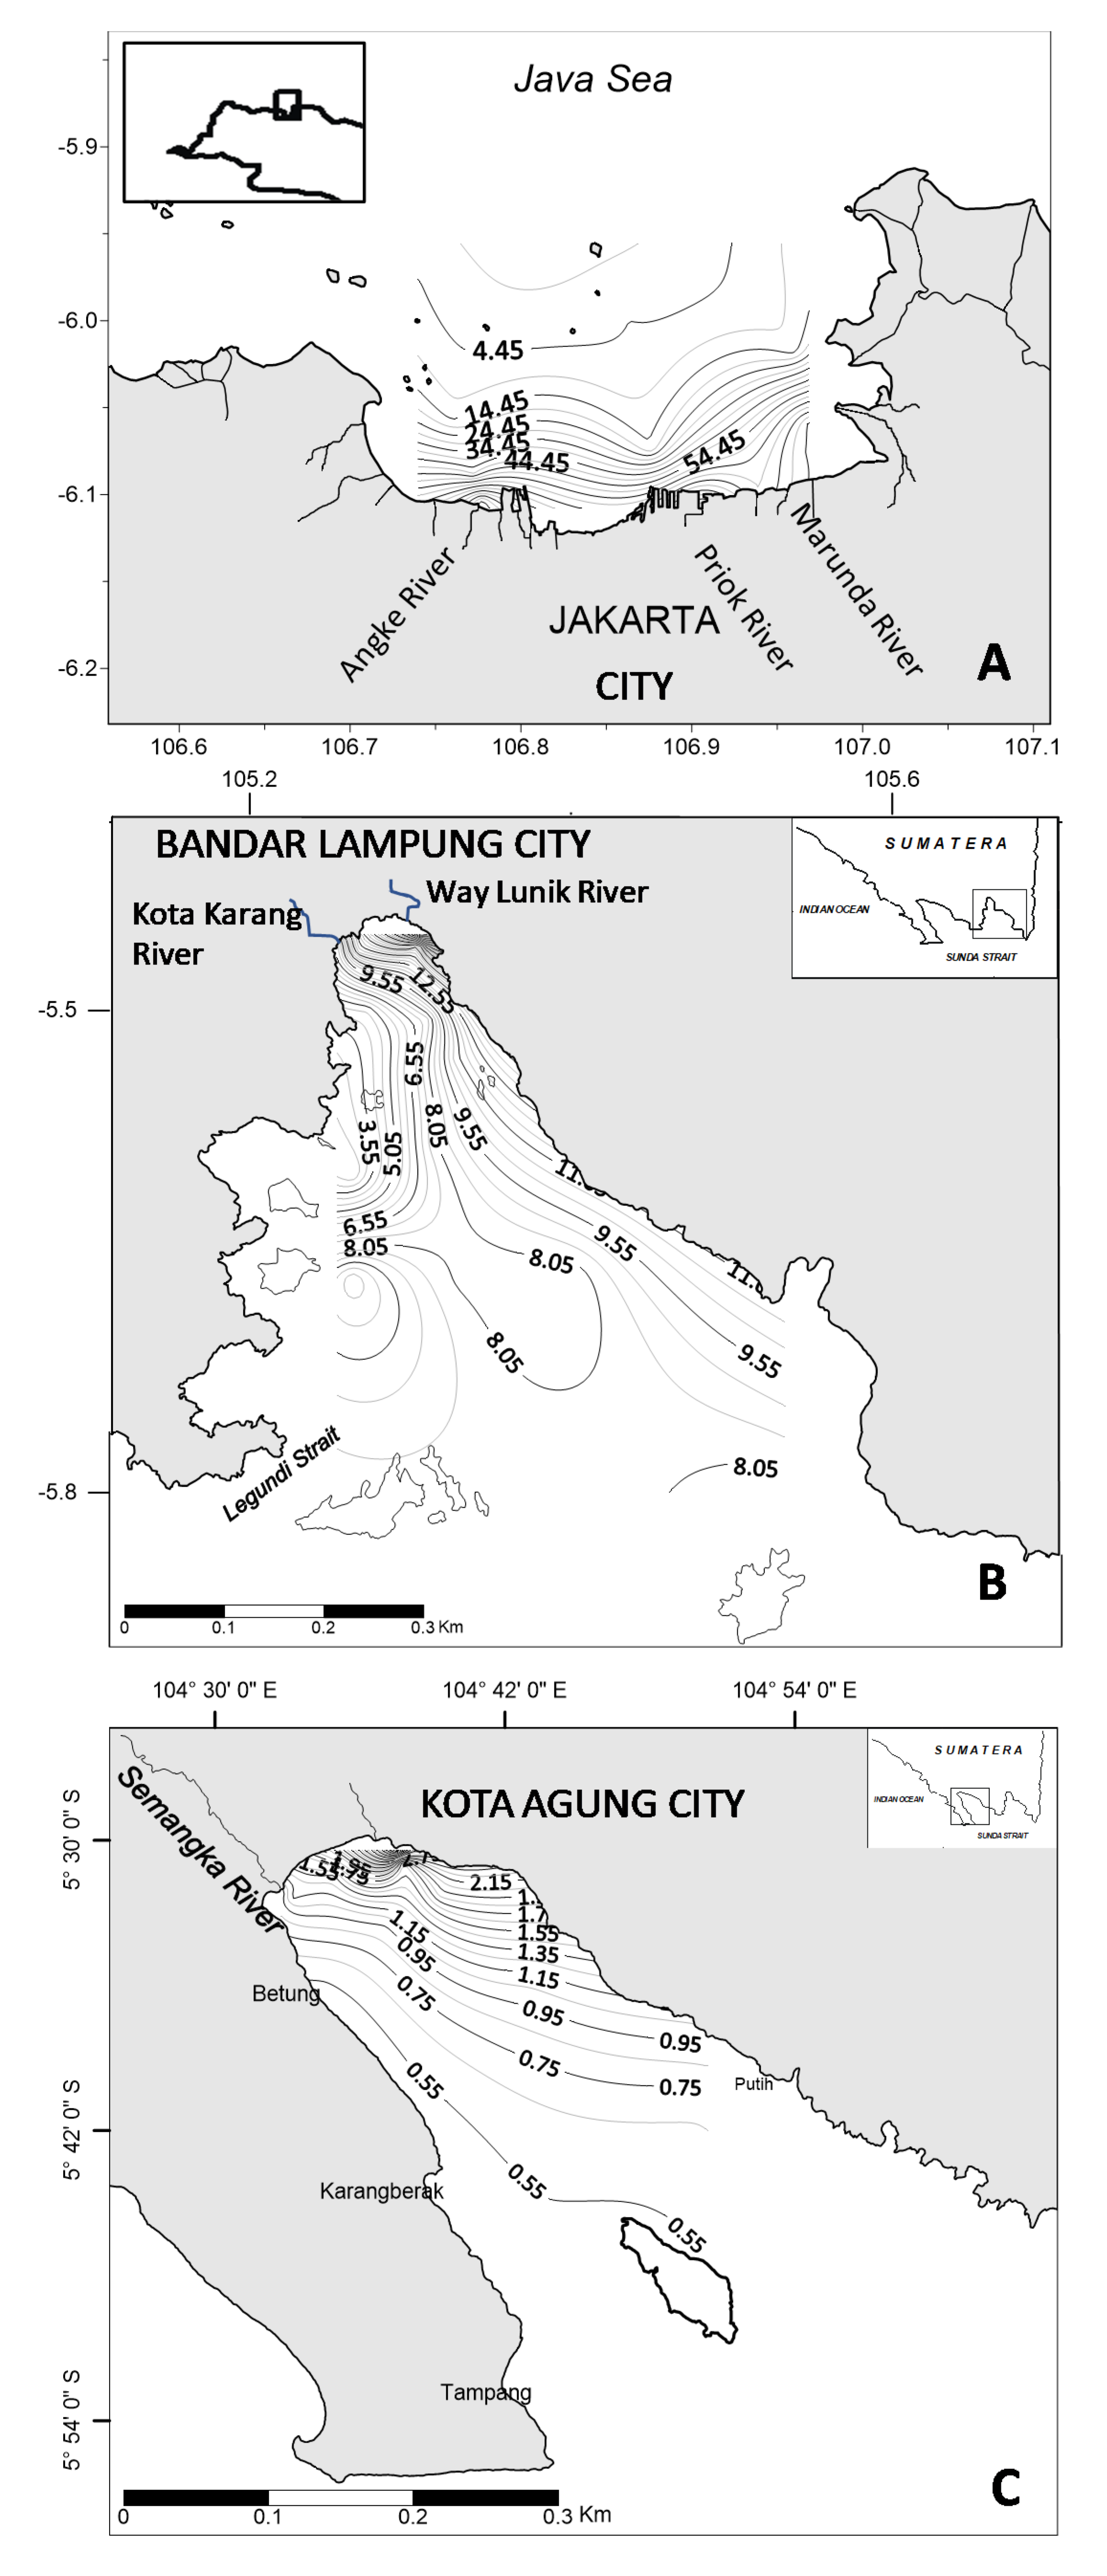
2. Context and Methodology

This study is part of a larger study on coastal eutrophication in the Indonesian tropical embayments, namely Jakarta Bay, Lampung Bay, and Semangka Bay, which had been previously partly published in Damar et al. [23,34]. The three different nutrient levels tropical embayment were studied as a case study (Figure 1). These bays are dissimilar in the eutrophication state [23], with Jakarta Bay as the most eutrophic bay, followed by Lampung Bay, and with Semangka Bay as the least eutrophic bay.
A sampling of phytoplankton pigments and field measurements were conducted at two different tropical seasons of rain and dry periods in December 2000 to December 2001 with a frequency of every two months. Sampling stations were determined based on the spatial variability coverage principles, and ranged from lower salinity to the more offshore waters of the bays. Hence, in each bay, measurement stations are representative of high nutrient waters of river mouths and inner part of the bay, lesser nutrient levels of the middle part of the bay, and the least nutrient water of the outer part of the bay.
In Jakarta Bay, 15 sampling stations were defined, where three of them were located at the river mouths of Angke, Priok, and Marunda rivers, and the rest were located at the marine waters of the bay (Figure 1). Marine waters stations are divided into three parts, namely the inner part of the bay (stations 10, 11, 12), the middle part of the bay (stations 2, 5, 8, 3, 6, 9), and the outer part of the bay (stations 1, 4 and 7). In Lampung Bay, there were 17 sampling stations, where two of them were located in the river mouths of Kota Karang (KK) and Way Lunik (WL) rivers, and 15 other stations were located in the marine part of the bay (Figure 1). In Lampung Bay, the inner part of the bay consists of stations 4 and 15, while the rest were considered as the middle (stations 1, 2, 3, 5, 6, 7, 8 and 9) and outer parts of the bay (stations 10, 11, 12, 13 and 14). In Semangka Bay, samplings were conducted at 14 sampling stations, representing the river mouth of the Semangka River (R), near coastline stations and the more offshore stations (Figure 1). The inner part of the bay consists of stations 1, 3, and 13, while the middle part of the bay consists of stations 2, 4, 7, 6, 8, and 9, and the outer part of the bay consists of stations 10, 11, and 12. As a remark, station 13 is located right in front of the local fishing port.
In order to have similar climatological and tidal cycle characters, sampling and measurements were conducted during the fixed period from 10.00 AM to 14.00 PM at each of bay. About 1 to 2 L of surface sea water were taken by using a 5 L-Van Dorn water sampler at each sampling station and then filtered to get phytoplankton pigment samples. The filter used was a GF/F Whatman glass microfiber, with 47 mm diameter and 0.7 µm porosity; the vacuum pump was performed by applying maximum filtration of 200 mbar and kept in −20 °C until being analyzed. Pigment analysis was conducted following the methods recommended by Mantoura and Llewellyn [36] at the Forschungs-und Technologie Zentrum (FTZ) laboratory in Germany by using HPLC (High Performance Liquid Chromatographer). The algae pigments collected in the filters were diluted after grinding in 90% acetone and then centrifuged for 5 min at 3600 rpm. Grinding of filters was performed by diluting the filters into cold acetone (4 °C) and grinding in a tissue grinder for 5 min with a 2 mm diameter of glass beads. Pigments identification was done chromatographically, separated by HPLC and then spectrophotometrically measured. A calibration by using a spectrafocus Thermospray (TSP) detector (Thermo Finnigan) and standard pigments from the Danish Hydraulic Institute (DHI) was performed. The column used was Nucleosil C18, 250 × 4.6 mm, with a 5 µm mesh size at 120 Å. Each pigment species determination and concentration computation was done by using Chromquest 4.0 software.
Surface water irradiance was measured by means of a Licor spherical quantum sensor (LI-1935A) by applying a conversion of 1 W m−2, which is equal to 4.17 μmol photons m−2 s−1 [37]. The whole euphotic depth irradiance was calculated by summing up all euphotic depth irradiances, which were calculated by applying the light attenuation coefficient calculated from Secchi disk readings (Sd (m)), by using the empirical relationship k = 0.191 + 1.242/Sd (R2 = 0.853) [38]. The average irradiance values of each station were calculated by dividing the total light by the depth of euphotic zone in each station. To support the analyses, physical and chemical water properties data of salinity, Secchi depth, underwater light, nutrients, and phytoplankton group compositions were employed from the study of Damar et al. [23]. Besides taking water for pigment samples, samples for nutrients (Dissolved Inorganic Nitrogen—DIN—and phosphorus) were taken by filtering 0.5 to 1 L of surface seawater into MFS nucleofilter with 47 mm diameter and pore size of 0.2 µm, and were analyzed according to the methods of Grashoff et al. [39]. Phytoplankton samples were taken by filtering 25 L of surface water into a 40-micron mesh sized plankton net for species identification purposes. Utermöhl [40] technique was applied to both cell counting and species identification purposes. Data on phytoplankton abundance and species composition had been presented in Damar et al. [23].
In order to analyze the interaction between nutrients and light in influencing total pigments, a single variable and multiple linear regression analyses were performed. Additionally, multiple linear regressions between each pigment to total pigments were completed to analyze the spatial distribution of each pigment species. Single linear regression between each pigment and total pigments were performed aimed to evaluate the specific contribution and role of each pigment in the variabilities of total pigment. Pearson’s correlation analysis between each pigment concentration and phytoplankton group abundances was performed, which can be used for estimating the phytoplankton group using pigment species.
One-way Analysis of Variance (ANOVA) statistical analysis was performed to test the differences of pigment concentration between stations (within bay), between bays and between seasons, which was then followed by a post test of the Least Significant Difference -Tukey’s, to determine the highest station (within each bay) and bay in pigment concentration. These statistical analyses were performed by means of MS Excel 2016 software, in the “data analysis” and “add-ins” mode for ANOVA test. To have a multi-variables correlation and linkage between both environmental variables and stations in each bay, a Biplot Principle Component Analysis (PCA) was performed. Variables used were pigment species and their concentration, nutrient concentrations, class of phytoplankton abundances, and Secchi depth values, and they are analyzed based on stations of measurement. In principle, the biplot PCA is a two-dimensional graphic describing a summary table, containing stations as objects and environmental parameters as variables. The software used for PCA analysis was XLStat 2019.

3. Results

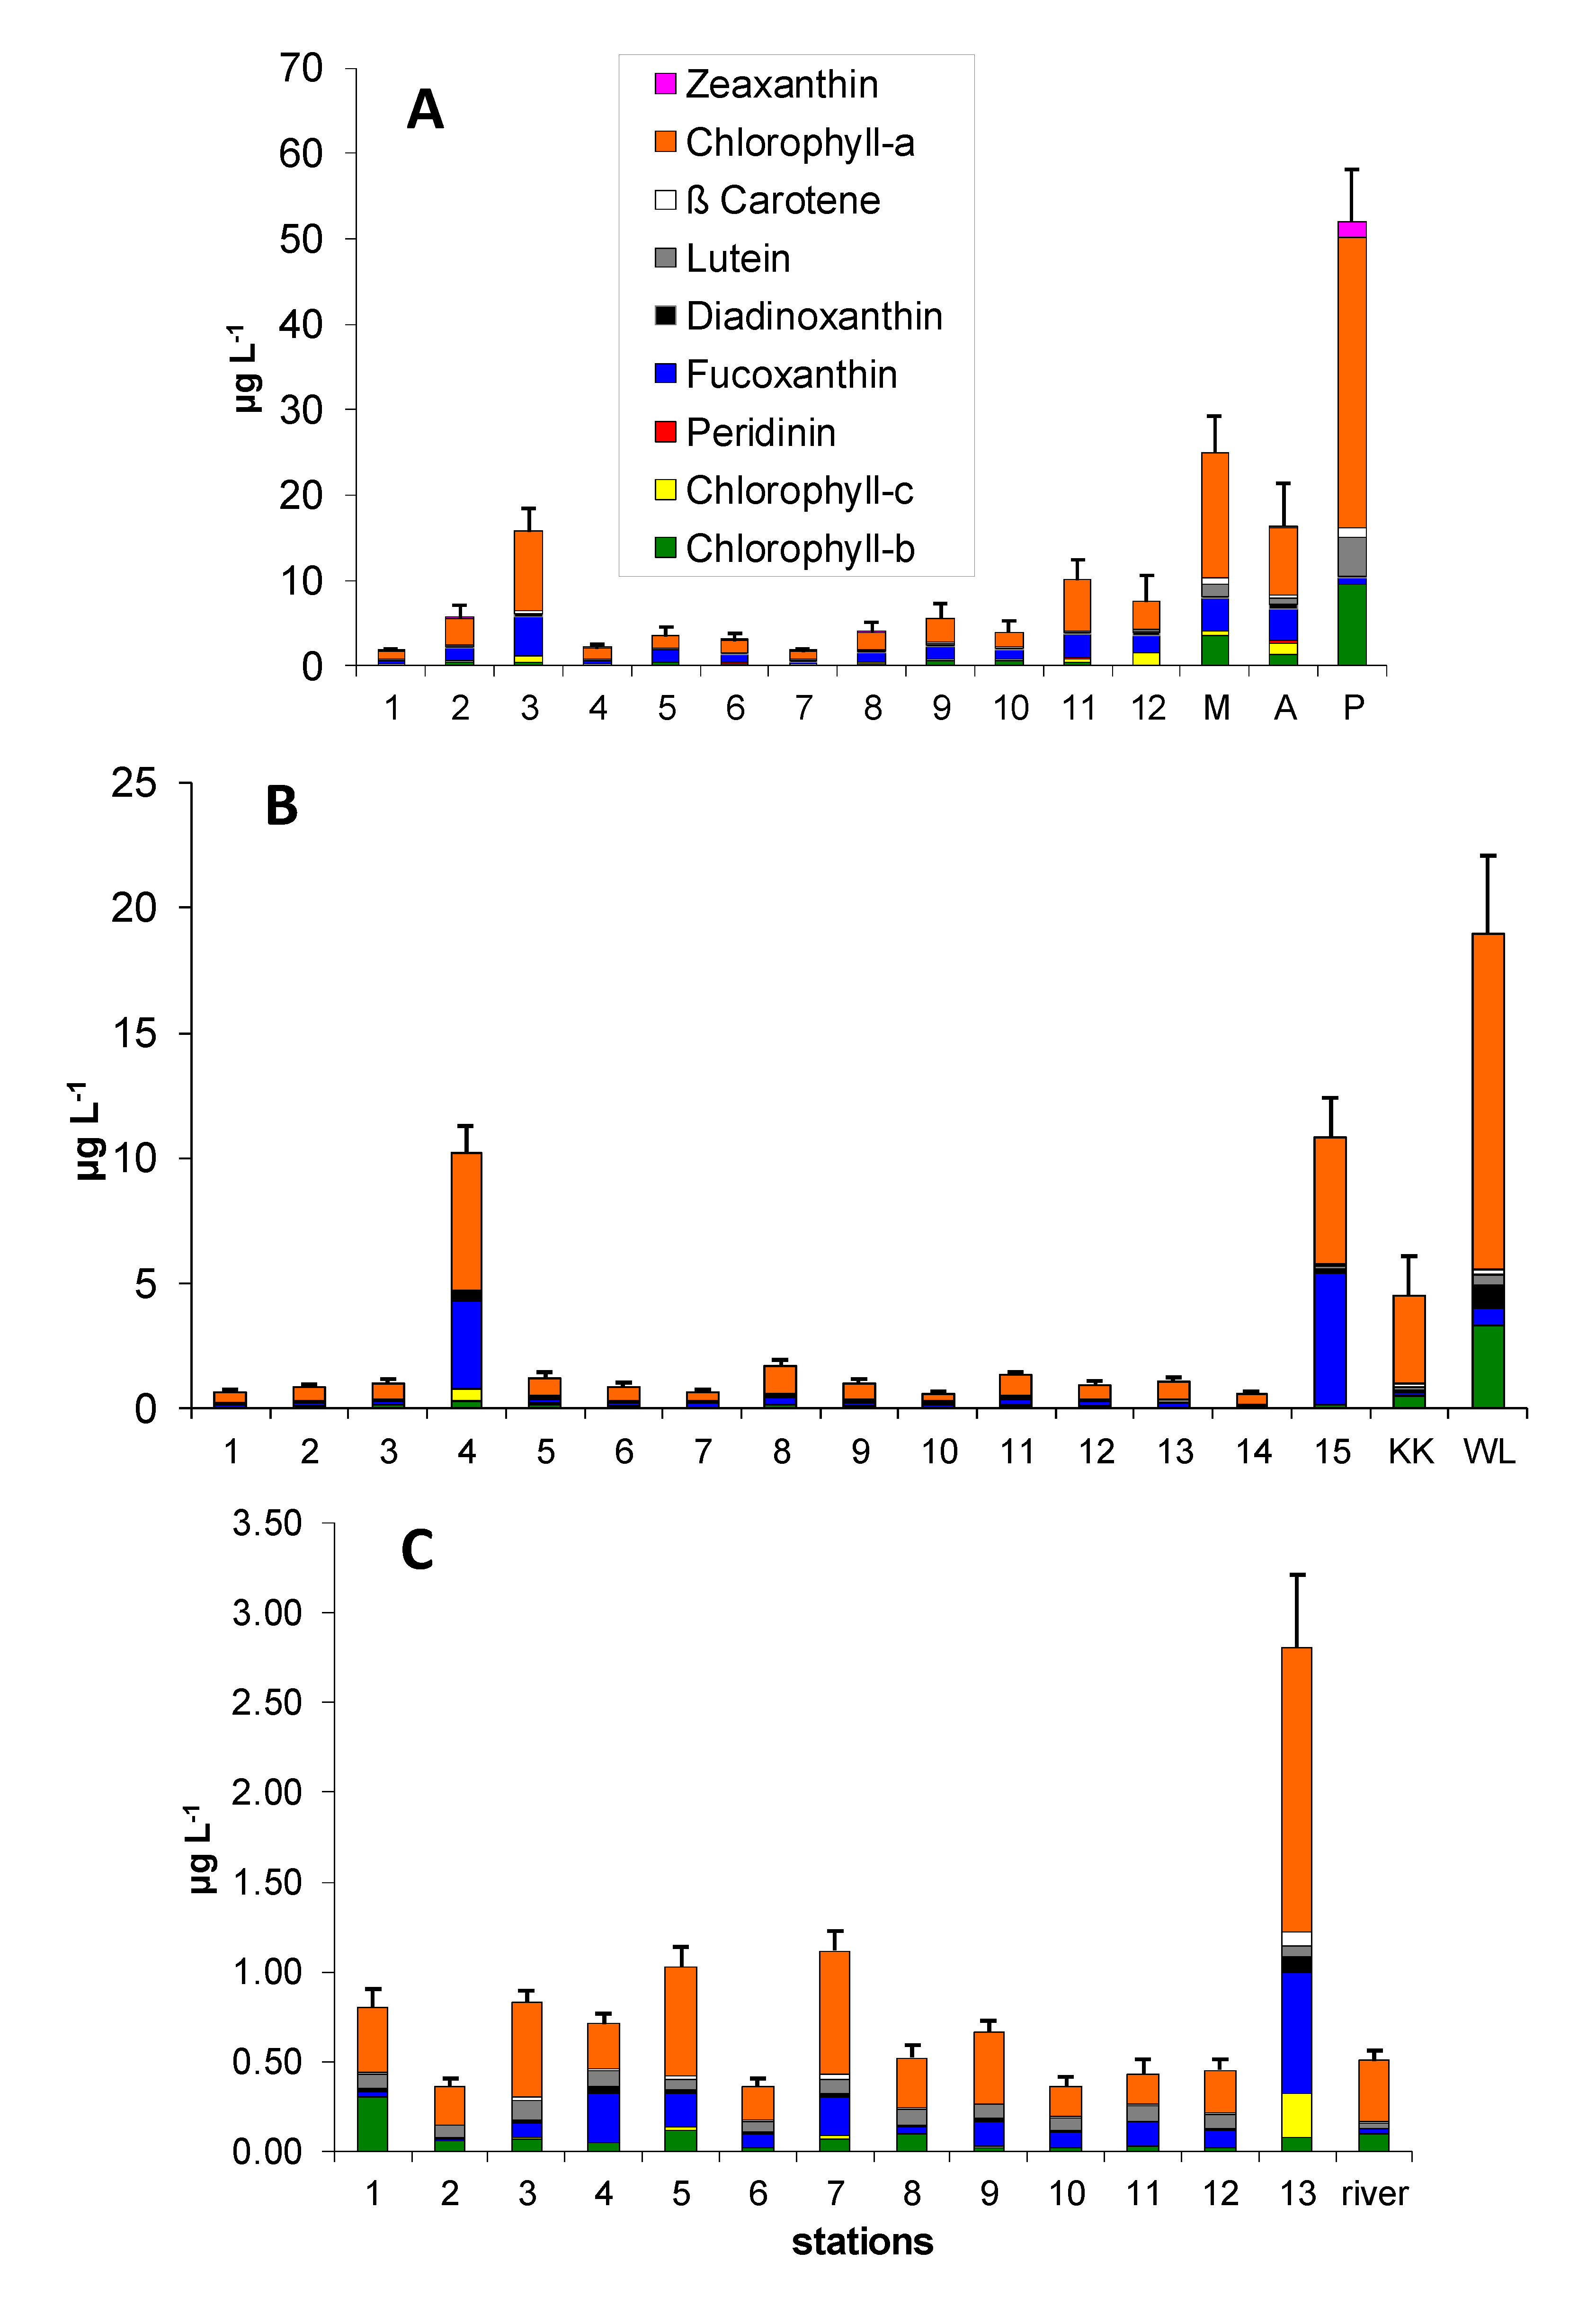
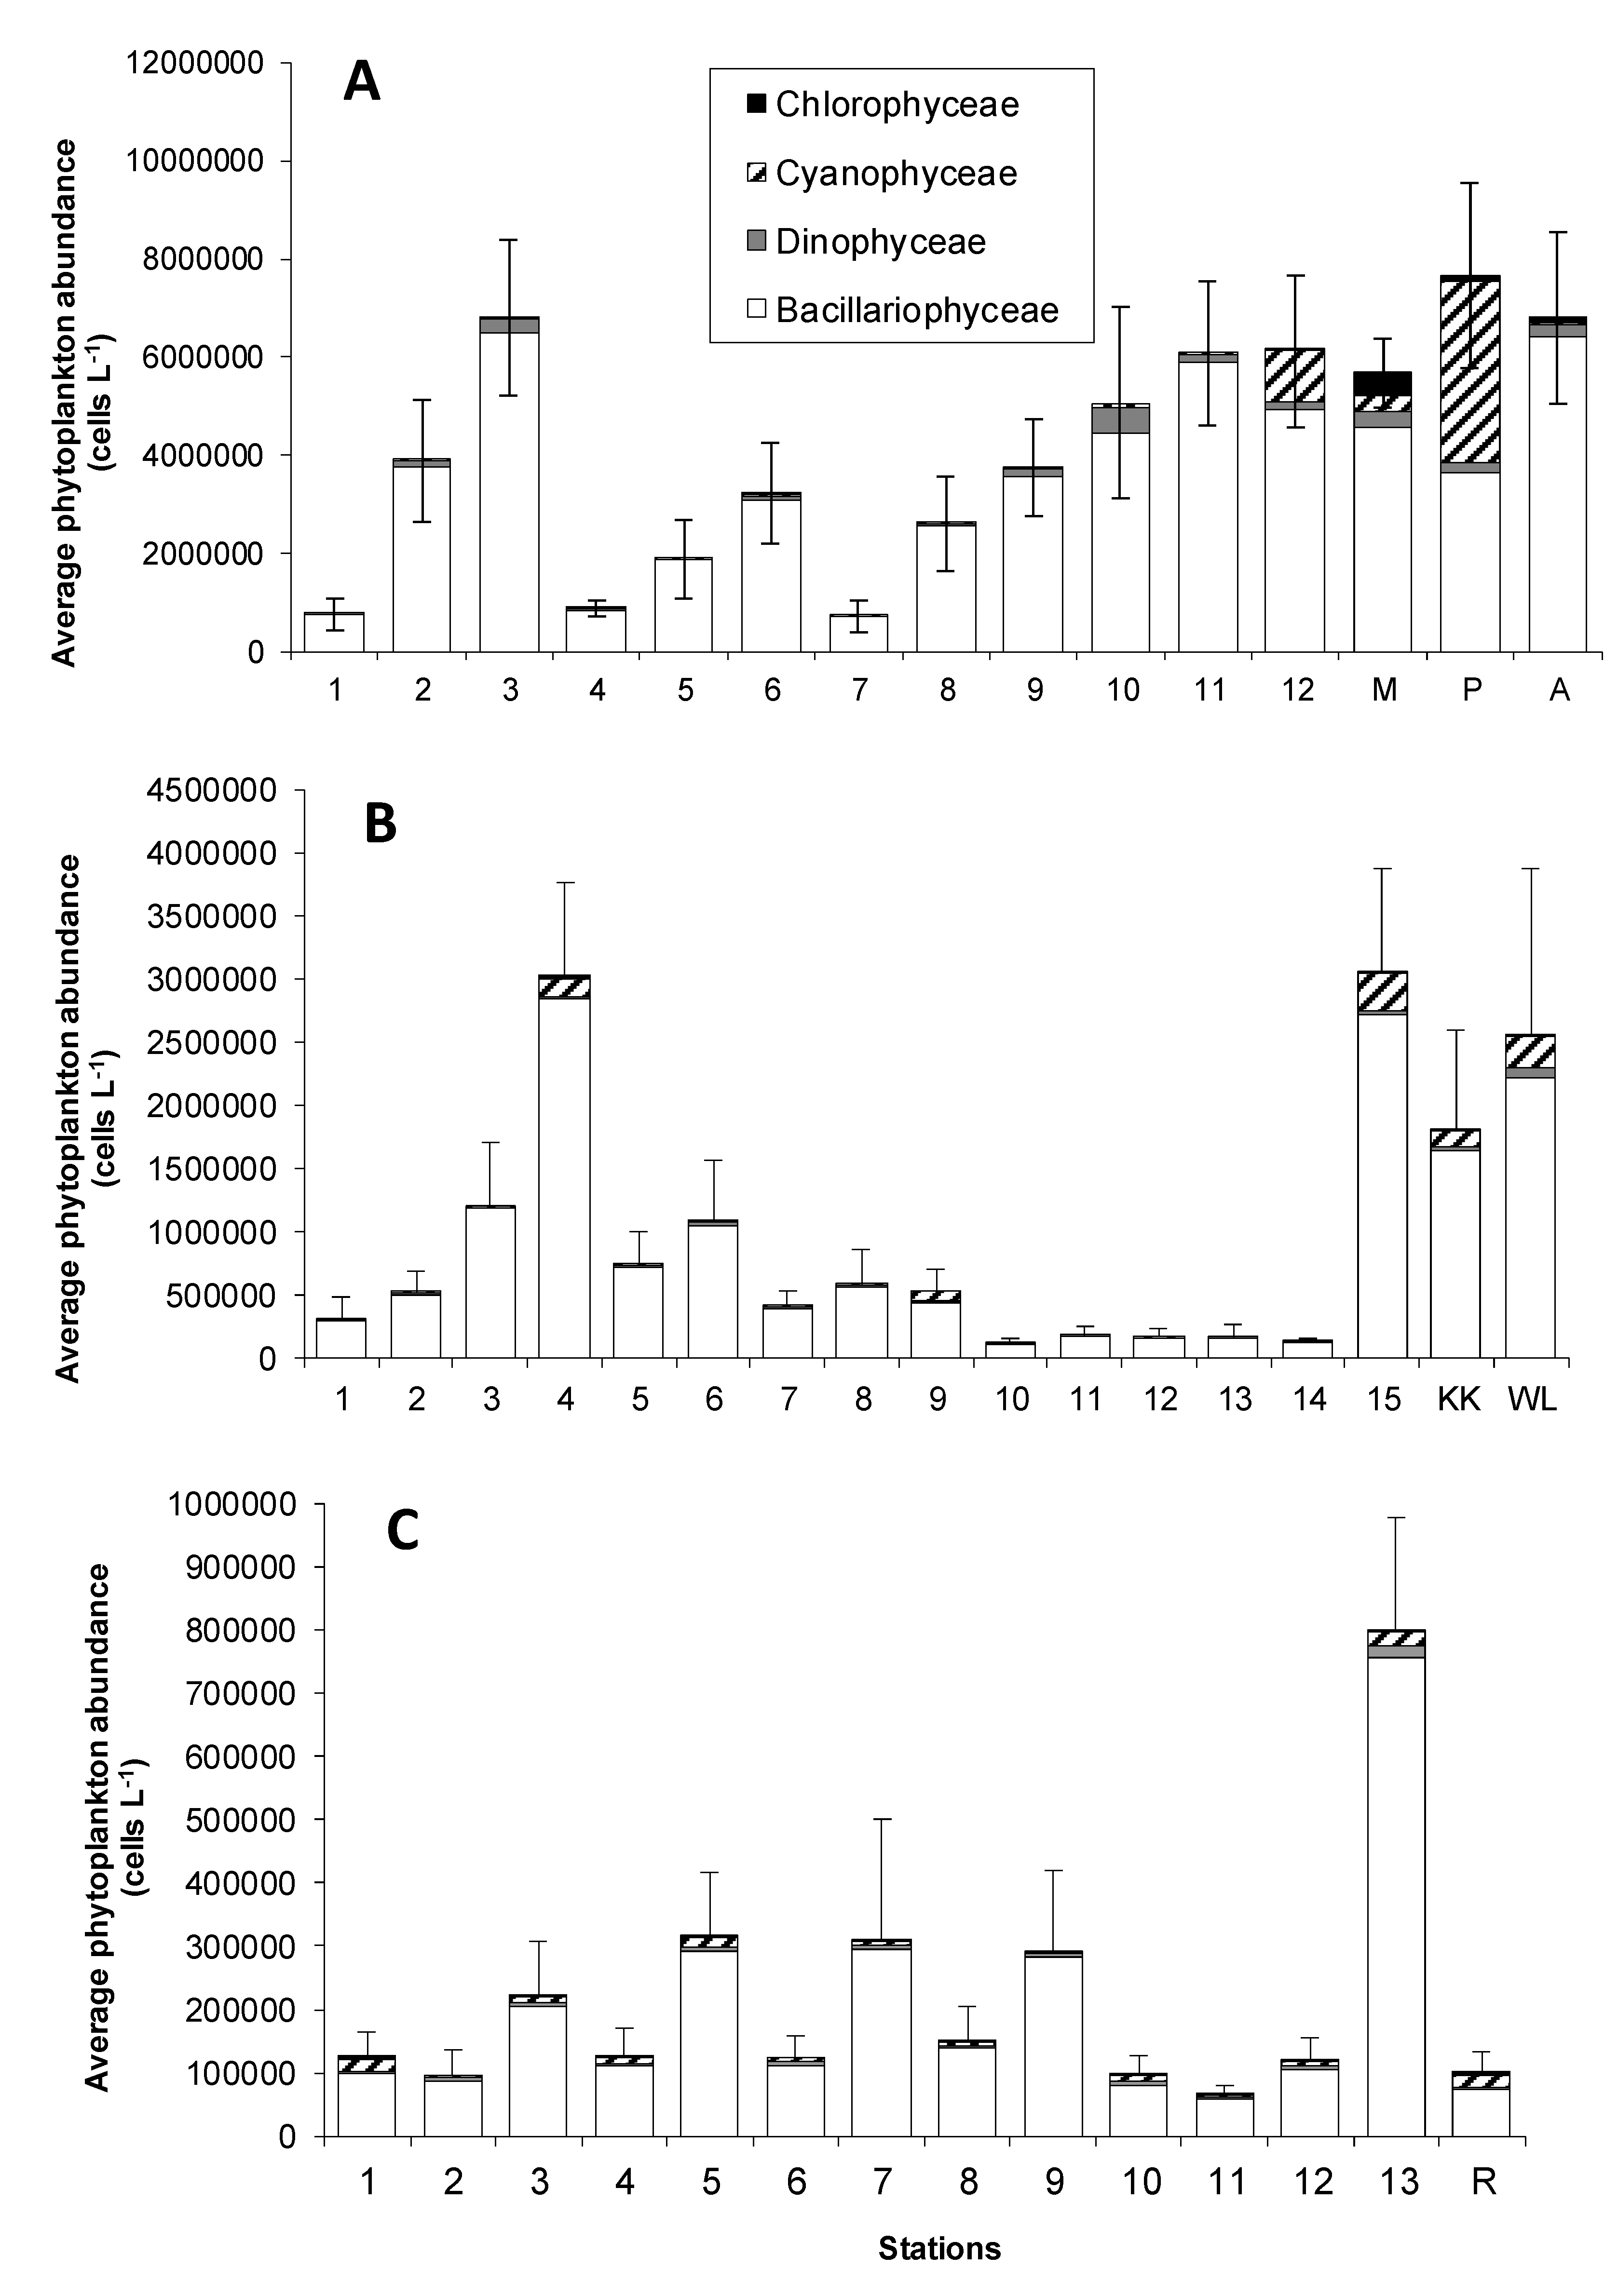
3.1. Pigment Distribution

Pigment composition at all three bays studied consisted of Chl-a, Chl-b, Chl-c, lutein, zeaxanthin, fucoxanthin, peridinin, diadinoxanthin, and ß-carotene. Other pigments were also identified but in very low concentration and frequency, i.e., prasinoxanthin, violaxanthin, and alloxanthin. Major pigments identified are well known as biomarkers for several phytoplankton groups. Pigments of peridinin and Chl-c are markers for dinoflagellates. Pigments of fucoxanthin, diadinoxanthin, and Chl-c are markers for diatoms, while lutein and Chl-b are markers for Chlorophyceae [15,41]. Generally, Chl-a was always the highest in concentration, as this pigment is found in every phytoplankton groups [11,24,41]. Results of phytoplankton pigment analysis show that the concentration of total algae pigments between bays was significantly different (ANOVA; p value 0.0022; F ratio 2.56; degree of freedom 2). A-post LSD Tukey’s test shows that the three bays were significantly difference one to another, showing Jakarta Bay as the highest, with an annual mean of 10.55 µg L−1, Lampung Bay the second highest, with a mean of 3.37 µg L−1, and the lowest was Semangka Bay with a mean of 0.80 µg L−1 (Figure 2 and Figure 3).
There are significant spatial differences in pigment concentration within the bay studied, showing that the highest total pigment concentration was always observed in the area close to the river mouths and inner part of the bay. In Jakarta Bay (ANOVA test; F ratio 2.45; degree of freedom 13; p value 0.000012), the highest total pigment concentration was observed at stations of river mouths of Angke, Priok, and Marunda, which amounted to 16.18 µg L−1, 50.12 µg L−1, and 25.02 µg L−1, respectively. In Lampung Bay (ANOVA test; F ratio 2.29; degree of freedom 16; p value 0.000019), the highest total pigment concentration was observed at stations 4, 15, the KK river mouth, and the WL river mouth, with values of 10.28 µg L−1, 10.83 µg L−1, 4.52 µg L−1, and 19.01 µg L−1, respectively. Stations of KK and WL are located in the river mouth, while stations 4 and 15 are located right in front of those river mouths, characterized by high activity of the fishing port. In Semangka Bay (ANOVA test F ratio 2.29; degree of freedom 13; p value 0.00076), the highest total pigment concentration was observed at station 13 (2.81 µg L−1), where activities of the fishing port are observed, contributing to a high amount of organics.
Different from its spatial distribution, the temporal distribution of pigment concentration shows insignificant differences between dry and rainy periods. In Jakarta Bay, it ranged from 6.17 µg L−1 (the rainy period) to 9.23 µg L−1 (the dry period). In Lampung Bay, it ranged from 1.51 µg L−1 (the rainy period) to 3.21 µg L−1 (the dry period). In Semangka Bay, it ranged from 0.46 µg L−1 (the rainy period) to 1.82 µg L−1 (the dry period). The ANOVA test results show the set of values of insignificant differences between seasons in Jakarta Bay (F ratio 0.68; degree of freedom 5; p value 0.17), Lampung Bay (F ratio 0.25; degree of freedom 5; p value 0.72), and Semangka Bay (F ratio 1.5; degree of freedom 5; p value 0.005).
A clear relationship between nutrient and phytoplankton pigments in the study area was observed. The highest total pigment concentration was always observed in the area where nutrient concentration was the highest. Data on nutrient concentration of this study have been presented previously in Damar et al. [23], showing that the annual mean of DIN, phosphorus, and silicate in Jakarta Bay was significantly higher than those of Lampung and Semangka bays. The annual mean of DIN, phosphorus and silicate in Jakarta Bay were 20.10 µM, 5.08 µM, and 44.80 µM, respectively. The annual mean of Lampung Bay’s was 14.28 µM, 2.32 µM, and 39.34 µM, respectively, and Semangka Bay was 2.71 µM, 0.24 µM, and 22.00 µM for DIN, phosphorus, and silicate, respectively. There were no significant differences (p > 0.005) in term of seasonal nutrient contents in each bay studied, typical for lower seasonal fluctuations of tropical regimes [23]. During the period of the study, insignificant seasonal differences (p > 0.005) in salinity distributions was also observed [23].
In terms of the number of pigment species (not their concentrations), there were no significant differences between stations in each bay and all bays. Almost all pigment species were observed at all of the stations, despites their high variabilities in term of their concentrations. There were significant differences in each pigment species concentration both within and between bay. In Jakarta Bay, the concentration of pigments that were significantly different between stations were Chl-a, Chl-b and lutein (ANOVA p values of 0.00021, 0.00076, and 0.00042, respectively for Chl-a, Chl-b, and lutein). Pigments of Chl-a was significantly higher (ANOVA p value 0.00002; degree of freedom 14) in the river mouths (mean concentration of 18.92 µg L−1), compared to those of outer part of the bay stations (mean concentration of 1.04 µg L−1). Chl-b and lutein were also significantly higher in the river mouths stations rather than other stations (ANOVA p value 0.00014; degree of freedom 14). Chl-b and lutein ranged from 8.76 µg L−1 to 19.26 µg L−1 (Chl-b) and 4.92 µg L−1 to 8.93 µg L−1 (lutein) in these stations, which was four- to nine-fold higher than those of station 4, which was located in the outer part of the bay. In Lampung Bay, besides Chl-a, Chl-b was also significantly higher (ANOVA p value 0.00034; degree of freedom 16) in the river mouth station of WL, showing a mean concentration of 3.32 µg L−1, while the lowest Chl-b was observed at station 14 as low as 0.05 µg L−1. In Semangka Bay, pigments that were significantly different, observed between stations, were Chl-a and fucoxanthin, showing higher values in station 13: as much as 1.59 and 0.68 µg L−1, respectively. The lowest concentration of those two pigments was observed at station 11: as low as 0.17 and 0.09 µg L−1, for both Chl-a and fucoxanthin, respectively (ANOVA p value 0.00094; degree of freedom 13 and p value 0.00098; degree of freedom 13).
These regressions show the relative contribution of individual pigments to trends in total pigment concentrations within each bay, i.e., which pigments (and therefore algal groups) are dominant across that bay. This analysis also can be used for determining the role of a pigment in its location. The results show that there are some differences in the pigments contributing to differences in total pigment concentration in each bay; therefore, it is likely that each bay has distinct algal community composition, dominated by different algal groups, and hence, pigment groups. Results show that strong linear correlation is only observed in the pigments of Chl-a, Chl-b, lutein, and β-carotene (Jakarta Bay), diadinoxanthin, Chl-a, Chl-b, lutein, and β-carotene (Lampung Bay), and Chl-a, Chl-c, fucoxanthin, diadinoxanthin, and β-carotene (Semangka Bay) (Table 1). This correlation shows that those mentioned pigments were not equally distributed in all sampling stations and its variability significantly contributes to the total pigment variability.

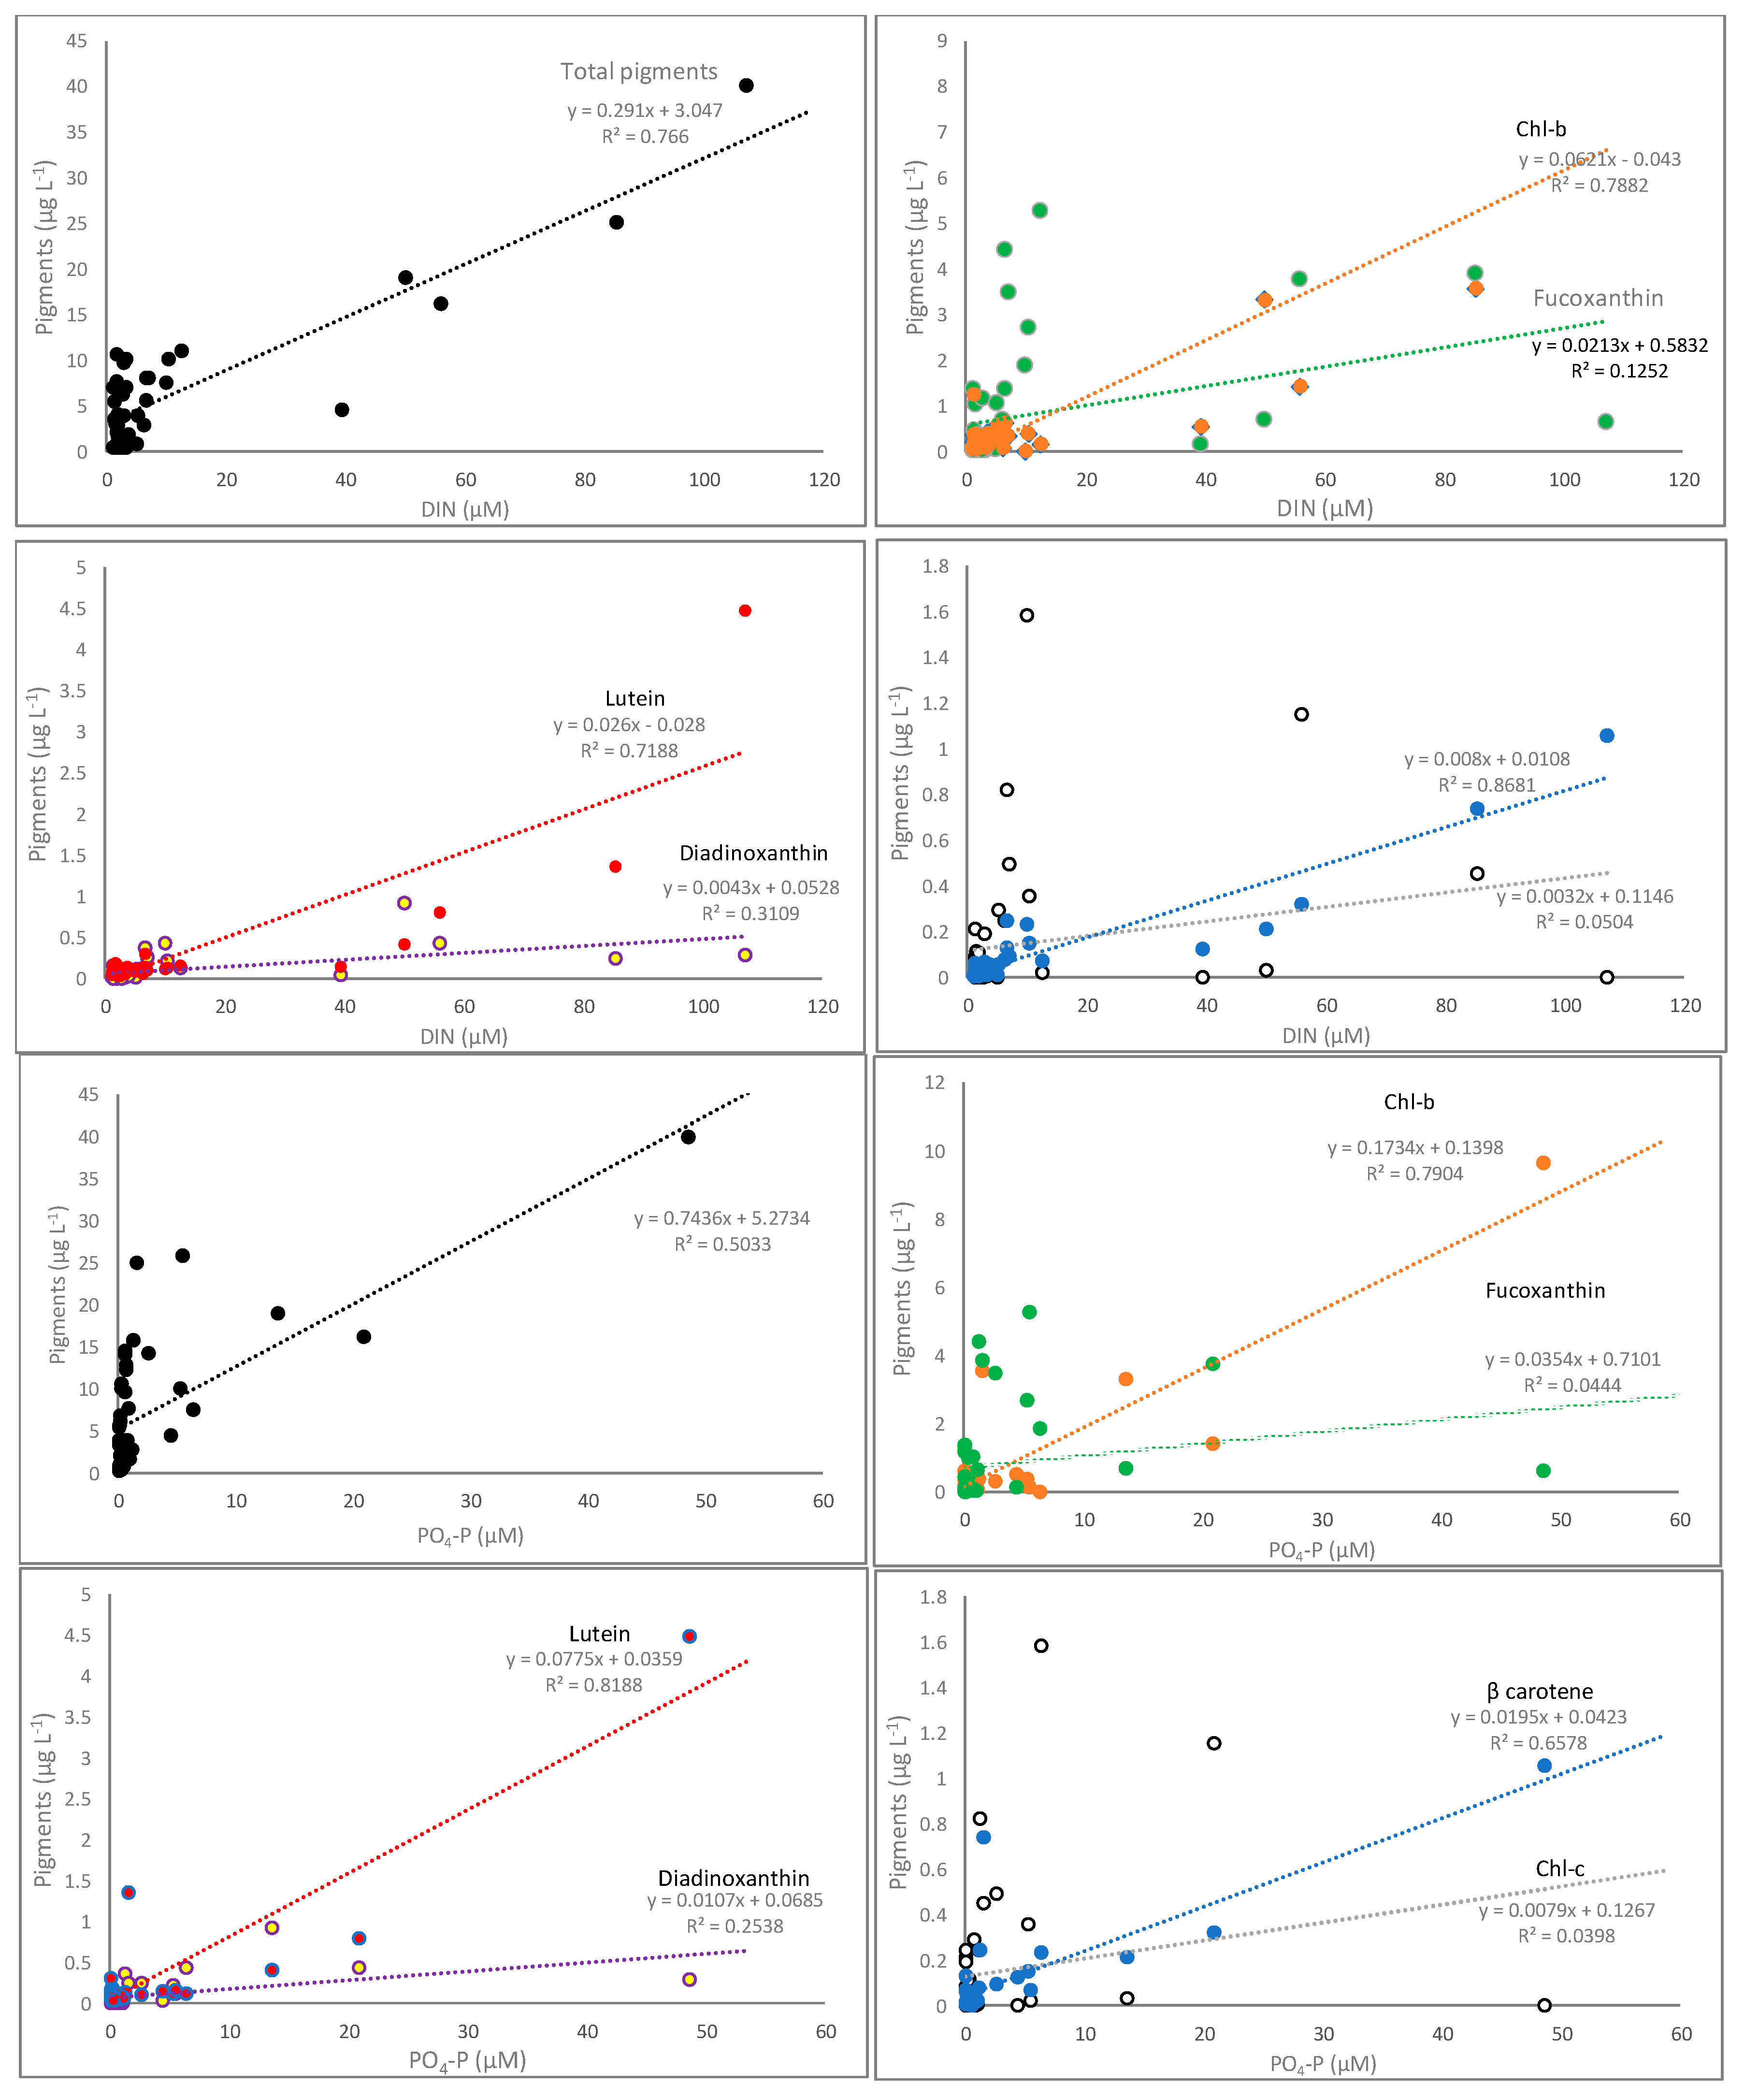
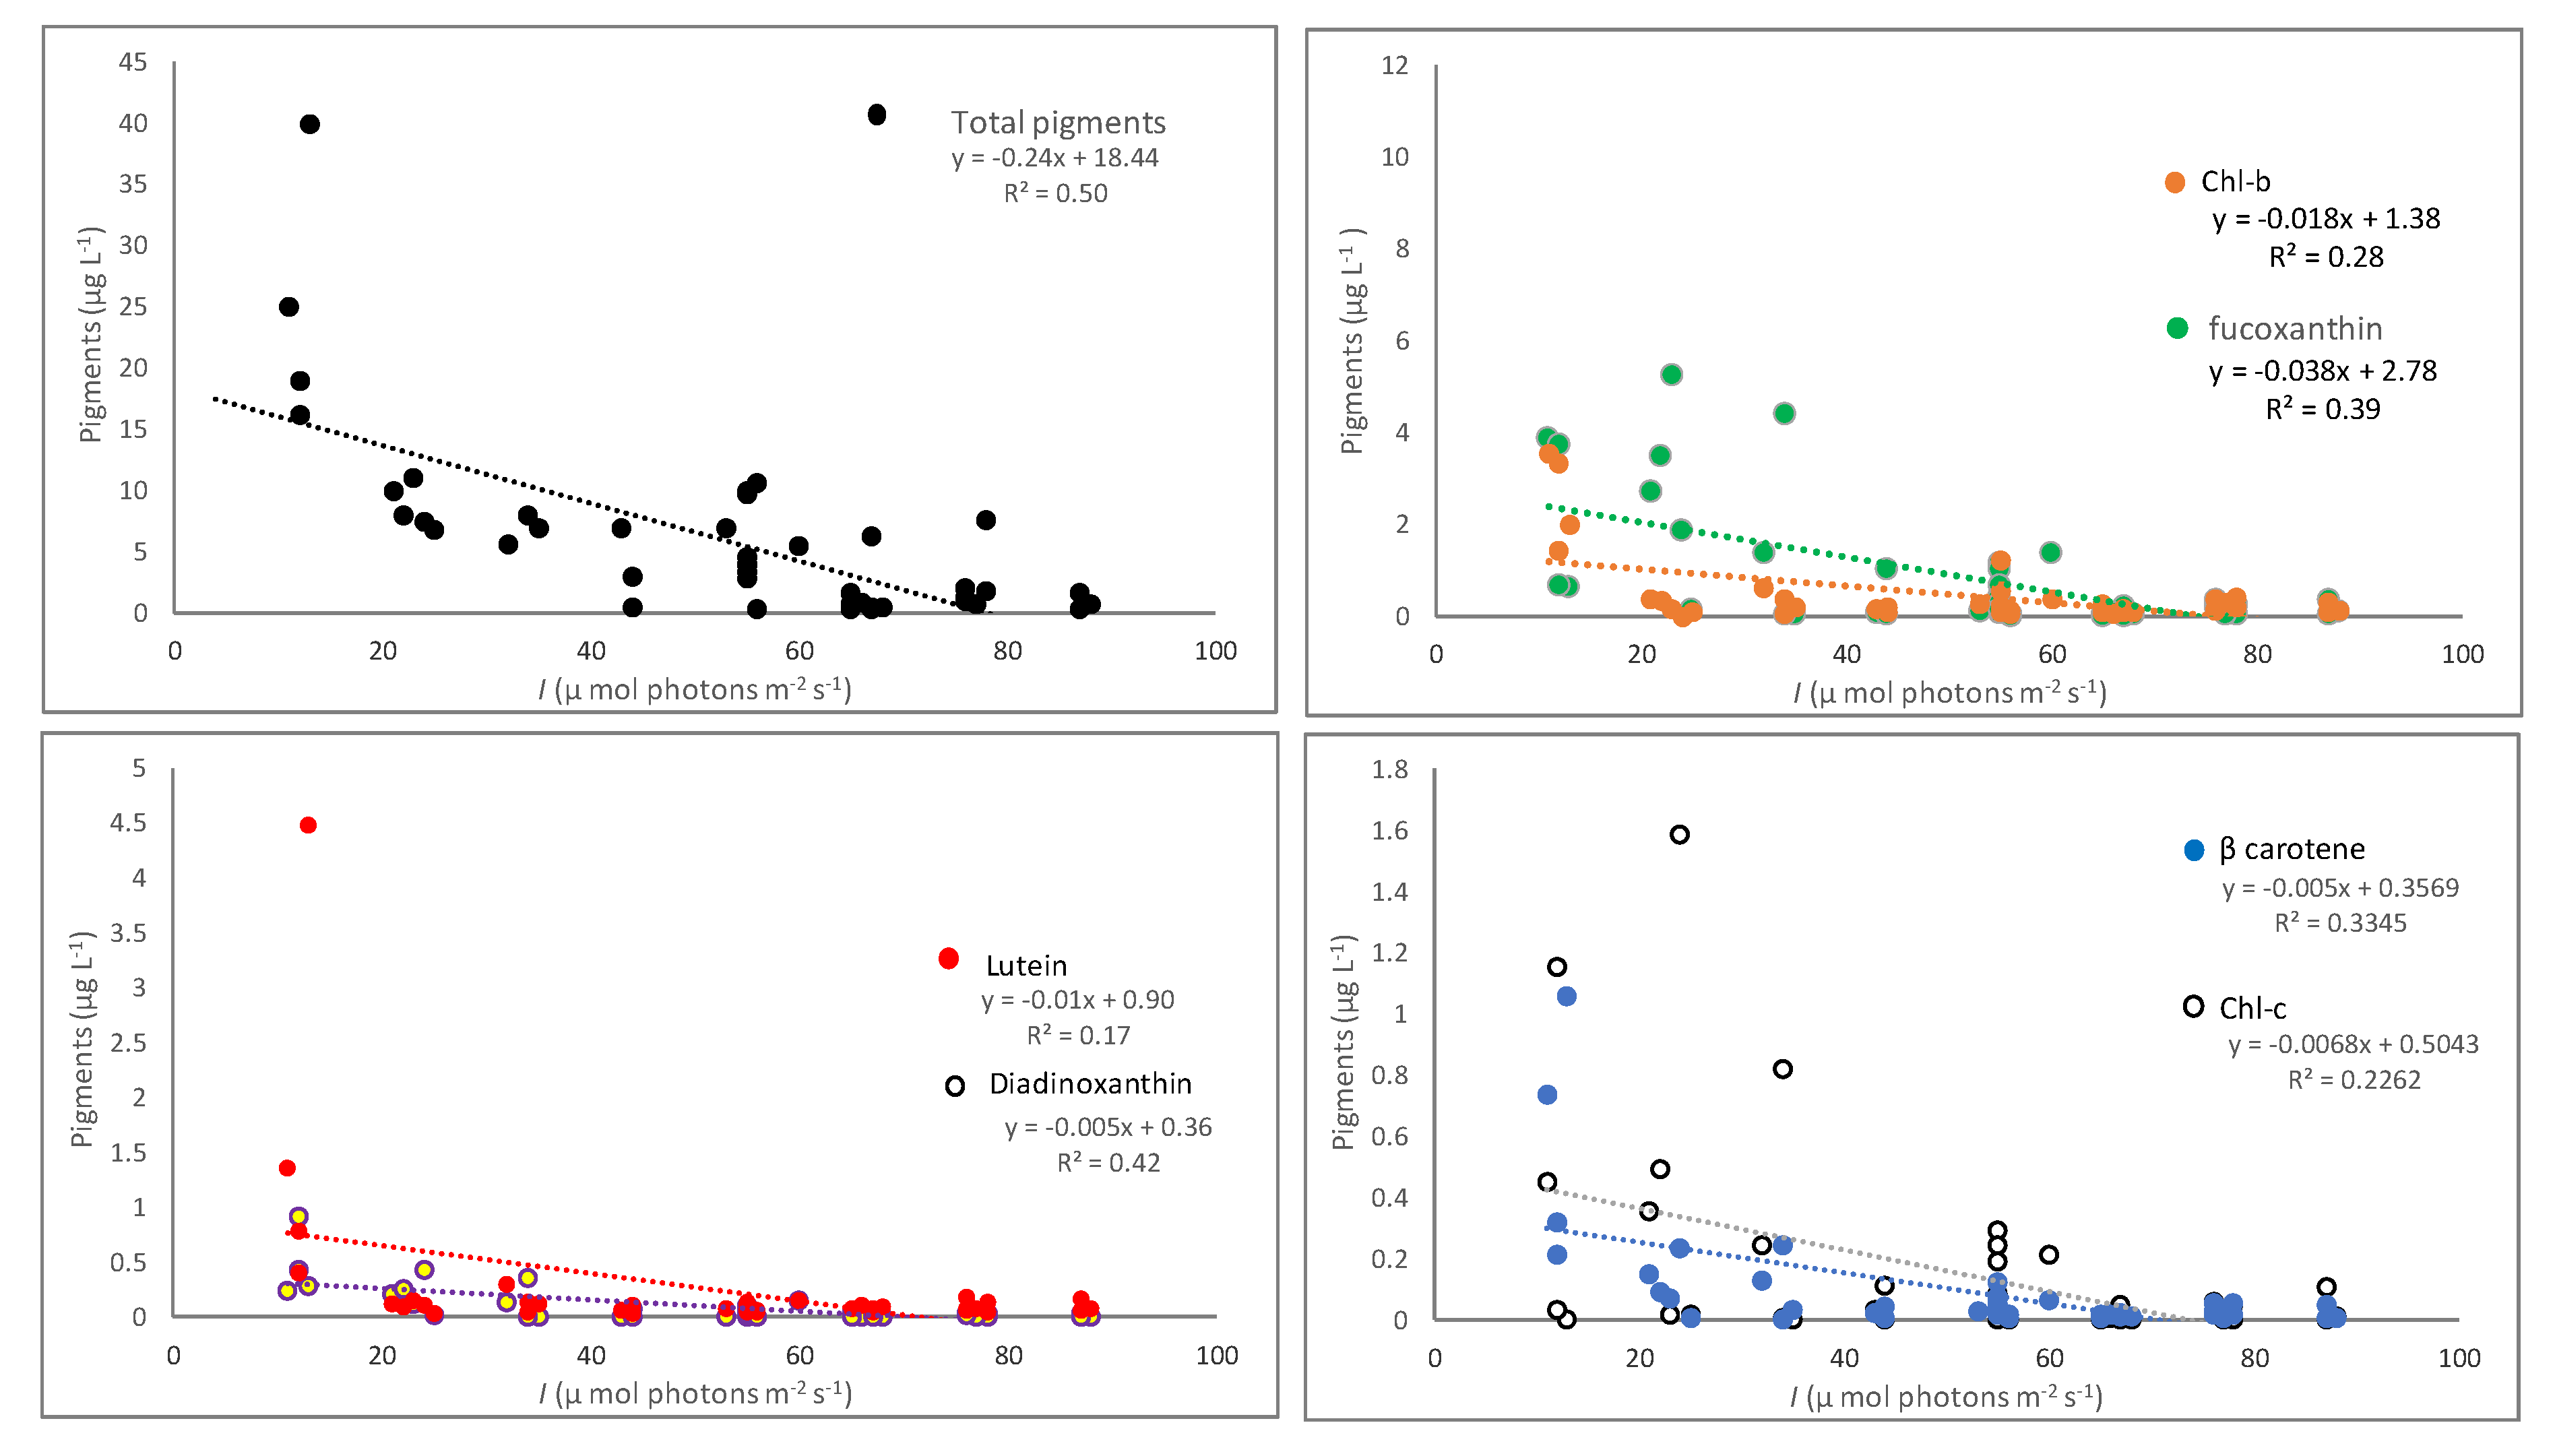
3.2. Pigments Correlation with Nutrients and Underwater Light

Algae pigments and nutrient concentrations have strong linear correlation throughout the bays (Figure 4 and Table 2). The results show that algae pigment concentration variability is significantly linearly regulated by the presence of dissolved inorganic nutrients in the water (Figure 4 and Table 2). Linear regression analyses show strong linear correlation, both for DIN and phosphorus, in particular to total pigments (Figure 4). Similarly, nutrients are positively correlated to total algae pigments throughout the bays (Figure 4), while underwater light is not significantly correlated to total pigments (Figure 5). Regression analysis between light and pigments show that light is not significantly correlated with pigments (Table 2). For a combined total of the bays, the contribution of DIN (R2 = 0.77) is relatively higher compared to that of phosphorus (R2 = 0.50) in regulating the variability of total pigments. However, contributions from both DIN and phosphorus are varied in each bay (Table 2).
Single variable linear regression analysis of each pigment species shows that Chl-b, lutein, and β-carotene are significantly linearly correlated to either DIN or phosphorus (Table 2) in all bays studied. This correlation shows that the concentration of those mentioned pigments is high in high nutrient sites. Those three pigments are well known as biomarkers for Chlorophyceae [15]. At all bays studied, in high nutrient sites such as at river mouths, cell abundance of Chlorophyceae were elevated [23].

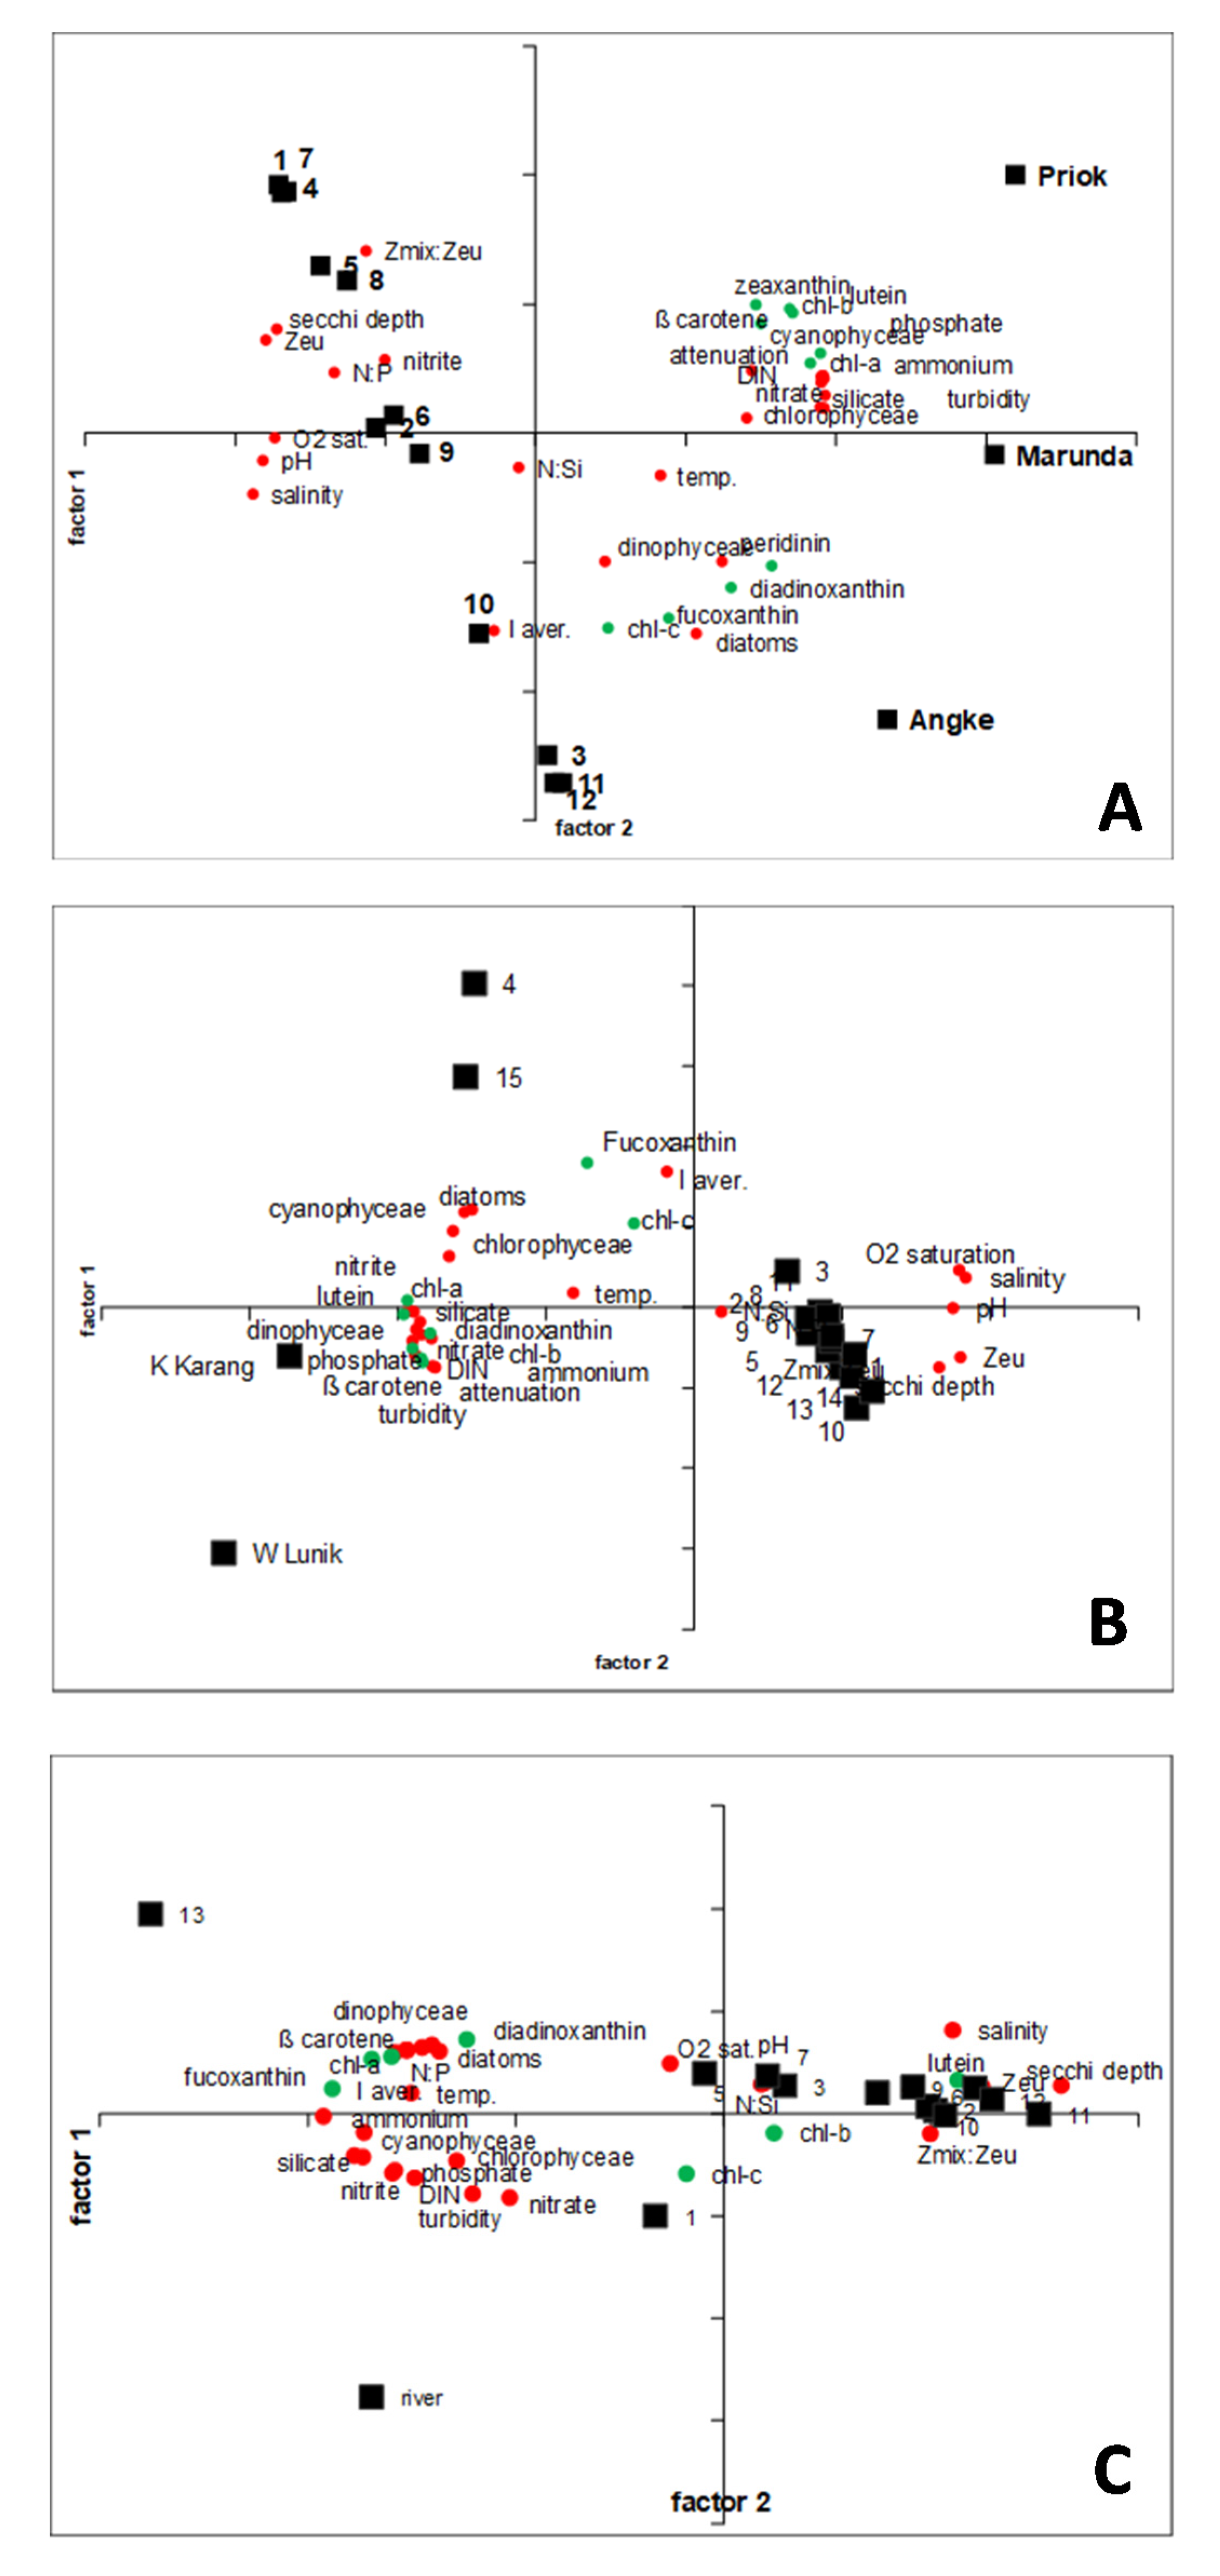
3.3. General Proxy for Phytoplankton Composition

The results of algae pigment analysis at each station and each bay show that pigment composition is in line with the microscopic analysis of phytoplankton groups. Phytoplankton composition results of this study had been published in Damar et al. [23], showing that high phytoplankton abundance in Jakarta Bay was recorded at the stations of river mouths, and inner part of the bay (around 6 × 10⁶ cells L−1), which then decreased to around 2.5 × 10⁶ cells L−1 in the middle part of the bay, and the lowest always observed at the outer part of the bay around 0.8 × 10⁶ cells L−1 (Figure 6). Spatial distribution of each phytoplankton group is also conformed with the spatial distribution of pigment species. In Jakarta Bay at all stations, diatoms dominated the phytoplankton community, ranging from 743,952 cells L−1 at the outermost part of the bay to 6,432,016 cells L−1 at the river mouths. In the river mouths stations, Cyanophyceae was increased, as high as 1,335,371 cells L−1, while at middle and outer parts of the bay were much lower at 46,364 cells L−1 and 2286 cells L−1, respectively. The same was observed with Chlorophyceae, which had higher abundance in the river mouth stations, as high as 242,549 cells L−1, while at the middle and outer parts of the bay, numbers were much lower at 10,658 cells L−1 and 194 cells L−1, respectively. In Jakarta Bay, fucoxanthin as a biomarker for diatoms dominated pigment composition (>50%) at almost all stations, with exceptions at stations 1 and 5 and the Priok River mouth. In these stations, Chl-b and lutein dominated pigment composition (>40%), indicating the presence of Chlorophyceae. As was presented by Damar et al. [23], genus Scenedesmus spp. represented the class of Chlorophyceae in this site. Damar et al. [23] also presented the occurrence of dinoflagellates but in low concentrations (around 15%), marked by the pigments of peridinin and Chl-c. Zeaxanthin, the pigment marker for cyanobacteria, was found only in low concentration, especially at river mouth stations. Microscopic identification showed that the genus of Trichodesmium spp. was responsible for the occurrence of this pigment [35]. Diatoms (Skeletonema costatum, Chaetoceros debilis and Pseudonitzschia spp.) dominated the phytoplankton community, especially in the more offshore stations of Jakarta Bay. Meanwhile, the density of dinoflagellates (Ceratium spp.) and cyanobacteria (Trichodesmium spp.) was elevated in the inshore stations, including river mouths. This elevation conforms to the results of phytoplankton pigments analysis.
Algae pigment analysis of Lampung Bay shows that the pigments were composed by Chl-a, Chl-b, Chl-c, peridinin, zeaxanthin, diadinoxanthin, lutein, fucoxanthin, and ß-carotene. High total pigment concentrations prevailed at river mouths and at the surrounding sites (stations 4 and 15), while at other stations that were located in the more offshore waters, the pigment concentration was low. At all stations, except river mouths, fucoxanthin and diadinoxanthin dominated the phytoplankton pigments, indicating the dominance of diatoms. At river mouths, Chl-b was the dominant pigment, a marker of Chlorophyceae from the genus of Scenedesmus. Chl-c as a biomarker for dinoflagellates was found at almost all sites, but in rather low concentrations.
Distribution of algae pigments in Lampung Bay conforms to microscopic identification on the group of phytoplankton (Figure 6; data taken from Damar et al. [23]), which indicated the dominance of diatoms at all stations (indicated by the presence of fucoxanthin and diadinoxanthin). Manual phytoplankton microscopic identification shows the dominance of Chaetoceros danicus, C. cf. debilis and Pseudonitzschia spp. In Damar et al. [23], the highest phytoplankton abundance in Lampung Bay was always observed at the highest nutrient-level station, i.e., station 4 and 15, which amounted to around 2.5 × 10⁶ cells L−1, while in the middle and outer parts of the bay, it decreased to around 0.5 × 10⁶ cells L−1. Diatoms ranged from 127,795 at the outer stations to 2,716,504 cells L−1 at the river mouth station. Another group, such as Chlorophyceae, was found, but in limited density and only in the river mouth sites (10,511 cells L−1) marked by the pigments of lutein and Chl-b. Dinoflagellates were found in very limited density (ranged from 2794 to 34,522 cells L−1) and frequency, which was marked by peridinin and Chl-c. This group was a minor group and was mostly observed at the river mouths and surrounding areas (stations 4 and 15), represented by Ceratium furca, C. Tripos spp., and Dinophysis spp.
Similar to Jakarta Bay and Lampung Bay, the results of algae pigments and microscopic phytoplankton group identification in Semangka Bay were in conformity. The spatial distribution of algae pigments shows that a high concentration of algae pigments of 1.22 µg L−1 was observed at fishing port waters (station 13). Fucoxanthin was observed in a relatively elevated concentration in this site: as much as 1.22 µg L−1, indicating the dominance of diatoms. At this station, Chl-c and Chl-b were also detected, indicating the contribution of dinoflagellates and Chlorophyceae. Microscopic identification results showed that dinoflagellates consisted of Ceratium furca. In Semangka Bay, as it contains low-nutrient water, phytoplankton abundance of this study, as shown in Damar et al. [23], ranged from 28,679 cells L−1 at the more offshore waters to 1,229,642 cells L−1 at station 13 of the local fishing port. At the other stations of this bay, algae pigments were mainly composed of fucoxanthin and Chl-b, the biomarkers for both diatoms and Chlorophyceae. Microscopic identification indicated the occurrence of diatoms from the genus of Chaetoceros spp., Guinardia flaccida and Rhizosolenia indica.
To support the correlation between pigment concentration and phytoplankton abundance, a set of Pearson’s correlation between groups of phytoplankton abundance and pigment species was developed (Table S1). The results show that diatoms abundance highly correlates with fucoxanthin and diadinoxanthin (Pearson’s r = 0.87 and 0.82 in Jakarta Bay, 0.85 and 0.86 in Lampung Bay, and 0.98 and 0.86 in Semangka Bay, respectively), dinoflagellates highly correlates with Chl-c (Pearson’s r = 0.48 in Jakarta Bay, 0.51 in Lampung Bay and 0.92 in Semangka Bay, respectively) and Chlorophyceae closely correlates with Chl-b and β-carotene (Pearson’s r = 0.51 and r = 0.71 in Jakarta Bay, 0.33 and 0.58 in Lampung Bay and 0.26 and 0.60 in Semangka Bay, respectively).
Principal Component Analysis (PCA) results show that the three bays studied have a similar general pattern (Figure 7) in terms of the relationship between station and pigment and nutrient concentration as well as other parameters. The structure of PCA results are 34.18% and 64.77% of the cumulative variance in the pigments concentrations among stations, which was explained by axis 1 and 2, respectively (Jakarta Bay), 65.99% and 79.46%, respectively (Lampung Bay), and 46.70% and 73.17%, respectively (Semangka Bay).
The high-nutrient stations are characterized by a high concentration of total pigments, and inversely, the low-nutrient stations are characterized by low phytoplankton pigment concentration. For example, in Jakarta Bay (Figure 7, upper chart), station Priok river mouth (Priok) is located in the same quadrant where almost all pigments and nutrients are located, indicating that this station is characterized by high pigment and nutrients concentrations. Inversely, stations of the outer part of the bay, i.e., stations 1, 4, and 7, are characterized by low pigment and nutrient concentration but high in Secchi depth. This spatial-correlation pattern is also observed in both Lampung and Semangka bays. Another remark is in these stations, the presence of phytoplankton group marker pigments, such as Chl-b, Chl-c, peridinin, and β-carotene, began to increase. The relationship between a nutrient and phytoplankton biomass has been widely reviewed, such as those of Mishra et al. [10] and Oseji et al. [42], which demonstrates a positive linear correlation between the two variables, and this strengthens the hypothesis that nutrients are among the main regulators for the development of the phytoplankton community in tropical waters. These results are also supported by multiple linear regression analysis involving total pigments as dependent variable and nutrients and light as independent variables, showing a set of low values of numbers, highlighting the lower contribution of light for total pigments variabilities relative to that of nutrients (Table 3). Thus, in general, the PCA diagrams show clusters of the stations based on each parameter (pigment species, nutrients, physical properties of water, and phytoplankton group abundance), showing that there is a clear separation between high-nutrients sites (either bay or station within bay).

4. Discussion

The results of this comparative study show that nutrients are the main factor regulating phytoplankton development in the bays studied. In this study, the mean pigment concentration of all three different nutrient content bays was significantly different. Jakarta Bay was the highest in the annual mean of total pigment (10.55 μg L−1), followed by Lampung Bay (3.37 μg L−1), and the lowest mean was observed at Semangka Bay (0.80 μg L−1). Within each bay, a similar pattern was observed, showing higher pigment concentration in higher nutrient sites. This pattern is a basic discovery on the relationship between nutrients and phytoplankton development [3,4,5]. Similar results were also obtained from previous researches conducted by Damar et al. [23] and Sidabutar et al. [43] in these bays, who indicated that phytoplankton biomass always prevailed in the high nutrient concentration sites of river mouths and the area close to the nutrient sources. This pattern has been observed by many researchers worldwide [44].
Significant linear correlation was not observed between underwater light and pigment concentrations and they tend to correlate inversely, showing a relatively lower role of light in regulating pigment concentration in the bays studied. This relationship is different from the results of laboratory experiments where light correlates exponentially with pigments [38,45]. In the field, phytoplankton development is not solely governed by light, but is regulated by many other parameters, such as nutrients, temperature, salinity, and the physical movement/hydrodynamics of the waters. In this study, a relative comparison between light and nutrients shows that nutrients seem to be more important in regulating phytoplankton growth [46,47,48]. To support this, besides those two main parameters, this was also observed through our PCA diagrams, where some other parameters were also involved in regulating variabilities of phytoplankton pigments, i.e., salinity, turbidity, water temperature, and dissolved oxygen. However, they were not deeply discussed in this paper. Underwater light parameter in the study area seems to be influenced by water turbidity. In tropical regions where irradiance tends to be stable, turbidity can play an important role in underwater light. Hence, especially in the high nutrient levels of nearshore waters, where turbidity is high, the role of nutrients in regulating phytoplankton growth may be confounded by the role of light availability. In fact, in a single-factor study in the laboratory, the relationship between the light with pigment and phytoplankton biomass is in a non-linear and positive correlation. In their research, Tillmann et al. [38], Kocum et al. [49], and Damar et al. [34] show that the development of phytoplankton biomass is exponentially correlated with light resources.
The results of the multilinear regression analysis between the total pigment and a combination of nutrient and light indicate a pattern that is not different from that of a single linear regression result. DIN and phosphorus are positively correlated with total pigment, while the light relates inversely with total pigments. The contributions of nutrients in determining phytoplankton development seem to be relatively higher than that of the light. This conclusion is in accordance with the results of the previous studies in tropical waters, as done by Guo et al. [25] in their research in the South China Sea and Raveh et al. [7] in the Mediterranean Sea.
In a natural situation, the relationship between phytoplankton development and environmental factors is a complex process. In its relation to nutrient and light, phytoplankton development is influenced by both of the factors in a unique process. Cloern [3] and Kochum et al. [49] used a relative diagram between nutrient and light in influencing the development of the phytoplankton community. The analysis used shows that both resources work together in influencing the success of phytoplankton development. Studies were done by Wilkerson et al. [50], Guinder et al. [51], and Xiao et al. [52], who evaluated decadal dynamics of diatoms developments, showing that the two resources (nutrients and light) were not solely influencing the development of phytoplankton biomass, but were also driven by other factors, such as physical and predatory factors. In an estuary, the bloom of phytoplankton will only occur if turbulence and sea currents are in minimum condition, which allows the accumulation of phytoplankton biomass. Lagaria et al. [47], in their research in the North East of the Aegean Sea, also discussed the importance of hydrographic factors in influencing the structure of phytoplankton communities. Nevertheless, underwater light observed in this study is relatively lower compared to the mean average standard for photosynthetic processes [3,38], which could be a plausible reason as to why nutrients play a more important role in determining the development of phytoplankton.
In this study, within the bay, it can be seen that there was a pattern showing a high concentration of algae pigments in the river mouths and adjacent waters, underlining again the significant role of riverine nutrients input for phytoplankton development. This pattern is also seen from the high correlation between each nutrient species and salinity in all bays studied [23]. In an estuary, water with lower salinity is characterized by higher nutrient concentration. A similar conclusion was also stated by Gieskes et al. [24] in the Banda Sea Indonesia and Chai et al. [46] in Pearl River Estuary. Studies were conducted by Van de Vyvera et al. [48] in temperate lakes in Chile, by Guo et al. [25] in the South China Sea, and by Wilkerson et al. [50], who described similar findings, showing that physical factors such as wind and upwelling play important roles in phytoplankton bloom development.
The result of the correlation analysis and regression between different types of pigments with phytoplankton group abundances show a similar pattern. Diatoms that were observed at all of the stations are closely correlated with fucoxanthin pigment. Dinoflagellates are characterized by the presence of peridinin and Chl-c, while Chlorophyceae is characterized by the strong correlation between cell abundance with Chl-b and lutein. Meanwhile, cyanobacteria are characterized by a strong relationship with zeaxanthin. Those pigments are well known as markers for the mentioned groups of phytoplankton as stated by Jeffrey et al. [15] and Wright [41].
Analyses of phytoplankton pigment results correspond closely with those from microscopic phytoplankton group identification. However, some remarks about the advantages and also the weakness of using quantitative pigment determination for the identification of phytoplankton groups are widely discussed by Irigoien et al. [53], Aneeshkumar and Sujatha [18], Lima et al. [19], and Sañé et al. [33]. There are several conditions where pigment identification results still need to be adjusted by microscopic identification of phytoplankton species. Both techniques can be used together and will give better results [19,33]. More detailed studies on chemo-analytical of photosynthetic pigments need to be done, as has been shown by Aneeshkumar and Sujatha [18] and Thrane et al. [54]. This is also mentioned by Jeffrey et al. [15] and Wright [41], who revealed that some of the phytoplankton groups have similar major pigments, suggesting that the determination of phytoplankton species using algae pigments needs to be precautioned. Phycocyanin is not the only marker for dinoflagellates, it functions a similar purpose for cyanobacteria. Furthermore, it is also a marker for Chlorophyceae. Compilation studies were done by Aneeshkumar and Sujatha [18], showing that each group of phytoplankton is marked by more than a single major pigment. In their compilation based on the studies done by Jeffrey et al. [15] and Wright [41], cyanobacteria are marked by the presence of major pigments of zeaxanthin and β-carotene. Dinoflagellates group is marked by major pigments of Chl-c, diadinoxanthin, and peridinin. Diatoms are marked by major pigments of Chl-c, diatoxanthin, and fucoxanthin. Fucoxanthin and diadinoxanthin are also linked to Chysophyceae.
Based on the biplot principal component analysis (PCA) analysis, the three bays were shown to have a similar general spatial distribution pattern. The high-nutrient stations (river mouth and inner part of the bay stations) were characterized by a high concentration of total pigments, and inversely, the low-nutrient stations (middle and outer part of the bay) were characterized by low phytoplankton pigments. Furthermore, in the high-nutrient stations, the diversity of pigment types also increased. In these stations, the presence of phytoplankton group marker pigments, such as Chl-b, Chl-c, peridinin and β-carotene began to increase. The relationship between nutrient and phytoplankton biomass has been widely reviewed, such as those of Mishra et al. [10] and Oseji et al. [42], who demonstrated a positive linear correlation between the two variables, and this strengthens the hypothesis that nutrients play an important role in the development of phytoplankton communities. It can be seen in the PCA graphs that the variable of underwater light availability (I ave.) was located close to the center of the axes, mentioning the relatively lower contribution on the regulation of phytoplankton biomass variabilities. This is different from nutrients, which are located relatively far from the center, showing a strong correlation to phytoplankton biomass. These analyses suggest that in the three bays studied, light plays lower roles compared to that of nutrients in regulating phytoplankton growth. However, this finding might only be applied to this study and cannot be applied to other tropical bays, since coastal phytoplankton ecology is site-specific, as has been shown by [3,4], who stated that it varied between coastal waters and depended on local water properties, physical processes, and climatic variabilities.

5. Conclusions

In tropical coastal waters, nutrients are major resources for phytoplankton development, as shown by this study, which presents higher phytoplankton pigments concentrations in higher nutrient waters. It is also clearly seen that within each bay, high pigment concentration always prevailed in the high nutrient sites. Specific for the tropical location of this study, where light is always relatively available throughout the year, the contribution of underwater light availability seems to be less pronounced, especially in the high-nutrient, turbid, nearshore waters. In these sites, the response of the phytoplankton community to nutrients confounded the typical relationship observed with light. Phytoplankton pigments can be used as proxies to support microscopic phytoplankton group identification, though with some precaution, since some pigments are biomarkers for several groups of phytoplankton. The nutrient enrichment in tropical estuarine environments is still an interesting topic to be explored, not only for the sake of scientific development, but also for handling some ecological problems of eutrophication in tropical waters.

Supplementary Materials

The following is available online at https://www.mdpi.com/2077-1312/8/5/311/s1, Table S1: Pearson’s correlation coefficients between pigment concentrations and phytoplankton group abundances in each bay.

Author Contributions

Conceptualization, A.D., F.C., and K.-J.H.; methodology, A.D., F.C., and K.-J.H.; software, A.D.; validation, A.D., F.C., and K.-J.H.; formal analysis, A.D. and F.K.; investigation, A.D., F.C., and K.-J.H.; resources, A.D., F.C., and K.-J.H.; data curation, A.D.; writing—original draft preparation, A.D.; writing—review and editing, A.D. and F.K.; visualization, A.D. and F.K.; supervision, A.D., F.C., and K.-J.H.; project administration, A.D.; funding acquisition, A.D. All authors have read and agreed to the published version of the manuscript.

Funding

This research was funded by the Deutscher Akademischer Austauschdienst (DAAD), Germany, which is part of the scholarship study awards number A/99/09416, 1999.

Acknowledgments

The authors would like to thank the Forschungs-und Technologie Zentrum (FTZ)-Westkueste, Germany, for providing working space, including the use of laboratories in analyzing algae pigments samples, the Center for Coastal and Marine Resources Studies, IPB University (PKSPL IPB), Indonesia, for giving field research facilities, and to the Deutscher Akademischer Austauschdienst (DAAD), Germany, for giving a Ph.D. study scholarship to the first author from 1999 to 2003. Special thanks go to Britta Egge (FTZ-Westkueste Buesum) for her very valuable works in helping the first authors during pigment samples analysis of this research. Sincere thanks go out to Cornelia Reineke (FTZ-Westkueste Buesum) for tutoring the first author on how to work with phytoplankton samples during the period of the research.

Conflicts of Interest

We declare that we do not have any conflict of interest related to this research and publication.

References

  1. Ferrier-Pages, C.; Gattuso, J.-P.; Dallot, S.; Daubert, J. Effect of nutrient enrichment on growth and photosynthesis of the zooxanthellate coral Stylophora pistillata. Coral Reefs 2000, 19, 103–113. [Google Scholar] [CrossRef]
  2. Riemann, L.; Nielsen, T.G.; Kragh, T.; Richardson, K.; Parner, H.; Jakobsen, H.H.; Munk, P. Distribution and production of plankton communities in the subtropical convergence zone of the Sargasso Sea. I. Phytoplankton and bacterioplankton. Mar. Ecol. Prog. Ser. 2011, 426, 57–70. [Google Scholar] [CrossRef] [Green Version]
  3. Cloern, J.E. The relative importance of light and nutrient limitation of phytoplankton growth: A simple index of coastal ecosystem sensitivity to nutrient enrichment. Aquat. Ecol. 1999, 33, 3–16. [Google Scholar] [CrossRef]
  4. Cloern, J.E. Our evolving conceptual model of the coastal eutrophication problem. Mar. Ecol. Prog. Ser. 2001, 210, 223–253. [Google Scholar] [CrossRef]
  5. Colijn, F.; Hesse, K.-J.; Ladwig, N.; Tillmann, U. Effects of the large-scale uncontrolled fertilisation process along the continental coastal North Sea. Hydrobiologia 2002, 484, 133–148. [Google Scholar] [CrossRef]
  6. Kitsiou, D.; Karydis, M. Coastal marine eutrophication assessment: A review on data analysis. Environ. Int. 2011, 37, 778–801. [Google Scholar] [CrossRef]
  7. Raveh, O.; Angel, D.L.; Astrahan, P.; Belkin, N.; Bar-Zeev, E.; Rahava, E. Phytoplankton response to N-rich well amelioration brines: A mesocosm study from the southeastern Mediterranean Sea. Mar. Pollut. Bull. 2019, 146, 355–365. [Google Scholar] [CrossRef]
  8. Anderson, D.M. Approaches to monitoring, control and management of harmful algal blooms (HABs). Ocean Coast. Manag. 2009, 52, 342–347. [Google Scholar] [CrossRef] [Green Version]
  9. Agirbas, E.; Koca, L.; Aytan, U. Spatio-temporal pattern of phytoplankton and pigment composition in surface waters of south-eastern Black Sea. Oceanologia 2017, 59, 283–299. [Google Scholar] [CrossRef]
  10. Mishra, R.K.; Senga, Y.; Nakata, K.; Mishra, S.; Sahu, B.K. Spatio-temporal variation of Prochlorococcus and phytoplankton community between Shimizu coast and Suruga bay, Northwest Pacific Ocean. Reg. Stud. Mar. Sci. 2020, 33, 100890. [Google Scholar] [CrossRef]
  11. Reuss, N. Sediment Pigments as Biomarkers of Environmental Change. Ph.D. Thesis, University of Copenhagen, Copenhagen, Denmark, March 2005. [Google Scholar]
  12. Barlow, R.; Lamont, T.; Kyewalyanga, M.; Sessions, H.; Morris, T. Phytoplankton production and physiological adaptation on the southeastern shelf of the Agulhas ecosystem. Cont. Shelf Res. 2010, 30, 1472–1486. [Google Scholar] [CrossRef]
  13. Lamont, T.; Barlow, R.G.; Kyewalyanga, M.S. Physical drivers of phytoplankton production in the southern Benguela upwelling system. Deep Sea Res. Part I 2014, 90, 1–16. [Google Scholar] [CrossRef]
  14. Hashihama, F.; Umeda, H.; Hamada, C.; Kudoh, S.; Hirawake, T.; Satoh, K.; Fukuchi, M.; Kashino, Y. Light acclimation states of phytoplankton in the Southern Ocean, determined using photosynthetic pigment distribution. Mar. Biol. 2010, 157, 2263–2278. [Google Scholar] [CrossRef]
  15. Jeffrey, S.W.; Mantoura, R.F.C.; Wright, S.W. Phytoplankton Pigments in Oceanography; UNESCO Publishing: Paris, France, 1997; p. 661. [Google Scholar]
  16. Jeffrey, S.W.; Wright, S.W.; Zapata, M. Recent advances in HPLC pigment analysis of phytoplankton. Mar. Freshw. Res. 1999, 50, 879–896. [Google Scholar] [CrossRef]
  17. Wright, S.W.; Jeffry, S.W. Fucoxanthin pigment markers of marine phytoplankton analyzed by HPLC and HPTLC. Mar. Ecol. Prog. Ser. 1987, 38, 259–266. [Google Scholar] [CrossRef]
  18. Aneeshkumar, N.; Sujatha, C.H. Biomarker pigment signatures in Cochin back water system—A tropical estuary south west coast of India. Estuar. Coast. Shelf Sci. 2012, 99, 182–190. [Google Scholar] [CrossRef]
  19. Lima, C.R.; Mendesa, C.R.B.; Tavanoa, V.M.; Detonia, A.M.S.; Secchi, E.R. Chemotaxonomy-based mapping of phytoplankton communities in the subtropical Southwestern Atlantic Ocean, with emphasis on the marine cyanobacterium Trichodesmium. Prog. Oceanogr. 2019, 172, 77–88. [Google Scholar] [CrossRef]
  20. Yang, S.; Cui, Z.; Zhang, Y.; Jiang, T.; Yang, Q.; Sun, Y. Photosynthetic pigments in surface sediments in the northwest of the Bohai Sea, China: Potential implications for sediment deposition of brown tides of Aureococcus anophagefferens in coastal waters. Ecol. Indic. 2019, 102, 145–153. [Google Scholar] [CrossRef]
  21. Foy, R.H. The phycocyanin to chlorophyll a ratio and other cell components as indicators of nutrient limitation in two planktonic cyanobacteria subjected to low-light exposures. J. Plankton Res. 1993, 15, 1263–1276. [Google Scholar] [CrossRef]
  22. Leavitt, P.R.; Hodgson, D.A. Sedimentary Pigments. In Tracking Environmental Change Using Lake Sediments; Smol, J.P., Birks, H.J.B., Last, W.M., Bradley, R.S., Alverson, K., Eds.; Kluwer Academic Publishers: Dordrecht, The Netherlands, 2001; pp. 295–325. [Google Scholar]
  23. Damar, A.; Colijn, F.; Hesse, K.-J.; Wardiatno, Y. The eutrophication states of Jakarta, Lampung and Semangka Bays: Nutrient and phytoplankton dynamics in Indonesian tropical waters. J. Trop. Biol. Conserv. 2012, 9, 61–81. [Google Scholar]
  24. Gieskes, W.W.C.; Kraay, G.W.; Nontji, A.; Setiapermana, D.; Sutomo. Monsoonal alternation of a mixed and a layered structure in the phytoplankton of the euphotic zone of the Banda Sea (Indonesia): A mathematical analysis of algal pigment fingerprints. Neth. J. Sea Res. 1988, 22, 123–137. [Google Scholar] [CrossRef]
  25. Guo, X.; Wang, Z.H.; Zhao, J.G.; Xiao, L.; Jiang, T. Effects of inorganic nutrients on the phytoplankton community in the sea surface microlayer of Daya Bay, South China Sea. J. Sea Res. 2020, 156, 101830. [Google Scholar] [CrossRef]
  26. Chacko, N. Chlorophyll bloom in response to tropical cyclone Hudhud in the Bay of Bengal: Bio-Argo subsurface observations. Deep Sea Res. Part I Oceanogr. Res. Pap. 2017, 124, 66–72. [Google Scholar] [CrossRef]
  27. Chakraborty, K.; Nimit, K.; Akhand, A.; Prakash, S.; Paul, A.; Ghosh, J.; Bhaskar, T.V.S.U.; Chanda, A. Modeling the enhancement of sea surface chlorophyll concentration during the cyclonic events in the Arabian Sea. J. Sea Res. 2018, 140, 22–31. [Google Scholar] [CrossRef]
  28. George, J.V.; Nuncio, M.; Chacko, R.; Anilkumar, N.; Noronha, S.B.; Patil, S.M.; Pavithran, S.; Alappattu, D.P.; Krishnan, K.P.; Achuthankutty, C.T. Role of physical processes in chlorophyll distribution in the western tropical Indian Ocean. J. Mar. Syst. 2013, 113–114, 1–12. [Google Scholar] [CrossRef]
  29. Hou, X.; Dong, Q.; Xue, C.; Wu, S. Seasonal and interannual variability of chlorophyll-a and associated physicalsynchronous variability in the western tropical Pacific. J. Mar. Syst. 2016, 158, 59–71. [Google Scholar] [CrossRef]
  30. Krishna, K.M. Variability of SeaWiFS-derived chlorophyll-a concentrations in waters off central east coast of India, 1998–2003. Int. J. Appl. Earth Obs. Geoinf. 2010, 12, 101–109. [Google Scholar] [CrossRef]
  31. Nukapothula, S.; Chen, C.; Yunus, A.P.; Wu, J. Satellite-based observations of intense chlorophyll-a bloom in response of cold core eddy formation: A study in the Arabian Sea, Southwest Coast of India. Reg. Stud. Mar. Sci. 2018, 24, 303–310. [Google Scholar] [CrossRef]
  32. Zhang, S.; Xie, L.; Hou, Y.; Zhao, H.; Qi, Y.; Yi, X. Tropical storm-induced turbulent mixing and chlorophyll-a enhancement in the continental shelf southeast of Hainan Island. J. Mar. Syst. 2014, 129, 405–414. [Google Scholar] [CrossRef] [Green Version]
  33. Sañé, E.; Valente, A.; Fatela, F.; Cabral, M.C.; Beltrán, C.; Drago, T. Assessment of sedimentary pigments and phytoplankton determined by CHEMTAX analysis as biomarkers of unusual upwelling conditions in summer 2014 off the SE coast of Algarve. J. Sea Res. 2019, 146, 33–45. [Google Scholar] [CrossRef]
  34. Damar, A.; Colijn, F.; Hesse, K.-J. Effects of different nutrient loadings on planktonic primary production in embayments of Indonesia. J. Trop. Biol. Conserv. 2014, 11, 63–85. [Google Scholar]
  35. Damar, A. Effects of Enrichment on Nutrient Dynamics, Phytoplankton Dynamics and Primary Production in Indonesian Tropical Waters: A Comparison between Jakarta Bay, Lampung Bay and Semangka Bay. Ph.D. Thesis, University of Kiel, Kiel, Germany, 2003. [Google Scholar]
  36. Mantoura, R.F.C.; Llewellyn, C.A. The rapid determination of algal chlorophyll and carotenoid pigments and their breakdown products in natural waters by reverse-phase-high-performance liquid chromatography. Anal. Chim. Acta 1983, 151, 297–314. [Google Scholar] [CrossRef]
  37. Lalli, C.M.; Parsons, P.R. Biological Oceanography. An Introduction, 2nd ed.; Elsevier Butterworth-Heinemann: Oxford, UK, 1997. [Google Scholar]
  38. Tillmann, U.; Hesse, K.-J.; Colijn, F. Planktonic primary production in the German Wadden Sea. J. Plankton Res. 2000, 22, 1253–1276. [Google Scholar] [CrossRef]
  39. Grasshoff, K.; Kremling, K.; Ehrhardt, M. Methods of Seawater Analysis; Verlag Chemie Weinheim: Deerfield Beach, FL, USA, 1983; p. 419. [Google Scholar]
  40. Utermöhl, H. Zur vervollkommnung der quantitativen phytoplankton-methodik. Int. Ver. Theor. Angew. Limnol. Mitt. 1958, 9, 1–38. [Google Scholar] [CrossRef]
  41. Wright, S.W. Analysis of phytoplankton populations using pigment markers. In Proceedings of the Course Notes for a Workshop “Pigment Analysis of Antarctic Microorganisms”, Kuala Lumpur, Malaysia, 29 June–1 July 2005. [Google Scholar]
  42. Oseji, O.F.; Chigbu, P.; Oghenekaro, E.; Waguespack, Y.; Chen, N. Spatiotemporal patterns of phytoplankton composition and abundance in the Maryland Coastal Bays: The influence of freshwater discharge and anthropogenic activities. Estuar. Coast. Shelf Sci. 2018, 207, 119–131. [Google Scholar] [CrossRef]
  43. Sidabutar, T.; Bengen, D.G.; Wouthuyzen, S.; Partono, T. The abundance of phytoplankton and its relationship to the N/P ratio in Jakarta Bay, Indonesia. Biodiversitas 2016, 17, 673–678. [Google Scholar] [CrossRef]
  44. Dring, M.J. The Biology of Marine Plants; Edward Arnold (Publishers) Limited: London, UK, 1982; p. 129. [Google Scholar]
  45. Platt, T.; Gallegos, C.K.; Harrison, W.G. Photoinhibition of photosynthesis in natural assemblages of marine phytoplankton. J. Mar. Res. 1980, 38, 687–701. [Google Scholar]
  46. Chai, C.; Jiang, T.; Cen, J.; Ge, W.; Lu, S. Phytoplankton pigments and functional community structure in relation to environmental factors in the Pearl River Estuary. Oceanologia 2016, 58, 201–211. [Google Scholar] [CrossRef] [Green Version]
  47. Lagaria, A.; Mandalakis, M.; Mara, P.; Frangoulis, C.; Karatsolis, B.-T.; Pitta, P.; Triantaphyllou, M.; Tsiola, A.; Psarra, S. Phytoplankton variability and community structure in relation to hydrographic features in the NE Aegean frontal area (NE Mediterranean Sea). Cont. Shelf Res. 2017, 149, 124–137. [Google Scholar] [CrossRef]
  48. Van de Vyver, E.; Van Wichelen, J.; Vanormelingen, P.; Van Nieuwenhuyze, W.; Daveloose, I.; De Jong, R.; De Blok, R.; Urrutia, R.; Tytgat, B.; Verleyen, E.; et al. Variation in phytoplankton pigment composition in relation to mixing conditions in temperate South-Central Chilean lakes. Limnologica 2019, 79, 125715. [Google Scholar] [CrossRef]
  49. Kocum, E.; Underwood, G.J.C.; Nedwell, D.B. Simultaneous measurement of phytoplanktonic primary production, nutrient, and light availability along a turbid, eutrophic UK east coast estuary (the Colne Estuary). Mar. Ecol. Prog. Ser. 2002, 231, 1–12. [Google Scholar] [CrossRef] [Green Version]
  50. Wilkerson, F.P.; Lassiter, A.M.; Dugdale, R.C.; Marchi, A.; Hogue, V.E. The phytoplankton bloom response to wind events and upwelled nutrients during the CoOP WEST study. Deep Sea Res. Part II Top. Stud. Oceanogr. 2006, 53, 3023–3048. [Google Scholar] [CrossRef]
  51. Guinder, V.A.; Molinero, J.C.; Popovich, C.A.; Marcovecchio, J.E.; Sommer, U. Dominance of the planktonic diatom Thalassiosira minima in recent summers in the Bahı´a Blanca Estuary, Argentina. J. Plankton Res. 2012, 34, 995–1000. [Google Scholar] [CrossRef]
  52. Xiao, W.; Wang, L.; Laws, E.; Xie, Y.; Chen, J.; Liu, X.; Chen, B.; Huang, B. Realized niches explain spatial gradients in seasonal abundance of phytoplankton groups in the South China Sea. Prog. Oceanogr. 2018, 162, 223–239. [Google Scholar] [CrossRef]
  53. Irigoien, X.; Meyer, B.; Harris, R.; Harbour, D. Using HPLC pigment analysis to investigate phytoplankton taxonomy: The importance of knowing your species. Helgol. Mar. Res. 2004, 58, 77–82. [Google Scholar] [CrossRef] [Green Version]
  54. Thrane, J.-E.; Kyle, M.; Striebel, M.; Haande, S.; Grung, M.; Rohrlack, T.; Andersen, T. Spectrophotometric analysis of pigments: A critical assessment of a high-throughput method for analysis of algal pigment mixtures by spectral deconvolution. PLoS ONE 2015, 10, e0137645. [Google Scholar] [CrossRef] [PubMed] [Green Version]
Figure 1. Sampling and measurement stations in Jakarta Bay (upper graph), Lampung Bay (middle graph), and Semangka Bay (lower graph) (redrawn after Damar [35] and Damar et al. [23]).
Jmse 08 00311 g001
Figure 2. Annual mean concentration values of phytoplankton pigments in Jakarta Bay (upper graph (A)), Lampung Bay (middle graph (B)), and Semangka Bay (lower graph (C)). Bars are standard deviations calculated from six data points. M = Marunda river mouth; A = Angke river mouth; P = Priok river mouth (upper graph). KK = Kota Karang river mouth; WL = Way Lunik river mouth (middle graph). R = Semangka river mouth (lower graph).
Jmse 08 00311 g002
Figure 3. Spatial distribution of the annual mean concentration values (µg L−1) of total phytoplankton pigments (including Chl-a) in Jakarta Bay (upper graph (A)), Lampung Bay (middle graph (B)), and Semangka Bay (lower graph (C)).
Jmse 08 00311 g003
Figure 4. Linear regression analysis between nutrients and algae pigments: between dissolved inorganic nitrogen (DIN) and pigments (four upper graphs) and phosphorus (PO4-P) and pigments (four lower graphs) at all bays studied.
Jmse 08 00311 g004
Figure 5. Linear regression analysis between mean underwater light (Irradiance—I) and combined pigments of all bays studied.
Jmse 08 00311 g005
Figure 6. Phytoplankton cell abundance (cells L−1) of each station in Jakarta Bay (A), Lampung Bay (B), and Semangka Bay (C). Redrawn from Damar et al. [23].
Jmse 08 00311 g006
Figure 7. Multivariate analysis (principal component analysis (PCA) biplot) between phytoplankton pigments, phytoplankton groups, nutrient species, physical-chemical properties of water, and station numbers in Jakarta Bay (upper graph (A)), Lampung Bay (middle graph (B)), and Semangka Bay (lower graph (C)). Black boxes indicate measurement stations, green circles indicate algae pigments, and red circles indicate chemical and physical properties of water.
Jmse 08 00311 g007
Table 1. Linear regression analysis between each pigment to total pigments.
PigmentsLinear RegressionR2
Jakarta Bay
Chlorophyll-ay = 1.4761x + 1.4235R2 = 0.99
Chlorophyll-by = 4.9069x + 4.4668R2 = 0.91
Chlorophyll-cy = 1.55x + 9.7722R2 = 0.003
Fucoxanthiny = 2.674x + 5.8019R2 = 0.08
Diadinoxanthiny = 48.413x + 1.5975R2 = 0.28
Luteiny = 10.69x + 4.3464R2 = 0.89
β-caroteney = 42.669x + 0.9266R2 = 0.95
Zeaxanthiny = 22.781x + 7.0696R2 = 0.75
Lampung Bay
Chlorophyll-ay = 1.5079x + 0.2209R2 = 0.96
Chlorophyll-by = 5.4355x + 1.6574R2 = 0.69
Chlorophyll-cy = 0.4482x − 0.6728R2 = 0.19
Fucoxanthiny = 2.116x + 1.906R2 = 0.35
Diadinoxanthiny = 21.071x + 1.4949R2 = 0.82
Luteiny = 52.313x − 1.7543R2 = 0.80
β-caroteney = 87.282x − 0.6708R2 = 0.82
Semangka Bay
Chlorophyll-ay = 1.6801x + 0.0621R2 = 0.98
Chlorophyll-by = 1.4928x + 0.6721R2 = 0.03
Chlorophyll-cy = 9.2563x + 0.578R2 = 0.90
Fucoxanthiny = 3.4329x + 0.2712R2 = 0.84
Diadinoxanthiny = 25.055x + 0.3504R2 = 0.85
Luteiny = −5.9702x + 1.2246R2 = 0.03
β-caroteney = 33.127x + 0.2315R2 = 0.93
Table 2. Linear regression correlation properties between each nutrient species and underwater light to each algae pigment in each bay.
CorrelationJakarta Bay Linear Regression and R2p valuesLampung Bay Linear Regression and R2p valuesSemangka Bay Linear Regression and R2p values
DIN
DIN vs. Total pigmentsy = 0.30x + 3.10; R2 = 0.94; 7.94 × 10⁻⁹y = 0.15x + 6.48; R2 = 0.270.034y = 0.33x − 0.11; R2 = 0.580.0002
DIN vs. Chl-by = 0.06x + 0.02; R2 = 0.792.49 × 10−5y = 0.05x − 0.01; R2 = 0.696.53 × 10−5y = 0.01x + 0.10; R2 = 0.040.564
DIN vs. Chl-cy = 0.01x + 0.36; R2 = 0.010.852y = −0.0001x + 0.05; R2 = 0.010.937y = 0.03x − 0.06; R2 = 0.490.0003
DIN vs. Fucoxanthiny = 0.01x + 1.37; R2 = 0.100.299y = 0.01x + 0.53; R2 = 0.020.637y = 0.09x − 0.13; R2 = 0.527.95 × 10−5
DIN vs. Diadinoxanthiny = 0.01x + 0.14; R2 = 0.230.091y = 0.01x − 0.01; R2 = 0.590.0005y = 0.01x − 0.01; R2 = 0.380.005
DIN vs. β-caroteney = 0.01x + 0.05; R2 = 0.933.23 × 10−8y = 0.004x + 0.02; R2 = 0.888.09 × 10−8y = 0.01x − 0.01; R2 = 0.516.92 × 10−5
DIN vs. Luteiny = 0.03x − 0.03; R2 = 0.782.81 × 10−5y = 0.01x + 0.05; R2 = 0.761.12 × 10−5y = −0.004x + 0.08; R2 = 0.120.135
PO4-P
PO4-P vs. Total pigmentsy = 0.68x + 5.80; R2 = 0.680.0002y = 0.93x + 8.59; R2 = 0.260.039y = 1.98x + 0.31; R2 = 0.781.48 × 10−5
PO4-P vs. Chl-by = 0.17x + 0.36; R2 = 0.774.02 × 10−5y = 0.21x − 0.05; R2 = 0.854.74 × 10−7y = 0.03x + 0.12; R2 = 0.010.778
PO4-P vs. Chl-cy = 0.002x + 0.37; R2 = 0.0040.889y = 0.002x + 0.04; R2 = 0.0054.75 × 10−7y = 0.21x − 0.03; R2 = 0.828.25 × 10−8
PO4-P vs. Fucoxanthiny = 0.003x + 1.62; R2 = 0.00080.988y = 0.15x + 0.35; R2 = 0.120.191y = 0.53x − 0.02; R2 = 0.736.89 × 10−6
PO4-P vs. Diadinoxanthiny = 0.005x + 0.15; R2 = 0.220.096y = 0.06x − 0.03; R2 = 0.862.76 × 10−7y = 0.07x + 0.001; R2 = 0.680.0001
PO4-P vs. β-caroteney = 0.02x + 0.12; R2 = 0.640.0006y = 0.01x + 0.02; R2 = 0.879.65 × 10−8y = 0.06x + 0.003; R2 = 0.761.05 × 10−6
PO4-P vs. Luteiny = 0.08x + 0.11; R2 = 0.844.86 × 10−6y = 0.03x + 0.05; R2 = 0.948.74 × 10−10y = −0.02x + 0.08; R2 = 0.100.249
I
I vs. Total pigmentsy = −0.30x + 22.35; R2 = 0.510.0046y = −0.12x + 13.19; R2 = 0.310.045y = −0.01x + 1.36; R2 = 0.030.599
I vs. Chl-by = −0.02x + 1.67; R2 = 0.280.049y = −0.02x + 1.29; R2 = 0.230.063y = 0.002x + 0.01; R2 = 0.090.477
I vs. Chl-cy = −0.009x + 0.79; R2 = 0.270.076y = −0.002x + 0.15; R2 = 0.130.189y = −0.002x + 0.12; R2 = 0.080.387
I vs. Fucoxanthiny = −0.038x + 3.30; R2 = 0.470.011y = −0.04x + 2.57; R2 = 0.280.039y = −0.002x + 0.28; R2 = 0.030.631
I vs. Diadinoxanthiny = −0.004x + 0.38; R2 = 0.630.001y = −0.007x + 0.43; R2 = 0.360.013y = −0.01x + 0.04; R2 = 0.030.573
I vs. β-caroteney = −0.008x + 0.57; R2 = 0.460.008y = −0.002x + 0.12; R2 = 0.270.044y = −0.001x + 0.05; R2 = 0.090.364
I vs. Luteiny = −0.022x + 1.51; R2 = 0.230.082y = −0.003x + 0.22; R2 = 0.310.022y = 0.001x + 0.04; R2 = 0.130.233
Note: DIN = dissolved inorganic nitrogen; PO4-P = phosphorus; I = average underwater irradiance.
Table 3. Multiple linear regression between nutrients (dissolved inorganic nitrogen and phosphorus) and light to total pigment concentration in all bays studied.
LocationMultiple Linear Regression EquationRR2
Combined baysTotal pigment = 8.84 + 0.16 DIN + 0.25 PO4 − 0.09 Light0.920.85
Jakarta BayTotal pigment = 5.84 + 0.22 DIN + 0.19 PO4 − 0.05 Light0.980.96
Lampung BayTotal pigment = 7.78 + 0.14 DIN + 1.28 PO4 − 0.03 Light0.760.57
Semangka BayTotal pigment = 1.28 + 0.04 DIN + 1.87 PO4 − 0.05 Light0.890.79
Note: DIN = dissolved inorganic nitrogen; PO4 = phosphorus.

