Article

The Effect of Mass Ratio and Damping Coefficient on the Propulsion Performance of the Semi-Active Flapping Foil of the Wave Glider

1
National Ocean Technology Center, Tianjin 300112, China
2
School of Marine Science and Technology, Tianjin University, Tianjin 300072, China
*
Author to whom correspondence should be addressed.
J. Mar. Sci. Eng. 2020, 8(5), 303; https://doi.org/10.3390/jmse8050303
Submission received: 23 March 2020 / Revised: 14 April 2020 / Accepted: 24 April 2020 / Published: 26 April 2020
(This article belongs to the Special Issue Unmanned Underwater Vehicle – Hydrodynamics and Navigation System)

Abstract

:
A numerical investigation on the propulsion performance of the semi-active flapping foil of the wave glider with different mass ratio and damping coefficient is investigated. The commercial CFD software Fluent is used to solve the URANS equations around the flapping foil by the Finite Volume Method. A mesh of 2D NACA0012 foil with the Reynolds number Re = 42,000 is used in all simulations. We first analyze the effect of the mass ratio on the mean output power coefficient and propulsion efficiency and note that with the variation of the mass ratio, the propulsion efficiency decreases slightly. Besides, we find that the mass ratio has a noticeable influence on the mean output power coefficient, and the influence is determined by the reduced frequency. For high reduced frequency, with the increase of the mass ratio, the propulsion performance of the flapping foil decreases monotonously. For low reduced frequency, the mean output power increases slightly. For critically reduced frequency, the mean output power coefficient of the foil firstly increases and then decreases via the mass ratio increase. Then, we examine the influence of the damping coefficient on the propulsion performance of the flapping foil and find that the damping coefficient has a severe adverse effect on the output power and propulsion efficiency. We conclude that the influence of the damping coefficient should be considered first when we design the propulsion device of the semi-active flapping foil. Meanwhile, we should also consider the sea conditions to choose the mass ratio to optimize the flapping foil.

1. Introduction

The main advantages of the wave glider over traditional unmanned surface vehicle are long endurance and low maintenance. Based on the unique capability, the wave glider can support many important marine applications, such as oceanographic, climate observation, tsunami detection [1]. The key innovation of the wave glider depends on its unique two-body structure, the surface boat, and the submerged glider via umbilical cable [2,3,4]. The composition of the wave glider and the propulsion mechanism are shown in Figure 1. The wave can drive the platform to make the heaving motion. During the motion, the flapping foil passively pitch and generate thrust continuously. Compared with the conventional propeller propulsion, this novel wave propulsion greatly expands the observation range and application field [5,6,7]. Therefore, research on the hydrodynamic characteristics of flapping foil of wave glider under wave conditions is necessary, which is of significance to the optimal design.
In recent years, research on the two-body coupling effect of the wave glider and its wave propulsion performance has become a hotspot. Some researchers have applied different methods to establish the two-body coupling dynamic model of a wave glider. Kraus [1,7] presented a six degree of freedom set of nonlinear dynamic equations of the wave glider and implemented the EKF algorithm to estimate the sailing performance of the wave glider. Ngo [8] establishes a predictive kinematic model based on Gaussian process models to predict the speed of the wave glider. Wang [9] Tian [10] and Qi [11] established the nonlinear dynamic model of the wave glider based on D-H approach, Newton-Euler approach and Kane method. The motion simulation demonstrated that the sea conditions is one of the important factors affecting the velocity of the wave glider. Other researchers have performed numerical simulations and experimental studies on the flapping foil of the wave glider. Based on Reynolds-Averaged Navier-Stokes (RANS), Jia [12], Liu [13], and Bing [14] used the steady-state CFD method to obtain the thrust and drag coefficients of the wave glider. Yang [15] used the Unsteady Reynolds-Averaged Navier-Stokes (URANS) to simulate the flow around the surface boat and the flapping foil. The simulation model involves two CFD software, FINE/Marine and STAR-CCM+. Qi [16] points out that the spring stiffness is a key factor affecting the hydrodynamic characteristic of the flapping foil. Most literature focus on the coupling effect, the dynamic and kinematics model, and the prediction of platform velocity. However, there is a lack of research on the propulsion mechanism of the flapping foil under wave conditions.
Since the 1970s, the preliminary understanding of the propulsion mechanism of flapping foil has been obtained through observation, experiment and numerical study [17,18,19,20,21,22,23,24,25]. Compared with the full-active flapping foil, the semi-active one has advantages of simple structure, high reliability, and easy maintenance [26,27]. Many scholars use experimental methods and numerical simulation methods to study the propulsion mechanism of the semi-active flapping foil. The key contributions of classic research are illustrated in Table 1. Nurray and Howle [18], Thaweewat et al. [23], and Qi [16] studied the semi-active flapping foil and noticed that the parameters of the torsion spring have a serious impact on the flapping foil. Young and Lai [20] point out that the Strouhal-number, the motion of the foil (pitching/heaving motion amplitudes and phases difference), and the flapping frequency influence the character of the foil. In summary, we find that in most studies of the propulsion performance of the semi-active flapping foil, the inertia coefficient of the foil is usually a constant value, which means the influence of the inertia is ignored. According to studies by Jian [28], Richards [29], and Zhu [30] on the energy extraction performance of the semi-active foil, they point out that the inertia coefficient plays an important role in the dynamic response of the semi-active flapping foil, especially the trajectory of the passive motion. We can infer that the inertia coefficient also has an important influence on the propulsion performance of the semi-active flapping foil. In addition, we note that there is little research on the effect of damping on the semi-active flapping foil. Damping is an inevitable factor in mechanical systems. Studying the influence of damping has general guiding significance for the engineering application of semi-active flapping foil.
We have carried out some research on the propulsion performance of the semi-active flapping foil and analyzed the influence of factors such as reduced frequency and heaving amplitude, spring stiffness coefficient, and critical amplitude on the propulsion performance of the flapping foil. The research results are published in [17]. Based on the previous research, this paper analyzes the impact of inertia and damping on the propulsion performance of the semi-active flapping foil and reveals the influence mechanism of the inertia and damping coefficients. In this paper, firstly, we establish the dynamic model of semi-active flapping foil and describe the problem and numerical method briefly. Then, the effects of the mass ratio on the propulsion performance of the flapping foil are investigated in detail. Finally, we study the effect of damping coefficient on the propulsion performance of the flapping foil.

2. Problem Description and Methodology

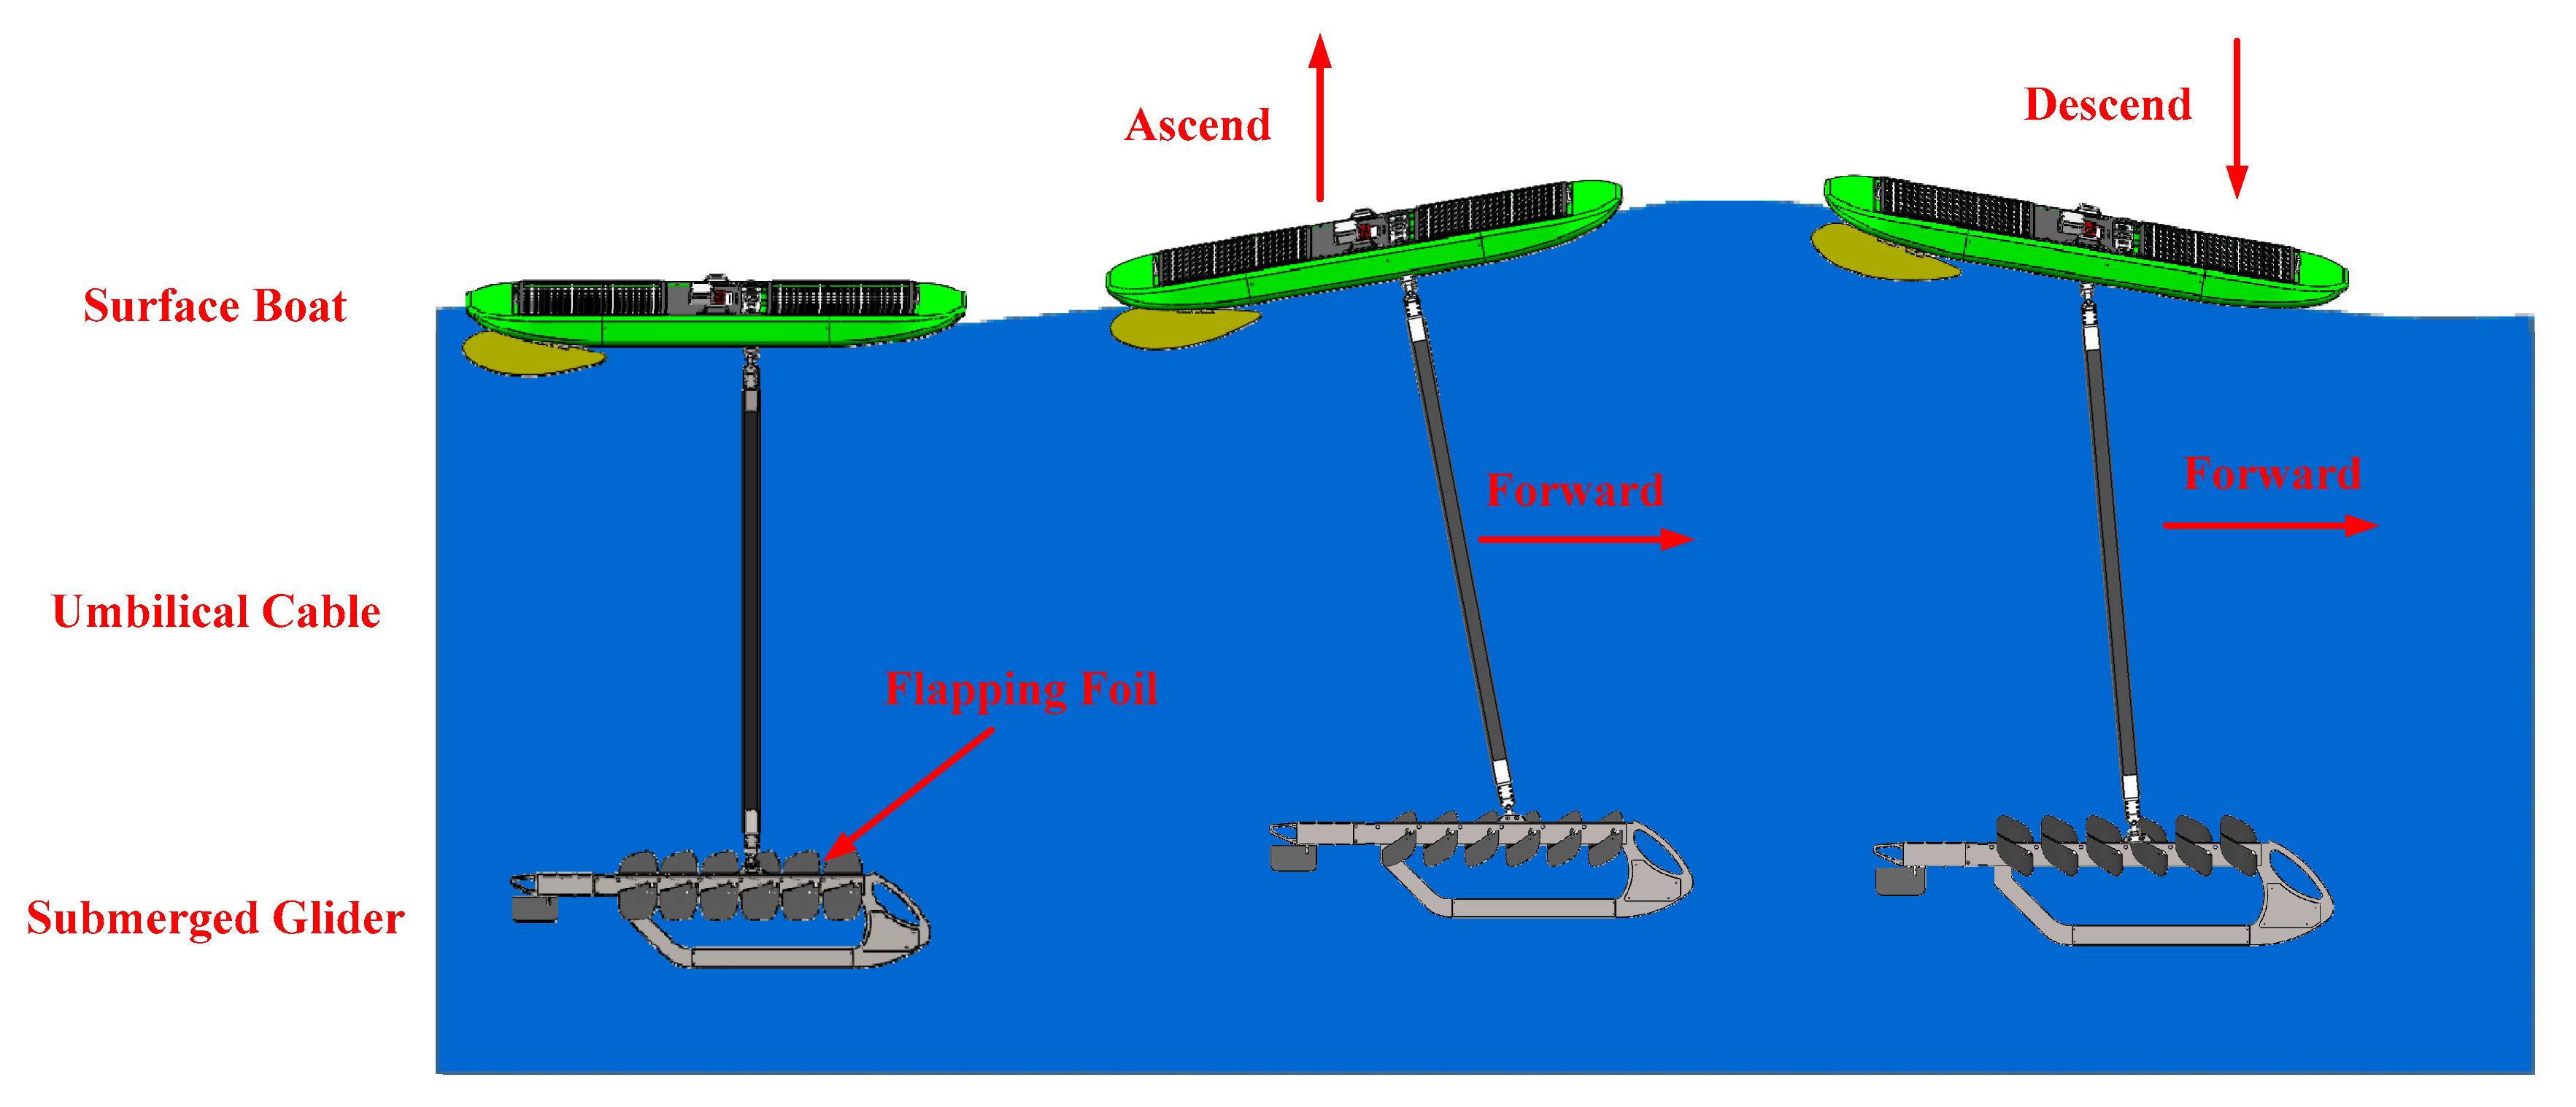
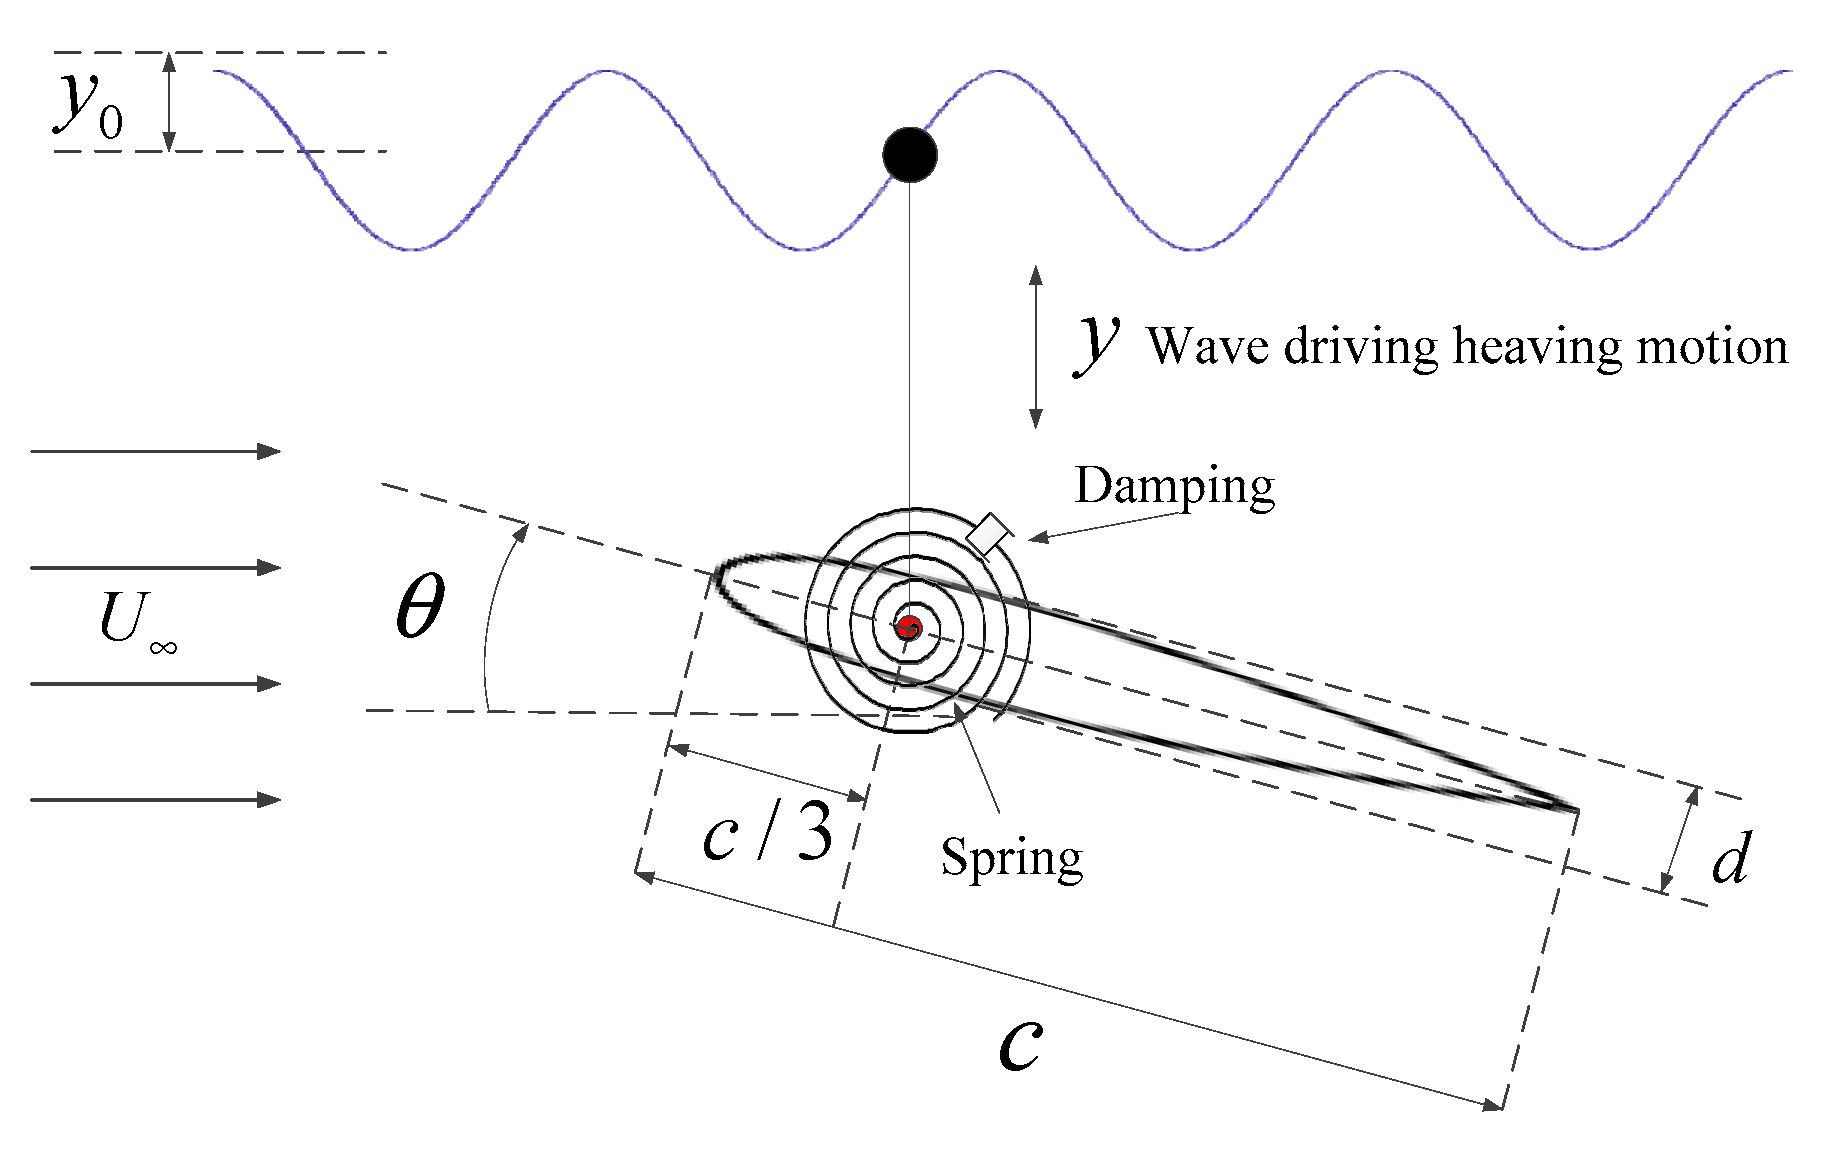
2.1. Problem Description

The typical semi-active flapping foil motion model is defined as the foil experiencing a full-prescribed harmonic heaving motion and a passive pitching motion. The sketch of the semi-active foil is illustrated in Figure 2. A two-dimensional foil with NACA0012 profile is connected to the torsion spring and damper, where the pitching axis is located at one-third chord. Under the action of the wave, the submerged glider including the foil does the heaving motion. The heaving motion is defined as a simple harmonic function for the sake of simplification. The foil performs passive pitching motion under the action of the external force and moment. In addition, the foil can only move and pitch in vertical direction; any other degrees of freedom are prohibited.
The heaving motion y ( t ) and pitching motion θ ( t ) are expressed as follow.
y ( t ) = y 0 s i n ( 2 π f t ) ,
I θ ¨ ( t ) ζ θ ˙ ( t ) + k θ ( t ) = M ( t ) ,
where y 0 and f are respectively the heaving amplitude and frequency. f * named the reduced frequency is the non-dimensional coefficient of heaving frequency, f * = f c / U . I and ζ are the moment of inertia and the pitching damping coefficient, ζ * is the non-dimensional frequency of damping coefficient, ζ * = ζ / ( ρ c U ) . ρ is the fluid density. U is the free flow, and is kept constant. c and d note as the chord length and the span of the foil, respectively. M is the hydrodynamic moment of the foil. The density ratio of the flapping foil to water is expressed as the mass ratio r.
Due to the heaving motion of the foil and upstream flow, the effective angle of attack is defined as:
α e ( t ) = α h ( t ) θ ( t ) ,
where α h is the heaving induced angle, α h ( t ) = arctan ( y ˙ ( t ) / U ) . The instantaneous input power and output power into the system are defined as:
P I ( t ) = F y ( t ) y ˙ ( t ) + M ( t ) θ ˙ ( t ) ,
P O ( t ) = F x ( t ) U ,
The mean input power coefficient C P I ¯ and the mean output power coefficient C P O ¯ are expressed as follows:
C P I ¯ = 1 T 0 T ( P I ( t ) / ( 1 2 ρ U 3 c ) ) ,
C P O ¯ = 1 T 0 T ( P O ( t ) / ( 1 2 ρ U 3 c ) ) ,
where F x , F y are defined as the thrust and lift force, respectively. C X , C X , C M are defined as the non-dimensional coefficients of thrust, lift force, and moment.
C X ( t ) = F x ( t ) / 0.5 ρ U 2 c ,
C Y ( t ) = F y ( t ) / 0.5 ρ U 2 c ,
C M ( t ) = M ( t ) / 0.5 ρ U 2 c 2 ,
The propulsion efficiency is defined as the ratio between the mean output power and the mean input power.
η = C P O ¯ / C P I ¯ ,

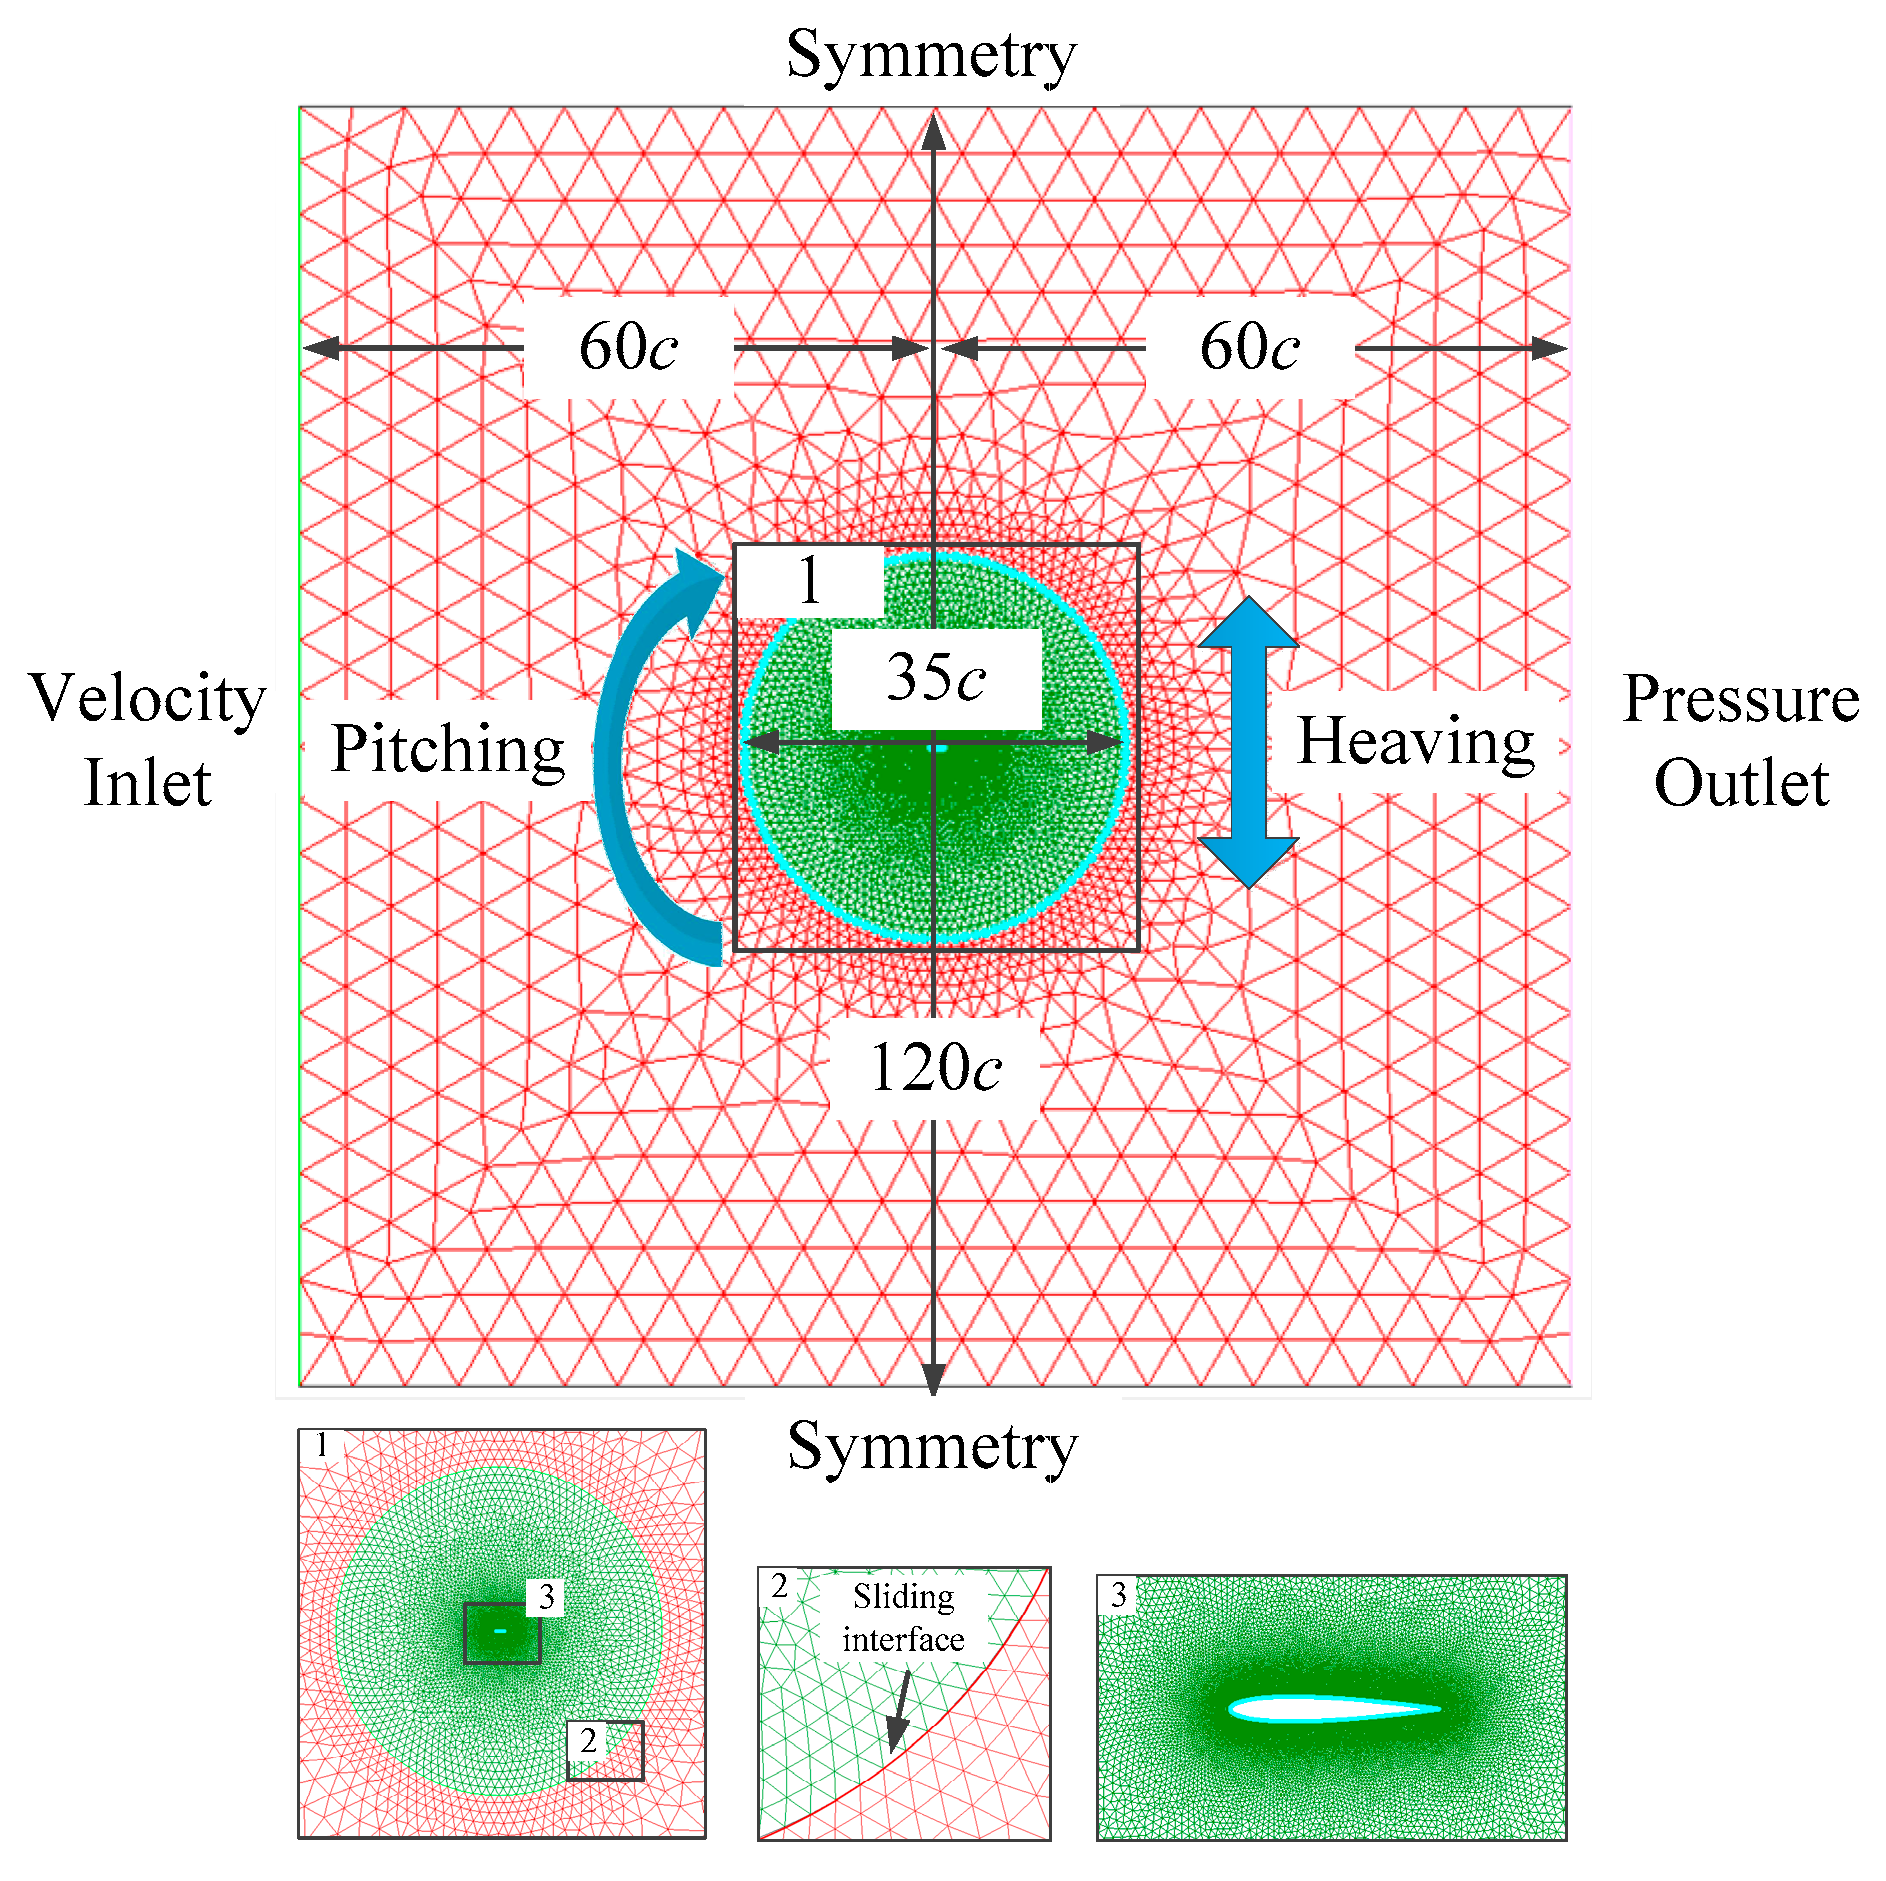
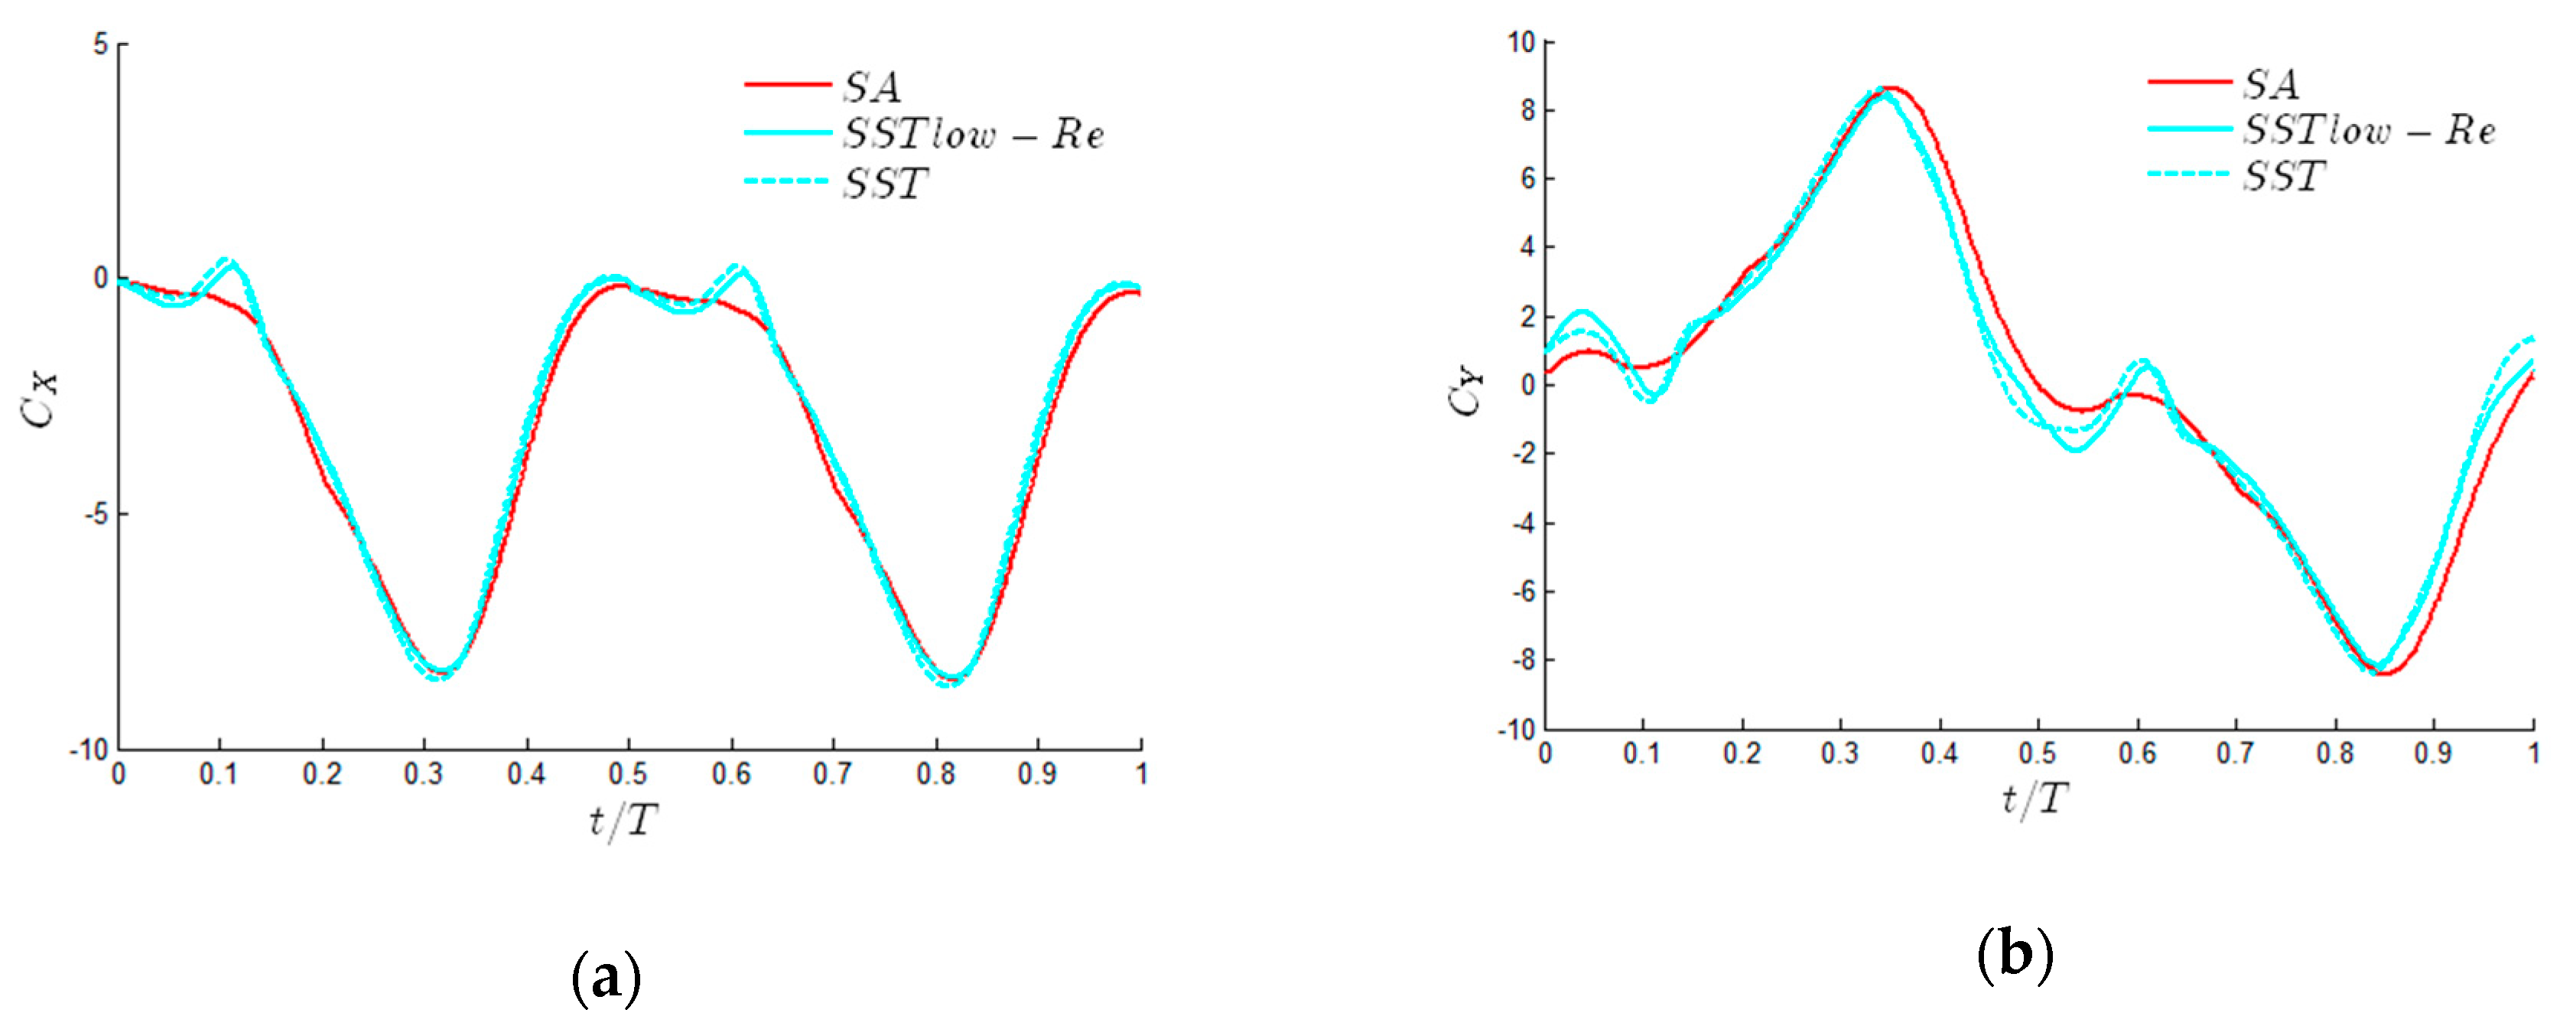
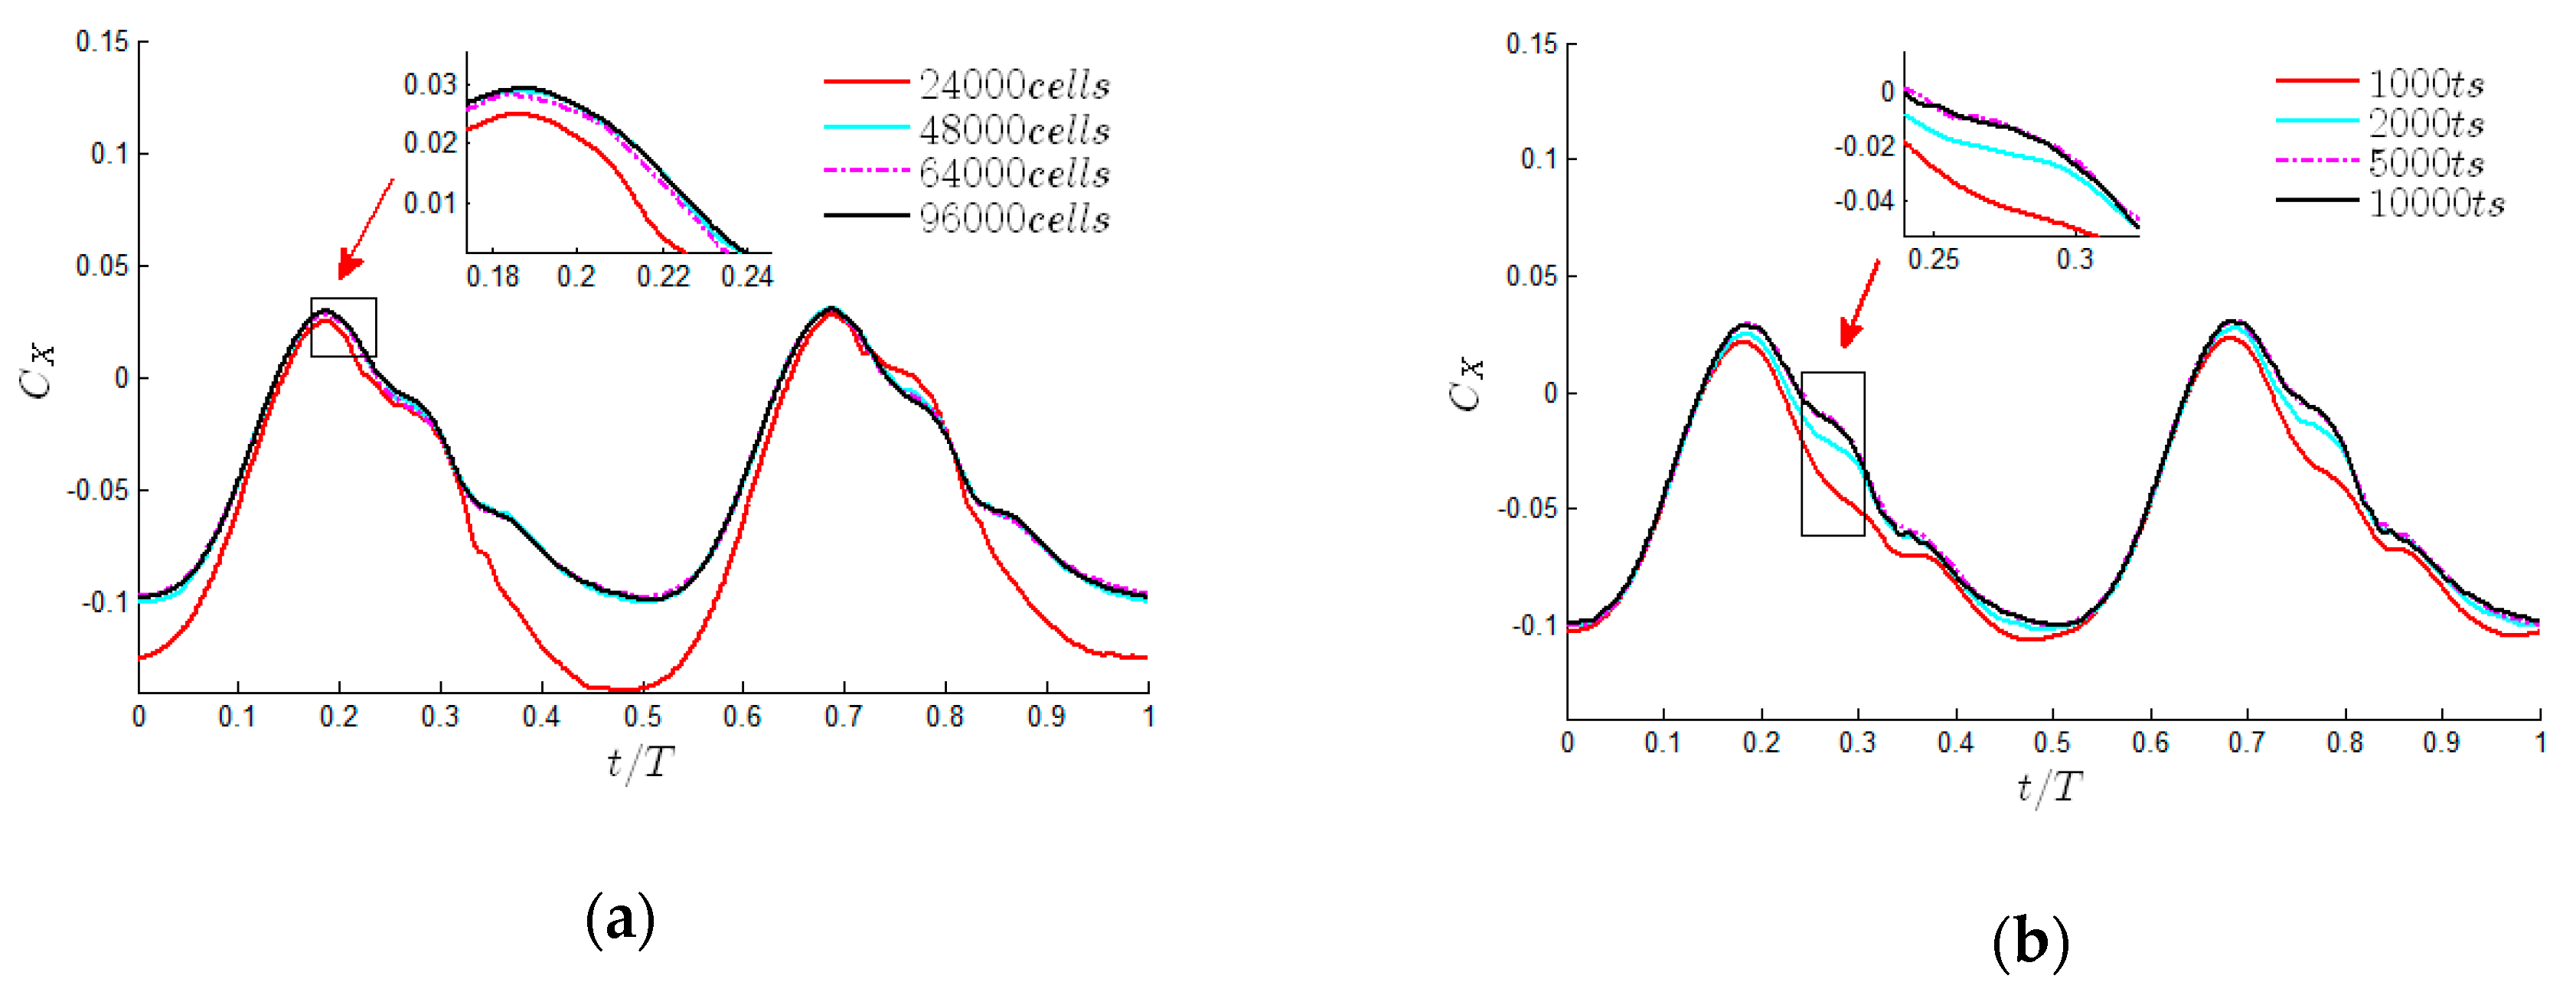
2.2. Numerical Methods and Validation

The governing equations for the unsteady incompressible flow around the hydrofoil are the two-dimensional continuity equation and Navier-Stokes equations, where the Reynolds average method is introduced to consider the effect of the turbulence, and it can be expressed as follows:
ρ t + x i ( ρ u i ) = 0 ,
t ( ρ u i ) + x j ( ρ u j u i ) = F i p x i + σ i j x j + x j ( ρ u i u j ) ,
where u i represents the Reynolds average velocity component with the average symbol omitted, F i represents the body force in x and y direction, p is the pressure, u i is the fluctuating velocity, σ i j is the component of the stress tensor.
The unsteady flow around the foil is simulated by the CFD software FLUENT version 19.1. The time-dependent Navier-Stokes equations are solved using the Finite Volume Method (FVM). In our research, the flapping foil is a two-dimension NACA0012 profile. The simulation strategy, including both the computational domain and boundary conditions, is shown in Figure 3. The computational domain is divided into inner region and outer region by the sliding interface. The inner region containing the foil performs rigid pitching and heaving motion. The computational domain is 120c × 120c, with domain of 35c around the foil. The height of the first row is set at a distance to the surface of 10−5c, and the distance grows with rate of 1.1 until 30th rows. We consider both pitching and heaving motion of the flapping foil through mesh motion and remeshing. The vertical movement of the inner domain is fully prescribed based on the typical wave condition. Based on the dynamics equation (2) and the fourth-order Runge-Kutta algorithm [23], we calculate the pitching angle of the flapping foil and control the inner grid motion through UDFs to simulate the passive pitching motion.
The choice of turbulence model has an important influence on the results of numerical simulation of the semi-active foil. We notice that the Reynolds number R e = U c / γ = 42 , 000 , and there are both laminar and turbulent flows; then, we select three typical turbulence models (k-ω SST, k-ω SST with low-Re corrections, and S-A) and compare the evolution of the thrust and lift coefficients in one period, as shown in Figure 4. We notice that the evolution of the thrust coefficients corresponding to different turbulence models is basically the same. Comparing S-A model with k-ω SST and k-ω SST with low-Re corrections, the difference of the mean thrust coefficient is 1.8%, as shown in Table 2. Due to lower requirement of the mesh and reliable simulation result [16,30], we chose the S-A model for all computations for all computations. The SIMPLE algorithm is selected for the pressure-velocity coupling. The second-order scheme is used for the pressure, momentum, and turbulent viscosity resolution. The second-order implicit scheme is used for the unsteady formulation. An absolute convergence criterion of 10−5 is set for the x-velocity, y-velocity, continuity, and nut.
In order to verify the simulation strategy, the grid, time independence, and validation are studied. We simulated on four grid levels (24,000 cells, 48,000 cells, 64,000 cells, and 96,000 cells) and four corresponding time-steps (1000 ts/2000 ts/5000 ts/10,000 ts). The mean thrust coefficient is set as the criterion, and the criterion for the stop is less than 1% in periodic solution. The evolution of the thrust coefficient for grid independence and time independence are illustrated in Figure 5a,b. The errors of the mean thrust coefficient for different parameters are given in Table 3. According to the computation results, the grid of 48,000 cells and the time step of 2000 are chosen for all simulations. To verify the reliability of the computation, we also validated the current strategy against the classic literature [30] under the same conditions. The evolutions of the thrust coefficient and lift coefficient are shown in Figure 6. We note that the simulation results agree well with those of Kinsey and Dumas. The simulation strategy of this study is credible and accurate.

3. Results and Discussions

The effects of the reduced frequency, the mass ratio and the damping coefficient on the propulsion performance of the semi-active flapping foil are simulated in this section. The range of the mass ratio basically covers common engineering materials, such as polyacetal, aluminum alloy, and stainless steel. The other physical parameters of the flapping foil refer to the actual parameters of the wave glider. The heaving motion parameters are determined by the typical sea conditions in which the wave glider operates. The general parameters for all computations are shown in Table 4.

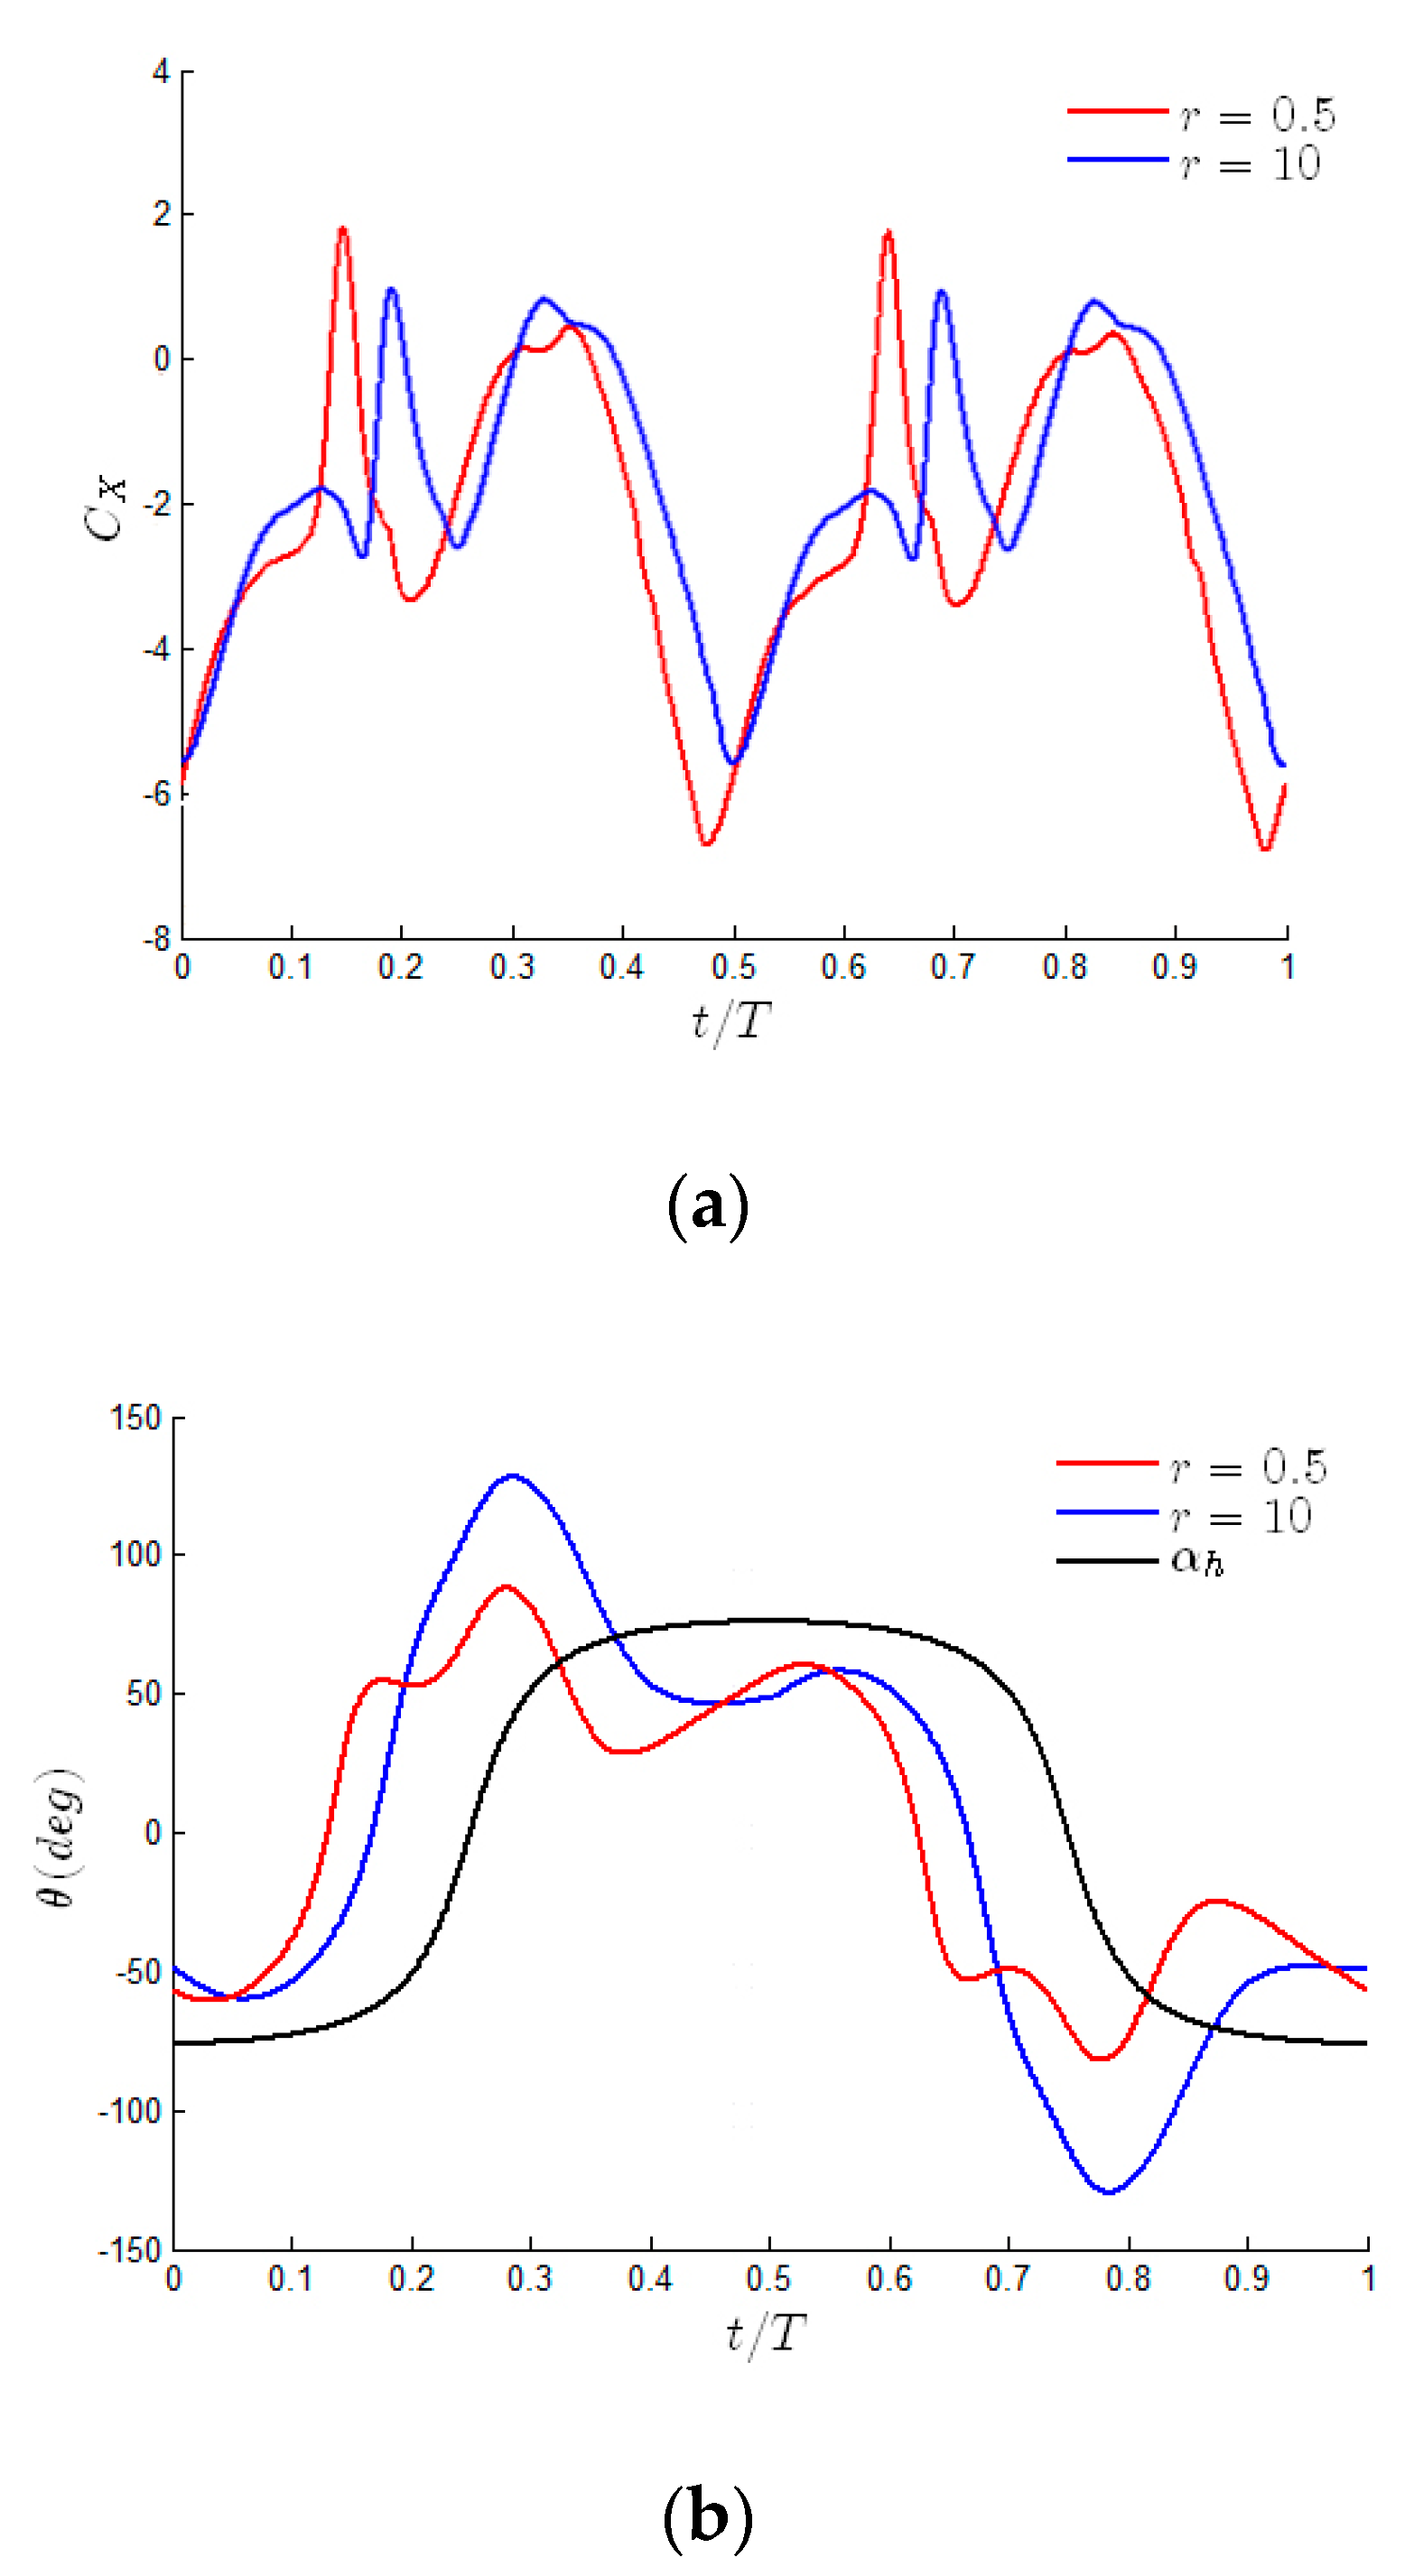
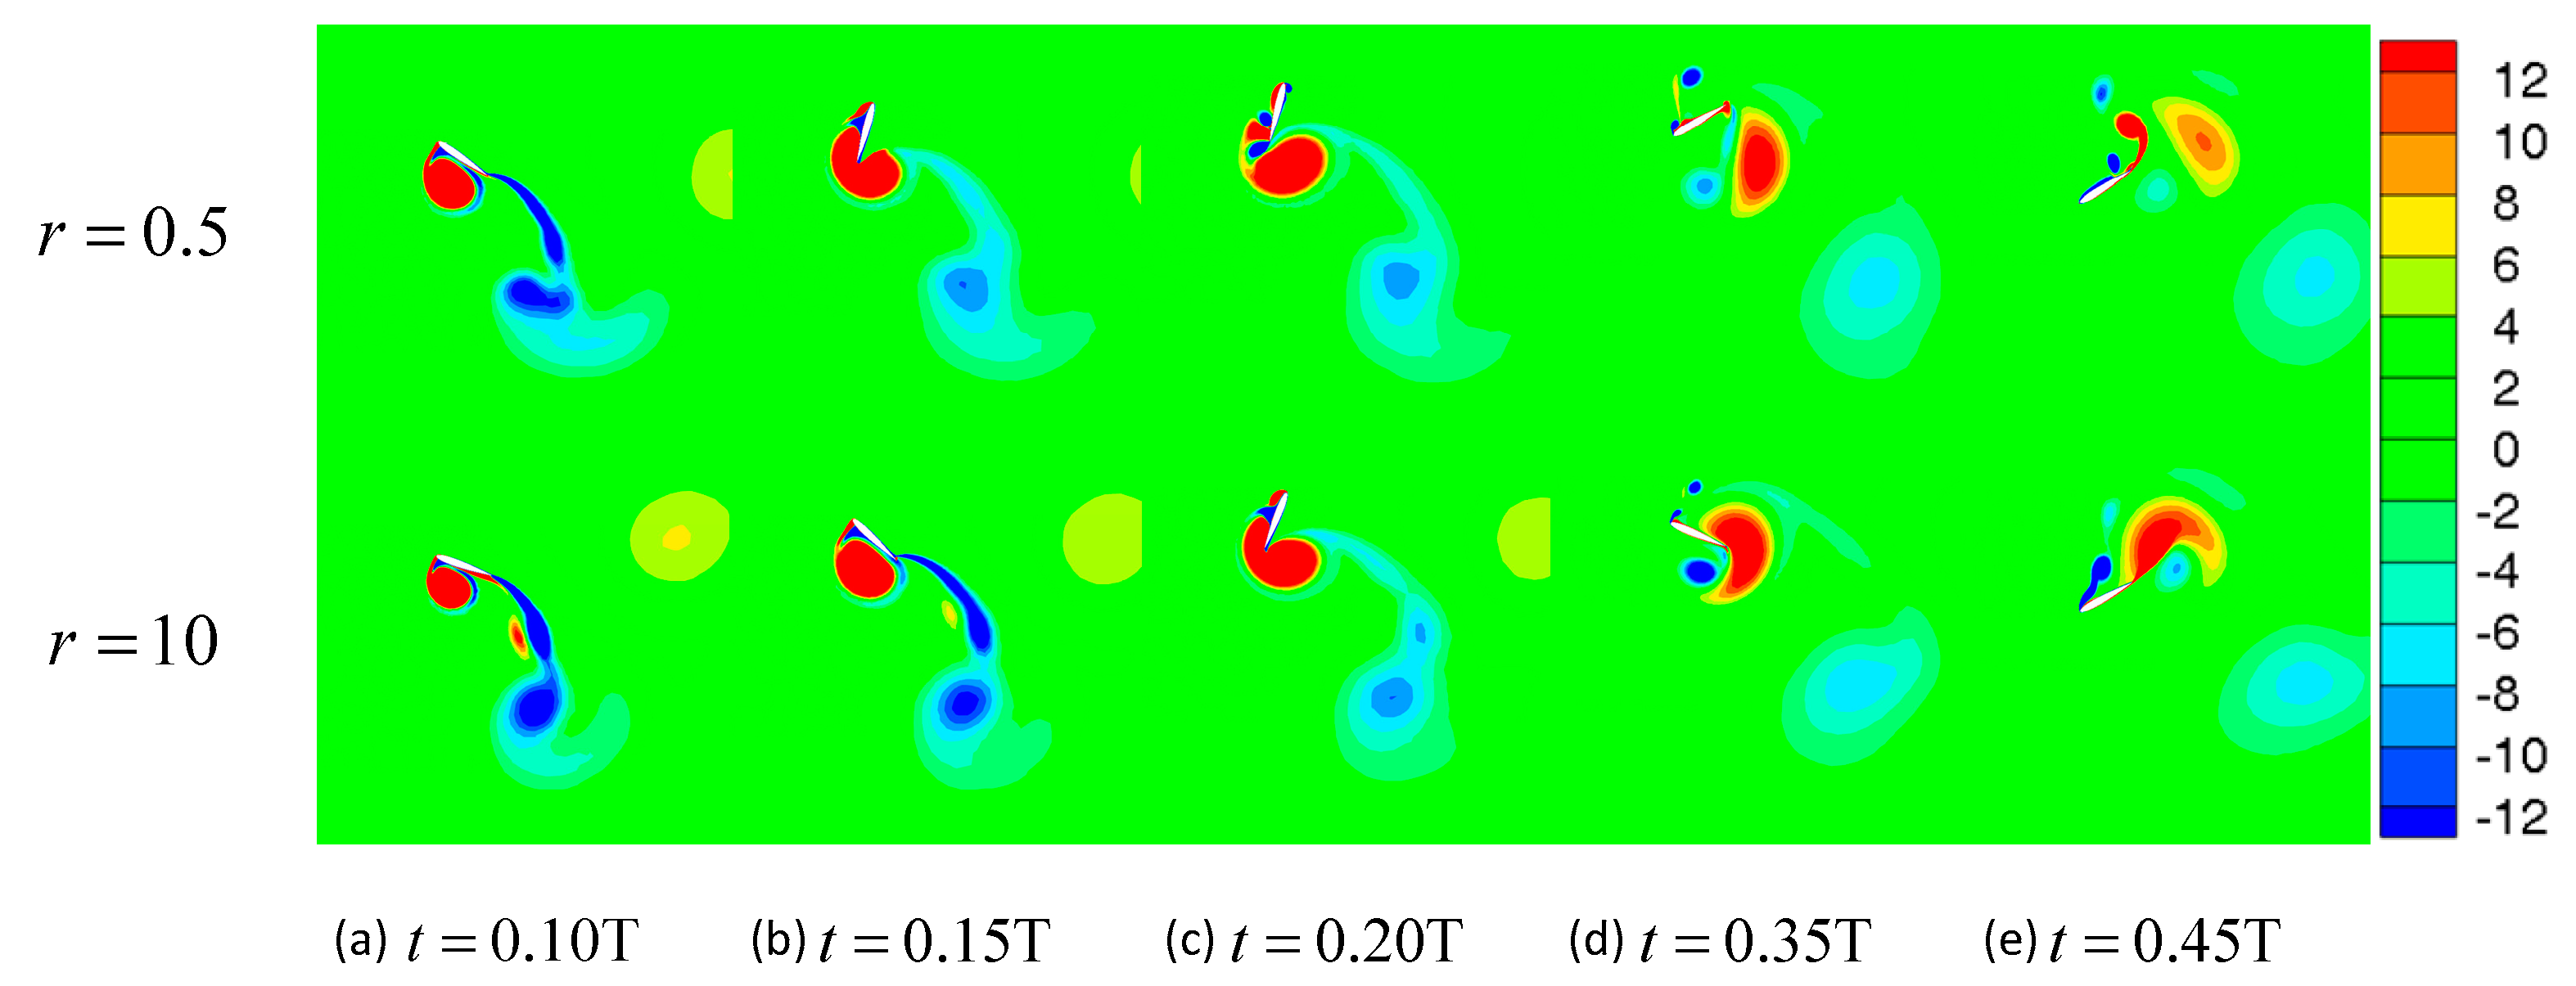
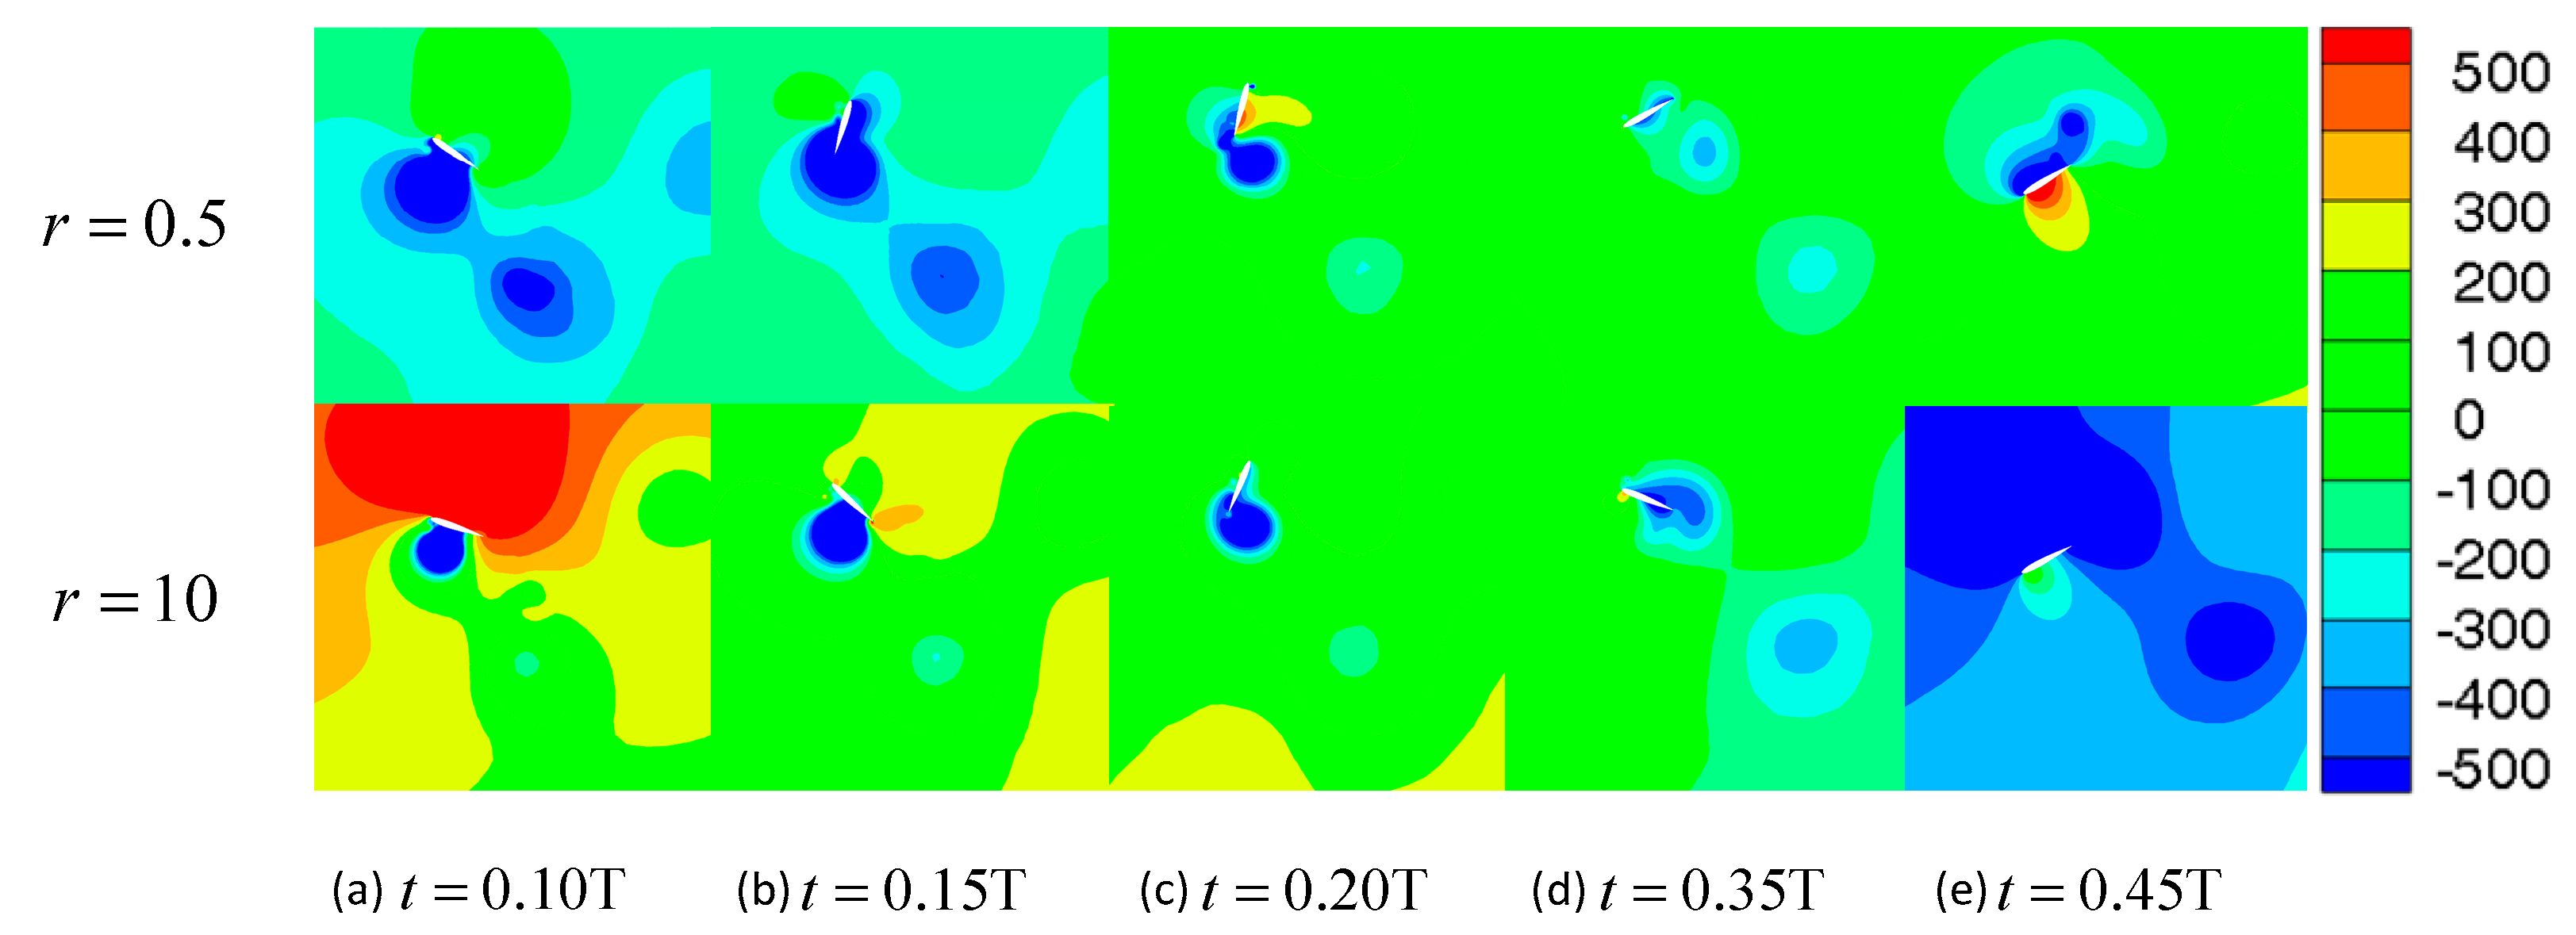
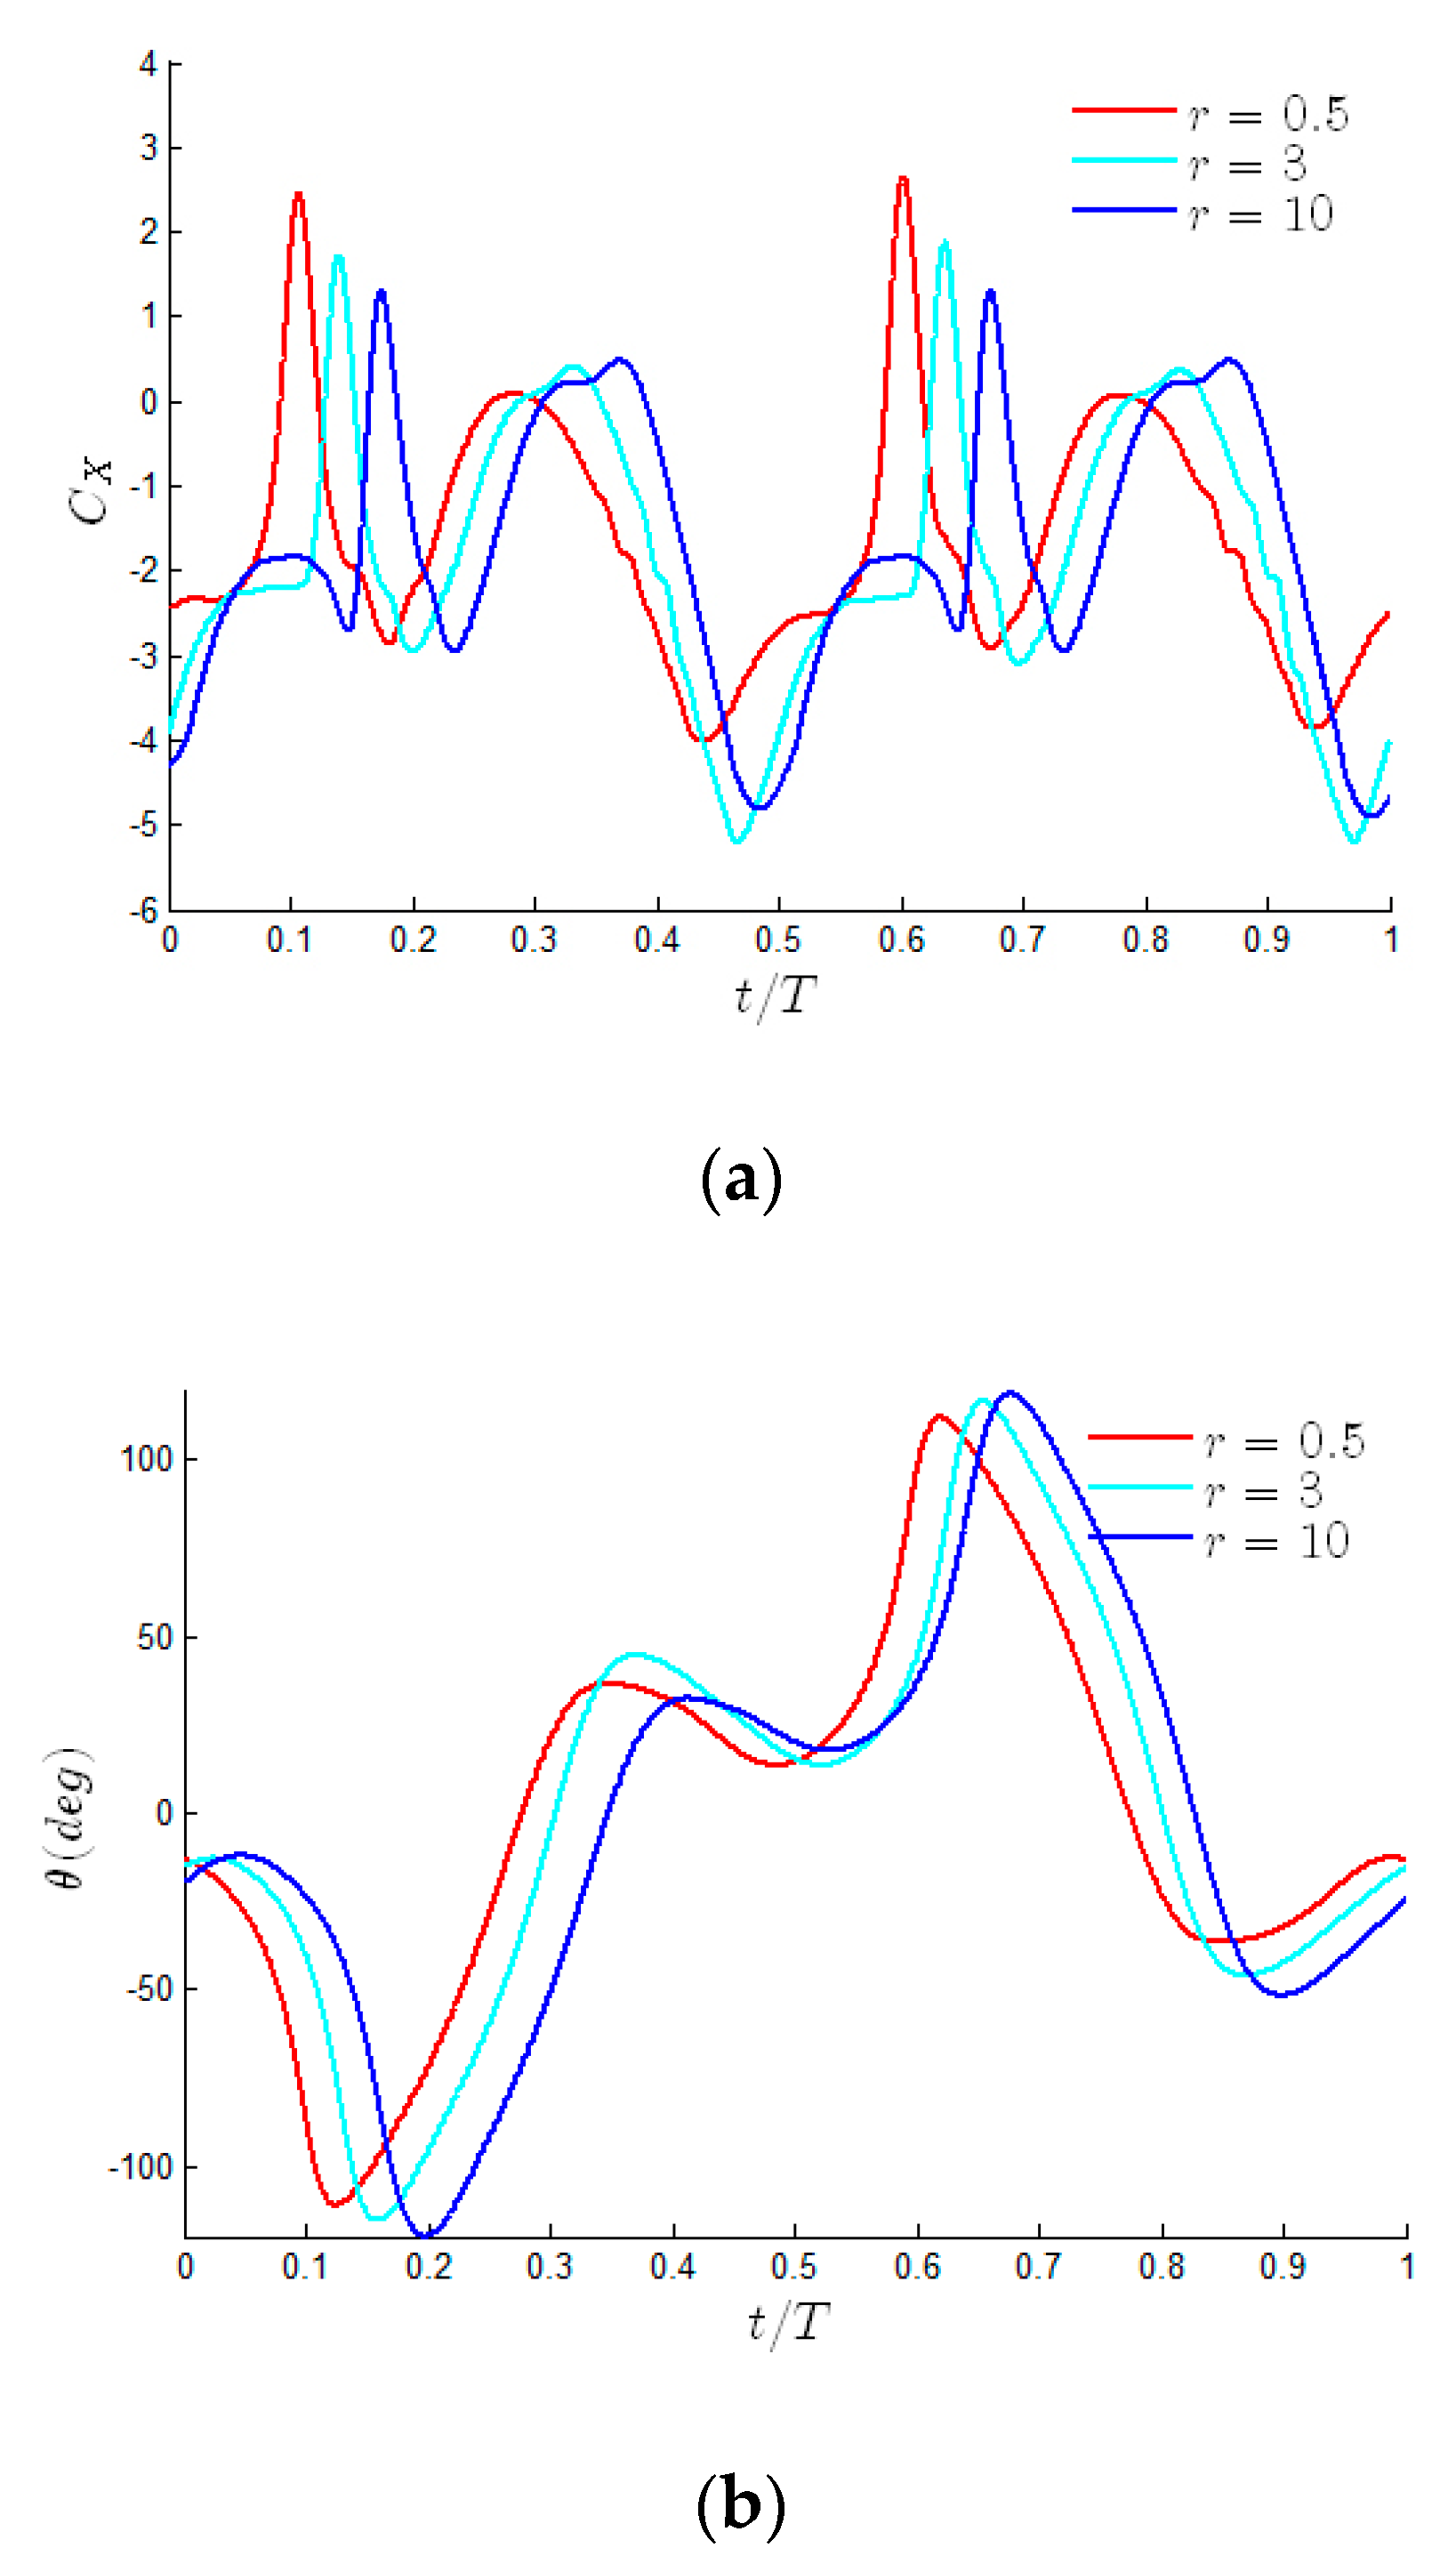
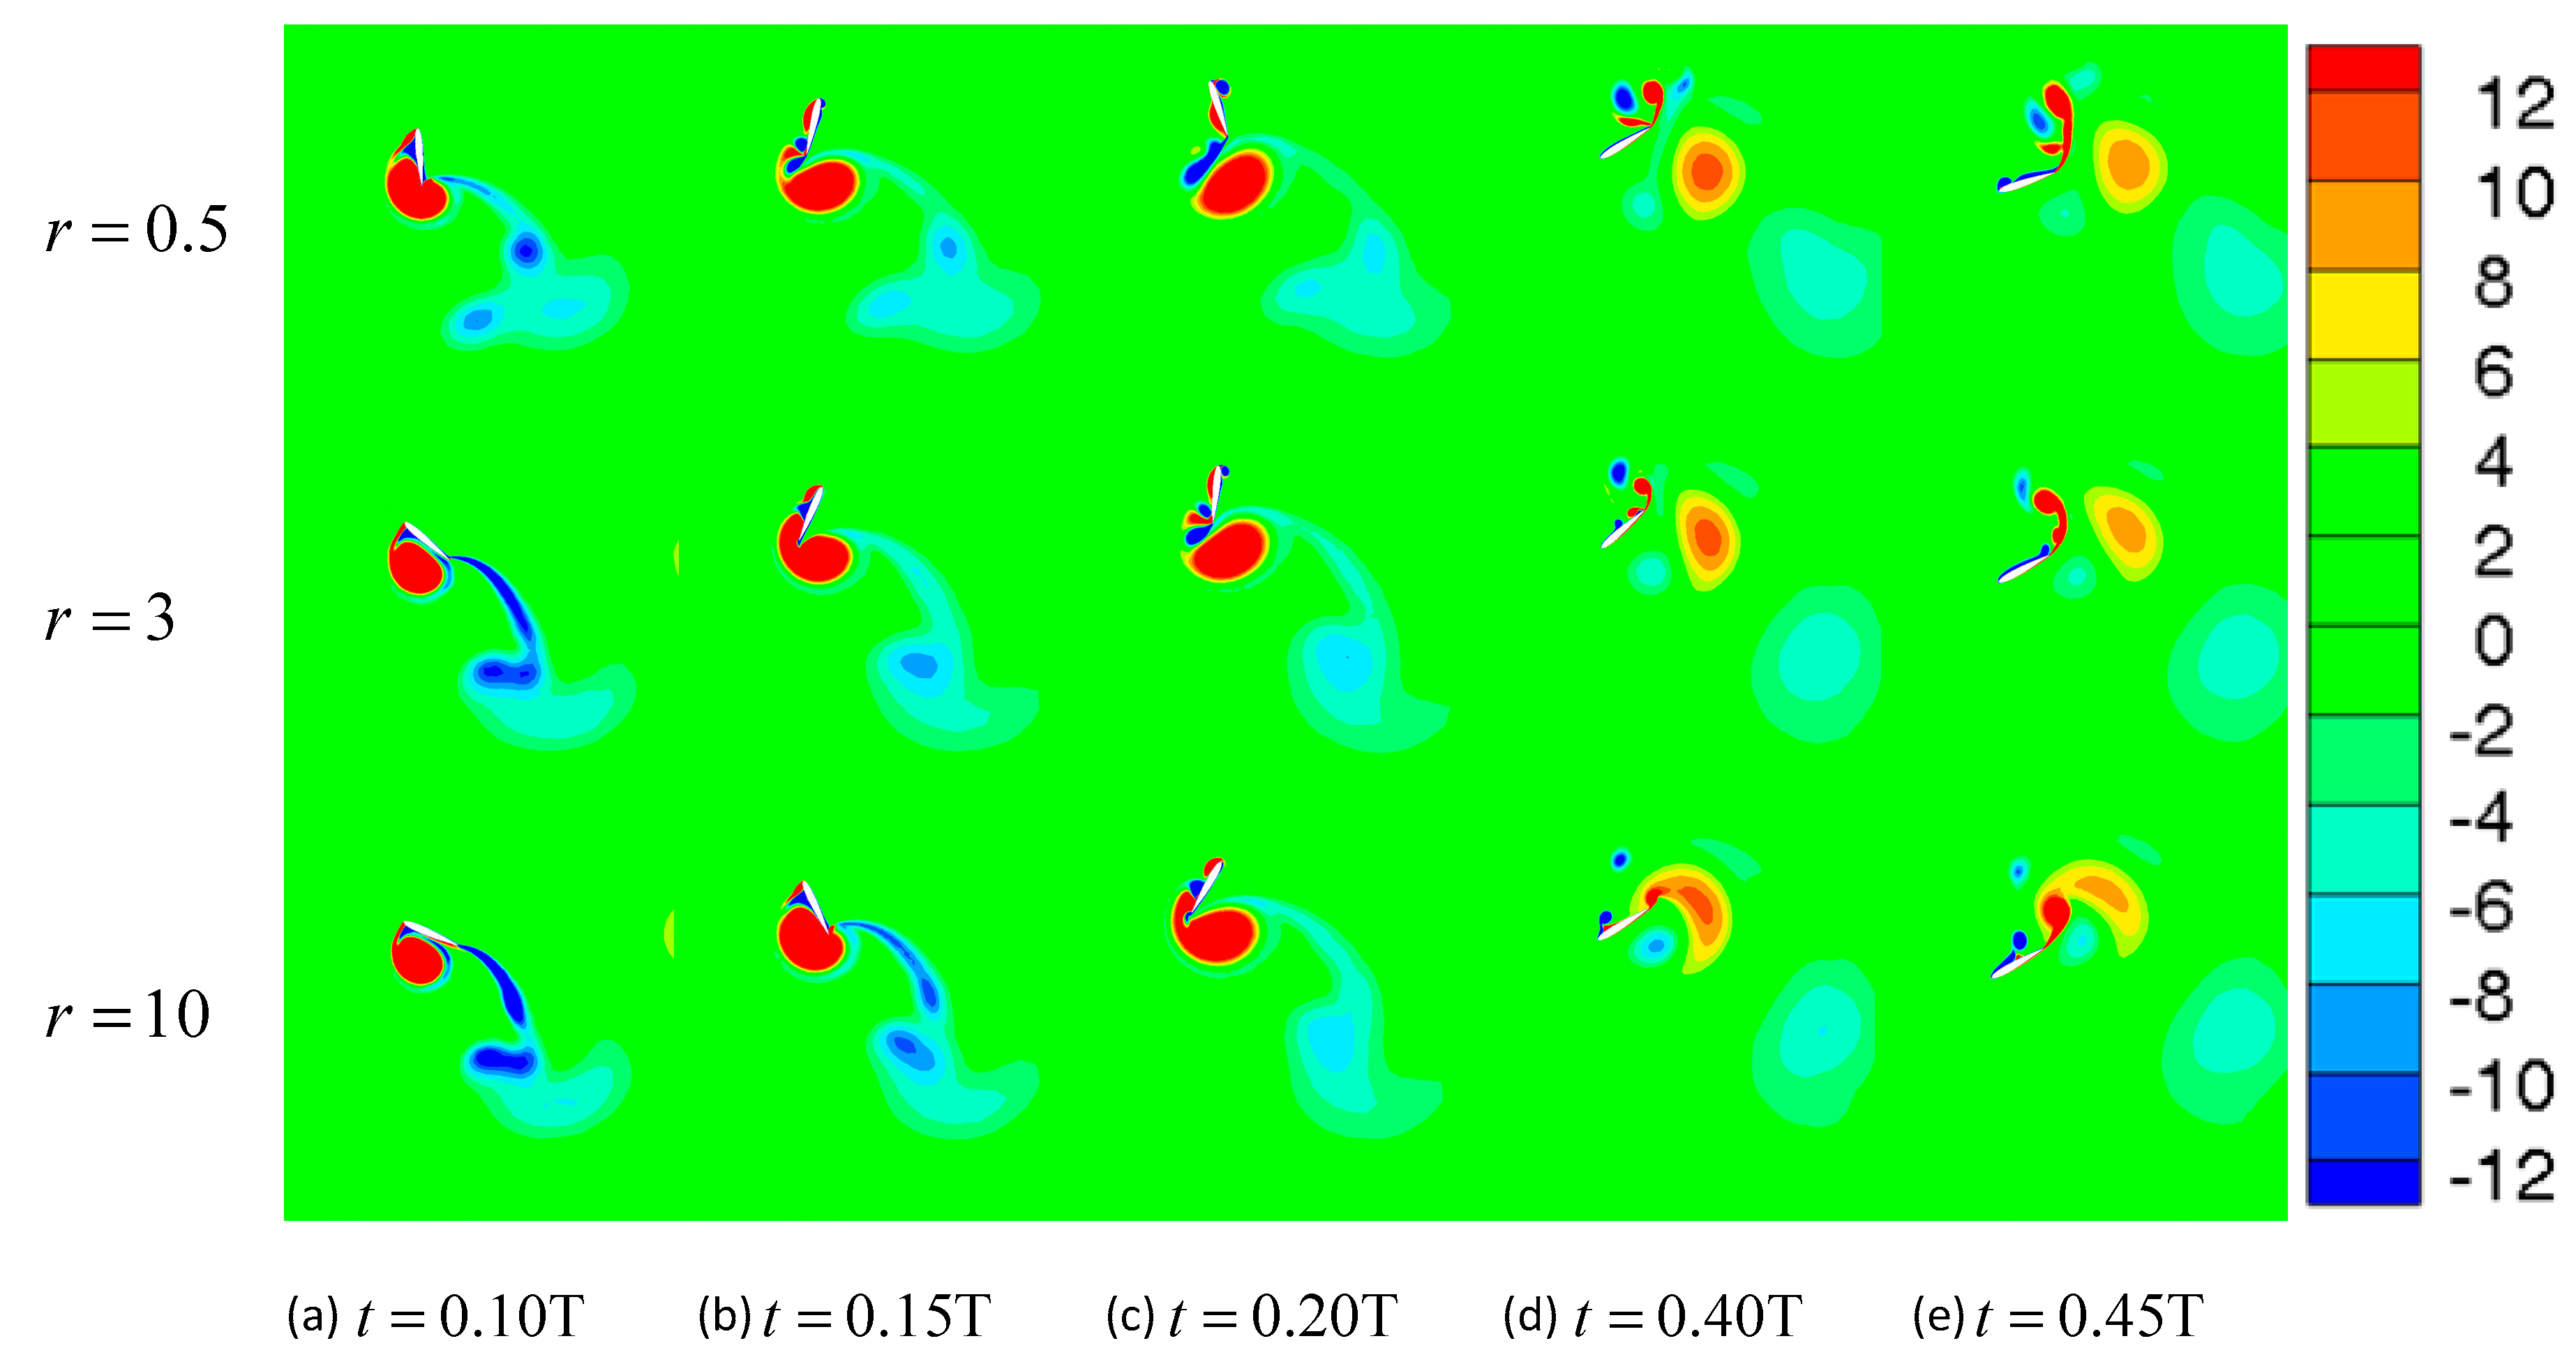
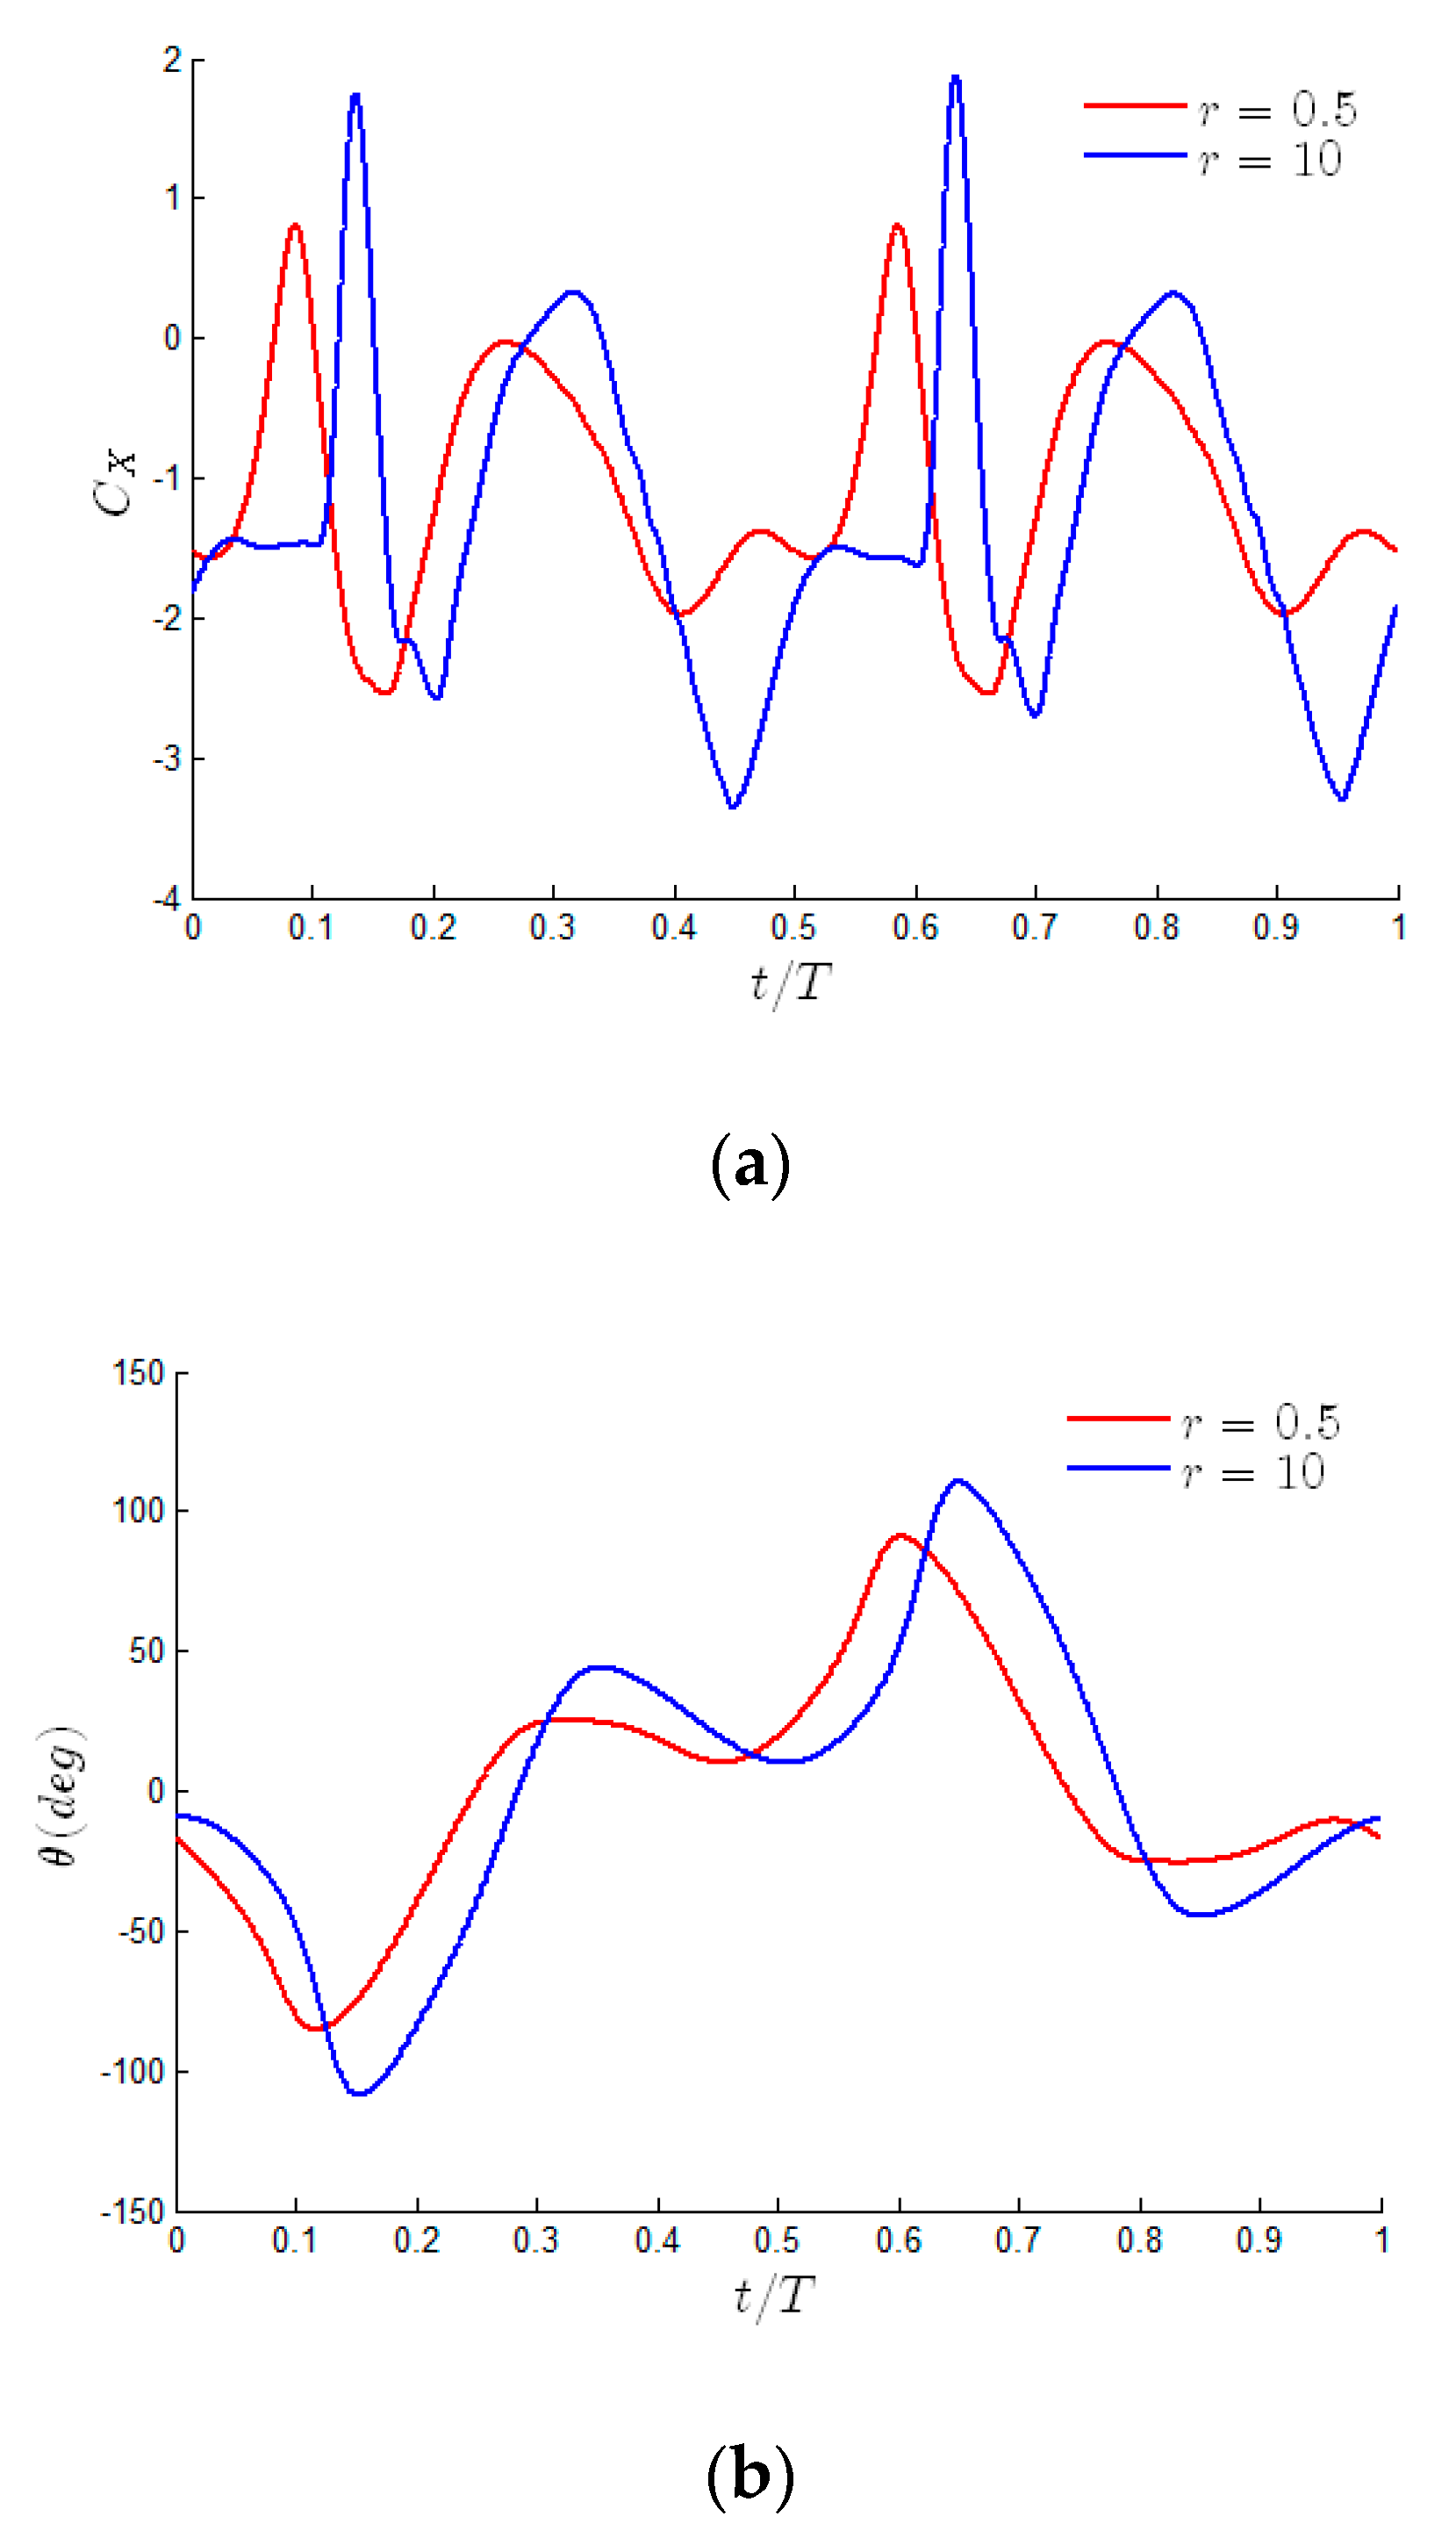
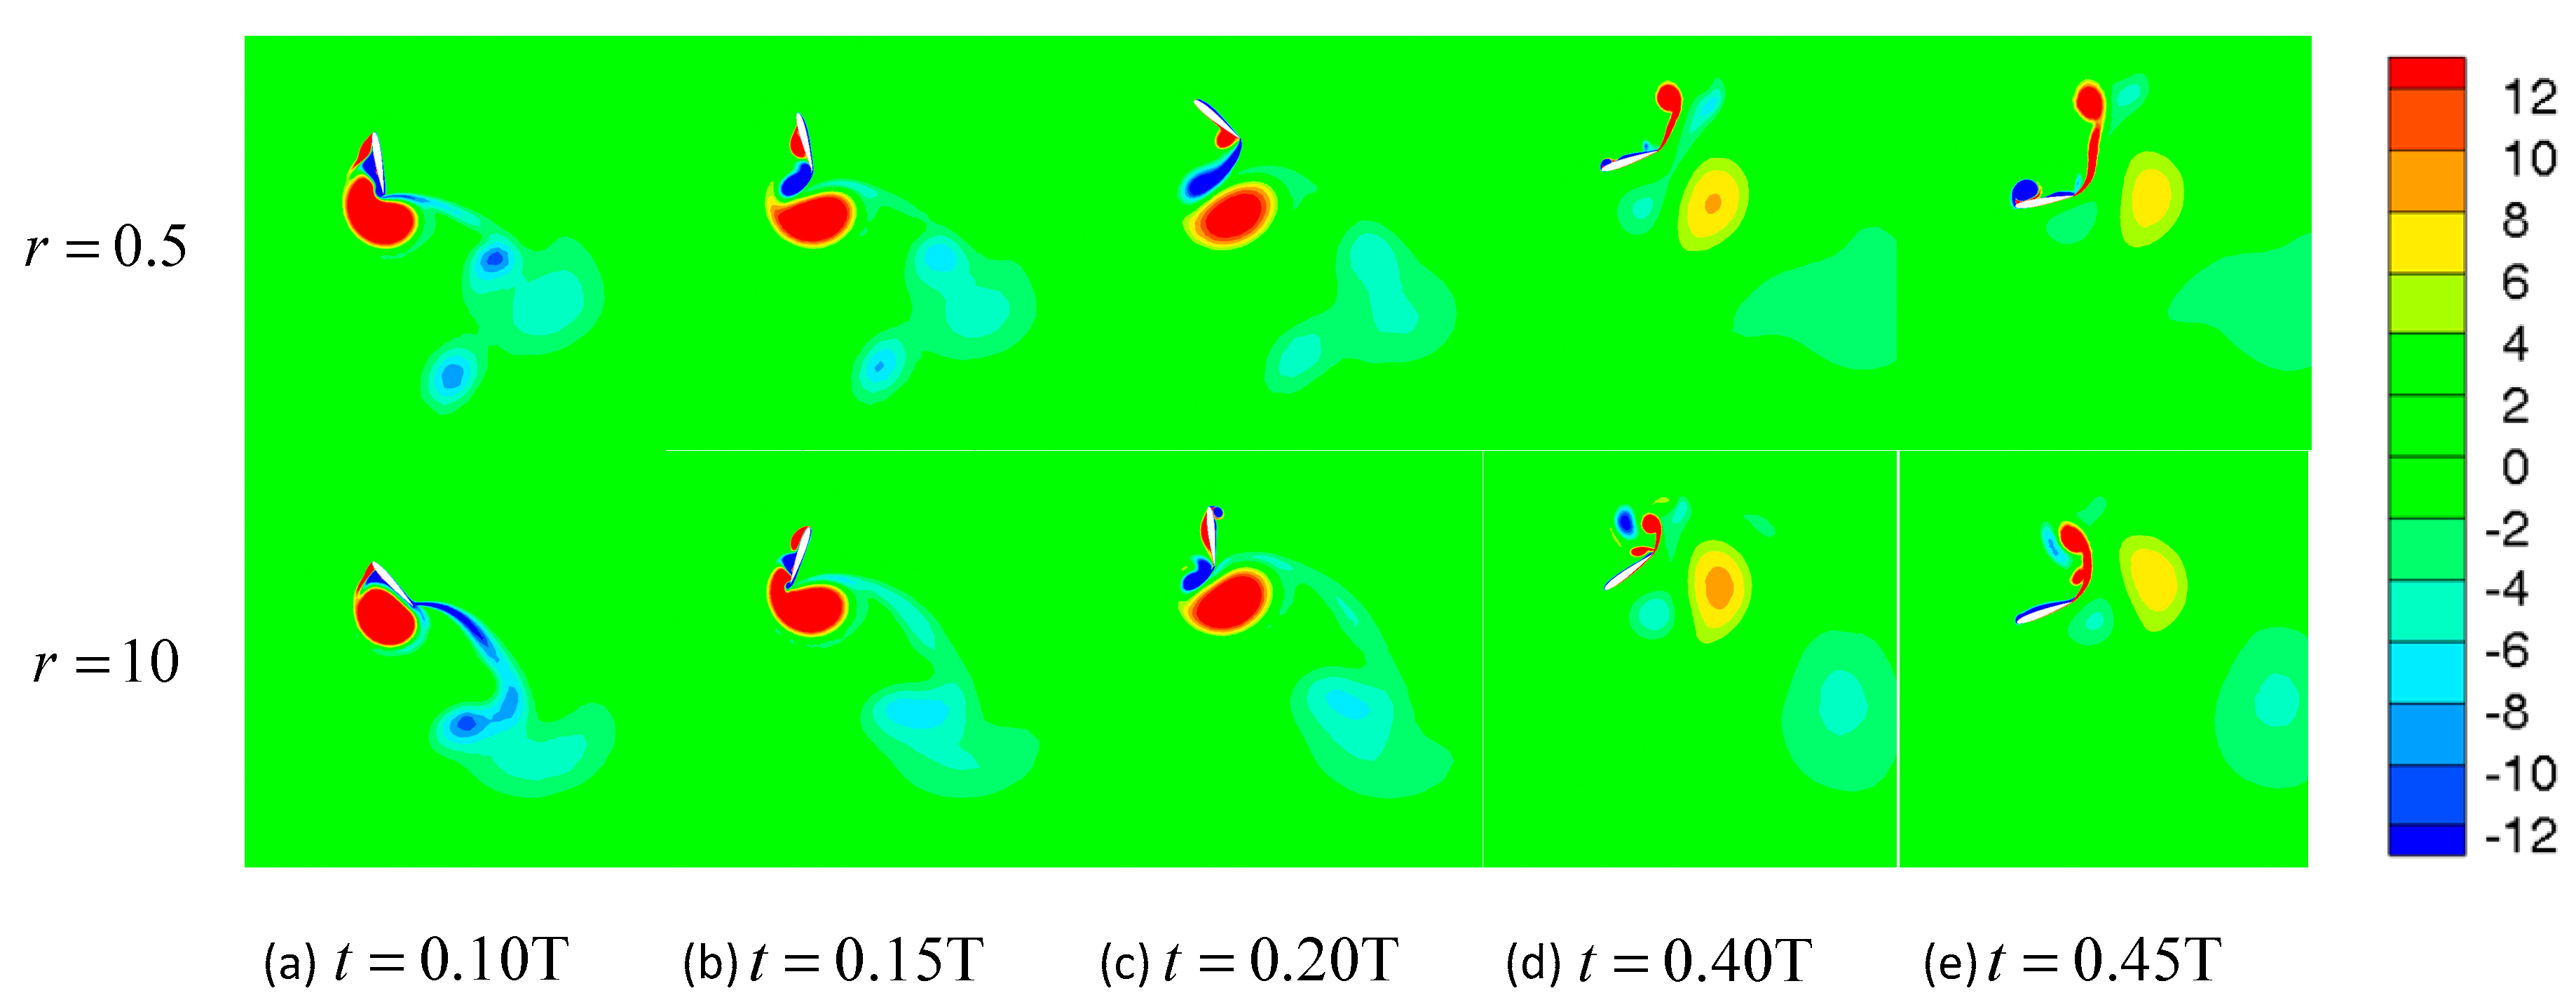
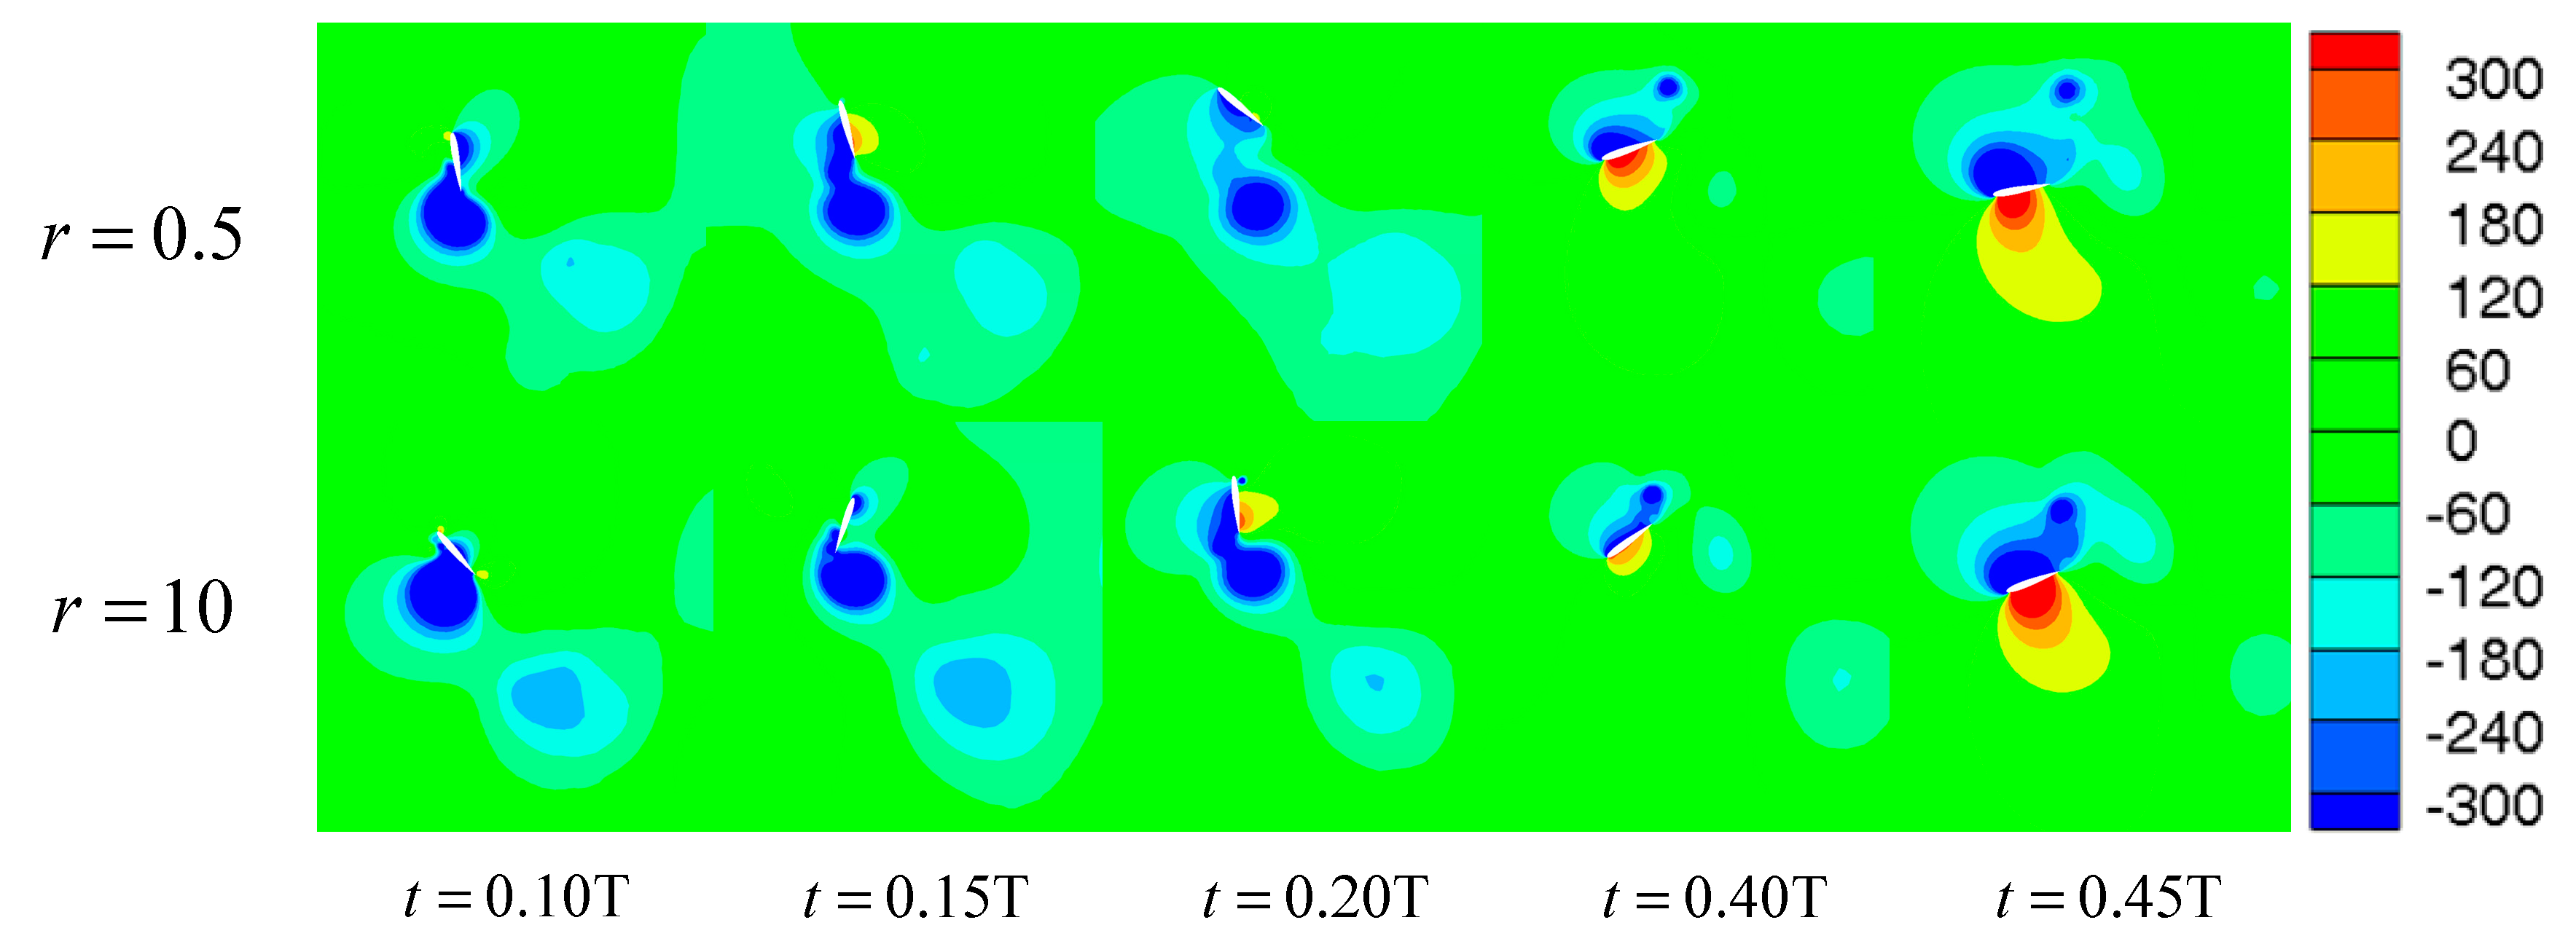
3.1. The Effect of the Mass Ratio

Referring to the Equation (2), we note that the mass ratio can affect the dynamic response of pitching motion and then affect the hydrodynamic characteristics of the flapping foil. In order to investigate the effect of inertia, the propulsion performance of semi-active flapping foil on the parametric space ( f * , r) is shown in Figure 7. The effect of damping is ignored in this section. When f * 0.24 , the mean output power predicts a monotonic increase with the variation of the mass ratio. Especially with the increase of reduced frequency, the change rate of the mean output power coefficient tends to be greater. For f * = 0.19 and f * = 0.23 , comparing r = 10 with r = 0.5 , the mean output power coefficients increase by 3.7% and 18.6%, respectively. When 0.24 < f * < 0.27 , the propulsion performance of the foil firstly increases and then decreases via the mass ratio incearse. For f * = 0.25 , there is an optimal mass ratio,   r = 3 , while the mean output power coefficient reaches the maximum value. Comparing r = 3 with r = 10 and r = 0.5 , the mean output power coefficient increase 14% and 13.9%, respectively. When f * 0.27 , with the variation of the mass ratio, the propulsion performance of the flapping foil decreases monotonously. For f * = 0.27 and f * = 0.34 , comparing r = 10 with r = 0.5 , the mean output power coefficients decrease by 18.6% and 18.7%, respectively. Based on the above analysis, we conclude that the effect of inertia on the mean output power coefficient is closely related to the reduced frequency of flapping foil. When below the critical interval, increasing the mass ratio can improve the output power of flapping foil. When above the critical interval, the inertia coefficient has a counter effect. When the frequency is in the critical interval, there is an optimal value of the mass ratio. When the mass ratio is less than the optimal value, the propulsion performance improves with the variation of the mass ratio, but when the mass ratio is greater than the optimal value, the performance of the flapping foil gradually decreases.
The comparison of the propulsion efficiency of the semi-active flapping foil for varying mass ratio is shown in Figure 8. We find that the inertia coefficient has little effect on the propulsion efficiency, and with the variation of the mass ratio, the propulsion efficiency decreases, except for f * = 0.25 . In addition, we also note that the efficiency decreases monotonously as the reduced frequency increases. For f * = 0.19 and f * = 0.34 , comparing r = 10  with r = 0.5 , the propulsion efficiencies decrease by 3.4% and 3.9%, respectively. For f * = 0.25 , with the increase of the mass ratio, the propulsion efficiency increases first and then decreases. This response is the same as the mean output power coefficient, as shown in Figure 7. The reason for this phenomenon is that the mean output power coefficient has a large change, and the change of input power coefficient is small. The propulsion efficiency is more affected by the former.
Based on the discussion above, we conclude that the effects of the mass ratio on the foil are mainly reflected in the mean output power coefficient. However, there is little effect on propulsion efficiency. Meanwhile, we also note that under different reduced frequencies, the influence of inertia on the flapping foil is also significantly different. In order to investigate the mechanism of this phenomenon, we artificially divide the reduced frequency into high reduced frequency, critical reduced frequency, and low reduced frequency. The effects of the mass ratio on the hydrodynamic performance in these three reduced frequencies will be described in detail.

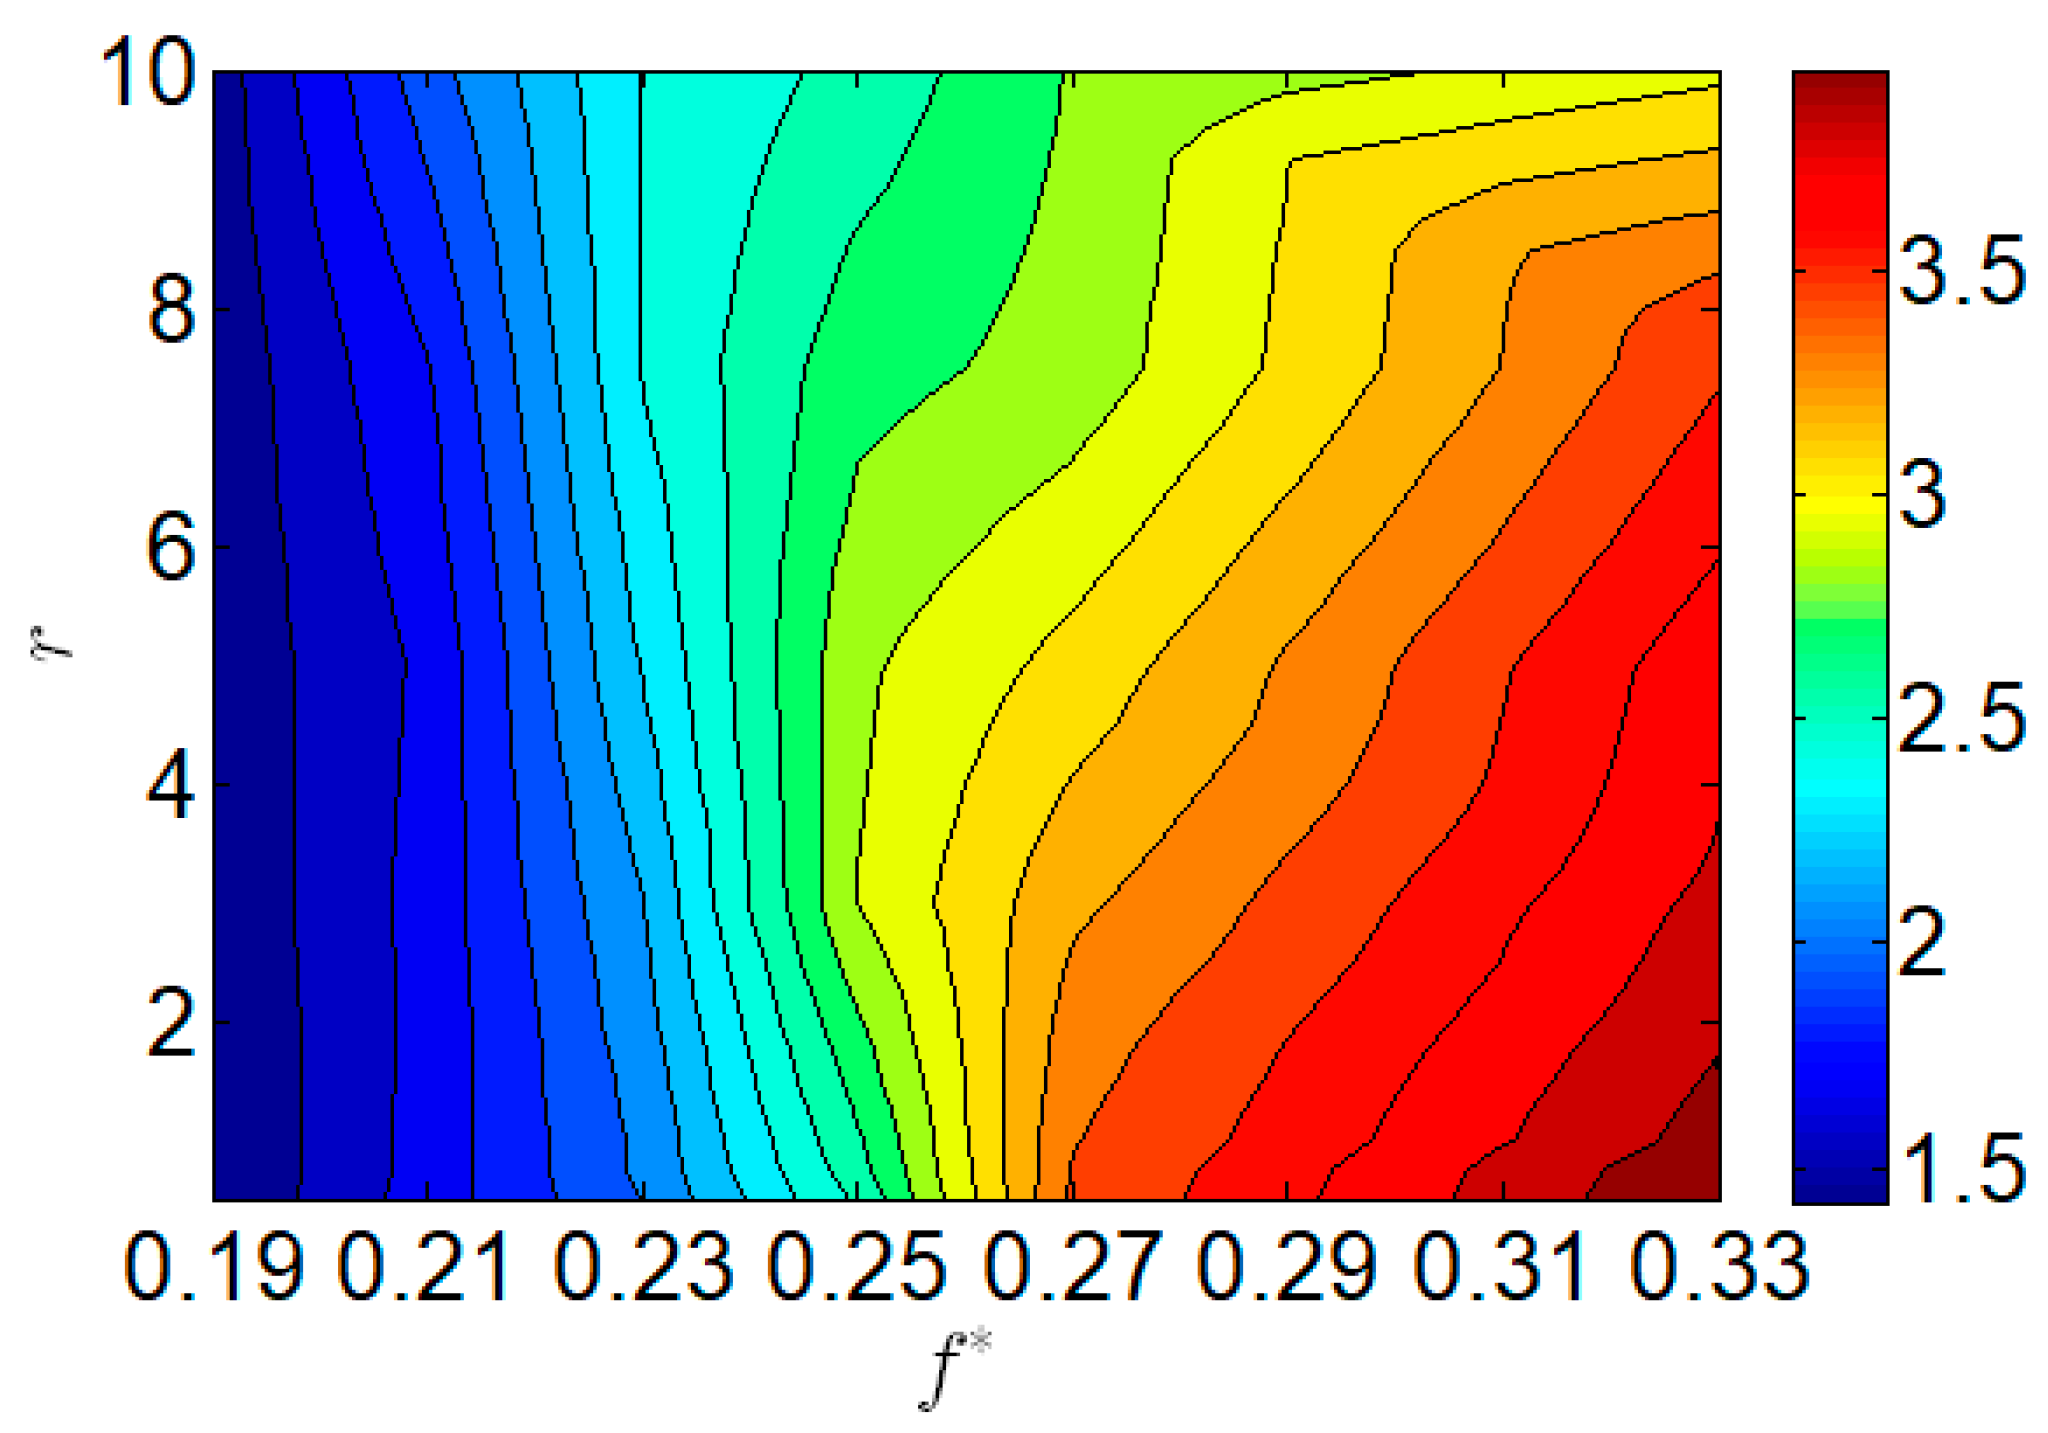
3.1.1. High Reduced Frequency

As illustrated in Figure 7, increasing the mass ratio can reduce the mean output power coefficient under high reduced frequency conditions. In order to explain this phenomenon, the time variations of the thrust coefficient and the effective angle of attack over one periodic cycle for different mass ratios are shown in Figure 6. We note that there are two distinct peaks and troughs in half a cycle for both small and large mass ratio cases. For r = 0.5 , the maximum values of the thrust coefficient are −3.2 and −6.4, respectively, occurring at t / T = 0.21 and t / T = 0.475 . For r = 10 , the maximum values of the thrust coefficient are −2.9 and −5.6, respectively, occurring at t / T = 0.26 and t / T = 0.5 . Comparing r = 10 with r = 0.5 , the maximum values of the thrust coefficient decrease by 9.4% and 12.5%, respectively. In addition, for r = 0.5 and r = 10 , the minimum values are 1.76 and 0.95, respectively, occurring at t / T = 0.15 and t / T = 0.2 . The minimum value of the thrust coefficient of r = 10 decreases by 46% compared with that of r = 0.5 . We notice that with the variation of the mass ratio, the maximum and minimum values of the thrust coefficient are reduced simultaneously. A smaller minimum value of the coefficient is beneficial to improving the propulsion performance of the flapping foil, but reducing the maximum value is not conducive to generating thrust. We also find that the thrust coefficient curve of r = 0.5 is below the curve of r = 10 most of the time, as shown in Figure 9a. This further explains that the large inertia coefficient reduces the mean output power coefficient of the flapping foil. Referring to Figure 9b, we observe that the instantaneous thrust coefficient reaches the maximum value at t / T = 0.475 for r = 0.5 , and the instantaneous effective angle of attack is 50 ° . There exists the boundary separation and dynamic stall around the flapping foil, due to the large effective angle of attack. Although the boundary separation can affect the hydrodynamic characteristics of the flapping foil, the larger effective angle of attack is conducive to the generation of the leading edge vortex (LEV) around the foil, and the proper leading edge vortex can increase the mean output power of the flapping foil [16,21,30,31]. In addition, we also observe that comparing r = 0.5 with and r = 10 , there are phase differences both in the thrust coefficient and the effective angle of attack, as shown in Figure 9a,b. Referring to Equation (2), we notice that the variation of mass ratio affects the moment of inertia, indirectly affects the synchronization of heaving and pitching motion.
In order to further clarify the mechanism of influence of the mass ratio on propulsion performance, we focus on the vortex distribution and evolution around the foil. Referring to Figure 9a, we chose the five snapshots of the vorticity fields of the flapping foil for the mass ratio of r = 0.5 and r = 10 , based on the time variation of the instantaneous thrust coefficient, as shown in Figure 10. The corresponding pressure contours for the different mass ratios are shown in Figure 11. For r = 0.5 , the instantaneous thrust coefficient reaches the maximum value at t / T = 0.15 , as shown in Figure 9a. We find that the pitching motion of the foil have an overshoot phenomenon at this moment, where the pitching angle is 106 ° . The overshoot of pitching motion causes a trailing edge vortex (TEV) and then produces a strong negative pressure area attached on the upper surface. The pressure region distribution around the foil and pitching angle leads to the peak value of resistance force at t / T = 0.15 , as illustrated in Figure 10b and Figure 11b. For r = 10 , we also find similar interactions between the foil and the wake. Comparing r = 10 with r = 0.5 , we observe the strength of the negative area of large mass ratio is weaker than that of small ratio, and this is the reason for the reduced of resistance value of the flapping foil, as shown in Figure 9a. For r = 0.5 , a LEV is generated at t / T = 0.35 , travels along the upper surface of the foil, and then strengthens to a large level at t / T = 0.45 . A strong negative pressure region on the upper surface appears at this time interval. The heaving motion of the foil is in a descend phase and leads to a positive area generated. Referring to Figure 9a, the flapping foil produces the maximum thrust at this moment. For r = 10 , the phase difference between the heaving and pitching motion caused by the large mass ratio makes the LEV separate from the foil prematurely. Thereby, The maximum instantaneous thrust coefficient of r = 10 is smaller than that of r = 0.5 . When t / T = 0 0.25 , the flapping foil for large mass ratio reduces the resistance force; the reduction is limited. When t / T = 0.25 0.5 , the large mass ratio significantly reduces the generation of thrust. We assume that the variation of the mass ratio is not conducive to the generation of thrust under high reduced frequency.

3.1.2. Critical Reduced Frequency

According to Figure 7, we find that there is a critical range of the reduced frequency, where the influence of the mass ratio on the propulsion performance has a unique characteristic. With the increase of the mass ratio, the mean output power coefficient increases first and then reduces. In Figure 12, we illustrate the variations of the thrust coefficient and the pitching angle over one cycle for three mass ratios r = 0.5 , r = 3 and r = 10 . With the increase of the mass ratio, the minimum values of the thrust coefficient continue to decline. For r = 0.5 , r = 3 , and r = 10 , the minimum values are 2.5, 1.7, and 1.3, respectively. Comparing r = 0.5 with r = 3 and r = 10 , the minimum values of the thrust coefficient is reduced by 32% and 48%. The pitching amplitudes of the flapping foil for three mass ratios are 111°, 116°, and 120°, respectively. The pitching amplitudes for three mass ratios are larger than 90°. We find that the more the pitching amplitude deviates from the vertical position, the smaller the horizontal component produced by hydrodynamic force is, which is more conducive to reducing the drag force. Otherwise, we also notice that in the second quarter of the period, with the variation of the mass ratio, the maximum values of the thrust coefficient first increase and then decrease. The maximum values of the thrust coefficient for three mass ratios are 4, 5.2, and 4.3, respectively. Comparing r = 0.5 with r = 3 and r = 10 , the thrust coefficients increase by 30% and 7.5%. The influence of the variation of the mass ratio on the maximum values of the thrust coefficient is the main reason that the mean output power coefficient varies with the mass ratio, as shown in Figure 7.
The five snapshots of the vorticity contour and corresponding pressure contour of the flapping foil for the three different mass ratios r = 0.5 , r = 3 and r = 10 are shown in Figure 13 and Figure 14. We find that at t / T = 0.1 , t / T = 0.15 , and t / T = 0.2 the flapping foil for different mass ratios reaches the maximum resistance, respectively, referring to Figure 12a. The heaving motion of the foil is in an ascend phase in this time interval, and the heaving velocity decreases gradually. Compared with three different mass ratios, the strength of the negative pressure area generated by the TEV continues to weaken. Meanwhile, we also observe that the pitching amplitude for three different mass ratios increases. The large pitching angle further reduces the horizontal component to the hydrodynamic force activated on the flapping foil. According to Figure 13d,e and Figure 14d,e, we point out that due to the lagged effect of the mass ratio on the phase difference of the pitching motion, the occurrence of the LEV is also delayed; this phenomenon can also be found in Figure 12a. Otherwise, the intensity of the LEV is continuously enhanced as the heaving velocity increases. The above factors are all conducive to improving the propulsion performance of flapping foil. However, with the further growth of the mass ratio, the LEV cannot attach to the upper surface of the foil well, as shown in Figure 13e. The premature separation of the LEV from the foil reduces the generation of thrust, resulting in a peak thrust coefficient of r = 10 being less than that of r = 3. In summary, we conclude that the generation and separation of the LEV, the pitching motion trajectory, and the synchronization of pitching and heaving motion all affect the generation of thrust.

3.1.3. Low Reduced Frequency

In the previous sections, we find the mean output power coefficient decreases monotonically with the variation of the mass ratio of the flapping foil at high reduced frequency. However, according to Figure 7, we also observe that increasing the mass ratio can improve the mean output power coefficient under low reduced frequency.
The variation of the instantaneous thrust coefficient and pitching angle in a period is illustrated in Figure 15. We observe that there are two distinct peaks and troughs in half a period for r = 0.5 and r = 10 in reference to the high reduced frequency. For r = 0.5 , the maximum and minimum thrust coefficients are −2.55 and 0.81. For r = 10 , the maximum and minimum instantaneous thrust coefficients are −3.35 and 1.75. Comparing r = 10 with r = 0.5 , the maximum value of the thrust coefficient increases by 31.4%, and the minimum value of the thrust coefficient increases by 116%. We notice that with the variation of the mass ratio, the maximum and minimum values of the thrust coefficient are increased simultaneously. The effects of the mass ratio at low reduced frequency on the instantaneous thrust coefficient is opposite to that at high reduced frequency, referring to Figure 15a. In the first quarter period, the increase of the mass ratio enlarges the resistance of the foil. In the second quarter period, the variation of the mass ratio increases the maximum values of the thrust coefficient. We conclude that the influence of the mass ratio on the thrust coefficient is inconsistent in a period. In addition, we notice that the variation of the mass ratio increases the pitching amplitude. For f * = 0.21 , the pitching amplitudes of the flapping foil are 85° and 109°, respectively, at r = 0.5 and r = 10 . The pitching amplitude increases by 28.3%. Further, we also observe that with the increase of the reduced frequency of the flapping foil, the effect of the mass ratio on the pitching amplitude decreases gradually. For f * = 0.25 and f * = 0.27 , with the variation of the mass ratio, the pitching amplitude increases by 8.1% and 4.3%, respectively, as shown in Figure 9b and Figure 12b. Further, we note that the minimum thrust coefficient occurs when the pitching motion approaches the peak value.
According to Figure 15, the five snapshots of the vorticity contour and corresponding pressure contour of the flapping foil for the mass ratio of r = 0.5 and r = 10 are shown in Figure 16 and Figure 17. For r = 0.5 and r = 10 , the thrust coefficients reach the minimum value at t / T = 0.1 , and t / T = 0.15 , respectively. Referring to Figure 12b, we note that the pitching angle is equal to the pitching amplitude, which are 85° and 109°, respectively. The large pitching angle and the negative pressure region for r = 10 result in a greater horizontal component of the hydrodynamic force acting on the foil than that for r = 0.5 , thereby increasing the resistance force. For r = 0.5 and r = 10 , we observe that the thrust coefficients reach the extreme value at t / T = 0.4 and t / T = 0.45 , respectively, referring to Figure 12a. Comparing Figure 16d,e, we note that the strength of the LEV for r = 10 is greater than that for r = 0.5 . The LEV for r = 10 at t / T = 0.45 is well attached to the upper surface of the flapping foil, and the LEV for r = 0.5 at t / T = 0.4 has begun to separate from the upper surface. The strong LEV and good adhesion increase the strength of the negative area, as shown in Figure 17d,e, and lead to produce large thrust force at this moment. This indicates that a large mass ratio results in a greater phase difference between the pitching motion and the heaving motion of the flapping foil. At this time, the heaving velocity is greater than that of small mass ratio, which in turn increases the strength of the LEV and improves the propulsion performance of the flapping foil.

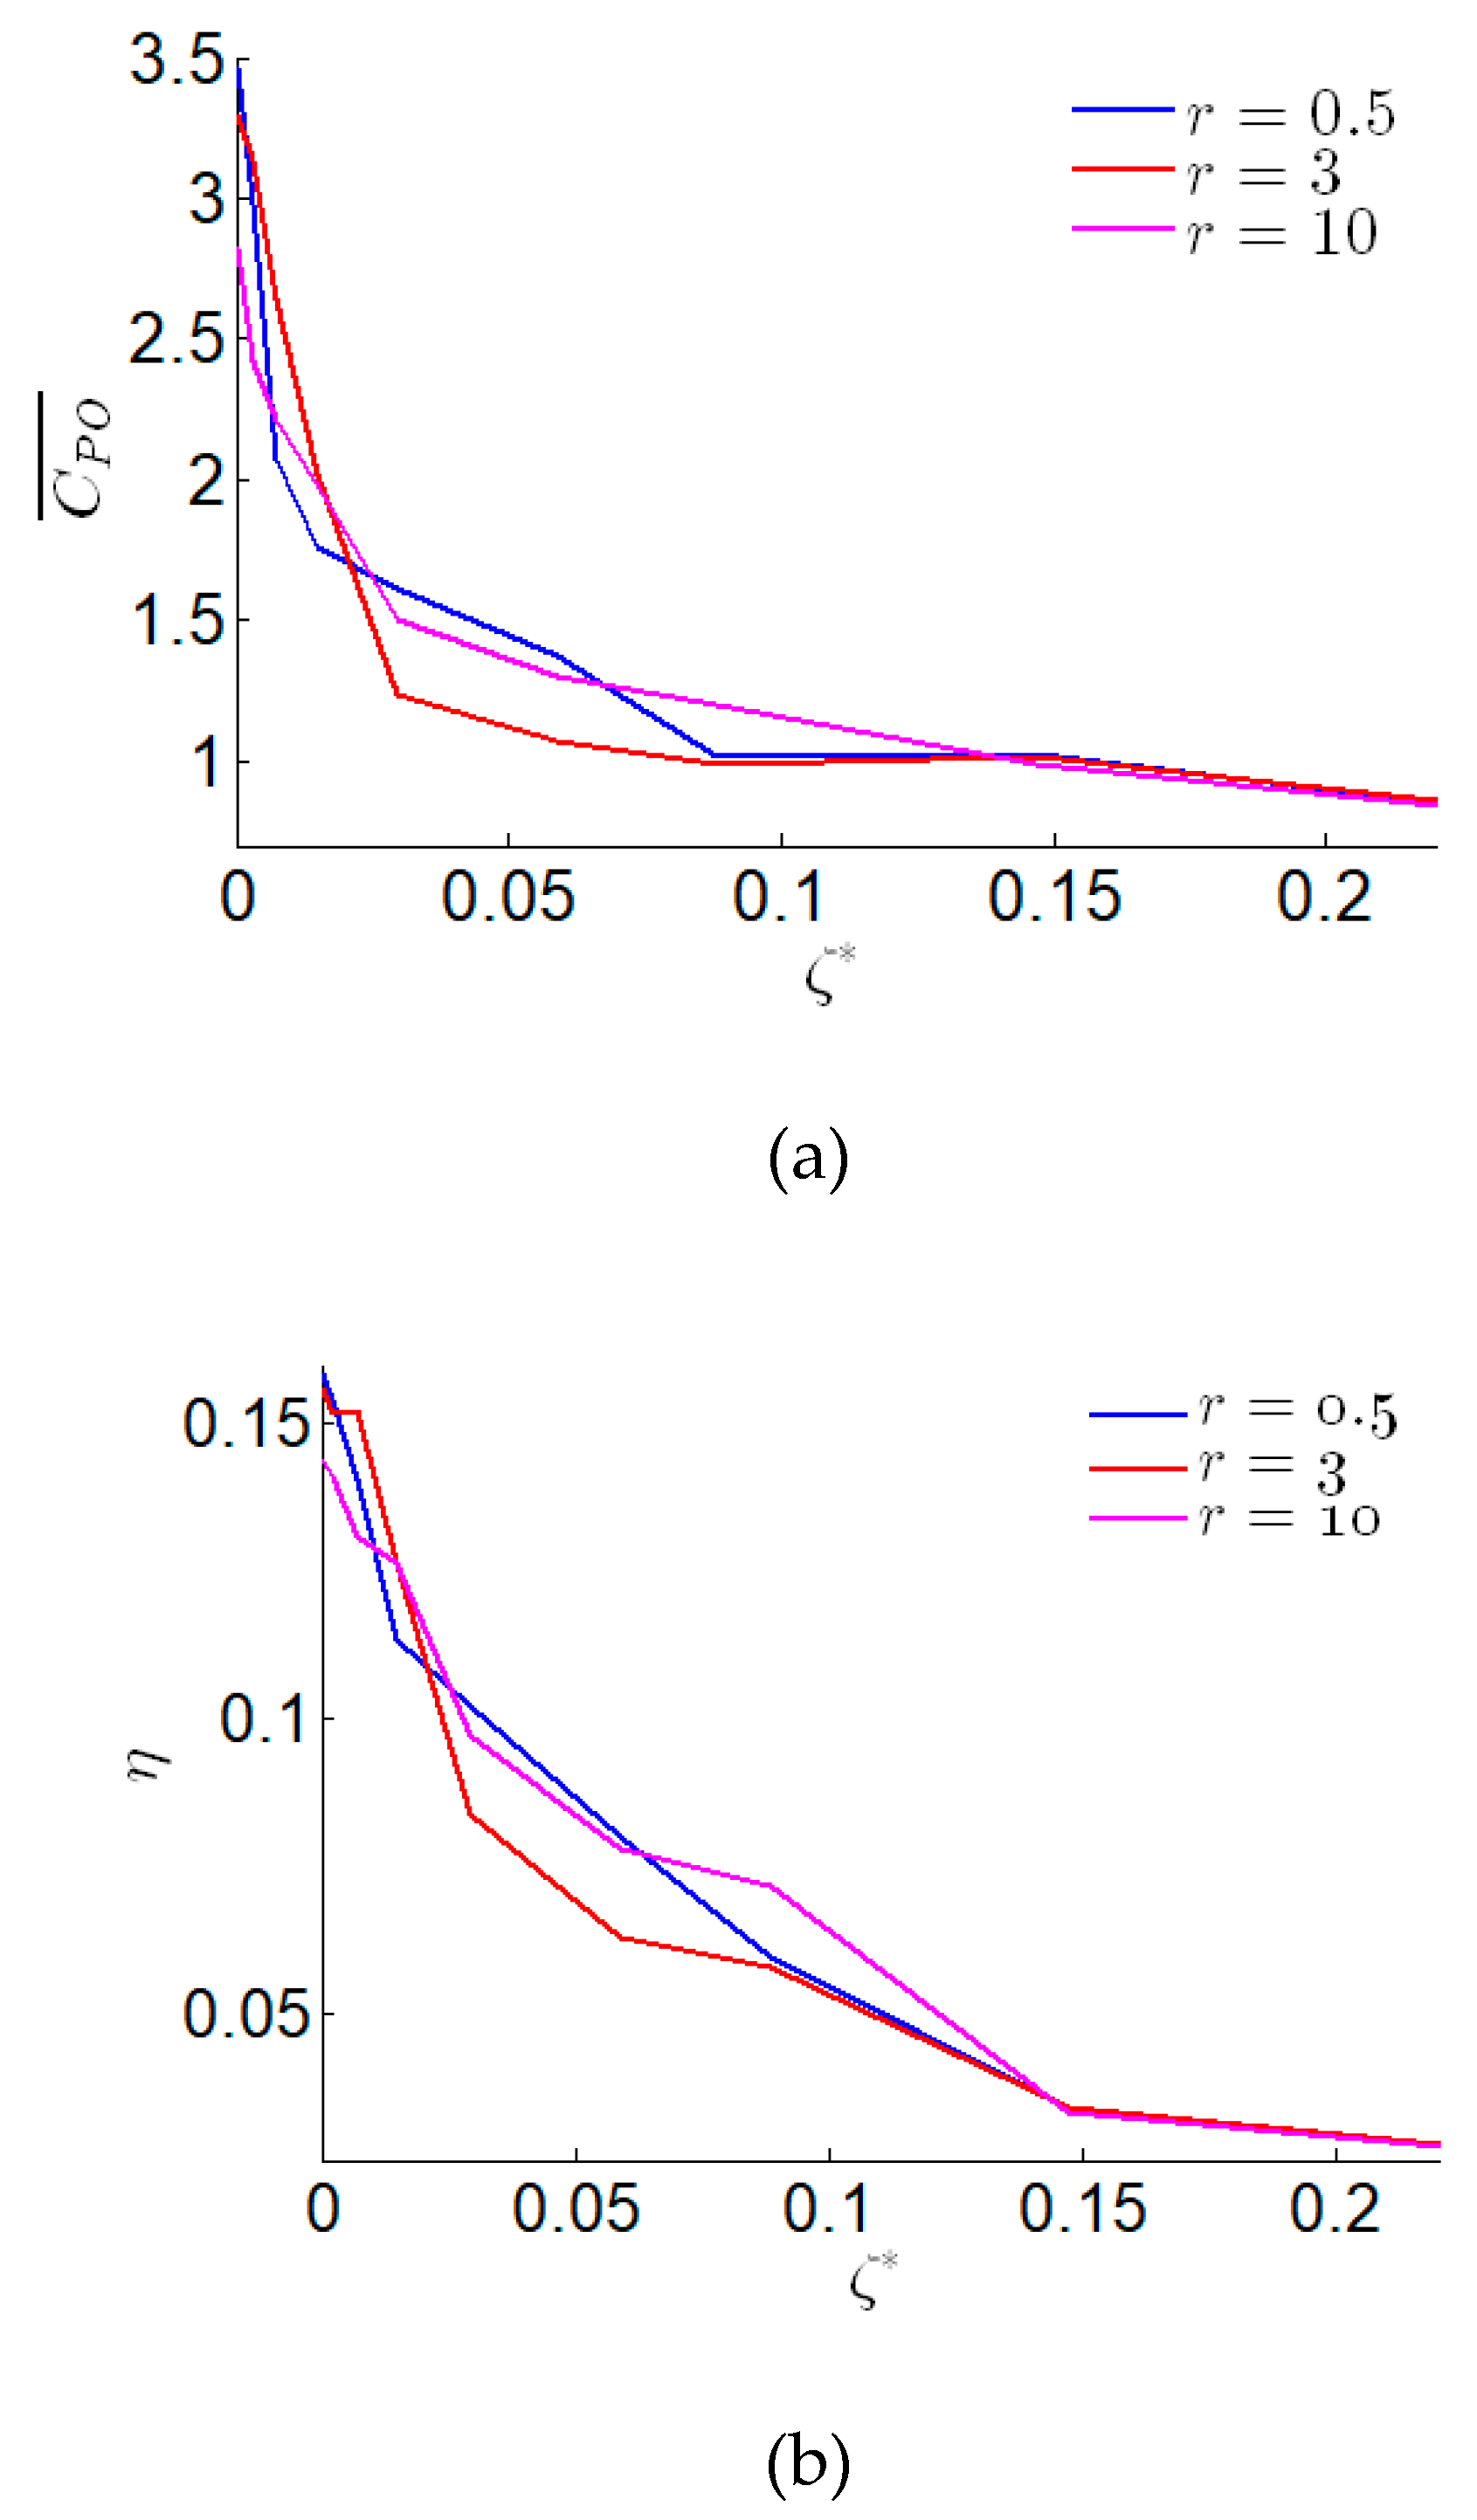
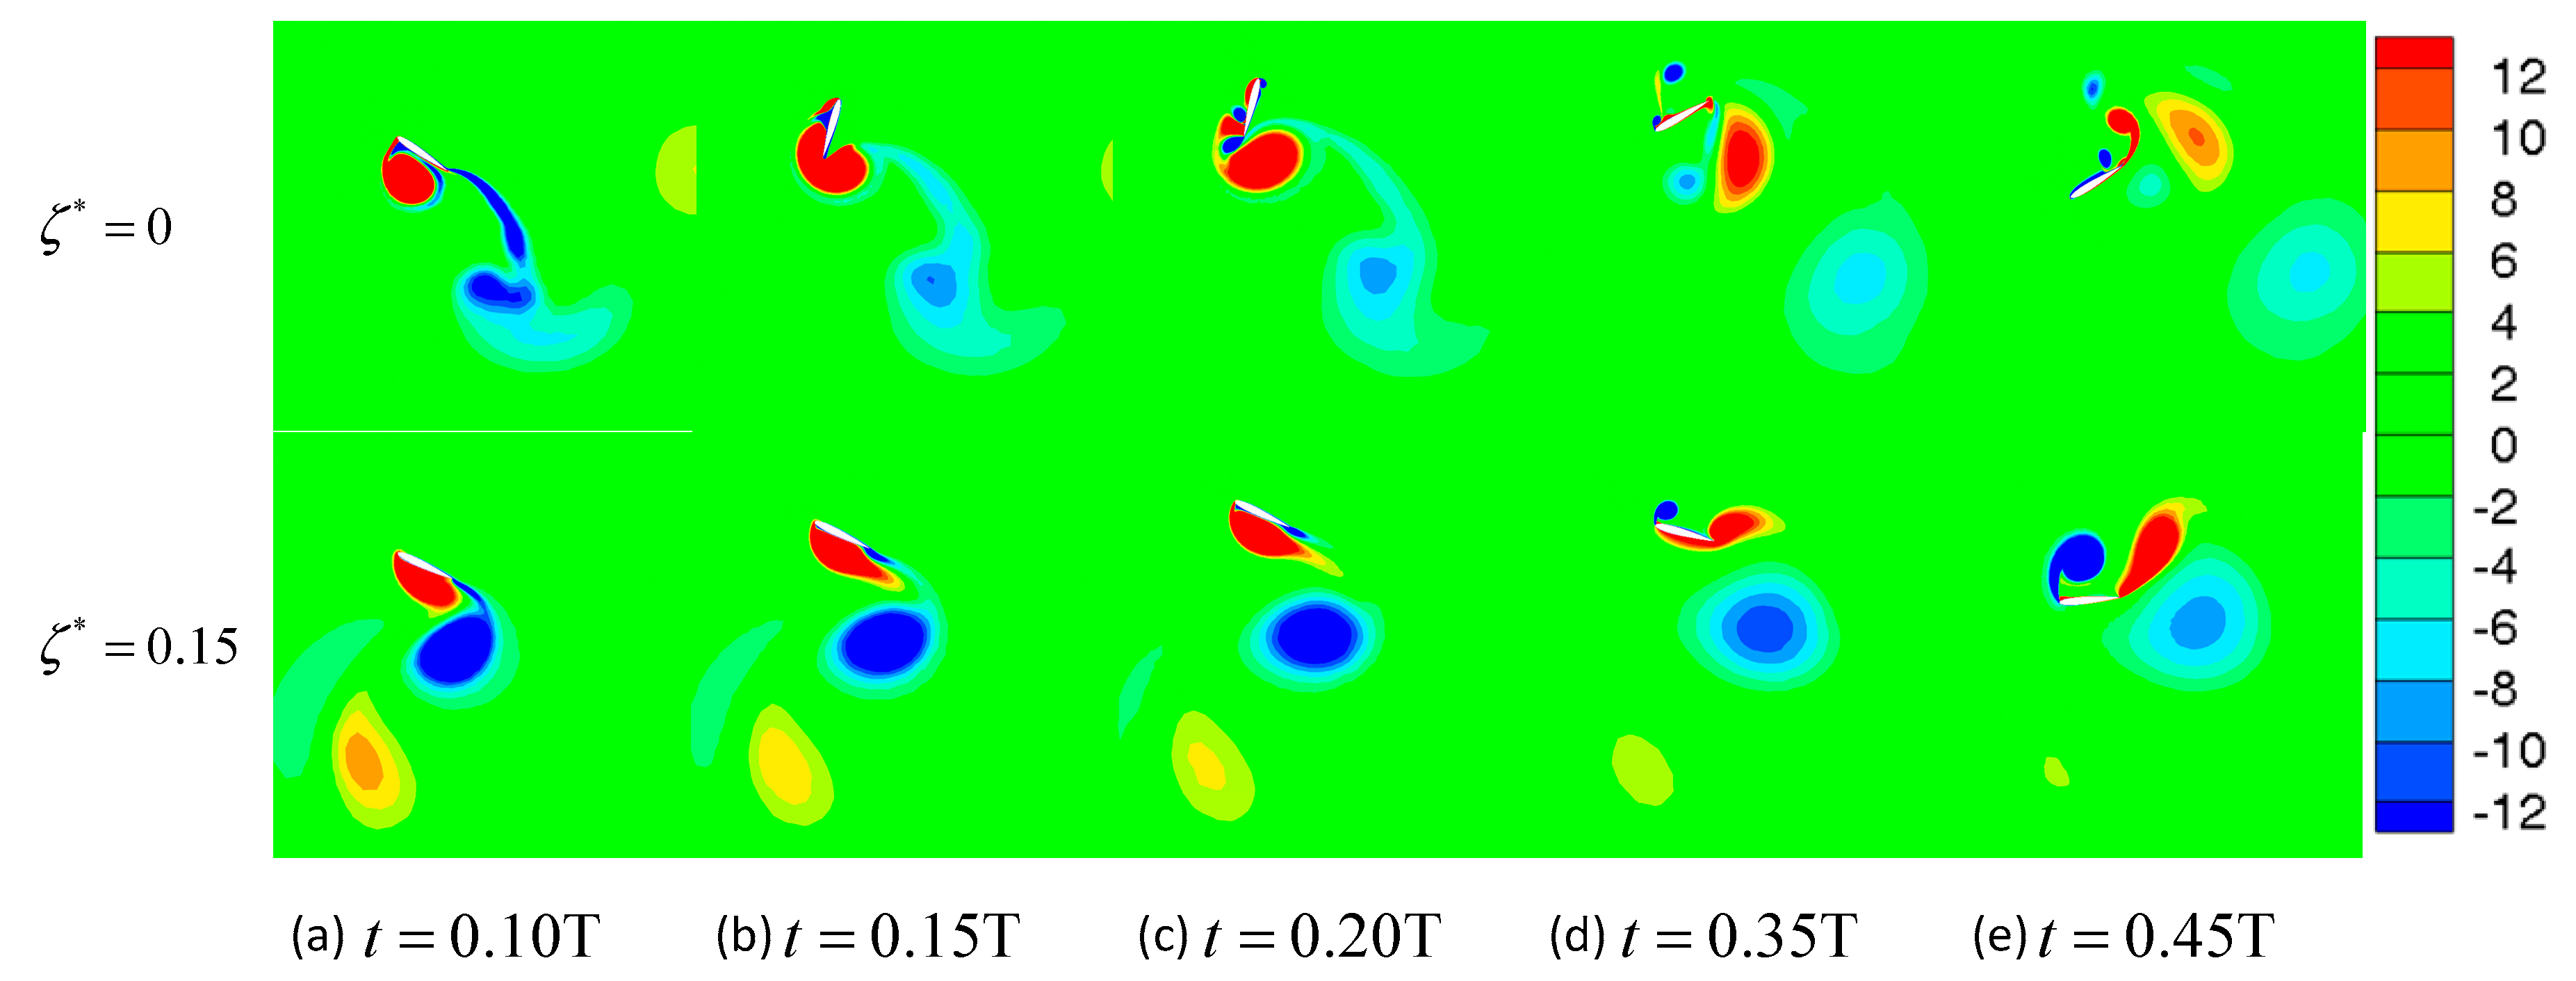
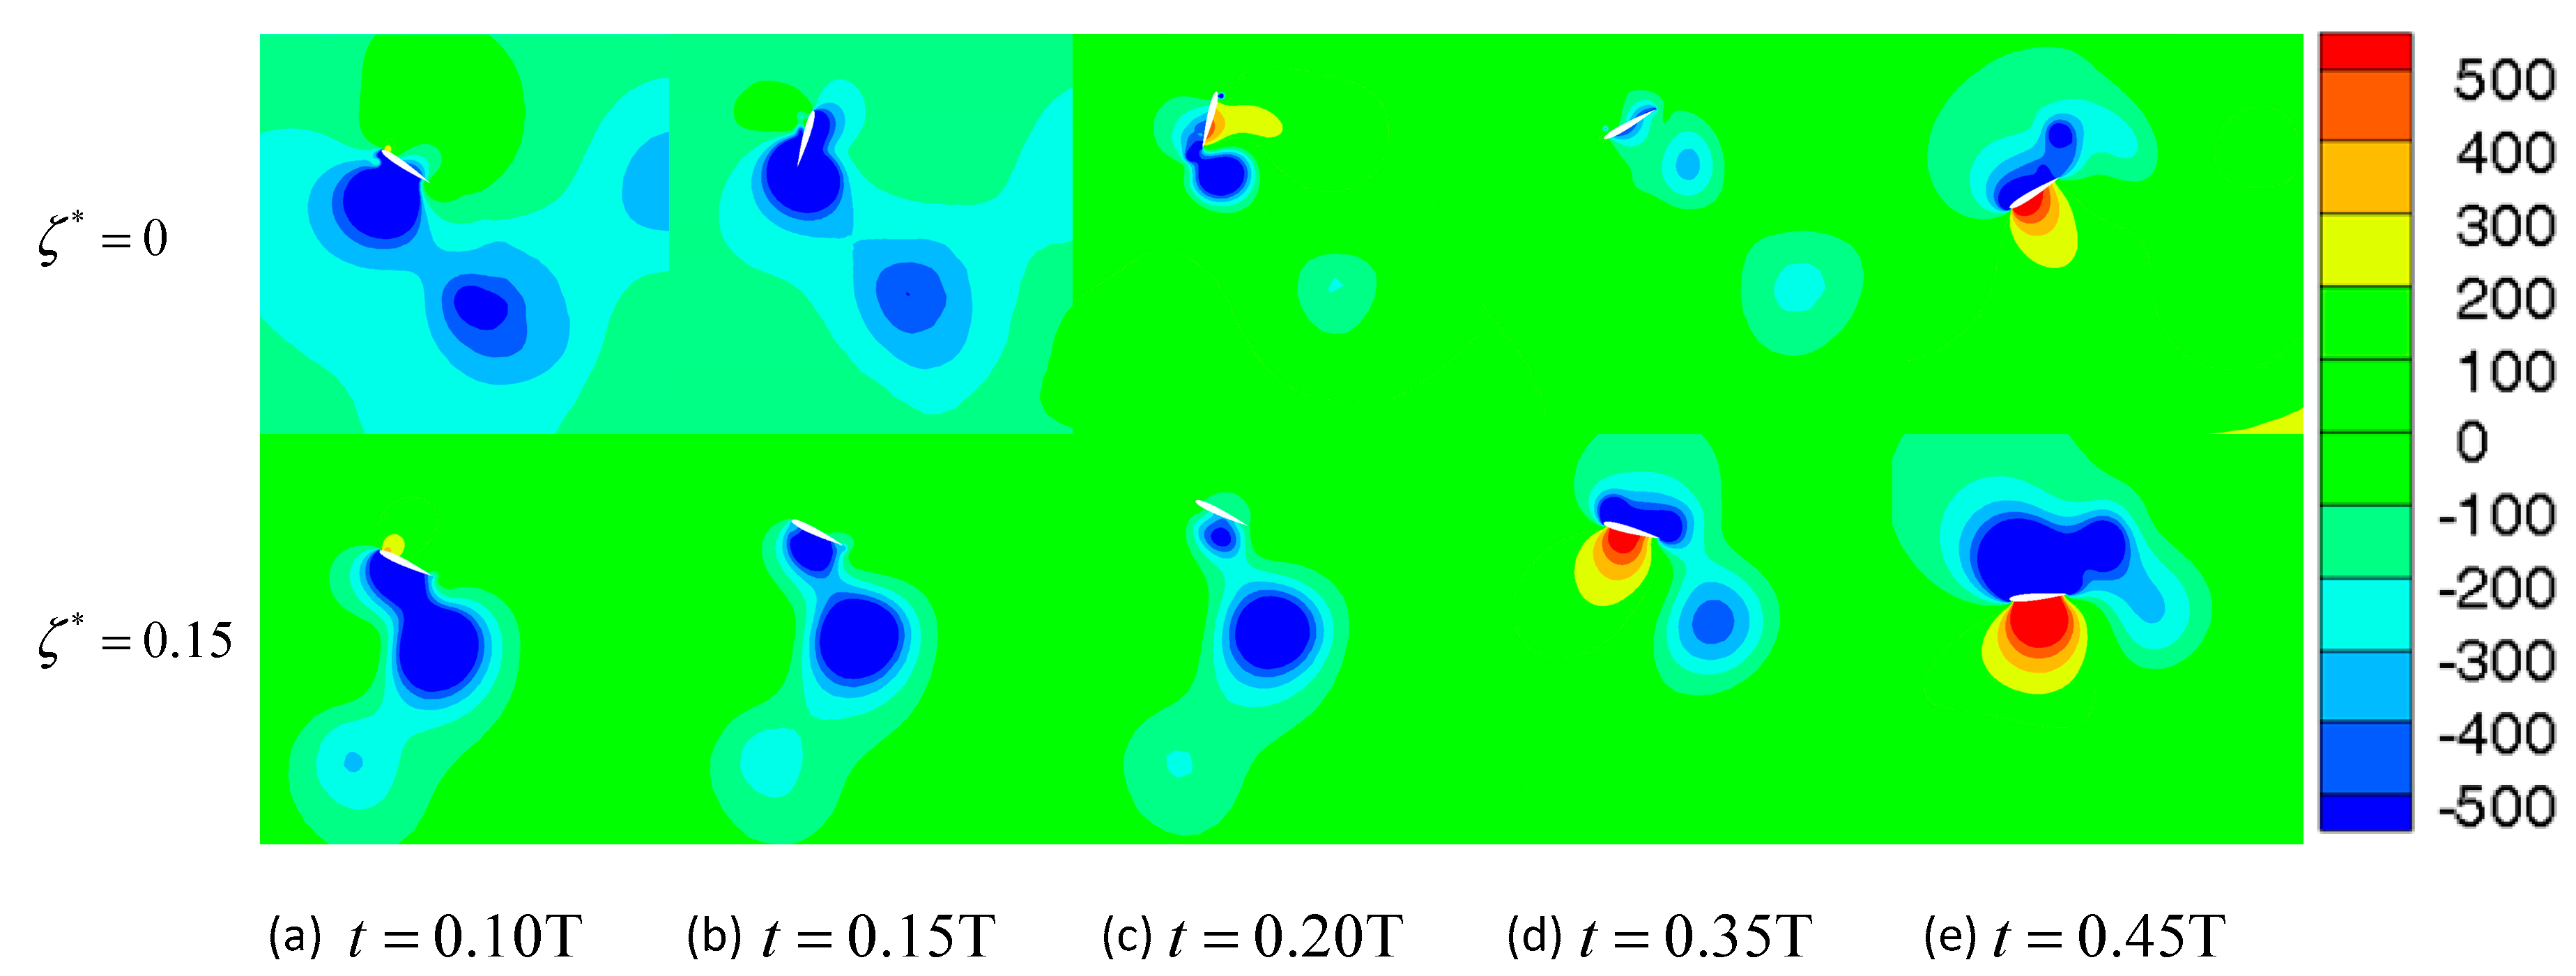
3.2. The Effect of the Damping Coefficient

In the previous section, we discussed the effects of the mass ratio on the propulsion performance of the foil and ignored the damping coefficient effect. This section will explore the influence mechanism of the damping coefficient on flapping foil.
The evolution of the mean output power coefficient and the propulsion efficiency for the variation of damping coefficient of three different mass ratios are shown in Figure 18a,b. We notice that with the increase of the damping coefficient, the mean output power coefficient of the flapping foil decreases monotonously. Further, we note that when ζ * < 0.03 , the mean output power coefficient decreases rapidly. When 0.03 ζ * < 0.15 , the rate of the mean output power coefficient reduces. When 0.15 ζ * , the mean output power coefficients for three mass ratios tend to consistent. Comparing ζ * = 0 with ζ * = 0.07 and ζ * = 0.15 , the mean output power coefficients decrease by 40.3% and 70.3%, respectively. The influence of the damping coefficient on the propulsion efficiency of flapping foil under different mass ratios is also basically the same. As the damping coefficient increases, the propulsion efficiency of the foil decreases linearly. Comparing ζ * = 0 with ζ * = 0.07 and ζ * = 0.15 , the propulsion efficiencies decrease by 11.3% and 78.5%, respectively. In summary, we conclude that the steady damping coefficient seriously affects the mean output power coefficient and propulsion efficiency of the propulsion system. With the increase of the damping coefficient, the propulsion performance of the flapping foil significantly decreases.
According to the above discussion, we illustrate the evolution of the instantaneous thrust coefficient in one period for three different damping coefficients, as shown in Figure 19. For ζ * = 0 and ζ * = 0.007 , we note that there are two distinct peaks and troughs in half a cycle. Comparing ζ * = 0.007 with ζ * = 0 , we notice that with the increase of the damping coefficient, the peaks and troughs of the instantaneous thrust coefficient are weakened. With the further increase of the damping coefficient, the evolution of the thrust coefficient changes significantly. For ζ * = 0.15 , there are only one distinct peaks and troughs in half a cycle. The thrust coefficient curve of ζ * = 0 is lower than the curve of ζ * = 0.007 at most times. Further, the thrust coefficient of ζ * = 0.15 is significantly smaller than that of ζ * = 0 and ζ * = 0.007 . This results in the mean output power coefficient of ζ * = 0.15 being significantly smaller than that of ζ * = 0 and ζ * = 0.007 . By analyzing the influence of different damping coefficients and the evolution of thrust coefficient in a cycle, we conclude that any damping will reduce the propulsion performance of the flapping foil; even a sufficiently small damping coefficient is not conducive to the generation of thrust of the semi-active flapping foil.
In order to further clarify the mechanism of influence of the damping coefficient, we focus on the vortex evolution around the foil. We illustrate the five snapshots of the vorticity fields of the flapping foil and the corresponding pressure contours for the different damping coefficient of ζ * = 0 and ζ * = 0.15 , based on the time variation of the instantaneous thrust coefficient, as shown in Figure 20 and Figure 21. For ζ * = 0 , at t / T = 0.1 to t / T = 0.20 , we note that the pitching motion has an overshoot, which causes the flapping foil to fail to generate thrust. This phenomenon can also be found in the previous section. Comparing ζ * = 0.15 with ζ * = 0 , we illustrate that the overshoot of pitching motion disappears with a large damping coefficient. A LEV generates and attaches well to the foil. At this time interval, a strong negative pressure region is generated under the foil, as shown in Figure 21a,b. We conclude that the damping coefficient is beneficial to improve the propulsion performance of the flapping foil in the first quarter cycle. For ζ * = 0.15 , a LEV and TEV are generated at the leading and trailing edges of the flapping foil, respectively, as shown in Figure 20d,e. The LEV and TEV cause a negative pressure region on the lower surface of the foil. Meanwhile, the heaving motion of the foil is in a descend phase in this time interval, and the heaving velocity increases gradually. Thus, we find that the negative pressure area on the foil is enhanced, as illustrated in Figure 21d,e. Due to the effect of the damping coefficient on the pitching motion of the flapping foil, the pitching angle is −4 degrees at t / T = 0.45 . Comparing ζ * = 0.15 with ζ * = 0 , we find that a small pitching angle is detrimental to generate the thrust by the semi-active flapping foil. In summary, we conclude that the constant damping coefficient affects the synchronization of the heaving and pitching motion, reduces the mean output power and propulsion efficiency. Further, we notice that any constant damping, even very small, is not conducive to the improvement of the propulsion performance of the semi-active flapping foil.

4. Conclusions

In this work, the propulsion performance of the semi-active flapping foil with different mass ratios and torque damping coefficients is systematically investigated via two-dimensional URANS and Finite Volume Method. Through numerical simulation results, we summarize several conclusions as follows. We first analyze the effect of the mass ratio on the mean output power coefficient and propulsion efficiency. We note that the mass ratio slightly affects the propulsion efficiency. However, the mass ratio has a noticeable influence on the mean output power coefficient, and the influence law of the mass ratio under different reduced frequencies is different. For high reduced frequency, with the increase of the mass ratio, the propulsion performance of the flapping foil decreases monotonously. For low reduced frequency, the mean output power predicts a monotonic increase with the variation of the mass ratio. For critical reduced frequency, the mean output power coefficient firstly increases and then decreases via the mass ratio increases. Then, we examine the influence of the damping coefficient on the propulsion performance of the foil, and notice the damping coefficient has a serious adverse effect on the output power and propulsion efficiency. Even more, we note that even a sufficiently small damping coefficient will seriously affect the generation of thrust. The influence of the damping coefficient should be considered first when we design the propulsion device of the semi-active flapping foil. Meanwhile, as the effect of the mass ratio of the foil on propulsion performance is strongly correlated to the reduced frequency, we should consider the sea conditions to comprehensively select the mass ratio of the semi-active flapping foil to optimize the propulsion device.
The results of this paper provide theoretical guidance for the optimal design of a single semi-active flapping foil propulsion system. Since the propulsion system of the wave glider adopts the form of a tandem foil, the mutual influence between multiple flapping foil also needs to be fully considered. Therefore, further research may be conducted on the coupling between multi-foil. In addition, the current study finds that constant damping coefficient has a serious adverse effect on the flapping foil propulsion system. How to use variable damping to improve the propulsion performance of the semi-active flapping foil is also one of the focuses of future research.

Author Contributions

Conceptualization, Z.Q., B.Z. and J.Z.; formal analysis, Z.Q. and M.J.; funding acquisition, M.J. and L.J.; investigation, Z.Q. and B.Z.; methodology, Z.Q. and B.Z.; validation, Z.Q., B.Z. and L.J.; writing—original draft, Z.Q. and M.J.; writing—review and editing, J.Z. All authors have read and agreed to the published version of the manuscript.

Funding

This study was funded by the National Key Research and Development Project (grant number 2017YFC0305900), the Natural Science Foundation of Tianjin (grant number 18JCYBJC24000), and the Key Laboratory of Submarine Geosciences, MNR (grant number KLSG1907.

Acknowledgments

The authors would like to thank the anonymous reviewers for their constructive comments and suggestions.

Conflicts of Interest

The authors declare no conflict of interest.

References

  1. Kraus, N.; Bingham, B. In Estimation of wave glider dynamics for precise positioning. In Proceedings of the Oceans 2011, Waikoloa, HI, USA, 19–22 September 2011; pp. 1–9. [Google Scholar]
  2. Hine, R.; Willcox, S.; Hine, G.; Richardson, T. In The Wave Glider: A Wave-Powered autonomous marine vehicle. In Proceedings of the Oceans 2009, Biloxi, MS, USA, 26–29 October 2009; pp. 1–6. [Google Scholar]
  3. Manley, J.; Willcox, S. In The Wave Glider: A persistent platform for ocean science. In Proceedings of the Oceans 2010, Sydney, Australia, 24–27 May 2010; pp. 1–5. [Google Scholar]
  4. Wiggins, S.; Manley, J.; Brager, E.; Woolhiser, B. Proceedings of the Monitoring Marine Mammal Acoustics Using Wave Glider, Oceans 2010, Seattle, WA, USA, 20–23 September 2010; pp. 1–4.
  5. German, C.R.; Jakuba, M.V.; Kinsey, J.C.; Partan, J.; Suman, S.; Belani, A.; Yoerger, D.R. In A long term vision for long-range ship-free deep ocean operations: Persistent presence through coordination of Autonomous Surface Vehicles and Autonomous Underwater Vehicles. In Proceedings of the 2012 IEEE/OES Autonomous Underwater Vehicles (AUV), Southampton, UK, 24–27 September 2012; pp. 1–7. [Google Scholar]
  6. Griffith, J. In Long Term Autonomous Ocean Remote Sensing Utilizing the Wave Glider. In Proceedings of the AGU Fall Meeting, San Francisco, CA, USA, 3–7 December 2012. [Google Scholar]
  7. Kraus, N.D. Wave Glider Dynamic Modeling, Parameter Identification and Simulation. Ph.D. Thesis, University of Hawaii, Honolulu, HI, USA, 2012. [Google Scholar]
  8. Ngo, P.; Al-Sabban, W.; Thomas, J.; Anderson, W.; Das, J.; Smith, R.N. In An analysis of regression models for predicting the speed of a wave glider autonomous surface vehicle. In Proceedings of the Australasian Conference on Robotics and Automation, Sydney, Australia, 2–4 December 2013. [Google Scholar]
  9. Wang, P.; Tian, X.; Lu, W.; Hu, Z.; Luo, Y. Dynamic modeling and simulations of the wave glider. Appl. Math. Model. 2019, 66, 77–96. [Google Scholar] [CrossRef]
  10. Tian, B.; Yu, J.; Zhang, A. In Lagrangian dynamic modeling of wave-driven unmanned surface vehicle in three dimensions based on the D-H approach. In Proceedings of the IEEE International Conference on Cyber Technology in Automation, Shenyang, China, 8–12 June 2015. [Google Scholar]
  11. Qi, Z.F.; Liu, W.X.; Jia, L.J.; Qin, Y.F.; Sun, X.J. Dynamic Modeling and Motion Simulation for Wave Glider. Appl. Mech. Mater. 2013, 397, 285–290. [Google Scholar] [CrossRef]
  12. Li, J.J.; Xuan, M.Z.; Zhan, F.Q.; Yu, F.Q.; Xiu, J.S. Hydrodynamic Analysis of Submarine of the Wave Glider. Adv. Mater. Res. 2014, 834, 1505–1511. [Google Scholar] [CrossRef]
  13. Liu, P.; Su, Y.M.; Liao, Y.L. Numerical and experimental studies on the propulsion performance of a Wave Glide propulsor. China Ocean Eng. 2016, 30, 393–406. [Google Scholar] [CrossRef]
  14. Bing, H.Z.; Xu, C.Y.; Chao, L.Y.; Jia, W.C. The Effect of Attack Angle on the Performance of Wave Glider Wings. Appl. Mech. Mater. 2015, 727, 587–591. [Google Scholar]
  15. Yang, F.; Shi, W.; Xu, Z.; Guo, B.; Wang, D. Numerical investigation of a wave glider in head seas. Ocean Eng. 2018, 164, 127–138. [Google Scholar] [CrossRef] [Green Version]
  16. Qi, Z.; Zou, B.; Lu, H.; Shi, J.; Li, G.; Qin, Y.; Zhai, J. Numerical Investigation of the Semi-Active Flapping Foil of the Wave Glider. J. Mar. Sci. Eng. 2019, 8, 13. [Google Scholar] [CrossRef] [Green Version]
  17. Triantafyllou, G.S.; Triantafyllou, M.S.; Grosenbaugh, M.A. Optimal Thrust Development in Oscillating Foils with Application to Fish Propulsion. J. Fluids Struct. 1993, 7, 205–224. [Google Scholar] [CrossRef]
  18. Murray, M.M.; Howle, L.E. Spring stiffness influence on an oscillating propulsor. J. Fluids Struct. 2003, 17, 915–926. [Google Scholar] [CrossRef]
  19. Pedro, G.; Suleman, A.; Djilali, N. A numerical study of the propulsive efficiency of a flapping hydrofoil. Int. J. Numer. Methods Fluids 2003, 42, 493–526. [Google Scholar] [CrossRef]
  20. Young, J.; Lai, J.C.S. Mechanisms Influencing the Efficiency of Oscillating Airfoil Propulsion. AIAA J. 2007, 45, 1695–1702. [Google Scholar] [CrossRef]
  21. Qi, Z.; Zhai, J.; Li, G.; Peng, J. Effects of non-sinusoidal pitching motion on the propulsion performance of an oscillating foil. PLoS ONE 2019, 14, e0218832. [Google Scholar] [CrossRef]
  22. Lin, X.; Wu, J.; Zhang, T. Performance investigation of a self-propelled foil with combined oscillating motion in stationary fluid. Ocean Eng. 2019, 175, 33–49. [Google Scholar] [CrossRef]
  23. Thaweewat, N.; Phoemsapthawee, S.; Juntasaro, V. Semi-active flapping foil for marine propulsion. Ocean Eng. 2018, 147, 556–564. [Google Scholar] [CrossRef]
  24. Wu, T.Y. Swimming of a Waving Plate. J. Fluid Mech. 1961, 10, 321–344. [Google Scholar] [CrossRef]
  25. Anderson, J.M.; Streitlien, K.; Barrett, D.S.; Triantafyllou, M.S. Oscillating foils of high propulsive efficiency. J. Fluid Mech. 1998, 360, 41–72. [Google Scholar] [CrossRef] [Green Version]
  26. Floc’H, F.; Phoemsapthawee, S.; Laurens, J.M.; Leroux, J.B. Porpoising foil as a propulsion system. Ocean Eng. 2012, 39, 53–61. [Google Scholar] [CrossRef]
  27. Jian, D.; Teng, L.; Pan, D.; Shao, X. Inertial effects of the semi-passive flapping foil on its energy extraction efficiency. Phys. Fluids 2015, 27, 174–191. [Google Scholar]
  28. Richards, A.J.; Oshkai, P. Effect of the stiffness, inertia and oscillation kinematics on the thrust generation and efficiency of an oscillating-foil propulsion system. J. Fluids Struct. 2015, 57, 357–374. [Google Scholar] [CrossRef]
  29. Zhu, J. The Effect of Damping Coefficient, Spring Coefficient, and Mass Ratio on the Power Extraction Performance of a Semiactive Flapping Wing. Int. J. Aerosp. Eng. 2019, 2019, 1–12. [Google Scholar] [CrossRef]
  30. Kinsey, T.; Dumas, G.; Kinsey, T.; Dumas, G. Parametric Study of an Oscillating Airfoil in a Power-Extraction Regime. Aiaa J. 2008, 46, 1318–1330. [Google Scholar] [CrossRef]
  31. Jian, D.; Caulfield, C.P.; Shao, X. Effect of aspect ratio on the energy extraction efficiency of three-dimensional flapping foils. Phys. Fluids 2014, 26, 043102. [Google Scholar]
Figure 1. The composition and the propulsion mechanism of the wave glider.
Jmse 08 00303 g001
Figure 2. Sketch of semi-active flapping foil under full-prescribed heaving motion and passive pitching motion.
Jmse 08 00303 g002
Figure 3. Computational domain and boundary conditions for flapping foil.
Jmse 08 00303 g003
Figure 4. Evolution of (a) thrust coefficient and (b) lift coefficient for y 0 = 0.4 , θ 0 = 50 ° , and f * = 0.21 as predicted by the different turbulence model.
Jmse 08 00303 g004
Figure 5. Evolution of the thrust coefficient for (a) the mesh independence study and (b) the time-step independence study for y 0 = 0.2 , k * = 0.09 , and f * = 0.17 .
Jmse 08 00303 g005
Figure 6. Comparison of results by Kinsey and Dumas and the present study, in terms of (a) thrust coefficient and (b) lift coefficient.
Jmse 08 00303 g006
Figure 7. The mean output power coefficient contours on the parametric space of reduced frequency and mass ratio.
Jmse 08 00303 g007
Figure 8. Comparison of the propulsion efficiency for varying mass ratio at f * = 0.19–0.34.
Jmse 08 00303 g008
Figure 9. The evolution of (a) the thrust coefficient and (b) the effective angle of attack over one periodic cycle for f * = 0.27 , r = 0.5 / 10 .
Jmse 08 00303 g009
Figure 10. The snapshots of the vorticity contours for f * = 0.27 , r = 0.5 / 10 , (a)   t = 0.10 T , (b)   t = 0.15 T , (c)   t = 0.20 T , (d)   t = 0.35 T , (e)   t = 0.45 T .
Jmse 08 00303 g010
Figure 11. The corresponding pressure contours for f * = 0.27 , r = 0.5 / 10 , (a)   t = 0.10 T , (b)   t = 0.15 T , (c)   t = 0.20 T , (d)   t = 0.35 T , (e)   t = 0.45 T .
Jmse 08 00303 g011
Figure 12. The time variation of (a) the thrust coefficient and (b) the pitching angle over one periodic cycle for f * = 0.25 , r = 0.5 / 3 / 10 .
Jmse 08 00303 g012
Figure 13. The snapshots of the vorticity contours for f * = 0.25 , r = 0.5 / 3 / 10 , (a)   t = 0.10 T , (b)   t = 0.15 T , (c)   t = 0.20 T , (d)   t = 0.40 T , (e)   t = 0.45 T .
Jmse 08 00303 g013
Figure 14. The corresponding pressure contours for f * = 0.25 , r = 0.5 / 3 / 10 , (a)   t = 0.10 T , (b)   t = 0.15 T , (c)   t = 0.20 T , (d)   t = 0.40 T , (e)   t = 0.45 T .
Jmse 08 00303 g014
Figure 15. The time variation of (a) the thrust coefficient and (b) the pitching angle over one periodic cycle for f * = 0.21 , r = 0.5 / 10 .
Jmse 08 00303 g015
Figure 16. The snapshots of the vorticity contours for f * = 0.21 , r = 0.5 / 10 , (a)   t = 0.10 T , (b)   t = 0.15 T , (c)   t = 0.20 T , (d)   t = 0.40 T , (e)   t = 0.45 T .
Jmse 08 00303 g016
Figure 17. The corresponding pressure contours for f * = 0.21 , r = 0.5 / 10 , (a)   t = 0.10 T , (b)   t = 0.15 T , (c)   t = 0.20 T , (d)   t = 0.40 T , (e)   t = 0.45 T .
Jmse 08 00303 g017
Figure 18. The variations of (a) the mean output power coefficient and (b) the propulsion efficiency at r = 0.5 , r = 3 , and r = 10 for y 0 = 2 c , f * = 0.27 .
Jmse 08 00303 g018
Figure 19. The time evolution of the thrust coefficient over one periodic cycle at three different damping coefficients for f * = 0.27 , r = 0.5 .
Jmse 08 00303 g019
Figure 20. The snapshots of the vorticity contours for f * = 0.27 , r = 0.5 , ζ * = 0 / 0.15 , (a)   t = 0.10 T , (b)   t = 0.15 T , (c)   t = 0.20 T , (d)   t = 0.35 T , (e)   t = 0.45 T .
Jmse 08 00303 g020
Figure 21. The corresponding pressure contours for f * = 0.27 , r = 0.5 ζ * = 0 / 0.15 , (a) t = 0.10 T , (b)   t = 0.15 T , (c)   t = 0.20 T , (d)   t = 0.35 T , (e)   t = 0.45 T .
Jmse 08 00303 g021
Table 1. Highlights of typical studies on the semi-active flapping foil.
ReferenceYearInfluence FactorLinks
Nurray and Howle2003Spring stiffnesshttps://doi.org/10.1016/S0889-9746(03)00026-4
Young and Lai2007Strouhal numberhttps://doi.org/10.2514/1.27628
Teng et al2015Mass ratiohttps://doi.org/10.1063/1.4921384
Thaweewat et al2018Reduced frequency, spring stiffnesshttps://doi.org/10.1016/j.oceaneng.2017.11.008
Qi et al.2019Spring stiffness, critical pitching amplitudehttps://doi.org/10.3390/jmse8010013
Table 2. Comparison of the mean thrust coefficient for different three turbulence models.
Turbulence ModelMeshTime-Step C ¯ X Mean Error (%)
Spalart-AllmarasMedium-1 grid5000ts−2.9692−1.8
k ω SST with low-Re correctionsMedium-1 grid5000ts−3.0238---
k ω SSTMedium-1 grid5000ts−2.9987−0.8
Table 3. Mesh and time-step independence results.
MeshTime-Step C ¯ X Mean Error (%)
Mesh IndependenceCoarse grid5000 ts−0.063640.39
Medium-1 grid−0.04560.66
Medium-2 grid−0.04550.44
Fine Grid−0.0453---
Time-step IndependenceMedium-1 grid1000 ts−0.054218.34
2000 ts−0.04855.89
5000 ts−0.04560.43
10000 ts−0.0458---
Table 4. Main characteristics for all computations.
ParametersRange
Chord length, c0.17 m
Hydrofoil shape2D NACA0012
Hydrofoil thickness, d0.02 m
Free stream velocity, U 0.25 m/s
Heaving amplitude, y 0 2c
Normalized spring constant, k * 0.09
Mass ratio, r0.5–10
Reduced frequency, f * 0.19–0.34
Damping coefficient,   ζ * 0–0.22

