Abstract
STORMTOOLS coastal environmental risk index (CERI) was applied to communities located along the southern coast of Rhode Island (RI) to determine the risk to structures located in the flood plain. CERI uses estimates of the base flood elevation (BFE), explicitly including the effects of sea level rise (SLR); details on the structure types, from the E911 emergency data base/parcel data, and associated first floor elevation (FFE); and damage curves from the US Army Corp of Engineers North Atlantic Coast Comprehensive Study (NACCS) to determine the damages to structures for the study area. Surge levels and associated offshore waves used to determine BFEs were obtained from the NACCS hydrodynamic and wave model predictions. The impacts of sea level rise and coastal erosion on flooding were modeled using XBeach and STWAVE and validated by observations at selected locations along the coastline. CERI estimated the structural damage to each structure in the coastal flood plain for 100 yr flooding with SLR ranging from 0 to 10 ft. The number of structures at risk was estimated to increase approximate linearly from 3700 for no SLR to about 8000 for 10 ft SLR, with about equal percentages for each of the four coastal communities (Narragansett, South Kingstown, Charlestown, and Westerly, Rhode Island (RI)). The majority of the structures in the flood plain are single/story residences without (41%) and with (46%) basements (total 87%; structures with basements are the most vulnerable). Less vulnerable are structures elevated on piles with 8.8% of the total. The remaining are commercial structures principally located either in the Port of Galilee and or Watch Hill. The analysis showed that about 20% of the structures in the 100 yr flood plain are estimated to be damaged at 50% or greater. This increases to 55% of structures as SLR rises to 5 ft. At higher SLR values the percent damaged at 50% or greater slowly declines to 45% at 10 ft SLR. This behavior is a result of the number of homes below MSL increasing dramatically as SLR values moves higher than 5 ft and thus being removed from the structures damaged pool. Generalized CERI risk maps have developed to allow the managers to determine the broad risk of siting structures at any location in their communities. CERI has recently become available as a mobile phone App, facilitating the ability of state and local decision makers and the public to determine the risk of locating a selected building type at any location in their communities.
1. Introduction
STORMTOOLS coastal environmental risk index (CERI) is a method to assess the risk and damage to structures and infrastructure resulting from storm surges, including the effects of sea level rise. It has been under development since 2016, with initial applications to Warwick and Charlestown, Rhode Island (RI), USA; the first representing application to a protected area in Narragansett Bay, where surge amplification dominates flooding and the later to a coastal community along the Southern RI shoreline where waves and erosion are critically important in estimating flooding risk and damage. An overview of the method and its applications to these two communities have been documented in Spaulding et al. (2016, 2017a and b) [1,2,3], Grilli et al. (2017) [4], and Schambach et al. (2018) [5]. Application of the method to Barrington, Bristol, and Warren located in Narragansett Bay has recently been completed (Grilli et al, 2019) [6]. These towns were selected for application given the very low-lying topography of the area, the density of residences, and its exposure to storm flooding. The method has also been applied to the eastern end of Matunuck Beach (2015–2016) [7,8], Misquamicut Beach (2016–2017) [9], and downtown Providence (2017–2018) [10] in recent senior design studies in Ocean Engineering, University of RI. In the most recent effort, the method has been extended and applied to assess the risk to wastewater treatment facilities (WWTF) and selected above ground storage tanks (AST) in upper Narragansett Bay (2018–2019) [11].
The ability to apply CERI to coastal areas in the state has recently been extended to include an app available on both Apple and Android platforms [12]. The app allows the user to select the location of the site of interest, specify the structure type and characters (first floor elevation—FFE) and the 100 yr flooding event including the projected value for sea level rise (SLR). The app provides estimates of the damage to the structure with supporting information on the base flood elevation (BFE), grade elevation, and the Federal Emergency Management Agency (FEMA) flood insurance rate map (FIRM) BFE and flooding zone designation. The app has proven to be very useful to those interested in building or renovating structures in the coastal zone to inform them of the risk for the location selected. It is also routinely used in support of the community and state permitting process for structures located in the flood zone.
This paper summarizes the application of CERI to the coastal communities along the Southern RI shoreline from Little Narragansett Bay, Westerly, RI to the Narrow River, Narragansett, RI. Section 2 outlines the methodology used to generate the maps. Section 3 provides the results of the analyses. Summary and conclusions are given in Section 4. Information on CERI and its application can be accessed via the STORMTOOLS CERI web site (http://www.beachsamp.org/stormtools/stormtools-coastal-environmental-risk-index-ceri/, accessed on 13 February 2020). The papers, referenced above, describing CERI and its applications to date can also be found there.
2. STORMTOOLS Coastal Environmental Risk Index (CERI)
An in-depth description of CERI is provided in Spaulding et al. (2016) [1], while the presentation here focused on providing an overview of the system and its basic building blocks. The goal of the STORMTOOLS CERI is to develop a methodology to assess the risks that structures and infrastructure face from storm surges, the combination of flooding and the associated wave environment, in the presence of sea level rise (SLR) and shoreline erosion/accretion. Figure 1 shows the framework for the STORMTOOLS CERI and its basic building blocks.
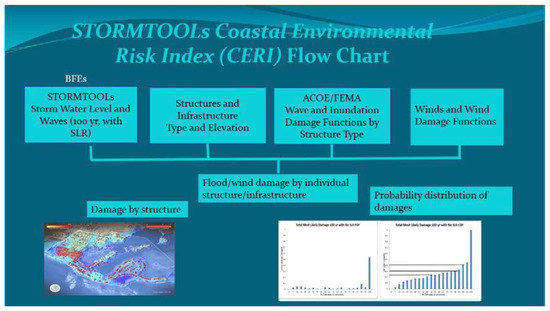
Figure 1.
Flow chart for STORMTOOLS coastal environmental risk index (CERI). Reproduced from [1], with permission from MDPI, 2020.
Each of the building blocks is described in more detail below.
2.1. Surge and Waves (BFE)
The flooding environment in CERI was characterized by the 100 yr (1% annual chance of occurrence) flooding event that was adjusted for the sea level rise (SLR) value projected for the proposed design life of the structure of interest. The design life is specified in terms of the base flood elevation (BFE; combination of inundation depth and the associated controlling wave height) for the corresponding SLR value that was projected over the design life. BFEs were used to characterize the flooding risk to be consistent with the Federal Emergency Management Agency (FEMA) methods used in the flood insurance rate maps (FIRMS) and those embedded in the ASCE 7-16 Minimum Design Standards (ASCE, 2017) [13], which have been adopted by the state of RI and the coastal communities where CERI is being applied in this study. Figure 2 provides a sketch from FEMA that shows the BFE in relationship to the still water elevation level (SWEL) (inundation level) and the underlying vertical reference to NAVD88. The RI Coastal Resources Management Council (RI CRMC) has formally adopted through its regulations the NOAA 2017 high curve (83% percentile) to estimate sea level rise for purposes of coastal planning and the review of proposed projects within its jurisdiction. The current NOAA projection was for SLR to be 3 ft by 2050, 5 ft by 2070, and 9 ft by 2100.
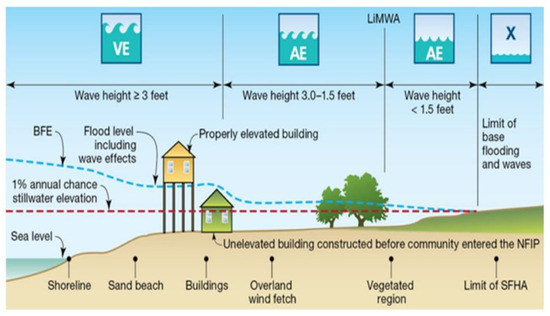
Figure 2.
Federal Emergency Management Agency (FEMA) schematic of flood zones with associated water levels and wave conditions. The location of base flood elevation (BFE) and still water elevation level (SWEL) are clearly shown by the dashed blue and red lines, respectively. BFE and SWEL are referenced to NAVD88. Zone definitions are provided at the top of the figure (VE, AE, limit of moderate wave action (LIMWA), and X). http://www.r3coastal.com/home/coastal-hazard-analysis-mapping/coastal-flood-hazard-mapping, accessed on 11 February 2020. (Definition of the flood zones are provided at https://www.fema.gov/flood-zones, accessed on 16 April 2020.)
Under the STORMTOOLS design elevation (SDE) maps initiative, maps of 100 yr flooding for sea level rise values of 0, 2, 3, 5, 7, and 10 feet have been prepared for the coastal areas of the state [13]. The maps were generated for Narragansett Bay and adjacent coastal waters and separately for the Southern RI coastal line. The former reflected an area where wave heights and coastal erosion were limited, but surge amplification was critically important, while the latter area was dominated by high amplitude waves and coastal erosion was critically important. In generating the SDE maps for the Southern RI shoreline XBeach was applied to the study area (in five separate overlapping grids to maintain very high resolution) to predict the evolution of the geomorphology for the storm event of interest (100 yr plus selected SLR value). The resolution of the model was sufficiently high to allow predictions of dune evolution, overtopping, and the generation of surge channels. The application of XBeach to Charlestown is provided in Grilli et al. [4] and Schambach et al. [5]. They show validation of application of the model to hurricane Irene, 2011 based on pre and post storm transect analyses, sensitivity of the model application to initial shoreline configurations and to the presence and absence of vegetation on the dune. They also show comparison of the model predictions for sediment volumes removed compared to an empirical based analysis estimate used in the FEMA Flood Insurance Study for Washington County.
Given the focus of the present study, Figure 3 shows the maps for the Southern RI shoreline for the cases of 0, 5, and 10 feet of SLR, reflecting the nominal values for today, 2070 and 2100, respectively. Details on the development of the SDE maps, including the modeling of the shoreline erosion for areas with significant wave heights is provided in Spaulding et al. (2019) [14]. The GIS-based online maps allow the user to determine the inundation and the associated controlling wave height (average wave height of 1% of the highest waves, assuming that waves are Rayleigh distributed) that comprise of the BFE at the area of interest. In addition, the user can also access FEMA FIRM BFE maps from the CERI application. The online map legend for the flood elevation values have been kept the same for all maps to facilitate inter-comparisons.
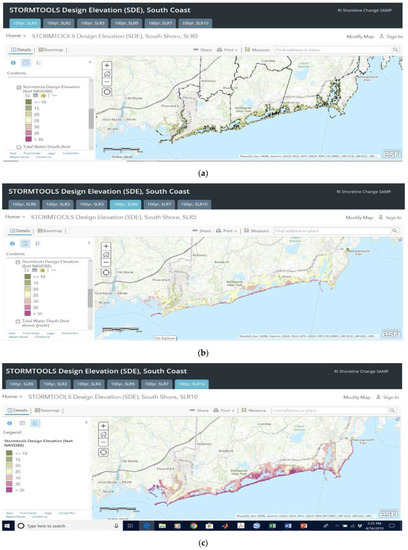
Figure 3.
STORMTOOLS design elevation maps (BFE) for sea level rise (SLR) values of (a) 0 ft (upper panel), (b) 5 ft (middle panel) and (c) 10 ft (lower panel). Blue colored tabs at the top of each figure show the SLR value selected. The BFE values are provided in feet relative to NAVD88. The legend for each figure is shown at the left and is the same for all figures to facilitate inter-comparison. The SDE maps and supporting training material to facilitate their use are provided at http://www.beachsamp.org/stormtools-design-elevation-sde-maps/, accessed on 13 February 2020) The maps for Southern RI are available at: https://crc-uri.maps.arcgis.com/apps/MapSeries/index.html?appid=3ba5c4d9c0744392bec2f4afb6ee2286, accessed on 13 February 2020.
2.2. Structure and Infrastructure Type and Elevation
The structures in the study area have been characterized in terms of seven prototype categories as outlined in the Army Corp of Engineers (ACOE) North Atlantic Coast Comprehensive Study (NACCS) [15]. This classification system has been selected to be consistent with the damage functions used in CERI to estimate structure and content damage [16]. Figure 4, left side, shows all prototypes, while the right side of the figure shows the prototypes that dominate the Southern RI shoreline communities (Prototypes 5, 6, and 7). Types 5 and 6 are residences without and with basements, respectively. A and B refer to single and two story residences, respectively. For Prototype 7 the structure is elevated on piles; A—open piles and B—enclosed piles. Photos of houses that typify each category, taken from RI shoreline communities, are shown in the figure (right side). In addition to characterization of the structures by prototype class, the elevation of the first-floor elevation (FFE) must be provided. FFEs are typically 2 to 3 feet for structure types 5 and 6, and 9 feet for those that are pile supported (Type 7). FFEs are typically measured relative to local grade at the entrance to the residence. For reference, stairs typically have a rise of 7.5 in (0.625 ft) per step (e.g., 3 steps is therefore about 2 ft).
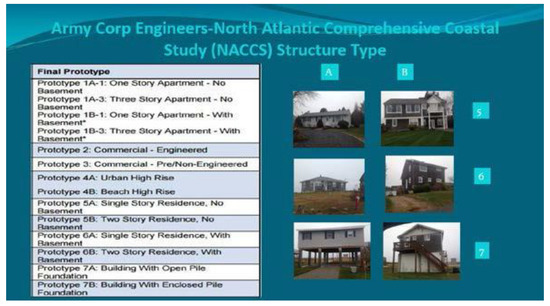
Figure 4.
Army Corp of Engineers (ACOE) North Atlantic Coast Comprehensive Study (NACCS) structure types (left side). Photographs of structure prototypes 5, 6, and 7, categories A and B are also shown (right side). 5 and 6 are residences, without and with basements; while A and B refer to single and two story buildings, respectively. Prototype 7 have pile foundations, A—open piles and B—enclosed pile. Reproduced from [1], with permission from MDPI, 2020.
The development of the structure database by ACOE NACCS prototype relied on four primary data sources (Table 1). Though each of the four towns organize and format their data differently the same general workflow was applied consistently for the study area.

Table 1.
CERI input data and source.
A data request was submitted to each town’s Planning Officer and the required information was delivered in both GIS (parcel) and Excel (building attributes) formats. Using a common ID field, the parcel and building datasets were merged.
The statewide E-911 points were separated by town and filtered to remove all structures outside of the inundation area to reduce file sizes. All structures at local elevations of 30 feet or lower were retained in the database. An additional check was performed to remove duplicate points on a structure, common for residential duplexes, condominiums, and strip malls. Remaining points were tagged with a ground elevation value and the structure locations were spatially joined with the parcel/building information, resulting in a single point file for each town with all required attributes: XYZ location; E-911 use category; number of stories; basement area; and whether the structure was elevated on piles.
Table 2 shows the data groupings and queries used to assign the proper NACCS building prototype to each point.
Table 2.
NACCS building types as applied to the CERI structure database. A listing of E-911 use categories can be found here: https://www.edc.uri.edu/projects/stormtools/E911_buildingtype.docx, accessed on 13 February 2020.
During the coding process, field checks were used to confirm the presence of elevated structures and to answer any building-specific questions that could not be answered from the available data. The database was modified as needed to reflect these surveys. The final output for CERI damage modeling was a comma delimited text file with the following format:
- NAME—town name;
- LAT—latitude;
- LON—longitude;
- ELEV—grade elevation, feet NAVD88;
- FFE—first floor elevation (grade plus 2 feet in most cases; grade plus 9 feet for 7A/B);
- NUMSTOR—number of stories;
- BCLASS—NACCS building prototype.
The data was provided to each town for their review. Once this validation step was completed the structure data were assumed to be verified.
To give a sense of the structures at potential risk, the data base was used to estimate the total number of structures in each town that were located at elevations less than 30 feet NAVD88. This elevation was selected since it captures the envelope of area flooded for all SLR cases investigated. The data is summarized in Table 3. Each town was seen to have approximately one quarter of the total with South Kingstown, Narragansett, and Westerly having comparable numbers and all slightly greater than Charlestown.
Table 3.
Number of structures and percent of total that are located below 30 feet NAVD 88 for each town in the study area.
A review of the data for Southern RI communities potentially at risk from flooding with 10 feet of sea level rise was dominated by single/two story residences with and without basements (Prototype 5; 42% and Prototype 6; 47%; total—89%). Elevated structures (7A and B) accounted for only 5.6% of the total. Commercial structures were quite limited and accounted for only a few percent of the total and were dominated by Westerly (Watch Hill area) and Narragansett (Port of Galilee).
2.3. Wave and Inundation Damage Functions
Damage (structure) functions from both waves and inundation are estimated using data from the NACCS study as summarized by Simm et al. [16] for each structure type noted in Table 2. As examples, Figure 5 shows the damage functions for single story residence with no basement (NACCS Prototype 5A) (upper panel) and a residence on an open pile foundation (7A; lower panel). These two cases were selected for presentation here given the fact that the former is the most dominant residence along the Southern RI coast-line, while the latter was the most typical for residences that were designed to reduce flooding damage. Minimum, most likely, and maximum structural damages are shown for both inundation and waves. Damages occurred if the water/wave levels exceeded the FFE of the structure. FFEs were typically a few feet for prototypes 5 and 6 and 9 feet for 7A/B. Following the NACCS protocol, CERI estimated the damage from inundation and waves and used the value that results in the greatest damage. CERI provides a map of all structures in the study area in danger of flooding and characterizes their ACOE type classification and FFE. It is noted whether large waves (greater than 3 feet) are present, as they dominate the damage no matter the structure type. Given the large waves for the 100 yr return period (for all SLR cases) along the Southern RI shoreline, wave damage dominated for structures located immediately along the coastline, while inundation damage became more prevalent as one moves landward, where waves were dissipated by friction and breaking. This transition is graphically illustrated in Figure 2 by the transition from FEMA VE to AE zones.
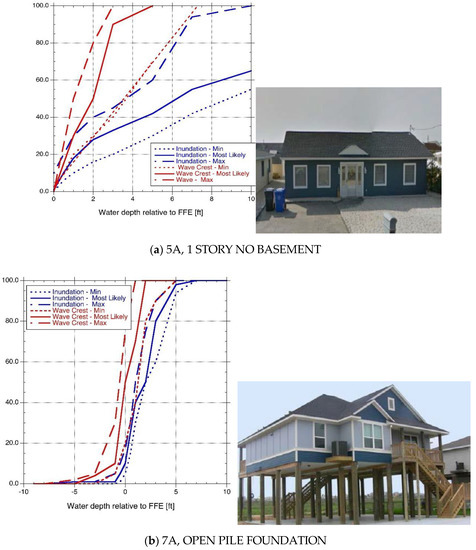
Figure 5.
Damage (structural) functions (% damage vs water elevation (ft) above FFE) for inundation (blue) and waves (red) for (a) 5A (single story with no basement) and (b) 7A (open pile foundation) residential structures are shown. A photograph of each structure type is provided. Damage functions for minimum, most likely, and maximum values are provided.
3. Results
CERI was applied to the entire Southern RI shoreline using the building blocks outlined above. Figure 6 shows the results for 100 yr no SLR for most likely damage. The percent damage for each structure is provided. If the structure is below the mean sea level (MSL) because of SLR it is noted in blue. Since this was not the SLR case no structures were labeled for this category. The legend (to the left) gives the damage range from green (no damage) to red (greater than 75% damage). The figure clearly shows the spatial distribution of structures in the study area, with most located on the various coastal headlands and interior shoreline of the coastal ponds. Note that at the resolution shown in the figure a single dot could represent more than one structure. If one zooms in then all individual structures are shown. In general, the further the structure is from the ocean the lower the damage.
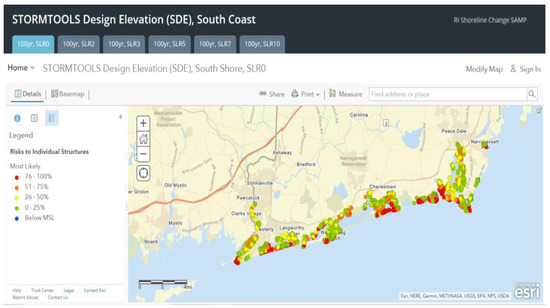
Figure 6.
CERI predicted damage for the 100 yr surge, no SLR case for the most likely damage estimates. (CERI results are available for all SLR cases at: https://crc-uri.maps.arcgis.com/apps/MapSeries/index.html?appid=2a4ab310fecc4721935287e5a5f7ace4) accessed on 13 February 2020).
Figure 7 shows example results for 100 yr surge with no, 5, and 10 feet SLR cases for all Southern RI shoreline communities. These three cases are intended to show the impact of SLR on the results. Maps for the additional SLR cases are available at the previous web link. The legends are shown on the left and are the same for all SLR cases to facilitate inter-comparison. The dots represent the structure’s damage and are color coded by percent damage. If the location of the structure is below MSL for the SLR case selected, it is colored in blue.
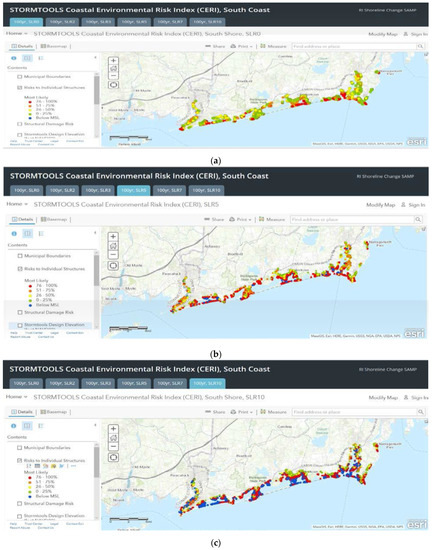
Figure 7.
CERI predicted for 100 yr surge and varying SLR cases, (a) none (upper panel), (b) 5 ft (center panel), and (c) 10 ft (lower panel) for Southern Rhode Island (RI) shoreline. Legend shown on left. (CERI results are available for all SLR cases at: https://crc-uri.maps.arcgis.com/apps/MapSeries/index.html?appid=2a4ab310fecc4721935287e5a5f7ace4) accessed on 13 February 2020).
Comparing the three panels shows that the damage increased with SLR as do the number of structures that were projected to be below MSLTo give a better sense of the spatial resolution of CERI, Figure 8 shows a zoomed in version of a portion of the maps provided in Figure 7, in the vicinity of the Port of Galilee. The locations of the individual structures become apparent with this higher resolution view. The progressive increase in damage with increasing SLR is clearly shown, as are the increase in the number of structures below MSL.
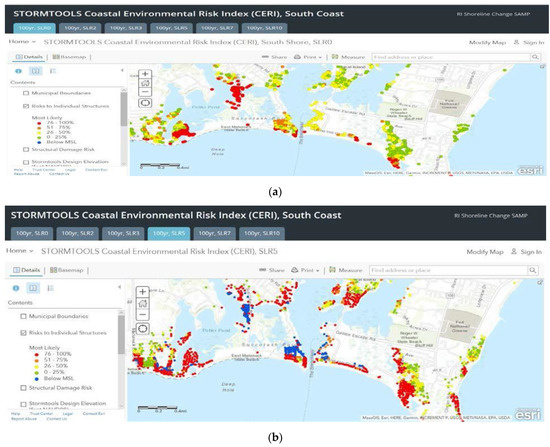
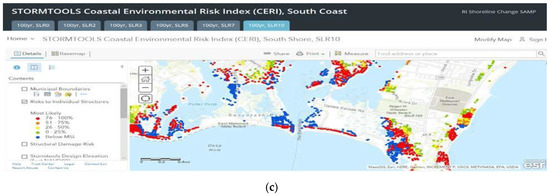
Figure 8.
CERI predicted for 100 yr surge and varying SLR cases, (a) none (upper panel), (b) 5 ft (center panel), and (c) 10 ft (lower panel) for the area in the immediate vicinity of the Port of Galilee. Legend shown on left.
Table 4 shows the number of buildings impacted by 100 yr storm for SLR values of 0–10 ft. Values are given for each town and summarized for all towns in the study area. This includes all structures that were predicted to be damaged. As noted earlier, the structures at most risk in the study area are single and two story homes, with and without basements (5 and 6 A and B).
Table 4.
Number of structures, by prototype class, impacted by the 100 yr storm surge with SLR values from 0 to 10 ft for the Towns of Charlestown, Narragansett, South Kingstown, and Westerly, RI.
Narragansett and Westerly had the highest potential impact to commercial structures (Prototypes # 2 and 3). Prototype # 1 are apartment buildings, of which there were very few in the study area. There were no high-rise buildings (Prototype # 4) since they are prohibited near the shore in these coastal communities. The impact of SLR was clearly to increase the number of structures at risk. The total number increased by about 30% with 2 ft of SLR from the no SLR case, increased to 65% with 5 ft of SLR, and to 115% for 10 ft of SLR.
To help put the results in context, Figure 9 shows the fraction of houses at risk of flooding with increasing SLR for the four coastal communities in the study area. The results for the application of CERI to the Towns of Barrington, Bristol, and Warren (BWB), located in Narragansett Bay, are also shown for reference (Grilli et al., 2019) [6]. Application of CERI to BWB has recently (2019) been completed and represents the location with the most structures at risk of coastal flooding in the state. The values given in the figure were a fraction of the total structures in the potential flood zone and provided in Table 4. As an example, for Charlestown 65% of the structures in the flood risk area were at potential risk for the 5 ft SLR case. This corresponded to 1342 structures (2056 times 0.65). The figure shows that the risk increased approximately linearly with SLR. The risk was highest for Charlestown, lowest for Narragansett, and intermediate for South Kingstown, and Westerly. The risk for the latter two towns was comparable to that for BWB.
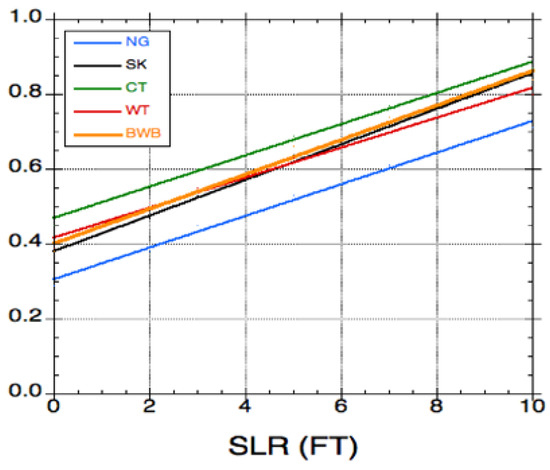
Figure 9.
Fraction of houses (%) under 30 ft NAVD88 potentially in harm way (predicted damage larger than 0 %), assuming the most likely scenario for any SLR case between 0 and 10 ft, for Narragansett (NG), South Kingstown (SK), Charlestown (CT), Westerly (WT), and Barrington, Warren, and Bristol (BWB).
The fraction of structures with damage greater than 50% versus sea level rise is provided in Figure 10. Figure 11 shows the predictions of the number of structures below the MSL vs. SLR value. Once again, the actual number can be obtained by multiplying the value from these figures by the number of structures provided in Table 4. Results were provided for the four communities plus BWB. CERI predicted that the number of structures damaged increased for most communities with SLR until a SLR of 5 feet (Figure 10). For SLR values greater than this, the fraction impacted (50% damage) peaks and then declined with further increases in SLR. This behavior was a result of the loss of structures being below MSL elevation (Figure 11).
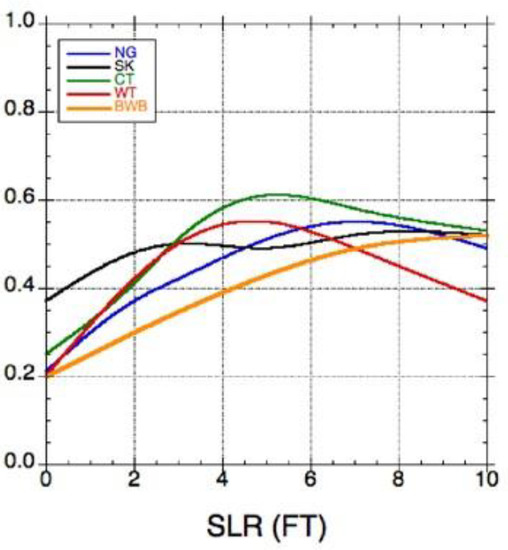
Figure 10.
Fraction of houses in harm’s way (damages >0; Figure 9) with damage greater than 50%, assuming the most likely scenario for any SLR case between 0 and 10 ft, for the towns of Narragansett (NG), South Kingstown (SK), Charlestown (CT), Westerly (WT), and Barrington, Warren, and Bristol (BWB).
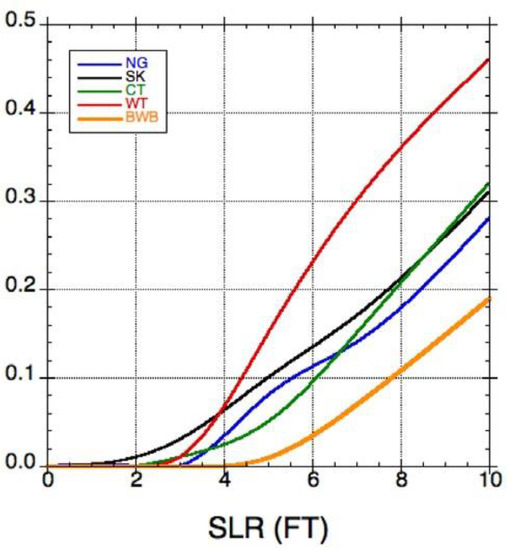
Figure 11.
Fraction of houses experiencing some damage (Figure 9) predicted to be under the mean sea level (MSL) assuming the most likely scenario for any SLR case between 0 and 10 ft for towns of Narragansett (NG), South Kingstown (SK), Charlestown (CT), Westerly (WT), and Barrington, Warren, and Bristol (BWB).
To help communities assess what the risks are of constructing structures at various locations (not just the locations of current structures) a methodology to generate risk maps has been developed and implemented in the CERI framework. These maps assess the risk for building a structure at any location in the flood zone. They are based on assuming that the most common structure in the study area (single or two story residence with a basement, 5A) is located at each grid of the computational domain. The maximum damage function was selected to make sure the maps are conservative in their representation of the risk. CERI risk maps for the study area are shown in Figure 12 for 100 yr, 0, 5, and 10 ft SLR cases, upper, mid, and lower panels, respectively. These are shown to be consistent with the results presented in Figure 7. The risk maps show values ranging from moderate to extreme and locations where structures would be below MSL. Comparing the maps shows the risk level increased with SLR. The below MSL category grows substantially with increasing SLR particularly for the 10 ft value.
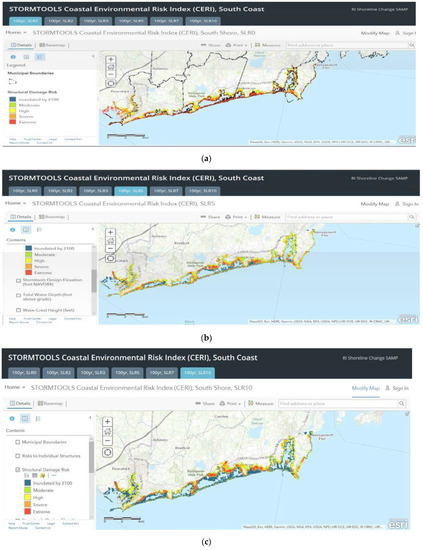
Figure 12.
CERI predicted risk maps for 100 yr surge and varying SLR cases, (a) none (upper panel), (b) 5 ft (center panel), and (c) 10 ft (lower panel) for the Southern RI shoreline.
Figure 13 shows the CERI damage map by structure overlaid on the risk map generated by the methodology outlined above. The figure clearly shows the consistency between the two maps and that the risk map is in general more conservative than the actual damage map.
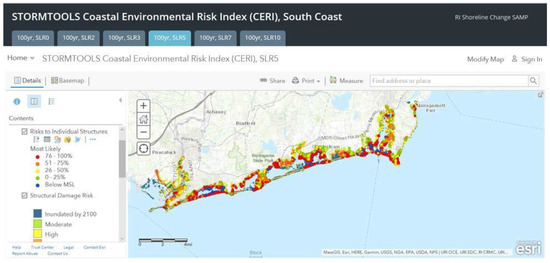
Figure 13.
CERI predicted damage and risk maps for 100 yr surge with 5 ft of SLR.
Figure 14 shows the ability to obtain high resolution risk maps from CERI for a user selected area. In this case, the figure shows risk for the Misquamicut Beach–Westerly area for 0, 5, and 10 ft of SLR. The growth in the extreme area and the area that would be inundated by 2100 clearly increased with SLR.
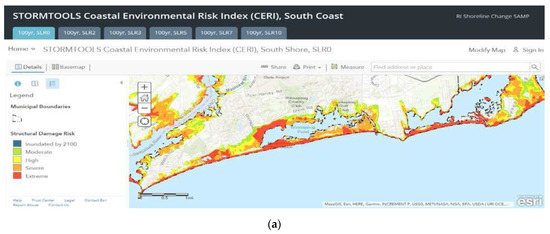
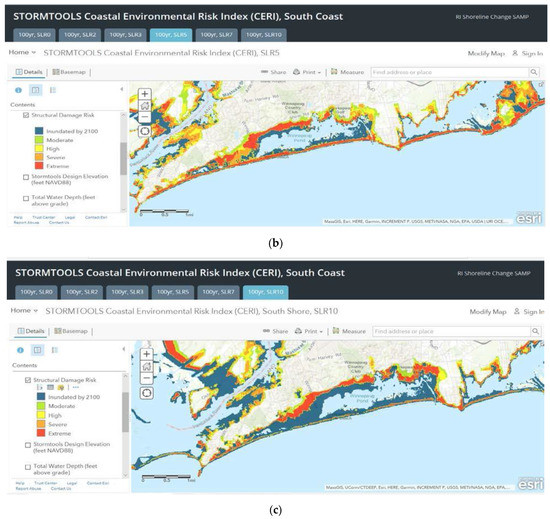
Figure 14.
CERI predicted risk maps for 100 yr surge and varying SLR cases, none (a), 5 ft (b), and 10 ft (c) for the Southern RI shoreline, high resolution map of Misquamicut Beach and Westerly area.
In accessing SDE maps and CERI results from their respective web sites, it is important to note that the user has access to more detailed supporting information. These additional data sets are noted in the summary below and selected examples provided.
Municipal boundaries.
SDE maps expressed in the form of BFE relative to NAVD88, for SLR values varying from 0 to 10 ft.
SDE/BFE maps relative to grade elevation. Inundation and wave components of SDE/BFEs. FEMA FIRM BFEs relative to NAVD88.
FEMA Hazard Areas FEMA Transects.
CERI Structural damage risk.
CERI Risk to individual structures.
To highlight some of the additional data that is available, via the interrogation tool, Figure 15 shows the damage to a structure located on the shoreline in Port of Galilee for 100 yr flood with 3 ft SLR (upper panel, light blue tab). Minimum, most likely, and maximum damages were provided. The E911 code, NACCS prototype number, and FFE were provided for the structure selected. The lower panel shows the risk map for the same area, ranking it as severe. As noted earlier, the risk map used the maximum damage, which was consistent with the damage for the structure selected in the upper panel.
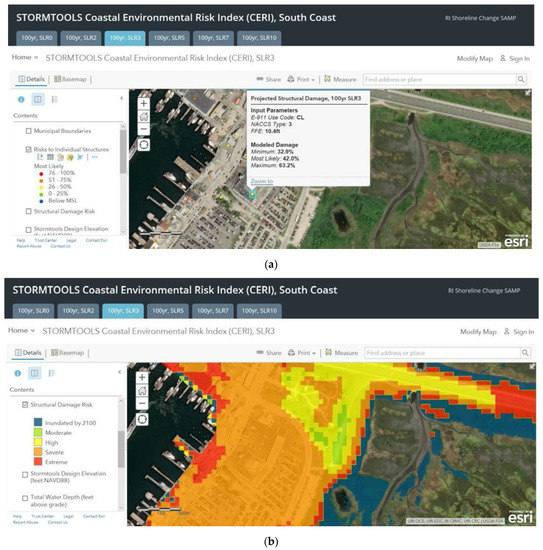
Figure 15.
CERI prediction of damage (minimum, most likely, and maximum) at a selected location in the Port of Galilee (a) upper panel for 100 yr, 3 ft SLR case. A description of the structure is provided followed by minimum, most likely, and maximum damage. A risk map for the same SLR case and the same area is shown in the (b) lower panel.
As another example, Figure 16 shows a comparison of BFE from the SDE and FEMA FIRM maps for a selected location on Misquamicut Beach for the 100 yr, no SLR case. The SDE maps predicted a higher BFE compared to the FEMA FIRMS at this location. The spatial variations of the BFE at this location was much greater for the SDE maps compared to their FEMA FIRM counterpart. This reflected the high-resolution wave modeling used in the SDE maps compared to the simplified 1-D transect methodology, WHAFIS, used in the FEMA FIRMs [2].
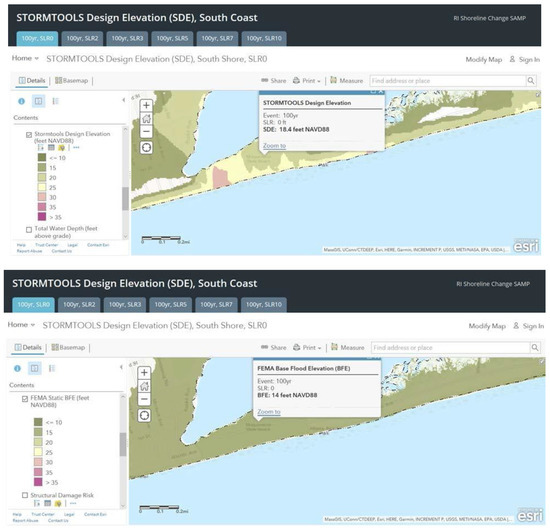
Figure 16.
SDE and FEMA estimates of BFE for a selected location on Misquamicut Beach for 100 year storm, no SLR.
4. Conclusions
CERI was applied to the Southern RI shoreline extending from little Narragansett Bay in Westerly to the mouth of Narrow River in Narragansett (including the towns of Westerly, Charlestown, South Kingstown, and Narragansett). The application used STORMTOOLS SDE maps to specify the BFE for 100 yr flooding, with SLR values varying from 0 to 10 ft [13]. The SDE approach used advanced, high resolution models and the most recent results from the ACOE NACCS study. It also used a validated model (XBeach) to estimate coastal erosion and changes in beach/dune morphology along the Southern RI shoreline. This is a significant advancement over the empirically based method used in earlier version of CERI [1].
The structures in the flood area were characterized using a merger of E911 and parcel data sets provided by the town and verified by selected site visits. The first finished floor elevations were generated based on the E911 and parcel data. Each structure has been assigned a classification according to the ACOE NACCS prototype protocol. Structures were classified as commercial buildings and residences (single and two stories, with and without basements, elevated pile (open or closed) supported structures. Damages were calculated for each structure at risk of flooding using the ACOE NACCS damage functions for the prototype selected. Damages were calculated for inundation and wave damage (minimum, most likely, and maximum). The estimate that generated the largest damage (inundation or wave) was selected based on the NACCS damage assessment protocol. In addition, flooding risk maps were generated for the study area for each SLR case. In this approach risk is estimated at each grid in the study area (not just at the locations of actual structures). These maps were proven to be helpful to assist municipalities in communicating risk to their constituents.
The results of this effort were provided in the form of BFEs (STORMTOOLS Design Elevation, SDE) maps and risk to individual structures and generalized risk maps from CERI. All results are available via ArcView GIS and can be readily accessed by municipal staff and the public.
The analysis shows that the dominate type of structure at risk were residences (single or two story, with or without a basement) under the no SLR case. The without basement class accounted for 46% of the structures, while the more vulnerable, with basement class, accounted for 40% for a total of 86%. Structures elevated on piles (open or closed) accounted for about 9%. The remaining were commercial buildings. The distribution of structures at risk (100 yr, no SLR) was roughly equivalent across towns (with the range varying from 800 to 1000) with a total for all four towns of 3710. The highest number at risk was in Charlestown and the lowest number was in Narragansett. Westerly and Narragansett had significantly more commercial structures at risk than the other towns but still a small number compared to the number of residential structures.
The number of structures at risk was shown to scale approximately linearly with SLR. SLR for 2 ft resulted in an increase of 30% of structures at risk. For 3 ft this increased by 42%, for 5 ft by 65%, and at 10 ft by 114%. The predictions show that the number of structures that were more than 50% damaged increased with SLR reaching a maximum value when SLR was at 5 ft. The number of structures below MSL was quite limited until SLR reached 5 ft and then increased rapidly for all towns.
Ideally the application of CERI to the study area should have been validated by comparing model predictions to observations for an actual storm event. This was not possible in the present study since the most recent, significant tropical/extratropical storm to impact the study area was in 1954 (hurricane Carol; an approximate 100 yr event) and detailed structure by structure damage was not available for this storm. The most recent storm to impact the Southern RI coastline was tropical storm Sandy, 2012. This was approximately a 25 yr event for the study area. Rhode Island (RI) was on the outer edge of this very large storm event, which made land fall in New York city. The CERI model results were generally consistent with experience from other storms that had impacted the area showing damage decreasing with distance inland from the coast. Damage along the coast was dominated by wave effects, which rapidly decreased with distance inland. Inland damage was dominated by inundation with waves playing a secondary role. The inundation damage generally decreased with distance inland as the depth of inundation decreased. When the storm event eroded the coastal dunes along the barriers, over topping and surge channels develop. These breaches allowed larger waves to penetrate further inland from the coast.
The results of the application of CERI to Southern RI coastal communities was presented in a series of outreach activities including presentations to key decision-makers: community administrators and planning, building, and permitting staff. Additional presentations were provided for the general public. The results were also integrated into the RI Coastal Resources Management Council, Coastal Hazard Application (CHA) on line permitting system (http://www.crmc.ri.gov/coastalhazardapp.html, accessed on 14 April 2020). All applicants are required to use the system to determine the risk profile for the specific site and the general area of interest. The latter is focused on understanding the risk to access roads to the property and to help the applicant better understand what the impact of flooding is on the immediate neighborhood. In signing their application, the property owner certifies that they have been informed about the risks. This information has proven very useful in helping individuals understand the risk for the development of interest. The CERI app, mentioned earlier, can also be used to access information on the risk at each site. One of the substantial benefits of the CERI app is that the user is allowed to modify the structure type and attributes (FFE) and see how the risk changes. Builders have successfully used the app to help those proposing to build structures in the flood zone to clearly understand the implications of structure design on flooding risk.
CERI can readily be extended and applied to new study areas given the following input; 1. estimates of the BFE for selected SLR values of concern; 2. information on grade elevation, ideally benchmarked to NAVD88 or similar; 3. estimates of SLR, including the effects of local subsidence; 4. locations and descriptions of each structure, including structure type (using US ACOE prototypes) and the elevation of the first floor elevation (FFE), relative to either grade elevation or NAVD88; and 5. wave and inundation damage functions. One can use the US ACOE damage functions or alternate ones based on data from actual events or those based on detailed analyses of the structures of interest.
BFEs, for varying SLR values, can be generated using coupled hydrodynamic and wave modeling approaches using high resolution grid systems for the flood area. Ideally the modeling approach should explicitly include the impact on the geomorphology of the shoreline and dune system from the event of interest. The impact of SLR on storm surge and waves is often performed using a linear superposition approach; simply adding SLR to the inundation levels. This approach, if selected, needs to be validated by comparison to the fully non-linear case where SLR adjusts the bathymetry used as input to the hydrodynamic model.
Information on structure types and locations are typically available in the US from tax assessor’s databases or E911 emergency data base. The former are typically organized by community or county and the later by state. Both data bases include photos and some underlying classification of the structures. Verification of the structures is recommended to be certain the data base accurately characterizes the structures of interest. Once CERI is set up and operational, it is recommended that it be validated against observations if possible. This is often not possible, as damage data from storm events is not typically readily available.
Author Contributions
M.L.S.: conceptualization and methodology; A.G.: software, validation, formal analysis; C.D.: data curation and visualization; T.C.: resources; M.L.S.: writing original draft; All: writing—review and editing; G.F.: project administration, funding acquisition. All authors have read and agreed to the published version of the manuscript.
Funding
This project was supported with funding from the NOAA, Office of Coastal Management (OCM), Project of Special Merit (PSM) Program to the RI Coastal Resources Management Council (CRMC), South Kingstown, RI under NOAA Award NA17NOS4190172. The work was performed by the University of RI (URI) via a cooperative agreement with the RI CRMC. Noah Hallisey, a Master of Environmental Science and Management (MESM) candidate at the University of RI, Kingston, RI field verified selected structure prototypes and the associated estimates of the FFEs.
Conflicts of Interest
The authors declare no conflict of interest. The funders had no role in the design of the study; in the collection, analyses, or interpretation of data; in the writing of the manuscript, or in the decision to publish the results.
Acronyms
| ASCE | American Society of Civil Engineers |
| ACOE | Army Corp of Engineers |
| BCLASS | NACCS Building Prototype |
| BFE | Base Flood Elevation |
| CERI | Coastal Environmental Risk Index |
| CI | Confidence Interval |
| CRMC | RI Coastal Resources Management Council |
| DEM | Digital Elevation Model |
| ELEV | Grade Elevation, feet NAVD88 |
| FEMA | Federal Emergency Management Agency |
| FFE | First Floor Elevation (grade plus 2 feet in most cases; grade plus 9 feet for 7A/B) |
| FIRM | Flood Insurance Rate Maps |
| FIS | Flood Insurance Study |
| LAT/LON | Latitude/Longitude |
| LIDAR | Laser Imaging, Detection, and Ranging |
| LIMWA | limit of moderate wave action |
| MESM | Master of Environmental Science and Management |
| MSL | Mean Sea Level |
| NACCS | USACE, North Atlantic Comprehensive Coastal Study |
| NAME | Town Name |
| NAVD88 | North Atlantic Vertical Datum, 1988. |
| NOAA NOS | National Ocean and Atmospheric Administration–National Ocean Survey |
| NUMSTOR | Number of stories |
| OCM | Office of Coastal Management |
| PSM | Projects of Special Merit |
| RI GIS | Rhode Island–Geographic Information System |
| SFHA | Special Flood Hazard Area |
| SDE | STORMTOOLS Design Elevation maps |
| SLR | Sea Level Rise |
| STWAVE | Steady state spectral WAVE model |
| SWEL | Still water elevation level |
| STORMTOOLS | tools in support of storm analysis |
| URI | University of Rhode Island |
| WHAFIS | wave hazard assessment model |
| XBeach | nearshore wave and geomorphological model |
References
- Spaulding, M.L.; Grilli, A.; Damon, C.; Crean, T.; Fugate, G.; Oakley, B.A.; Stempel, P. STORMTOOLS: Coastal Environmental Risk Index (CERI). J. Mar. Sci. Eng. 2016, 4, 54. [Google Scholar] [CrossRef]
- Spaulding, M.; Grilli, A.; Damon, C.; Fugate, G.; Oakley, B.A.; Isaji, T.; Schambach, L. Application of state of art modeling techniques to predict flooding and waves for an exposed coastal area. J. Mar. Sci. Eng. 2017, 5, 10. [Google Scholar] [CrossRef]
- Spaulding, M.; Grilli, A.; Damon, C.; Fugate, G.; Isaji, T.; Schambach, L. Application of state of art modeling techniques to predict flooding and waves for coastal area with a protected bay. J. Mar. Sci. Eng. 2017, 5, 14. [Google Scholar] [CrossRef]
- Grilli, A.; Spaulding, M.L.; Oakley, B.A.; Damon, C. Mapping the coastal risk for the next century, including sea level rise and changes in the coastline: Application to Charlestown RI, USA. Nat. Hazards 2017. [Google Scholar] [CrossRef]
- Schambach, L.; Grilli, A.R.; Grilli, S.; Hashemi, R.; King, J. Assessing the impact of extreme storms on barrier beaches along the Atlantic coastline: Application to the southern Rhode Island coast. Coast. Eng. 2018, 133, 26–42. [Google Scholar] [CrossRef]
- Grilli, A.; Spaulding, M.L.; Damon, C.; Crean, T.; Fugate, G. Application of the Coastal Environmental Risk Index (CERI) to Barrington, Bristol, and Warren, RI, Report Prepared for the RI; Coastal Resources Management Council: South Kingstown, RI, USA, 2019. [Google Scholar]
- Small, C.; Blanpied, T.; Kauffman, A.; O’Neil, C.; Proulx, N.; Rajacich, M.; Simpson, H.; White, J.; Spaulding, M.L.; Baxter, C.D. Assessment of damage and adaptation strategies for structures and infrastructure from storm surge and sea level rise for a coastal community in Rhode Island, United States. J. Mar. Sci. Eng. 2016, 4, 67. [Google Scholar] [CrossRef]
- Blanpied, T.; Kauffman, A.; O’Neil, C.; Proulx, N.; Rajacich, M.; Simpson, H.; Small, C.; White, J. Assessment of Damage from Storm Surge and Sea-Level Rise along Matunuck Beach Road and Surrounding Communities, Ocean Engineering Senior Design Project, Ocean Engineering; University of RI: Narragansett, RI, USA, 2016. [Google Scholar]
- Bianchi, C.; Folkert, L.; Knight, J.; Madison, H.; Maroukis, M.; Quinn, B.; Schicho, J.; White, M. Assessment of Damage for the Misquamicut, RI Community from a 100 yr Storm Event and Sea Level Rise, Ocean Engineering Senior Design Project, Ocean Engineering; University of RI: Narragansett, RI, USA, 2017. [Google Scholar]
- Aiudi, M.; Day, E.; Girard, P.; Menefee, N.; Schwarz, M.; Zarba, E. Application of Coastal Environmental Risk Index to Providence and Fox Point Hurricane Barrier, Ocean Engineering Senior Design Project, Ocean Engineering; University of RI: Narragansett, RI, USA, 2018. [Google Scholar]
- Bowe, E.; Loo, M.; Ross, E.; Savastano, C.; Thirkell, S.; Weisman, J. Evaluating and Improving the Resilience of Wastewater Treatment and Hazardous Material Storage Facilities in Upper Narragansett Bay to Coastal Flooding, Ocean Engineering Senior Design Project, Ocean Engineering; University of RI: Narragansett, RI, USA, 2019. [Google Scholar]
- Spaulding, M.L.; Grilli, A.; Damon, C.; McKenna, B.; Christensen, M.; Vinhateiro, N.; Boyd, J.; Fugate, G. STORMTOOLS, Coastal Environmental Risk Index (CERI) Risk and Damage Assessment App. J. Mar. Sci. Eng. 2020, 8, 129. [Google Scholar] [CrossRef]
- ASCE. Minimum Design Loads and Associated Criteria for Buildings and Other Structures; American Society of Civil Engineers (ASCE): Reston, VA, USA, 2017; ISBN 978-0-7844-7996-4. [Google Scholar]
- Spaulding, M.L.; Grilli, A.; Damon, C.; Hashemi, R.; Anbaran, S.K.; Fugate, G. STORMTOOLS Design Elevation (SDE) Maps: Including impact of sea level rise. J. Mar. Sci. Eng. 2020, 8, 292. [Google Scholar] [CrossRef]
- Cialone, M.A.; Massey, T.C.; Anderson, M.E.; Grzegorzewski, A.S.; Jensen, R.E.; Cialone, A.; Mark, D.J.; Pevey, K.C.; Gunkel, B.L.; McAlpin, T.O.; et al. North Atlantic Coast Comprehensive Study (NACCS) Coastal Storm Model Simulations: Waves and Water Levels; Report: ERDC/CHL TR-15-44; Coastal and Hydraulics Laboratory, U.S. Army Engineer Research and Development Center: Vicksburg, MS, USA, 2015. [Google Scholar]
- Simm, J.D.; Guise, A.; Robbins, D.; Engle, J. US North Atlantic Coast Comprehensive Study: Resilient Adaptation to Increasing Risk; Physical depth- damage function summary report; Coastal and Hydraulics Laboratory, U.S. Army Engineer Research and Development Center: Vicksburg, MS, USA, 2015; p. 40. [Google Scholar]
© 2020 by the authors. Licensee MDPI, Basel, Switzerland. This article is an open access article distributed under the terms and conditions of the Creative Commons Attribution (CC BY) license (http://creativecommons.org/licenses/by/4.0/).