Article

Stormtools Design Elevation (SDE) Maps: Including Impact of Sea Level Rise

1
Ocean Engineering, University of RI, Narragansett, RI 02882, USA
2
Environmental Data Center, University of RI, Kingston, RI 02881, USA
3
Rhode Island, Coastal Resources Management Council, South Kingstown, RI 02879, USA
*
Author to whom correspondence should be addressed.
J. Mar. Sci. Eng. 2020, 8(4), 292; https://doi.org/10.3390/jmse8040292
Submission received: 16 February 2020 / Revised: 8 April 2020 / Accepted: 14 April 2020 / Published: 18 April 2020
(This article belongs to the Section Ocean Engineering)

Abstract

:
Many coastal communities in the US use base flood elevation (BFE) maps for the 100-year return period, specified on Federal Emergency Management Agency (FEMA) Flood Insurance Rate Maps (FIRMs), to design structures and infrastructure. The FIRMs are increasingly known to have serious problems in accurately specifying the risk coastal communities face, as most recently evidenced during hurricanes Harvey and Irma in 2017 and Florence and Michael in 2018. The FIRM BFE maps also do not include the impact of sea level rise, which clearly needs to be considered in the design of coastal structures over the next several decades given recent National Oceanic and Atmospheric Administration (NOAA) sea level rise (SLR) projections. Here, we generate alternative BFE maps (STORMTOOLS Design Elevation (SDE) maps) for coastal waters of Rhode Island (RI) using surge predictions from tropical and extratropical storms of the coupled surge-wave models from the US Army Corp of Engineers, North Atlantic Comprehensive Coast Study (NACCS). Wave predictions are based on application of a steady state, spectral wave model (STWAVE), while impacts of coastal erosion/accretion and changes of geomorphology are modeled using XBeach. The high-resolution application of XBeach to the southern RI shoreline has dramatically increased the ability to represent the details of dune erosion and overtopping and the associated development of surge channels and over-wash fans and the resulting landward impact on inundation and waves. All methods used were consistent with FEMA guidelines for the study area and used FEMA-approved models. Maps were generated for 0, 2 ft (0.6 m), 5 ft (1.5 m), 7 ft (2.1 m), and 10 ft (3.1 m) of sea level rise, reflecting NOAA high estimates at various times for the study area through 2100. Results of the simulations are shown for both the southern RI shoreline (South Coast) and Narragansett Bay, to facilitate communication of projected BFEs to the general public. The maps are hosted on the STORMTOOLS ESRI Hub to facilitate access to the data. They are also now part of the RI Coastal Resources Management Council (CRMC) risk-based permitting system. The user interface allows access to all supporting data including grade elevation, inundation depth, and wave crest heights as well as corresponding FEMA FIRM BFEs and associated zones.

1. Introduction

In most coastal states in the US, state and municipal building codes use the Federal Emergency Management Agency (FEMA) Flood Insurance Rate Maps (FIRM) generated during Flood Insurance Studies (FIS) (see FIS for Washington County, RI, as an example [1]) to specify the flooding zones (and the associated estimates of inundation depths and wave heights used in the design of structures and infrastructure. The latter are normally expressed in the form of Base Flood Elevation (BFEs), relative to the North Atlantic Vertical Datum (NAVD88) datum, and represent the sum of the still water elevation level (SWEL) due to 100-yr flooding plus the controlling wave crest height (Figure 1). The controlling wave crest height represents an estimate of the upper end of the wave spectra and is 1.12 times the significant wave height (Hs). The FIRMS also include 500-yr levels (0.2% annual chance), but they represent flooding only, without the associated wave environment. FEMA further delineates the flood-impacted area in terms of VE, AE, and X zones. The VE zone has a wave crest height greater the 3 ft (0.9 m), the AE zone has crest heights less than 3 ft (0.9 m), and the X zone is where flooding occurs from the 500-yr event, but not the 100-yr event. The AE zone is often divided in two sections, one where the wave crest height is above and the other below 1.5 ft (0.45 m). The dividing line is the Limit of Moderate Wave Action (LIMWA) and the zone between 1.5 (0.45m) and 3 (0.9 m) feet is often referred to as the Coastal A zone. Any area that can be flooded during the 100-yr event is defined as the Special Flood Hazard Area (SFHA).
These BFEs are also included in the widely used American Society of Civil Engineers ASCE 7–16 [2] (https://asce7hazardtool.online/, accessed on 16 October 2018), which sets the minimum design loads for structures, and are often required or referenced in state and municipal building codes. Strong concerns have been voiced about the FEMA FIRMs being outdated and unreliable, particularly after flooding in Texas and Louisiana from hurricanes Harvey and Irma (https://www.bloomberg.com/graphics/2017-fema-faulty-flood-maps/, accessed on 5 February 2020). These were highlighted in a recent review by the Office of Inspector General (OIG, 2017) [3] and earlier by an in-depth technical review by National Research Council (NRC) (2009) [4] of the methods used in generating the maps. While the FIRMs were explicitly developed for setting flood insurance rates, their use for design is being increasingly questioned since they do not address sea level rise (SLR), which is projected to be very significant (several meters) over the next 100 yrs. Design of structures that don’t explicitly consider the risk from SLR put property owners, communities, governmental entities, insurance companies, businesses, and financial institutions at unnecessary risk.
The goal of this paper was to generate BFE maps (called STORMTOOLs Design Elevation (SDE) maps) which explicitly consider SLR for coastal communities in Rhode Island (RI) for both open coastal areas, where waves and erosion are important (southern coast), and for a protected bay (Narragansett Bay), where surge amplification dominates. The maps were developed for RI using methods that meet the FEMA guidelines [5] for coastal mapping in the region and employ models approved by FEMA [6] for use in such investigations. This strategy was used to facilitate their adoption by coastal states and communities. The methods used in generating the maps also addressed several of the fundamental weaknesses of the FEMA FIRMs for the study area [7,8].
These SDE maps are an integral building block in the RI Coastal Resources Management Council (CRMC) risk-based permitting system that resulted from adoption of the Beach Special Area Management Plan (SAMP) in July 2018. The CRMC has also recently integrated the STORMTOOLS Design Elevation (SDE) Maps into their online Coastal Hazard Application process, which is a coastal hazard, risk-based permitting tool. Given its maturity and widespread use in the state, STORMTOOLS, including the SDE, is currently being migrated to the ESRI Hub format.

2. Approach and Study Area

The maps were developed under the STORMTOOLS initiative [9], whose goal is to provide access to a suite of coastal planning tools (numerical models, maps, data sets, etc.), available as a Geographic Information Systems (GIS)-based web service that allows widespread accessibly and applicability at high resolution for user-selected coastal and inland areas of interest. They are called STORMTOOLS Design Elevation (SDE) maps in recognition of their use to support the design of coastal structures and infrastructure. The maps are also an integral part of the STORMTOOLS Coastal Environmental Risk Index (CERI) [10,11,12] which assesses the risk that structures and infrastructure face from storm surges, including flooding and the associated wave environment, in the presence of sea level rise (SLR), and shoreline erosion/accretion, based on estimating damage to structures in the impacted area.
The study area selected for the development of the SDE maps were the coastal communities of RI including both the southern RI shoreline (South Coast) and Narragansett Bay. These areas were selected for application given the relatively low-lying topography of the towns and the number of residential/commercial/municipal structures at risk from SLR and storm surge. They include all coastal areas in RI. Figure 2 shows the density of structures at risk for 100-yr storm, plus 7 ft (2.1 m) of SLR for RI. The locations of the structures were based on the RI E911 emergency response database and partially verified with parcel-level data from the coastal towns. The Narragansett Bay and southern RI coastline study areas are outlined by the red and blue ovals, respectively. The division into open coastline and bay areas is in recognition of the fact that flooding dynamics are dominated by the amplification of surge levels with distance up the bay, with waves and shoreline erosion being secondary, while waves and shoreline erosion are critically important along the southern RI coast with very limited surge amplification.

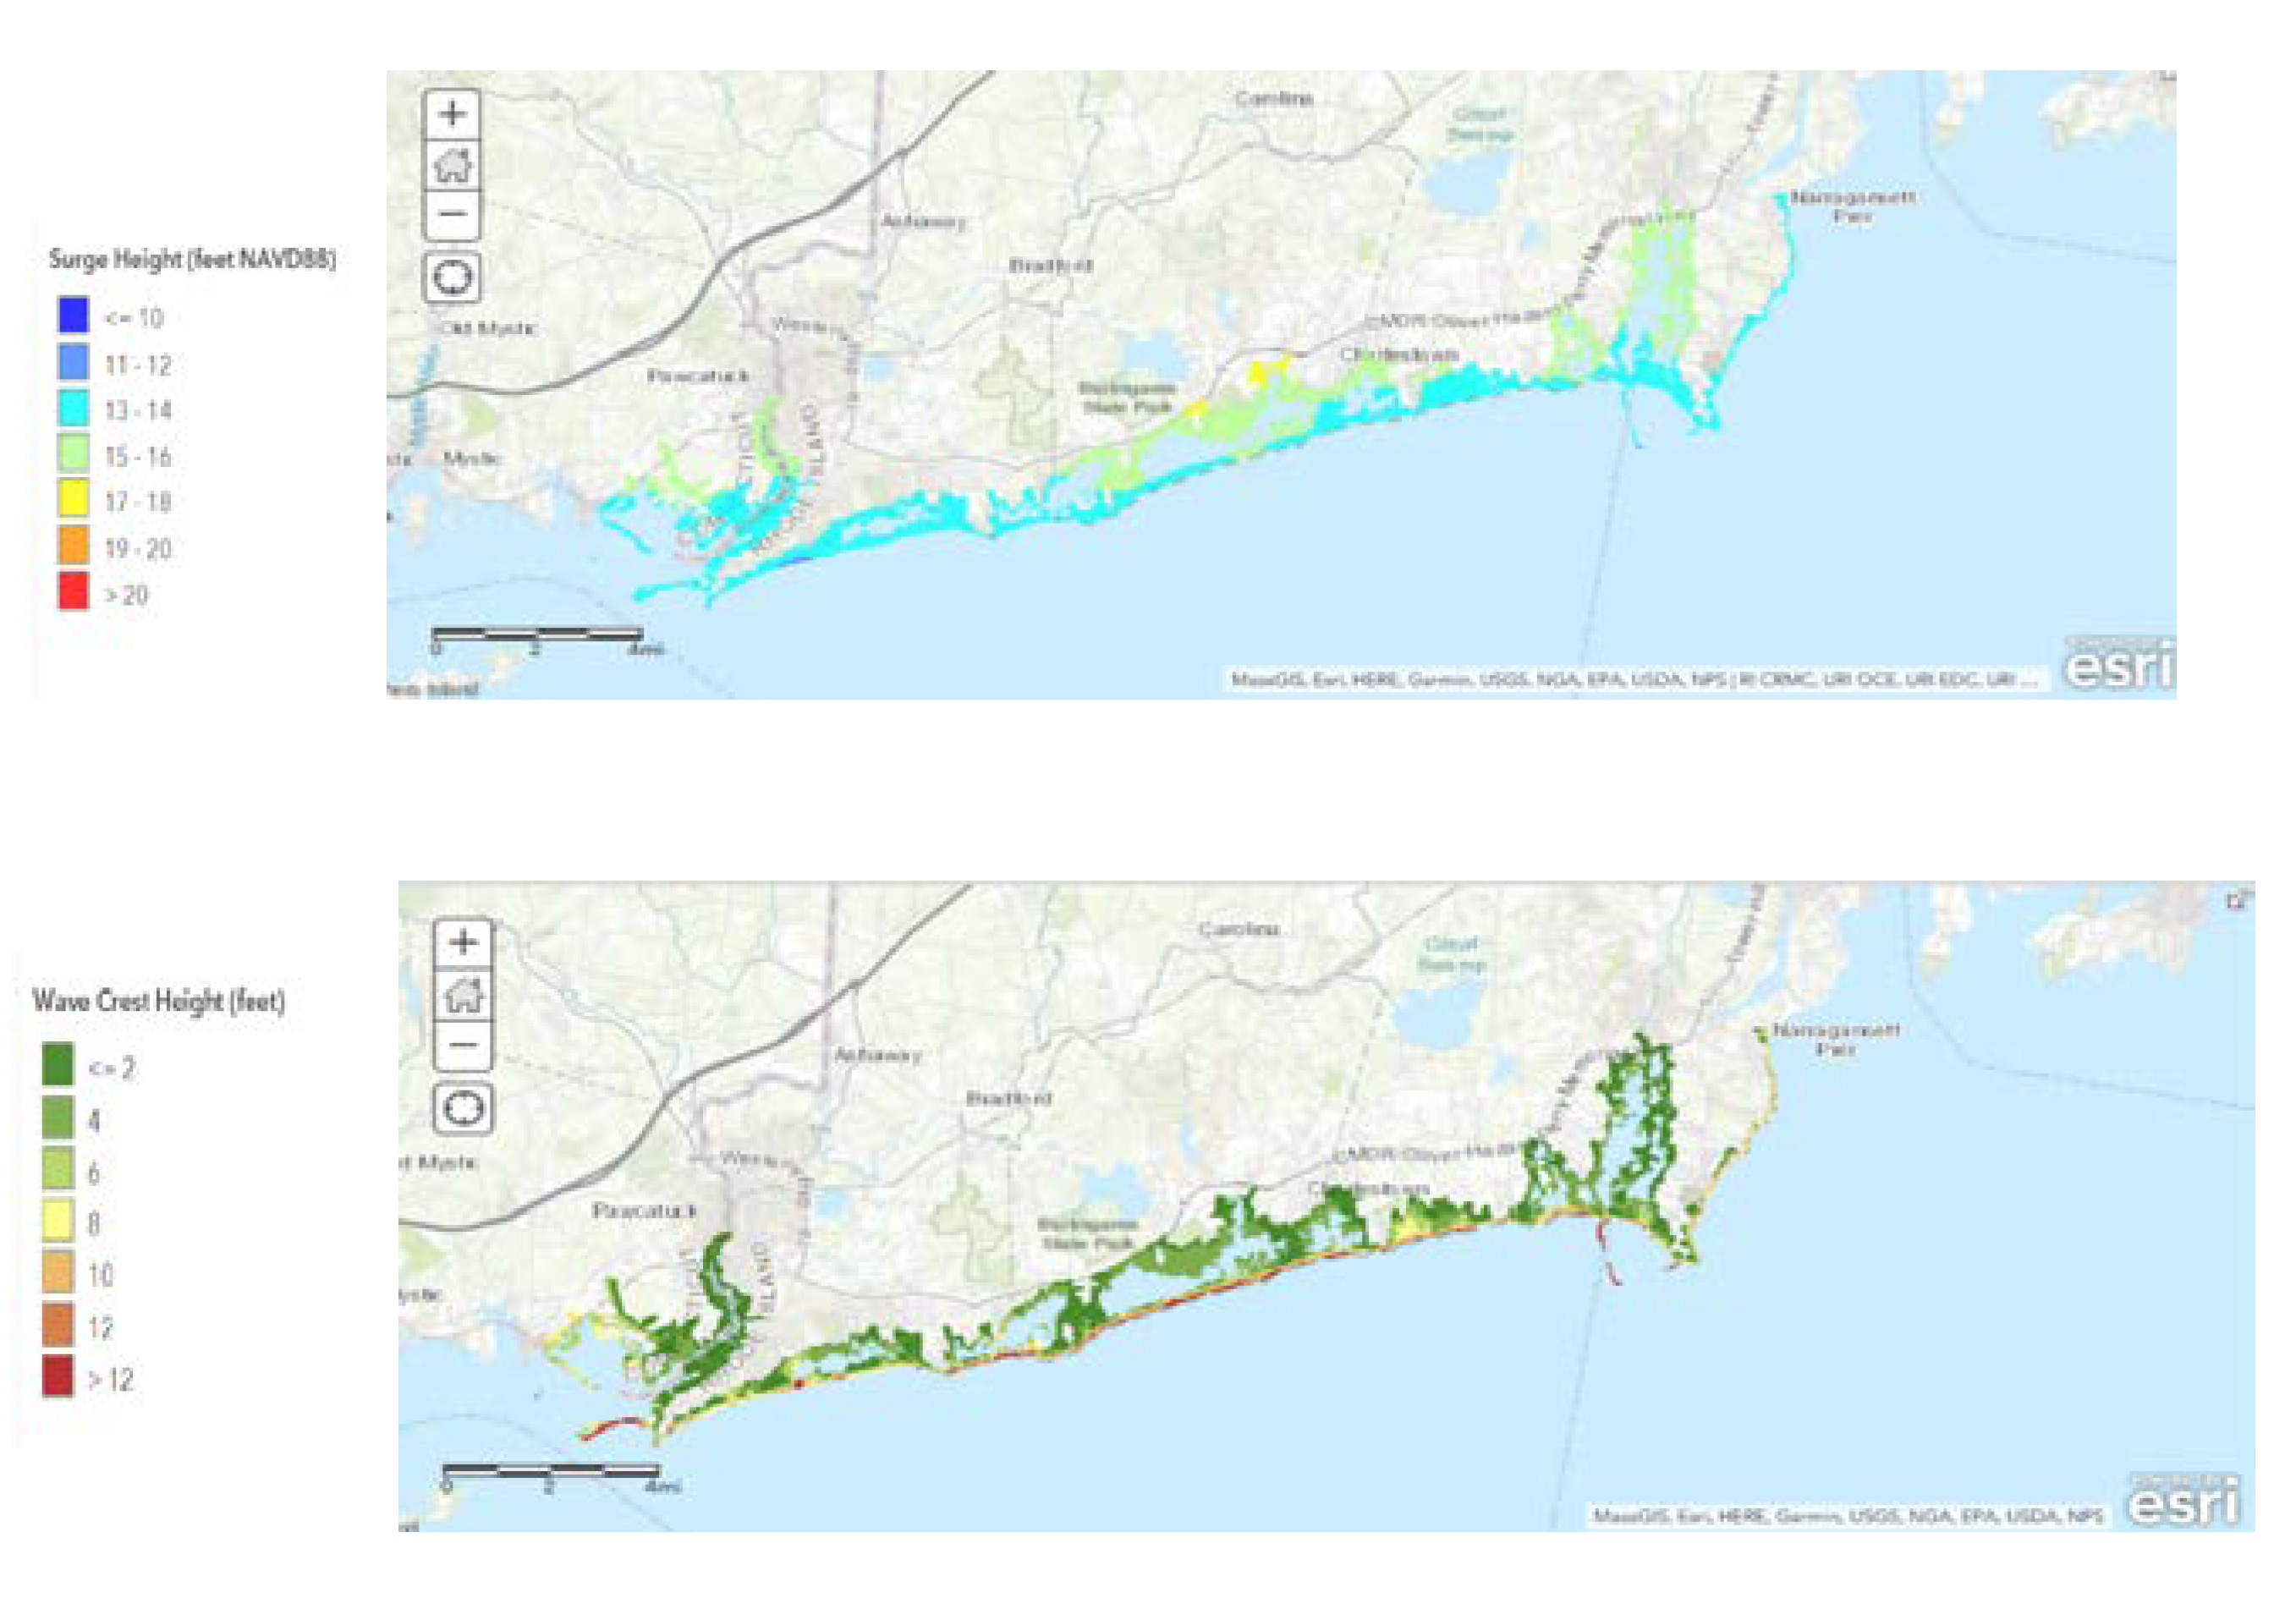
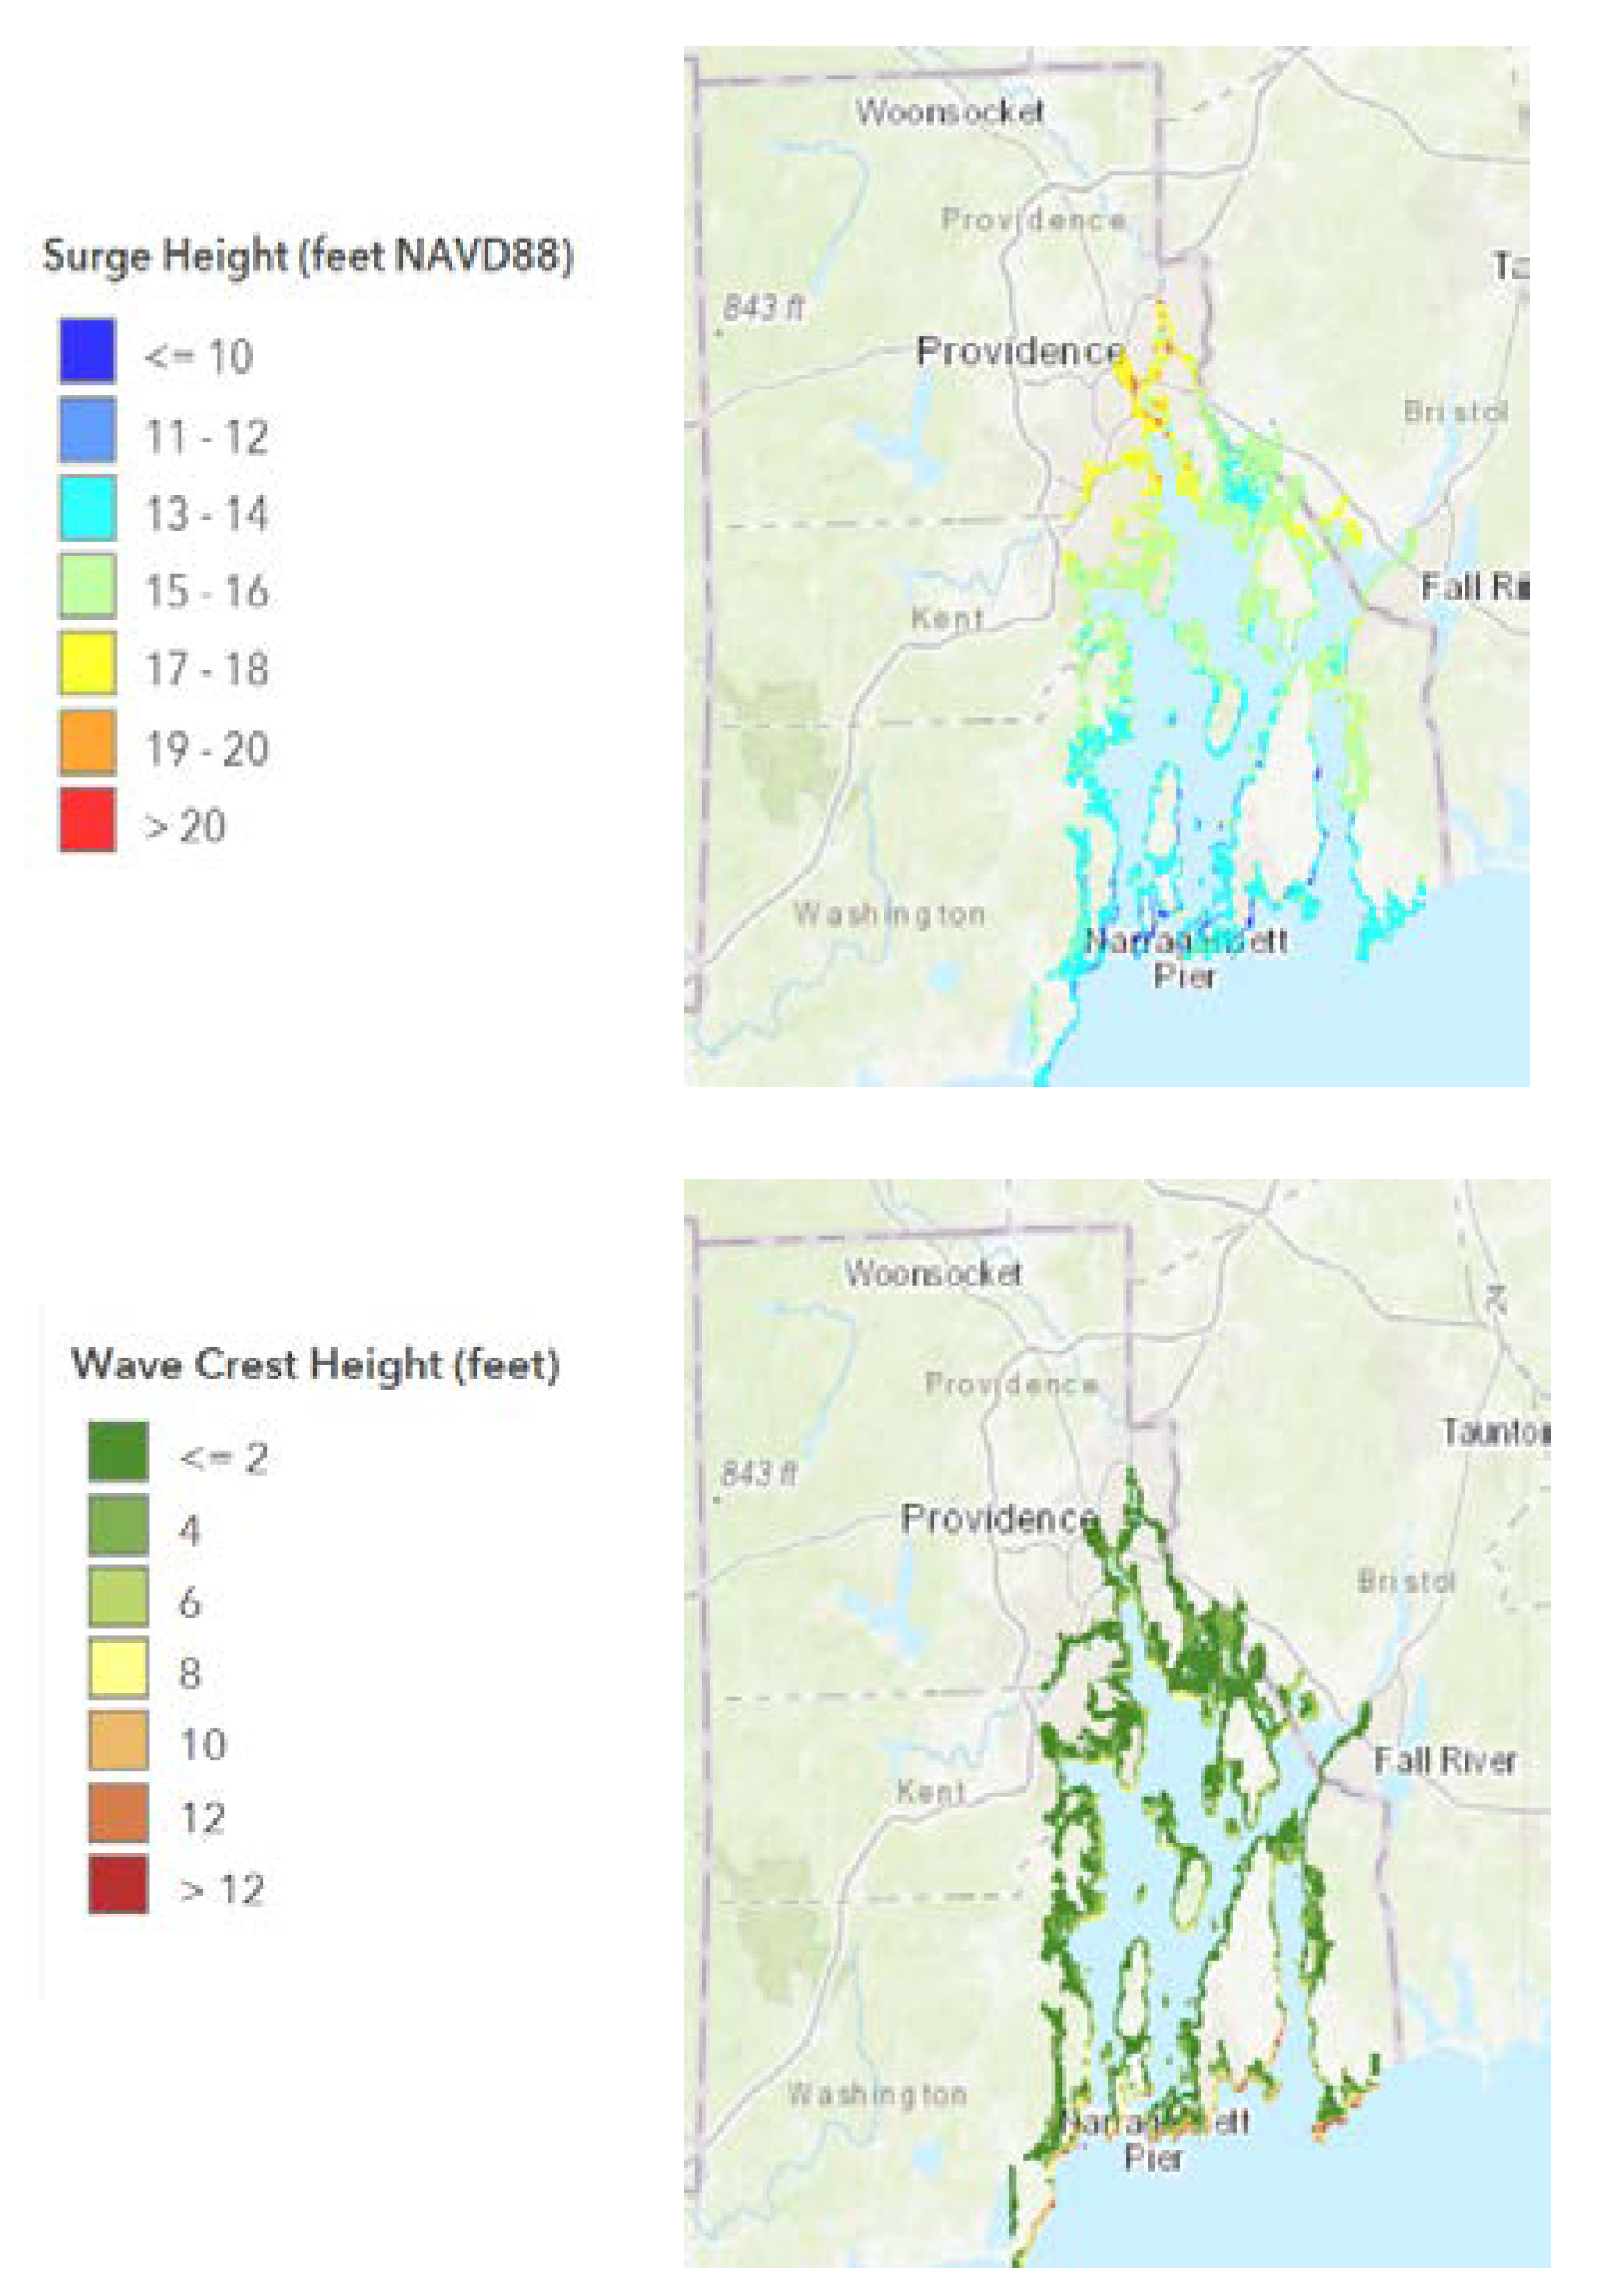
2.1. The 100-Yr Water Levels Including Effects of SLR

Following the approach presented in Spaulding et al. [9], the 100-yr water levels for storm surge for the study area were estimated using predictions of unstructured grid, coupled, hydrodynamic, and wave models (ADvanced CIRCulation model- STeady state spectral WAVE model/Wave Model ADCIRC- STWAVE/WAM) for 1050 synthetic tropical storms and 100 historical extratropical storms performed as part of the US Army Corp of Engineers, North Atlantic Comprehensive Coast Study (NACCS) [13]. The results of the simulations and return period analyses are archived at approximately 1000 save points principally located near the coast of the entire state. The water level for the upper 95% confidence limit (CL), for the surge plus tidal case, was employed to address uncertainty in the estimates. Spaulding et al., 2016 [9] provided additional details, including a comparison of the NACCS-based return period analysis to that based on historical observations at the National Oceanic and Atmospheric Administration, National Ocean Survey (NOAA NOS) water level stations at Newport (#8452660) and Providence (#8454000), RI [14]. The analysis showed that the surge water levels were approximately linearly amplified with distance from the mouth to the head of Narragansett Bay (factor of 1.35), but were approximately constant along the southern RI shoreline.
In the interest of simplicity, it would be ideal if the surge water level in the presence of SLR could be approximated by the simple addition of the SLR value to the 100-yr flood levels (without SLR) (the so-called linear superposition method). To evaluate this linear superposition method, simulations were performed for a much higher resolution grid, based on the original NACCS grid, but that more accurately captured the nearshore bathymetry and topography in RI. The ADCIRC-SWAN (Simulating WAves Nearshore) hydrodynamic-wave model, used in this analysis, was the same as that used in the NACCS [13]. It is described in detail and its application and validation to selected wind-forced storm events in the RI study area are presented in Torres et al., 2018 [15]. Simulations were performed with this higher resolution model for NACCS tropical storm #492. This storm was selected since it gave approximately the same water level as the 100-yr event (95% confidence limit) at the NOAA NOS stations at Newport and Providence, RI, as the estimated values based on observations.
Figure 3a shows the model-predicted water levels (WL) vs. time for the south coast of RI (Charlestown, RI) (green oval in Figure 2) and at the Newport and Providence NOAA NOS stations. The amplification of the surge height, with distance up the bay, is clearly evident. Surge levels along the southern RI coastal line (not shown) are very close to the values at Charlestown, RI. Figure 3b shows the NACCS-predicted water level vs. time at NACCS save point #8741 (point closest to Newport), the results of simulations with the higher resolution grid for the 100-yr event, the 100-yr simulation results with 6.6 ft (2 m) of SLR simply added (linear approximation), and results of the high-resolution simulation where sea level rise was accounted for by changing the original bathymetry used as input to the coupled hydrodynamic and wave model. The 2-m SLR case was selected for simulation since it was at the center of the range of SLR values of principal interest and was sufficiently large to clearly show the impact of nonlinearity on the model predictions. The latter case was based on the full simulation results and, hence, included any nonlinear (NL) interactions between surge and increased water depth due to SLR. Figure 3c is a repeat of 2b but at the Providence station. Results of the linear and nonlinear simulation using the high-resolution model at the Charlestown, RI, location are shown in Figure 3d.
Table 1 shows the maximum water level at Newport and Providence, RI, from NACCS storm #492 from the NACCS save point closest to these locations (Save Point #8741- Newport; #10395-Providence) based on the original simulations, as a result of the application of ADCIRC-SWAN high-resolution model without SLR, with 6.6 ft (2-m SLR) simply added (linear superposition), and with 6.6-ft (2-m) SLR added to the initial bathymetry and nonlinear(NL) simulations performed. The high-resolution (lower limit of 5 to 10 m) model was in excellent agreement with the original NACCS simulation for the peak water levels at the Newport and Providence locations. The linear (L) superposition method predicted slightly larger peak water levels than for the full nonlinear (NL) model, about 3.2% at Newport and 5.7% at Providence.
Figure 4 shows the spatial structure of the peak water level for the linear superposition method, the full nonlinear results, and the percent difference between the two for the 6.6-ft (2-m) SLR case. The percent difference between the two increased with distance up the bay. There was, in essence, no difference along the southern RI shoreline (Figure 3c).
These simulations show that the amplification factor decreased slightly with distance up the bay (Figure 4a,b), with no change along the southern RI shoreline. In the interest of developing conservative design elevation maps, the SLR value of interest was, therefore, simply added to the 100-yr surge.

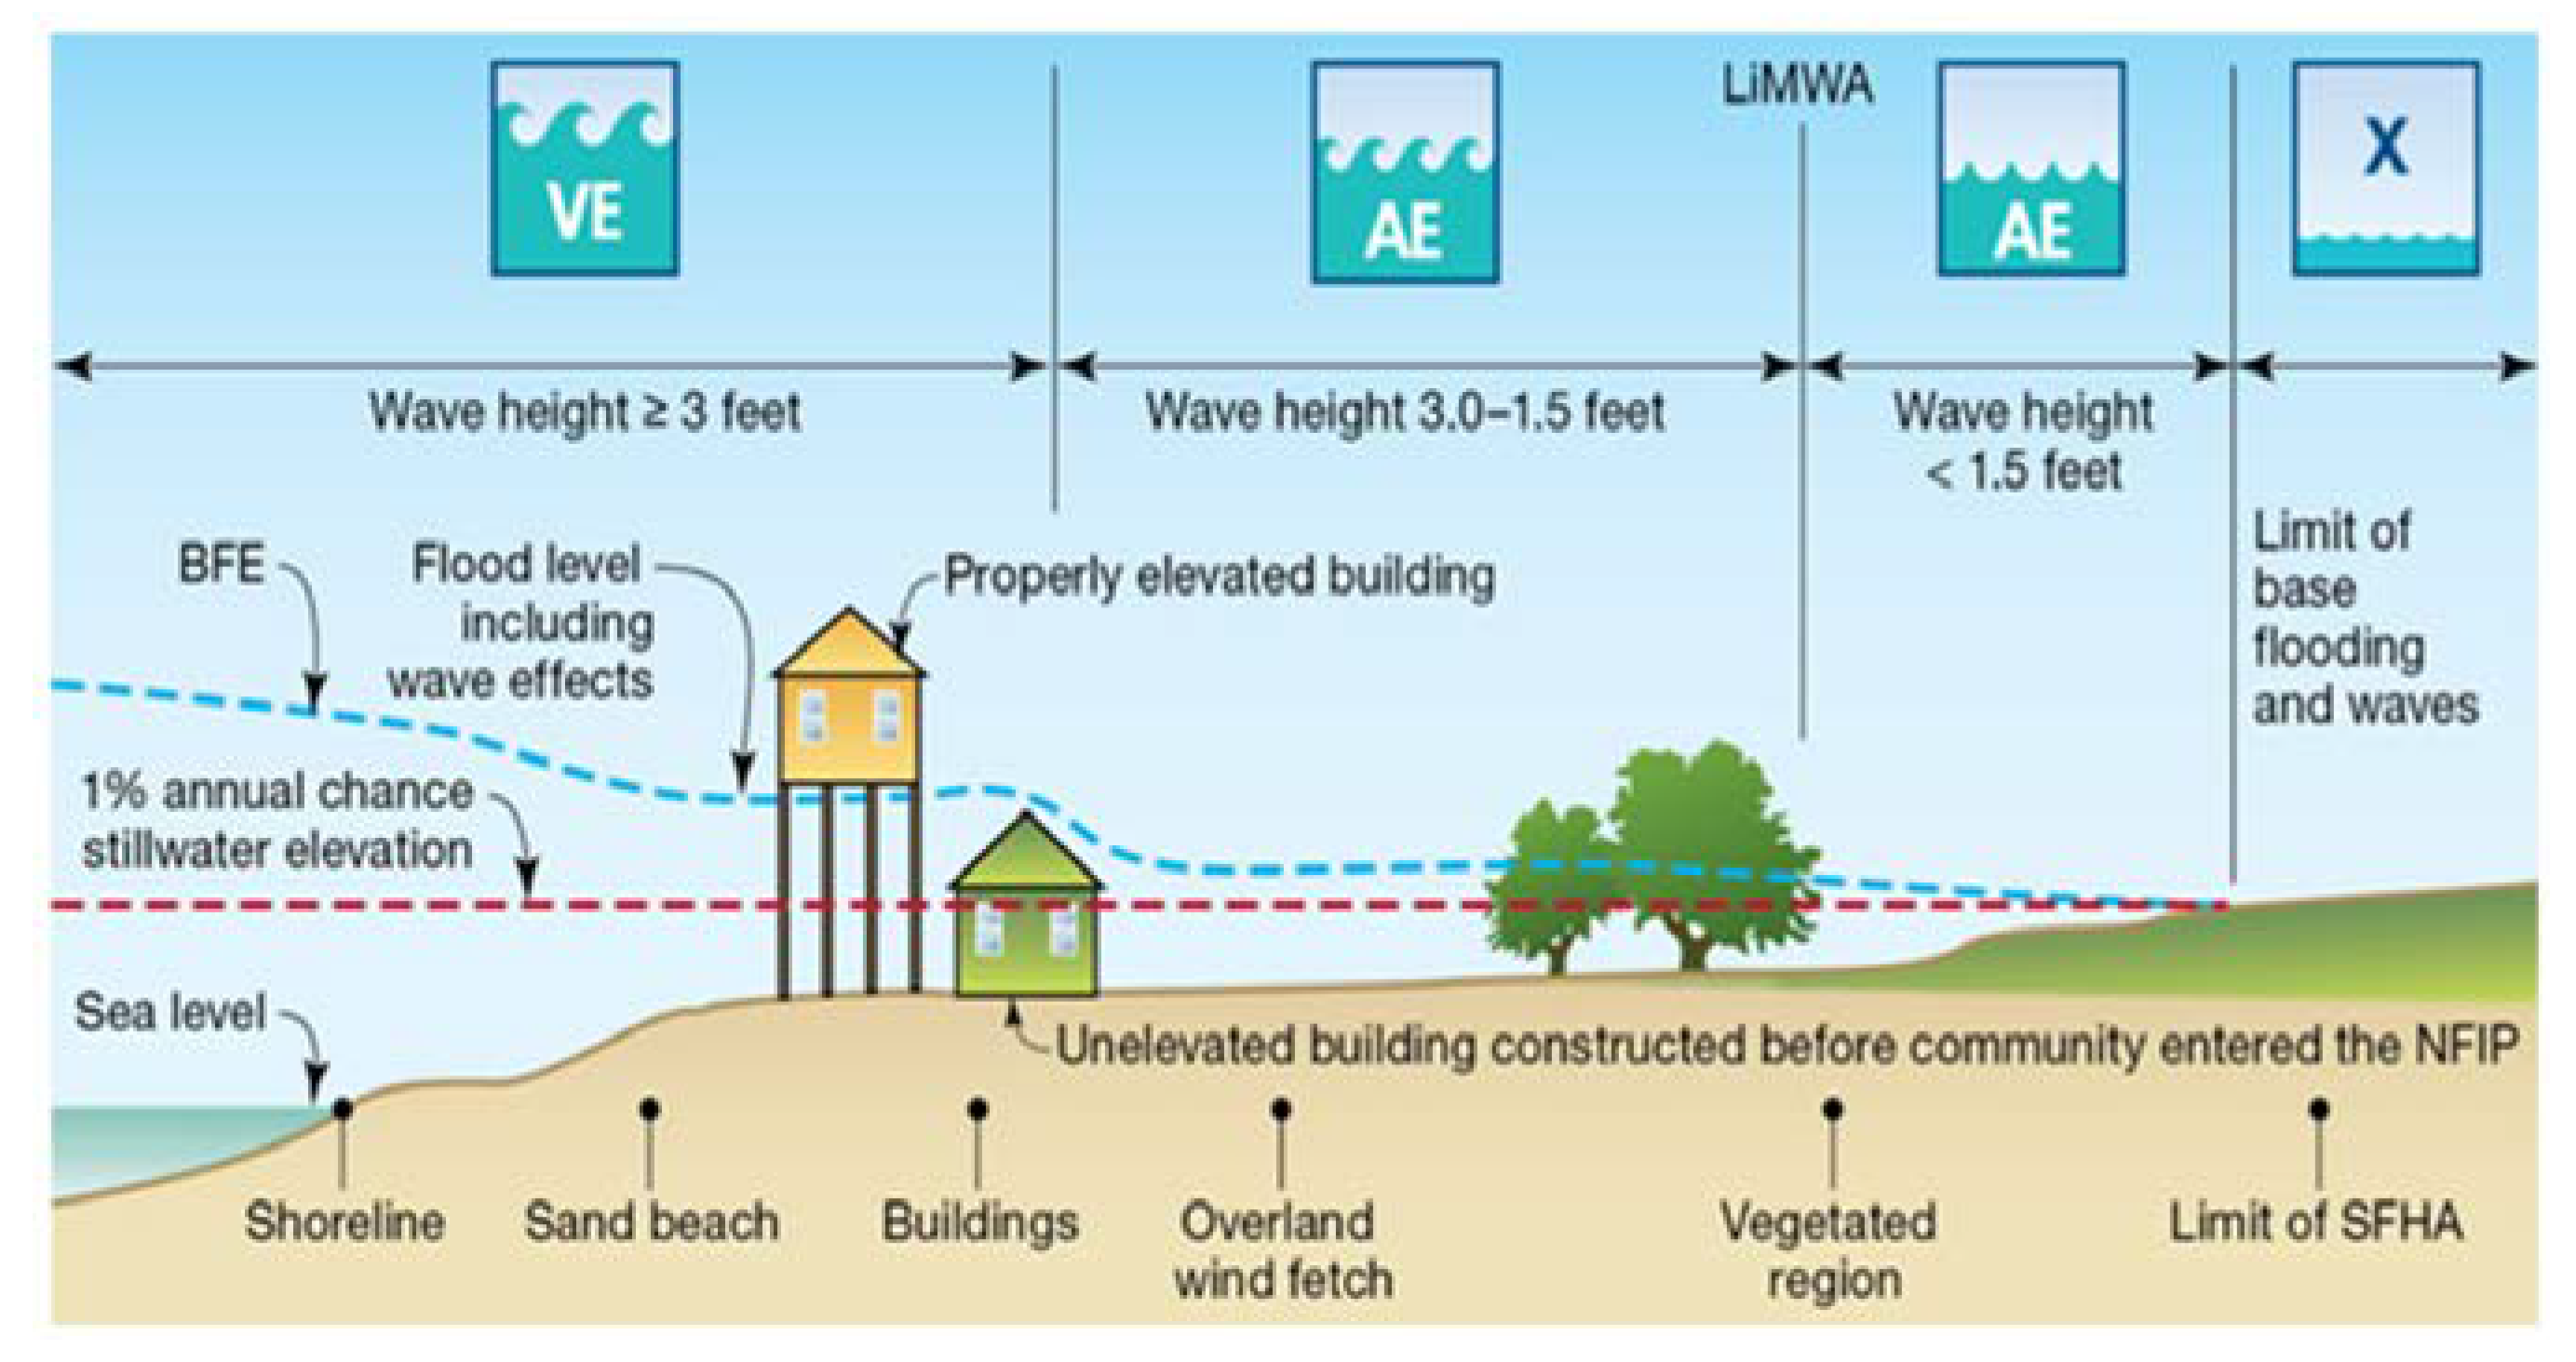
2.2. Waves Including Effects of SLR

The analysis of wave heights (and the associated impact of coastal erosion) necessary to determine BFEs was performed using two different approaches. For Narragansett Bay, where waves are quite limited, wave heights were estimated by applying STWAVE [16,17] for a grid covering the bay area. For the southern RI shoreline, where waves and coastal erosion are important, simulations were performed using the geomorphological model XBeach to determine the eroded dune profiles [18]. The profile was then used to generate an eroded digital elevation model (DEM), which was then used as input to STWAVE for simulations of 100-yr wave conditions, with and without SLR. The methods for each location are provided in more detail below.

2.3. Narragansett Bay

Waves heights were estimated in Narragansett Bay for extreme storm events associated with an annual probability of exceedance of 1% (100-year storm) using the Steady State Spectral Wave model (STWAVE), a phase-averaged wave model [16,17]. STWAVE was forced along the open boundary to the south (RI Sound) with significant wave heights of 33 ft (10 m), a period of 20 sec, and a direction of 165 degrees referenced to north (N). These values were extracted from the NACCS save point wave database located at the mouth of the bay. Wind forcing of 35 m/sec (80 mph) (100 yr) was assumed aligned with the central axis of the lower bay at 180 degrees to maximize the fetch along the lower east and west passages. STWAVE predictions employed a 15-m grid to optimize accuracy and computational efficiency and mapped on a 16.4-ft (5-m) grid. The DEM used the NOAA National Ocean Survey bathymetry merged with 2011 laser imaging, detection, and ranging (LIDAR) data and was available via RI Geographic Information System (RI GIS) (http://www.rigis.org/data/topo/2011, accessed on 16 January 2017). The DEM had a horizontal resolution of 33 ft (10 m) across the ocean and 3.3 ft (1 m) on land. The vertical accuracy on land was approximately 0.5 ft (15 cm), based on a comparison to the blind control points used during the 2011 LIDAR survey and subsequent evaluations of the DEM using certificates of elevation made available for selected towns in the state. Simulations were performed for a no sea level rise as well as for four SLR scenarios: 0, 0.6, 1.5, 2.1 m, and 3.04 m (0, 3, 5, 7, and 10 ft). These SLR values spanned the likely range for RI (Newport and Providence) based on NOAA high estimates from mid-century through 2100 for the bay. They are available via the US Army Corp of Engineers (USACE) SLR calculator (http://corpsmapu.usace.army.mil/rccinfo/slc/slcc_calc.html, accessed on 18 October 2018). NOAA high estimates were selected by RI Coastal Resources Management Council to specify the SLR values for their newly adopted risk-based permitting system.

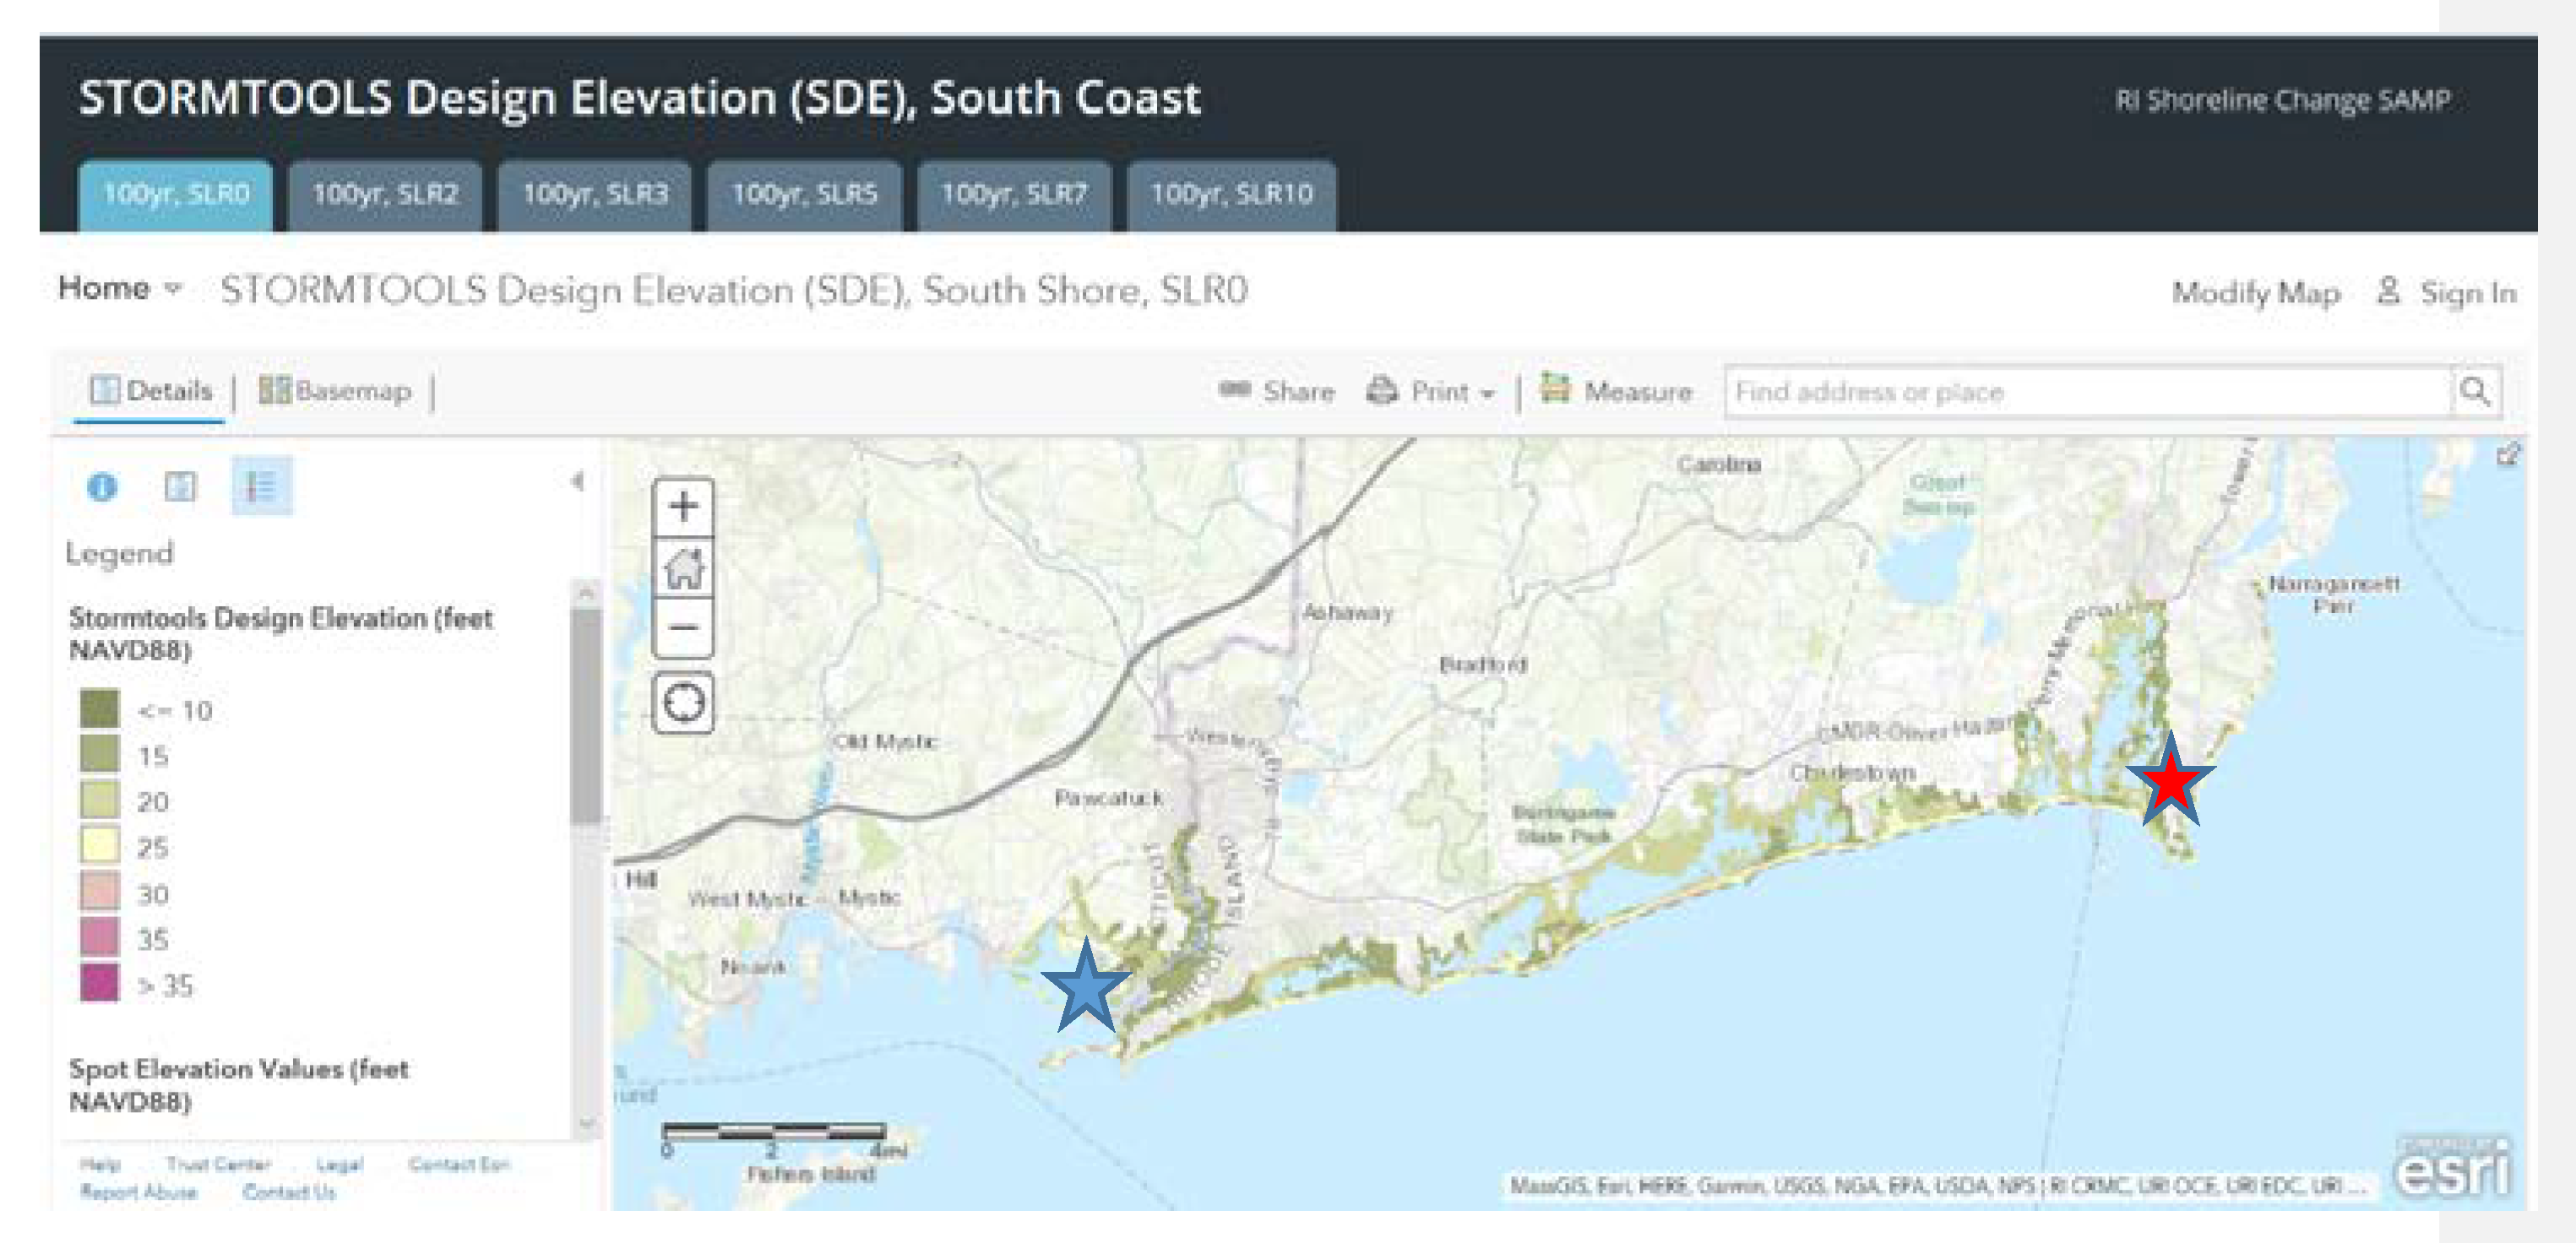
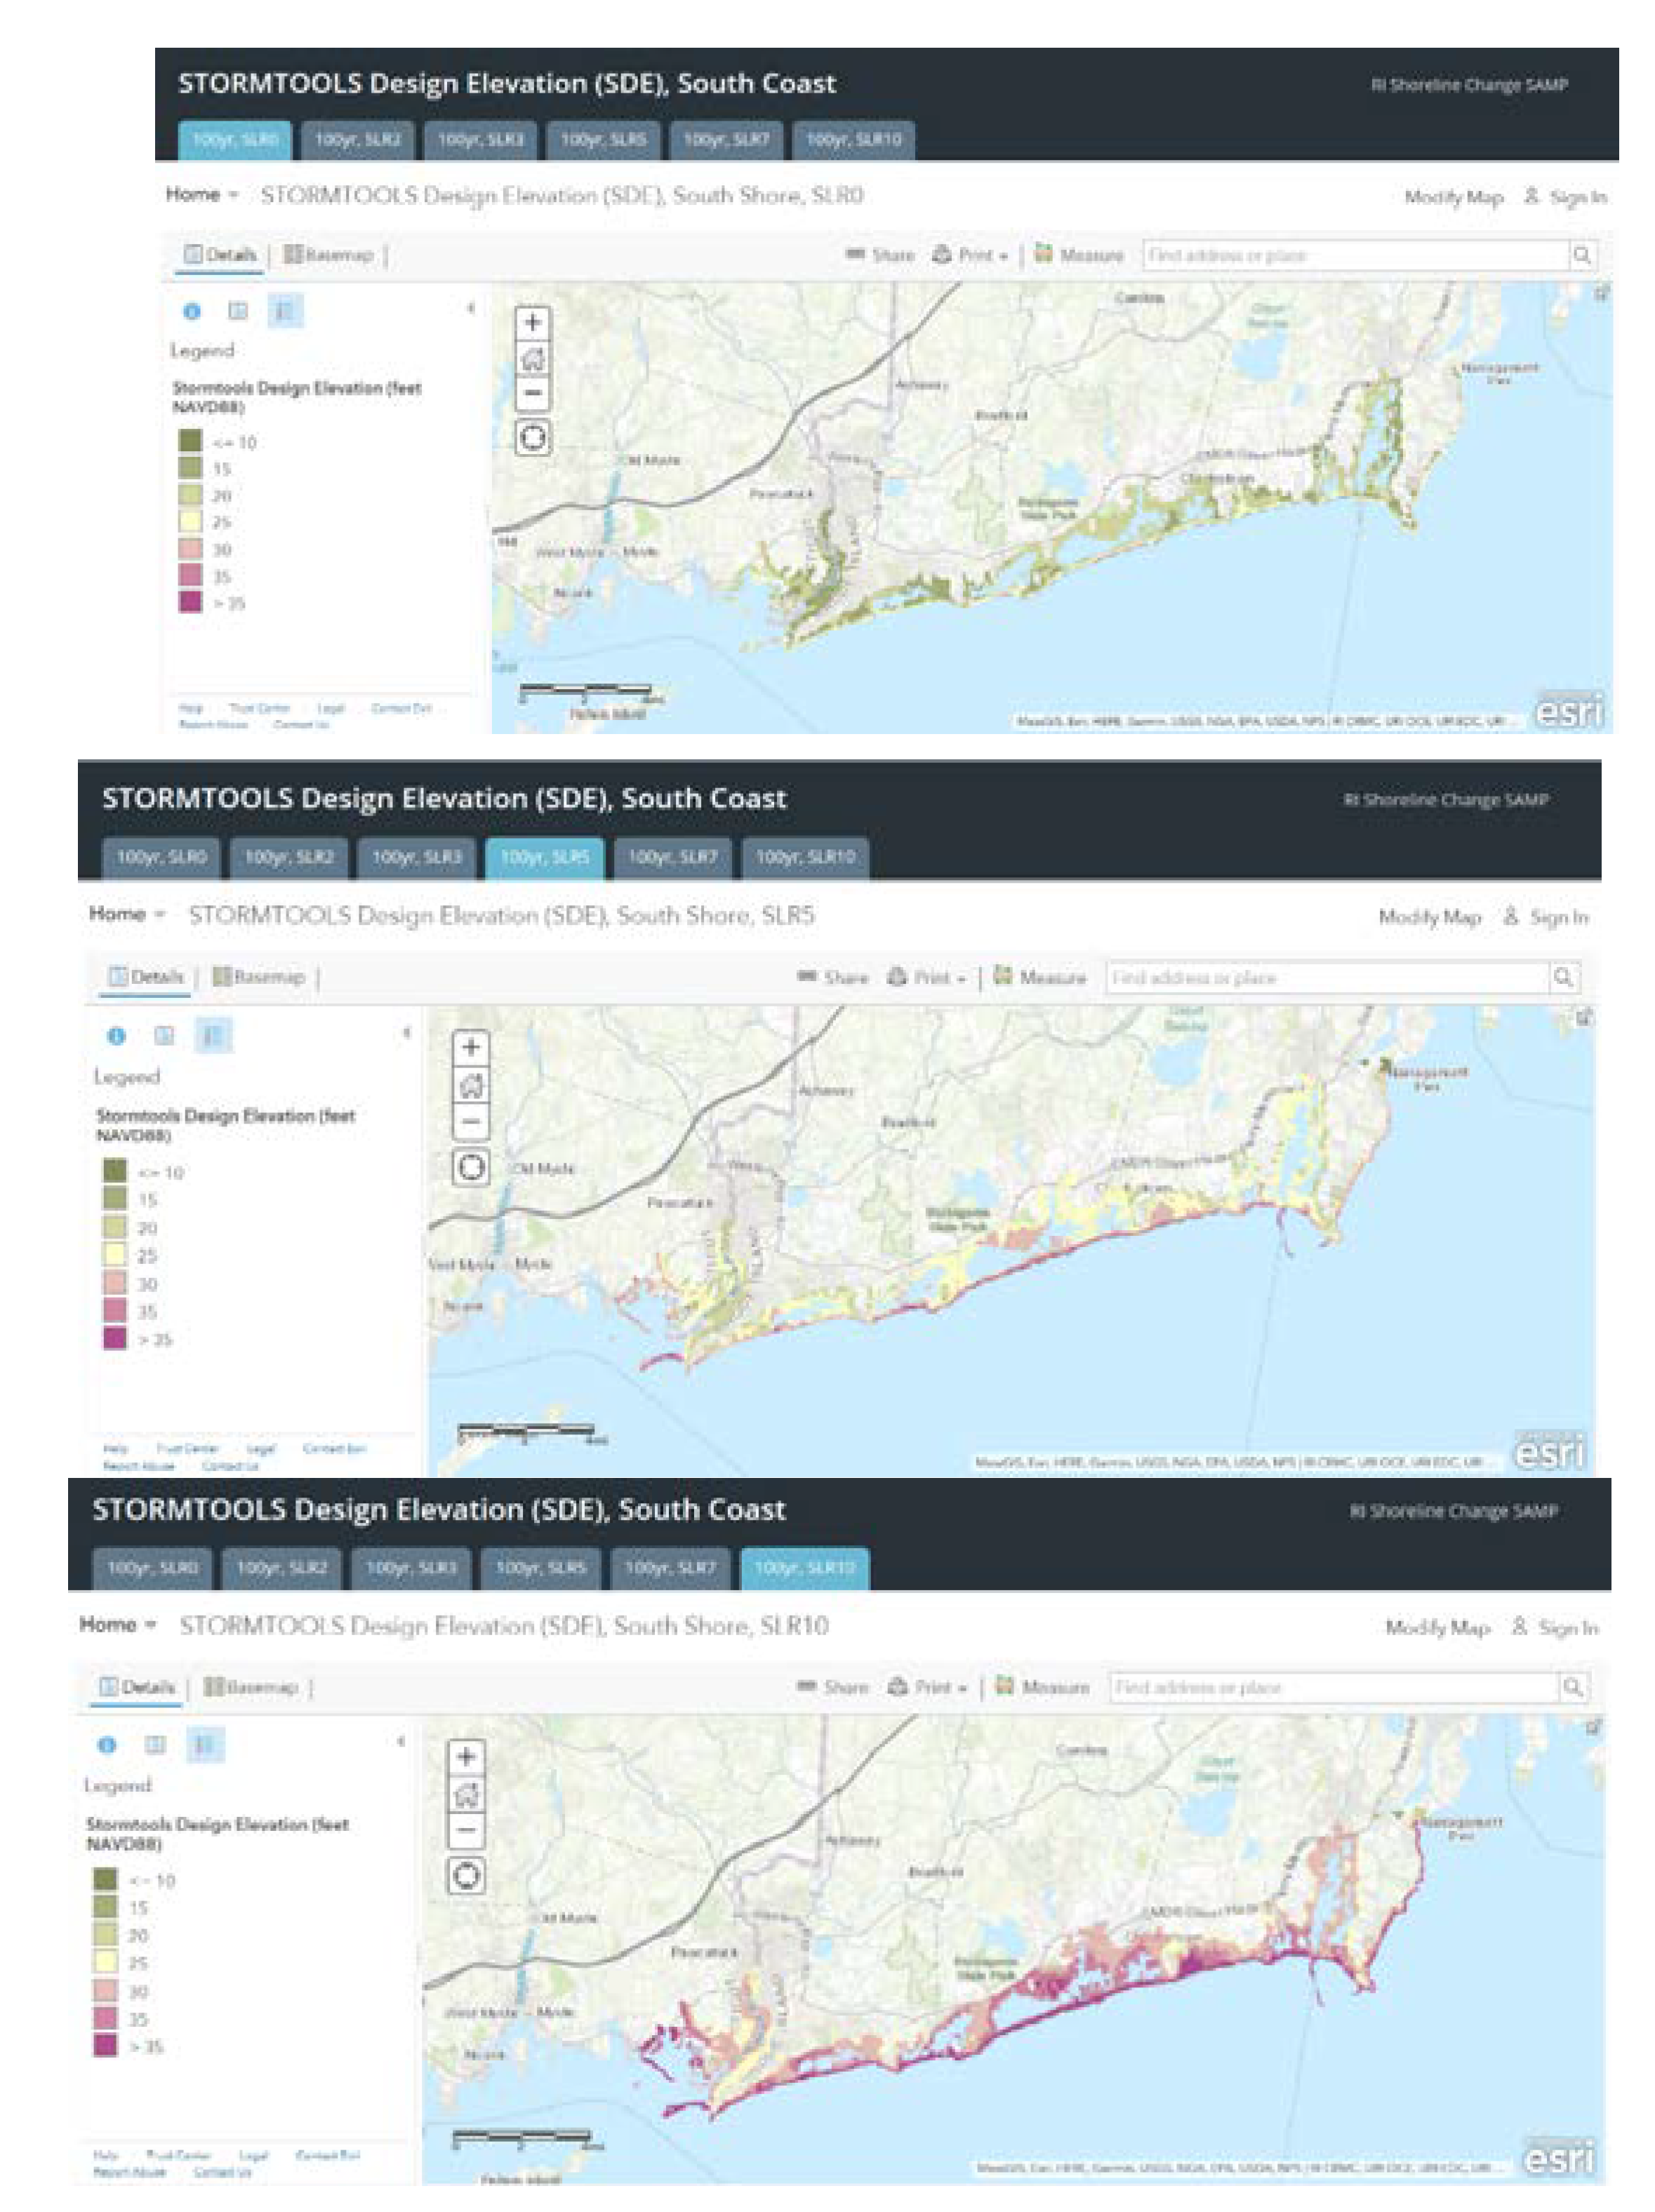
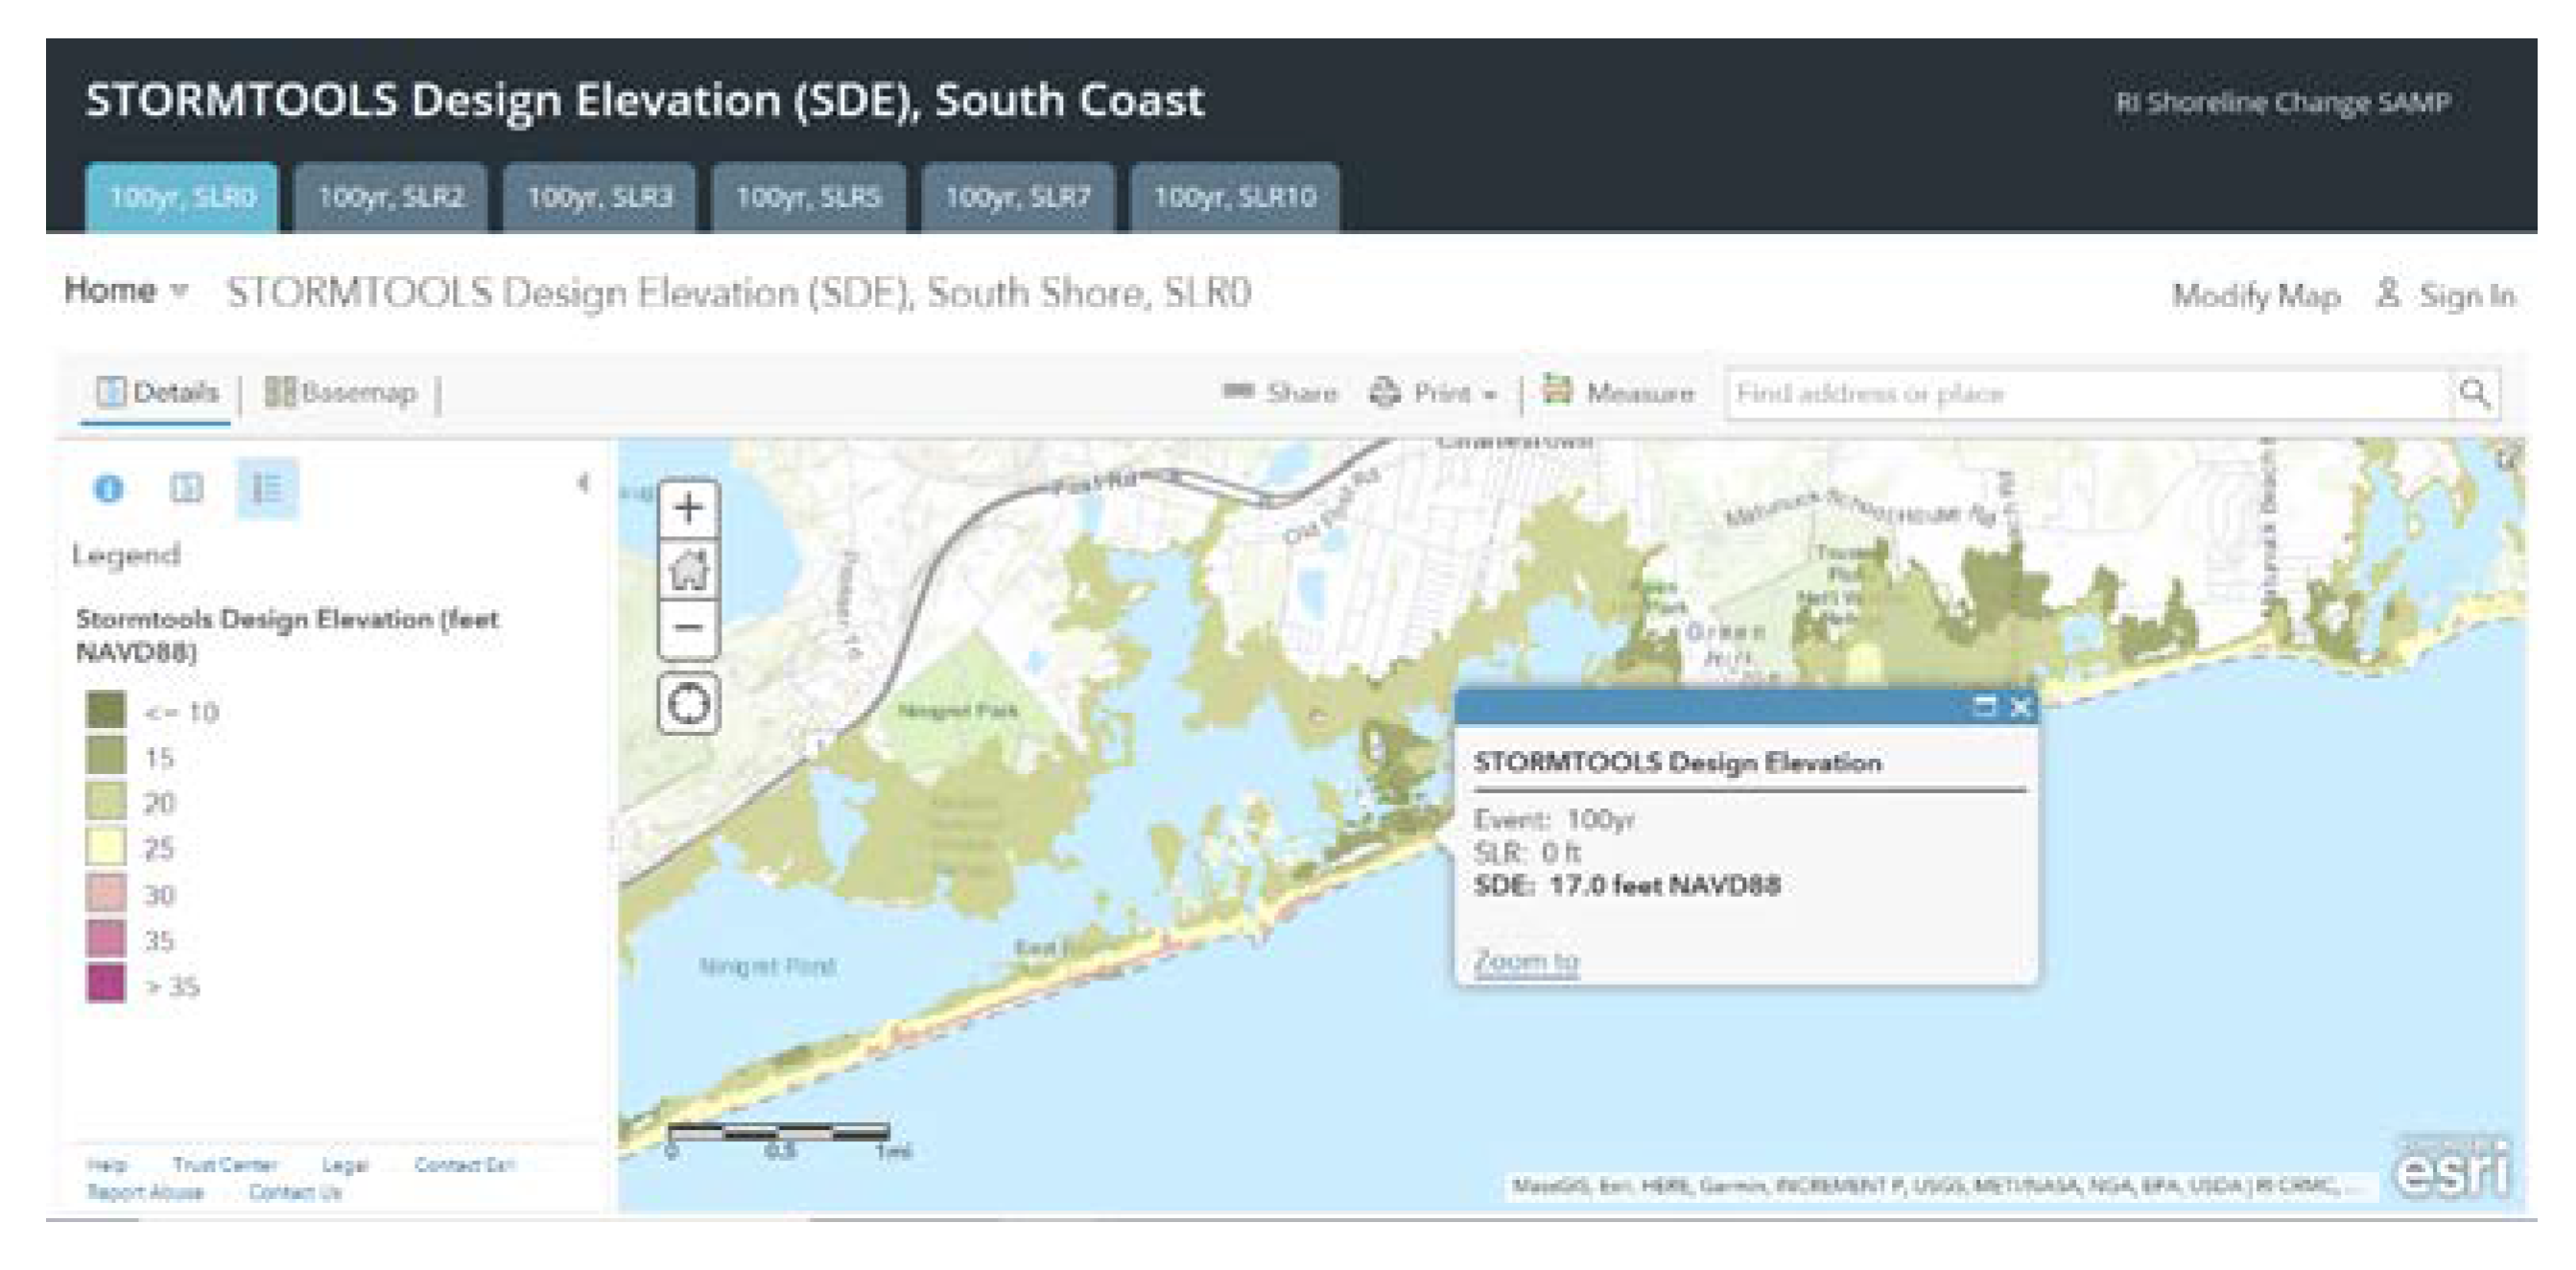
2.4. Southern RI Shoreline (South Coast)

Schambach et al., 2017 [18] applied the geomorphological model XBeach to a section of the southern RI shoreline in Charlestown, RI (see Figure 2 for location, green oval). XBeach is a fully coupled hydrodynamic (wave action and horizontal mean flow) and morpho-dynamics (change in geomorphology and sediment transport) model that dynamically simulates processes that occur during four erosion regimes, as defined by Sallenger [19] (swash, collision, over-wash, and inundation). A detailed description of the model is provided in Harter and Figlus [20]. Additional details on XBeach applications to the general study area and detailed sensitivity studies to the initial conditions, seasonal variabilities in storms, and sea level rise are provided in [21,22].
The model was applied to the Charlestown, RI, study area (approximately 6.2 miles (10 km) along shore and 4.4 miles (7 km) cross shore) including the dune and adjacent coastal pond using a nominal grid resolution of 33 ft (10 m). The bathymetry/topography was provided using a merge dataset which included NOAA bathymetric data and 2011 Northeast LIDAR data for the land area, described above. The land cover vegetation was obtained from RI GIS database. The offshore boundary condition was specified in terms of water level and wave conditions during the event of interest. The lateral boundaries assumed no flow and no along shore pressure gradient.
The model was applied and validated to tropical storm Irene, which impacted RI on 11 August 2011. Time series of water levels and waves during the storm were generated by Torres et al., 2018 [15] using the high resolution ADCIRC-SWAN models described above. The model was calibrated using the wave asymmetry and skewness parameter and resulted in a 6% mean relative error between simulated and measured subaerial eroded volumes from four cross-transects (beach profiles) where measurements were made shortly (within several days) before and after the storm. The model was then applied to predict the shoreline erosion for the 100-yr storm event.
The forcing for the event was based on the NACCS database with simulations performed using NAACS storm #457 as the 100-yr synthetic design storm (SDS). This SDS was selected based on the similitude of the return period of its water level and wave elevation to the NACCS-estimated 100-yr significant wave height and surge elevations, at the closest NACCS save points from the grid offshore boundary. The predicted median eroded volume was 46 m3/m for the entire barrier beach, in good agreement with FEMA’s estimates, based on their protocol [6] of 50 m3/m in their most recent Washington County FIS [1]. Model performance showed similar mean post-storm reductions in dune crest heights to those generated by FEMA. The model showed large spatial variations in along shore eroded volumes, with the highest values where breaching and surge channels developed and the lowest where healthy back dune vegetation was present. Model results were broadly consistent with the databased approach performed as part of an earlier study to estimate storm damage to structures in the study area under the Coastal Environmental Risk Index (CERI) initiative [10].
In the current study, the method outlined by Schambach et al., 2018 [18] was applied to the entire southern RI coastline (Figure 2, blue circle). Time series of water level and waves, necessary as input on the offshore boundary, were similarly based on the 100-yr SDS. Values of water elevations and wave spectral parameters were extracted at many NAACS save points to accurately define the energy spectra placed at the offshore boundary conditions of the computational grid. Four separate domains were used to accurately represent the study area. A JOint North Sea WAve Project (JONSWAP) wave energy spectrum was employed with a significant wave height varying between 23 to 29.5 ft (7 to 9 m) from Napatree Point, Westerly, to Point Judith, South Kingstown, RI, to capture the sheltering effect of Block Island on the southwestern RI shoreline.
The model-predicted changes in bathymetry and topography were then used to generate a revised (eroded) digital elevation model (DEM) that reflected the 100-yr storm event. The STWAVE model was then used, employing the revised DEM, to simulate the wave conditions in the flood inundated area. The offshore surge level boundary conditions for STWAVE were provided by simulations of the 100-yr storm event as noted above.

3. Results

The SDE maps (BFE maps with SLR) are shown separately for the Narragansett Bay and southern RI shoreline (South Coast) areas.
The division into two separate viewers was done for convenience in organizing the results and based on the different methods used in their generation, as described above. Each is presented separately below.

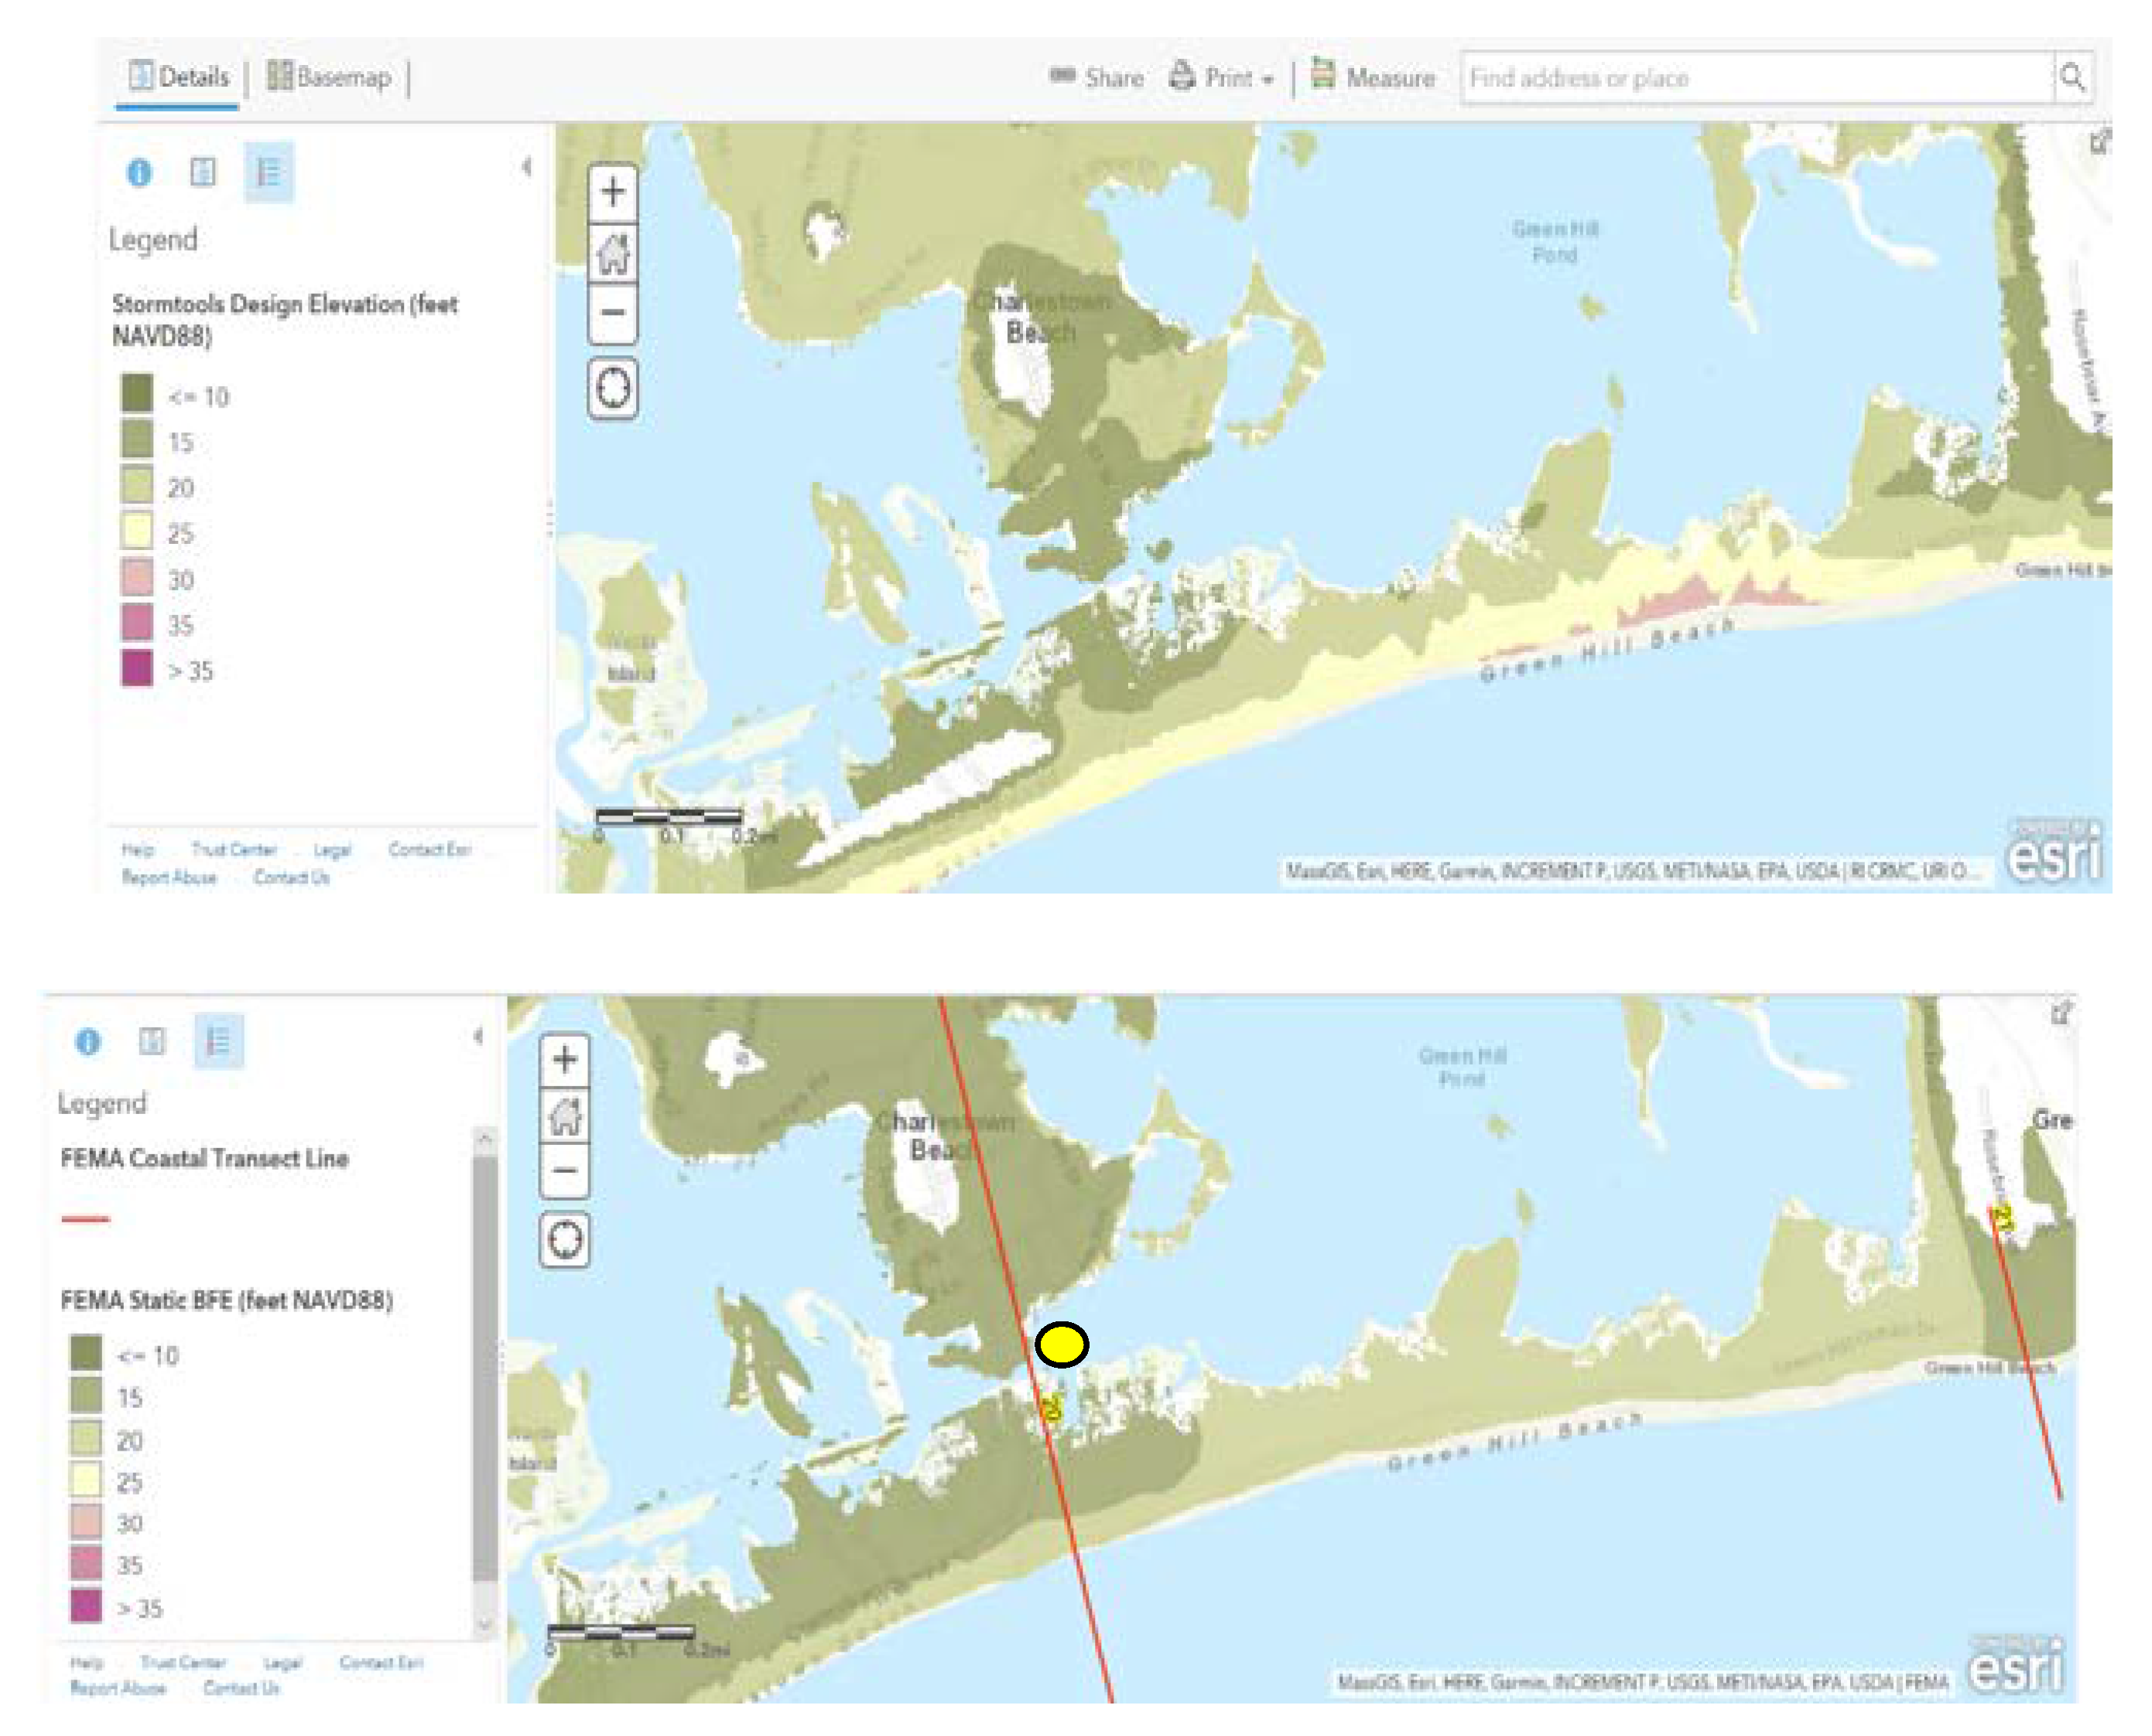
3.1. SDE Maps for South Coast, Southern RI Shoreline

Figure 5 shows the user interface for the SDE maps for the southern RI shoreline. The map selected in this case was 100-yr surge with no SLR (highlighted blue tab at the top left of the interface). BFE maps for this case are shown in the figure, as is the legend to the left. All water levels are provided in ft, referenced to NAVD88. The highest water levels in this case were immediately along the shoreline (about 30 ft) and decreased with distance inland, as offshore waves are dissipated by breaking and friction. Most of the wave dissipation occurred immediately offshore of the coastal dune system. BFE heights decreased rapidly with distance landward as a result of wave breaking and frictional dissipation. Frictional dissipation was highest in the presence of dune vegetation and more limited in its absence.
Figure 6 shows SDE maps for 0, 5 ft (1.5 m), and 10 ft (3 m) of SLR. Maps are available for 2 (0.6 m) and 7 (2.13 m) ft, but not shown here. These maps were assembled from individual images from the map viewer. In this case, the background map was based on the topographic map used in Figure 5. Background maps in the BFE map interface were user selected with six options (imagery, imagery with labels, streets, topography, and dark and light gray).
The 100-yr flooding map showed the expected increase in BFE due to SLR. The BFEs for the SLR cases reflected the increase due to the increase in surge depth plus the increase in the controlling wave height given the greater underlying surge depth.
To help gain insight into the maps, Figure 7 shows the surge inundation levels (upper panel) and associated wave heights (lower panel) for the no-SLR case. The sum of the two is the BFE shown in Figure 5.
The figure shows that the surge levels (upper panel) were approximately constant (14 ft, 4.3 m) along the coast and increased slightly with distance inland. The latter was due to local wind forcing over the flood inundated area. The lower panel shows the predicted wave heights for the same area. The waves were quite large (14 to 16 ft, 3.65 to 4.3 m) immediately along the coast and decreased very rapidly with distance inland, as the waves propagated over the dunes. Locations of breaches in the dune and the associated over-wash fans into the adjacent ponds were clearly evident. Wave heights on the backside of the coastal ponds were generally quite low (1.5 ft, 0.5 m) if the dunes remained intact. If the dunes were over-washed, the wave heights could increase to 6 ft (1.8 m).
The user had the ability to zoom into an area of interest, either by using the zoom feature or entering the street address or latitude-longitude of the location of interest. Figure 8 shows the 100-yr, no-SLR case for the Charlestown, RI, area, with Ninigret and Green Hill Ponds as the focus area. The map shows the flooding levels relative to NAVD88, while the insert highlights the ability to interrogate the map and determine the BFE at a location of interest; in this case the BFE was 17.0 ft (5.2 m).
The interface also allowed the user to compare and contrast the FEMA FIRMs and SDE maps. As an example, selecting the same area in Charlestown, RI, as shown in Figure 8 (see green oval in Figure 2 for its location along the coast), Figure 9 shows the SDE BFE map for this area in the upper panel and the FEMA FIRM BFE map in the lower panel. The FEMA BFE values were typically 0.9 to 1.3 m (3 to 4 ft) lower than the SDE maps. The FEMA maps also lacked the level of detail provided in the SDE maps. The unusual anomaly in the FEMA map (high water level) for Green Hill Pond was a result of the 1-D transect method used to generate the wave heights and its subsequent spatial interpolation to a 2-D map. (FEMA transect lines 20 and 21 shown in the figure. Results must be interpolated between these two transect lines.) A detailed presentation and discussion on the sources of the differences are provided in Spaulding et al., 2017 [7].
To highlight the utility of the interrogation tool, Table 2 provides a comparison of the SDE (no-SLR) to FEMA BFE and to the SDE estimates for various SLR values at the location of the Charlestown Breachway Bridge (yellow dot in Figure 9). SDE value (15.6 ft (4.75 m) = 13.5 ft surge and 0.8 ft wave) was predicted to be 3.6 ft (1.1 m) higher than FEMA estimate with no-SLR (12 ft, 3.65 m). (Note: FEMA maps round to the nearest whole number.) The impact of SLR raises the BFE by simply offsetting the flood inundation level but by also by increasing the wave height (e.g., for 10 ft (3.05 m) of SLR case water level was increased to 23.1 ft (7 m) and the wave height to 6.1 ft (2 m)). The values for other SLR cases are provided Table 2.
In addition to the information presented here (BFEs from the SDE maps, with varying SLR and FEMA FIRMs), we also included the option to access maps of FEMA-designated zones (V, A, LIMWA, and SFHA) (Figure 1) for both FEMA FIRMs and SDE maps, transects along which FEMA made wave estimates, the various components of the SDE BFE including both surge and wave crest height (see example in Table 2), and SDE-based water depths relative to local grade (this metric, depth of inundation, is different than BFEs, which are typically referenced to NAVD88).

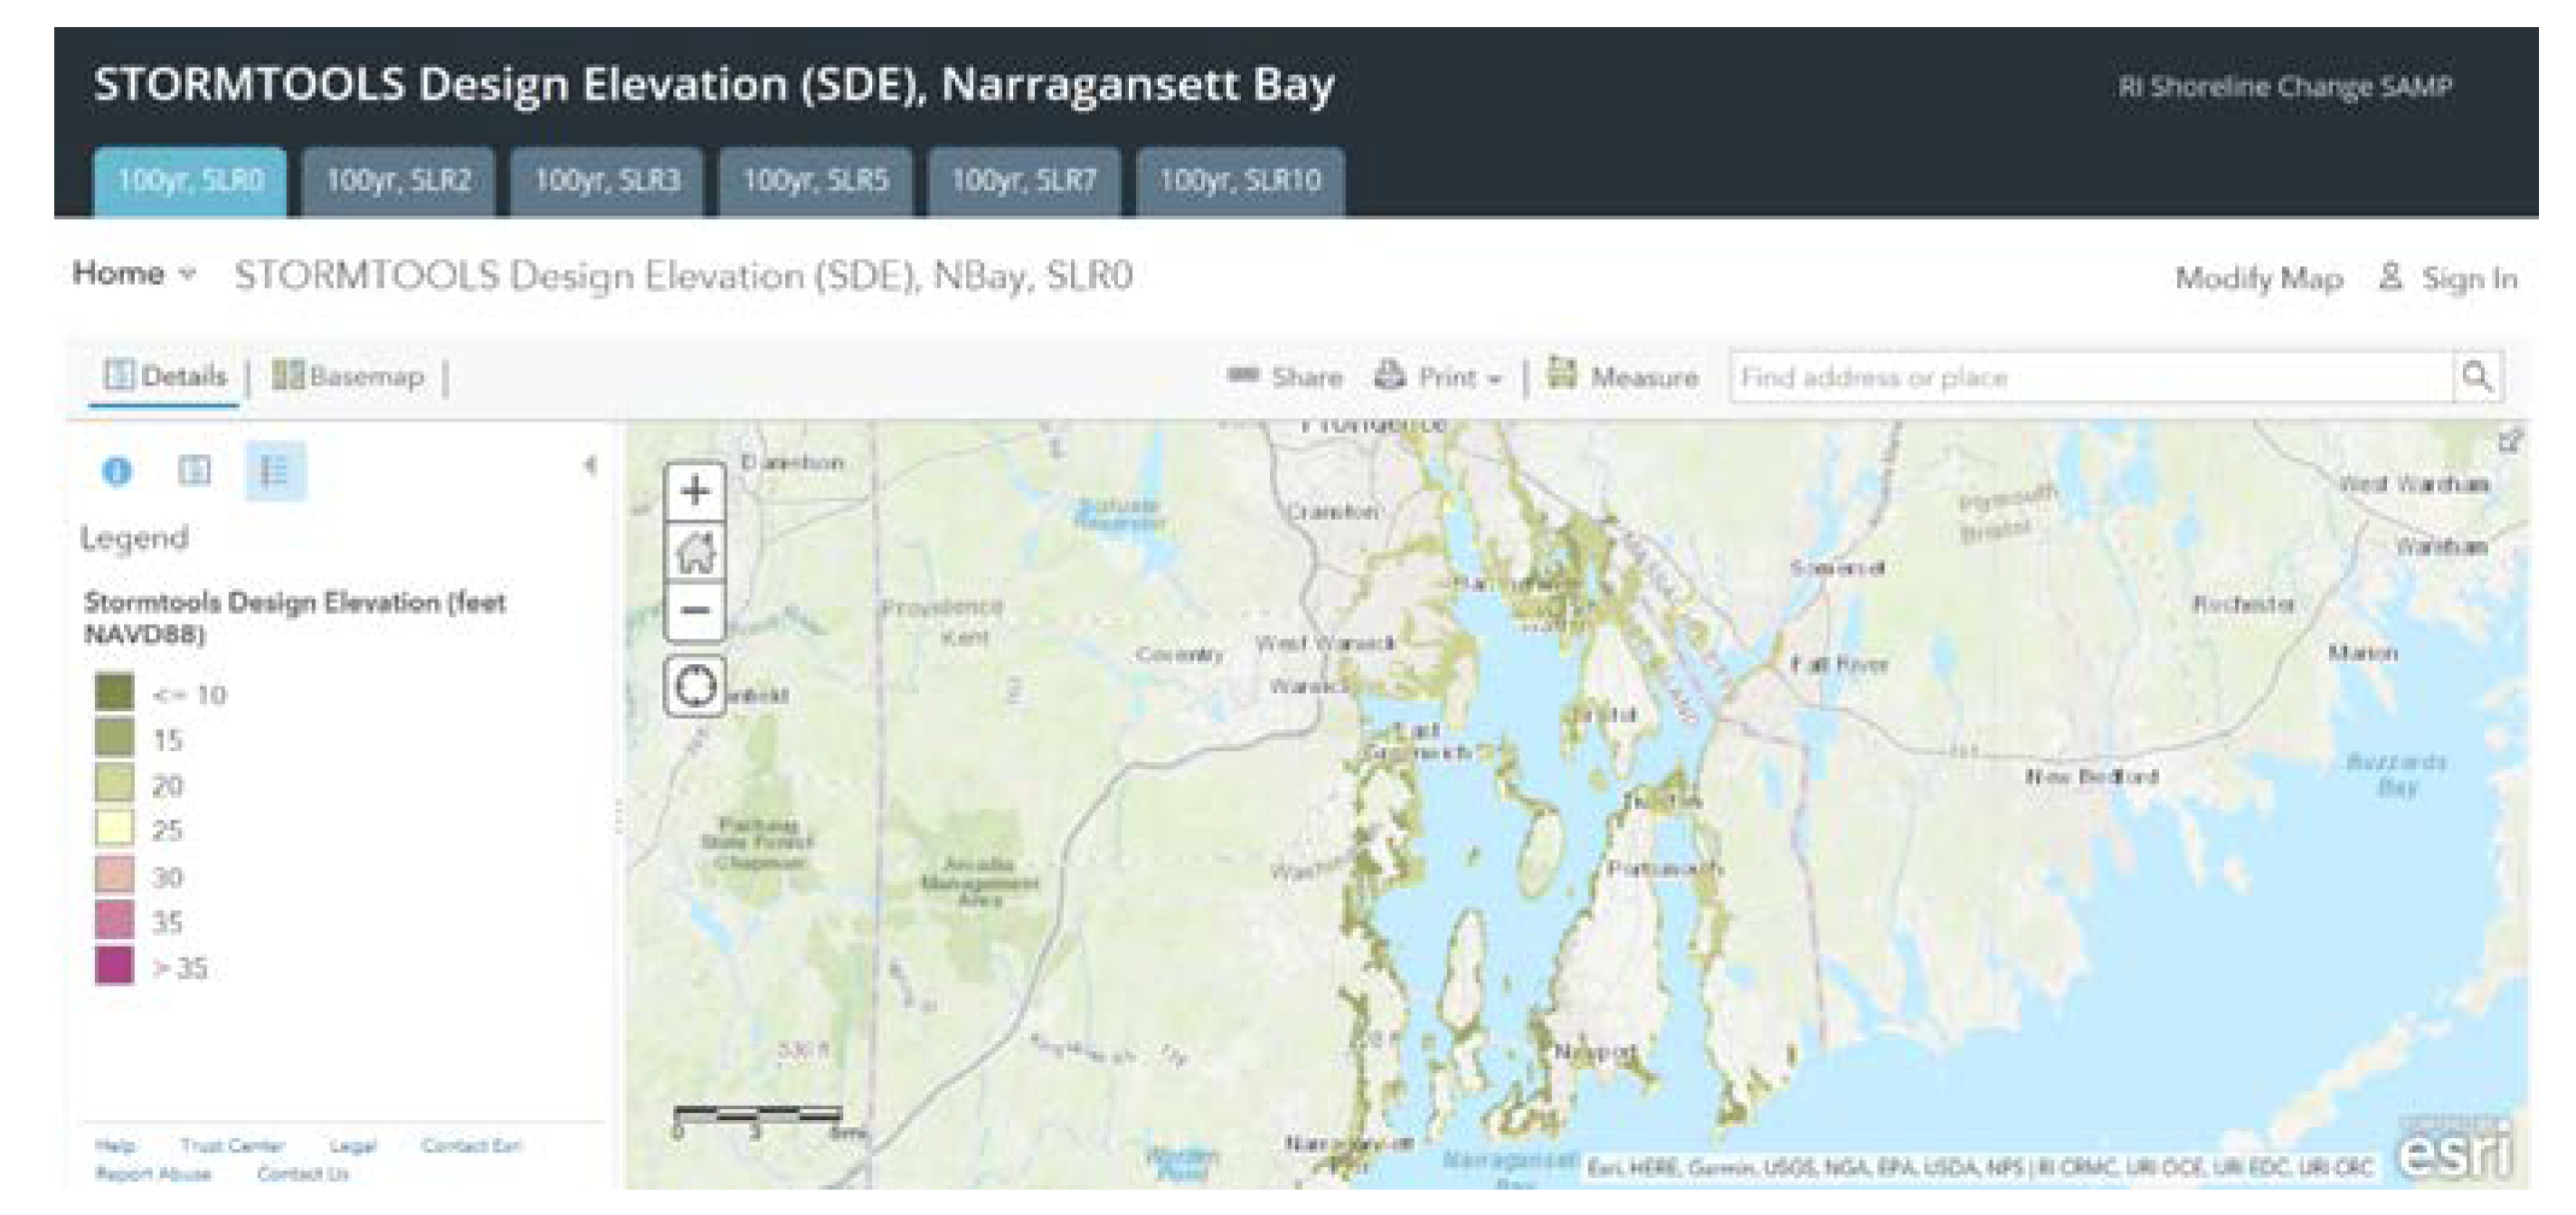
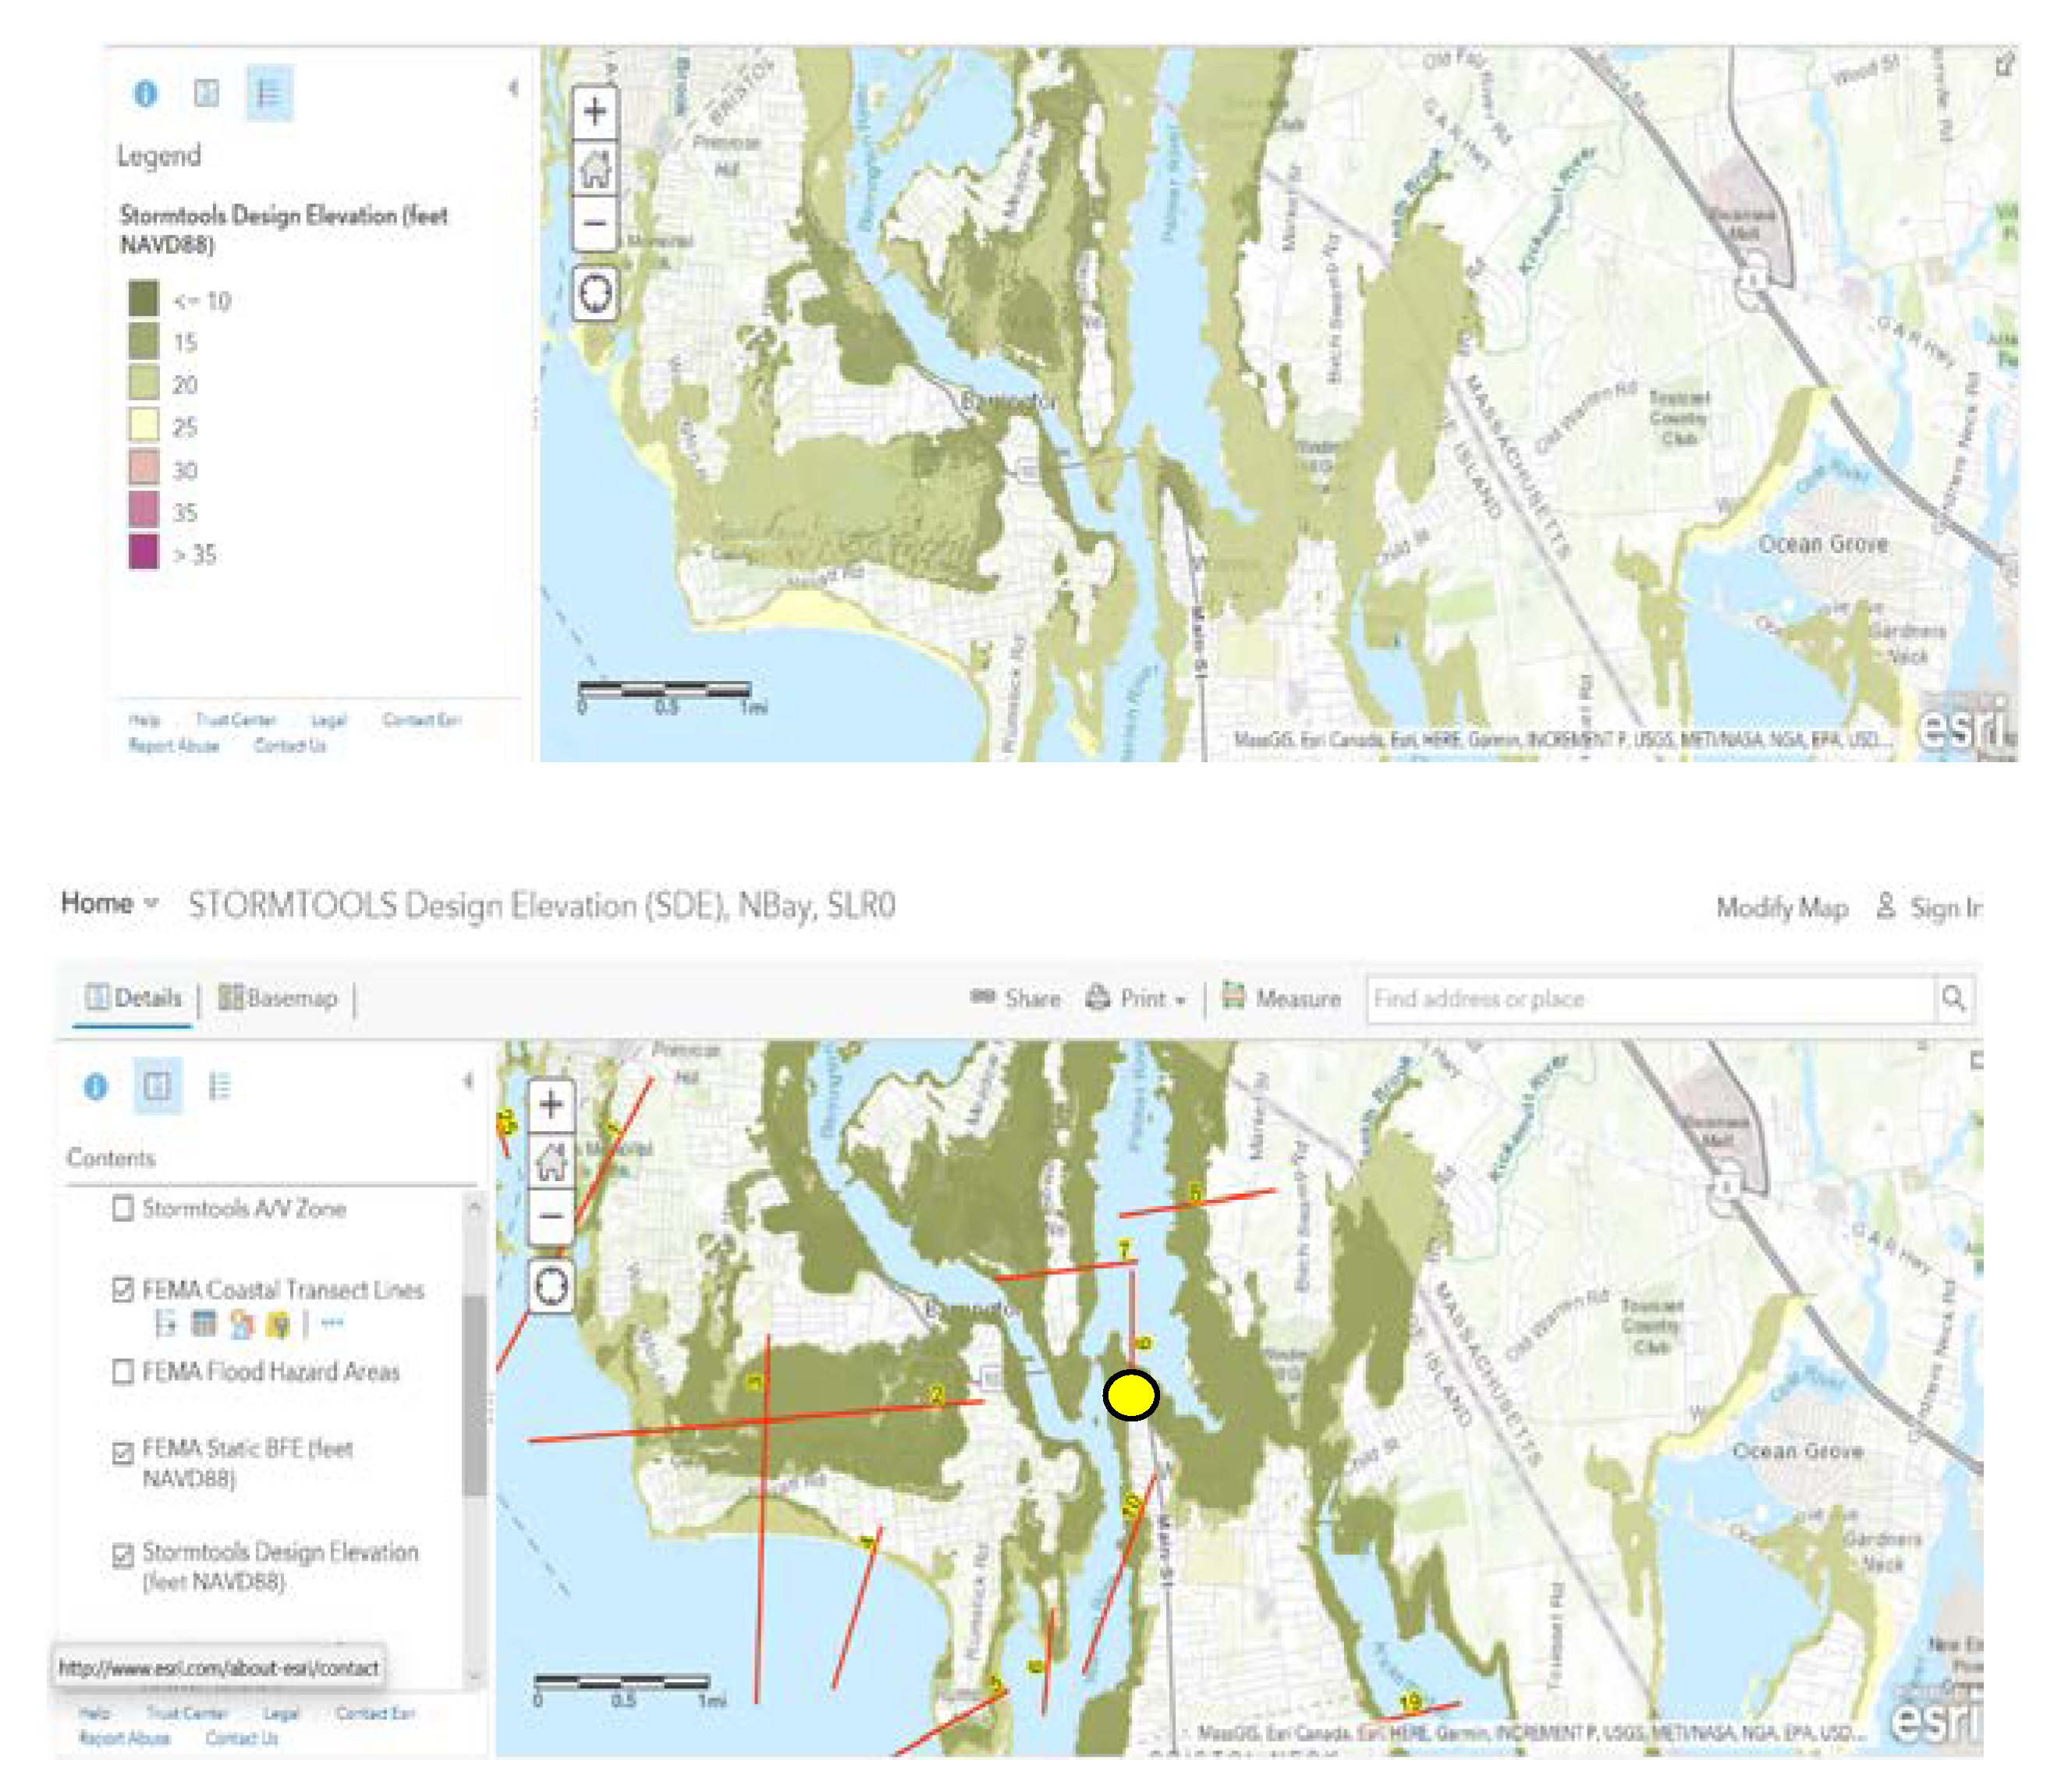
3.2. SDE Maps for Narragansett Bay

Provided below is a similar overview of the Narragansett Bay SDE maps that is comparable to that above for the South Coast.
Figure 10 shows the user interface for the SDE maps for Narragansett Bay. The map selected in this case was 100-yr surge with no SLR (highlighted blue tab at the top left of the interface). BFE maps for this case are shown in the figure, as is the legend to left. All water levels are provided in feet, referenced to NAVD88. The highest water levels in this case were found at the upper end of Narragansett Bay and were a result of the amplification of the surge height with distance up the bay (see Figure 4 as an example) [9]. Wave heights in the bay are generally quite limited, given the protected nature of the bay and limited fetch distances. The large waves at the mouth of the bay propagating from offshore (29.5 ft (9 m) significant wave height, 20-sec peak period) decrease quite rapidly in magnitude as they enter the east and west passages of lower Narragansett Bay. This transition from large offshore waves to much smaller fetch-limited local wind-generated waves was included in the STWAVE methodology used for modeling waves for the SDE maps.
Figure 11 shows SDE maps for 0, 5 (1.52 m) ft, and 10 ft (3.05 m) of SLR. Maps are available for 2 (0.61 m) and 7 (2.13 m) ft, but not shown here. These maps were assembled from individual images from the map viewer. The 100-yr flooding maps showed the expected increase in BFE due to SLR. The BFEs for the SLR cases reflected the increase, due to the increase in surge depth plus the increase in the controlling wave height given the greater underlying surge depth. The wave contribution was generally quite small in the bay, given the small wave heights.
To help gain insight into the maps, Figure 12 shows the surge inundation levels (upper panel) and associated wave heights (lower panel) for the no-SLR case. The sum of the two is the BFE shown in Figure 10.
The figure shows that the surge levels (upper panel) increased with distance up the bay from 13 ft (4 m) along the coast to about 18 ft (5.48 m) at the head of the bay, or an amplification of 1.38. This was consistent with the results of the application of the high-resolution hydrodynamic model to the bay shown in Figure 4a,b. Note there is little cross-bay variation in the amplification. The lower panel of Figure 12 shows the predicted wave heights for the same area. The waves were quite large at the mouth of the bay (10 ft, 3 m) but decreased as one moved northward in the bay with values typically of 3 ft (1 m) or lower. It is noted on southward-facing shorelines inside the bay that are exposed to long fetches along the east and west passages of Narragansett Bay, wave heights can reach 6 ft (1.8 m). Erosion at these locations was quite limited, given the low wave heights and limited length of shoreline exposed to the large waves.
Figure 13 shows the 100-yr, no-SLR case for the towns of Barrington, Warren, and Bristol as a focus area (Figure 2, yellow oval). This area was selected to provide a higher resolution view, given its very high density of structures (see Figure 2) subject to coastal flooding. The upper panel shows the flooding levels relative to NAVD88, while the lower panel highlights the ability to interrogate the map and determine the BFE at the location of interest; in this case the BFE was 14.7 (4.5 m) ft. A closer look at the map shows that the south-facing coastal areas, within the map window, had BFE amplitudes higher than those immediately landward. This was due to the largest wind fetch being along the central axis of the bay, with a wind direction toward the north.
The interface also allowed the user to compare and contrast the FEMA FIRMs and SDE maps. As an example, Figure 14 shows the SDE BFE map for this area in the upper panel and the FEMA FIRM BFE map with associated transect lines in the lower panel. The FEMA BFE values were typically 2 (0.6 m) to 3 (0.9 m) ft lower than SDE maps. The FEMA maps also lacked the level of detail provided in the SDE maps. A detailed presentation of the sources of the differences for this general location in the bay are provided in Spaulding et al., 2017 [8].
Table 2 shows a comparison of the FEMA BFE and the SDE with varying sea level rise (SLR) at end of the Route 103 Bridge, Warren, RI. The location is shown by the yellow circle in Figure 14 (lower panel). The SDE value for no-SLR is 15.6 ft (1.45 m) (14-ft surge elevation and 1.6-ft wave) compared to FEMA FIRM value of 12 ft (3.65 m). SDE values increased with increasing SLR, reaching a peak value of 27.6 ft (8.4 m) for the 10-ft (3-m) SLR case. The change in BFE was principally caused by the increase in surge from SLR with a very small change in wave height.

4. Conclusions

A state-of-the-art method to generate BFEs including the effects of SLR (SDE maps) was developed and applied to protected, low-lying coastal communities inside Narragansett Bay and to those along the wave-impacted, erosion-prone southern RI shoreline (South Coast). The approach implemented used FEMA-approved models and guidelines, but addressed weaknesses identified in the development of the FEMA FIRMS for the study area. The strategy to develop the maps was based on extensive state-of-the-art hydrodynamic and wave modeling studies performed as part of the US Army Corp of Engineers (ACOE) North Atlantic Coast Comprehensive Study (NACCS) simulations with a fully coupled high-resolution surge and wave model (ADCIRC-SWAN) with and without the effects of SLR. Application of XBeach to the southern RI coast line was next performed to determine the geomorphology of the eroded shoreline and dune system and then STWAVE was applied to the XBeach-modified topography to predict the impact of SLR on storm wave heights for areas along the southern RI shoreline. Use of XBeach, after extensive validation and sensitivity testing, dramatically increased the ability to provide high-resolution representation of the erosion and overtopping of the dune, to include the ability to delineate the locations of surge channels and associated over-wash fans in the presence of SLR. STWAVE was independently applied to predict wave conditions for Narragansett Bay with wave forcing at the open boundary from the NACCS. The underlying methodology and its application have been documented in the publications provided in the reference list by the authors. The approach taken in developing the maps was conservative in that the assumptions and decisions made in the mapping methodology were used to address the uncertainty in the predictions. The two most important assumptions were (1) the use of the upper 95% confidence level value for the surge water levels compared to FEMA’s approach, which uses the 50% confidence level, and (2) the assumption that linear superposition of SLR values on 100-yr surge can be used to represent surge levels in the presence of SLR. As shown in the paper, this was a conservative assumption since fully coupled simulations showed the surge level predicted by nonlinear methods gave values slightly lower than the linear superposition approach. To the authors’ knowledge, this is the first example of the development of BFE maps which explicitly considered the impact of SLR in the coastal waters and used state-of-the-art models.
The Narragansett Bay study area was impacted by the amplification of the 100-yr surge as it progressed up the bay (amplification of about 1.38, between Newport and Providence), but experienced relatively low wave heights (typically less than 3 ft (1 m)), given the protected location from offshore waves. Wave heights were largest when the fetch distances were greatest. This was observed on the south-facing portions of the coast, given that winds that give the largest wave heights come from the south. Sea level rise was shown to increase the 100-yr surge levels and slightly increase the wave heights. The methods employed here assumed that SLR had no additional impact on the surge level beyond raising the mean water level by the selected value of the SLR.
The southern RI coastline (South Coast) showed very little variation in the 100-yr surge height from Napatree Point to Point Judith. Wave heights were very large (23 to 33 ft (7 to 10 m), significant wave heights, 20-sec peak period) along this coastline as it borders on the open ocean with strong winds and unlimited fetch distances. The presence of the large waves resulted in substantial nearshore erosion with overtopping or breaching of the dunes and flooding of the adjacent coastal ponds, while large waves broke at the top of the eroded dune line and the decrease in dune height allowed waves with substantial heights to propagate into the adjacent ponds.

Author Contributions

Conceptualization: M.L.S.; methodology, M.L.S., A.G., R.H., and S.K.; software; A.G., C.D., S.K.; validation: A.G.: formal analysis, A.G.; resources, G.F.; data curation: C.D.; writing—original manuscript: M.L.S.; writing—review and editing- All; visualization: C.D.; supervision and project administration: M.L.S., A.G.; funding acquisition: M.L.S., G.F. All authors have read and agreed to the published version of the manuscript.

Funding

The development of SDE maps for the state of RI was supported by Housing and Urban Development (HUD), Hurricane Sandy Coastal Development Block Grant (CDBG) Disaster Recover–Catalog of Federal Domestic Assistance (CFDA) #14.269 (Grant #B-13-D5-49-0001) and administered through the State of Rhode Island, Executive Office of Commerce, Office of Housing and Community Development (OHCD).

Conflicts of Interest

The authors declare no conflict of interest. The funders had no role in the design of the study; in the collection, analyses, or interpretation of data; in the writing of the manuscript, or in the decision to publish the results.

Acronyms

ADCIRCADvanced CIRCulation model
ASCEAmerican Society of Civil Engineers
BCPBlind Control Points
BFEBase Flood Elevation
CERICoastal Environmental Risk Index
CIConfidence Interval
CRMCRI Coastal Resources Management Council
DEMDigital Elevation Model
ESRISupplier of Geographic Information System (GIS) software
FEMAFederal Emergency Management Agency
FIRMFlood Insurance Rate Maps
FISFlood Insurance Study
GISGeographic Information System
HUDHousing and Urban Development
JONSWAPJOint North Sea WAve Project
LLinear
LIDARLaser Imaging, Detection, and Ranging
LIMWAlimit of moderate wave action
MSLMean Sea Level
NACCSUSACE, North Atlantic Comprehensive Coastal Study
NAVD88North Atlantic Vertical Datum, 1988
NLNonlinear
NOAA NOSNational Ocean and Atmospheric Administration- National Ocean Survey
OIGOffice of Inspector General
OHCDOffice of Housing and Community Development
RI GISRhode Island- Geographic Information System
SFHASpecial Flood Hazard Area
SDESTORMTOOLS Design Elevation maps
SDSSynthetic Design Storm
SLRSea Level Rise
STWAVESTeady state spectral WAVE model
SWELStill water elevation level
STORMTOOLStools in support of storm analysis
SWANSimulating WAves Nearshore
URIUniversity of Rhode Island
USACEUS Army Corp of Engineers
WLwater level
XBeachnearshore wave and geomorphological model

References

  1. FEMA. Flood Insurance Study, Washington County, RI, FEMA Flood Insurance Study Number 44009CV001B; FEMA: Washington, DC, USA, 2012.
  2. ASCE. Minimum Design Loads and Associated Criteria for Buildings and Other Structures, ASCE /SEI 7-16; ASCE: Reston, VA, USA, 2017; ISBN 978-0-7844-7996-4. [Google Scholar]
  3. Office of Inspector General (OIG). FEMA Needs to Improve Management of Its Mapping Program; Report OIG-17-110; Department of Homeland Security: Washington, DC, USA, 27 September 2017.
  4. NRC. Mapping the Zone: Improving Flood Map Accuracy; Committee on FEMA Flood Maps; Board on Earth Sciences and Resources/Mapping Science Committee; National Research Council; National Academies Press: Washington, DC, USA, 2009; ISBN 978-0-309-13057-8.
  5. FEMA Approved Models. Available online: https://www.fema.gov/coastal-numerical-models-meeting-minimum-requirement-national-flood-insurance-program (accessed on 17 January 2017).
  6. Federal Emergency Management Agency (FEMA). Atlantic Ocean and Gulf of Mexico Coastal Guidelines Update; FEMA: Washington, DC, USA, 2007.
  7. Spaulding, M.; Grilli, A.; Damon, C.; Fugate, G.; Oakley, B.A.; Isaji, T.; Schambach, L. Application of state of art modeling techniques to predict flooding and waves for an exposed coastal area. J. Mar. Sci. Eng. 2017, 5, 10. [Google Scholar] [CrossRef] [Green Version]
  8. Spaulding, M.; Grilli, A.; Damon, C.; Fugate, G.; Isaji, T.; Schambach, L. Application of state of art modeling techniques to predict flooding and waves for coastal area with a protected bay. J. Mar. Sci. Eng. 2017, 5, 10. [Google Scholar] [CrossRef] [Green Version]
  9. Spaulding, M.L.; Isaji, T.; Damon, C.; Fugate, G. Application of STORMTOOLS’s simplified flood inundation model, with and without sea level rise, to RI coastal waters. In Proceedings of the ASCE Solutions to Coastal Disasters Conference, Boston, MA, USA, 9–11 September 2015. [Google Scholar]
  10. Spaulding, M.L.; Grilli, A.; Damon, C.; Crean, T.; Fugate, G.; Oakley, B.A.; Stempel, P. STORMTOOLS: Coastal Environmental Risk Index (CERI). J. Mar. Sci. Eng. 2016, 4, 54. [Google Scholar] [CrossRef] [Green Version]
  11. Spaulding, M.L.; Grilli, A.; Damon, C.; Crean, T.; Fugate, G. Developing the RI Coastal Environmental Risk Index (CERI) to Inform State and Local Planning and Decision Making: Application to the Communities along the Southern RI Shoreline; Report Prepared on Behalf of the RI; Coastal Resources Management Council: South Kingstown, RI, USA, 2019.
  12. Grilli, A.; Spaulding, M.L.; Damon, C.; Becker, A.; Menendez, J.; Stempel, P.; Crean, T.; Fugate, G. Application of the Coastal Environmental Risk Index (CERI) to Barrington, Bristol, and Warren, RI; Report Prepared for RI; Coastal Resources Management Council: South Kingstown, RI, USA, 2018.
  13. Cialone, M.A.; Massey, T.C.; Anderson, M.E.; Grzegorzewski, A.S.; Jensen, R.E.; Cialone, A.; Mark, D.J.; Pevey, K.C.; Gunkel, B.L.; McAlpin, T.O.; et al. North Atlantic Coast Comprehensive Study (NACCS) Coastal Storm Model Simulations: Waves and Water Levels; MS 39180-6199, Report: ERDC/CHL TR-15-44; Coastal and Hydraulics Laboratory U.S. Army Engineer Research and Development Center: Vicksburg, MS, USA, August 2015. [Google Scholar]
  14. Zervas, C. Extreme Water Levels of the United States, 1893–2010; NOAA Technical Report NOS CO-OPS 067; NOAA National Ocean Survey: Washington, DC, USA, 2013.
  15. Torres, M.; Hashemi, R.; Hayward, S.; Spaulding, M.; Ginis, I.; Grilli, S. The role of hurricane wind models in accurate simulations of storm surge and waves. ASCE J. Waterw. Port Coast. Ocean Eng. 2019, 145, 04018039. [Google Scholar] [CrossRef]
  16. Smith, J.M.; Sherlock, A.R.; Resio, D.T. STWAVE: Steady-State Wave Model User’s Manual for STWAVE, Version 3.0; ERDC/CHL SR-01-01; U.S. Army Engineering Research and Development Center: Vicksburg, MS, USA, 2001. [Google Scholar]
  17. Massey, T.C.; Anderson, M.E.; McKee-Smith, J.; Gomez, J.; Rusty, J. STWAVE: Steady State Spectral Wave Model. User’s Manual for STWAVE, Version 6.0; US Army Corp of Engineers, Environmental Research and Development Center: Vicksburg, MI, USA, 2011. [Google Scholar]
  18. Schambach, L.; Grilli, A.; Grilli, S.; Hashemi, R.; King, J.W. Assessing the impact of extreme storms on barrier beaches along the Atlantic coastline: Application to southern Rhode Island coast. Coast. Eng. 2018, 133, 26–42. [Google Scholar] [CrossRef]
  19. Sallenger, A.H. Storm impact scale for barrier islands. J. Coast. Res. 2000, 16, 890–895, ISSN 0749-0208. [Google Scholar]
  20. Harter, C.F.; Figlus, J. Numerical modeling of the morphodynamics of low lying barrier island beach and foredune system inundated during Hurricane Ike, using XBeach and CSHORE. Coast. Eng. 2017, 120, 64–74. [Google Scholar] [CrossRef]
  21. Grilli, A.; Spaulding, M.L.; Oakley, B.A.; Damon, C. Mapping the coastal risk for the next century, including sea level rise and changes in the coastline: Application to Charlestown RI, USA. Nat. Hazards 2017, 88, 389–414. [Google Scholar] [CrossRef]
  22. Al Naser, N.; Grilli, A.; Grilli, S.; Baxter, C.; Bradshaw, A.; Maggi, B. Land use and mitigation effects on barrier beach erosion in storms: Case study in Rhode Island. Coast. Eng. Proc. 2018, 108. [Google Scholar] [CrossRef]
Figure 1. FEMA flood zone map definitions. Dashed red line is the 1% inundation level and the dashed blue line is the base flood elevation (BFE). These can be referenced to as either grade elevation or NAVD88 benchmarks. Zone definitions are provided at the top of the figure (VE, AE, LIMWA, and X). (http://www.r3coastal.com/home/coastal-hazard-analysis-mapping/coastal-flood-hazard-mapping, accessed on 11 February 2020). (Definition of the flood zones are provided at https://www.fema.gov/flood-zones, accessed on 16 April 2020.)
Jmse 08 00292 g001
Figure 2. Density of structures inundated with 100-yr storm surge plus 7 ft (2.1 m) sea level rise (SLR) for Narragansett Bay, RI, and the southern coast of RI based on STORMTOOLS. The red and blue ovals show the Narragansett Bay and southern RI shoreline study areas, respectively. The green oval shows the location of Charlestown, RI, and the yellow oval the towns of Barrington, Warren and Bristol, RI. study areas (http://www.beachsamp.org/wpcontent/uploads/2016/11/Map_SLR7_100YR_Edited_11_15.jpg, accessed, 26 October 2017).
Jmse 08 00292 g002
Figure 3. (a) Water level vs. time for NACCS storm #492 at Providence, Newport, and Charlestown, RI; (b) ADCIRC-SWAN-predicted water level vs. time for NACCS storm #492 at Newport without sea level rise (SLR), with 6.6 ft (2 m) of SLR simply added on, and with 2-m SLR added to the initial bathymetry and simulations run with the full model, (c) same as in (b) but at the Providence station; and (d) results of linear (superposition) and nonlinear simulation at Charlestown.
Jmse 08 00292 g003
Figure 4. Peak water level for NACCS storm #492 for Narragansett Bay for (a) linear superposition method, (b) full nonlinear simulation results, and (c) percent (%) difference between the two for 6.6-ft (2-m) SLR.
Jmse 08 00292 g004
Figure 5. User interface for the STORMTOOLS Design Elevation (SDE) Maps, southern RI coast line (South Coast), no SLR. The case selected was the 100-yr event with no SLR. Blue star, Napatree Point, Westerly, and red star, Point Judith, South Kingstown. The units on the tab are in ft of SLR. (https://crc-uri.maps.arcgis.com/apps/MapSeries/index.html?appid=3ba5c4d9c0744392bec2f4afb6ee228. Accessed on 16 October 2018).
Jmse 08 00292 g005
Figure 6. Impact of SLR on Narragansett Bay SDE maps, cases shown are 0, 5 ft, and 10 ft (0, 1.5, and 3 m) (upper, middle, and lower panels, respectively, note highlighted tab) SLR. (Note that the background map in these figures used the topographic map shown earlier. Background maps were user selected.).
Jmse 08 00292 g006
Figure 7. Surge inundation levels (relative to NAVD88) (upper panel) and the wave crest height (lower panel) for southern coast of RI for 100-yr, no-SLR case.
Jmse 08 00292 g007
Figure 8. Flooding in Charlestown, RI, (see green oval in Figure 2) in the vicinity of Ninigret and Green Hill Ponds for 100-yr, no-SLR case. The insert shows the ability of the point interrogation tool to determine the BFE at the user location selected.
Jmse 08 00292 g008
Figure 9. Comparison of SDE (upper panel) vs. FEMA FIRM (lower panel) BFE maps for the 100-yr, no-SLR case. Yellow dot indicates the location of the comparative analysis shown in Table 2.
Jmse 08 00292 g009
Figure 10. User interface for the STORMTOOLS Design Elevation Maps, Narragansett Bay. The case selected was the 100-yr event with no SLR. (https://crc-uri.maps.arcgis.com/apps/MapSeries/index.html?appid=9b85db9b7aaa400cac1a3cb404a96be8, accessed on 16 October 2018).
Jmse 08 00292 g010
Figure 11. Impact of SLR on Narragansett Bay SDE maps, cases shown are 0, 5 ft (1.52 m), and 10 ft (3.05 m) SLR (upper, middle, and lower panel, respectively.
Jmse 08 00292 g011
Figure 12. Surge inundation levels (relative to NAVD88) (upper panel) and the wave crest height (lower panel) for Narragansett Bay for 100-yr, no-SLR case.
Jmse 08 00292 g012
Figure 13. Flooding in the vicinity of Barrington, Warren, and Bristol, RI, for 100-yr, no-SLR case. The point interrogation tool was used to determine the BFE at the location selected.
Jmse 08 00292 g013
Figure 14. Comparison of SDE (upper panel) vs. FEMA (lower panel) BFE maps for the 100-yr, no-SLR case. The FEMA transect lines are shown in the FIRM maps.
Jmse 08 00292 g014
Table 1. Maximum water level at Newport and Providence from NACCS storm #492 for the save point closest to these locations (NACCS save point #8741-Newport, #10395-Providence) based on the original simulations, as a result of the application of ADCIRC-SWAN high-resolution model (Torres et al., 2018) [15] without SLR, with 2-m SLR simply added, and with 2-m SLR added to the initial bathymetry and nonlinear simulations performed.
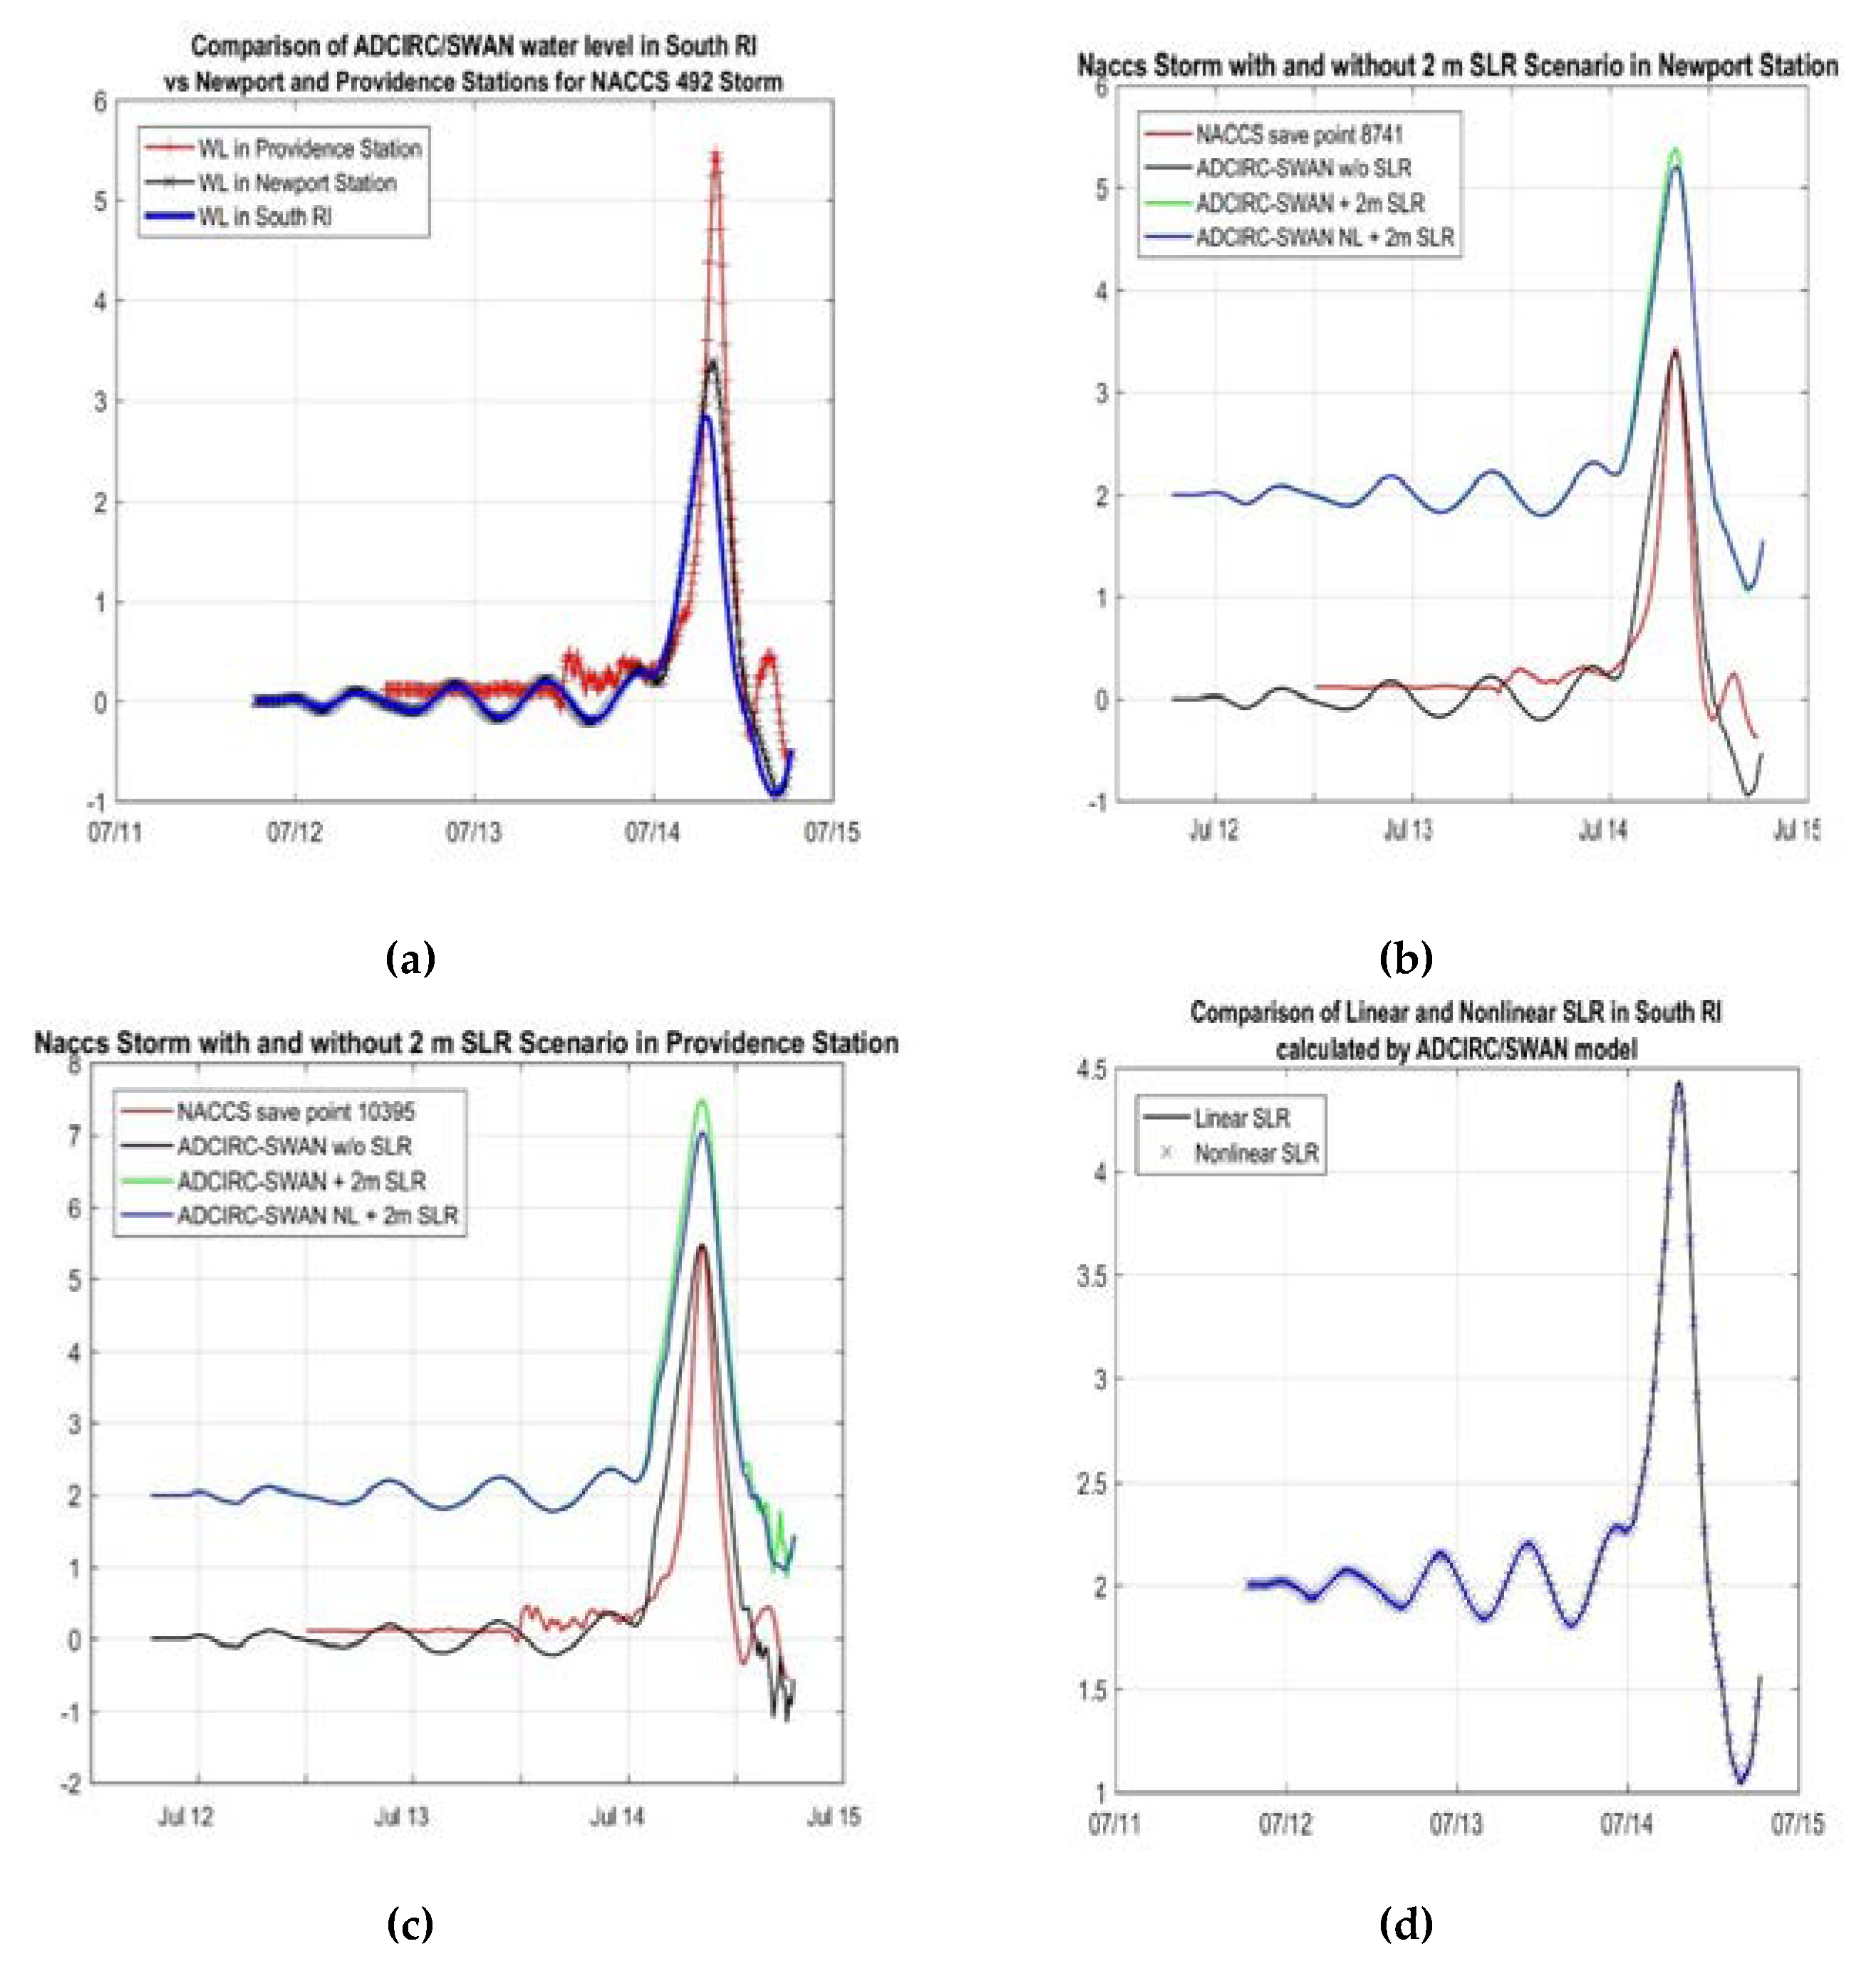
Max Water Elevation (m)
NACCS at Save Point
8741/10395
ADCIRC-SWAN w/o SLRADCIRC_SWAN + 2m SLRADCIRC_SWAN Non-Linear with 2m SLR
Newport3.433.385.385.21
Providence5.465.487.487.05
Table 2. Comparison of surge depth, wave height, and SDE values (ft, m) at two selected locations vs. 1% water level with sea level rise (SLR).
Location:Rte 103 Bridge Charlestown Breachway Bridge
Warren, RI Charlestown, RI
Surge*WaveBFE*BFE*Surge*WaveBFE*BFE*
(ft)Height(ft)(m)(ft)Height(ft)(m)
(ft) (ft)
FEMA FIRM 123.66 144.27
SDE 0 SLR14.31.615.94.8513.40.614.04.27
SDE 2 SLR16.51.818.35.5815.51.717.25.24
SDE 3 SLR17.71.218.95.7616.42.118.55.64
SDE 5 SLR18.92.221.16.4318.43.321.76.61
SDE 7 SLR20.72.623.37.120.54.525.07.62
SDE 10 SLR23.93.026.98.223.46.129.58.99
* Referenced to NAVD88.

