Article

Relationship between the Persian Gulf Sea-Level Fluctuations and Meteorological Forcing

by
Naghmeh Afshar-Kaveh
1,*,
Mostafa Nazarali
2 and
Charitha Pattiaratchi
3
1
School of Civil Engineering, Iran University of science and technology, Tehran 16846-13114, Iran
2
Department of Coastal Engineering, Pouya Tarh Pars Consulting Engineers Company, Tehran 14376-15613, Iran
3
Oceans Graduate School & the UWA Oceans Institute, The University of Western Australia, Perth 6009, Australia
*
Author to whom correspondence should be addressed.
J. Mar. Sci. Eng. 2020, 8(4), 285; https://doi.org/10.3390/jmse8040285
Submission received: 14 February 2020 / Revised: 31 March 2020 / Accepted: 13 April 2020 / Published: 16 April 2020
(This article belongs to the Section Physical Oceanography)

Abstract

:
Sea-level data from six tide gauge stations along the northern coast of the Persian Gulf were analyzed both in time and frequency domain to evaluate meteorological forcing. Spectral analyses indicated that mixed, predominantly semi-diurnal tides were dominant at all stations, but low-frequency fluctuations correlated well with atmospheric pressure and wind components. Non-tidal sea-level fluctuations up to 0.75 m were observed along the northern coasts of the Gulf due to the combined action of lower atmospheric pressure and cross-shore wind. Coherency between low-frequency sea-level records and mean sea-level pressure indicated that the latter usually leads to sea-level fluctuations between 1 and 6.4 days. In contrast, the same analysis on the wind velocity and sea level revealed that the former lags between 3 and 13 days. The effect of wind stress on coastal sea-level variations was higher compared with the effect of atmospheric pressure. Concurrent analysis of low-pass-filtered sea-level records proved that the non-tidal wave moves from west to east along the northern coasts of the Persian Gulf.

1. Introduction

Coastal regions experience sea-level fluctuations occurring over different time scales from seconds to centuries. Globally, astronomical forces of the Sun and the Moon result in tidal variability with periods of 12 and 24 h as well as tidal modulations with periods up to 18.6 years [1,2]. In many regions, the effects of the tides dominate the water-level variability. However, in regions where the tidal effects are smaller, other processes, such as atmospheric forcing, are important for determining the local water level. The relative importance of air pressure and winds in sea-level variability depends on the location and time scale [3]. The sea surface will rise in response to a drop in local air pressure, and vice versa, which is called the local inverse barometer (LIB). In the ideal LIB model a rise/fall of 1 mbar in air pressure results in a fall/rise of 1 cm in sea level [1]. However, this isostatic condition rarely applies to coastal seas [4]. In addition, atmospheric pressure is not the only meteorological forcing responsible for sea-level variability. Winds blowing over the shallow waters result in wind set-up/set-down.
Sea-level variability (SLV) in response to wind and atmospheric pressure change has been extensively studied for different water bodies around the world [5,6,7]. They are considered to be meso-scale phenomena both temporally and spatially [8]. In these studies, observed records of sea-level fluctuations were compared with atmospheric pressure and wind observations both in time and frequency domains. In contrast, some authors employed soft computing methods [9,10] or ocean circulation models [11,12,13] to investigate the relationship between meteorological forces and the sea-level fluctuations.
However, these types of sea-level fluctuations due to atmospheric forcing have received less attention in the Persian Gulf. Although occurrences of tropical cyclones have never been recorded in the Persian Gulf, there may be such events in the future associated with global warming [14]. One of the most recent destructive events in the region was recorded on 19 March 2017. This was a meteorological tsunami [15] that hit the shorelines of Dayyer coastal city along the northern coast of the Gulf [16]. During this event, the maximum run-up of 3 m and inundation of about one kilometer resulted in five people dying.
Atmospheric processes that generate SLV encompass a variety of temporal and spatial scales, and their contribution to sea-level extremes may vary spatially and temporally. The response of sea level to meteorological forces can be described by means of depth-integrated equations of motions. The change in sea level, Δ η, in response to an atmospheric pressure change Δ P a and wind can be written as:
Δ η = Δ P a ρ g
Δ η Δ y = τ y ρ g ( η + h )
where Pa is atmospheric pressure, τy is wind stress, ρ and g are seawater density and gravitational acceleration, respectively. h is the water depth.
In this paper, we examine the SLV along the northern coasts of the Persian Gulf, with the aim of identifying the contribution of atmospheric pressure and wind to low-frequency sea-level fluctuations. Sea-level data from 6 tide gauges along the northern Persian Gulf coasts were used to evaluate different types of sea-level fluctuations in the region. In addition, frequency analysis on the meteorological forces, including atmospheric pressure, and wind velocity components are presented in this paper. The coherency between these forces is also described both in time and frequency domains.

2. Materials and Methods

2.1. Study Area

The study area is the Persian Gulf, a semi-enclosed basin with the maximum depth of 90 m and area of 251,000 km2. This Gulf is connected to the Gulf of Oman in the east by the Strait of Hormuz. The sea-level data were available at 6 stations along the northern coast of the Persian Gulf (Figure 1). Some of these stations are operated by the National Cartographic Center of Iran and the others were installed during temporary projects by Port and Maritime Organization of Iran. The sampling interval of sea-level observations at Kangan and Bushehr was 30 min and 10 min in others (Table 1). The mean tidal range varied from 1.5 m in Bushehr to 0.9 m in Javad al-Aemmeh. The maximum tidal range (difference between the highest and the lowest astronomical tide) at these stations were 3.26 m and 1.65 m, respectively.

2.2. Data Sources

Data on atmospheric parameters including winds (speed and direction) and Mean Sea-Level Pressure (MSLP) were obtained from two sources: (1) coastal meteorology stations [17]; and, (2) global weather prediction model, European Center for Medium-Range Weather Forecasts (ECMWF) [18]. In this study, the latter set were chosen for further analysis. This was because location of coastal meteorology stations (Figure 1) were far away from the tide gauge stations. Also, the sampling interval at these stations was three hours with many gaps in the records and were located inland. The ECMWF ERA5 data set were available at hourly intervals over a 0.25° grid. Although these data may underestimate some peak values due to the temporal and spatial averaging. Comparison between ERA5 and meteorology station wind speeds indicated that for both wind components at all stations, the mean correlation coefficient was 0.68. The Root Mean Square Error (RMSE) in these stations were between 2 and 2.75 ms−1. The same comparisons were performed for MSLP data of ERA5 and meteorology stations and the mean correlation coefficient and RMSE at the stations were 0.99 and 0.6 hPa, respectively.
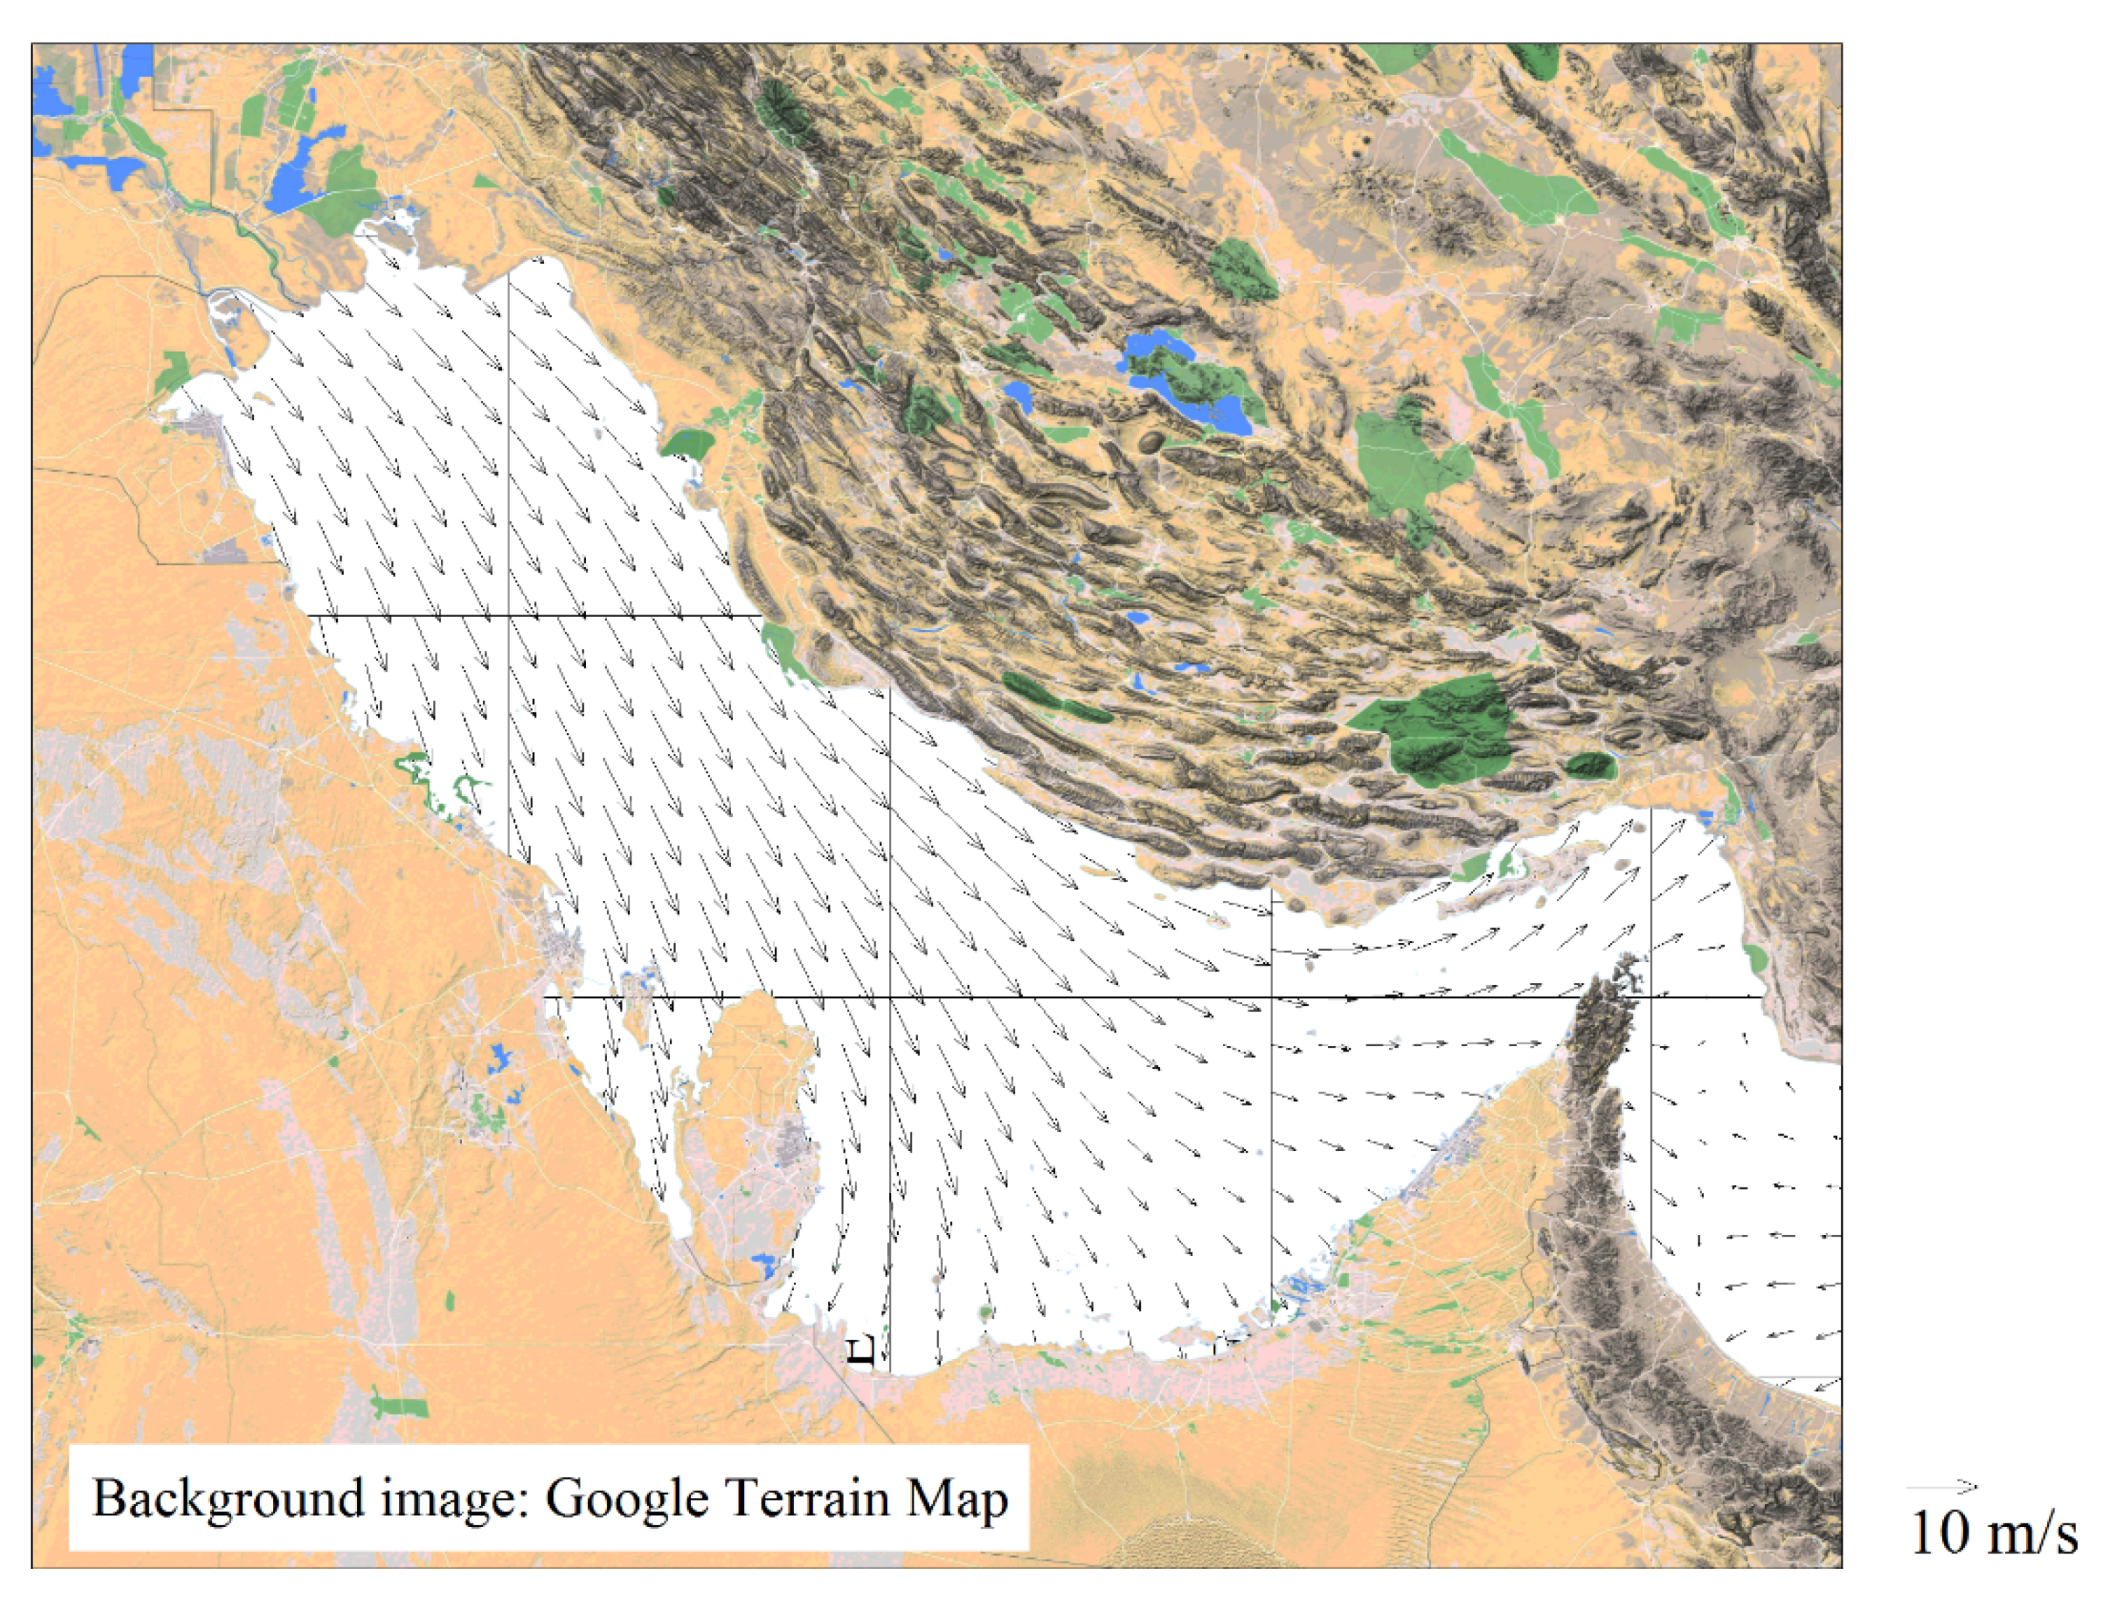
The dominant wind in the Persian Gulf is the Shamal wind, a north-westerly wind that blows most of the time and change its direction while moving to the east [19]. A snapshot of a Shamal wind event affecting the whole Persian Gulf on 22 January 2010 is shown in Figure 2. The background of this image shows the terrain map of the land surrounding the Persian Gulf. It is clear that the wind aligns itself parallel to the longitudinal axis of the Gulf. As is shown on this image, moving from the west toward east, the wind vectors propagate parallel to the mountains that are mainly located along the northern part of the Gulf. The second important wind in this region is called Kaus (Sharqi) wind, which blows from southeast. The frequency of occurrence of Kaus winds is lower than Shamal winds, but their maximum wind speed is higher. Overall, the percentage of calm wind (wind speed < 2 ms−1) is between 12.5% and 51% at different stations along northern coasts of the Gulf and the maximum wind speed is ~14.5 ms−1. Due to presence of high mountains along most of the northern coasts, the winds change their direction to be parallel to the mountains. In contrast, along the flat coastal regions, which are presented along the southern part of the Persian Gulf, cross-shore wind could be observed clearly.
The MSLP in the study region varied between 989.7 hPa (summer) and 1028.0 hPa (winter) with a mean of 1008.6 hPa. The highest decrease of MSLP during a week was 15 hPa that coincided with the passage of weather fronts over the Persian Gulf (Figure 3).

3. Results

In this paper, we are going to focus on the contribution of atmospheric forcing on the sea-level variations within Persian Gulf. Therefore, at the first step, the behavior of atmospheric forcing and sea-level records were studied separately. Then the combined relationship between these parameters was examined.

3.1. Spectral Analysis

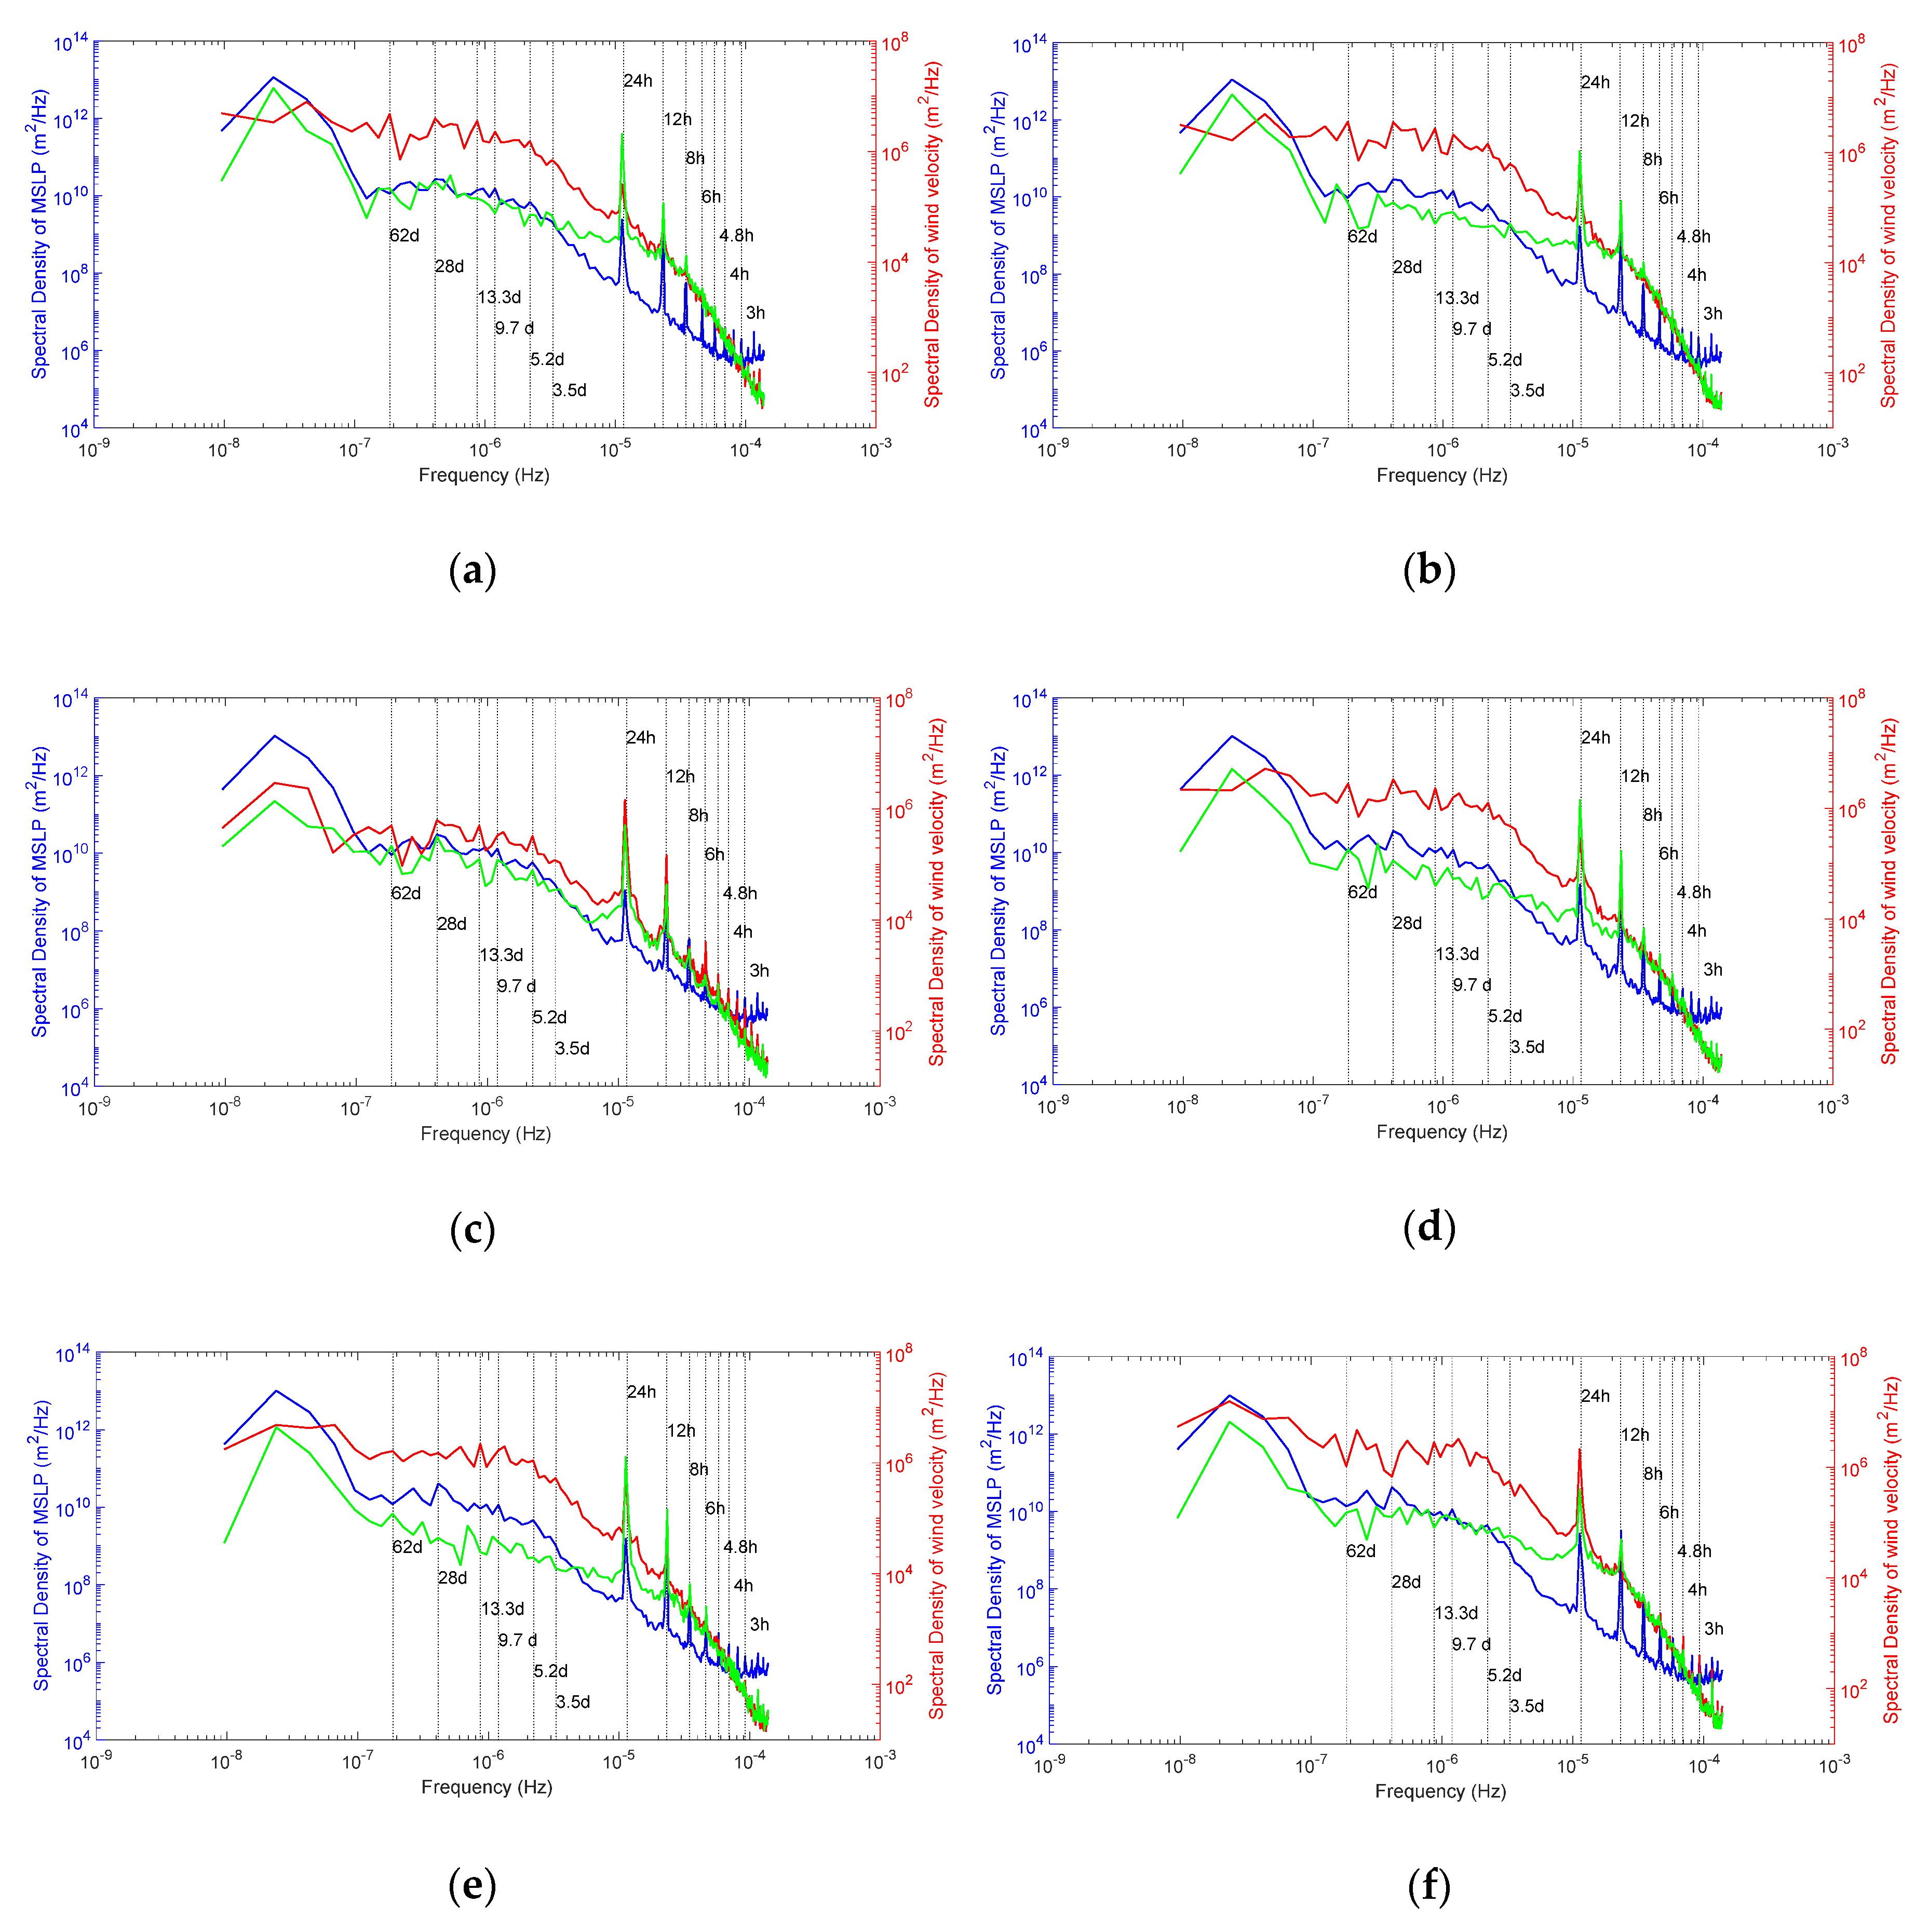
Before investigation on the periodicity of wind, the hourly winds vector data were decomposed into the major and minor components [20]. The principal axis of wind velocity in all stations was parallel to the shoreline, along the longitudinal axis of the Persian Gulf. Therefore, the major component is the along-shore wind velocity component while the minor one is the cross-shore wind velocity component. It must be emphasized that both along-shore and cross-shore wind velocity components could affect sea-level height at the coastal regions. The contribution of cross-shore component was described by Equation (2). The energy spectrum of the wind velocity components was calculated for each station (Figure 4). The analysis of wind velocity variations for time scales ranging from 2 h to one year, indicated periodicity in some frequencies. The highest peaks in the spectrum corresponded to 24 h, representing sea breezes activity [21]. A complementary spectral peak occurs at the first harmonic of the diurnal frequency, period of 12 h, which is due to the occurrence of land breezes. A large amount of energy is present at the low-frequency part of the spectrum whose periods are longer than 3.5 days. These frequencies corresponded to the time scale of synoptic weather patterns. At low frequency range, the major wind velocity component exhibited several peaks at periods 3.5, 5.2, 9.7, 13.3, 28, and 62 days. The minor wind velocity component also has the same energy level in low frequency band to the major wind component.
Similarly, the same energy peaks at 12 and 24 h could be detected in the spectrum of MSLP data. There were also other peaks at 3, 3.4, 4, 4.8, 6, and 8 h. The low-frequency peaks were present at 5.2, 9.7, 11.9, 28, 43.5, and 76 days.
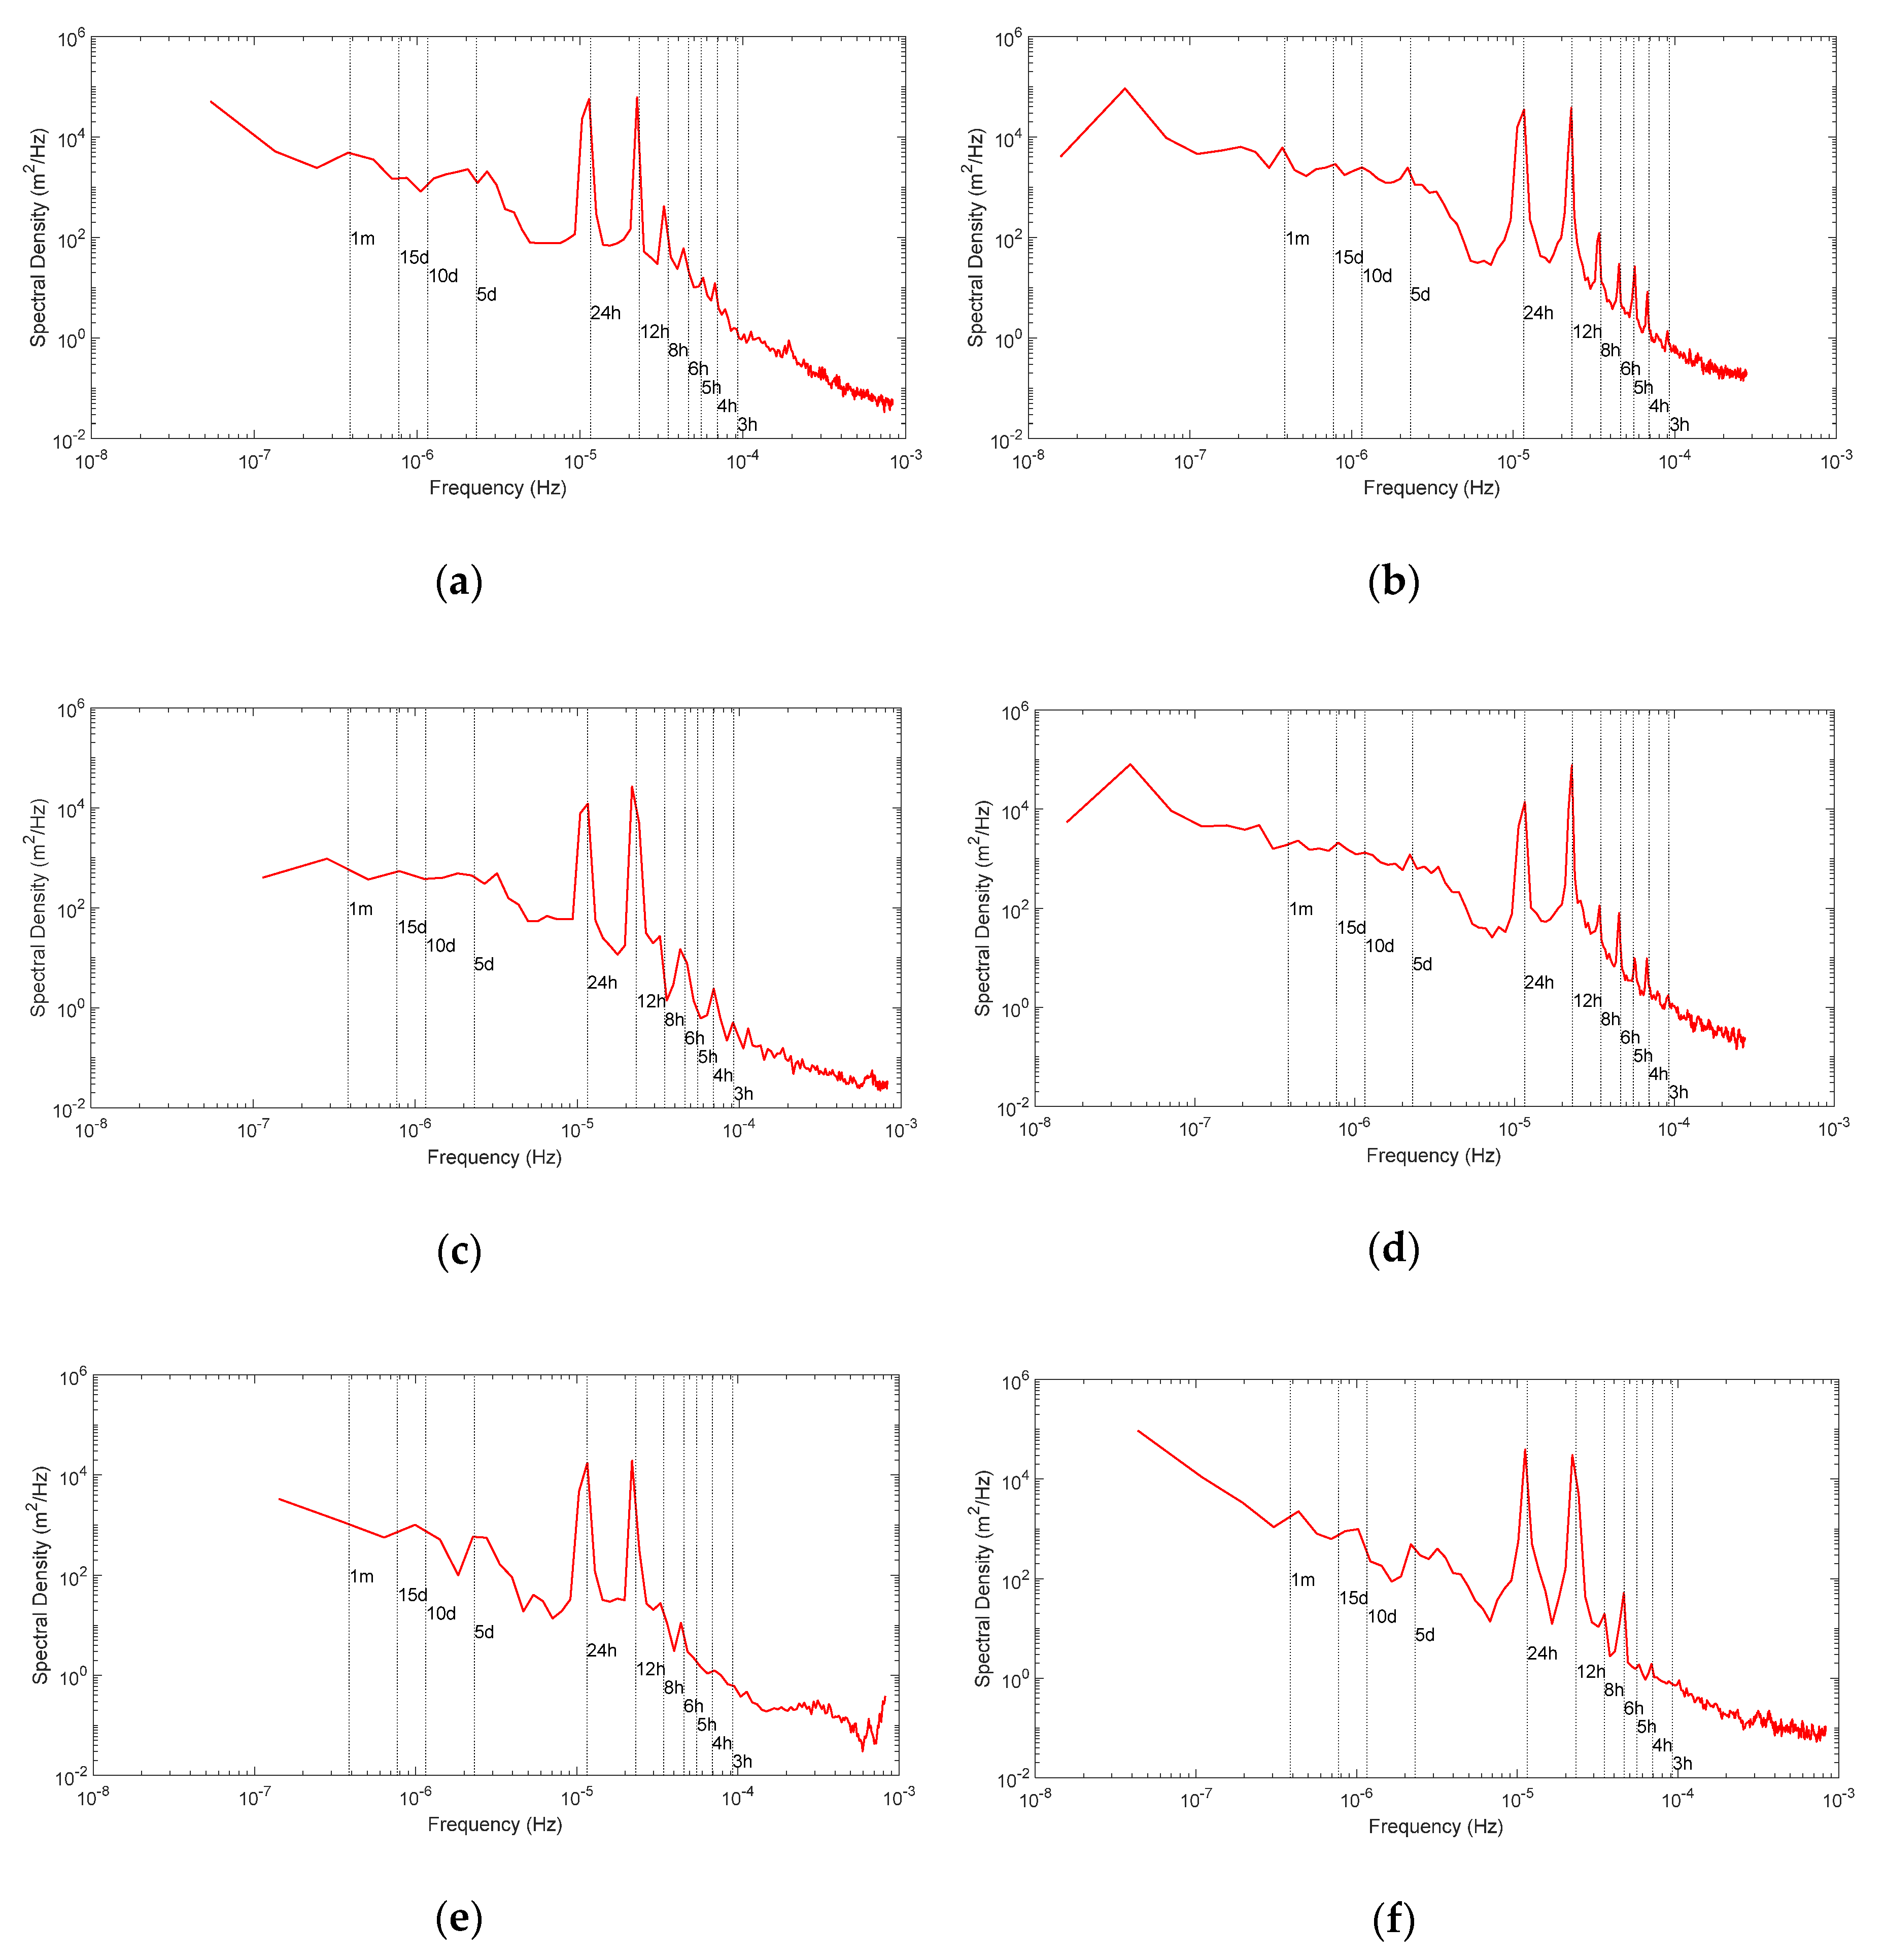
Spectral analysis on sea-level records has shown that the main amount of energy in these spectra are concentrated at low frequencies, and it rapidly decreased moving toward higher frequencies (Figure 5). The diurnal and semi-diurnal signals could be detected by two sharp peaks at 24 and 12 h, respectively, Therefore, the tide is the most important phenomenon affecting water level of the Persian Gulf. The other peaks belong to shorter period harmonics at 3, 4, 5, 6, and 8 h. Tidal range at these stations is between 1.8 m at Javad al-Aemmeh station and 3.4 m at Deylam station. Also, low-frequency peaks at 3.5, 5.5, 11, 14, 28, and 50 days were observed at different stations. The relative broad peak centered at 24 h could be due to the interference of diurnal tidal signals and other waves in the Persian Gulf. The period of seiche as a potential reason for aforementioned peak can be calculated according to Merian’s formula [22,23]:
T n = 2 L n gH
where n = 1, 2, 3, … are different modes of oscillation, T is the natural period of a closed basin, L is the length, H is the average depth of the body of water, and g is the acceleration due to gravity. Considering length of the basin to be 820 km and average depth of 32.3 m, the principal seiche period of this basin would be 25.6 h. To compare this period with the peaks of the sea-level energy spectra, the spectra of Kangan station, which has the longest sea-level record, was calculated again using a smaller bandwidth (Figure 6). It is shown that there is a separate peak around 25.6 h that may be attributed to the mode 1 seiche oscillation in the Persian Gulf. Indeed, it seems that in the calculation of seiche period, the Persian Gulf acts more as a closed basin (entrance width smaller than the Gulf width).

3.2. Characteristics of the Tide

To extract harmonic coefficients from the measurement data, the harmonic analysis was performed by using UTIDE MATLAB® functions (version R2017b) (The Mathworks, Inc.: Natick, MA, USA) [24]. This analysis describes the changing elevation of sea surface as a sum of a finite number of cosine waves with specific properties such as amplitudes, frequencies, and phases. The frequencies are given a priori and the other two parameters will be calculated using least square method. The 8 main tidal harmonics at each station are listed in Figure 7. Depending on the length of records in each station, different diurnal, semi-diurnal, and several ter-diurnal and quarter-diurnal tidal components are resolved. Due to short sea-level records at Lavar and Javad al-Aemmeh, some constituents, P1 and K2, were not resolved by this analysis.
The principal lunar semi-diurnal, M2, harmonic constituent has the largest amplitude in all stations and the other three main constituents are K1, O1, and S2, respectively. The tidal from number (FN) is calculated for each station. It is the ratio of the sum of the amplitudes of the main diurnal harmonic constituents (O1 and K1) to the sum of the main semi-diurnal constituents (M2 and S2), Equation (4). As the FN at all stations was between 0.45 and 1.1, the northern coasts of the Persian Gulf has a mixed, predominantly, semi-diurnal tidal cycle [1].
FN = K 1 + O 1 M 2 + S 2

4. Discussion

4.1. Wavelet Analysis

As the Fourier Transform only revealed frequencies present in the whole time series, information on individual events are lost [25]. However, the Wavelet transform (WT) expands time series into time-frequency space and can therefore find localized intermittent periodicities [26].
The time-frequency spectrum of WT [27] is used in this study to understand the spectral feature and the stability of the various frequency processes in the sea-level records (Equation (5)). This equation shows the WT, which is used to analyze time series that contain nonstationary power at many different frequencies.
ψ 0 ( η ) = π 1 / 4 e i ω 0 η e γ 2 / 2
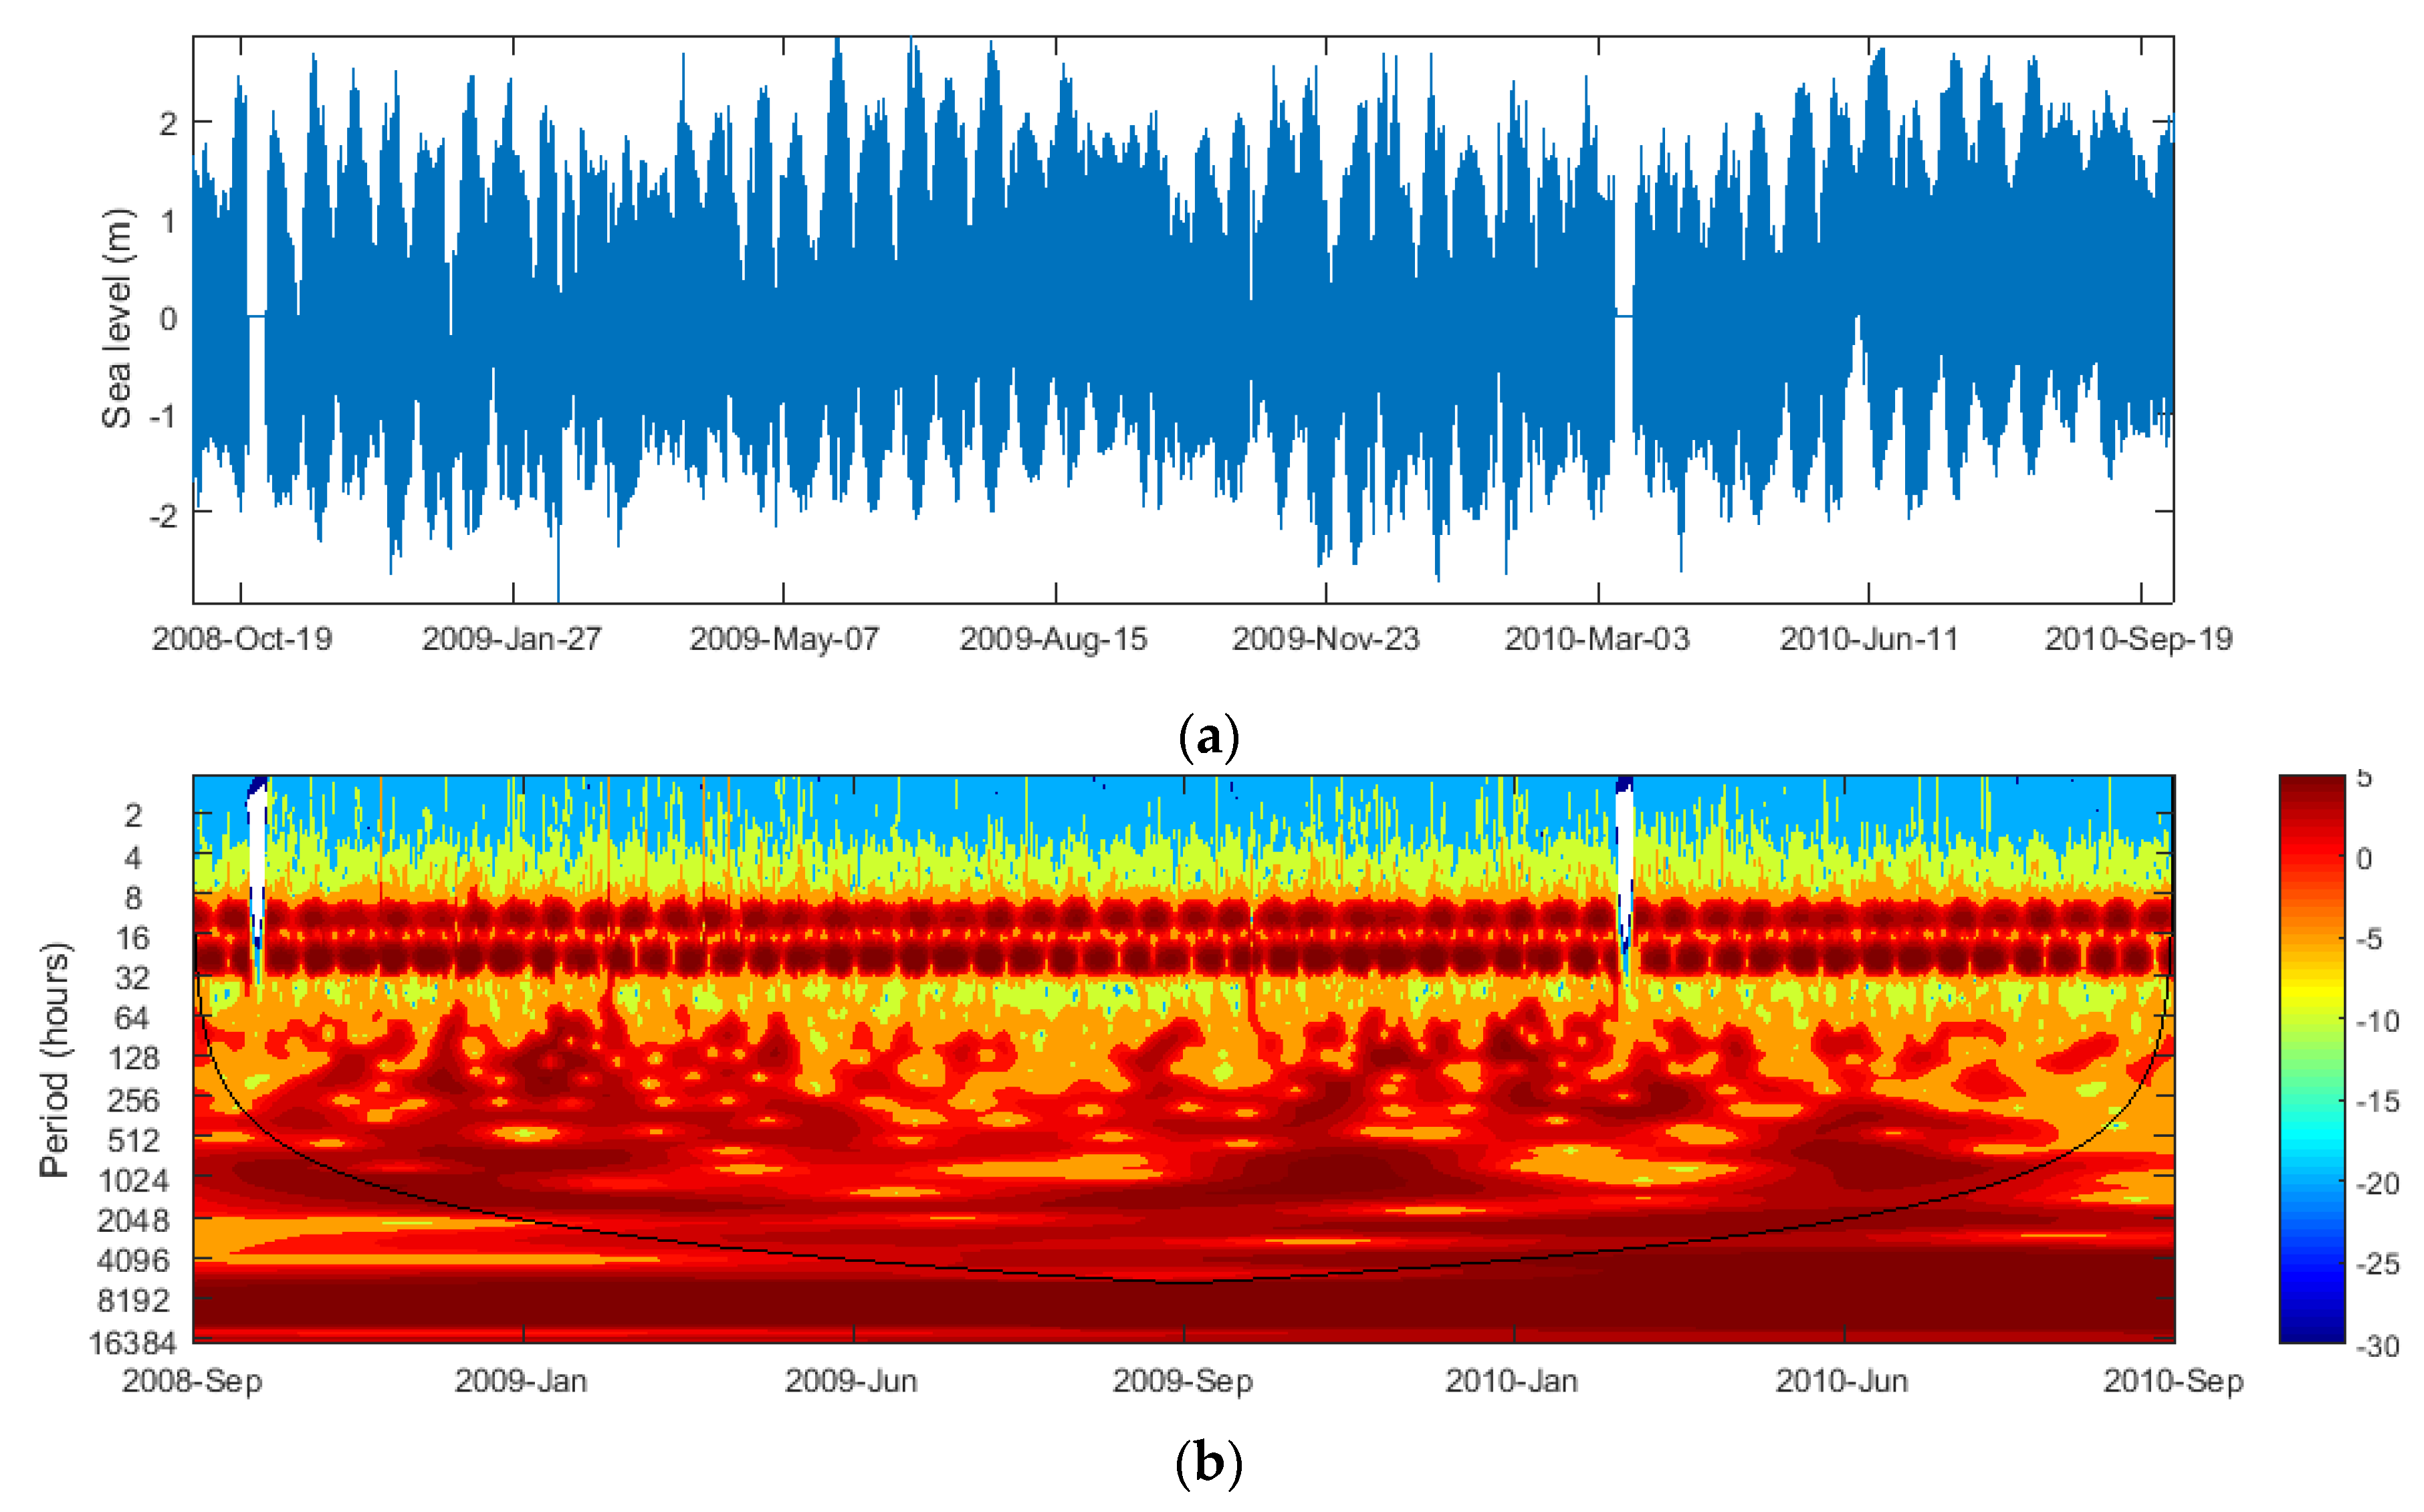
where ψ 0 denotes wavelet function, γ is the non-dimensional time parameter, i is the imaginary unit number, and ω 0 is the non-dimensional frequency. Typical results from WT are presented for Bushehr (Figure 8). Both the magnitude and periods of the various frequency signals in the sea level can be seen from the time-frequency spectrum. Analyses such as this were carried out for all stations, except for Lavar and Javad al-Aemmeh whose sea-level records were short to make analysis possible. The results show that a large amount of energy is concentrated at tidal frequencies. The neap and spring periods could be observed clearly in this figure at periods between 12 and 24 h. It is interesting that there are phase lags between energy peaks at diurnal and semi-diurnal harmonics.
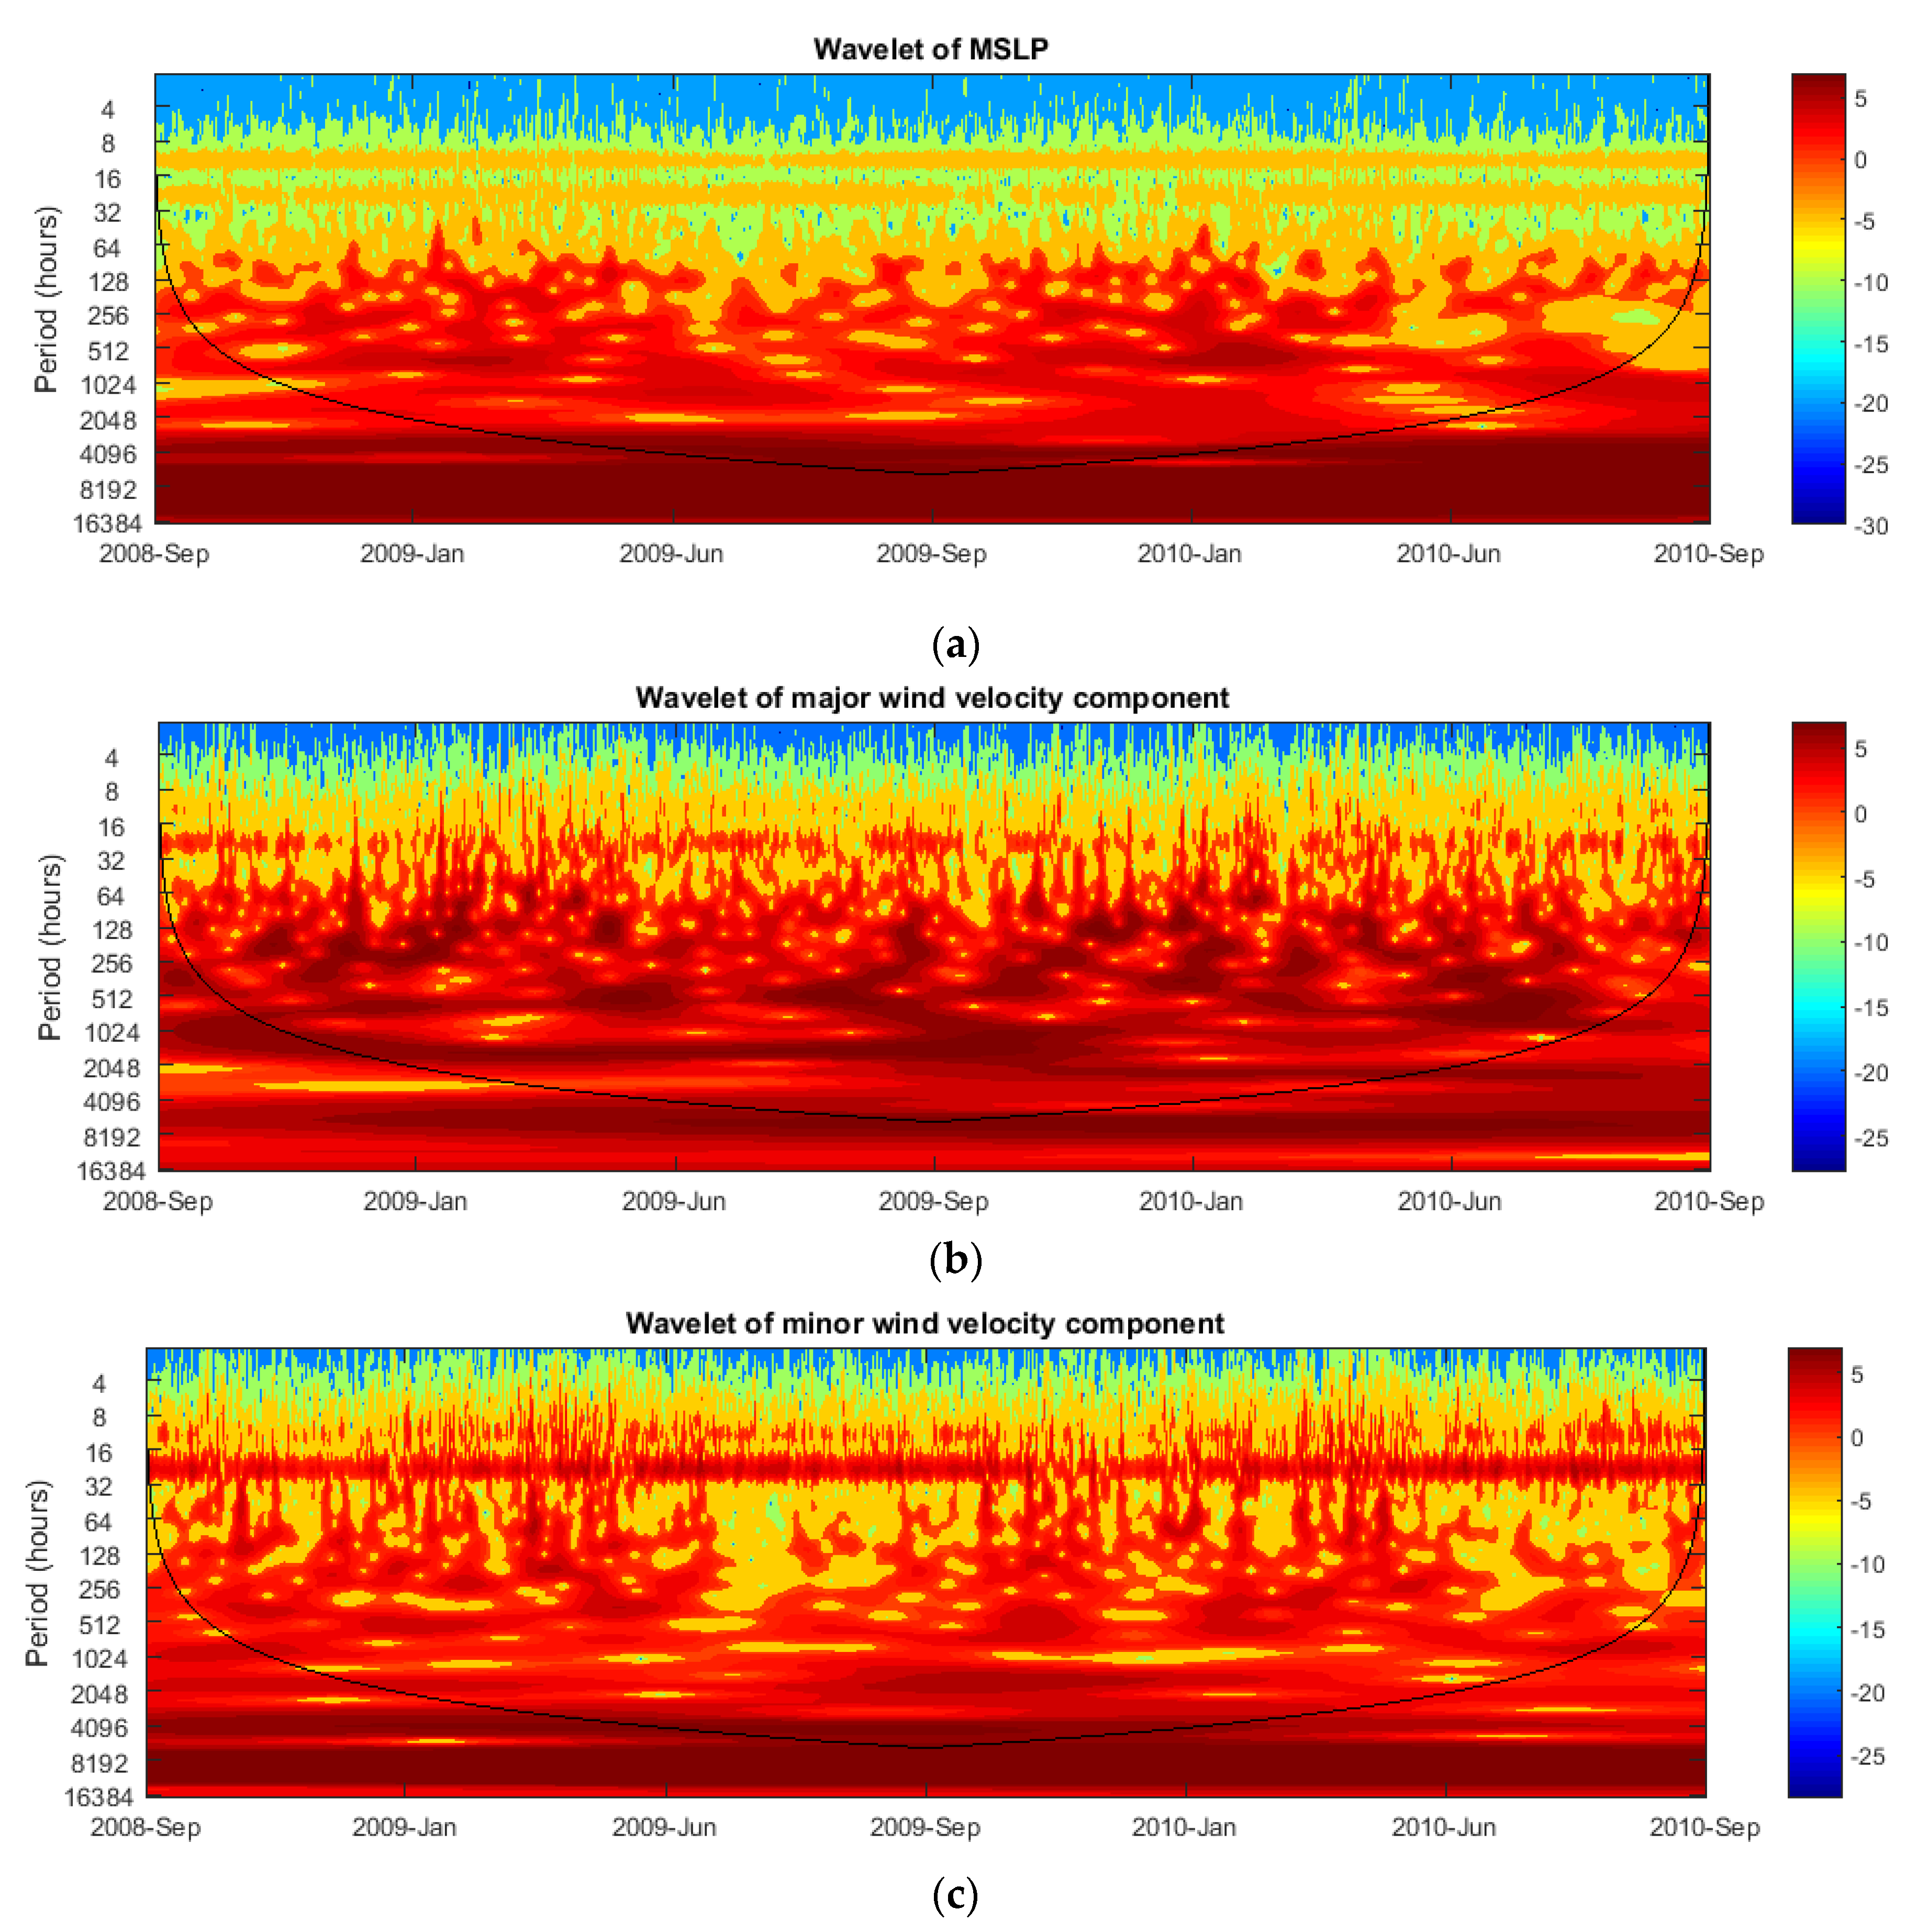
The wavelet analysis of MSLP indicated that these fluctuations were strongest during the autumn and winter regimes (September–February) and occurred preferentially at times scales 9–35 days. Correspondingly, there were lower fluctuations during spring and summer seasons. Diurnal and semi-diurnal energy associated with the sea-land breeze were clearly recognizable in the wavelet diagram of minor wind velocity component (Figure 9a).

4.2. Low-Pass Filtering

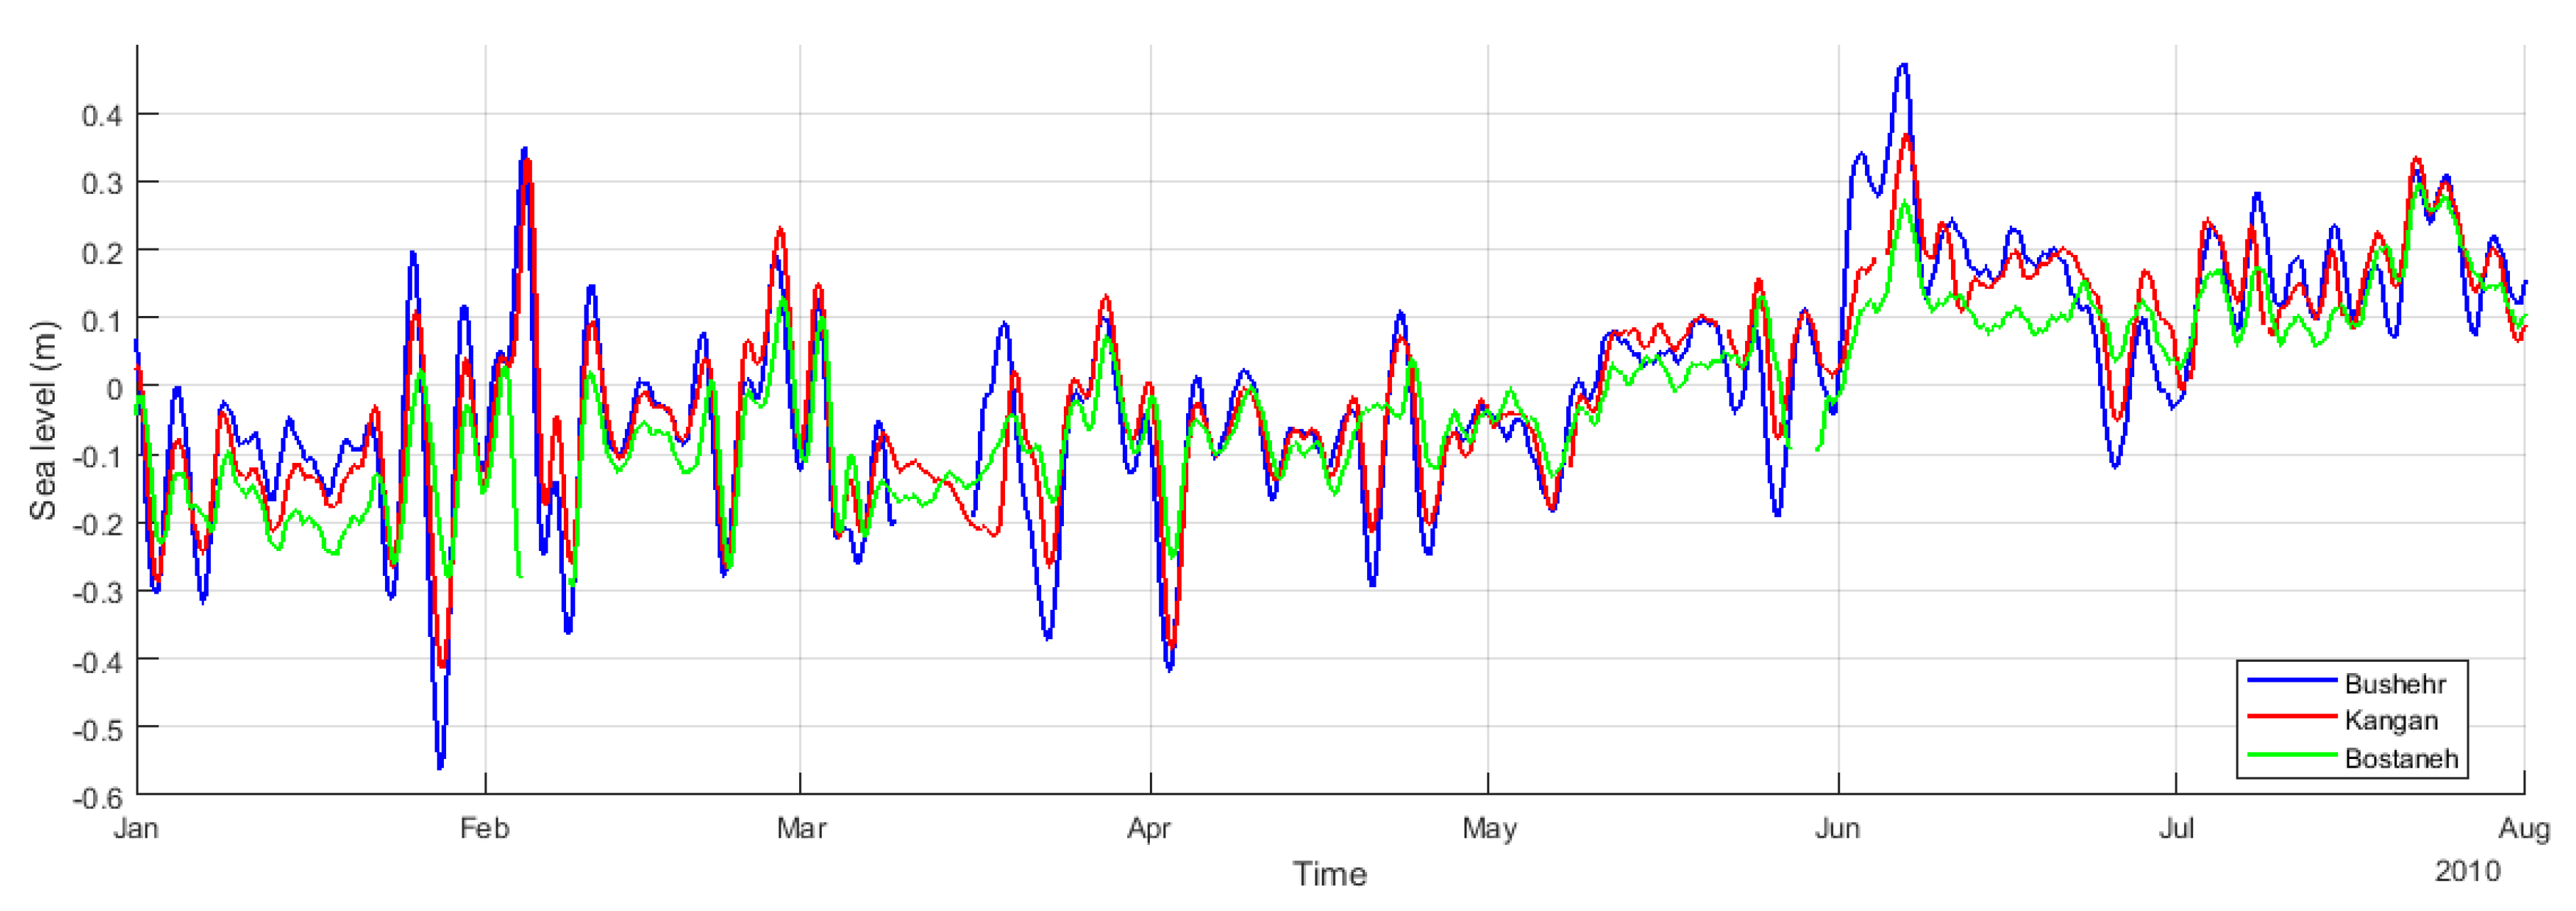
To assess the relation between low-frequency sea-level variation and atmospheric forces, the high frequency signals were filtered from the observed sea-level data. The cutoff frequency (half-power point) used in this analysis was 48 h. The range of low-pass-filtered sea-level records was not the same along the northern coasts of the Persian Gulf. There range was higher along the northwestern part compared to northeastern regions (Figure 10). The variations in non-tidal sea level at Bushehr station were up to 0.75 m while they were ~0.60 cm and ~0.40 m at Kangan and Bostaneh stations, respectively. Also, the seasonal variation in sea level was detected using 90-day low-pass filter on the sea level records. The highest mean sea-level occurred during the summer months (July to August), and the lowest during winter months (January to February). The difference in mean sea-level elevation was between 0.20 and 0.25 m. One of the major component of this seasonal sea-level fluctuation is the steric effect [2,28] caused by seasonal variation in air and sea heat fluxes. Beyond this effect, the seasonal variation in air pressure may increase the sea-level variations.
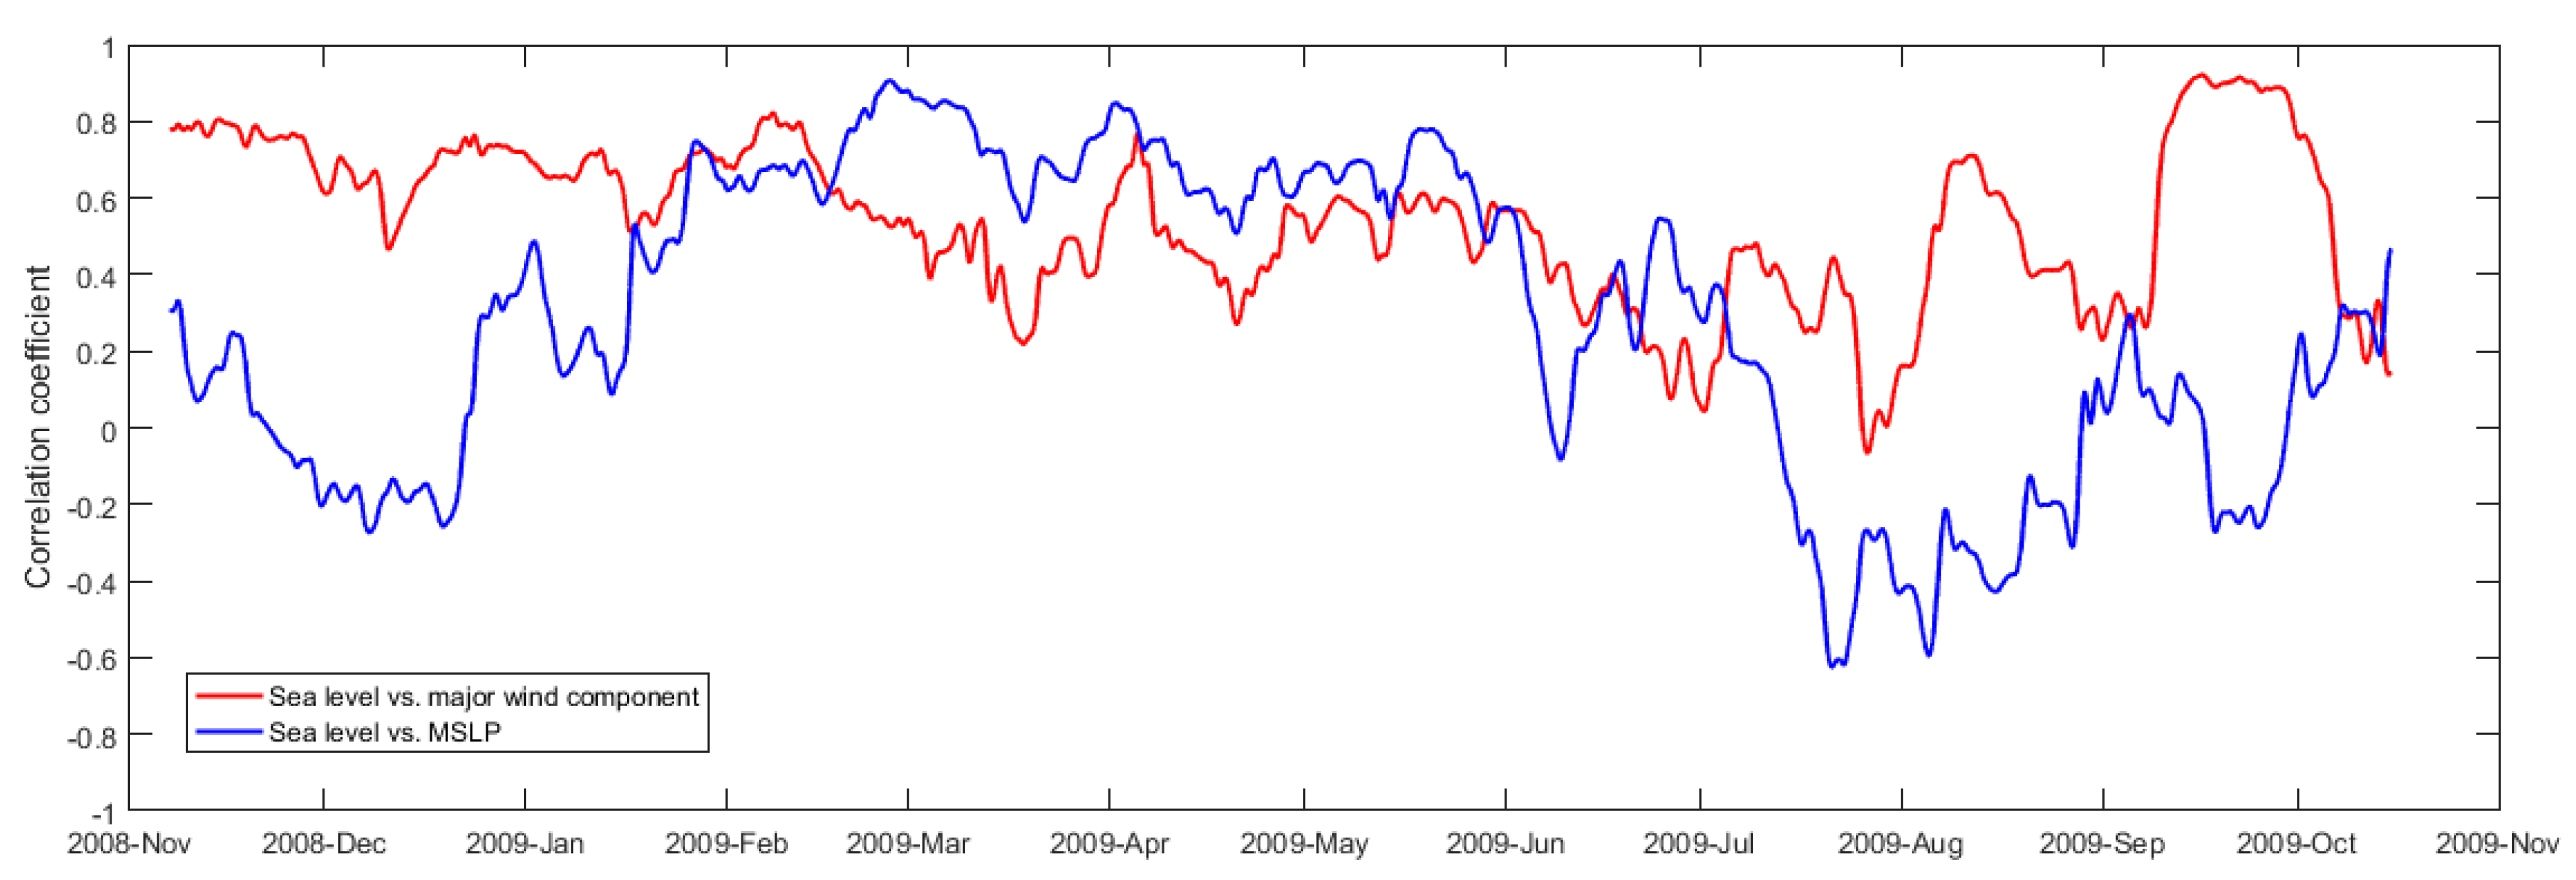
The same low-pass filter was been applied to the wind velocity components and MSLP data. Time series of low-pass-filtered records at Bushehr station between February and June 2009 indicated that high sea-level events corresponded to low pressure and onshore wind (Figure 11). Although the signals agreed well in many of the events, there were significant events where the sea level had larger amplitude fluctuations than atmospheric pressure (mid-February) and vice versa (mid-March). These differences were also present in the comparison between wind velocity and sea-level time series. It is not always possible to quantify the exact contribution of wind and MSLP to the total non-tidal sea-level fluctuation, because the wind is highly correlated with the gradient of MSLP, and both of them are related to the larger scale atmospheric formations. To quantify the correlation between sea-level variation and meteorological forcing, correlation coefficients between these parameters were calculated using a moving window of 10 days. The variation of the correlation coefficient with time is shown in Figure 12. The positive unity implies that MSLP and major wind speed component fully explain the sea-level response, while the negative unity indicates the reverse behavior.
The wind components contained higher correlation with sea level compared to atmospheric pressure (Figure 12). The red line, correlation between wind and sea level, changed with different seasons. It had the highest values during late autumn/early winter. It was seen that during summer and autumn, the correlation coefficient between MSLP and sea level was significantly less than unity indicating that factors other than barometric pressure influence sea level variability. However, during winter and spring, the barometric pressure had the highest correlation with sea level.

4.3. Cross-Correlation between Parameters

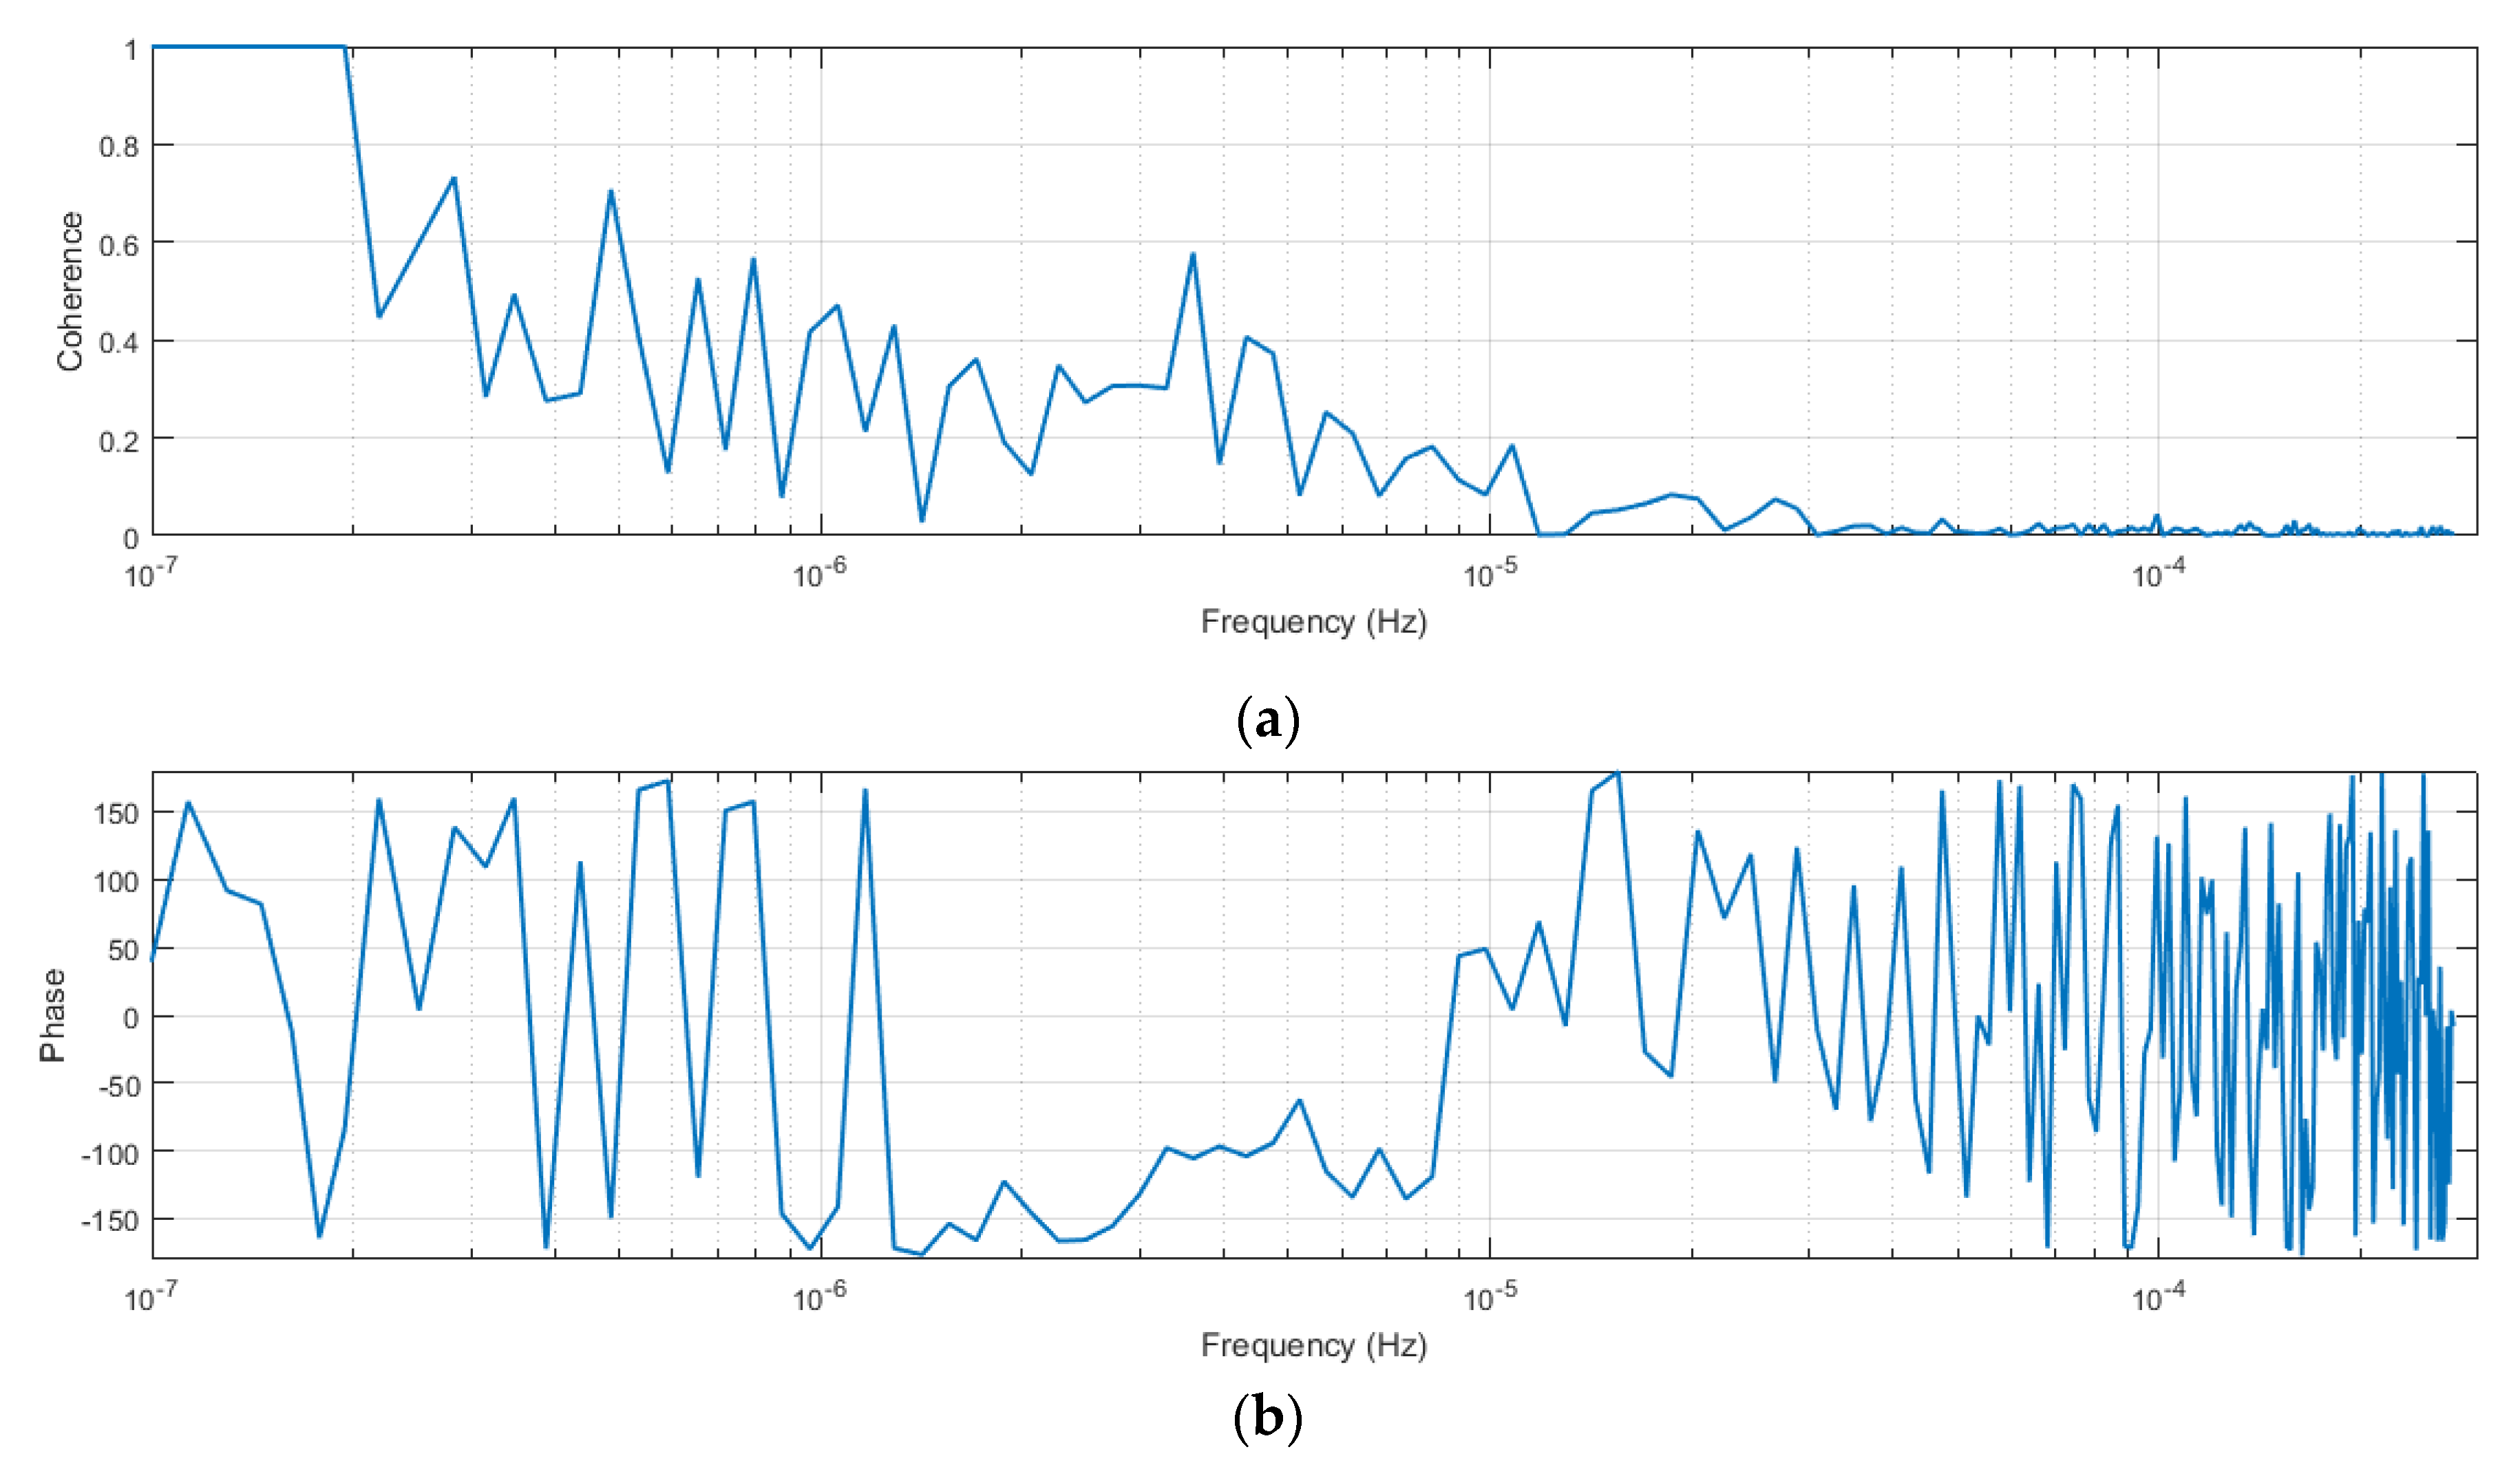
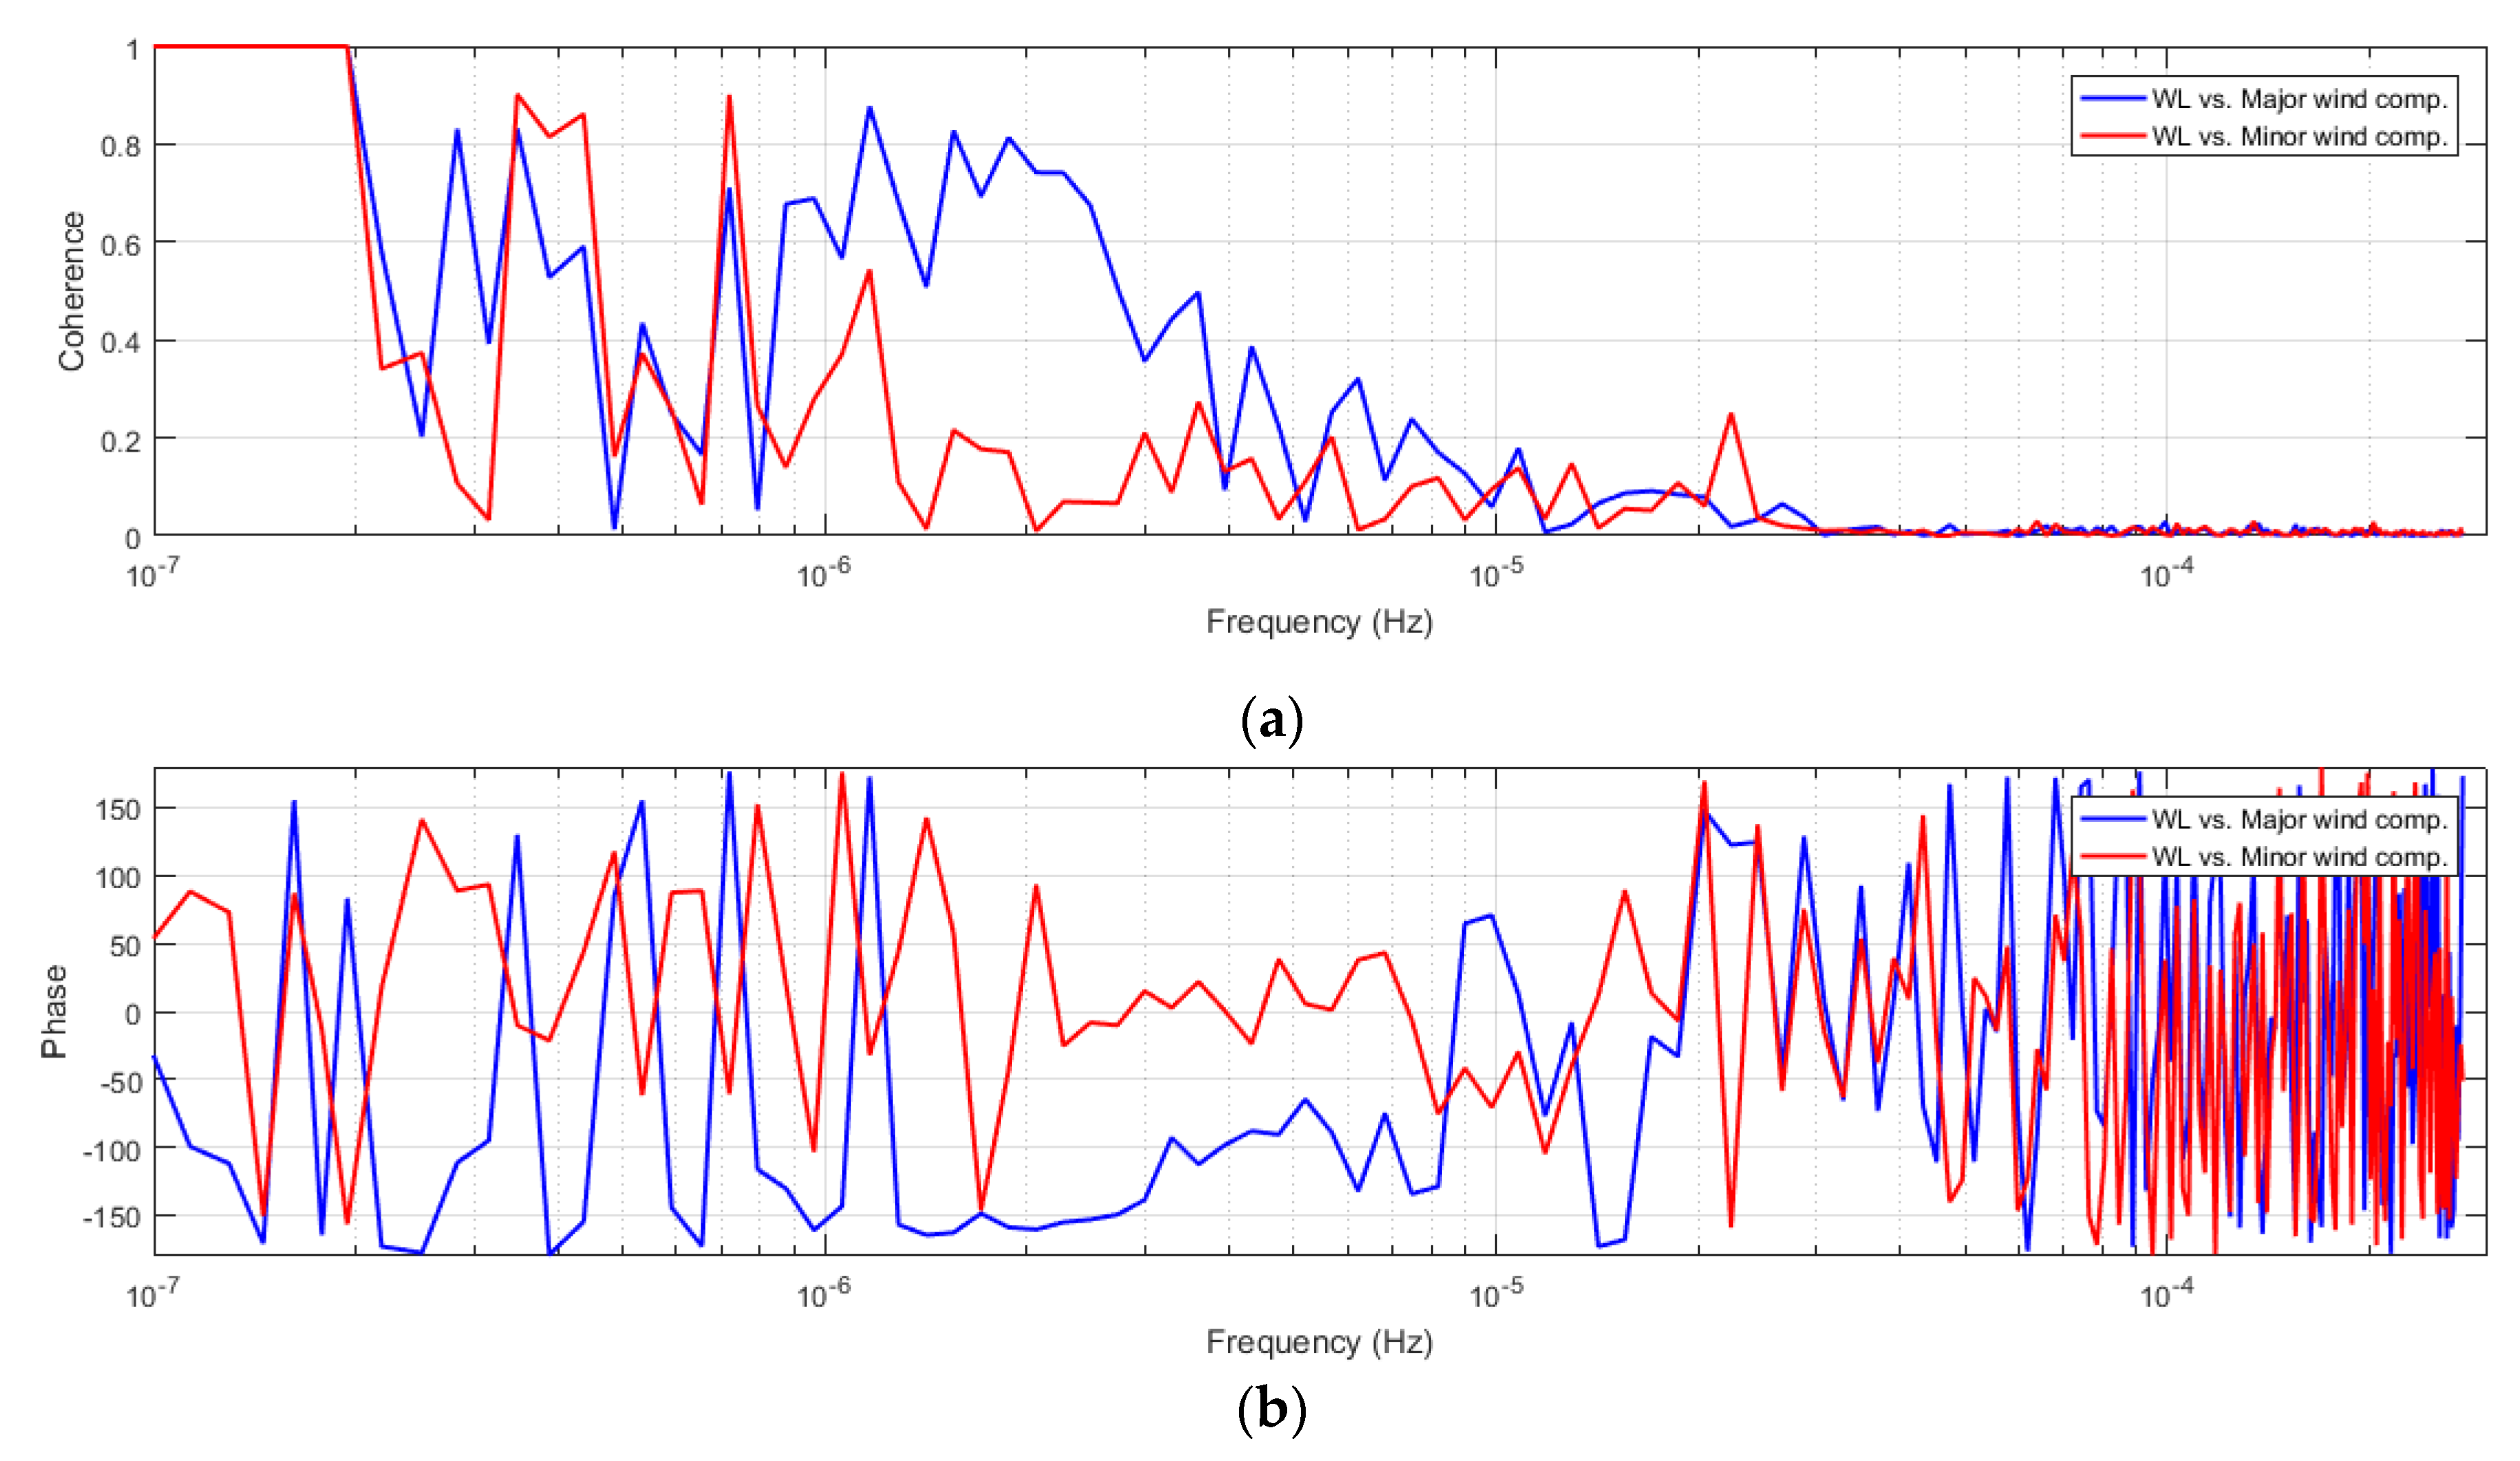
One of the possible reasons for low and even negative correlation coefficient between meteorological forcing and sea level could be the phase lag between these parameters. Therefore, cross-spectral analysis was performed through application of coherence spectrum between time series of sea-level and wind velocity components. The same analysis was also performed between time series of sea level and MSLP. Results of this analysis at Bushehr station are depicted in Figure 13 and Figure 14. The frequencies with the highest coherency were extracted in each station. At almost, all stations, there were high coherency peaks at periods corresponding to 2.4, 10.6 and 13.7 days. There were also some peaks at periods 16.8, 23.7 and 43.3 days at Kangan and Bushehr stations. The mean phase lag at Bushehr station in the frequency band between 1.5 × 10⁻⁶ and 7.5 × 10⁻⁶ Hz (equal to periods between 1.5 and 7.5 days) was 125°. This indicated that at these periods, the atmospheric pressure generally leads to sea-level fluctuations between 1 and 6.4 days, respectively. This figure also shows that there was no consistent lag between atmospheric pressure and sea level at lower frequencies. There were both positive and negative phase lag values, which means that sometimes the atmospheric pressure leads to sea-level fluctuations, and at the other times it lags.
The same procedure was followed for the investigation on the relation between sea level and wind components. Cross spectrum of wind velocity components versus low-frequency sea-level records at Bushehr station indicated that there were peaks at periods 3.5, 5.3, 7.6 and 10.1 days. The same peaks were observed in the cross spectrum at other stations. In addition, there were peaks at longer periods, 33.3 and 40.7 days. For periods between 3 and 13 days, the sea level in general lagged behind the major wind components by between 2 and 10 days, respectively. It was also observed that the minor wind velocity component had lower correlation with sea level compared to the major component. The other findings from the spectral analysis are: (a) at almost at all the stations the coherence between sea level and wind was larger than the coherency between sea level and MSLP; and, (b) coherency between wind velocity components and sea-level fluctuations decreased from the west (Bushehr) to east (Bostaneh). The coherence between atmospheric pressure and sea level was almost the same at all the stations.
The coherence for Bushehr and Kangan station were generally greater than the one of Bostaneh station. This indicated that for the two former stations, a larger proportion of sea-level variation may be explained by meteorological forces than for the Bostaneh station, which is located at the eastern section of Persian Gulf.
Time series of low-pass-filtered sea-level records at Bushehr, Kangan, and Bostaneh tide gauge stations over a two-month period indicated that the variability at Bushehr and Kangan were similar, even for low amplitude fluctuations (Figure 15). However, at Bushehr, the amplitude of non-tidal sea-level fluctuation, in general, exceeded those at Kangan and Bostaneh stations, both for positive and negative events. High water-level conditions at Bushehr station generally led to those of Kangan and Bostaneh stations. The same behavior was observed for low water levels (Figure 15).
This sequence of high water-level occurrence at all stations indicated a west to east wave moving along the northern coasts of the Persian Gulf. This wave may be considered to be a coastal trapped wave, but it actually has different origin. A coastal trapped waves is defined as a wave traveling parallel to the coast, with the highest height at the shoreline and decreasing height offshore [7]. In the northern hemisphere it has to travel counterclockwise, traveling with the coast to the right [2,29]. However, according to above analysis, a clockwise wave was observed during the complete study period. Hence, these low-frequency water-level fluctuations cannot be classified as a coastal trapped wave. They were generated by the passage of atmospheric pressure systems over the Persian Gulf.
To extract the lag between these time series, a cross-correlation analysis was undertaken between each pair of time series. In this manner, similarity between the reference time series, i.e., Bushehr low-pass-filtered sea-level records, and the shifted (lagged) time series of low-pass-filtered sea-level records of another station was measured by the cross-correlation. The results showed that the mean lag between the low-pass-filtered sea-level record at Bushehr and at Kangan station was 5.5 h. The mean lag between low-pass sea-level records at Kangan and Bostaneh stations was 5 h. The dominant wind regime of the Persian Gulf travels from the northwest towards the Strait of Hormuz and matches the sequence of high/low non-tidal sea-level occurrences as described above.
A longer continuous time series of sea-level records may be required to study the semi-annual and annual tidal constituents and lower frequency SLV in the Persian Gulf. Also, it is suggested to employ sea-level data from the southern coasts of the Persian Gulf to better investigate the counterclockwise movement of non-tidal wave in the region.

5. Conclusions

The low-frequency sea-level variabilities along the northern coasts of the Persian Gulf were examined together with the response of sea level to low-frequency wind components and MSLP. Spectral analysis revealed that tides were responsible for most of the spectral energy at sea level. Harmonic analysis on sea-level records indicated that the principal lunar semi-diurnal, M2, and harmonic constituent had the largest amplitude followed by the other three main constituents K1, O1, and S2. Low-pass-filtered sea-level data had a maximum amplitude of 0.75 m at Bushehr station, which comprised a significant portion of total sea-level fluctuations. Spectral analysis on wind components and MSLP indicated that there were energy peaks at periods from 3 days to 2 months. Energy peaks at similar periods were also observed in the sea-level time series. Coherency between low-frequency sea-level records and MSLP indicated that for periods between 1.5 and 7.5 days, atmospheric pressure led to sea-level fluctuations at time periods between 1 and 6.4 days. Similarly, the sea level usually lagged up to 10 days behind the major wind velocity component in the range of 3- to 13-day periods. The contribution of wind velocity components to the sea-level fluctuations was higher compared to the effect of atmospheric pressure.

Author Contributions

Methodology, N.A.-K., M.N. and C.P.; software, M.N.; resources, N.A.-K.; data curation, M.N.; writing—original draft preparation, N.A.-K., M.N.; writing—review and editing, N.A.-K., M.N. and C.P.; visualization, M.N.; supervision, C.P. All authors have read and agreed to the published version of the manuscript.

Funding

This research received no external funding.

Conflicts of Interest

The authors declare no conflict of interest.

References

  1. Pugh, D.; Woodworth, P. Sea-Level Science: Understanding Tides, Surges, Tsunamis and Mean Sea-Level Changes; Cambridge University Press: Cambridge, MA, USA, 2012; ISBN 9781139235778. [Google Scholar]
  2. Pattiaratchi, C.B. Coastal Tide Gauge Observations: Dynamic Processes Present in the Fremantle Record; Schiller, A., Brassington, G.B., Eds.; Operational Oceanography in the 21st Century; Springer: Dordrecht, The Netherlands, 2011; pp. 185–202. [Google Scholar]
  3. Woodworth, P.L.; Melet, A.; Marcos, M.; Ray, R.D.; Wöppelmann, G.; Sasaki, Y.N.; Cirano, M.; Hibbert, A.; Huthnance, J.M.; Monserrat, S. Forcing factors affecting sea level changes at the coast. Surv. Geophys. 2019, 40, 1351–1397. [Google Scholar] [CrossRef] [Green Version]
  4. Goring, D.G. Short-term variations in sea level (2–15 days) in the New Zealand region. N. Z. J. Mar. Freshw. Res. 1995, 29, 69–82. [Google Scholar] [CrossRef]
  5. Pasarić, M.; Pasarić, Z.; Orlić, M. Response of the Adriatic sea level to the air pressure and wind forcing at low frequencies (0.01–0.1 cpd). J. Geophys. Res. Ocean. 2000, 105, 11423–11439. [Google Scholar] [CrossRef]
  6. Raicich, F. On the contributions of atmospheric pressure and wind to daily sea level in the northern Adriatic Sea. Cont. Shelf Res. 2010, 30, 1575–1581. [Google Scholar] [CrossRef]
  7. Sammari, C.; Koutitonsky, V.G.; Moussa, M. Sea level variability and tidal resonance in the Gulf of Gabes, Tunisia. Cont. Shelf Res. 2006, 26, 338–350. [Google Scholar] [CrossRef]
  8. Pattiaratchi, C.; Eliot, M. Sea Level Variability in South-West Australia: From Hours to Decades. In Coastal Engineering 2008: (In 5 Volumes), Proceedings of the Thirty-First International Conference, Hamburg, Germany, 31 August–5 September 2008; World Scientific: Singapore, 2009; pp. 1186–1198. [Google Scholar]
  9. Afshar-Kaveh, N.; Ghaheri, A.; Chegini, V.; Nazarali, M. Prediction of nontidal sea level variations in the Persian Gulf using data assimilation techniques. Coast. Eng. J. 2018, 60, 340–355. [Google Scholar] [CrossRef]
  10. Siek, M.; Solomatine, D. Nonlinear Multi-Model Ensemble Prediction Using Dynamic Neural Network with Incremental Learning. In Proceedings of the 2011 International Joint Conference on Neural Networks, San Jose, CA, USA, 31 July–5 August 2011; IEEE: Piscataway, NJ, USA, 2011; pp. 2873–2880. [Google Scholar]
  11. Oddo, P.; Bonaduce, A.; Pinardi, N.; Guarnieri, A. Sensitivity of the Mediterranean sea level to atmospheric pressure and free surface elevation numerical formulation in NEMO. Geosci. Model. Dev. 2014, 7, 3001–3015. [Google Scholar] [CrossRef] [Green Version]
  12. Afshar-Kaveh, N.; Ghaheri, A.; Chegini, V.; Etemad-Shahidi, A.; Nazarali, M. Evaluation of different wind fields for storm surge modeling in the Persian Gulf. J. Coast. Res. 2017, 33, 596–606. [Google Scholar]
  13. Šepić, J.; Vilibić, I.; Jordà, G.; Marcos, M. Mediterranean Sea level forced by atmospheric pressure and wind: Variability of the present climate and future projections for several period bands. Glob. Planet. Chang. 2012, 86, 20–30. [Google Scholar] [CrossRef]
  14. Lin, N.; Emanuel, K. Grey swan tropical cyclones. Nat. Clim. Chang. 2016, 6, 106–111. [Google Scholar] [CrossRef] [Green Version]
  15. Pattiaratchi, C.B.; Wijeratne, E.M.S. Are meteotsunamis an underrated hazard? Philos. Trans. R. Soc. A 2015, 373. [Google Scholar] [CrossRef] [PubMed] [Green Version]
  16. Heidarzadeh, M.; Šepić, J.; Rabinovich, A.; Allahyar, M.; Soltanpour, A.; Tavakoli, F. Meteorological tsunami of 19 March 2017 in the Persian Gulf: Observations and analyses. Pure Appl. Geophys. 2019, 1–29. [Google Scholar] [CrossRef] [Green Version]
  17. NOAA’s FTP Servers. Available online: ftp://ftp.ncdc.noaa.gov/pub/data/noaa (accessed on 1 June 2019).
  18. (C3S). ERA5: Fifth Generation of ECMWF Atmospheric Reanalyses of the Global Climate. Copernicus Climate Change Service Climate Data Store (CDS). 2017. Available online: https://cds.climate.copernicus.eu/cdsapp#!/home (accessed on 1 June 2019).
  19. Walters, K.R.; Sjoberg, W.F. The Persian Gulf Region: A Climatological Study; FMFRP 0-54; Department of the Navy, United States Marine Corps: Washington, DC, USA, 1990.
  20. Thomson, R.E.; Emery, W.J. Data Analysis Methods in Physical Oceanography, 3rd ed.; Elsevier: Miami, FL, USA, 2014. [Google Scholar]
  21. Masselink, G.; Pattiaratchi, C.B. Characteristics of the sea breeze system in Perth, Western Australia, and its effect on the nearshore wave climate. J. Coast. Res. 2001, 173–187. [Google Scholar]
  22. Lisitzin, E. Sea-Level Changes; Elsevier: New York, USA, 1974; ISBN 0080870449. [Google Scholar]
  23. Rabinovich, A.B. Seiches and Harbour Oscillations. In Handbook of Coastal and Ocean Engineering; Kim, Y.C., Ed.; World Scientific Publishing Co.: Singapore, 2009; pp. 193–236. [Google Scholar]
  24. Codiga, D.L. Unified Tidal Analysis and Prediction Using the UTide Matlab Functions; Technical Report 2011-01; Graduate School of Oceanography, University of Rhode Island: Narragansett, RI, USA, 2011; 59p. [Google Scholar]
  25. Kantha, L.H.; Clayson, C.A. Numerical Models of Oceans and Oceanic Processes; Academic Press: Waltham, MA, USA, 2000. [Google Scholar]
  26. Grinsted, A.; Moore, J.C.; Jevrejeva, S. Application of the cross wavelet transform and wavelet coherence to geophysical time series. Nonlin. Process. Geophys. 2004, 11, 561–566. [Google Scholar] [CrossRef]
  27. Morlet, J.; Arens, G.; Fourgeau, E.; Glard, D. Wave propagation and sampling theory—Part I: Complex signal and scattering in multilayered media. Geophysics 1982, 47, 203–221. [Google Scholar] [CrossRef] [Green Version]
  28. Church, J.A.; Gregory, J.M.; Huybrechts, P.; Kuhn, M.; Lambeck, C.; Nhuan, M.T.; Qin, D.; Woodworth, P.L. Changes in sea level. In Climate Change 2001: The Scientific Basis: Contribution of Working Group I to the Third Assessment Report of the Intergovernmental Panel on Climate Change; Houghton, J.T., Ding, Y., Griggs, D.J., Noguer, M., van der Linden, P.J., Dai, X., Maskell, K., Johnson, C.A., Eds.; Cambridge University Press: Cambridge, UK; New York, NY, USA, 2001; Chapter 11; pp. 639–694. [Google Scholar]
  29. Eliot, M.J.; Pattiaratchi, C.B. Remote forcing of water levels by tropical cyclones in south-west Australia. Cont. Shelf Res. 2010, 30, 1549–1561. [Google Scholar] [CrossRef]
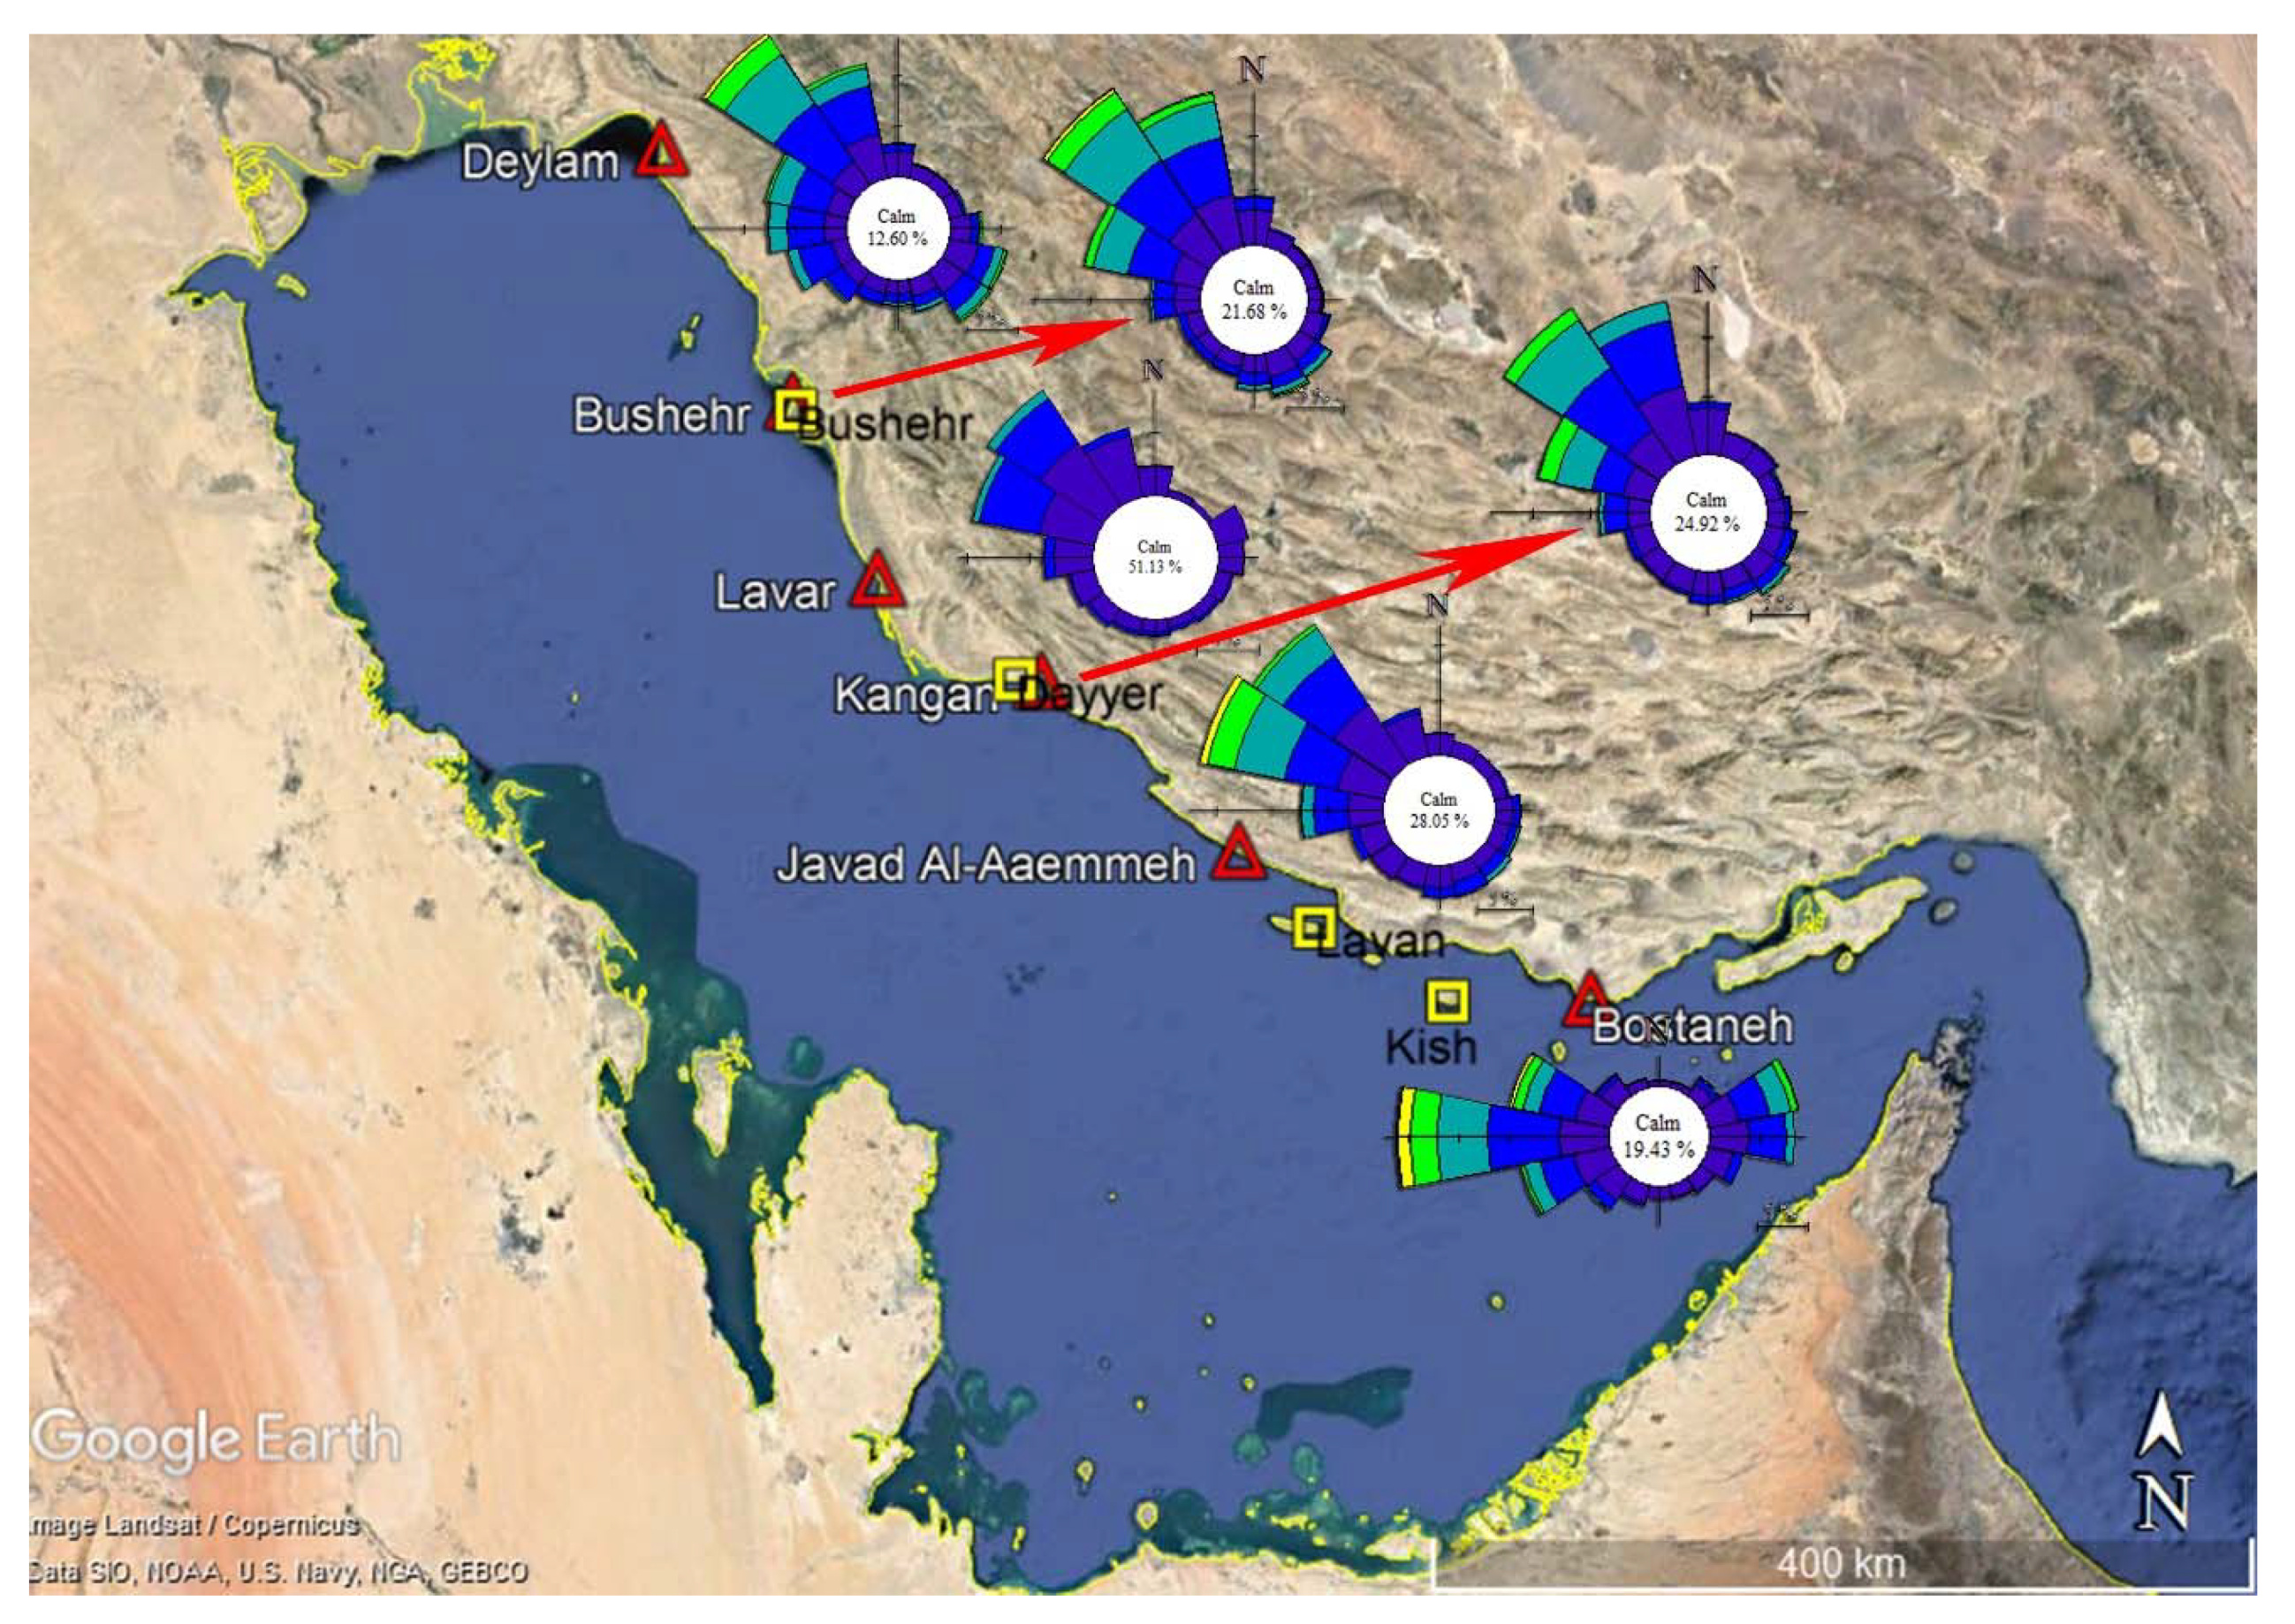
Figure 1. Location of sea-level observations (red triangles) and meteorology stations (yellow boxes) located along the northern coasts of the Persian Gulf (Image from Google Map: https://goo.gl/maps/MAU6TJCNbFGXoDzU6).
Jmse 08 00285 g001
Figure 2. Wind velocity vectors over the Persian Gulf showing a typical Shamal wind event (22 January 2010).
Jmse 08 00285 g002
Figure 3. (a) Time series of mean sea-level pressure at Bushehr station during 2009–2010; (b) an event in February 2010 with decreasing MSLP; and, (c) an event increasing MSLP in July 2010.
Jmse 08 00285 g003
Figure 4. Spectral energy plot of wind speed components (major component: red, minor component: green) and MSLP (blue color) at (a) Deylam station; (b) Bushehr station; (c) Lavar station; (d) Kangan station; (e) Javad al-Aemmeh station; (f) Bostaneh station.
Jmse 08 00285 g004
Figure 5. Energy spectrum of sea level at (a) Deylam station; (b) Bushehr station; (c) Lavar station; (d) Kangan station; (e) Javad al-Aemmeh station; (f) Bostaneh station.
Jmse 08 00285 g005
Figure 6. Energy spectrum of sea level at Kangan station.
Jmse 08 00285 g006
Figure 7. Amplitude of the main tidal constituents in all stations.
Jmse 08 00285 g007
Figure 8. Typical results of wavelet analysis on sea-level records at Bushehr station (a) Time series of sea level and (b) Wavelet analysis.
Jmse 08 00285 g008
Figure 9. Typical results of wavelet analysis on (a) the meteorological parameters including MSLP, (b) Major wind velocity component, and (c) minor wind velocity component (bottom) for Bushehr station.
Jmse 08 00285 g009
Figure 10. Low-pass-filtered sea-level records at Bushehr, Kangan, and Bostaneh stations.
Jmse 08 00285 g010
Figure 11. Low-pass-filtered time series of sea level compared with (a) MSLP, and (b) major wind velocity component at Bushehr station.
Jmse 08 00285 g011
Figure 12. Correlation between low-pass-filtered sea-level records and meteorological forcing including major wind component (red line) and MSLP (blue line).
Jmse 08 00285 g012
Figure 13. Cross spectrum of low-frequency sea-level records and MSLP at Bushehr station (a) coherence (b) phase difference.
Jmse 08 00285 g013
Figure 14. Cross spectrum of low-frequency sea-level records and wind velocity components at Bushehr station (a) coherence (b) phase difference.
Jmse 08 00285 g014
Figure 15. Low-pass-filtered sea-level records at Bushehr (Blue), Kangan (Green), and Bostaneh (Red) stations. The dashed and solid black lines show the sequences of high and low waters, respectively.
Jmse 08 00285 g015
Table 1. Sea-level data along northern Persian Gulf coasts.
Station NameStartFinishTime Step (min)Duration (days)
Deylam11 July 201011 February 201110215
Bushehr30 September 200830 September 201030729
Lavar24 June 20103 October 201010101
Kangan30 September 200830 September 201030729
Javad al-Aemmeh14 April 20105 July 20101081
Bostaneh25 November 200918 August 201010265