Article

Design and Performance of Permeable Groins on a Low-Energy Natural Beach

by
Alec Torres-Freyermuth
1,*,
Anne Hofman
2,
José Clemente Tuz-Pech
1,
Gabriela Medellín
1 and
Pieter C. Roos
2
1
Coastal Processes and Engineering Laboratory, Institute of Engineering, Universidad Nacional Autonoma de Mexico, Sisal, Yucatan 97835, Mexico
2
Department of Water Engineering and Management, University of Twente, 7522 NB Enschede, The Netherlands
*
Author to whom correspondence should be addressed.
J. Mar. Sci. Eng. 2020, 8(4), 283; https://doi.org/10.3390/jmse8040283
Submission received: 21 March 2020 / Revised: 8 April 2020 / Accepted: 12 April 2020 / Published: 15 April 2020
(This article belongs to the Section Coastal Engineering)

Abstract

:
Beach erosion, ubiquitous of sandy coasts around the world, can be exacerbated or mitigated with the use of hard engineering solutions including groins. The use of groins has been discouraged in many countries despite its capability to reduce sand losses. This study aims to design a 15 m permeable groin that allows sediment bypassing. Field experiments were conducted on a low-energy, sea-breeze dominated micro-tidal beach at the northern Yucatan peninsula during both mean and extreme wave conditions. Firstly, a short-term experiment consisted in monitoring the structure performance for 24 h during typical sea breeze conditions and the subsequent beach recovery after the structure removal. Secondly, a multi-day (60 days) experiment was conducted to investigate the performance of a single- and double-groin system during both mean and local storm conditions. Beach surveys were conducted to evaluate the beach response. Shoreline variability shows sediment accretion on the east side of the structure during sea breezes, whereas during NNW storm events, the accretion occurred on the west side. Importantly, on a scale of days, sediment bypassing occurs, and hence a net accretion was measured at both sides of the structure. During this time, a second structure was deployed 30 m apart to test the performance of a double-groin system, finding a net shoreline advance at all beach transects. Thus, low-crested short-length permeable groins are found to be a suitable emergency mitigation measure against beach erosion in micro-tidal environments causing moderate shoreline change.

1. Introduction

Beach erosion occurs as a result of divergence of (cross-or along-shore) sediment transport. This problem has been exacerbated on sandy beaches over the past decades owing to both increasing human activities (poor coastal management practices) and climate change effects (sea level rise and storm intensification) affecting coastal areas. For instance, long term scenarios of sea-level rise predict an increase of at least 1.5 m by the end of the century [1]. Thus, low-lying areas are more vulnerable to future scenarios of coastal erosion [2].
Beach sand losses are commonly ascribed to the occurrence of storms, responsible for offshore sediment transport induced by undertow currents driven by large wave breakers [3]. Furthermore, coastal infrastructure can play an important role in the beach width changes when littoral transport is significant, for example, [4]. Therefore, different mitigation measures have been proposed including hard engineering solutions, for example, [5], or the so-called “building with nature” approaches [6].
In recent years, the use of groins has been discouraged in the United States and many other countries, including Mexico, despite their well-known potential to maintain beach width and reduce sand losses [7]. This is mainly ascribed to the lack of knowledge of littoral processes that need to be considered for the structure design, functionality, and stability [8]. The groins’ functional design performance must be evaluated in terms of the amount of sediment bypassing instead of the amount impounded [7]. Wang and Kraus [9] conducted laboratory experiments on the groin performance owing to groin notching, finding that swash zone notching was the most efficient. Otay et al. [10] suggested that permeable groins might cause the deposition of sediment to be equal on the updrift and down-drift side of the structure. Previous studies have been devoted to the study of the design, effectiveness, or impact of permeable groins, for example, [11,12,13], finding that most of their conclusions are site-specific.
The aim of this work is to provide guidelines on the construction of permeable groins and their deployment on a sea-breeze dominated micro-tidal beach subject to significant littoral transport. More specifically, we propose the design of a low-crested permeable groin made of hexapod concrete elements. Its functionality and stability are evaluated by conducting short-term (24 h) and multi-day field experiments comprising mean and extreme wave conditions. The outline of this paper is as follows. Firstly, the description of the study area is presented in Section 2. Then, material and methods are described, including the description of the permeable groin design, experimental setup, measurements, and data analysis (Section 3). The results section presents the shoreline changes occurring in the vicinity of the single- and double-groin system on scales of hours, days, and weeks (Section 4). Finally, concluding remarks are given in Section 5.

2. Study Area

Sisal beach is located on a barrier island in the northern Yucatan peninsula (Mexico) (Figure 1). A thorough description of this field site has been presented in prior studies [14,15,16], and hence only an overview is given here.
The beach is composed of carbonate medium sand and is characterized by the presence of a vegetated dune and a submerged sandbar system (see Figure 1c). A wide and shallow continental shelf dissipates the incoming wave energy from the Gulf of Mexico. The field site is located east from the Sisal port (Figure 1c). The study area is characterized by a micro-tidal (spring tide of 0.8 m) mixed diurnal regime and low-energy wave conditions (i.e., Hs = 1 m at 10 m water depth). Winter storms in this area, known as Central American cold surge (CACS) or Norte events, are associated with cold-front passages in the Gulf of Mexico. These events occur between October and May and can present a significant inter-annual variability [17]. During these synoptic conditions, relatively high energy waves, which exceed 1.5 m and can reach more than 2.5 m at 10 m water depth, arrive to Sisal beach from the NNW inducing a storm surge as high as 1 m during intense events [18]. Moreover, short-lasting (few hours) local storms known as turbonadas can reach similar wave heights and wind intensity as extreme CACS events. Despite that wind intensity and storm surge are comparable to CACS events, both wave height and wave period are smaller, owing to smaller fetch and storm duration. On the other hand, hurricane events can significantly affect this area, but with a much lower occurrence [18]. The last hurricane that affected the northern Yucatan peninsula was Hurricane Isidore in 2002.
Mean wave conditions are controlled by more frequent sea-breeze events. Local breeze wind generates short-period high-incidence angle NE waves that drive a westward along-shore circulation [14]. A persistent westward littoral transport occurs across the nearshore, which was estimated between 20,000 and 80,000 m3/year using a numerical model [19]. Such net transport is commonly ascribed to sea breezes and can be significant inside the swash zone during sea breeze events [20]. Beach width is approximately 30 m at the field site and is strongly influenced by the port’s jetty. Seasonal beach variability, associated with the prevailing wave conditions (winter storms and sea breezes), induces beach rotation, whereas the long-term evolution is explained by sediment impoundment at the port’s jetty [16]. Owing to low-energy conditions and large sediment transport, this field site has been employed in a previous study as a natural laboratory to investigate shoreline perturbations [15].
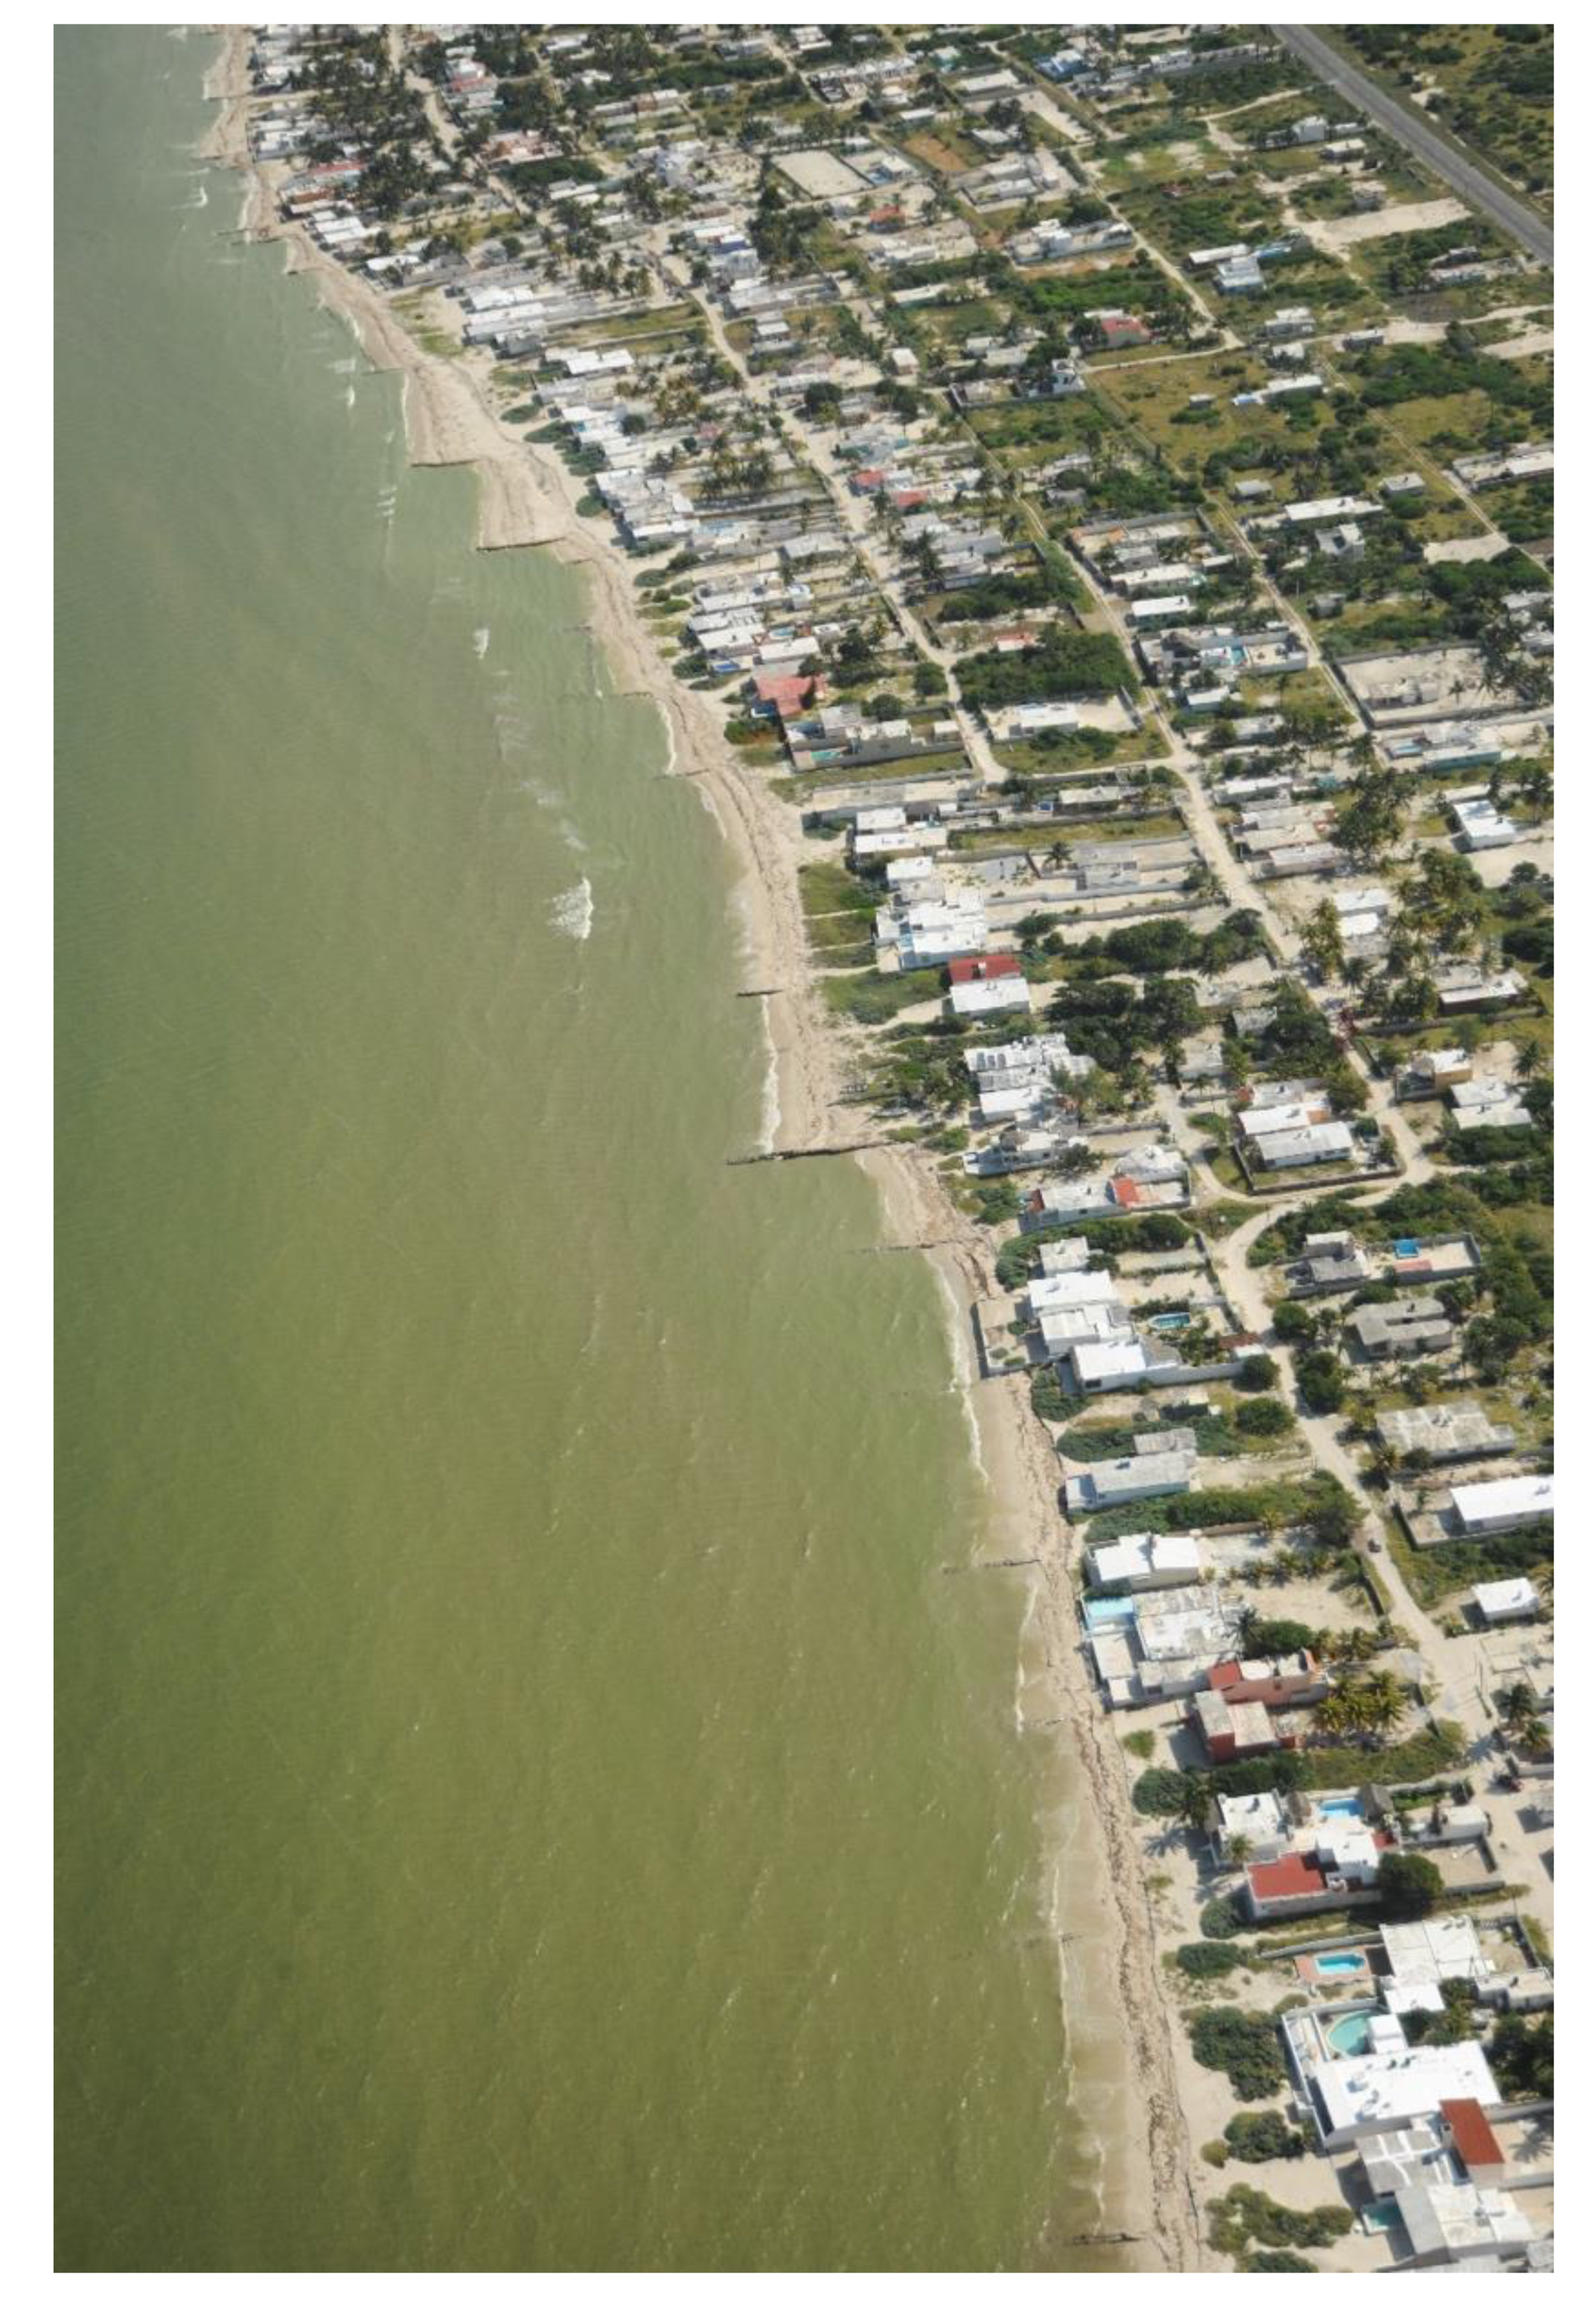
The northern Yucatan peninsula has been experiencing beach erosion over the past four decades [21]. Field observations show that the shoreline is highly sensitive to the presence of small coastal structures that induce along-shore sediment transport gradients in the swash zone, for example, [15,20]. Over the past few decades, coastal structures have been employed, with mixed success, as a mitigation measure against beach erosion in Yucatan. Some examples are the use of traditional groins made of timber and rocks [21,22,23], geotextile tubes filled with sand placed near the shoreline [24], and (permeable and impermeable) detached breakwaters [25]. The most popular mitigation measure implemented by local property owners in the 1960s–1980s along the Yucatan coast was the construction of groins (Figure 2), with different lengths, heights, and separation between them, made out of timber and rocks [22].
Tereskiewicz et al. [23] built an inventory of the various types of groins present along a 13 km stretch of the Yucatan coast. They quantified more than 300 groins of different sizes made of different materials. Similar groin patterns can be identified at other sites along the Yucatan coast. Most of these groins are unauthorized structures built by beach home owners. Medellín et al. [15] conducted a field experiment to quantify the impact of such types of groins: an impermeable 15 m long temporary groin, made of plywood and steel, was monitored during one (diurnal) sea breeze cycle. Field observations, consisting of beach surveys, show significant beach accretion/erosion on the up-/down-drift side of the structure in only 24 h. More recently, Torres-Freyermuth et al. [25] conducted a monitoring program to evaluate the performance of low-crested submerged detached breakwaters made of geotextile tubes and Reef Balls. The beach response behind the impermeable breakwaters was larger, and hence negative effects on adjacent beaches were more significant as compared with permeable breakwaters made of Reef Balls. Field observations revealed that down-drift effects on adjacent beaches are strongly dependent on the type of structure and permeability.

3. Materials and Methods

3.1. Permeable Groin Design

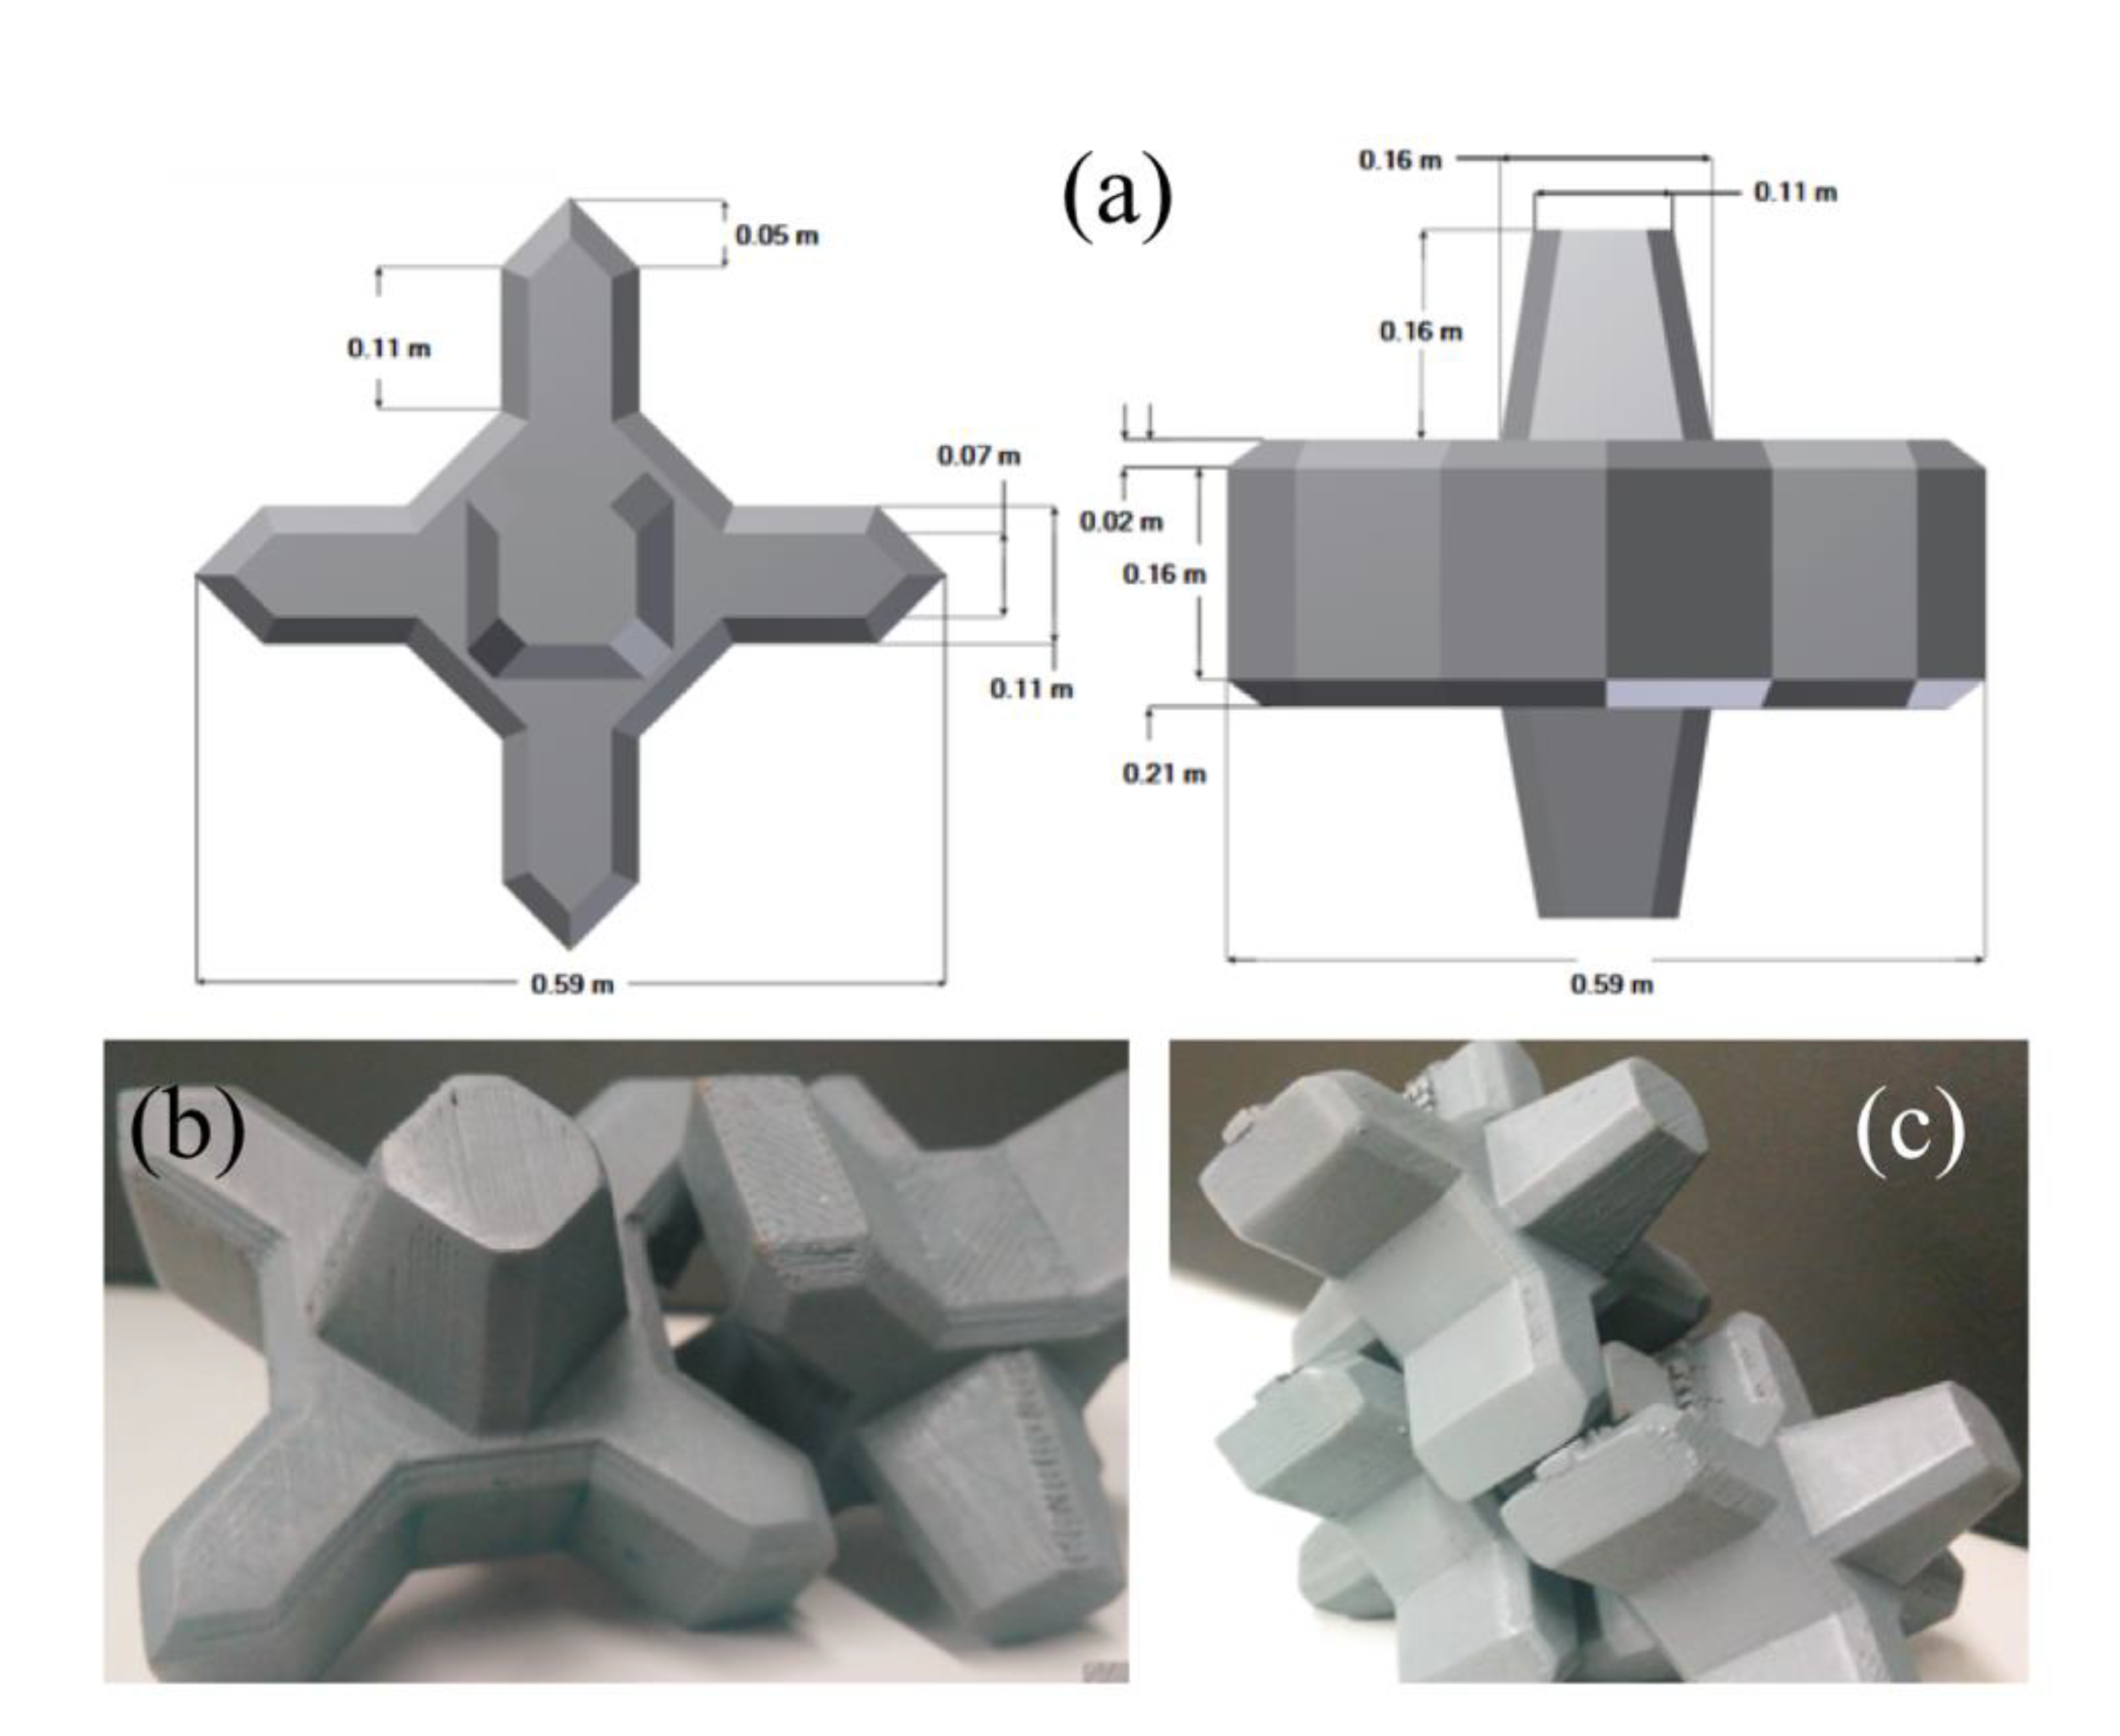
The 15 m long permeable groin was composed of 72 concrete hexapod elements. Each element is 0.59 m long and high, and 0.53 m wide (see Figure 3a), and has a mass of approximately 60 kg. For the groin construction, the elements were stacked in three rows, the first comprising 42 elements extending the full length from the subaerial beach profile to the inner surf zone up to a water depth of 0.6 m. Adjacent elements within the same row were interlocked as shown in Figure 3b. The second row, comprising 18 elements, ran parallel to the first row, but started in the swash zone and extended toward the seaward end. Finally, the third row is a top layer located above the two bottom rows and consisted of 12 elements interlocked using a cross-pattern (Figure 3c). The deployment time was approximately 2 h for a 20-person crew. The structure design allows sediment bypassing through the top of the structure when the up-drift side becomes saturated by sand. The same design was employed for both the 24 h and 60 day experiments. For the double-groin system, a spacing ratio of 1:2 was selected, which falls into the range 1:1 to 1:4 from the literature review of Balsillie and Berg [8].

3.2. Experimental Setup

Field experiments were conducted on a sea-breeze dominated beach to evaluate the performance of the 15 m long low-crested permeable groin. An overview of the short-term (Spring 2016) and multi-day (Spring 2017) field experiments is provided below. A summary of the instrumentation and sampling scheme is presented in Table 1.

3.2.1. Mean Wave Conditions Experiment: 24 Hour Deployment of a Single Groin

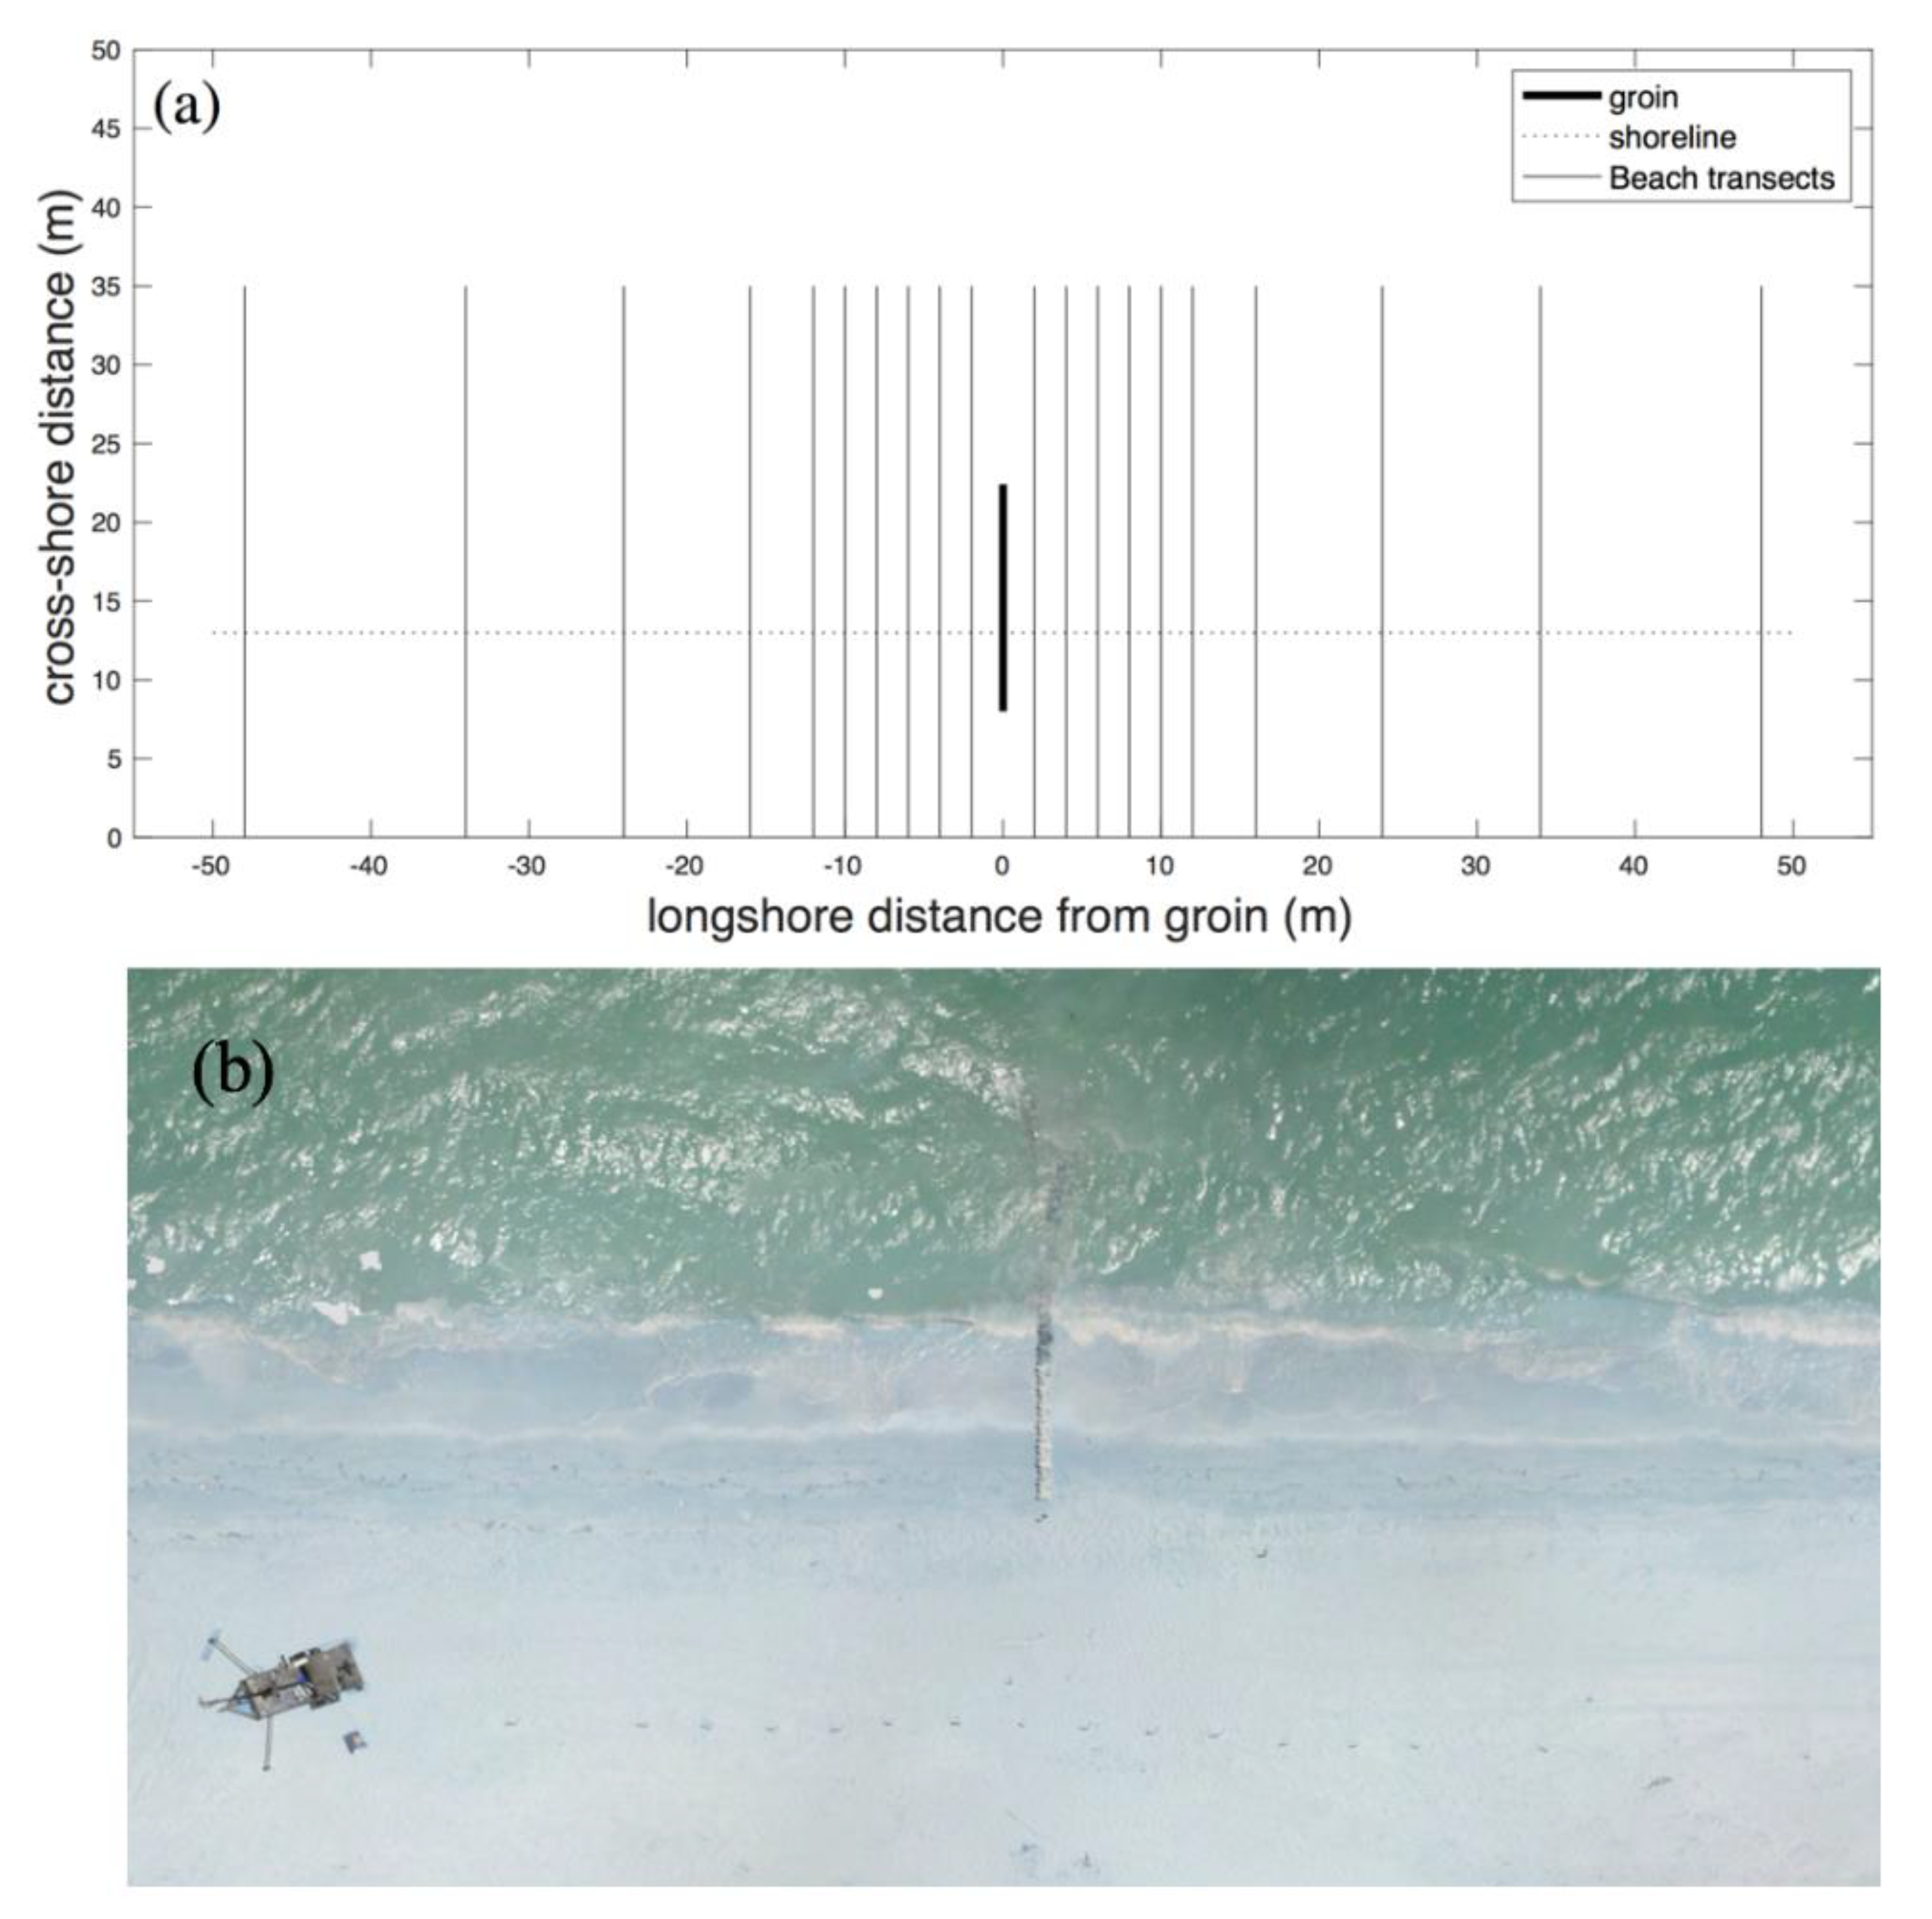
A short-term experiment, aimed to investigate the performance of a permeable structure during a single sea-breeze event, was conducted in Spring 2016. The groin described in Section 3.1 was temporarily deployed on the morning of May 31st, 2016. Beach profiles were undertaken along 20 transects using real time kinematics (RTK) global positioning system (GPS) Leica GS14. The system consisted of a base station permanently fixed in the roof of a building and a rover receiver carried out in a backpack, for example, [16]. The transects were separated in alongshore distance increasing from 2 m near the structure up to 10 m far from the structure, to allow for a better spatial resolution close to the groin (Figure 4a). A ground control point was measured before and after each survey in order to estimate the height of the rover antenna and to correct the measured elevation. The first survey was conducted before the structure deployment and the rest continued every two hours, including night hours, during the structure deployment (24 h). On the morning of June 1st, 2016, the structure was removed in less than two hours. Four beach surveys were conducted in the following two days to measure the beach recovery.
Wind, mean sea level, and waves were measured concurrently during the field experiment. Wind magnitude and direction at 1 Hz were measured with a meteorological station located at 5 m above the ground level. A tidal gauge installed inside the Sisal port (Figure 1c) measured the sea level every minute. An acoustic Doppler current profiler (ADCP) was deployed at 10 m water depth to measure 10 km offshore wave conditions (Figure 1b). These measurements allowed for the characterization of the forcing conditions during the experiment.

3.2.2. Mean and Extreme Wave Conditions Experiment: Multi-Day Deployment of a Single- and Double-Groin System

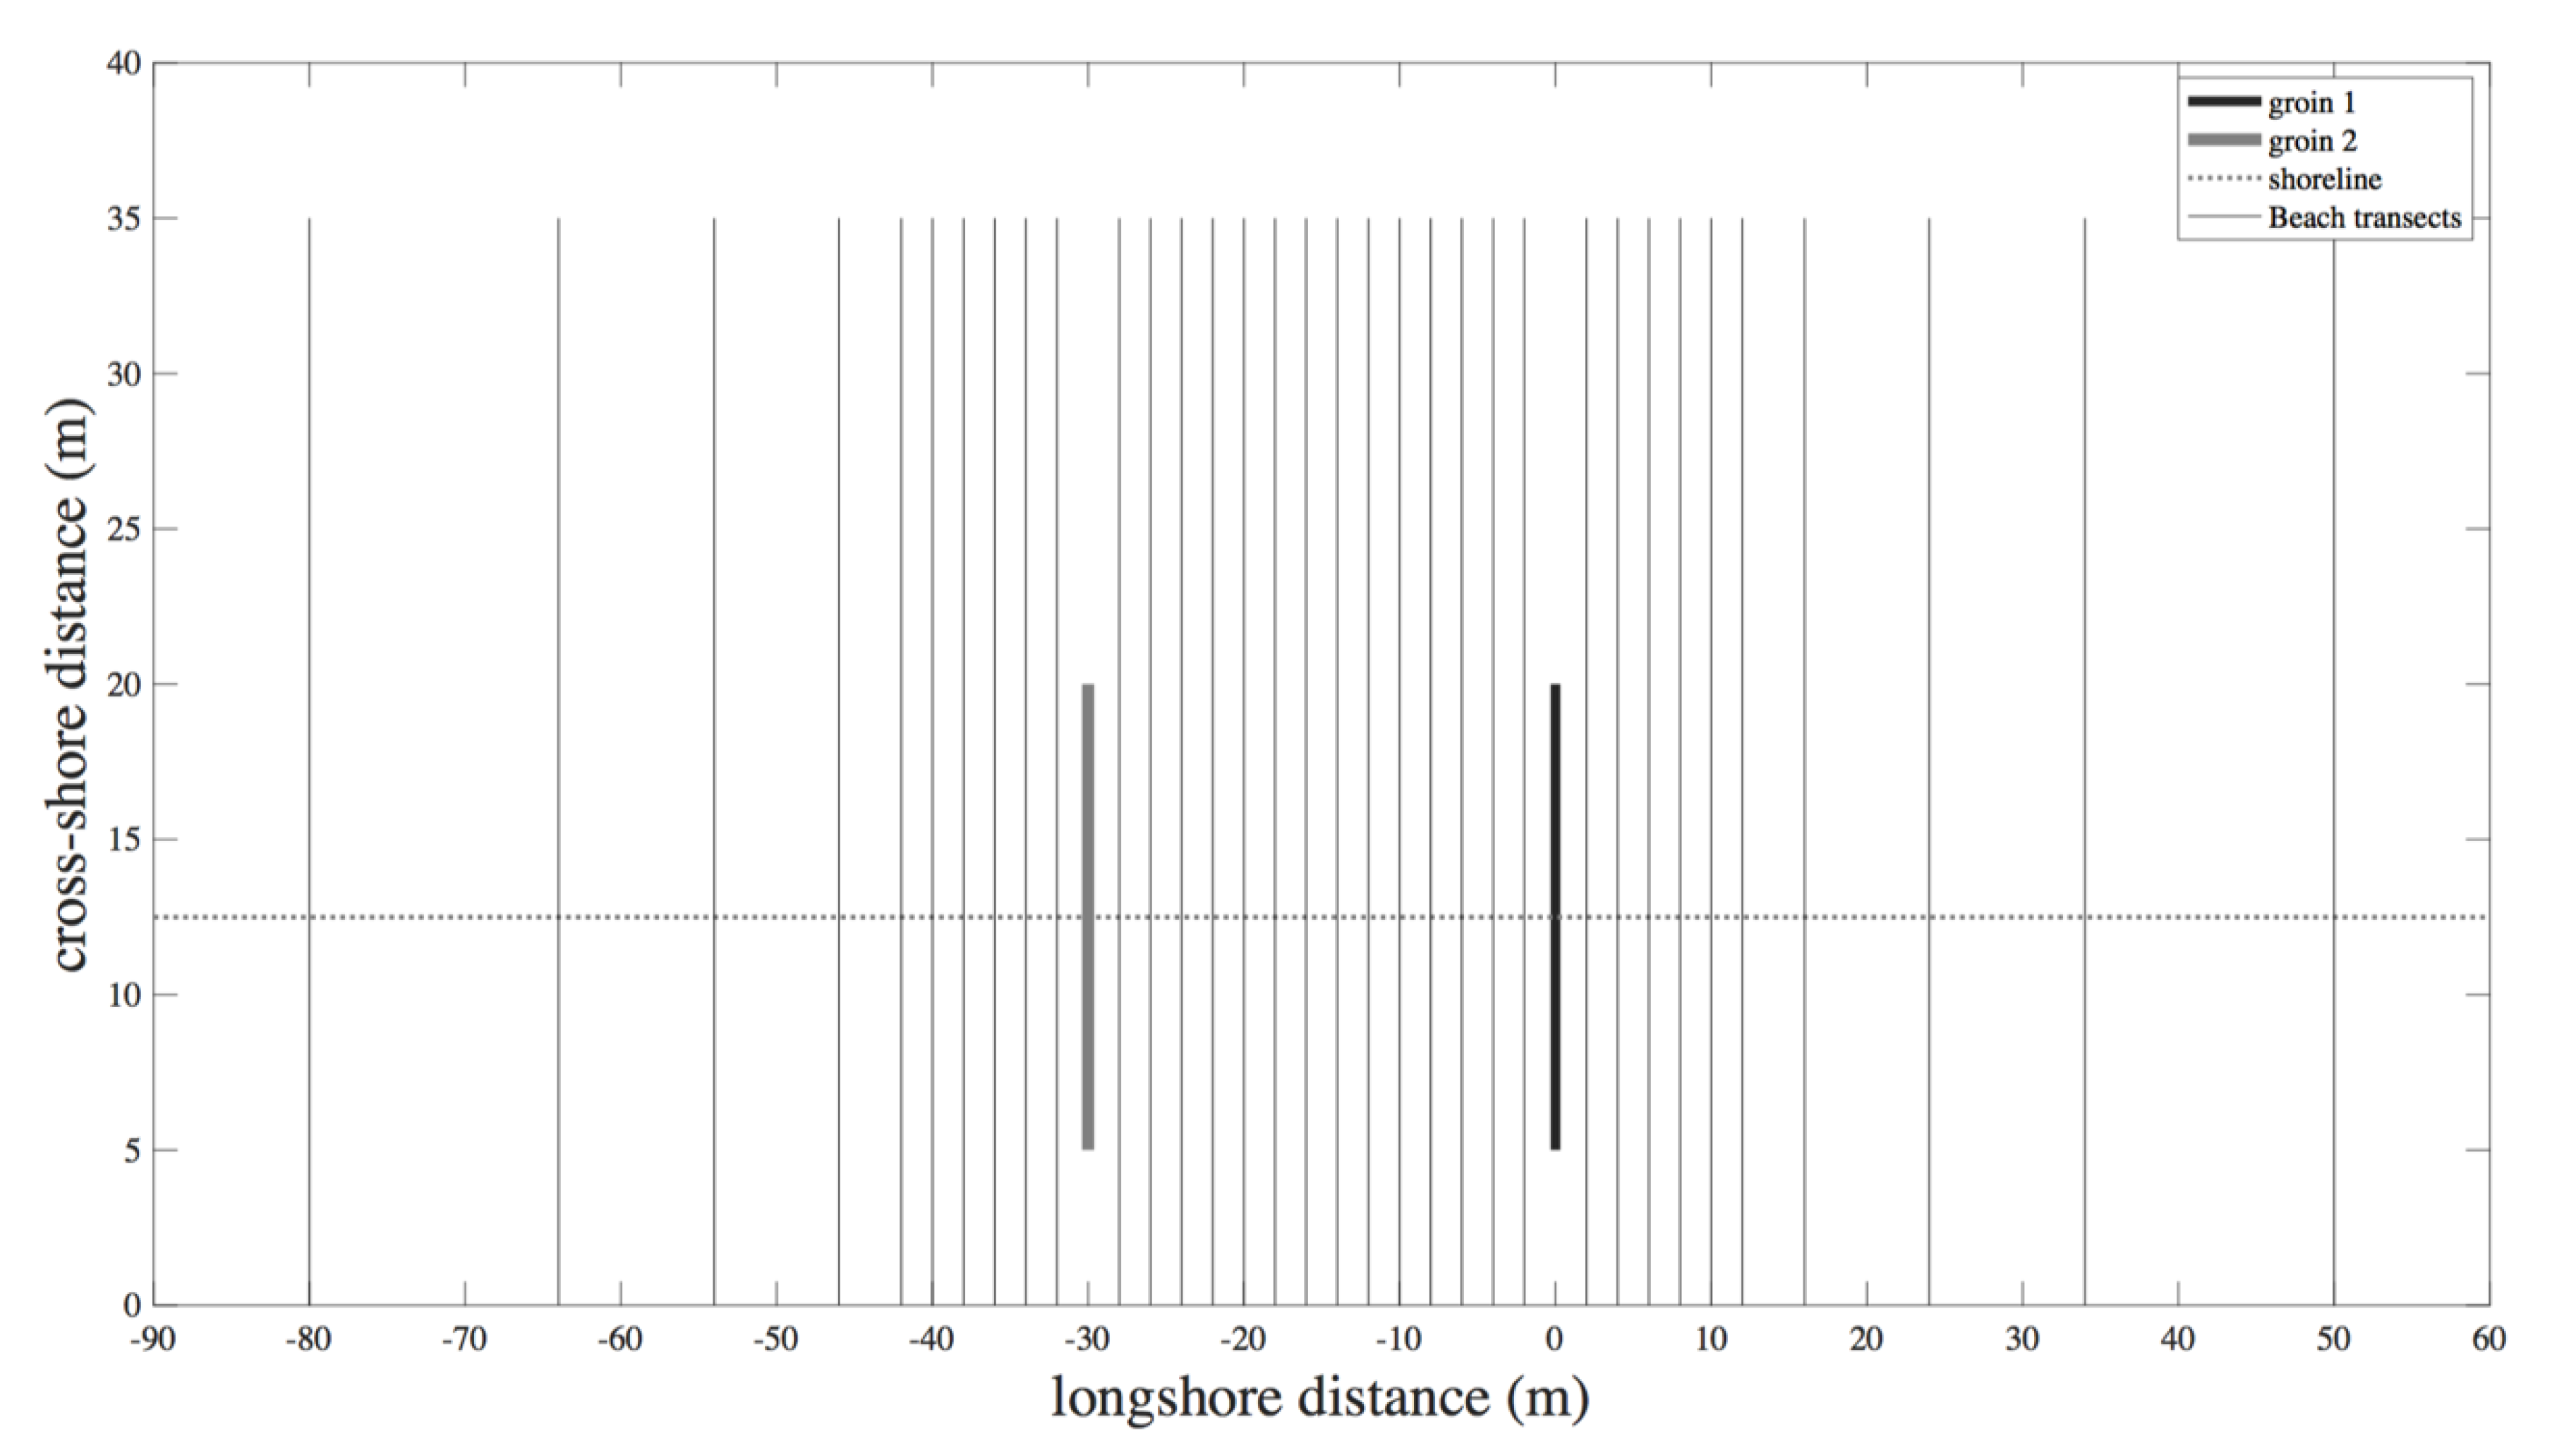
A 60-day experiment was conducted in Spring 2017 to investigate the structure stability and functionality. The experiment took place from May 2nd to June 30th, 2017. The multi-day experiment was conducted in two stages. During the first stage, beach profiles were surveyed along 20 transects using the same survey lines employed in the short-term experiment (see Figure 4a and Section 3.2.1). A first survey was conducted before the structure deployment, followed by six beach surveys conducted at selected dates in May (2, 3, 5, 8, 12, and 16) and June (8 and 14). This experiment was also meant to test the performance of a double-groin system. Therefore, for the second stage, a second groin with the same design was deployed 30 m (1:2 ratio) west of the first one on June 14th. Subsequent beach surveys were conducted at selected dates (June 16, 19, 23, and 27) and the separation and number of transects were re-designed (Figure 5) to assess the performance of the double-groin system. Tides and offshore waves were measured during the field experiment at the study site. Offshore wave conditions were recorded with the ADCP deployed at 10 m water depth. Wind magnitude and direction were not acquired during this period.

3.3. Data Analysis

Wave parameters, associated with both storm and mean wave conditions, were estimated from 30 min pressure and velocity measurements acquired with the ADCP deployed 10 km offshore at 10 m water depth. More specifically, the significant wave height (Hs), peak wave period (Tp), and mean wave direction (θ) were estimated. The wind and mean water level were obtained directly from the instruments when available (Table 1).
Beach profile measurements were projected to the nearest beach transects and the elevation data z were referenced with respect to the geoid MEX97 [26]. Subsequently, the shoreline positions (i.e., z = 0) were extracted from each beach profile in order to evaluate shoreline evolution. A three-point moving average was employed to smooth out the extracted shoreline. Empirical orthogonal function (EOF) analysis, for example, [27,28], was employed to investigate the spatial and temporal shoreline variability as follows:
x ( y , t ) = n = 1 N c n ( t ) e n ( y )
where en(y) is the spatial eigenfunction n evaluated in the longshore position y corresponding to each survey transect. cn(t) is the temporal eigenfunction n at time t corresponding to the survey date. The first mode, which contains most of the variance, can be associated with the shoreline response to the groin presence, for example, [15].

4. Results

4.1. Permeable Groin Impact during One Breeze Cycle

4.1.1. Forcing Conditions

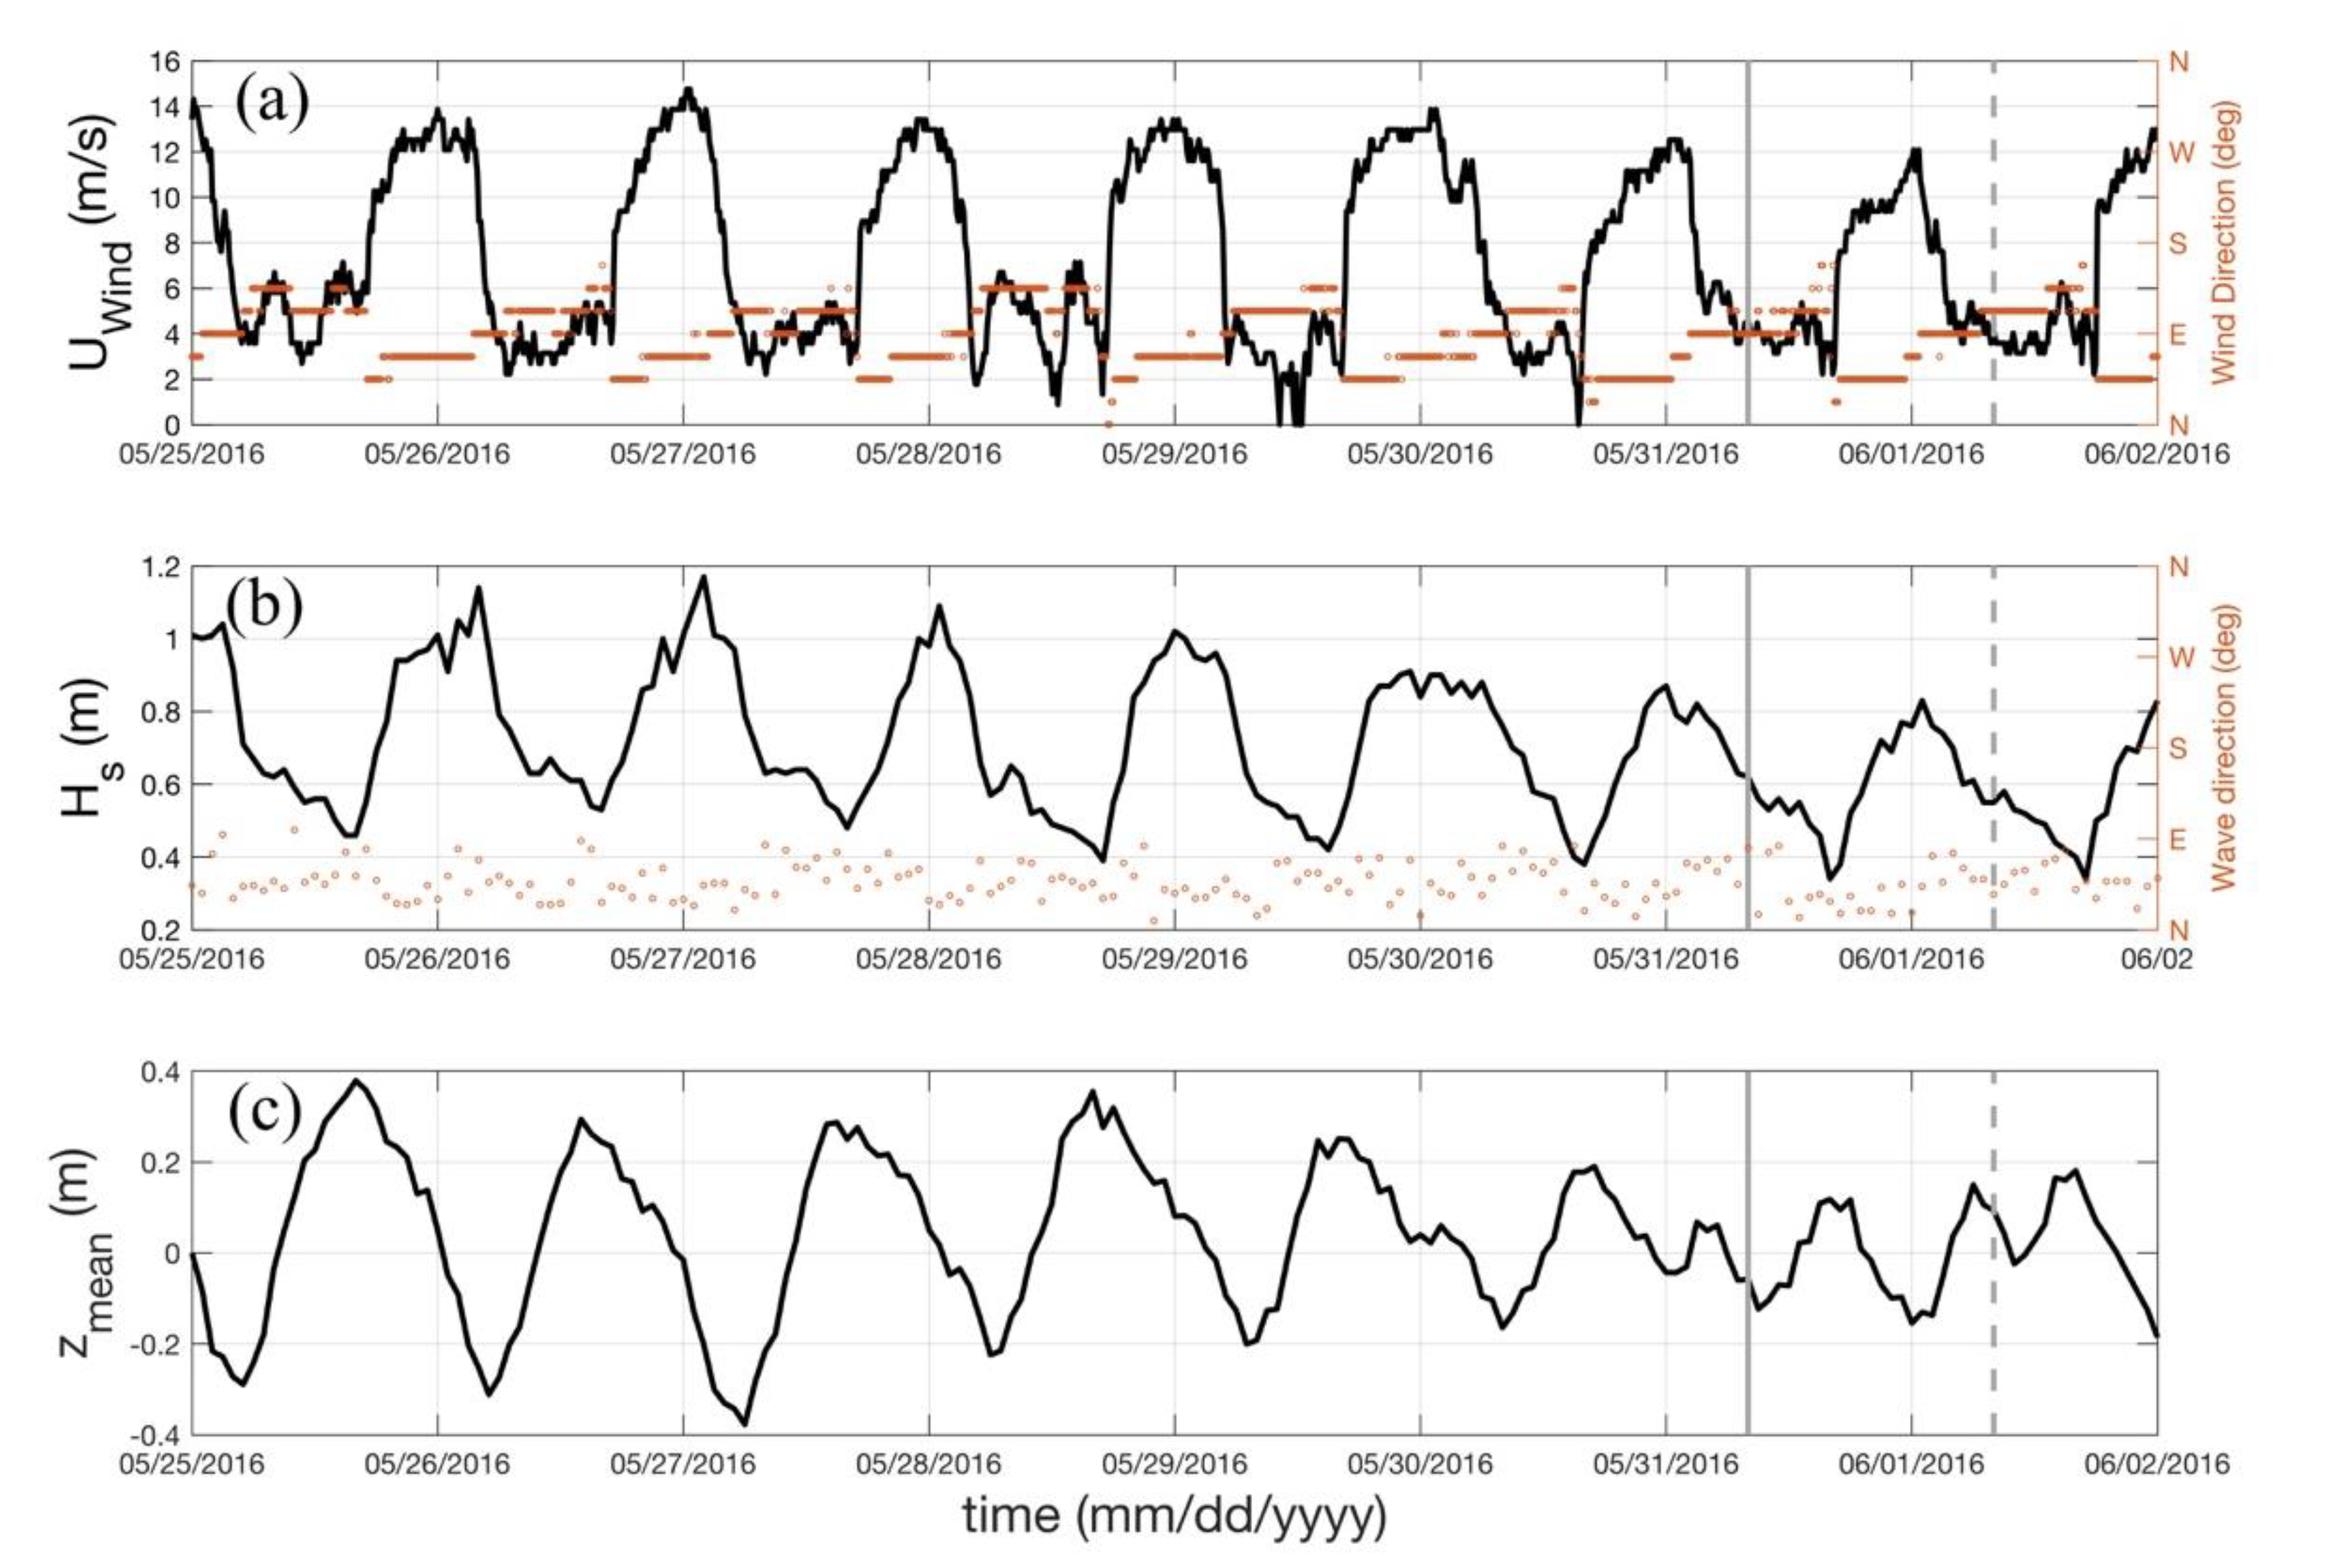
The wind conditions preceding and during the 24 h field experiment correspond to intense (Uwind > 10 m/s) sea-breeze events (Figure 6a). The breeze cycle in this area consists of mild seaward (SE land-breeze) winds during the morning and strong landward (NE sea-breeze) winds during the afternoon [29] (Figure 6a). Wave conditions are strongly controlled by local winds, and hence wave height is highly correlated with the wind intensity (Figure 6b), reaching the maximum wave height (Hs = 1.2 m) during the peak of the breeze cycle (see peaks in Figure 6a,b). The significant wave height doubles in a few hours as the wind switches direction from seaward (SE) to landward (NE). Waves approaching from the NE induced westward along-shore surf zone currents on the order of 0.30–0.50 m/s during the peak of the sea-breeze (not shown), for example, [14]. The role of tides during the experiment remained small because the structure was intentionally deployed during neap tides (Figure 6c) in order to restrict the horizontal extent of the swash zone, for example, [15].

4.1.2. Beach Response

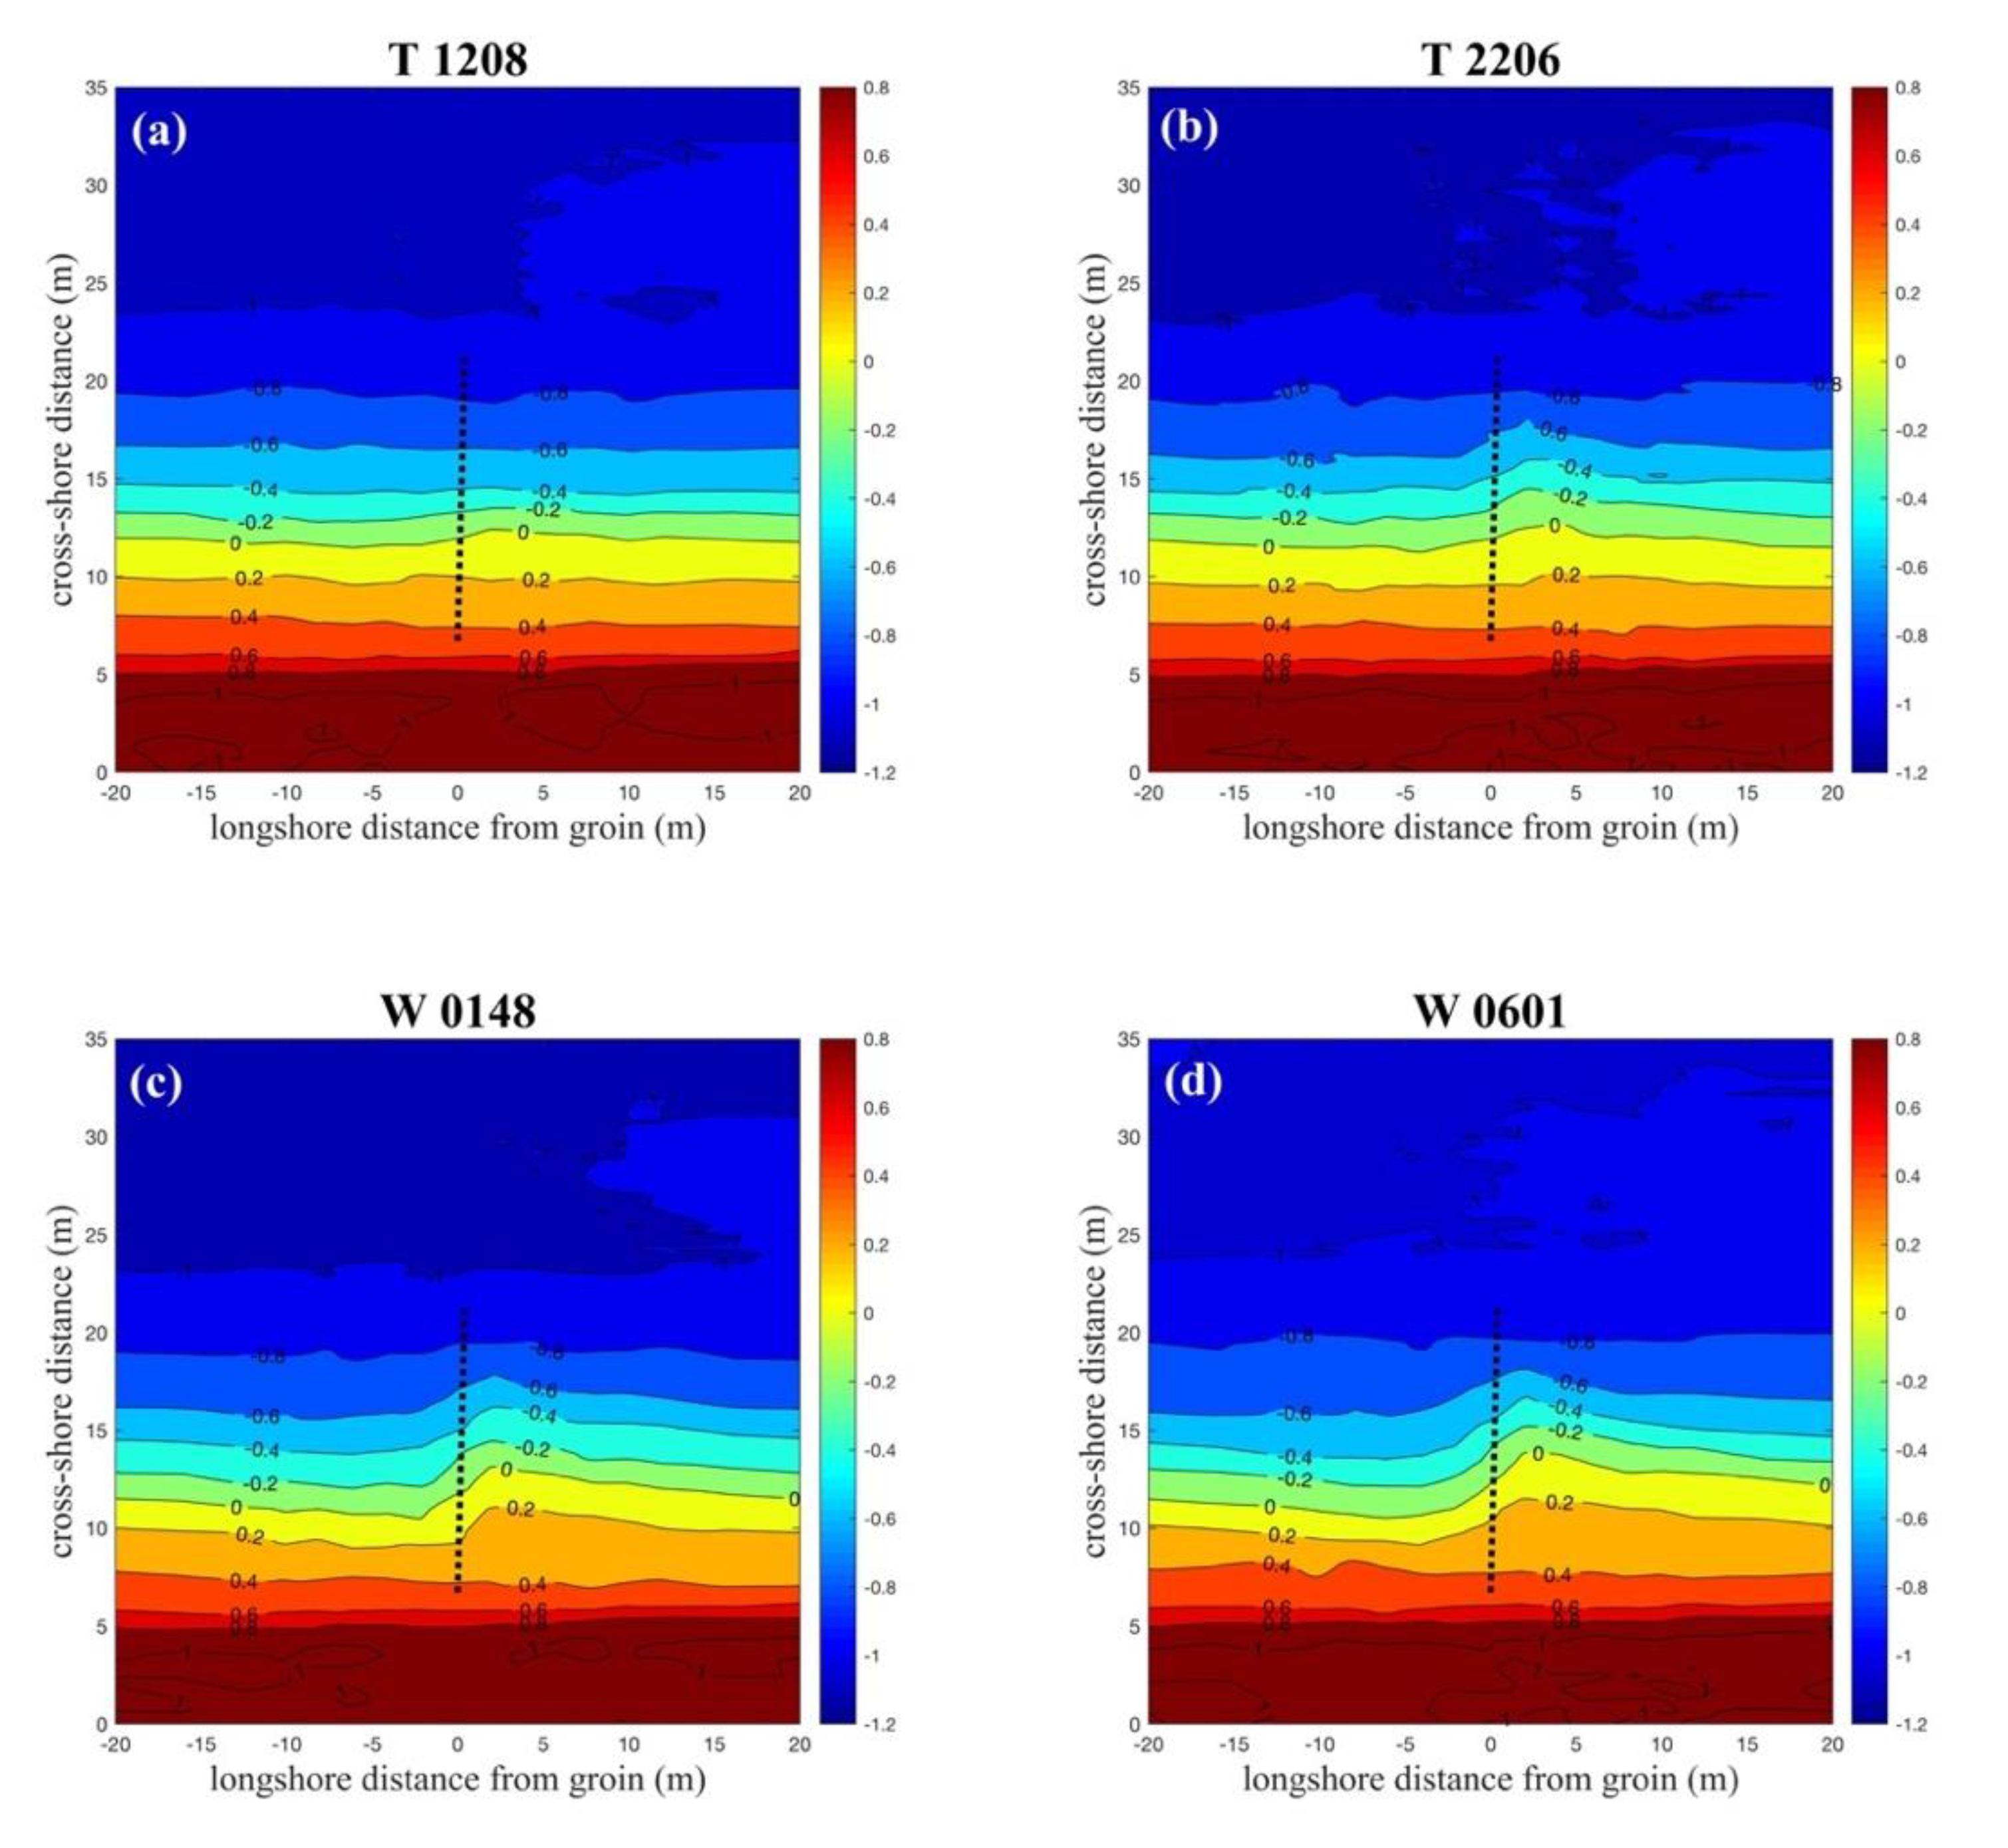
A relatively alongshore uniform bathymetry was measured in the study area before the structure deployment. The beach morphology changed rapidly owing to the presence of the permeable groin. The permeable groin partially interrupts the littoral transport, inducing beach accretion on the east side of the structure (Figure 7a) and beach erosion on the down-drift (west) side (see Supplementary Material). The surveyed beach measured 24 h after the structure deployment (Figure 7d) shows that the volumetric change at the up-drift side (35 m3/day) was about 50% of that reported by Medellín et al. [15] using a temporal impermeable groin with the same length under similar forcing conditions at this field site.
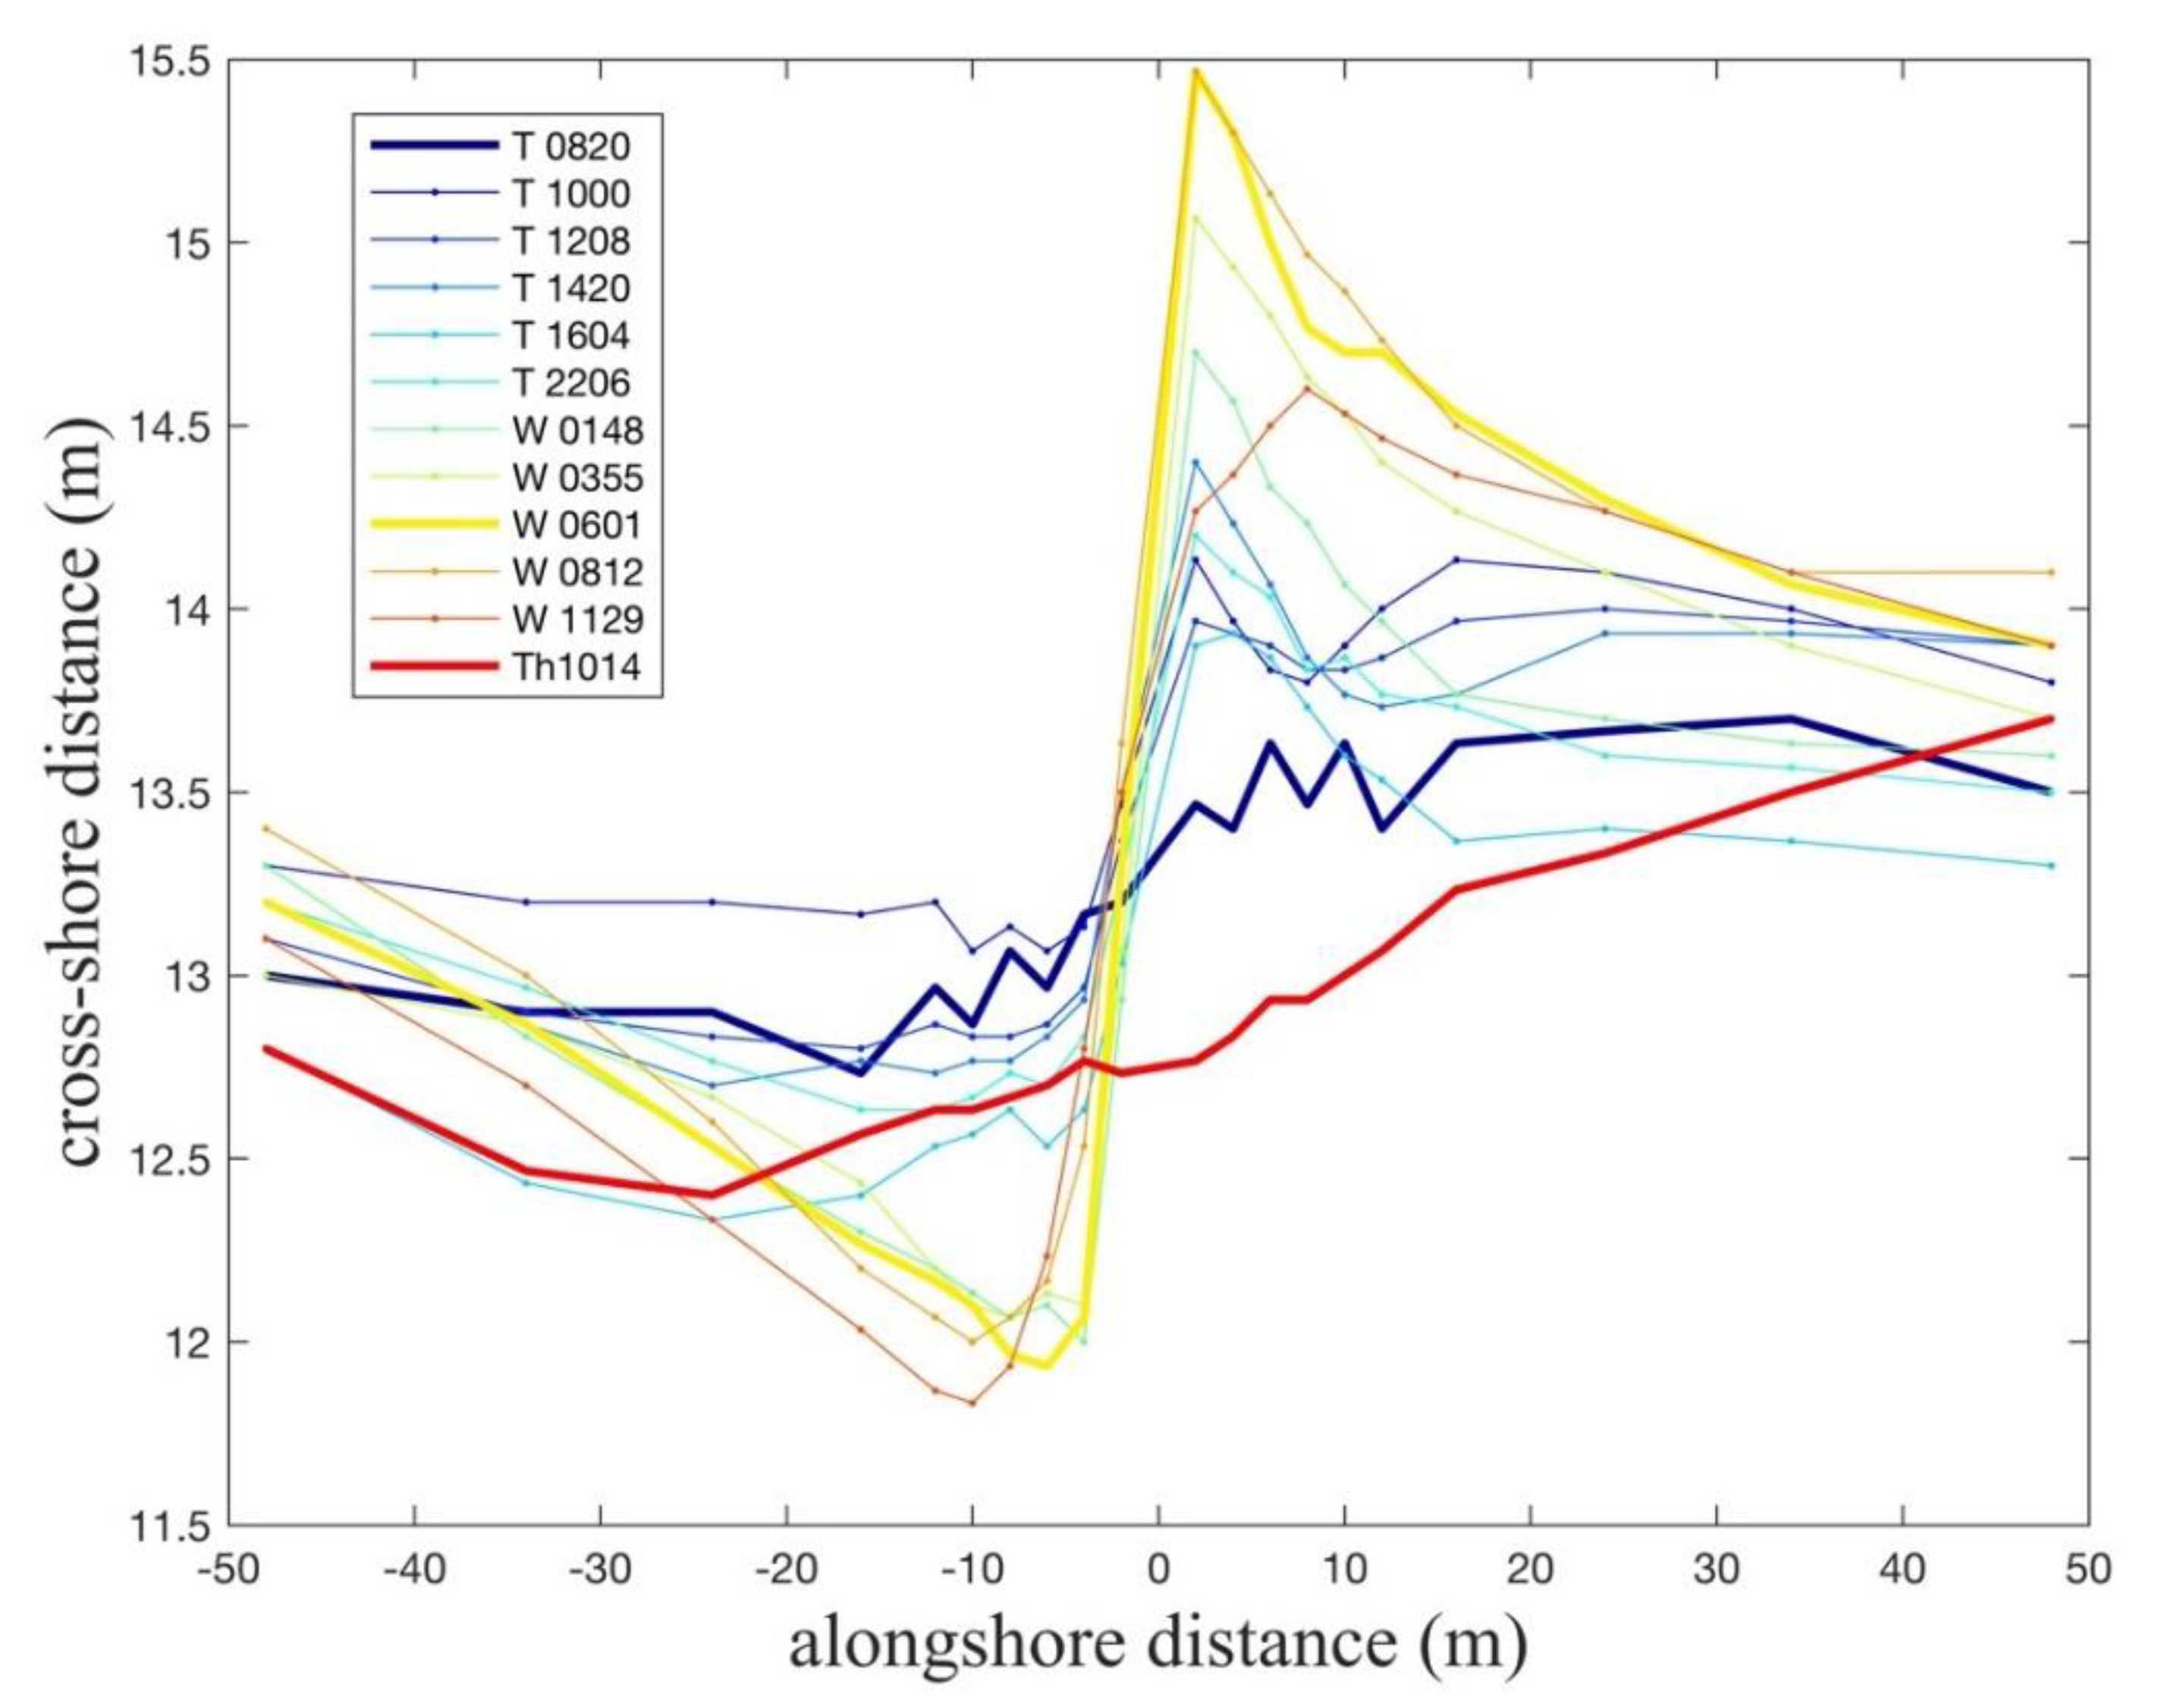
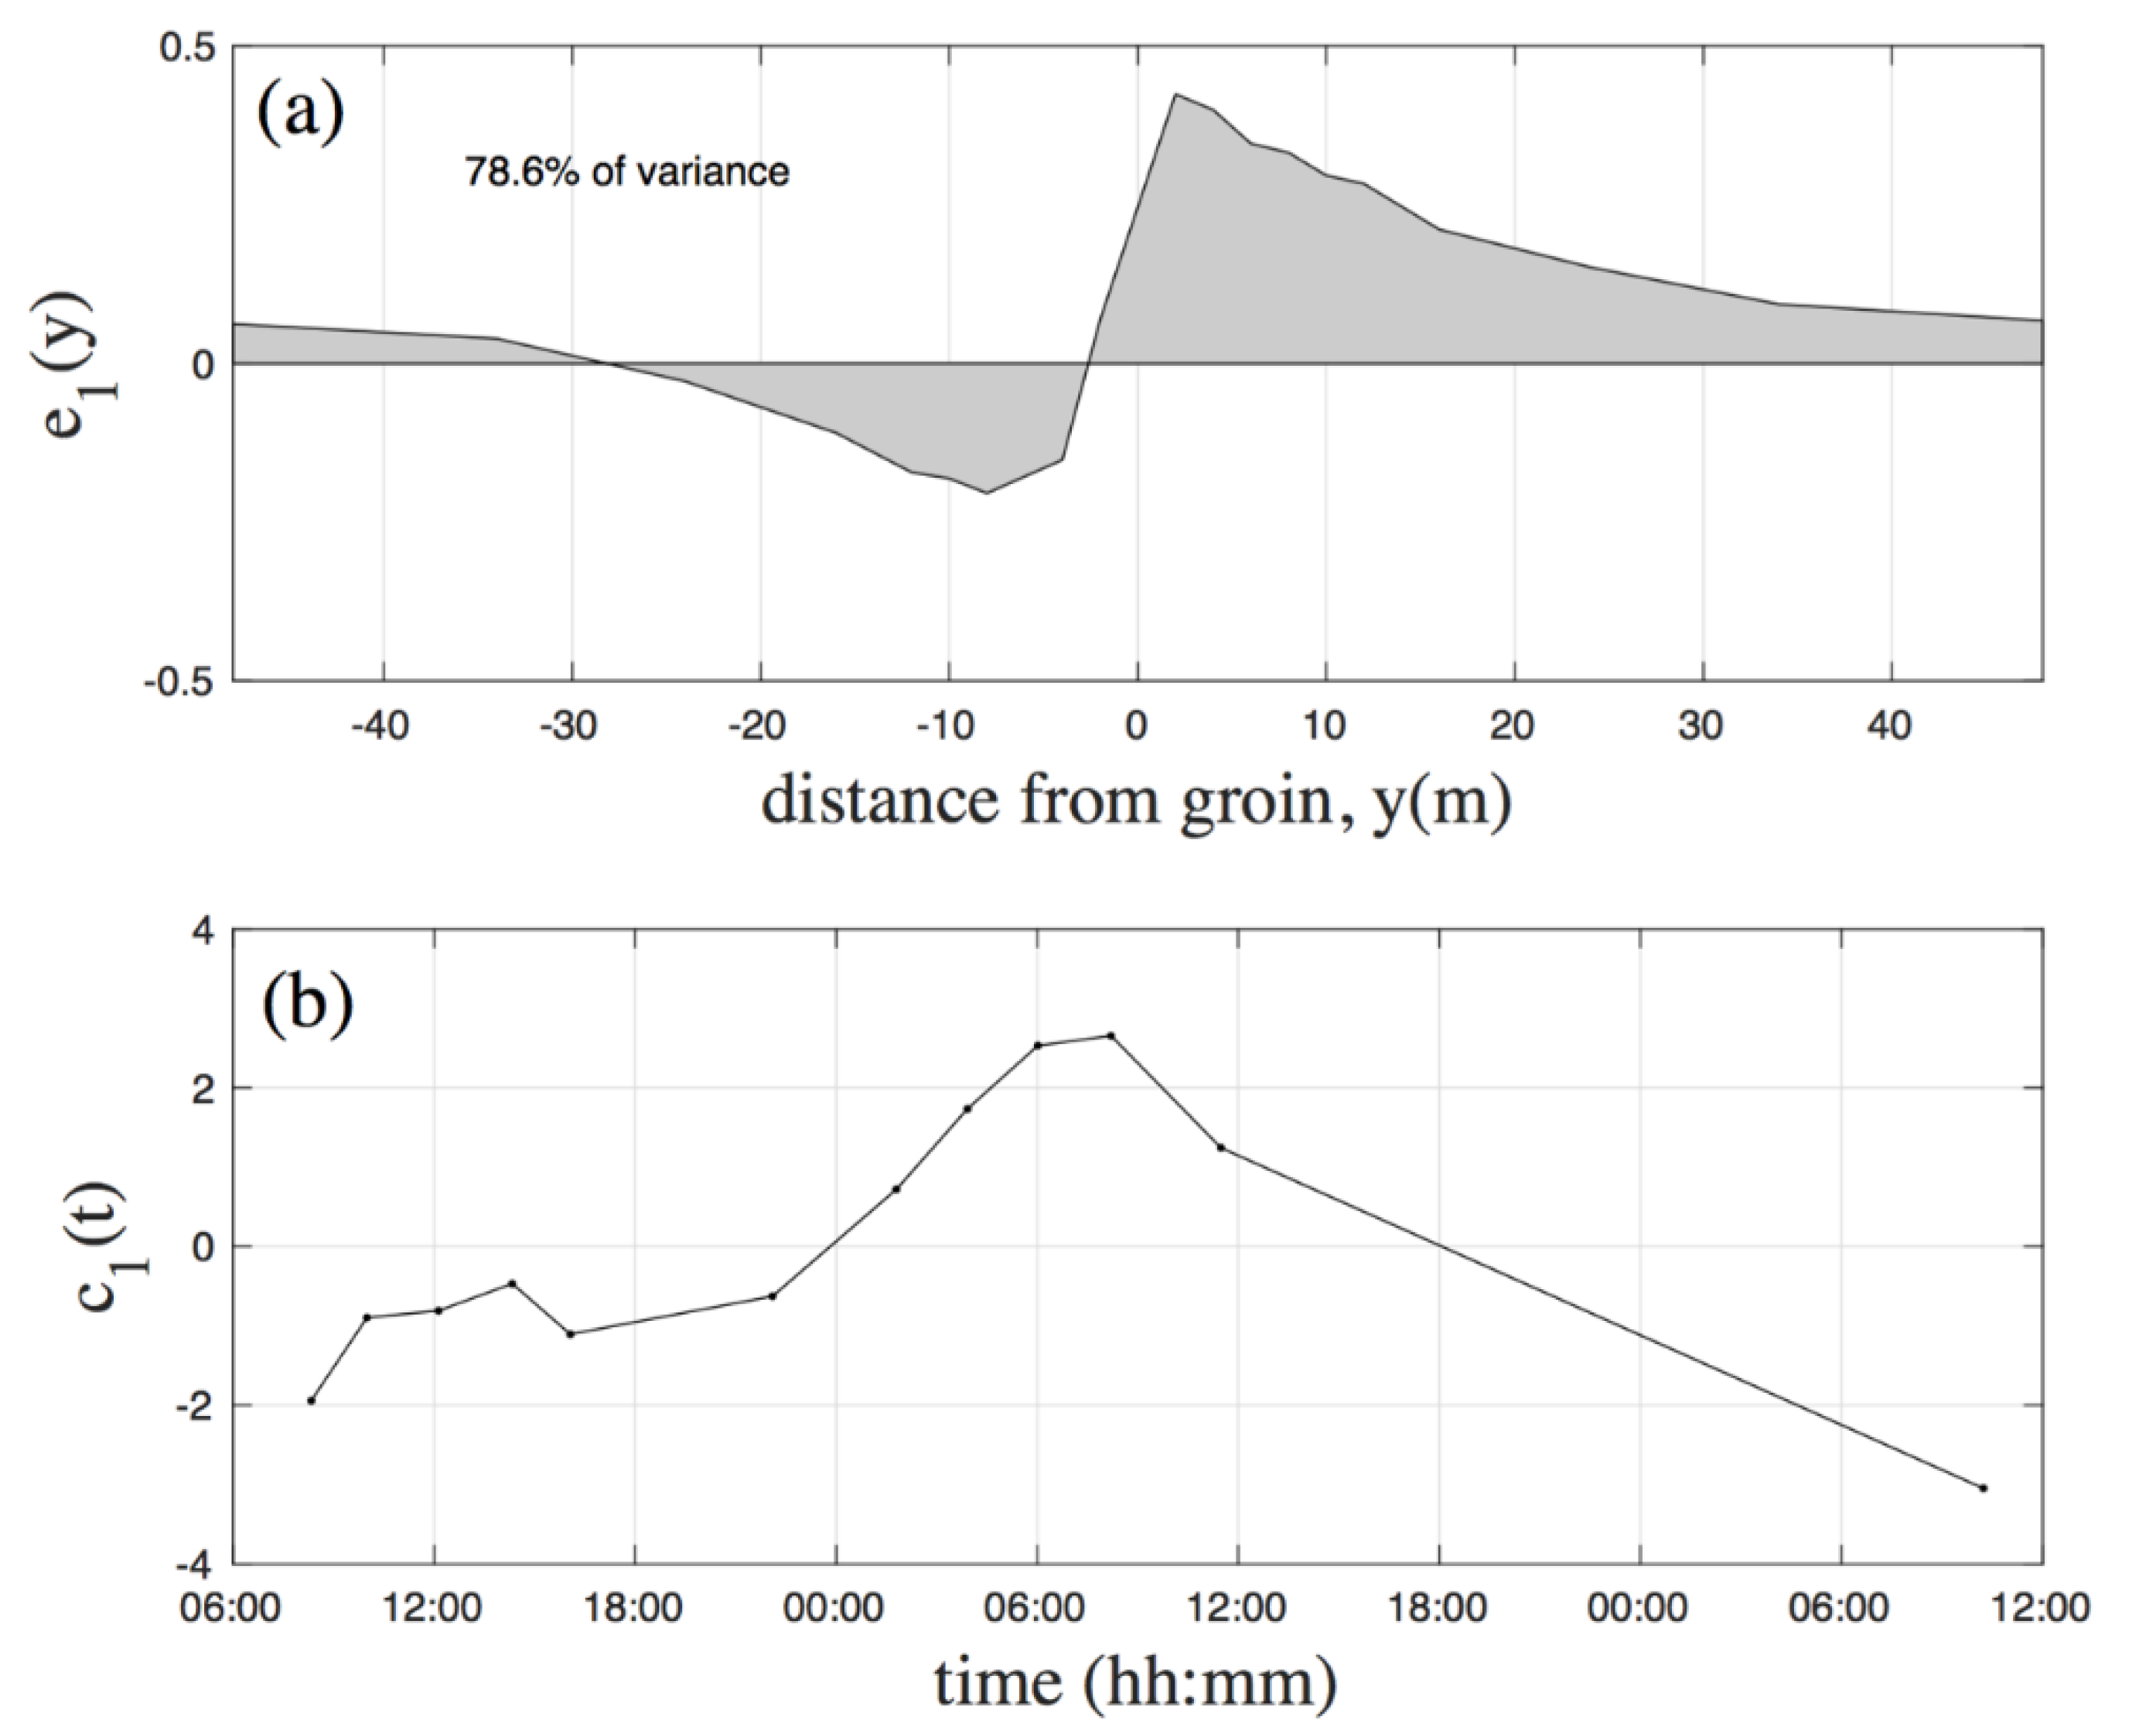
The beach profiles were measured to estimate the shoreline position (z = 0) and its evolution during the experiment. The shoreline presents changes since the first two hours after the structure deployment. In general, the shoreline position moved seaward at the up-drift (east) side of the structure, whereas it retreated at the down-drift (west) side (Figure 8). A maximum shoreline advance of 2 m was observed. After the structure removal, the shoreline tends to return to the initial condition (Figure 8). The impact of the structure on the shoreline position can be further investigated by means of an EOF analysis, for example, [15]. The first spatial and temporal mode, which explains almost 80% of the variance, can be ascribed to the groin presence, as already pointed out in Section 3.3. The spatial mode shows the dominant accretion/erosion pattern at the east/west side of the structure induced by the sediment transport impoundment east from the structure (Figure 9a). The temporal evolution (Figure 9b) represents the increase of shoreline change along the day, which seems to be correlated with the increase of wave energy associated with the intensification of sea breezes (Figure 6b). As shown in Figure 9b, the first spatial mode returns to the initial value 24 h after the structure removal. It is worth noticing that the shoreline position does not seem to reach saturation in the up-drift side, as observed by comparing the final survey with the preceding one (Figure 8). Therefore, questions arise regarding the structure’s capability to allow sediment bypassing, and hence the need to investigate the beach evolution on a longer term.

4.2. Assessment of Groin Stability and Functionality

The 24 h experiment demonstrated the structure effectiveness to increase the beach width in the upstream side during prevailing sea-breeze conditions and the beach capability to recover after the structure removal. However, a negative impact in the down-drift side was observed owing to the sediment impoundment (see Figure 7d and Figure 8). Therefore, a 60-day experiment was conducted to investigate the structure functionality considering different forcing conditions on a longer term.

4.2.1. Forcing Conditions

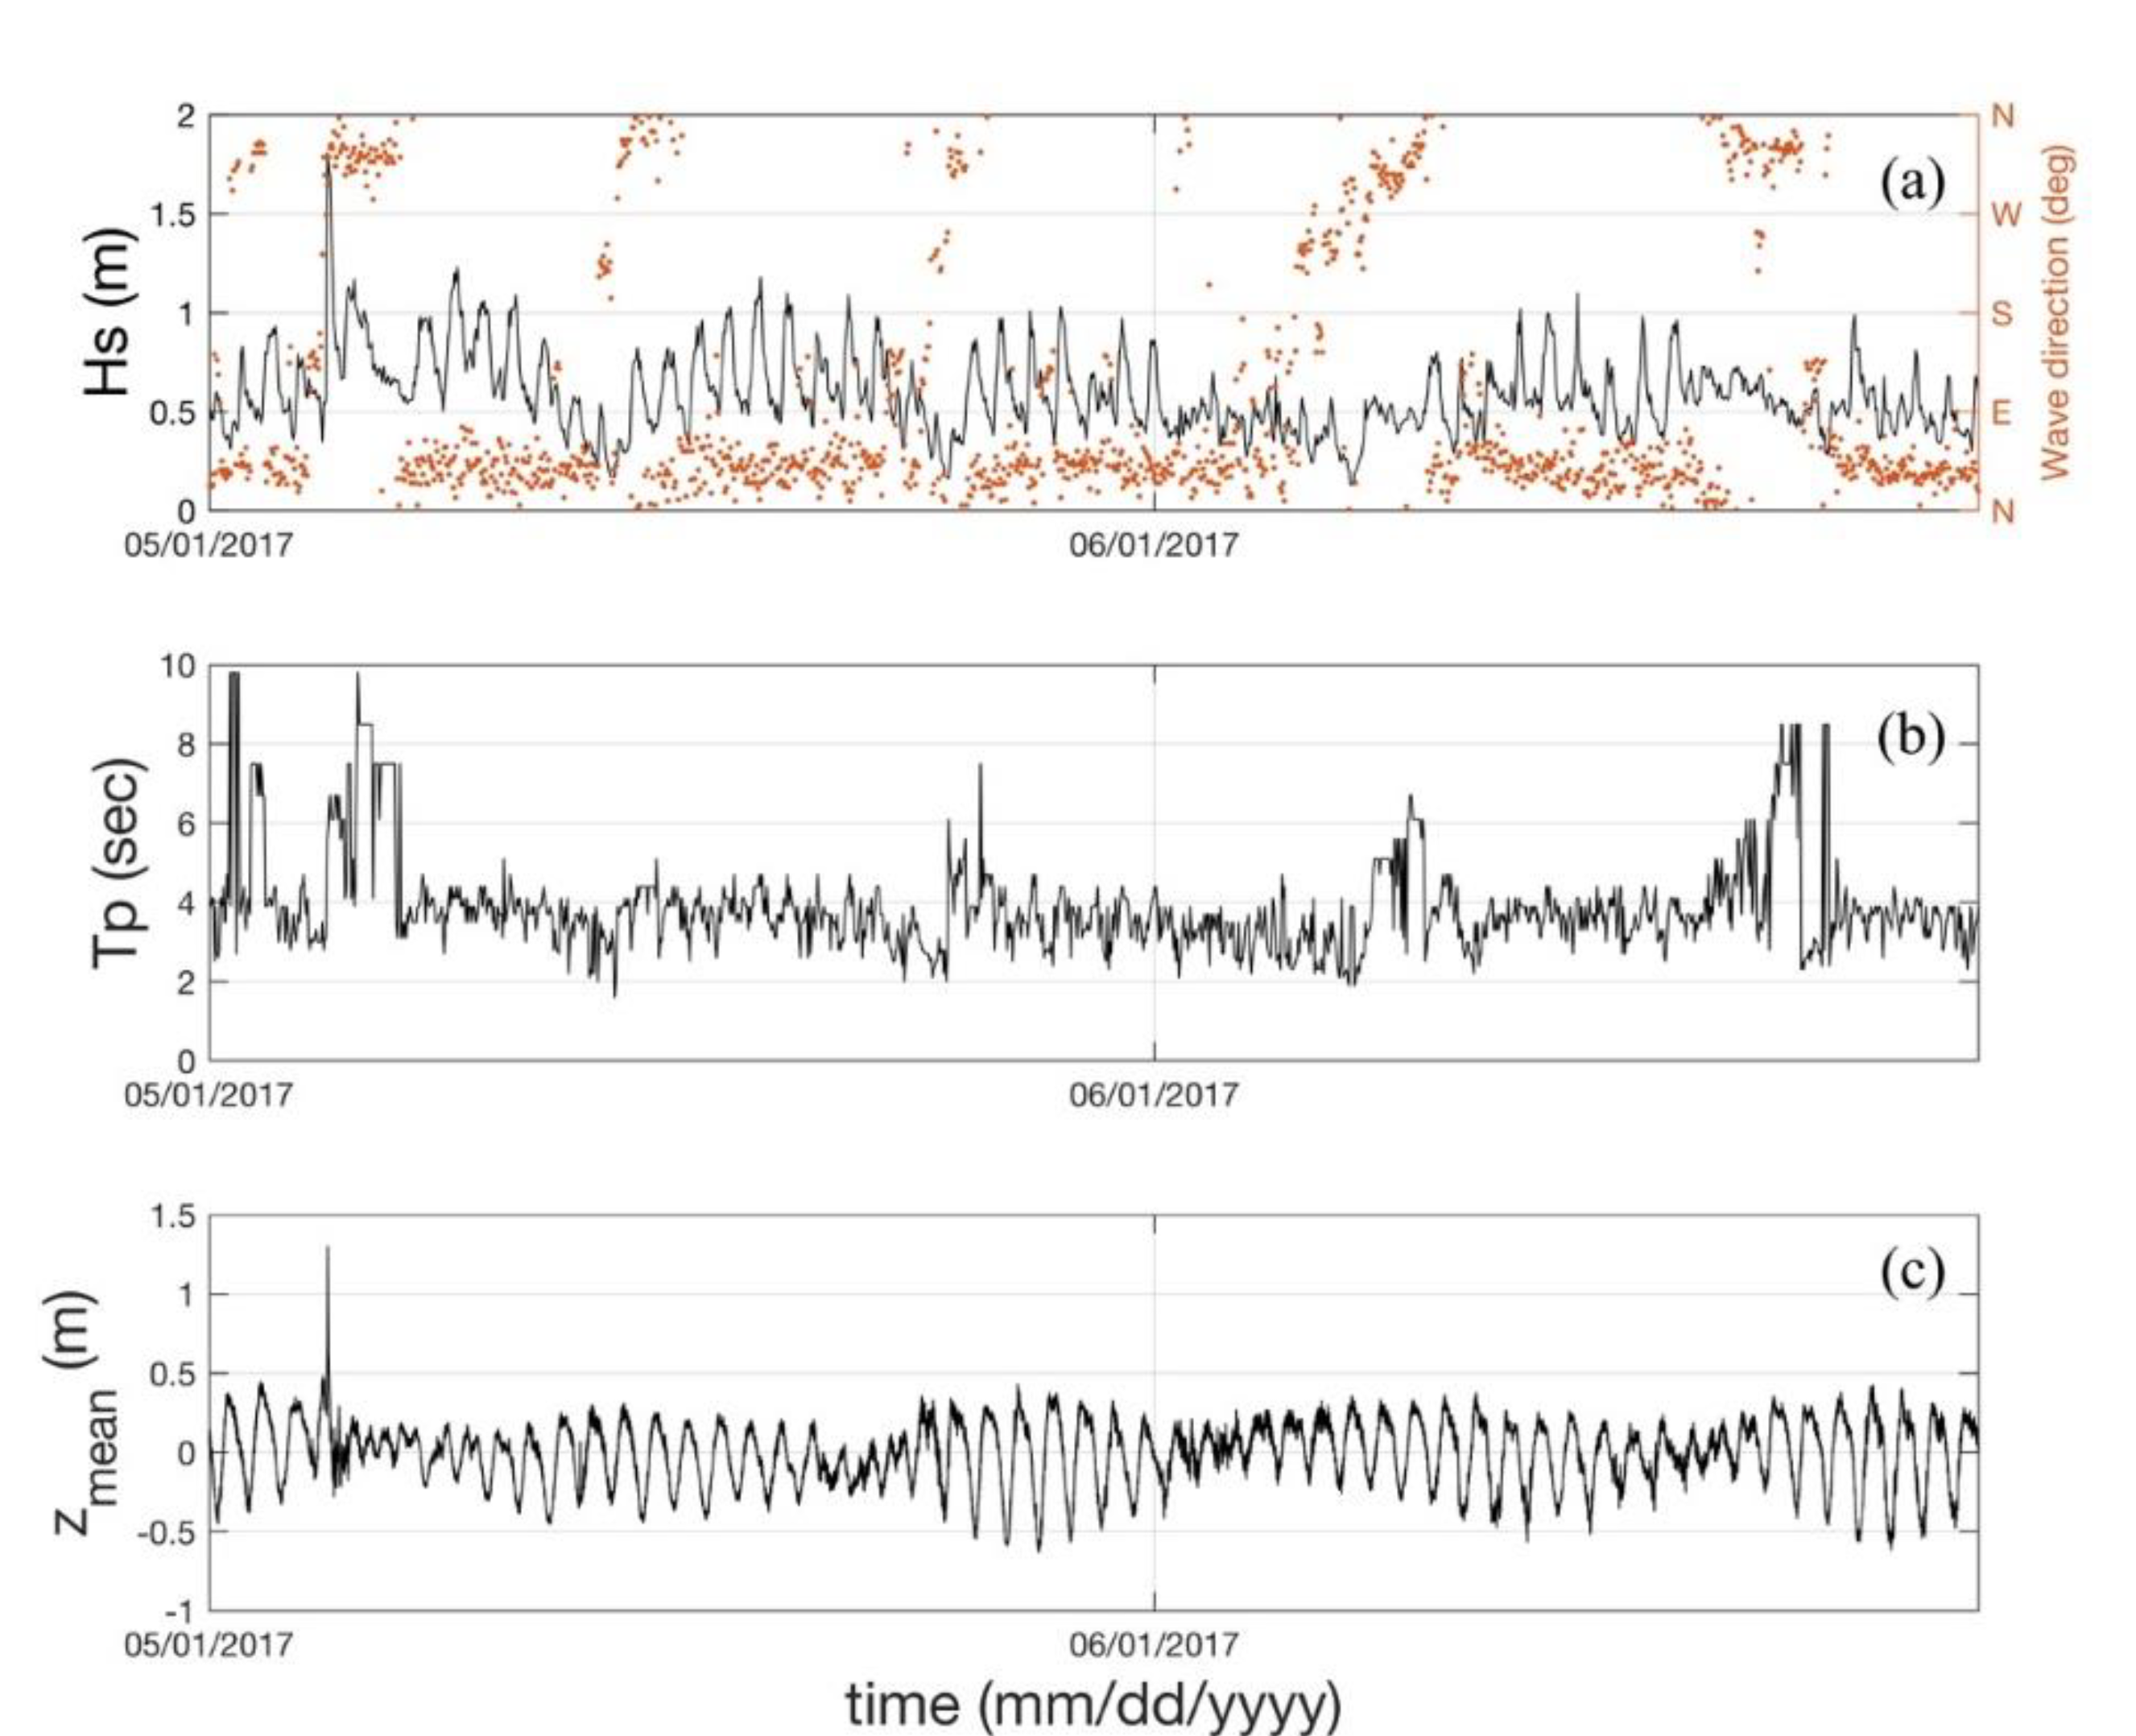
Wind conditions during the experiment included intense sea-breeze events; mild Central American cold surge events; and a local storm causing wind squalls, locally known as turbonada. The significant wave height and wave direction during the 60-day experiment ranged between 0.1 m and 1.8 m and NW–NE direction, respectively (Figure 10a). The wave height presented a diurnal variability during most of the experiment, associated with cyclic breeze events. The offshore significant wave height during intense sea-breeze events reached up to 1.2 m and was associated with short period waves (Tp = 4 s). On the other hand, the local turbonada storm arrived to the study area on May 4th, 2017. Strong winds (Uwind > 20 m/s) generated NNW energetic waves (Hs = 1.8 m) and a storm surge height on the order of 1 m (Figure 10c). These extreme conditions induced significant morphological changes in the subaerial beach in few hours. Low-energy swell also arrived to the study area during cold-front passages through the Gulf of Mexico. They were characterized by a Tp > 6 s and wave direction from the NNW, hence inducing eastward along-shore sediment transport.

4.2.2. Structure Stability

Marine conditions (Hs = 1.8 m and storm surge of 1 m) during the local storm allowed us to test the structure stability during extreme events. During mean wave conditions and tidal level variations, a significant part of the structure remained on the subaerial beach (Figure 11a). However, high water levels combined with storm wave conditions located the complete structure inside the swash zone (Figure 11b). Therefore, significant sediment bypassing occurs landward of the structure owing to the extension of the swash zone. Beach morphology measurements taken at the same beach, but located away from the structure show significant changes occurring on the subaerial beach owing to the local storm (Figure 12). Despite such energetic conditions, the structure remained at the same location (Figure 11b,c). Thus, the interlocking between the elements provided enough stability. After the storm, the structure was buried at some sections (Figure 11c) and some of the elements at the seaward tip were moved. Unfortunately, a detailed survey of the position of each one of the elements in the structure was not carried out. However, the structure was found to keep its functionality for the following days (Section 4.2.3).

4.2.3. Structure Functionality

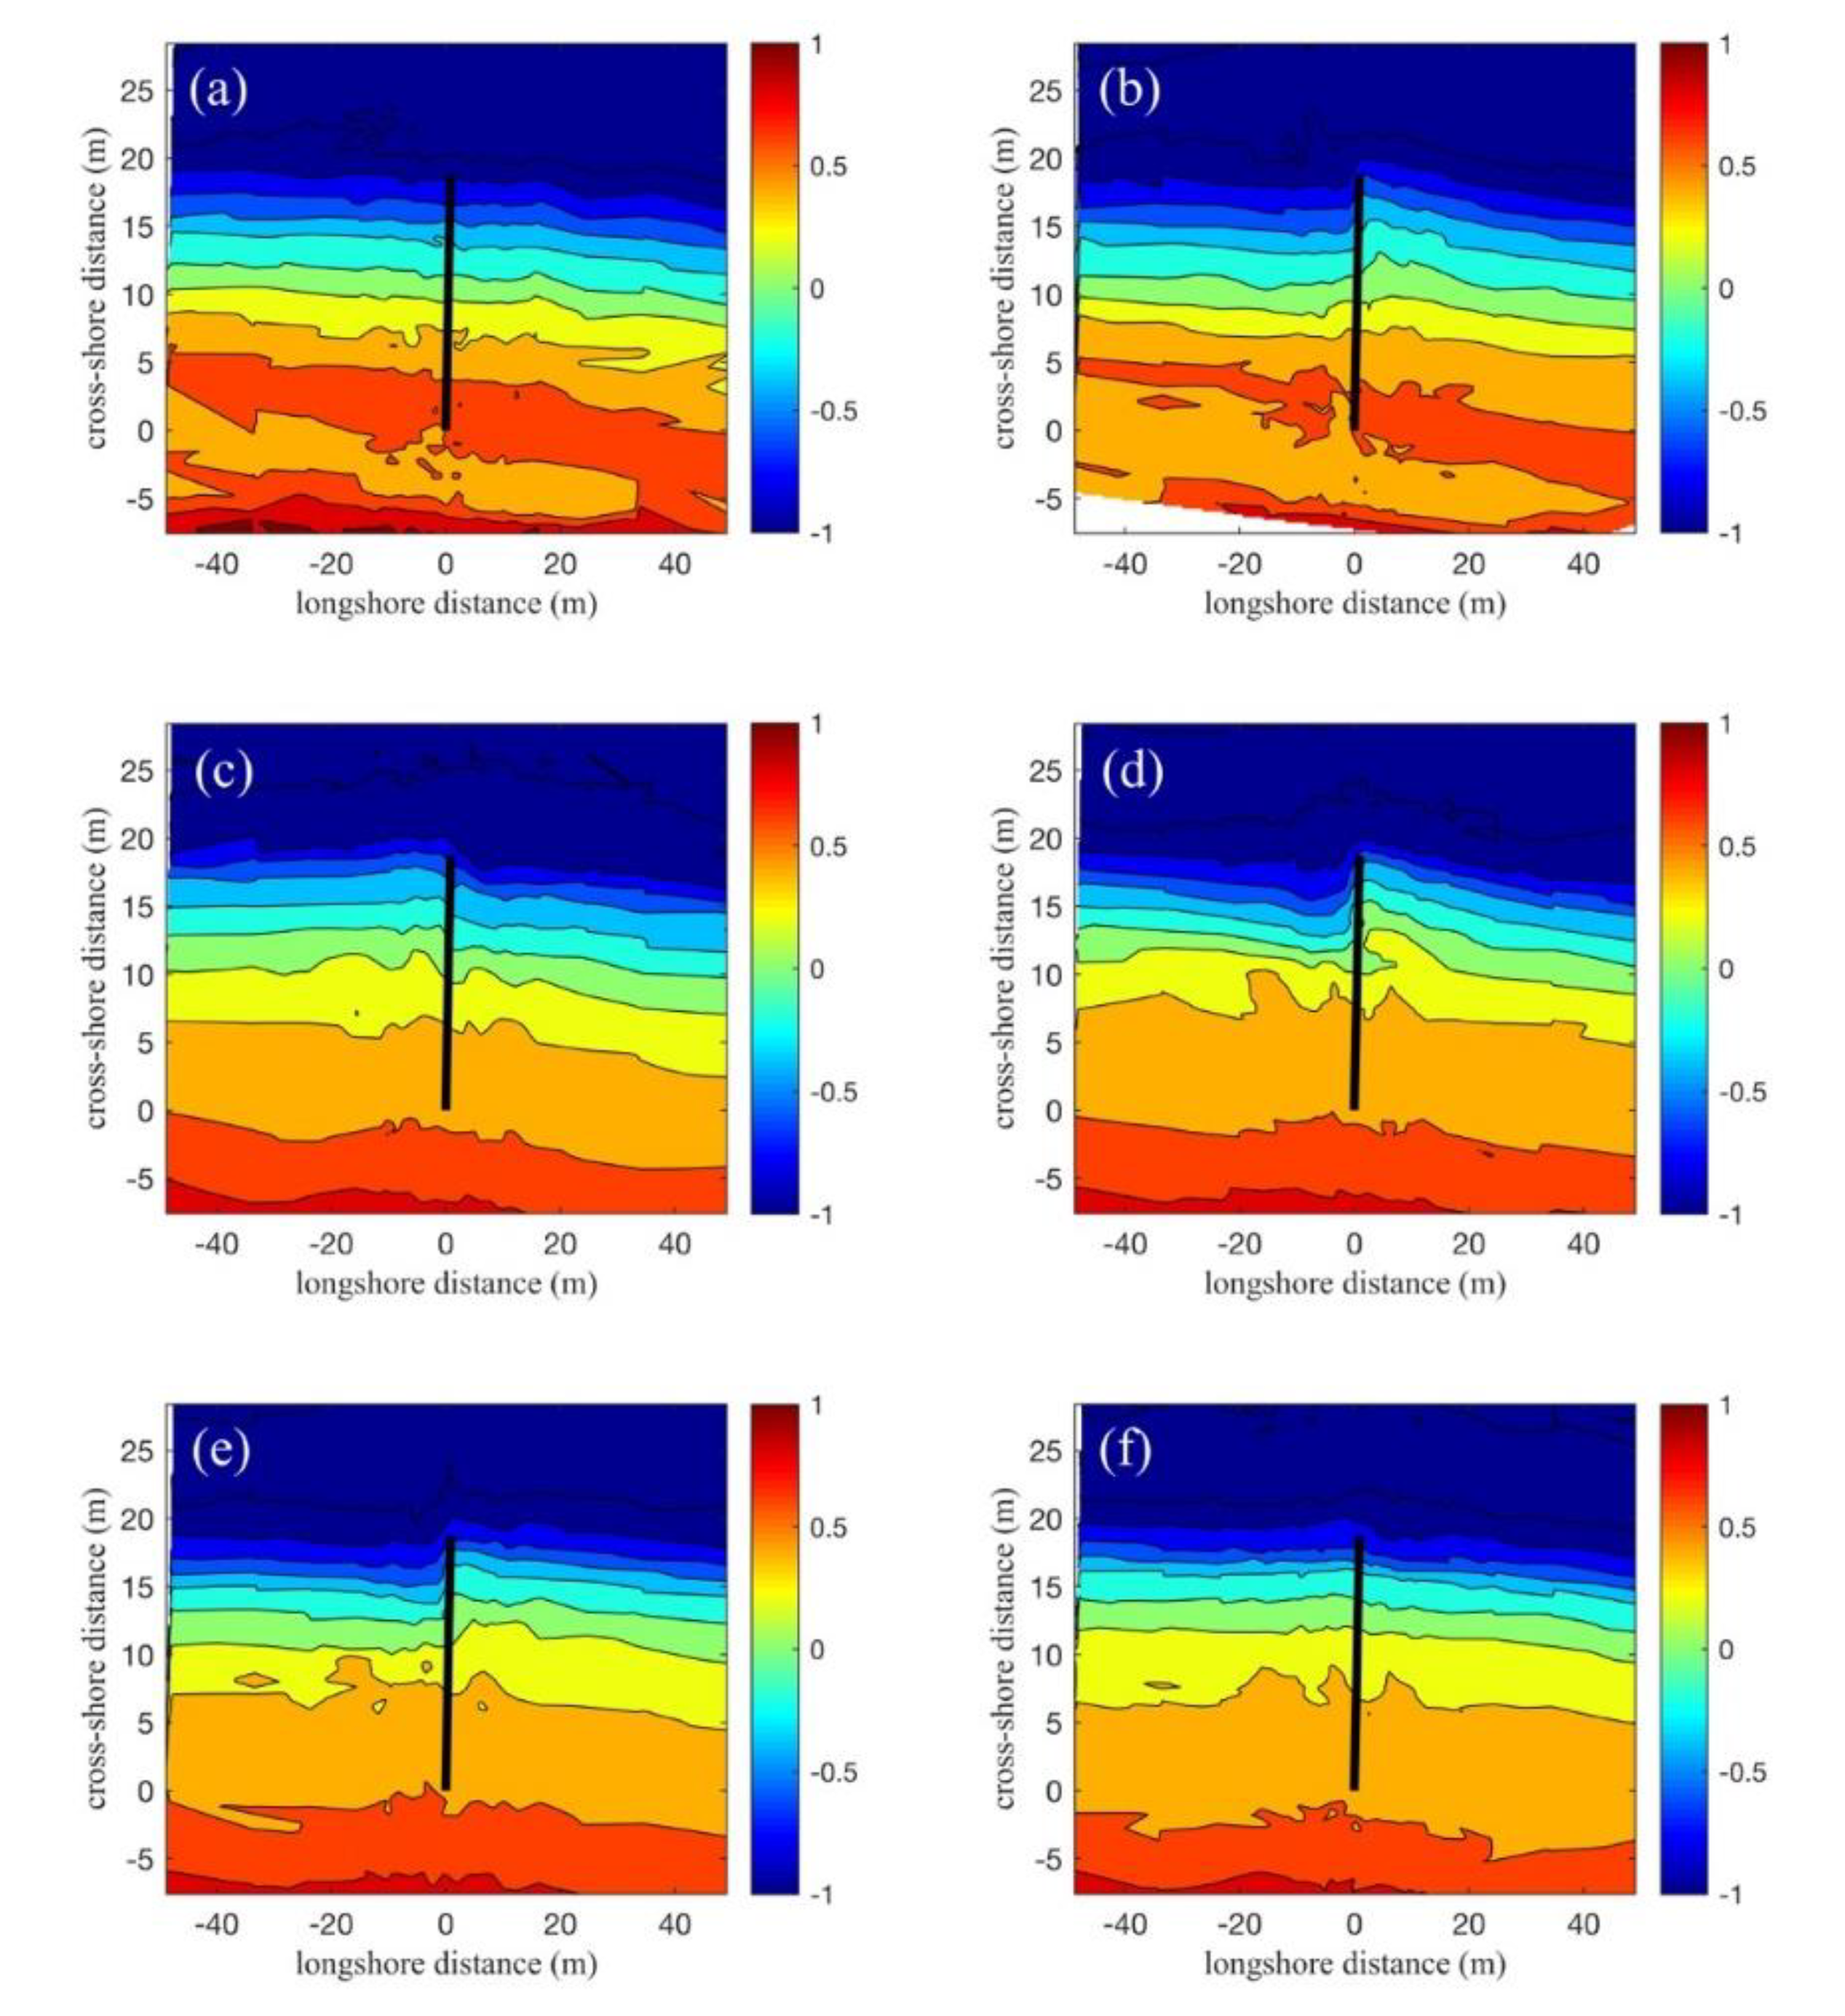
Beach surveys conducted during a longer-term experiment allow us to investigate the capability to increase beach width. The permeable groin was deployed during the Spring when prevailing sea-breeze conditions dominate the coastal dynamics in the study area [14]. Before the structure deployment, the beach topography displayed relative along-shore uniformity (Figure 13a). The accretion/erosion pattern reported during the diurnal experiment was also observed 24 h after the structure deployment on May 3rd (Figure 13b) owing to the persistent westward sediment flux induced by the typical NE waves. On May 4th, the NNW local storm (turbonada) arrived (see Figure 10), reversing the along-shore sediment transport and inducing beach accretion west from the structure (Figure 13c). However, after a few days, the shoreline features show the accretion pattern typical of sea breezes (Figure 13d), which persisted for the following days (Figure 13e). However, on June 8th, the beach displayed along-shore uniformity and a net seaward migration (Figure 13f), indicative of the structure’s capability to allow sediment bypassing once it is saturated.
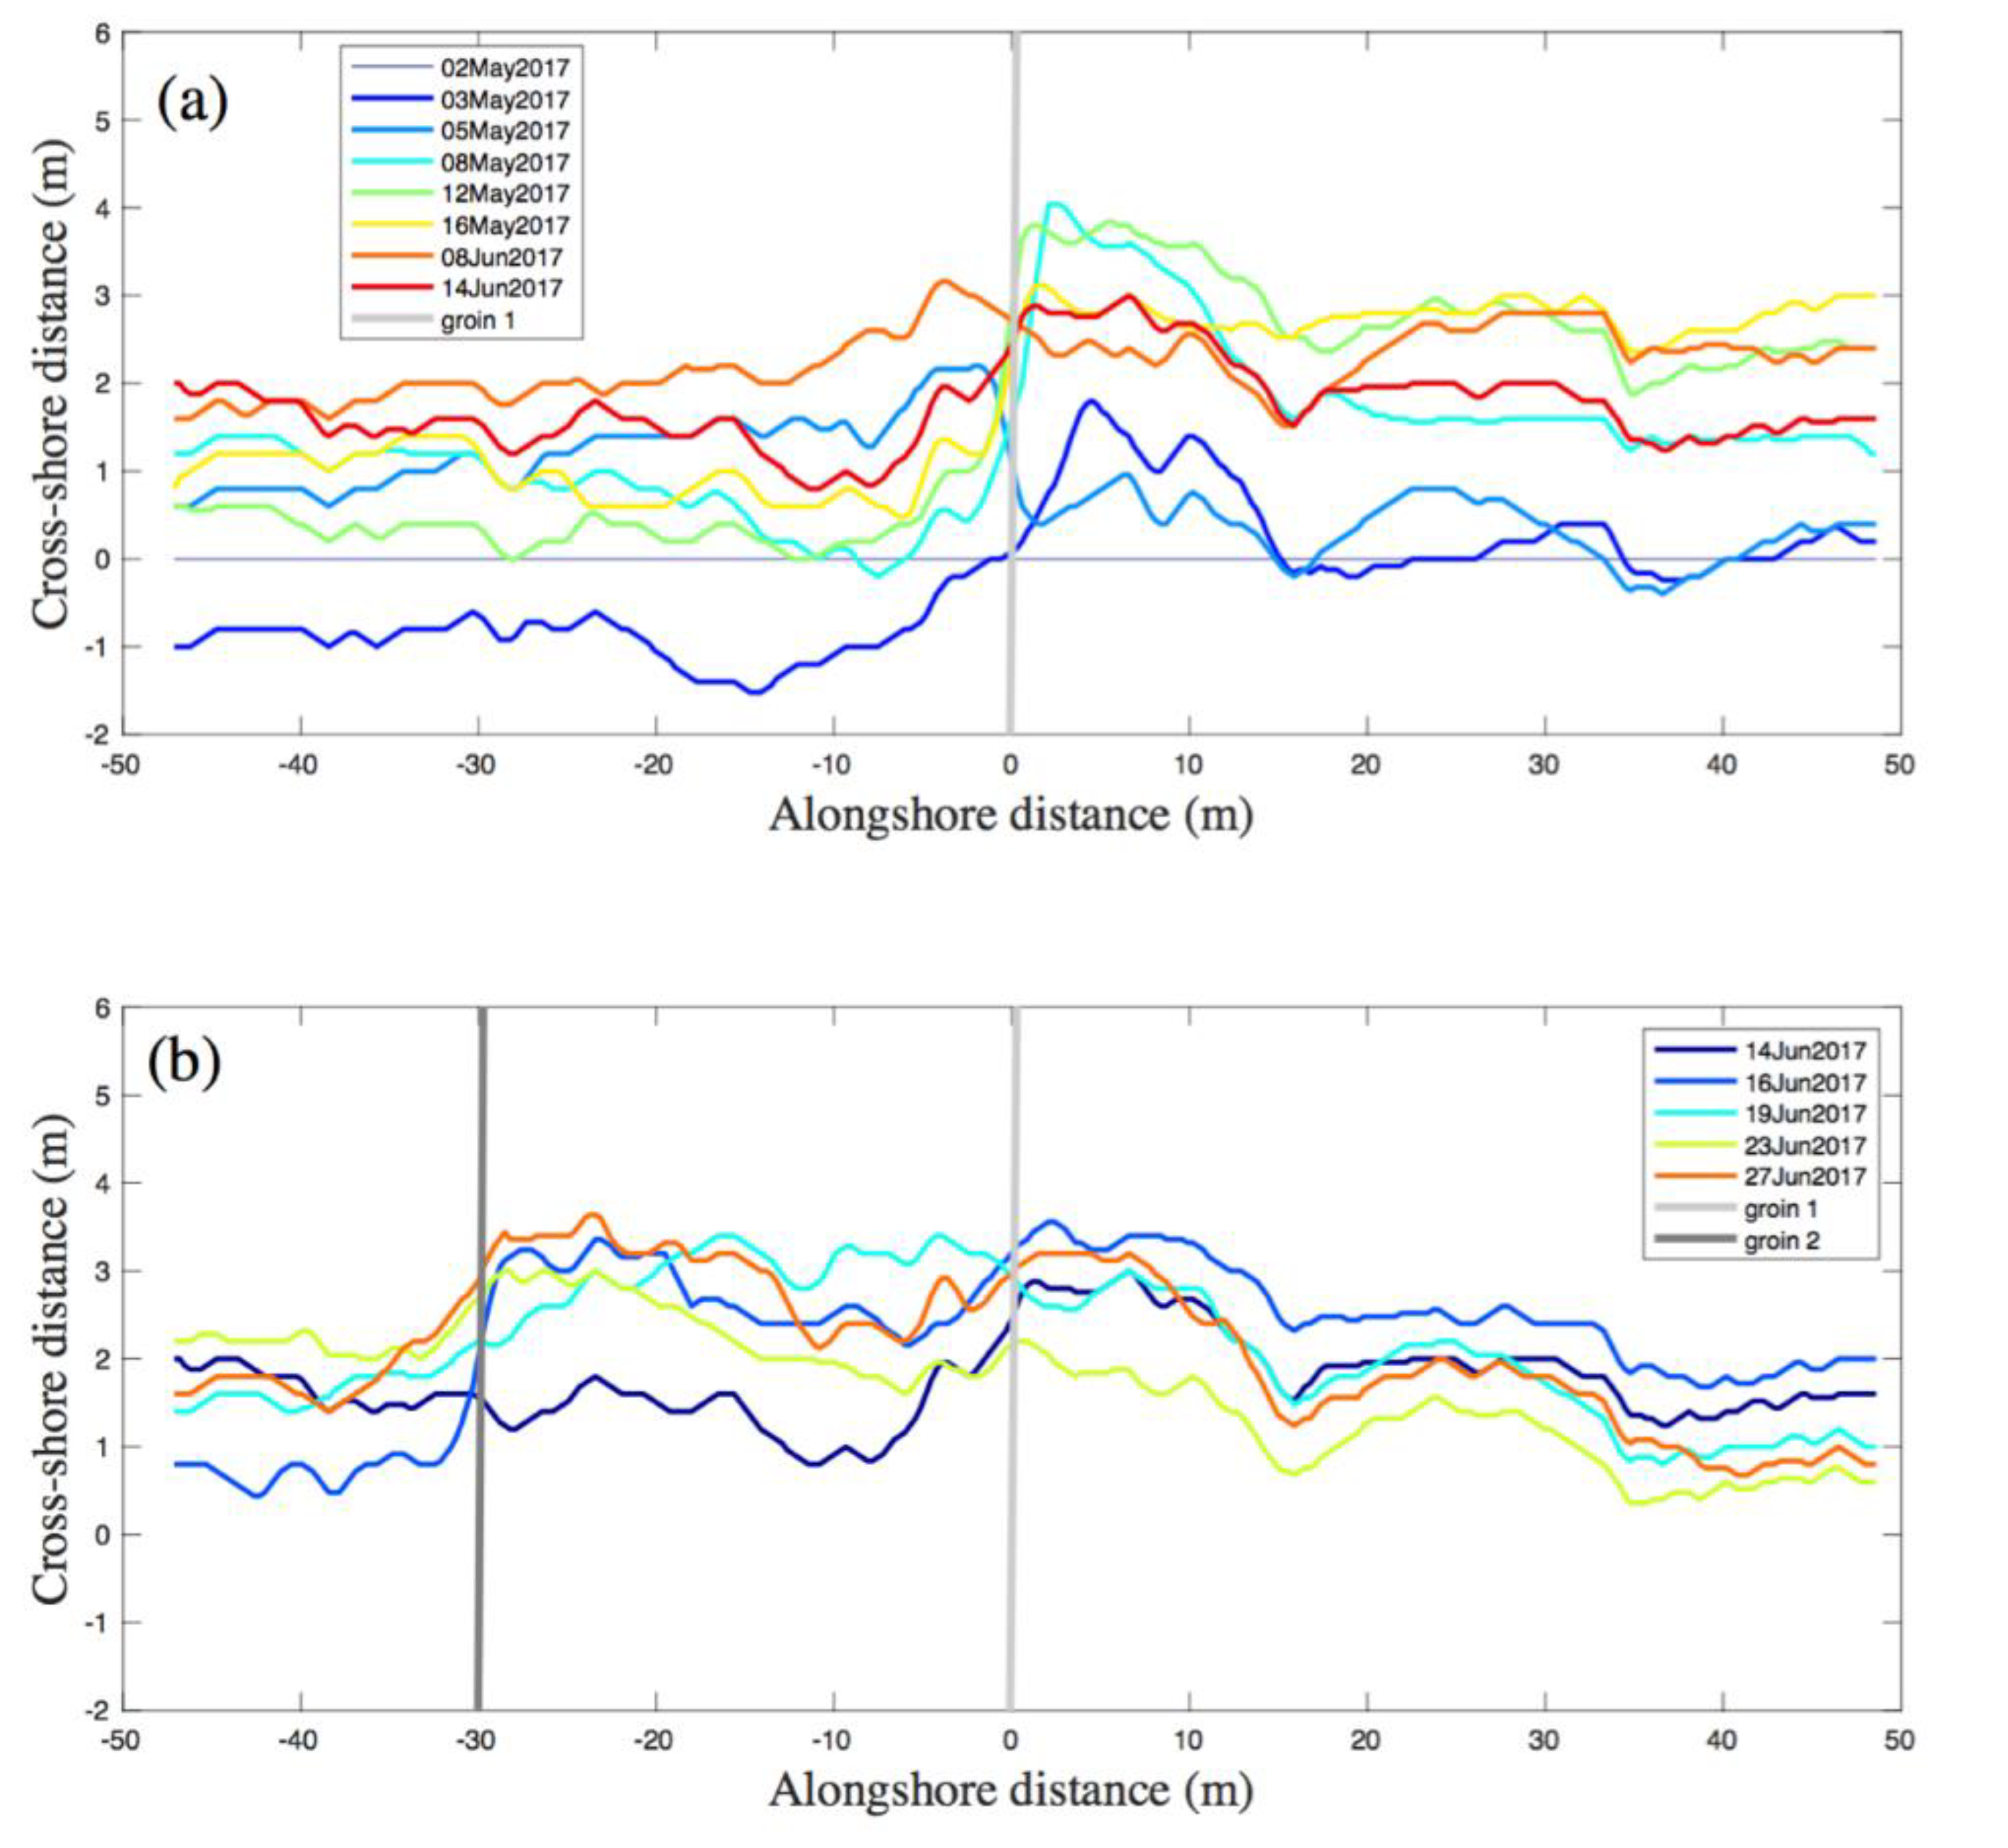
The shoreline relative changes, with respect to the first survey (e.g., May 2nd, 2017), during the single-groin experiment are shown in Figure 14a. Shoreline advance/retreat associated to sea breezes during the following day (May 3rd in Figure 14a) are consistent with the short-term experiment (see Figure 7d). Despite the extreme conditions during the local storm (May 5th in Figure 10 and Figure 13), the beach response in the vicinity of the structure was influenced by the permeable groin, reversing the accretion/erosion pattern owing to changes in wave direction. Therefore, shoreline evolution was highly sensitive to the forcing conditions, and more specifically to wave direction. The shoreline presented 1 to 3 m net seaward advance, with respect to the first survey, in all beach profiles by the end of the single-groin experiment (June 14th in Figure 14a).
A second groin was deployed on June 14th at a location 30 m west from the first groin. Wave conditions were dominated by NE sea breezes and mild NW swell (Figure 10). Significant accretion occurred between the two groins by June 16th, whereas erosion was observed west from the second groin (Figure 14b). The NW swell induced beach accretion west from the second groin, the re-distribution of the sediment between groins, and the shoreline retreat east from the first groin (June 19th in Figure 14b). Shoreline response was consistent with the varying wave conditions. The structures allowed sand bypassing, and hence a net shoreline advance, with respect to the first survey, was observed at all locations (June 27th in Figure 14b).

5. Conclusions

The design of a low-crested permeable groin composed of 60 kg concrete hexapod elements was presented, implemented, and tested in this study. The structure was deployed on a low-energy natural beach in order to evaluate its performance and stability. During prevailing sea-breeze conditions, beach morphology changes occurred on the scale of hours owing to the persistent littoral transport in the inner surf/swash zone. The shoreline perturbation due to the structure presence disappeared 24 h after the structure removal. The erosion/accretion pattern induced by the structure is reversed during NNW storms. On a longer term (i.e., 60 days), shoreline advance was measured at both sides of the structures during varying wave conditions. The latter highlights the short-crested permeable groin’s capability to allow sand bypassing and minimize negative effects in down-drift areas. The structure also allows surf zone sediment transport owing to its short length. Furthermore, a second groin was deployed to investigate the performance of a groin field, observing positive results when a separation distance of two times the groin length is considered. Therefore, short-crested and short-length permeable groins are found to be a suitable mitigation measure against beach erosion on low-energy micro-tidal beaches dominated by a persistent littoral transport. Thus, the structure proposed here could be scaled to other coastal sites considering the swash dynamics in the region. It is worth pointing out the absence of intense CAS events during the experiments. Thus, assessment of the structure stability and functionality during intense synoptic scale events deserves further investigation.

Supplementary Materials

The following are available online at https://www.dropbox.com/s/1g33nhdy0v4xajg/gopro_AnneCampa%C3%B1a.mov?dl=0: Permeable groin experiment time-lapse during the 24 h experiment. Field measurements are available upon request.

Author Contributions

Conceptualization, A.T.-F.; Methodology, G.M.; Structure design, A.H. and A.T.-F.; field work, A.H., J.C.T.-P., G.M., and A.T.-F.; field data analysis, A.H., J.C.T.-P., and G.M.; original draft preparation, A.T-F. and G.M.; writing—review and editing, P.R., A.H., and J.C.T.-P.; supervision, A.T.F. and P.C.R.; project administration, A.T.-F.; funding acquisition, A.T.-F. All authors have read and agreed to the published version of the manuscript.

Funding

This research was funded by CONACYT, through Investigación Científica Básica (grant numbers 284819 and 284430) and the Laboratorio Nacional de Resiliencia Costera (grant number 299063), and PAPIIT DGAPA-UNAM (grant number IN101218).

Acknowledgments

We acknowledge the field support provided by students and researchers from the Institute of Engineering at Sisal Campus. Special thanks to José López González, Gonzalo Uriel Martín Ruiz, Juan Alberto Gómez Liera, and David Gracia for technical support. Grupo BARI is acknowledged for the donation of the hexapod elements employed for this work. Tidal data was provided by the National Tidal Service (Servicio Mareografico Nacional). Two anonymous reviewers provided valuable comments.

Conflicts of Interest

The authors declare no conflict of interest. The funders had no role in the design of the study; in the collection, analyses, or interpretation of data; in the writing of the manuscript; or in the decision to publish the results.

References

  1. Schaeffer, M.; Hare, W.; Rahmstorf, S.; Vermeer, M. Long-Term sea-Level rise implied by 1.5 °C and 2 °C warming levels. Nat. Clim. Chang. 2018, 2, 867–870. [Google Scholar] [CrossRef]
  2. Aucelli, P.P.C.; Di Paola, G.; Rizzo, A.; Rosskopf, C.M. Present day and future scenarios of coastal erosion and flooding processes along the Italian Adriatic coast: The case of Molise region. Environ. Earth Sci. 2018, 77, 371. [Google Scholar] [CrossRef]
  3. Hoefel, F.; Elgar, S. The complexity and the stability of ecosystems. Nature 1984, 307, 321–326. [Google Scholar] [CrossRef]
  4. Masselink, G.; Pattiaratchi, C.B. Seasonal changes in beach morphology along the sheltered coastline of Perth, Western Australia. Mar. Geol. 2001, 172, 243–263. [Google Scholar] [CrossRef]
  5. Di Luccio, D.; Benassai, G.; Di Paola, G.; Rosskopf, C.M.; Mucerino, L.; Montella, R.; Contestabile, P. Monitoring and modelling coastal vulnerability and mitigation proposal for an archaeological site (Kaulonia, Southern Italy). Sustainability 2018, 10, 2017. [Google Scholar] [CrossRef] [Green Version]
  6. De Vriend, H.J.; Van Koningsveld, M.; Aarninkhof, S.G.; De Vries, M.B.; Baptist, M.J. Sustainable hydraulic engineering through building with nature. J. Hydro Environ. Res. 2014, 9, 159–171. [Google Scholar] [CrossRef]
  7. Kraus, N.C.; Hanson, H.; Blomgrem, S.H. Modern functional design of groin systems. Coast. Eng. 1994, 96, 1327–1342. [Google Scholar]
  8. Balsille, J.H.; Berg, D.W. State of groin design and efectiveness. In Proceedings of the 13th International Conference on Coastal Engineering, Vancouver, B.C., Canada, 10–14 July 1972; pp. 1367–1383. [Google Scholar]
  9. Wang, P.; Kraus, N.C. Movable-Bed model investigation of groin notching. J. Coast. Res. 2004, 33, 342–368. [Google Scholar]
  10. Otay, E.N.; Güngördü, Ö.; Börekçi, O.S. Shoreline Changes in the Vicinity of a Permeable Groin. In Coastal Engineering Workshop; Bogazici University: Istanbul, Turkey, 1997. [Google Scholar]
  11. Dette, H.H.; Raudkivi, A.J.; Oumeraci, H. Permeable pile groin fields. J. Coast. Res. 2004, 33, 145–159. [Google Scholar]
  12. Poff, M.T.; Stephen, M.F.; Dean, R.G.; Mulcahy, S. Permeable wood groins: Case study on the impact on the coastal system. J. Coast. Res. 2004, 33, 131–144. [Google Scholar]
  13. Zhang, R.; Stive, M.J.G. Numerical modelling of hydrodynamics of permeable pile groins using SWASH. Coast. Eng. 2019, 153, 103558. [Google Scholar] [CrossRef]
  14. Torres-Freyermuth, A.; Puleo, J.A.; DiCosmo, N.; Allende-Arandia, M.E.; Chardón-Maldonado, P.; López-González, J.; Figueroa, B.; Ruiz de Alegría-Arzaburú, A.; Figlus, J.; Roberts, T.; et al. Nearshore hydrodynamics on a sea breeze dominated beach during intense wind events. Cont. Shelf Res. 2017, 151, 40–52. [Google Scholar] [CrossRef]
  15. Medellin, G.; Torres-Freyermuth, A.; Tomasicchio, G.R.; Francone, A.; Tereszkiewicz, P.A.; Luisito, L.; Palemón-Arcos, L.; López, J. Field and numerical study of resistance and resilience on a sea breeze dominated beach in Yucatan (Mexico). Water 2018, 10, 1806. [Google Scholar] [CrossRef] [Green Version]
  16. Medellin, G.; Torres-Freyermuth, A. Morphodynamics along a micro-Tidal sea breeze dominated beach in the vicinity of coastal structures. Mar. Geol. 2019, 417, 106013. [Google Scholar] [CrossRef]
  17. Reding, P.J. The Central American Cold Surge: An Observational Analysis of the Deep Southward Penetration of North American Cold Fronts. Master’s Thesis, Department of Meteorology, Texas A&M University, College Station, TX, USA, 1992; p. 177. [Google Scholar]
  18. Rey, W.; Salles, P.; Torres-Freyermuth, A.; Ruíz-Salcines, P.; Teng, Y.-C.; Appendini, C.M.; Quintero-Ibáñez, J. Spatiotemporal storm impact on the northern Yucatan coast during hurricanes and central American cold surge events. J. Mar. Sci. Eng. 2020, 8, 2. [Google Scholar] [CrossRef] [Green Version]
  19. Appendini, C.M.; Salles, P.; Mendoza, E.T.; López, J.; Torres-Freyermuth, A. Longshore sediment transport on the northern coast of the Yucatan coast. J. Coastal Res. 2012, 28, 1404–1417. [Google Scholar] [CrossRef]
  20. Medellín, G.; Mariño-Tapia, I.; Euán-Ávila, J. The influence of a seawall on postnourishment evolution in a sea-Breeze-Dominated microtidal beach. J. Coast. Res. 2015, 31, 1449–1458. [Google Scholar] [CrossRef]
  21. Meyer-Arendt, K.J. Recreational development and shoreline modification along the north coast of Yucatán, Mexico. Tour. Geogr. 2001, 3, 87–104. [Google Scholar] [CrossRef]
  22. Meyer-Arendt, K.J. Recreational landscape evolution along the north Yucatan coast. Conf. Lat. Am. Geopgraphers 1987, 13, 45–50. [Google Scholar]
  23. Tereszkiewicz, P.; McKinney, N.; Meyer-Arendt, K.J. Groins along the Northern Yucatán Coast. J. Coast. Res. 2018, 34, 911–919. [Google Scholar] [CrossRef]
  24. Alvarez, E.; Rubio, R.; Ricalde, H. Beach restoration with geotextile tubes as submerged breakwaters in Yucatan, Mexico. Geotext. Geomembr. 2007, 25, 233–241. [Google Scholar] [CrossRef]
  25. Torres-Freyermuth, A.; Medellin, G.; Mendoza, E.T.; Ojeda, E.; Salles, P. Morphodybamic response to low-crested detached breakwaters on a sea-breeze dominated coast. Water 2019, 11, 635. [Google Scholar] [CrossRef] [Green Version]
  26. MEXICO97. Available online: https://www.ngs.noaa.gov/GEOID/MEXICO97/ (accessed on 20 August 2018).
  27. Winant, C.D.; Inman, D.I.; Nordstrom, C.E. Description of seasonal beach changes using empirical eigenfunctions. J. Geophys. Res. 1975, 80, 1979–1986. [Google Scholar] [CrossRef]
  28. Aubrey, D.G. Seasonal patterns of onshore/offshore sediment movement. J. Geophys Res. 1979, 84, 6347–6354. [Google Scholar] [CrossRef]
  29. Figueroa-Espinoza, B.; Salles, P.; Zavala, J. On the Wind Power Potential in the northwest of the Yucatan Peninsula in Mexico. Atmosfera 2014, 27, 77–89. [Google Scholar] [CrossRef] [Green Version]
Figure 1. Field site location with respect to (a) the Gulf of Mexico, (b) Northern Yucatan coast, and (c) Sisal beach. The acoustic Doppler current profiler (ADCP) wave measurements location is shown in (b). The locations of the field site (black box) and monitoring stations (tidal gauge and meteorological station) are shown in (c).
Jmse 08 00283 g001
Figure 2. Groins along the northern Yucatan coast. Photo courtesy of Aerozoom (www.aerozoom.com.mx).
Jmse 08 00283 g002
Figure 3. Structure design showing (a) hexapod element dimensions, (b) the interlocking between elements, and (c) the interlocking with the top/upper layer. Figure 3a: Courtesy of Grupo BARI.
Jmse 08 00283 g003
Figure 4. Experimental setup during the single-day experiment. (a) Plan view sketch showing survey lines relative locations with respect to the structure and (b) aerial photography taken after the permeable groin deployment (May 31st, 2016). Photo: Courtesy of Dr. Tonatiuh Mendoza.
Jmse 08 00283 g004
Figure 5. Experimental setup during the multi-day field experiment. Groin 1 was deployed on May 3rd, 2017 and groin 2 on June 16th, 2017.
Jmse 08 00283 g005
Figure 6. (a) Winds, (b) wave conditions, and (c) mean water level preceding and during the single-day structure deployment. The structure was deployed for 24 h in the morning of 05/31/2016 (solid vertical line) and removed on the morning of 06/01/2016 (dashed vertical line).
Jmse 08 00283 g006
Figure 7. Beach surveys (a) 6 h, (b) 16 h, (c) 20 h, and (d) 24 h after the permeable groin deployment, for the single-day experiment. Subplots titles correspond to the weekday initial and time of survey (hhmm).
Jmse 08 00283 g007
Figure 8. Shoreline position (z = 0) evolution after the structure deployment, for the single-day experiment. The thick lines show the shoreline position during the first survey (T0820), 24 h after the structure deployment (W0812), and 24 h after the structure removal (Th1014).
Jmse 08 00283 g008
Figure 9. Empirical orthogonal function analysis of the shoreline data during the single-day experiment (08:20 03/30/2016 to 10:14 06/02/2016. (a) Spatial structure and (b) temporal evolution of the first mode.
Jmse 08 00283 g009
Figure 10. Forcing conditions during the multi-day experiment. Offshore wave conditions: (a) significant wave height and mean wave direction and (b) wave period. (c) Mean water level.
Jmse 08 00283 g010
Figure 11. Permeable groin: (a) before the storm (May 3rd, 2017), (b) during the storm (May 4th, 2017), and (c) after the storm (May 6th, 2017). Photos by José Clemente Tuz-Pech.
Jmse 08 00283 g011
Figure 12. Beach profiles before and after the local storm (turbonada) showing subaerial beach changes owing to the storm conditions at the following locations: (a) 600 m, (b) 800 m, and (c) 1200 m eastward from the permeable groin.
Jmse 08 00283 g012
Figure 13. Beach morphology measurements for the multi-day experiment with a single groin, taken in Spring 2017: (a) May 2nd, (b) May 3rd, (c) May 5th, (d) May 8th, (e) May 16th, and (f) June 8th.
Jmse 08 00283 g013
Figure 14. Shoreline changes relative to the first survey (May 2nd 2017) in the presence of (a) one permeable groin and (b) two permeable groins.
Jmse 08 00283 g014
Table 1. Instrumentation and sampling scheme for the field experiments. ADCP, acoustic Doppler current profiler; RTK, real time kinematics; GPS, global positioning system.
Parameter MeasuredInstrument TypeSampling FrequencyStart DateEnd Date
Beach profilesGPS RTK Leica2 hMay 31st, 2016June 1st, 2016
--2 daysMay 3rd, 2017June 29th, 2017
WavesADCP Teledyne RD Instruments30 minMay 3rd, 2016June 30th, 2017
Sea levelUltrasonic sensor1 minMay 3rd, 2016June 15th, 2017
WindsWeather station1 minMay 31st, 2016June 1st, 2016