Article

Hydrodynamic Response of a Combined Wind–Wave Marine Energy Structure

1
State Key Laboratory of Coastal and Offshore Engineering, Deepwater Engineering Research Center, Dalian University of Technology, Dalian 116024, China
2
Department of Civil Engineering and Geomatics, Cyprus University of Technology, Limassol 3036, Cyprus
3
Newcastle Research & Innovation Institute, Newcastle University, Singapore 609607, Singapore
*
Author to whom correspondence should be addressed.
J. Mar. Sci. Eng. 2020, 8(4), 253; https://doi.org/10.3390/jmse8040253
Submission received: 28 February 2020 / Revised: 1 April 2020 / Accepted: 2 April 2020 / Published: 3 April 2020

Abstract

:
Due to the energy crisis and greenhouse effect, offshore renewable energy is attracting increasing attention worldwide. Various offshore renewable energy systems, such as floating offshore wind turbines (FOWTs), and wave energy converters (WECs), have been proposed and developed so far. To increase power output and reduce related costs, a combined marine energy structure using FOWT and WEC technologies has been designed, analyzed and presented in the present paper. The energy structure combines a 5-MW braceless semisubmersible FOWT and a heave-type WEC which is installed on the central column of the semisubmersible. Wave power is absorbed by a power take-off (PTO) system through the relative heave motion between the central column of the FOWT and the WEC. A numerical model has been developed and is used to determine rational size and draft of the combined structure. The effects of different PTO system parameters on the hydrodynamic performance and wave energy production of the WEC under typical wave conditions are investigated and a preliminary best value for the PTO’s damping coefficient is obtained. Additionally, the effects of viscous modeling used during the analysis and the hydrodynamic coupling on the response of the combined structure are studied.

1. Introduction

Due to the exhaustion of fossil fuels and their pollution on the environment, people are trying to develop various clean and renewable energy technologies to replace conventional energy resources. Offshore wind energy has experienced rapid development [1] during the past ten years however it faces significant challenges to ensure commercial viability due to the policy of grid parity [2]. The ocean contains a variety of clean and renewable resources such as wind energy, wave energy and tidal energy, etc. Wave energy is still in the very early stages of development. The integration of offshore wind energy and wave energy power generation by sharing space, transmission infrastructure, operation and maintenance (O&M) activities and supporting structure will improve the utilization efficiency of marine renewable energy, but also reduce their levelized cost of energy.
Many scholars tried to develop different wind–wave combined systems. The EU funded Marine Renewable Integrated Application Platform (MARINA Platform) program [3] that proposed possible combined systems for use. For example, two combined systems have been proposed, which respectively consist of the same WindFloat semisubmersible turbine platform with a point-absorber-type wave energy converter (WEC) and an oscillating-water-column type WEC. Peiffer et al. [4] and Aubault et al. [5] investigated the coupled dynamic analysis by numerical and laboratory models. Muliawan et al. [6,7] proposed an integrated concept combining a spar-type floating wind turbine with a torus WEC (named as STC). The dynamic response characteristics of the combined structure in typical operational and extreme sea states were studied. Further, Wan et al. [8,9,10] studied the dynamic response characteristics of the STC under typical operational and extreme sea states based on numerical and experimental methods. Another combined structure combining a floating semisubmersible wind turbine and flap-type WECs (named as SFC) was proposed. Michailides et al. [11,12,13] systematically studied the integrated operation of the SFC by numerical simulation and physical model tests and it was found that the total produced power can be increased. Moreover, Ren et al. [14] studied a new combined structure consisting of a monopile type wind turbine and a heave-type wave energy converter (denoted as MWWC). However, the conceptual designs of combined structure based a floating semi-submersible wind turbine and WECs in deep water have been insufficient so far.
In the present paper, we introduce a combined marine energy structure consisting of a 5-MW braceless wind turbine developed in [15] with a heave-type WEC inspired by the STC system [16,17], which was proposed first by our team. At the first stage, it aims to investigate the dynamic response and its geometry and various parameters. Based on potential flow theory by means of ANSYS/AQWA [18], we developed a numerical model, and the best diameter and draft of the WEC are selected. Moreover, the effect of different power take-off (PTO) parameters on the performance of the WEC’s produced power is investigated. A rational PTO damping and stiffness coefficient related with the power production is proposed. The effect of viscous load modeling and hydrodynamic coupling on the response of the combined structure is studied. Motions and dynamic responses of the combined structure under typical operational and extreme sea states are presented. The relative heave, semisubmersible pitch, horizontal contact force and PTO damping force of the combined structure, have an almost linear relationship with the wave height, while WEC surge and PTO produced power have an almost quadratic relationship under regular waves. Finally, a survival mode is examined in order to ensure combined concepts survivability in extreme wave conditions.

2. Theoretical Background Used for the Development of the Numerical Mode

2.1. Potential Flow Theory

For large-diameter elements, the existence of the structure affects the characteristics in the surrounding flow field. For the calculation of wave load, the three-dimensional potential flow theory is adopted [19,20], which generally assumes an ideal fluid and incompressible flow. The Laplace equation can be obtained with a velocity potential Φ based on the conservation of fluid mass and momentum, and is expressed as follows:
2 ϕ ( x , y , z , t ) = 0
The free wave surface, structure surface and subsea conditions of Φ can be expressed as below:
2 ϕ t 2 + g ϕ z = 0 , z = 0
ϕ n = U j n ˜ j
ϕ z = 0 , z = h
where U j and n ˜ j represent the generalized velocity and generalized normal vector of the corresponding motion mode of a point on the structure surface, respectively.
In the potential flow theory, the control equations and boundary conditions can be linearized, and the linear superposition principle can be used to decompose the velocity potential as below:
ϕ ( x , y , z , t ) = ϕ ( x , y , z , t ) i + ϕ ( x , y , z , t ) d + ϕ ( x , y , z , t ) r
where ϕ ( x , y , z , t ) i represents the incident wave velocity potential, ϕ ( x , y , z , t ) d is the diffraction potential and ϕ ( x , y , z , t ) r represents the radiation potential.
If the floating platform exhibits simple harmonic motion at the balanced position in static water, the velocity potential of the floating platform can be expressed as follows:
ϕ ( x , y , z , t ) = Re { φ ( x , y , z ) exp ( i ω t ) }
φ ( x , y , z , t ) = φ i ( x , y , z , t ) + φ d ( x , y , z , t ) + φ r ( x , y , z , t )
The incident wave velocity potential can be expressed as follows:
φ ( x , y , z , t ) i = A g ω cosh [ k ( z + h ) ] cosh k h exp ( i k ( x cos β + y sin β ) )
where A, g, h, k and β represent the wave amplitude, gravitational acceleration, water depth, wavenumber and wave propagation direction, respectively.
The radiation potential that can be solved by the following governing equations and boundary conditions can be expressed as:
φ ( x , y , z , t ) r = i ω x ¯ j φ j r ( x , y , z )
The control equation, free wave surface condition, structure surface condition, subsea conditions and r can be expressed as follows:
2 φ i r ( x , y , z ) = 0
φ j n ν φ j r = 0 , z = 0
φ j r n = n ˜ j
φ j r n = 0 , z = h
lim r r ( φ j r r i k φ j r ) = 0
where x ¯ j is the motion amplitude in the motion mode of j, and φ j r represents the radiation potential in the motion mode of j.
r = x 2 + y 2
Finally, the Green’s function method is used to calculate the diffraction potential and is no elaborated further here.

2.2. Viscous Load Modeling

2.2.1. Morison Equation (Cylinders of the Semisubmersible Platform)

For small-diameter offshore structures, the Morrison equation is mainly used to calculate the hydrodynamic loads [19,21]. When the diameter of the structure is less than or equal to 0.15 times the wavelength, the existence of the structure has small effect on the wave field. The wave force applied on the structure is the sum of the drag force and the inertia force, which can be expressed as follows:
f d = C d ρ 2 D μ | μ |
where Cd represents the drag force coefficient. In the paper, Cd = 1.2 is selected due to H/d ≤ 0.2 and d/L ≥ 0.2; H, d and L represent wave height, water depth and wave length, respectively; μ, D, and ρ are the incoming flow velocity, structure diameter and fluid density, respectively; and fd represents drag force on a unit height of the structure.

2.2.2. Heave Mode Viscous Load Effects on the WEC

The viscosity can significantly affect the dynamic responses of the combined structure (especially the estimation of the PTO produced power), but the effect of viscous damping on the WEC cannot be calculated based on potential flow theory, which has a great difference with physical truth. Therefore, the viscous effect of the heave mode of the WEC has been additionally included, which is calculated as follows [22,23]:
D c r i t i c a l = 2 ( M 33 + m 33 ) K 33
F v i s c o u s = D c r i t i c a l × η
where M33, m33 and K33 represent the mass, added mass at heave natural frequency and hydrostatic stiffness coefficient of the WEC in the heave direction and their values are 540.982 t, 422.3 t and 1515.4 kN/m, respectively; Fviscous, Dcritical and η are the viscous force, the critical damping and damping coefficient based on the viscous effects of the heave mode of the WEC. Based on the reference [24], a damping coefficient of 6–10% in heave direction is recommended using experimental study for different cylindrical semisubmersible platforms. Therefore, 8% of damping coefficient for WEC in heave direction is used in our simulation.

2.3. Equation of Motion of the Combined Structure

The simulation of the combined structure is carried out in the time domain. The hydrodynamic properties of the numerical modeling, such as the linear excitation forces, added mass and potential damping as well as the coupling terms of the two bodies, are obtained. In addition, the mechanical coupling (PTO of WEC) between the two bodies is modeled with both linear damper and spring. The mooring lines are also regarded as linear springs. Therefore, the equation of motion for the analysis of the combined structure can be expressed as follows [9]:
( ( M + m ) 11 m 12 m 21 ( M + m ) 22 ) ( x ¨ 1 ( t ) x ¨ 2 ( t ) ) + 0 t ( h ( t τ ) 11 h ( t τ ) 12 h ( t τ ) 21 h ( t τ ) 22 ) ( x ˙ 1 ( τ ) x ˙ 2 ( τ ) ) d τ + ( ( R ) 11 ( R ) 12 ( R ) 21 ( R ) 22 ) ( x 1 ( t ) x 2 ( t ) ) = ( f 1 w i n d ( t ) 0 ) + ( f 1 w a v e ( t ) f 2 w a v e ( t ) ) + ( f 1 v i s c o u s ( t ) f 2 v i s c o u s ( t ) ) + ( f 1 i n t e r f a c e ( t ) f 2 i n t e r f a c e ( t ) ) + ( F 1 P T O ( t ) F 2 P T O ( t ) )
f 1 i n t e r f a c e ( t ) = f 2 i n t e r f a c e ( t )
F 1 P T O = F 2 P T O
where the subscripts 1 and 2 are denoting the semisubmersible platform and the WEC, respectively; M and m represent the structural mass matrix and the added mass, respectively; x, x ˙ and x ¨ represent the displacement, velocity and acceleration of the bodies; h(t-τ) represents the retardation function; Rij is the restoring coefficient matrix; f w i n d ( t ) and f w a v e ( t ) represent wind loads on the rotor and wave forces, respectively; f 1 v i s c o u s ( t ) is the viscous force based on Morison equation applied on the semisubmersible and f 2 v i s c o u s ( t ) is the viscous load applied on the WEC (Equation (21)); f i n t e r f a c e ( t ) is the interface forces between the semisubmersible platform and the WEC including horizontal contact forces and vertical friction forces; and F P T O represents the PTO force.

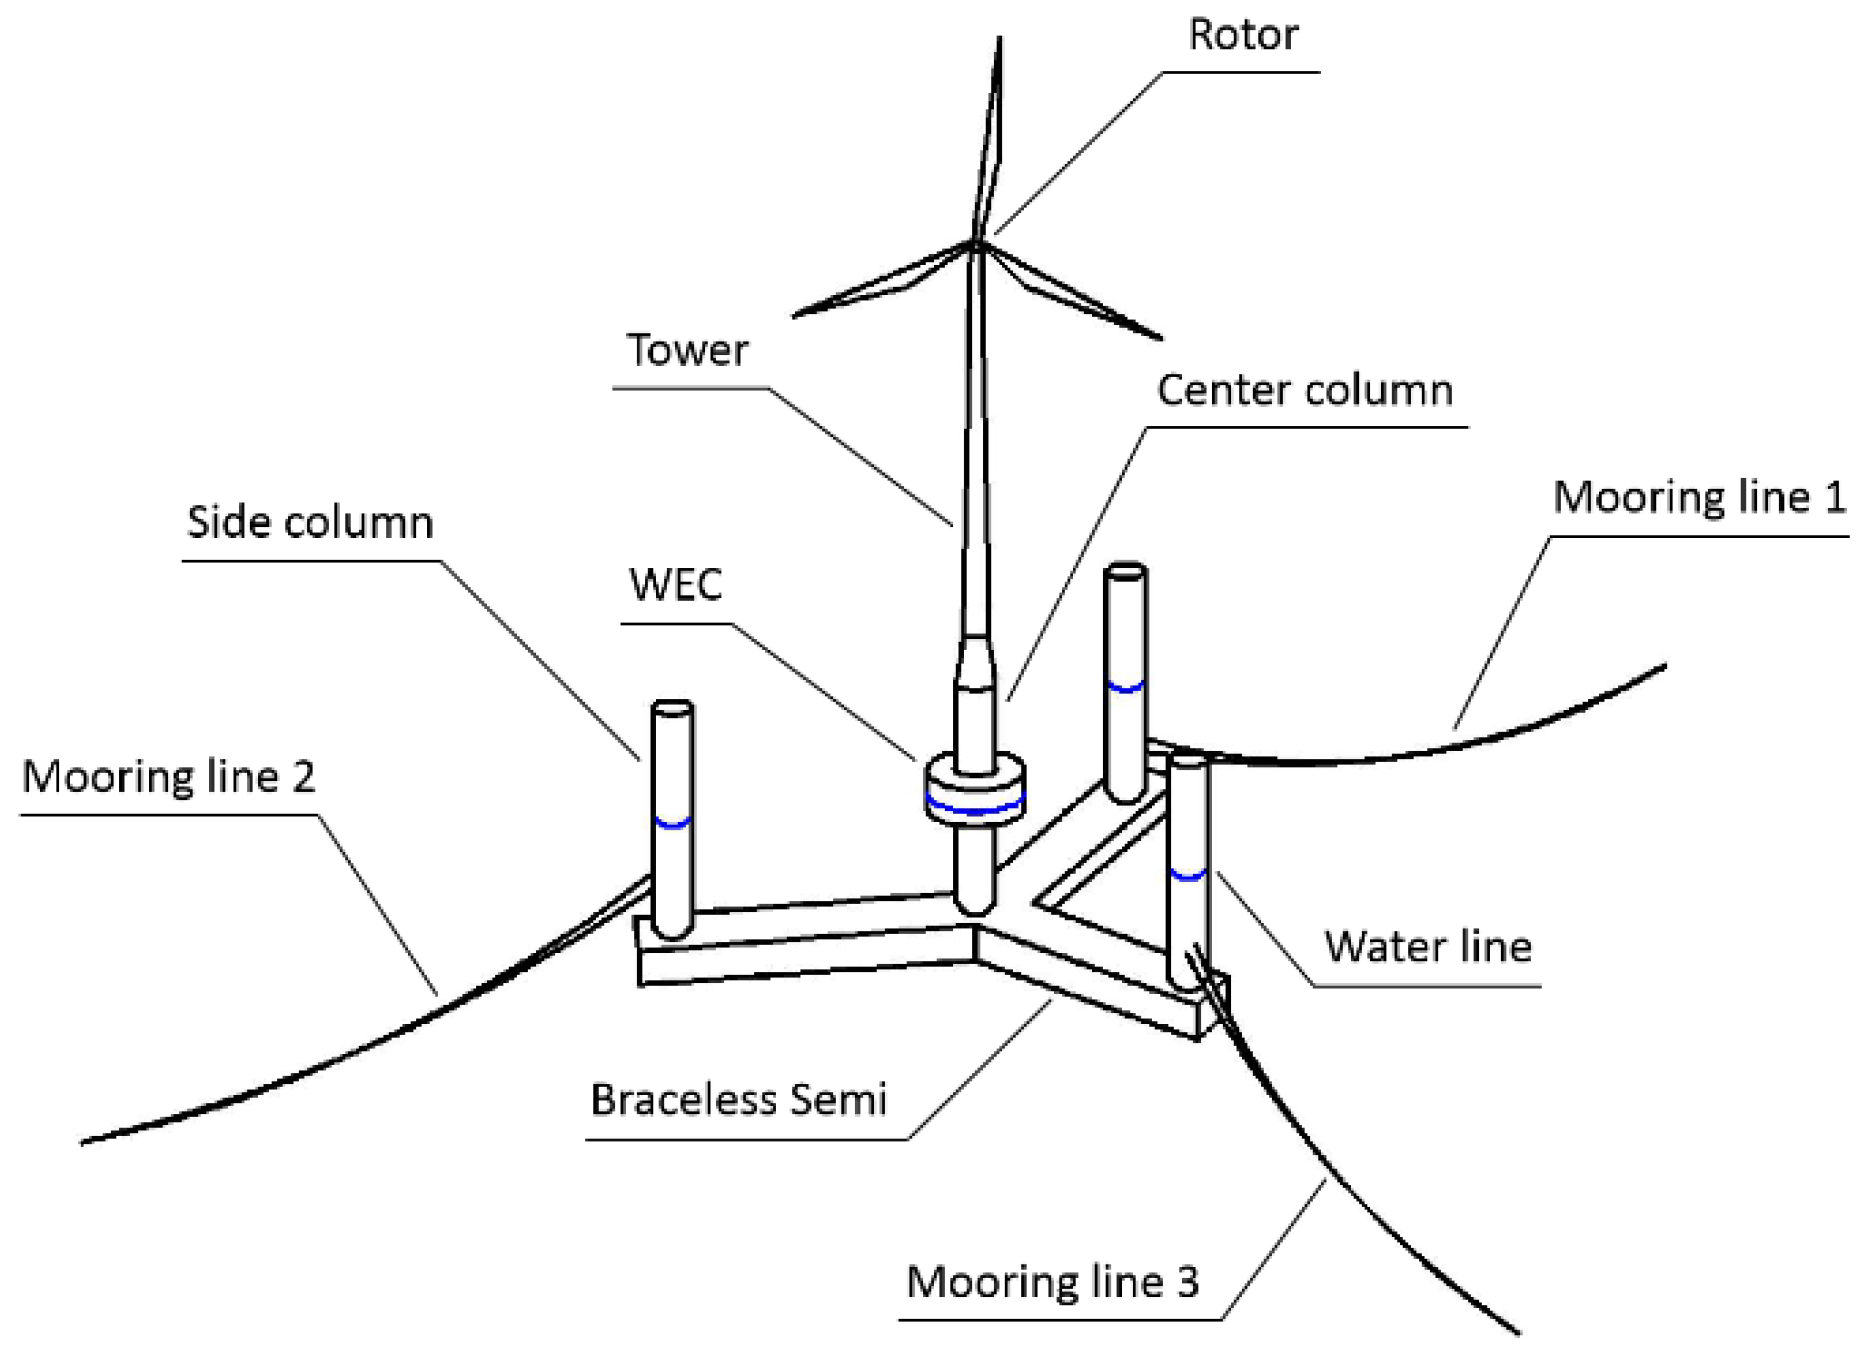
3. Characteristics of the Combined Structure

3.1. Design Parameters of the 5-MW Semisubmersible Wind Turbine and of the WEC

The combined model proposed in the present paper consists of a braceless 5-MW semisubmersible wind turbine and a heave-type WEC. The conceptual model and the main design parameters of the 5-MW semisubmersible wind turbine and the WEC are shown in Figure 1 and Table 1, respectively. In the model, the WEC can be moved up and down relative to the center column of the semisubmersible, and the wave energy is produced by the PTO at the same time. The relative movement is constrained by the mechanical connection between the center column and the WEC in a direction perpendicular to the center column [25]. As a result, the utilization efficiency of marine renewable energy is improved through shared power generation platforms and shared transmission systems, effectively reducing the unit power generation cost [6,13]. For the numerical simulation, viscous forces of the columns of the semisubmersible are considered as viscous drag loads using Morison equation in the horizontal direction.

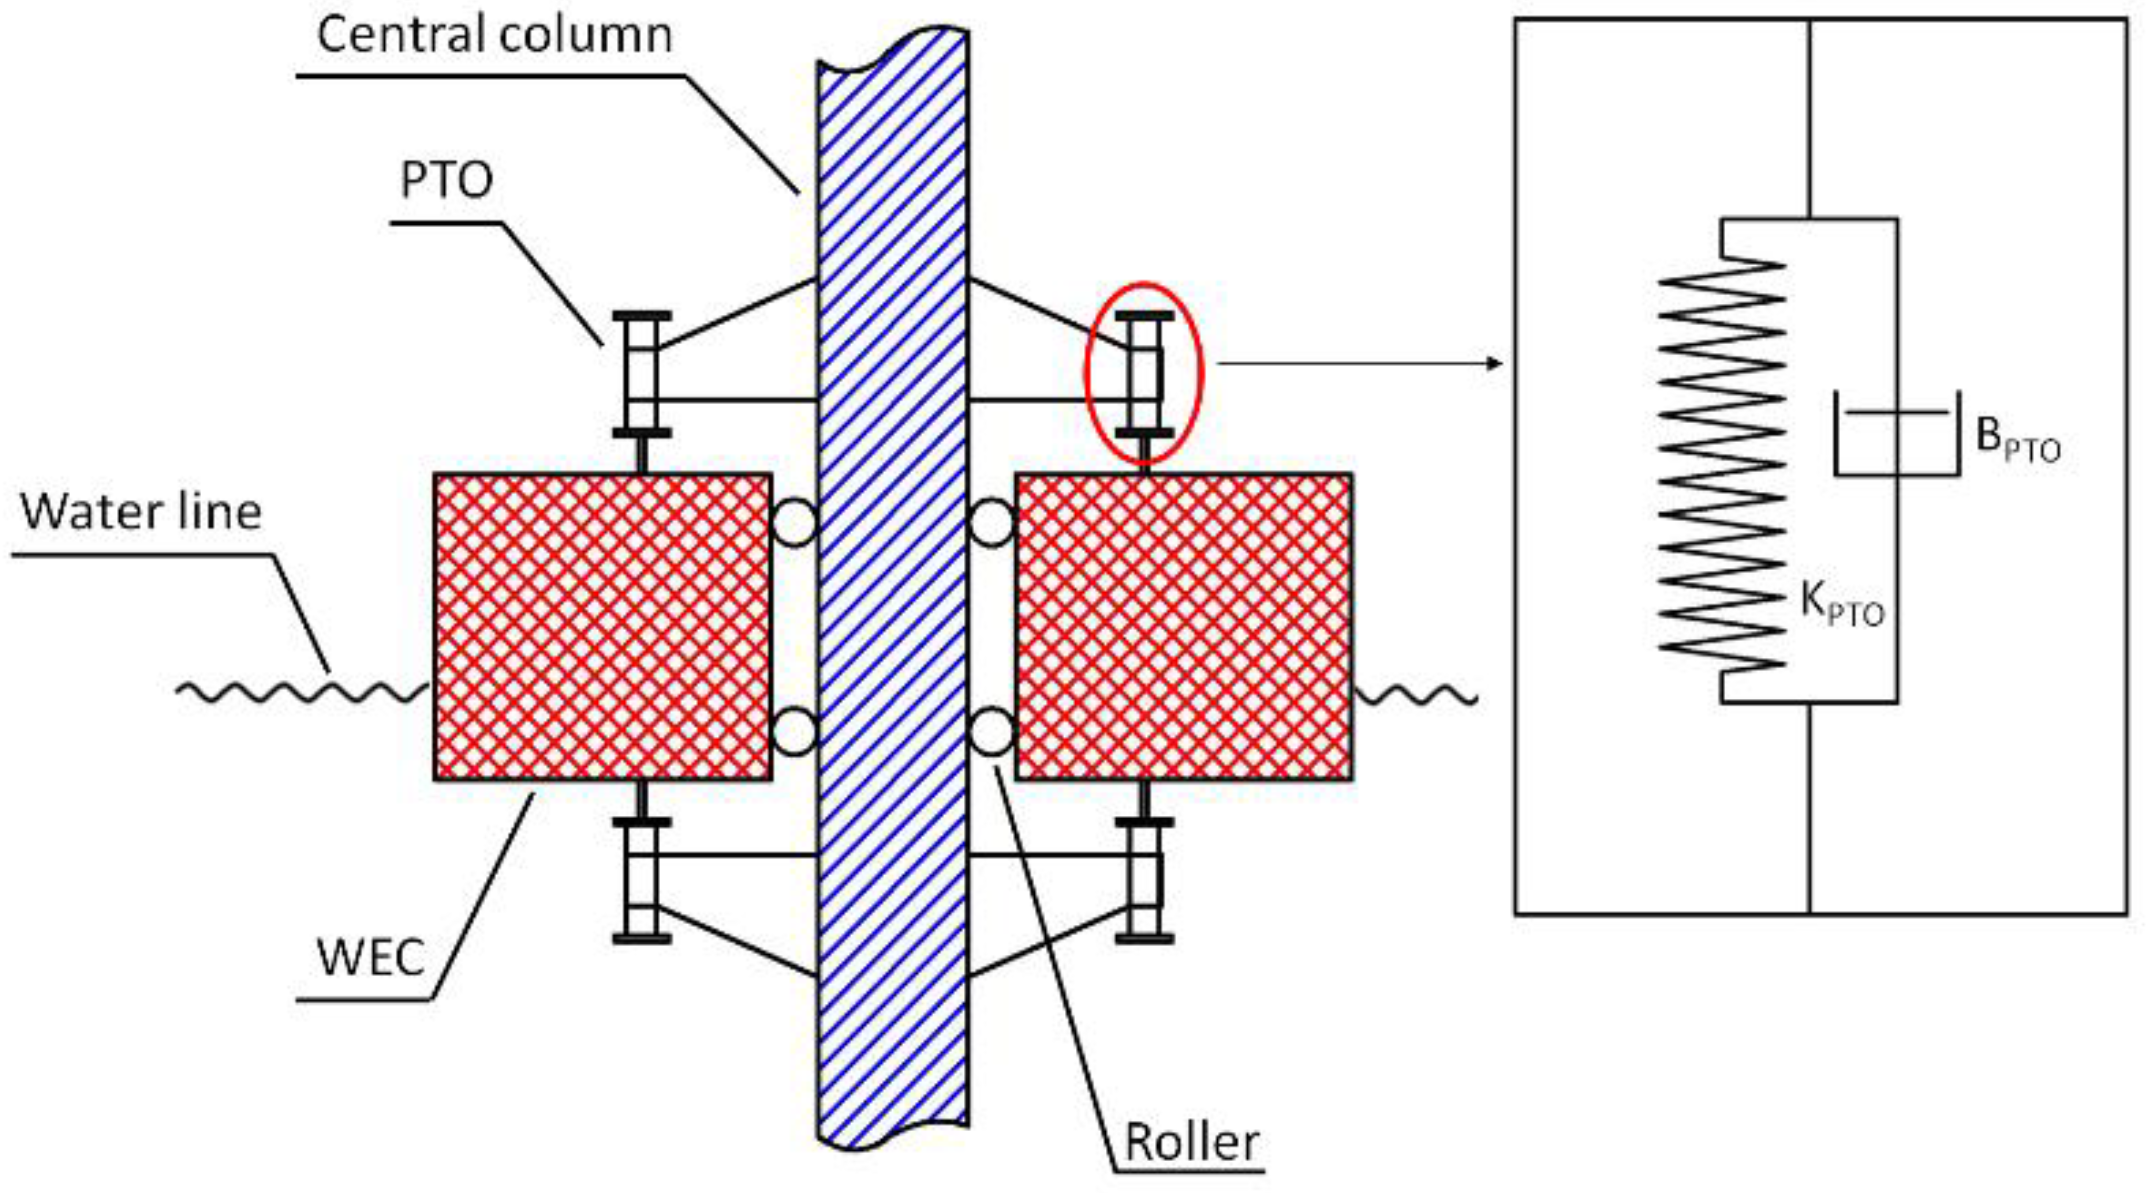
3.2. Power-Take-Off (PTO) System

The combined structure has been modeled as two rigid bodies consisting of a semisubmersible platform and a WEC, which are connected by a PTO. The PTO has been simplified as a system of heave-direction linear dampers (BPTO) and linear springs (KPTO) and is modeled with the use of corresponding fender features in ANSYS/AQWA (Figure 2).
For the PTO system [9], the PTO force includes the linear damping force and the linear spring force, which can be expressed as:
F P T O = B P T O ( x ˙ 2 x ˙ 1 ) + K P T O ( x 2 x 1 )
where BPTO and KPTO are the linear damping stiffness coefficient and the linear spring stiffness coefficient, respectively.
Moreover, the produced power by the relative heave motion between the column of the semisubmersible and the WEC is calculated as follows:
P = B P T O ( x ˙ 2 x ˙ 1 ) ( x ˙ 2 x ˙ 1 )

4. Results and Discussion

4.1. Model Parameters Best Selection

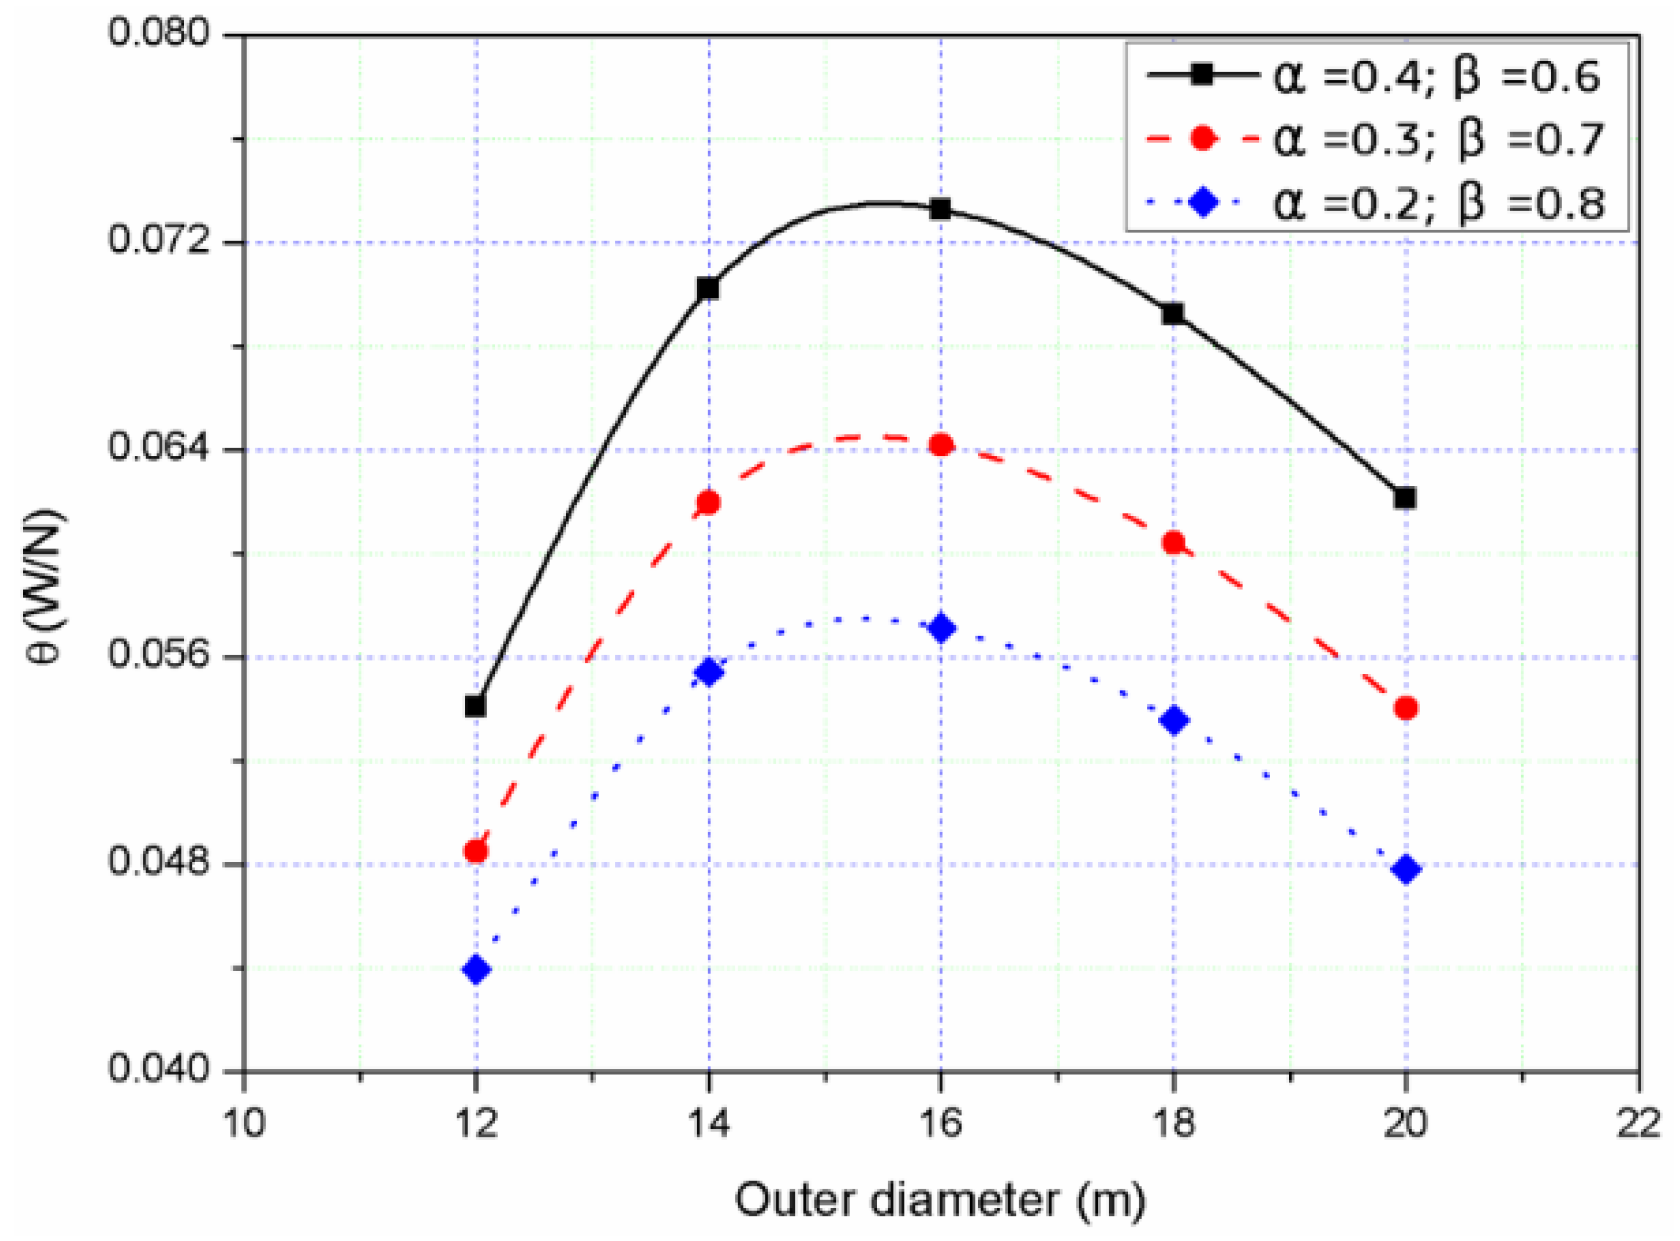
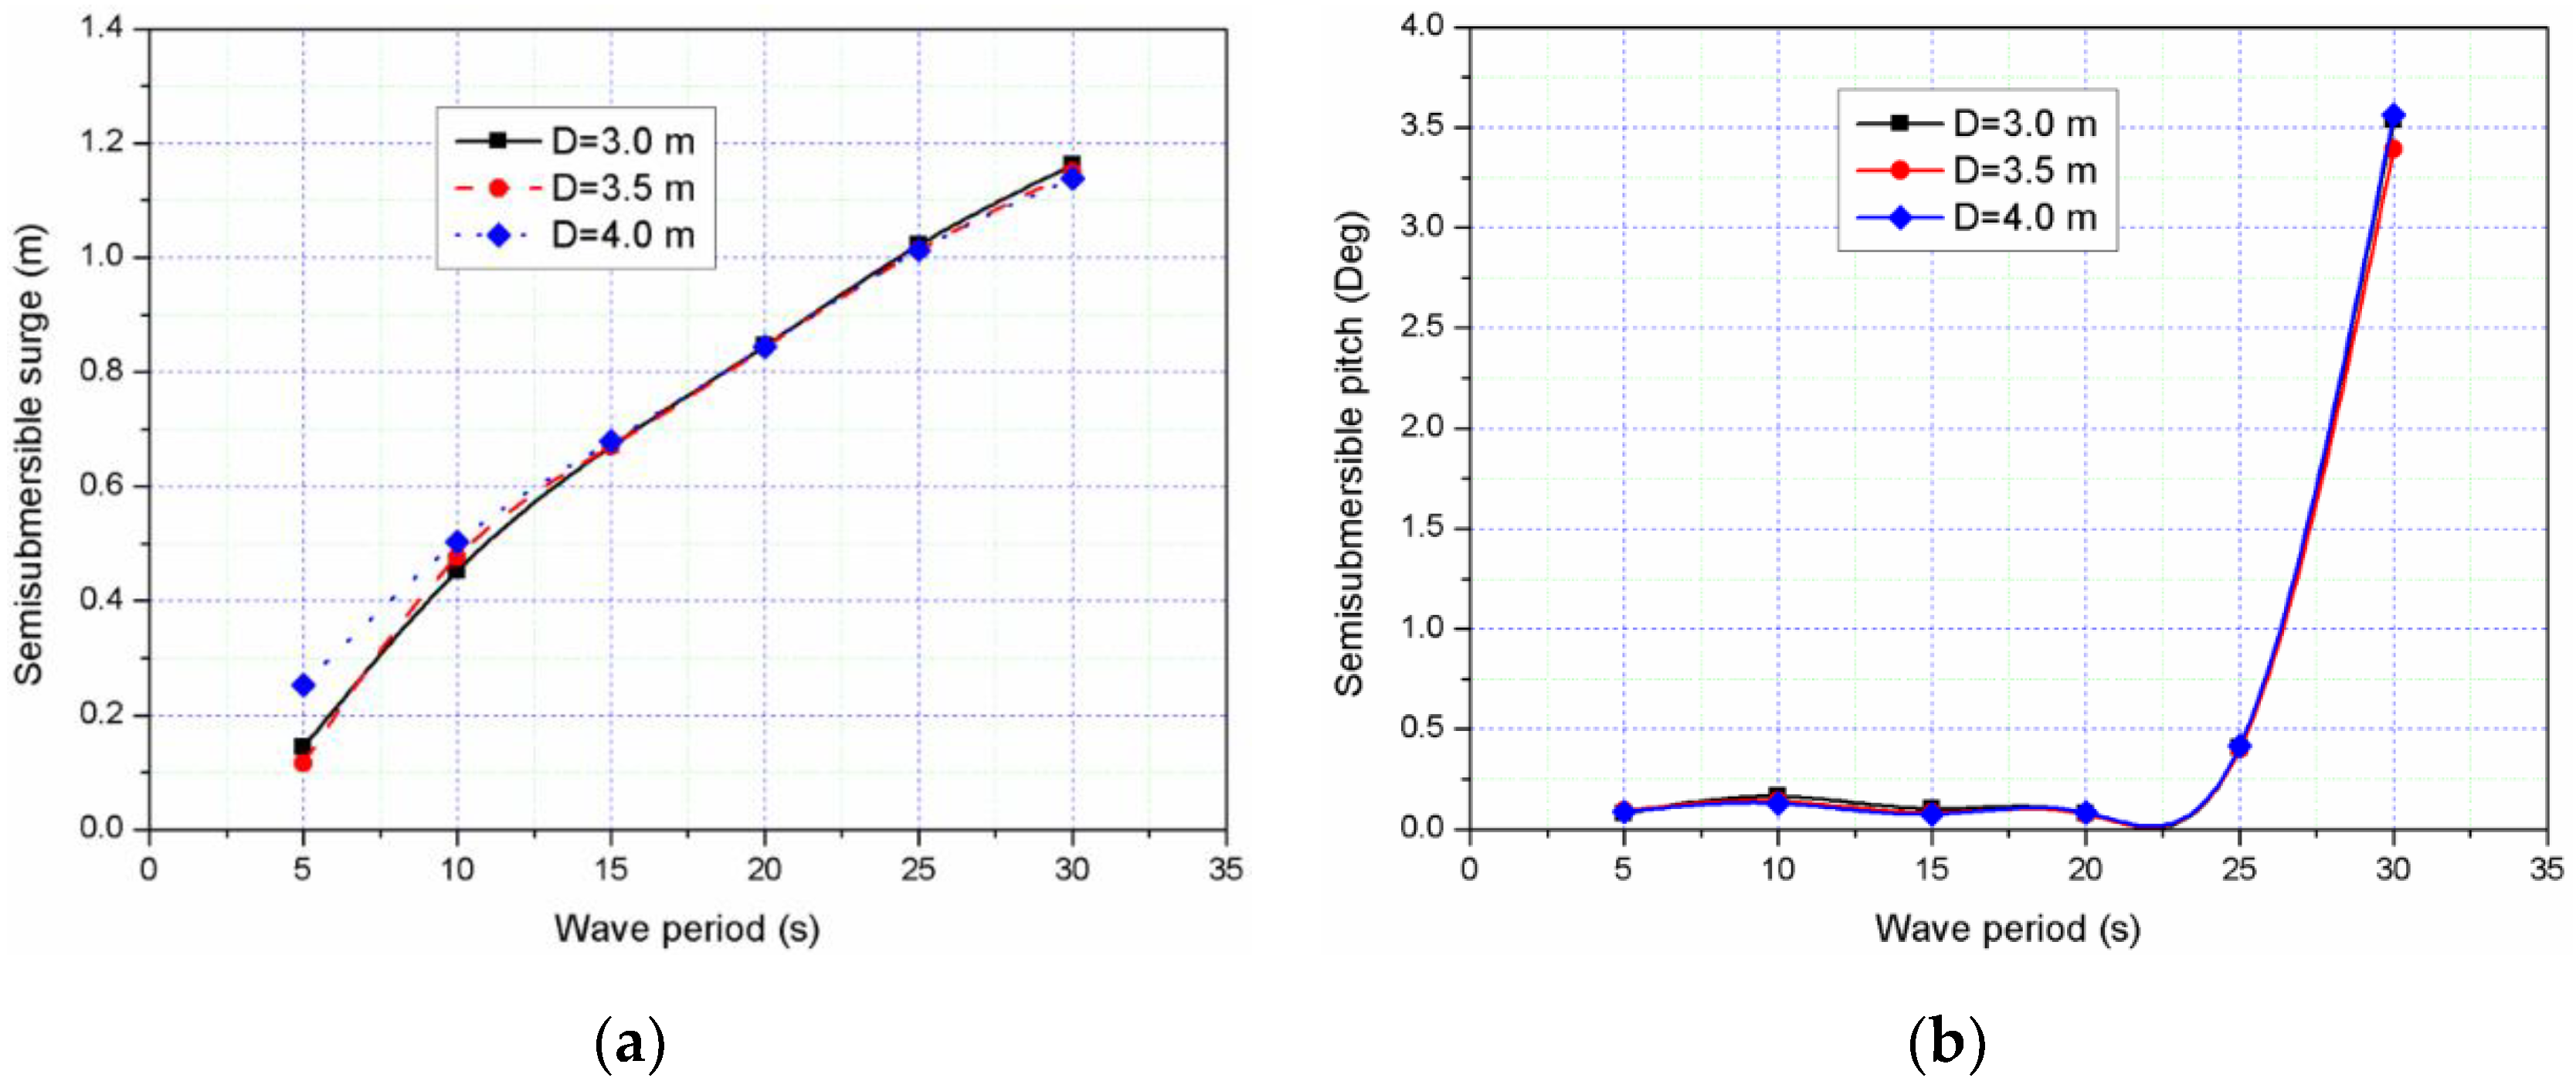
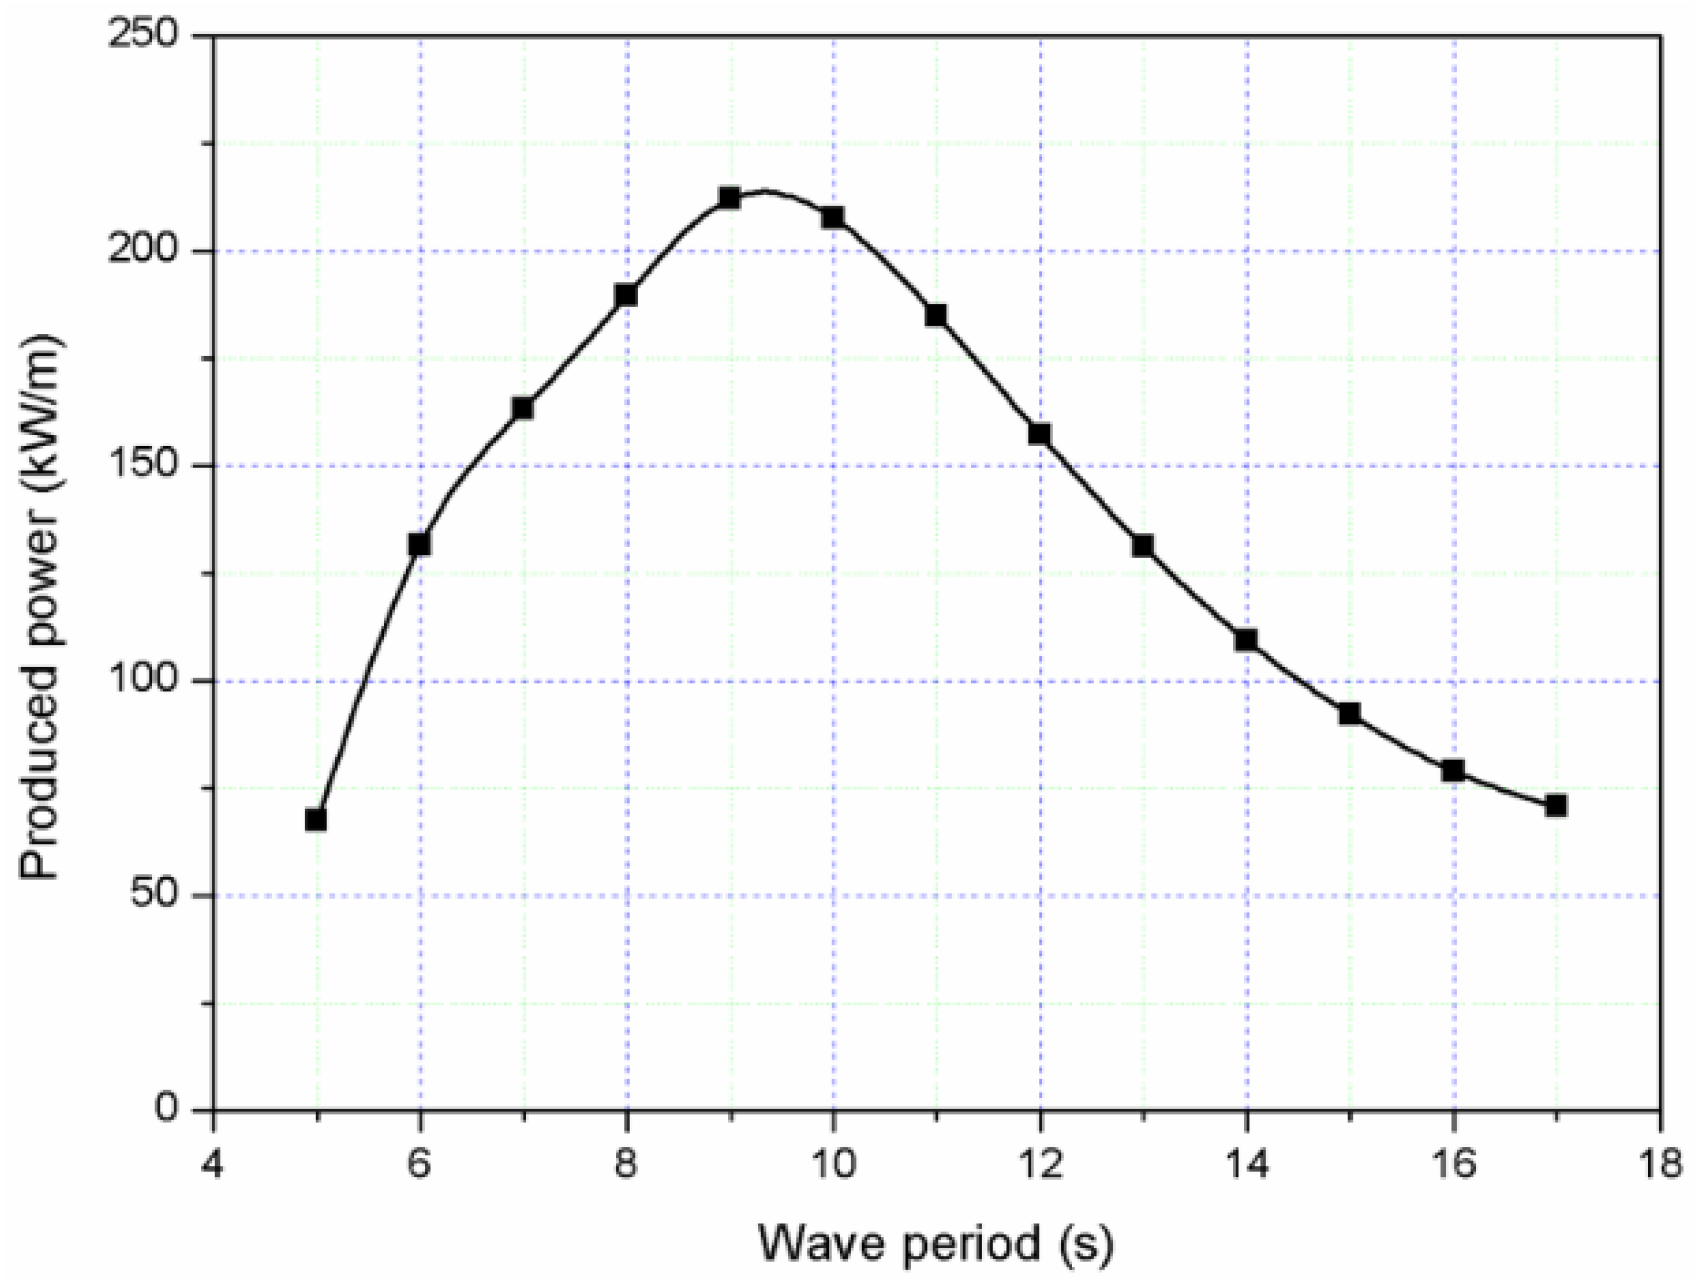
4.1.1. Preliminary Determination of Structural Design Parameters of the WEC

The modification of the structural parameters of the WEC will directly affect its hydrodynamic performance, resulting in changes in the produced wave energy efficiency. By evaluating the motion responses of the combined structure, a rational outer diameter and draft can be obtained.
Five different outer diameters of the WEC ranging from 12.0 m to 20.0 m are examined. To obtain the best WEC in terms of PTO produced power, WEC’s cost and structure’s safety, some factors such as gravity of the WEC and the horizontal contact forces between the column of the semisubmersible and the WEC have been considered. The values of those parameters are calculated under a regular wave with wave height 2 m and wave period 9 s. It is noted that wind loads are not considered here. To reduce the cost and increase safety, the best selection of outer diameter of the WEC can be obtained by Equation (24) and Figure 3. It is noted that we did not solve the mathematical optimization problem in this paper. Based on the curves in Figure 3, a rational value of 16 m is selected for the rest of the paper since all the curves are close to their peak for 16 m.
θ = P α F h + β G
where θ reflects a performance indicator of the WEC; P, Fh and G represent the PTO produced power, horizontal contact force and WEC weight, respectively, and α and β are related to the cost and safety of the WEC. With the comparison of different parameters with various groups (α = 0.4, β = 0.6; α = 0.3, β = 0.7; α = 0.2, β = 0.8), it is found that the best selection will be achieved when the outer diameter is 16 m. In this paper, we assume that cost reduction (related to β) is more important and the safety is less important (related to α) for the combined structure. Therefore, α = 0.3, β = 0.7 is assumed in this study.
Moreover, the effect of different drafts of the WEC on the responses of the semisubmersible are presented in Figure 4 and are slightly different when the draft is 3.0 m and 3.5 m. However, considering the possible slamming effects due to water entry and exit, which can destroy the WEC, choosing the value of the draft (3.5 m) is more reasonable. Therefore, the selection of diameter 16 m and draft 3.5 m is followed in the rest of the paper.

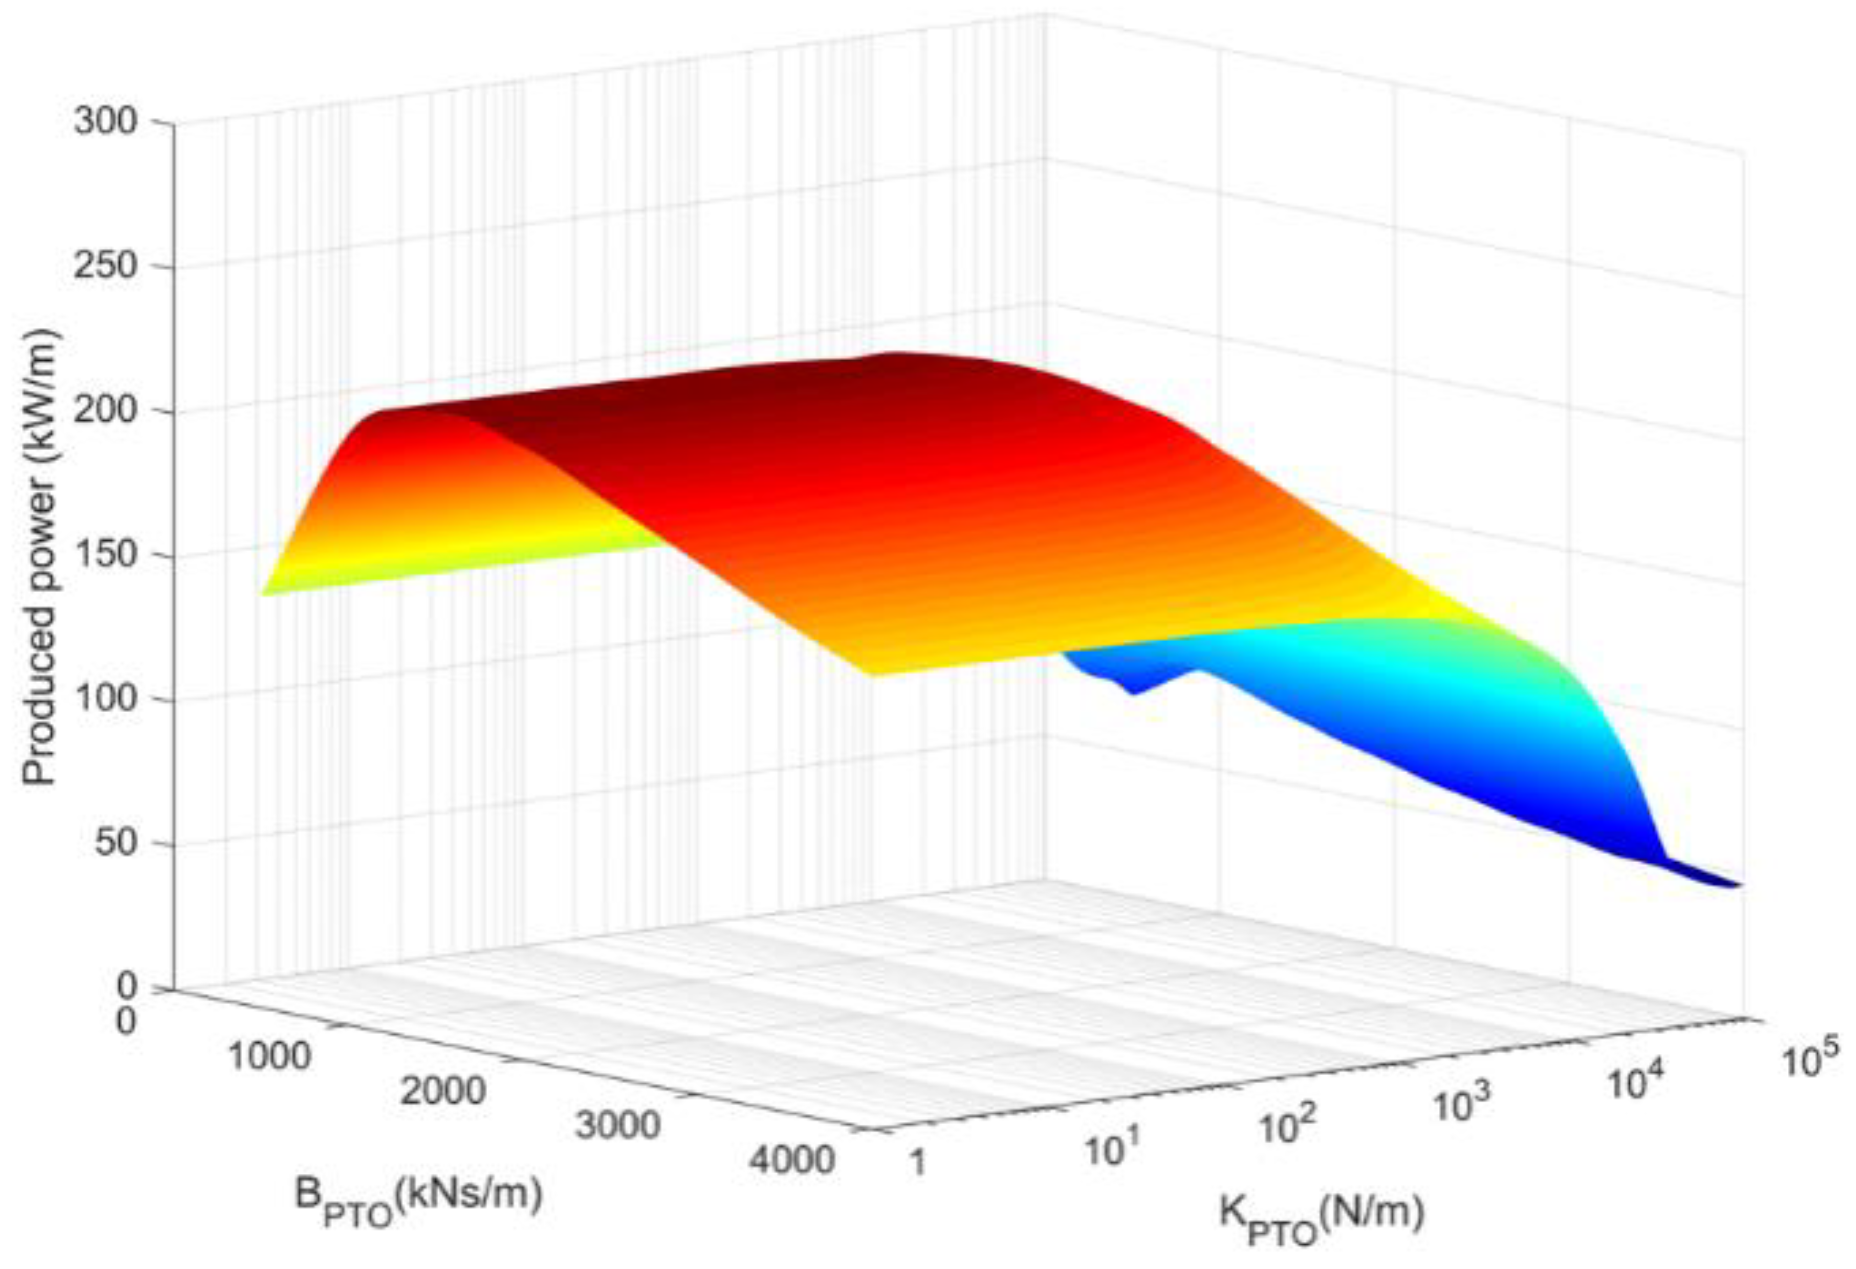
4.1.2. Determination of Rational BPTO and KPTO Parameters

Before determination of linear damping and stiffness coefficients, the effect of different wave periods (BPTO = 2000 kNs/m, KPTO = 100 N/m was arbitrary selected) on the PTO produced power has been investigated under regular waves with wave height 2 m. The values of produced power are shown in Figure 5. It indicates that there is a maximum produced power when the wave period is around 9 s because the WEC was designed to have a natural period in heave around 7–2 s.
The BPTO and KPTO parameters can significantly affect the dynamic responses of the combined structure. To illustrate mutual effects of linear damping and stiffness coefficients on the PTO produced power of the WEC, different BPTO and KPTO values are simulated with wave height 2 m and wave period 9 s. The results of produced power are shown in Figure 6; it can be seen that the value of produced power will be the largest when the BPTO coefficient is 1500 kNs/m with an invariable KPTO. The value of produced power increases when the BPTO is smaller than 1500 kNs/m, while the values will decrease when the BPTO is larger than 1500 kNs/m. Moreover, for same BPTO values, produced power decreases as KPTO increases, which is more significant when its value is over 1000 N/m. Therefore, a best BPTO coefficient of 1500 kNs/m and a KPTO coefficient of 1 N/s are selected for the rest of the paper, respectively.

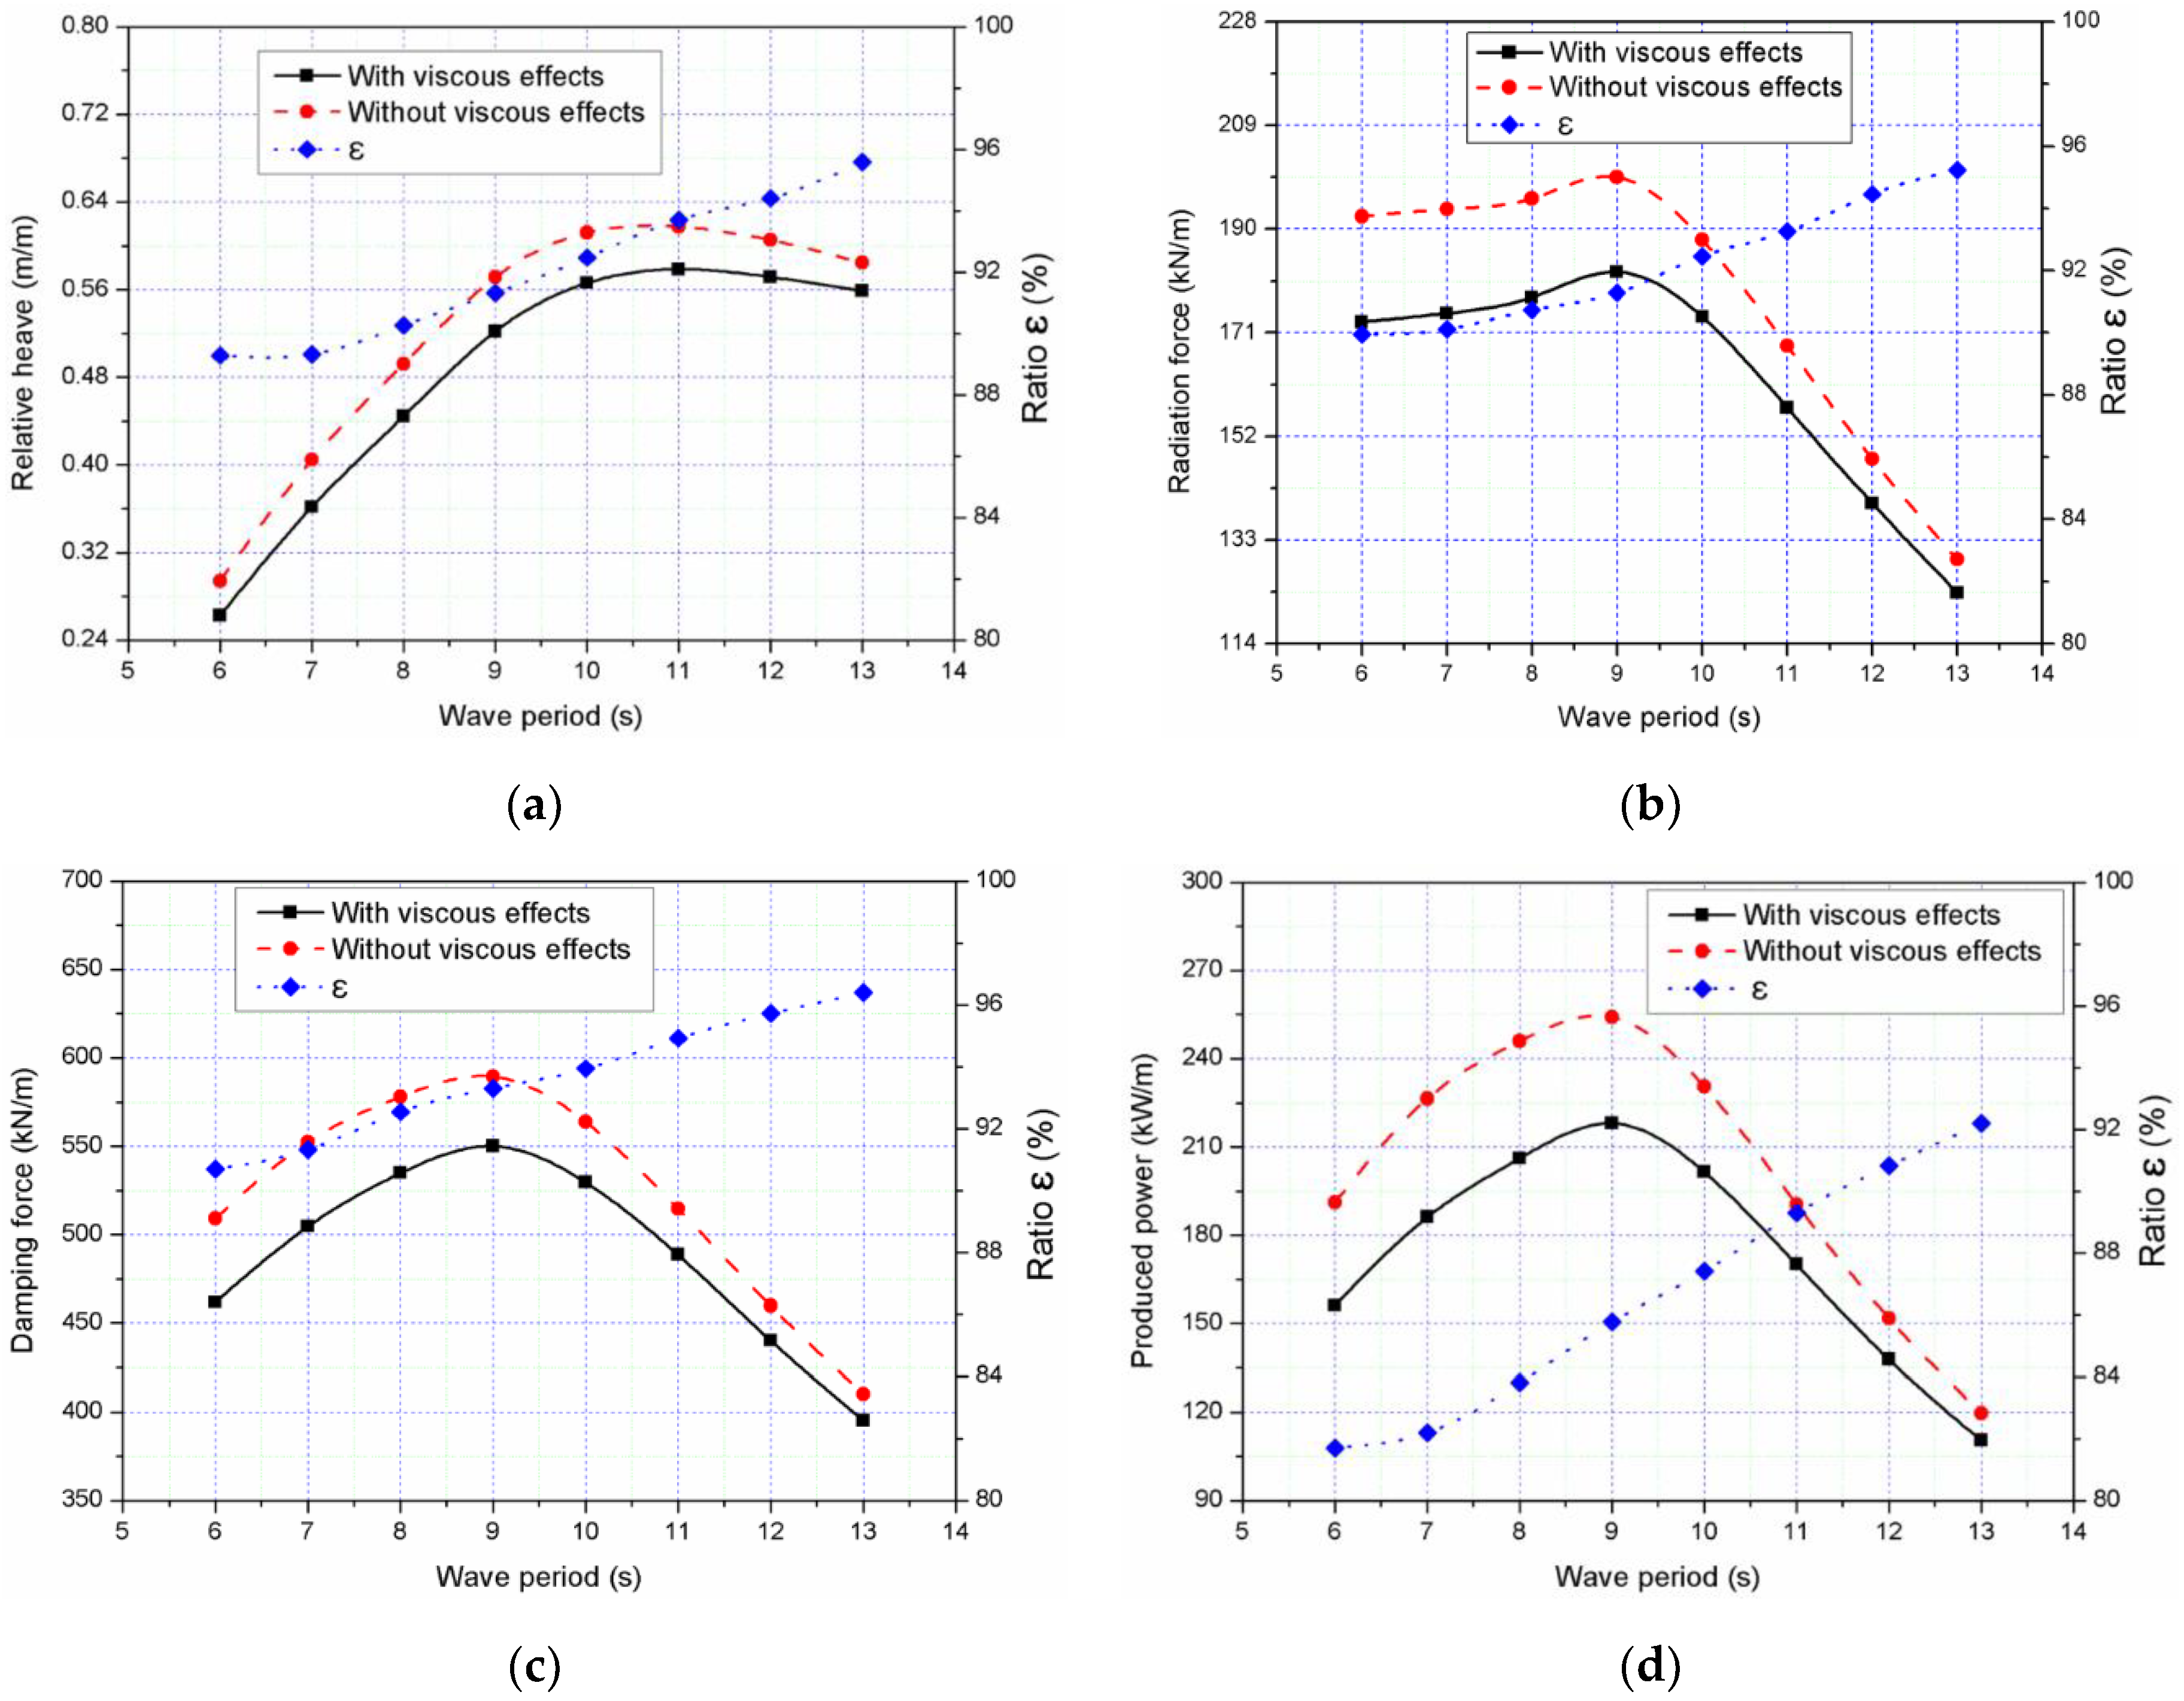
4.2. Viscous Effects on the Heave Motion of the WEC

By ignoring viscous effects, the produced power may be overestimated when there is a large relative motion between the semisubmersible and the WEC. The dynamic responses of the combined structure with or without considering viscous effects have been presented for regular waves with a wave height 2 m and a wave period 9 s. In Figure 7, the dynamic responses considering viscous effects are smaller than those without considering them. The relative heave motion with viscous effect has a peak value when wave period is 11 s, which is different from that without viscous effect. However, the radiation force, PTO damping and produced power, a peak value exists when the period is 9 s. Moreover, the ratio which can quantitatively describe viscous effects on the combined structure between those responses (Equation (25)) always increases with increasing period.
ε = λ ν × 100 %
where ε is a ratio, and λ and ν represent the dynamic responses with and without viscous effects.

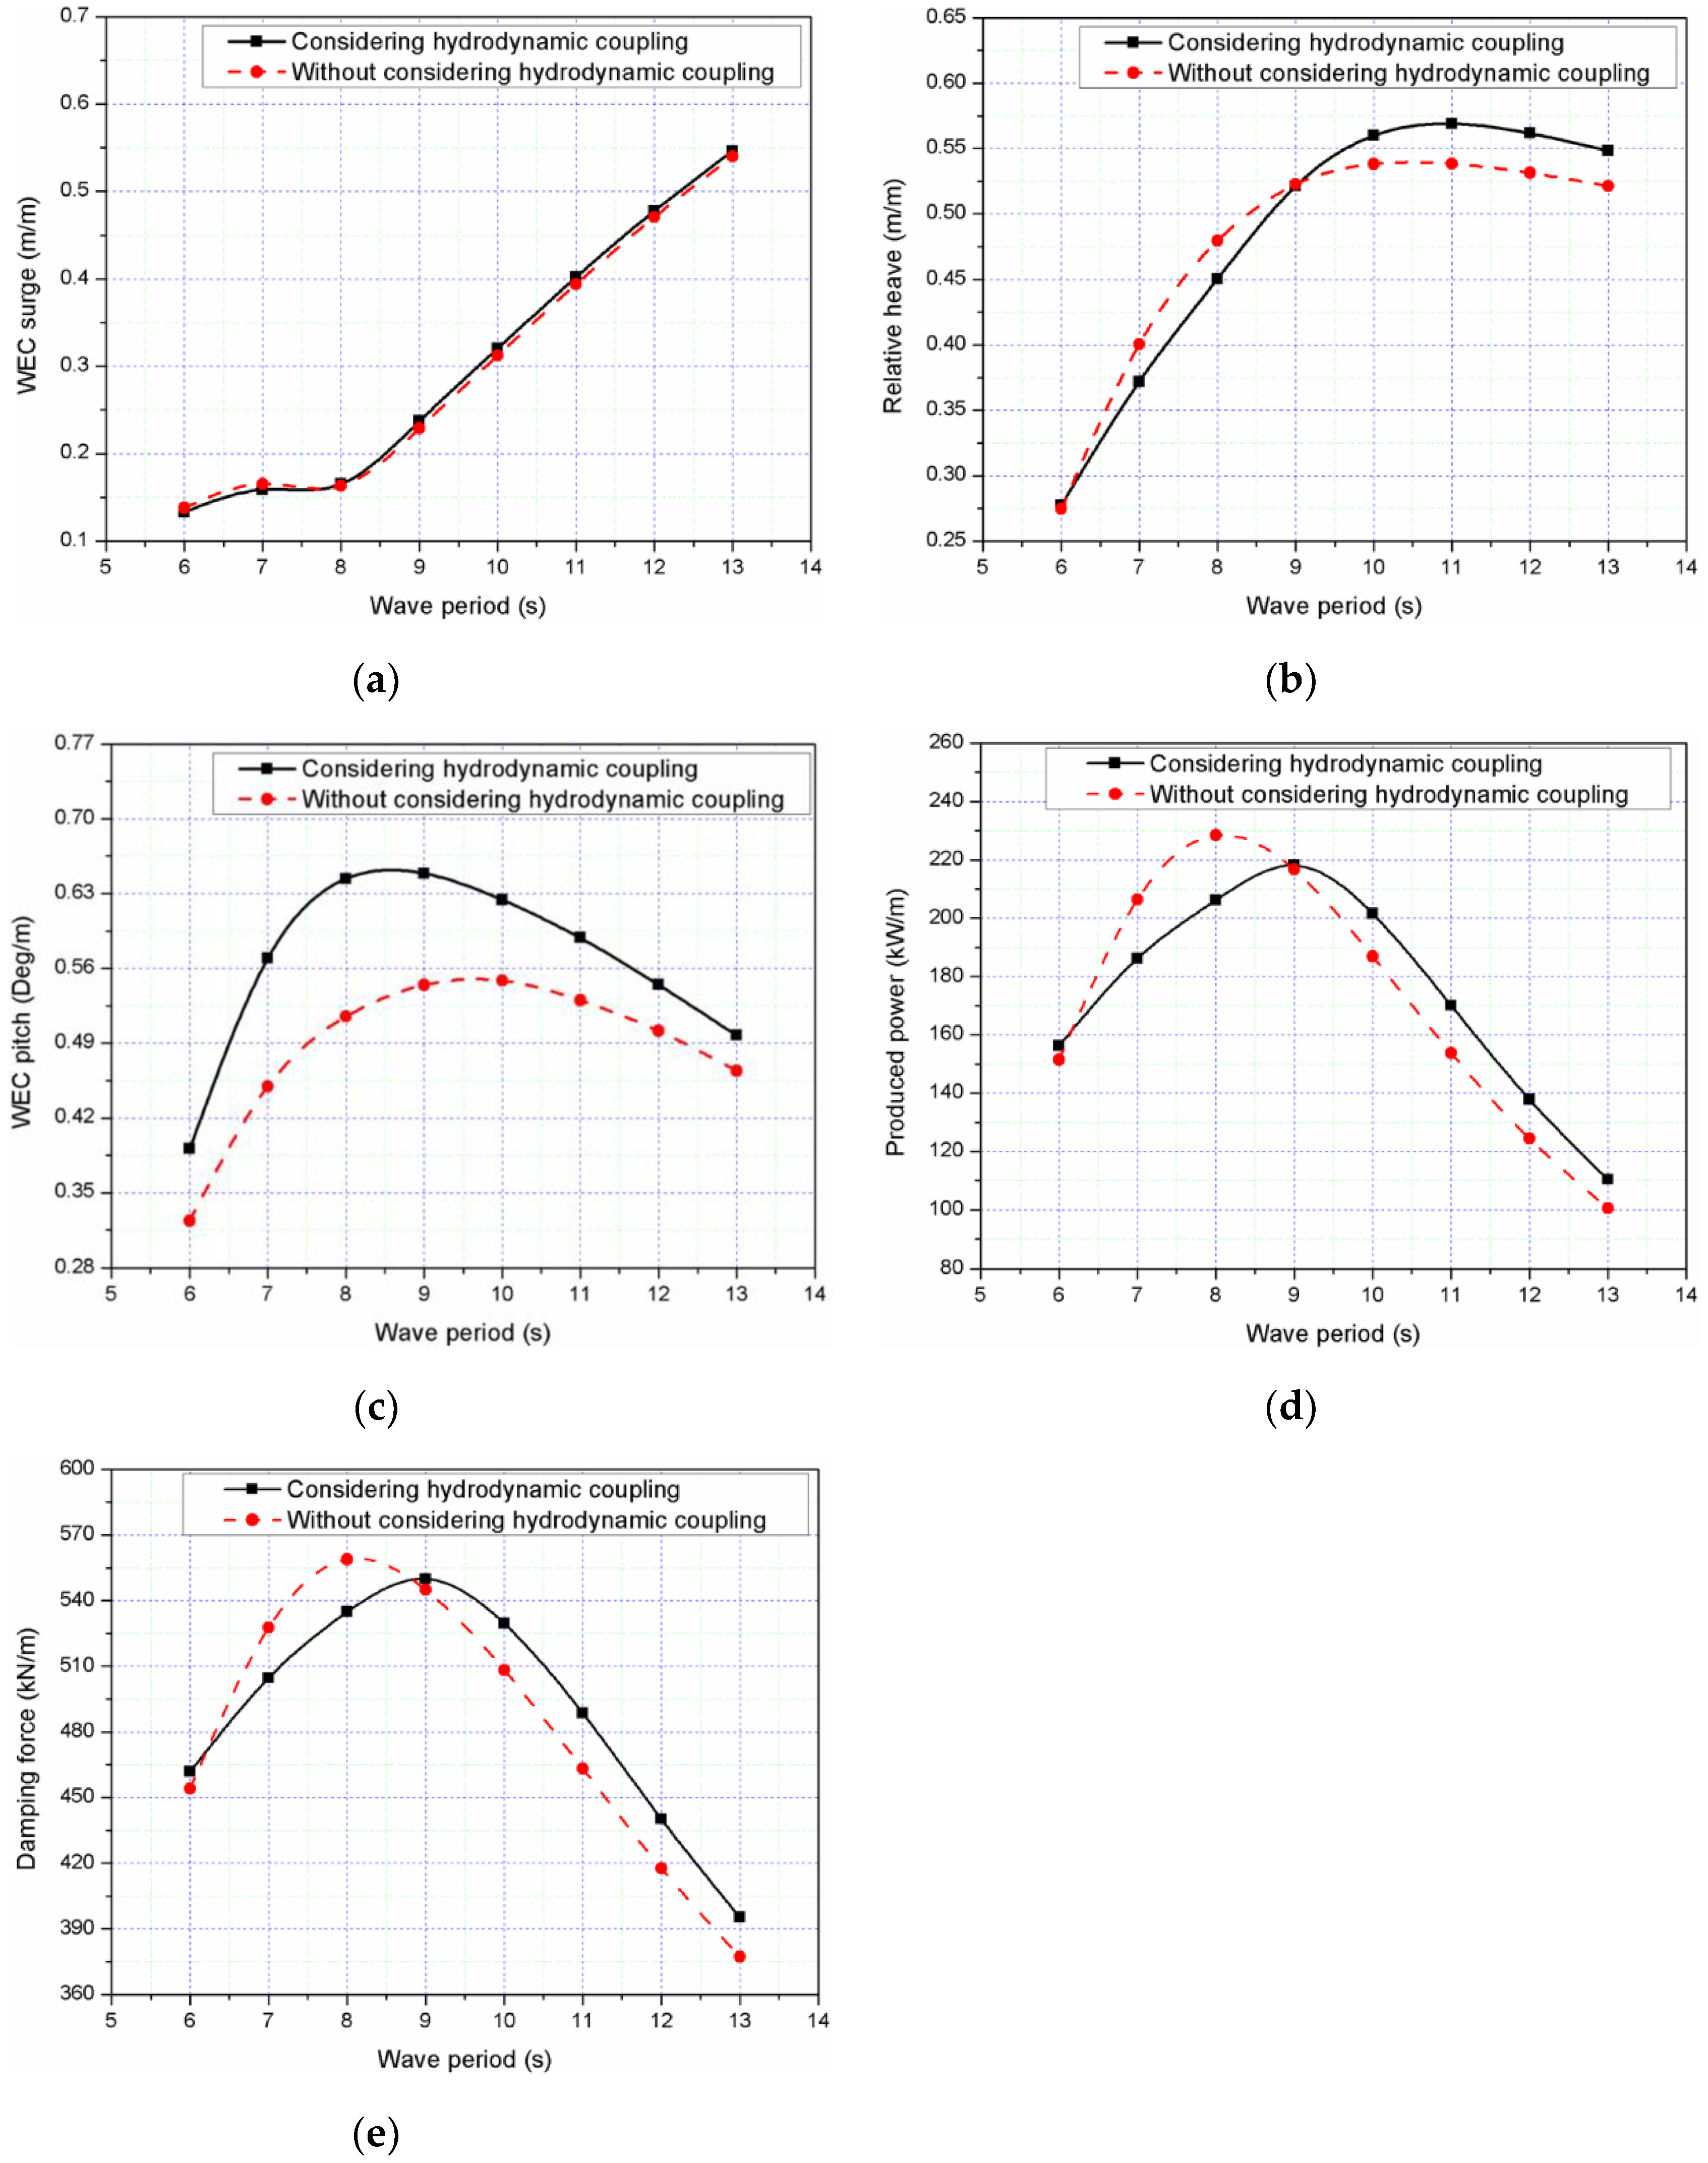
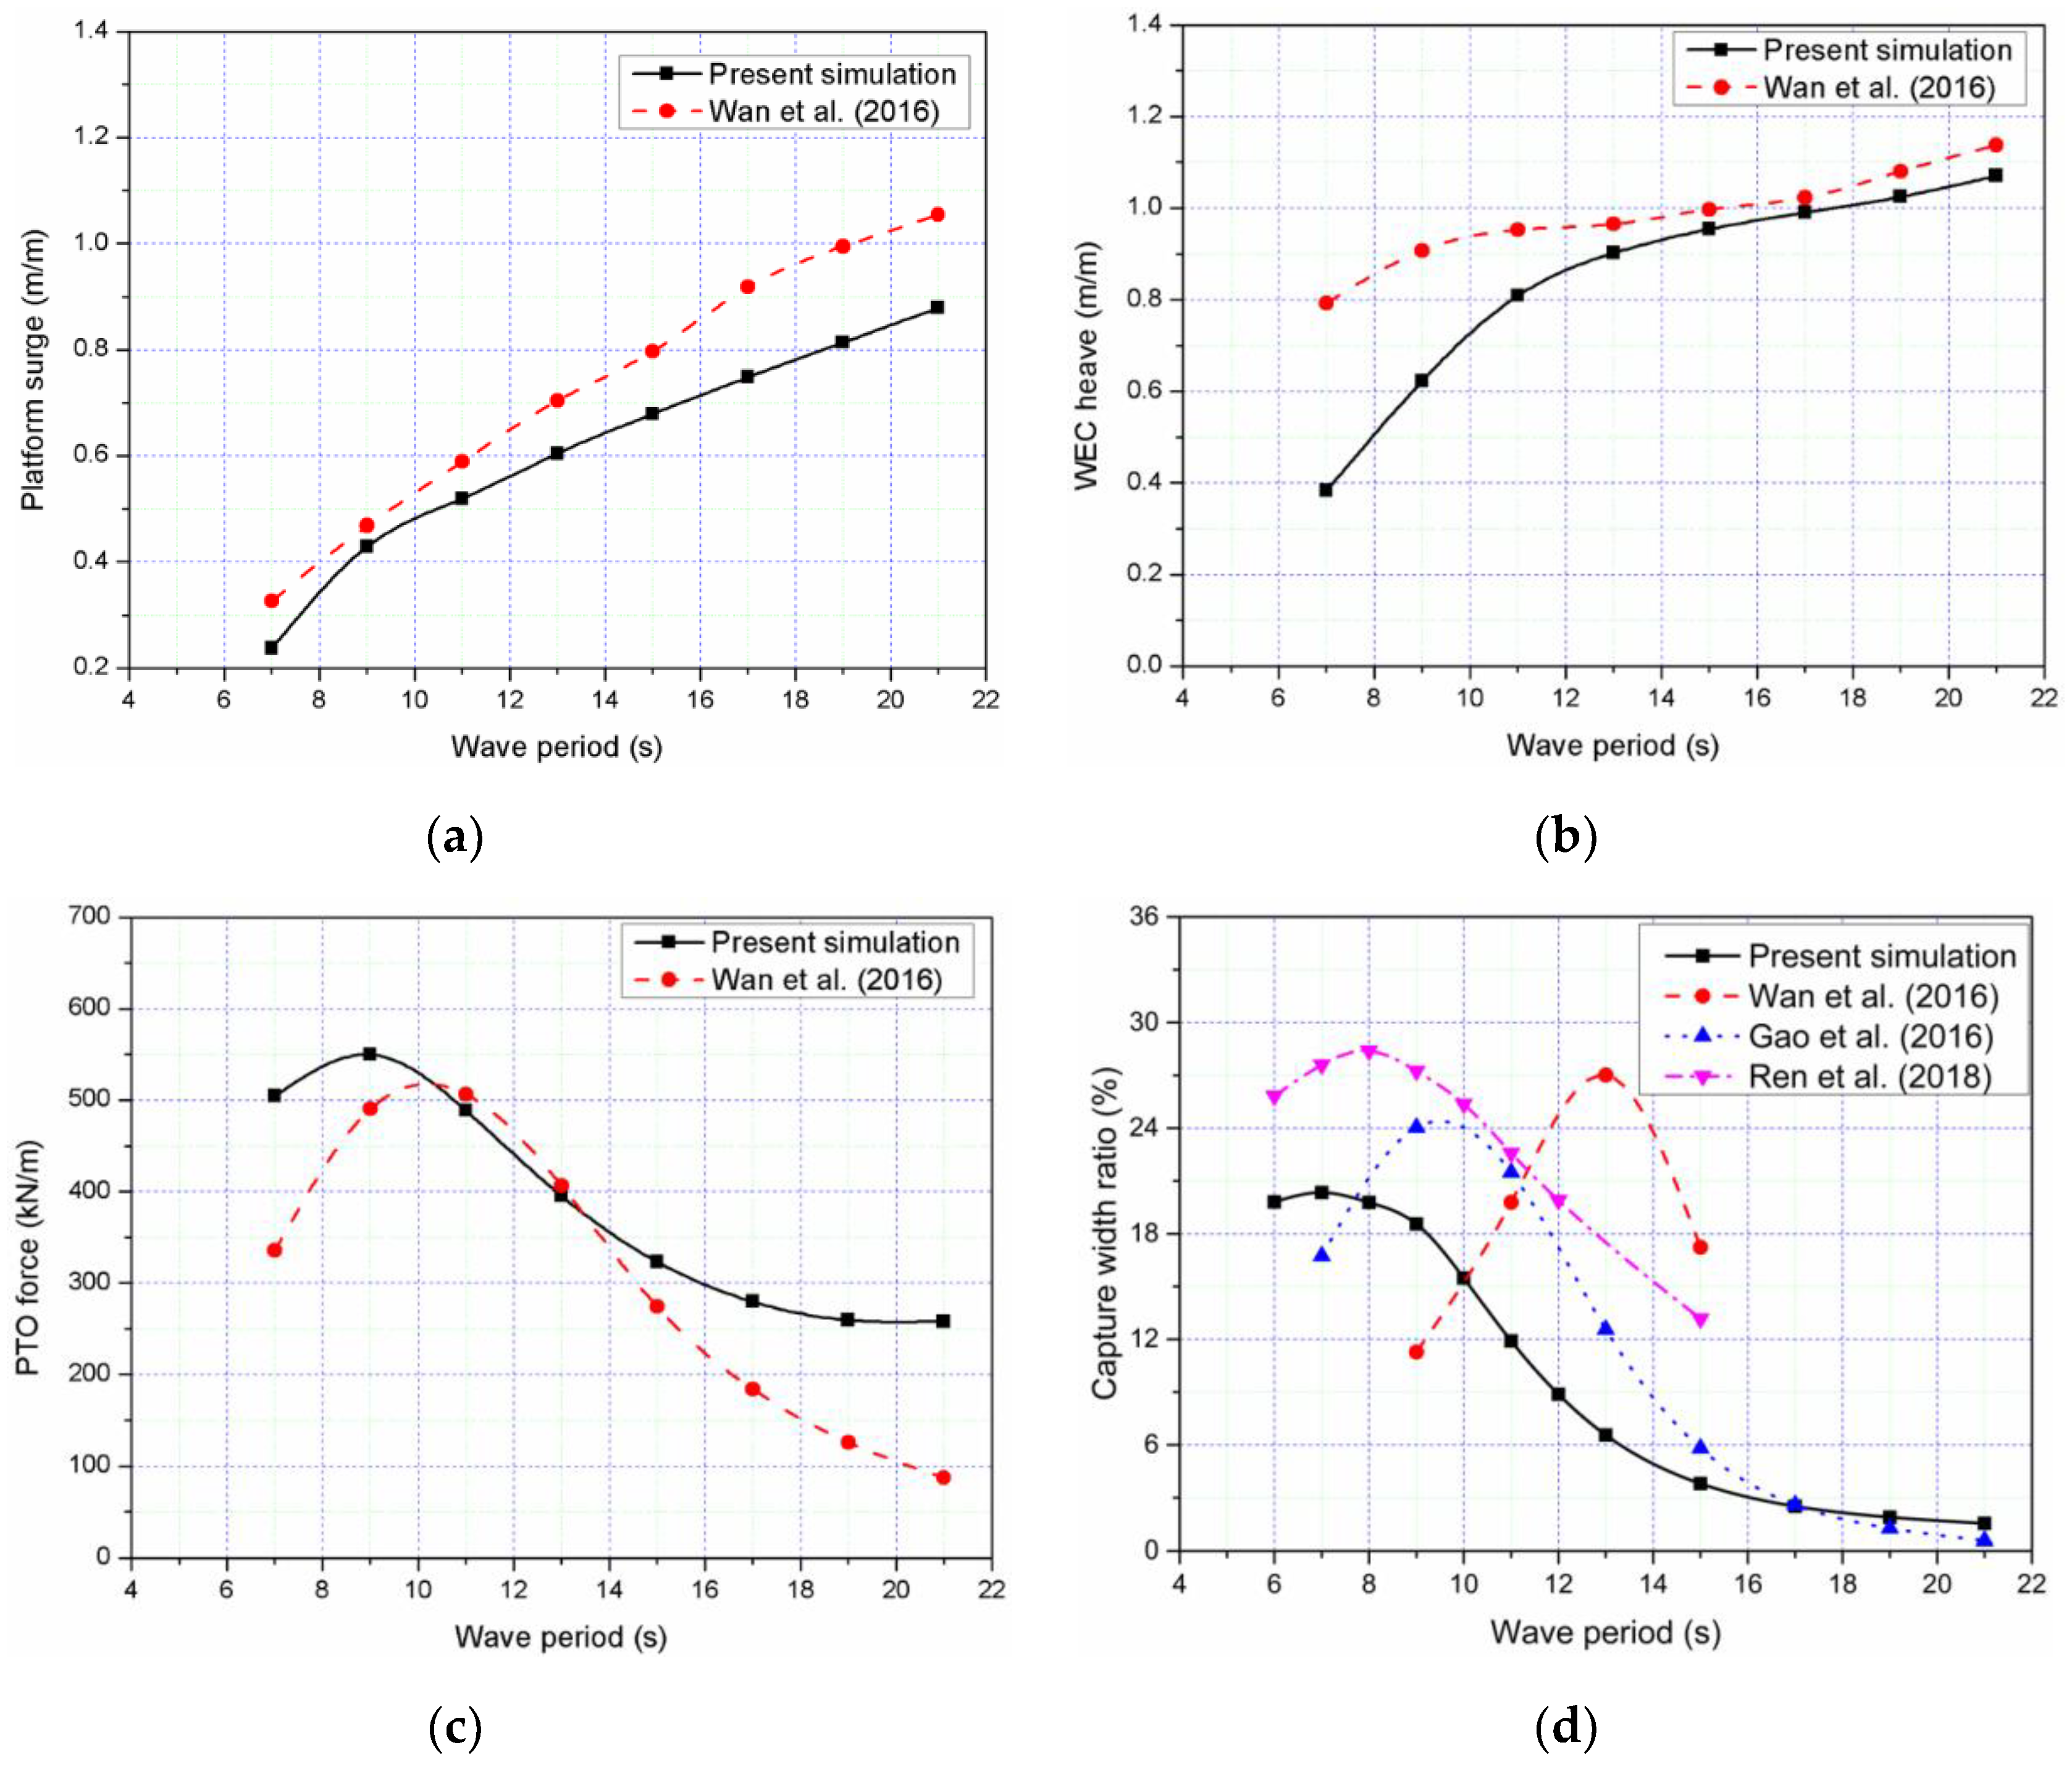
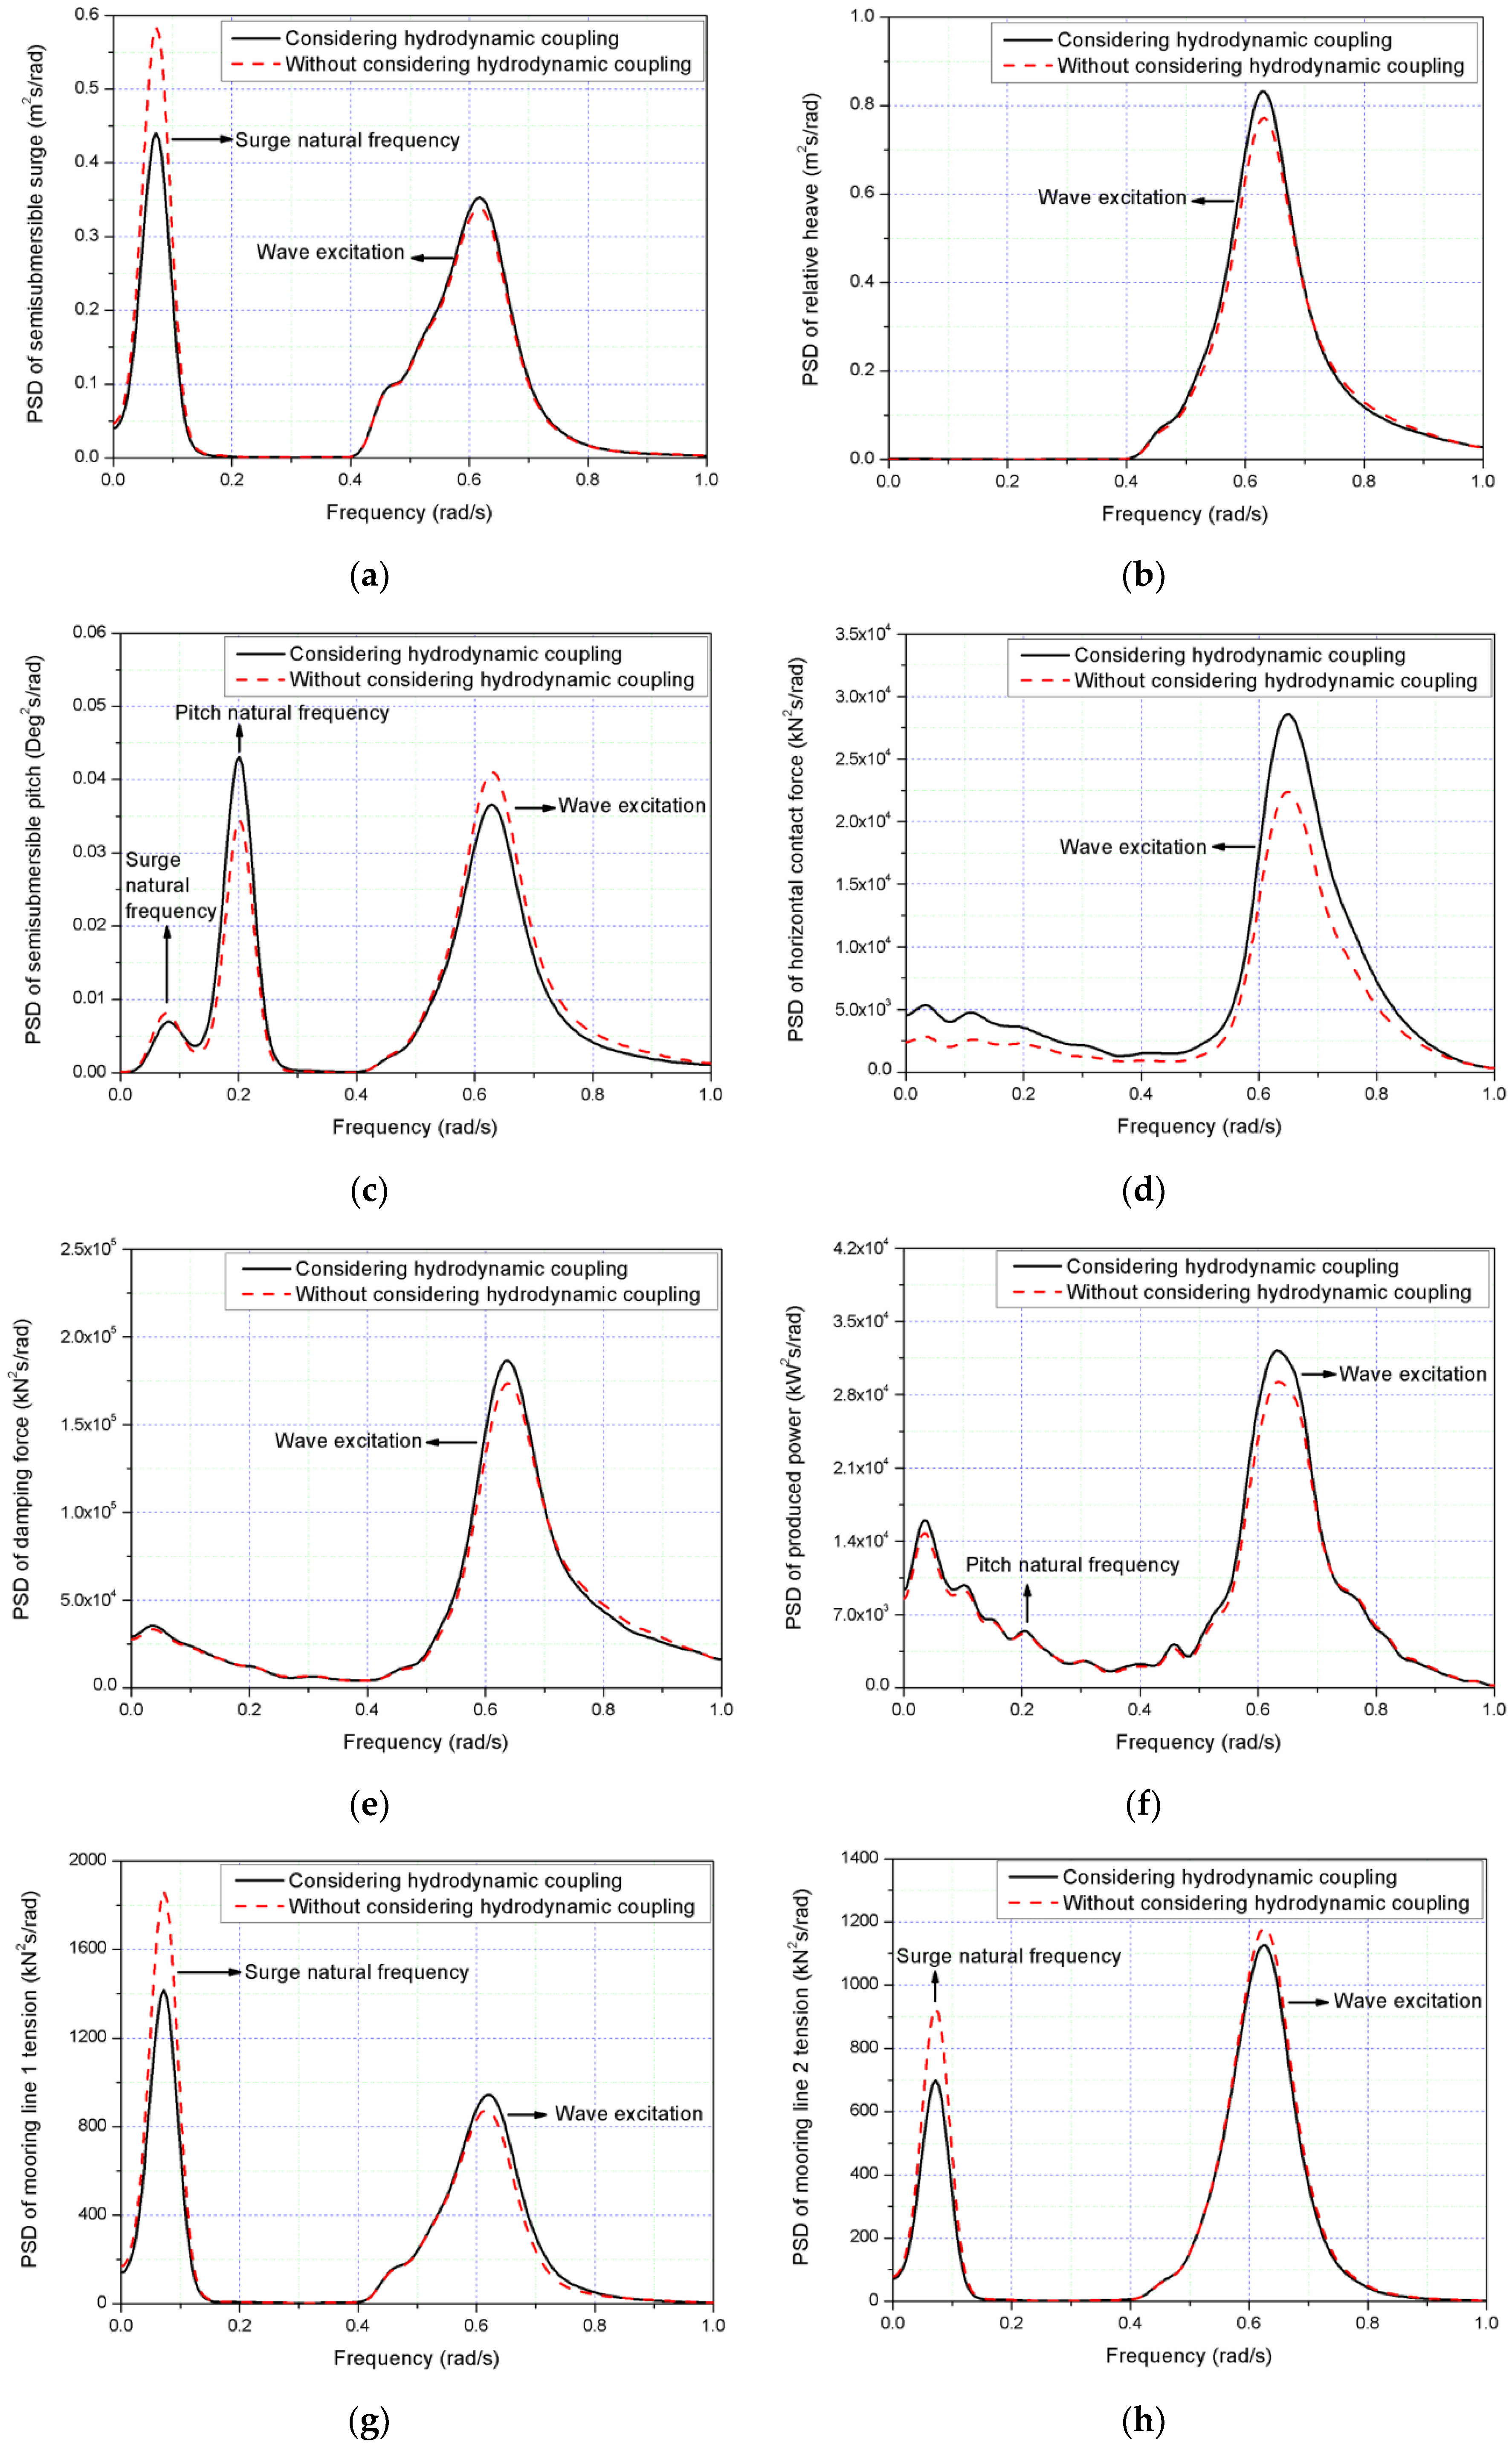
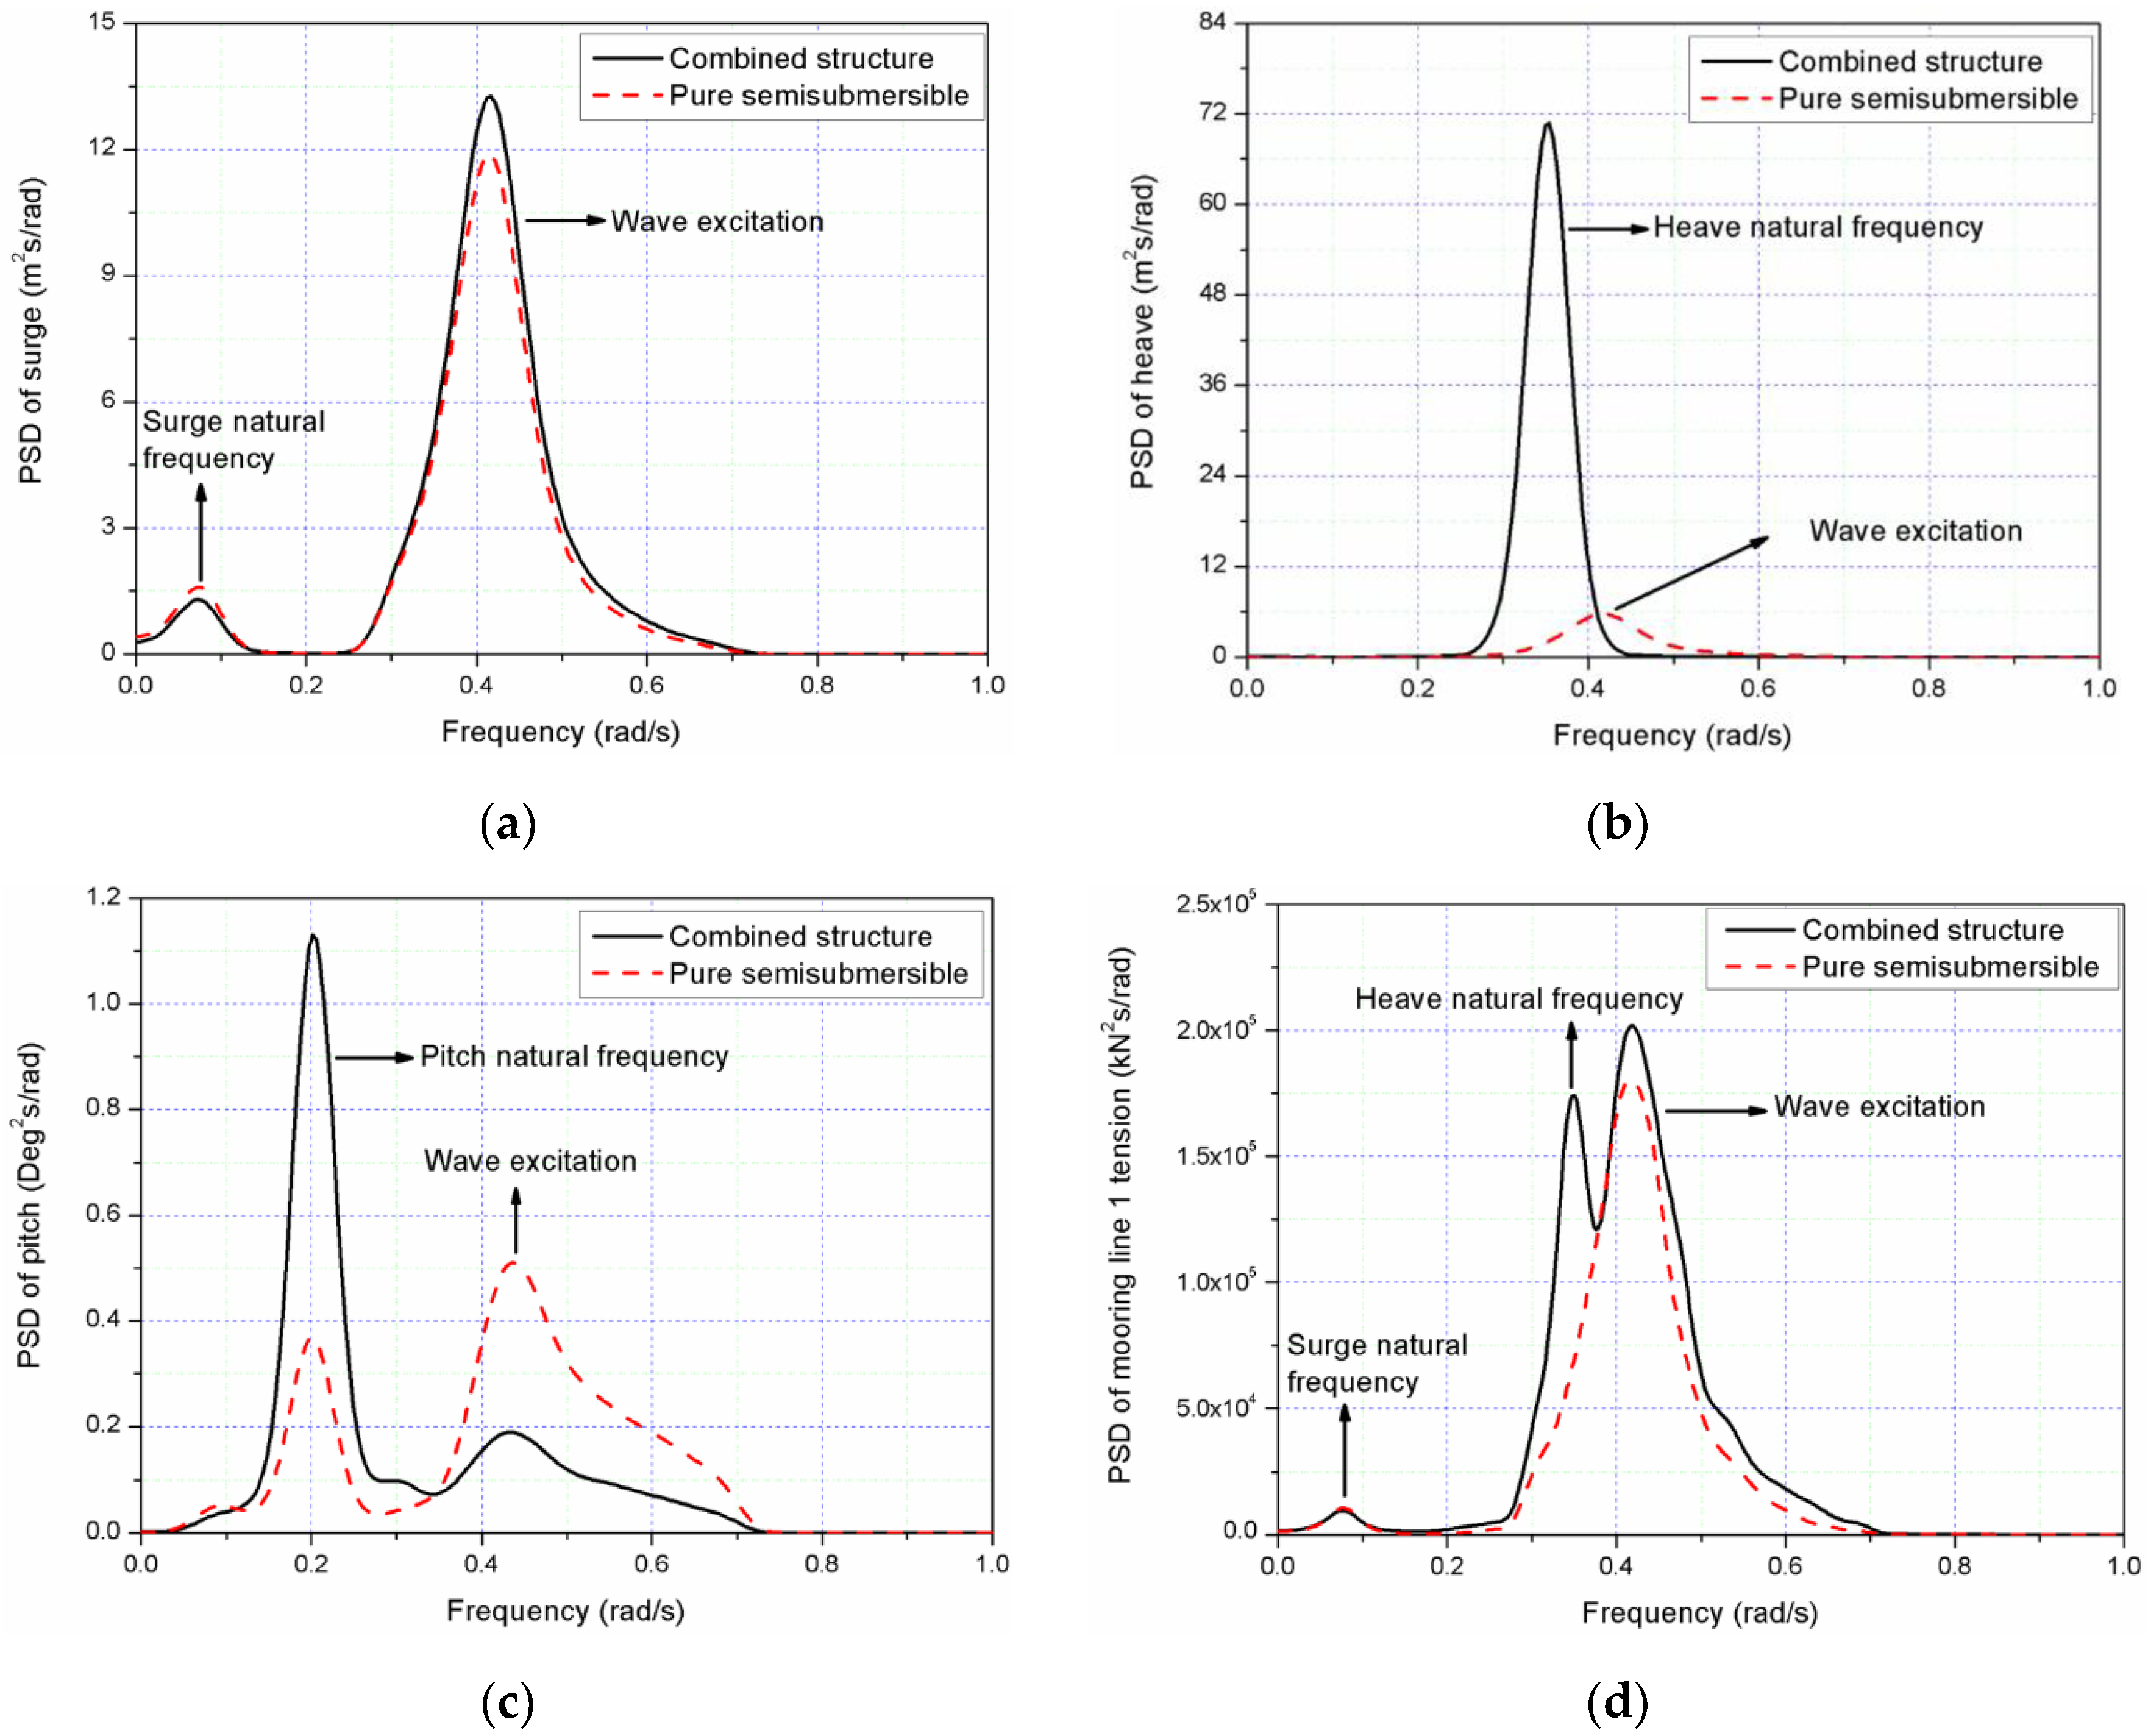
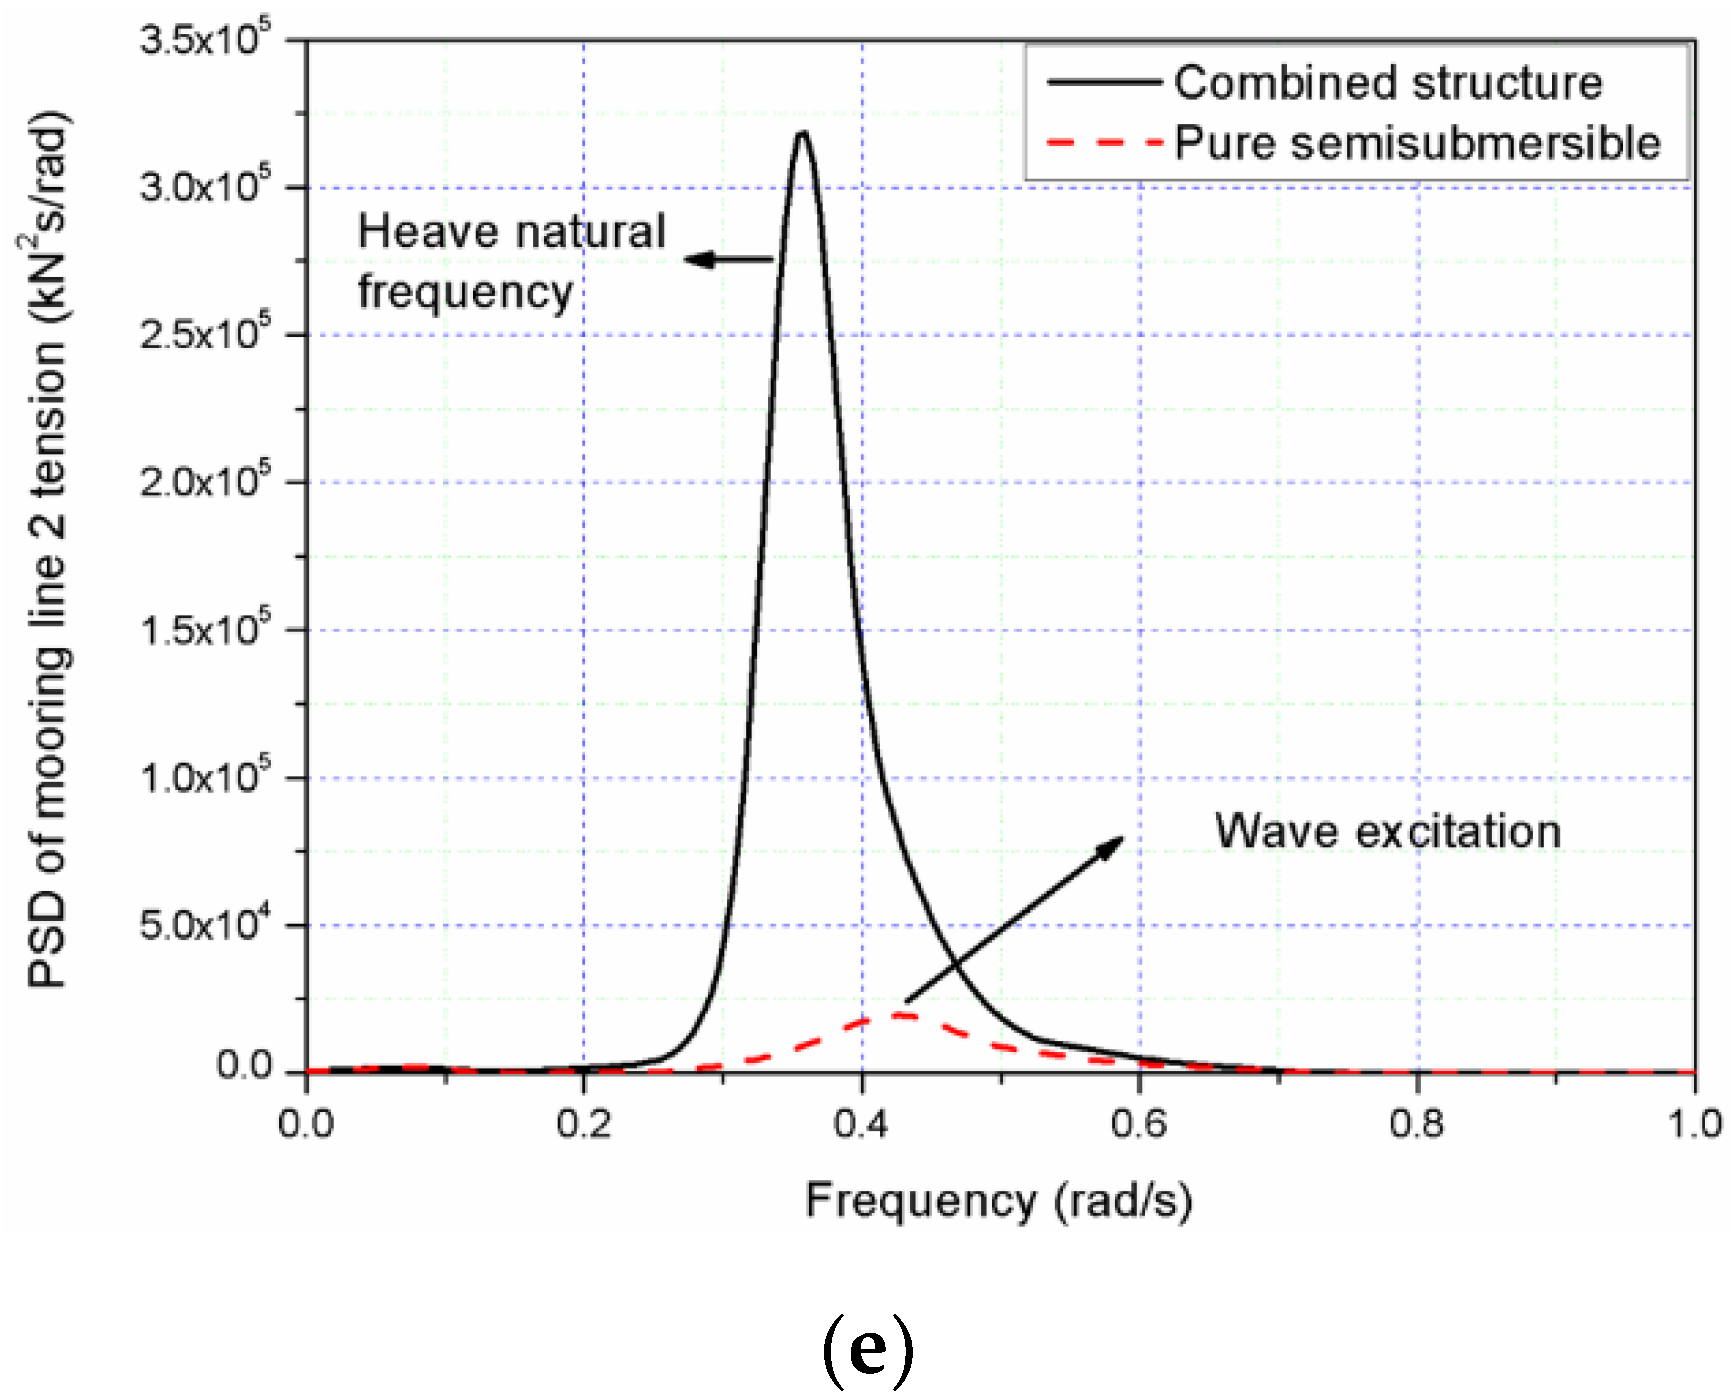
4.3. The Hydrodynamic Coupling Effect on the Combined Structure

In the flow field, in addition to the direct interaction between the semisubmersible and WEC, there is also an interaction between the two bodies due to the radiation and diffraction effects of the combined structure on the flow field. The radiation and diffraction potentials acting on the semisubmersible and WEC can interact when considering hydrodynamic coupling [26,27], which is proved by comparing diffraction forces and radiation forces of the semisubmersible and the WEC with considering hydrodynamic coupling with those without considering hydrodynamic coupling (Figure 8). It can be seen that the diffraction forces (Figure 8a) and radiation forces (Figure 8b) acting on the semisubmersible have same trends for different wave periods when considering hydrodynamic coupling. There is a little increase of the diffraction force and radiation force acted on the semisubmersible considering hydrodynamic coupling. The largest difference for diffraction force and radiation force is approximately 3.8% and 3.6% larger than those without considering hydrodynamic coupling at wave period of 11 s. However, for WEC, the effects of the hydrodynamic coupling are significant on the diffraction forces (Figure 8c) and radiation forces (Figure 8d). And the diffraction force acted on the WEC considering hydrodynamic coupling is approximately 52.2% larger than that without considering hydrodynamic coupling at the wave period of 8 s and the radiation force is 55.4% larger than that without considering hydrodynamic coupling at the period of 11 s. Therefore, motion and dynamic responses of the WEC should be put more emphasis compared with the semisubmersible for the combined structure.
As hydrodynamic loads with considering hydrodynamic coupling are different from those without considering hydrodynamic coupling the relevant responses of the combined structure with wave height 2 m are presented and studied. The WEC surge motion (Figure 9a) and the relative heave motion (Figure 9b) considering hydrodynamic coupling are not always larger compared to those without considering hydrodynamic coupling. Additionally, the amplitudes of the relative heave motion (Figure 9b) and WEC pitch motion (Figure 9c) have similar trends, but WEC pitch motion considering hydrodynamic coupling is always larger than the case without considering hydrodynamic coupling. Figure 9d shows the wave period considering hydrodynamic coupling (approximately 9 s) is larger than that without considering hydrodynamic coupling (approximately 8 s). The largest produced power considering hydrodynamic coupling is smaller than that without considering hydrodynamic coupling. Same conclusions with PTO damping force (Figure 9e) are presented.

4.4. Dynamic Responses of the Combined Structure under Different Type Environmental Conditions

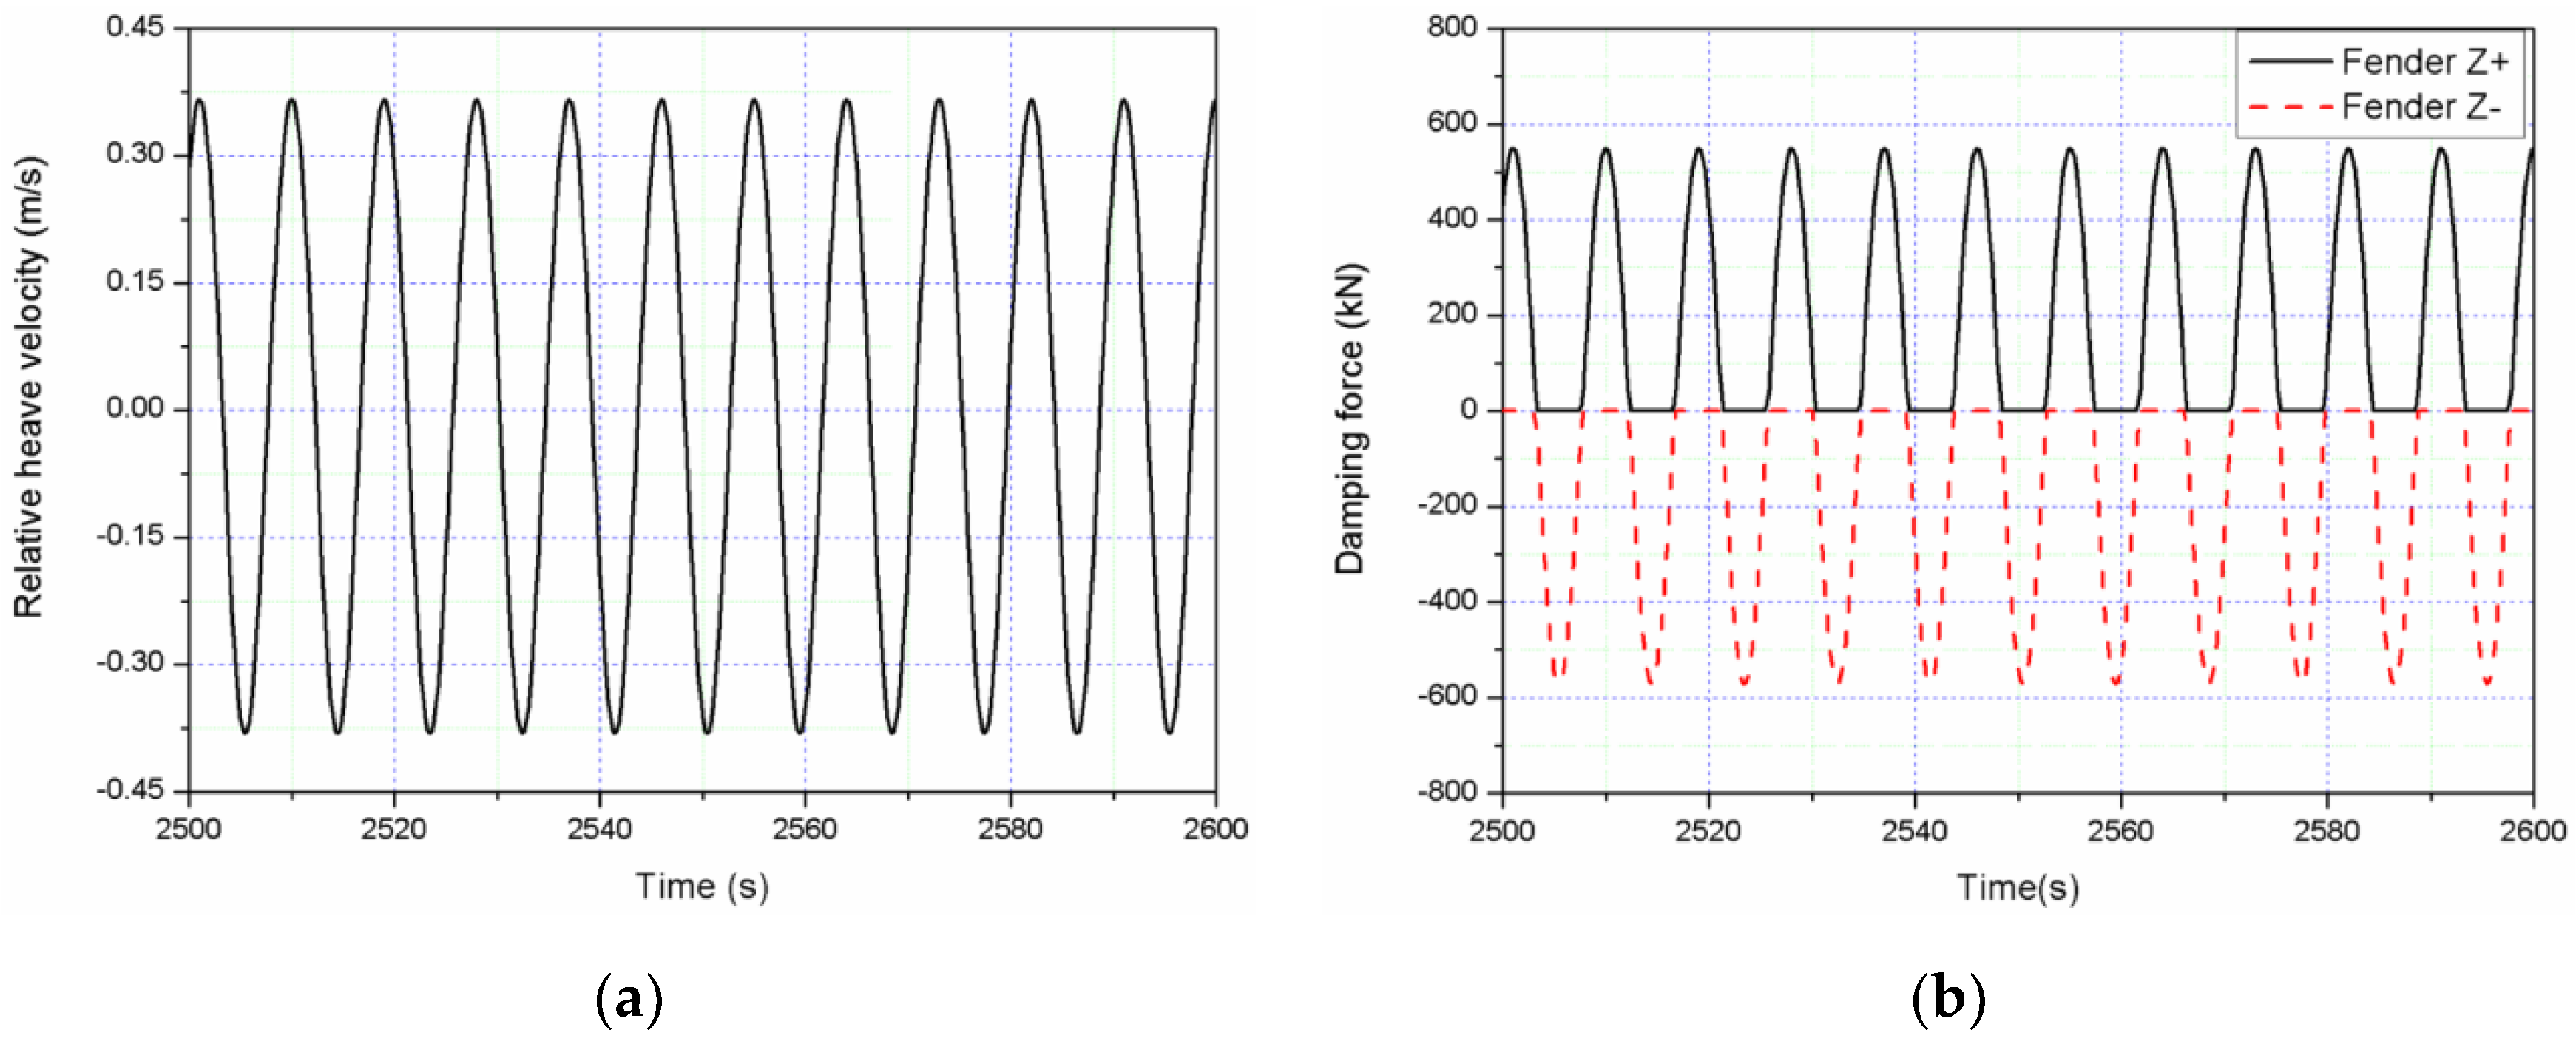
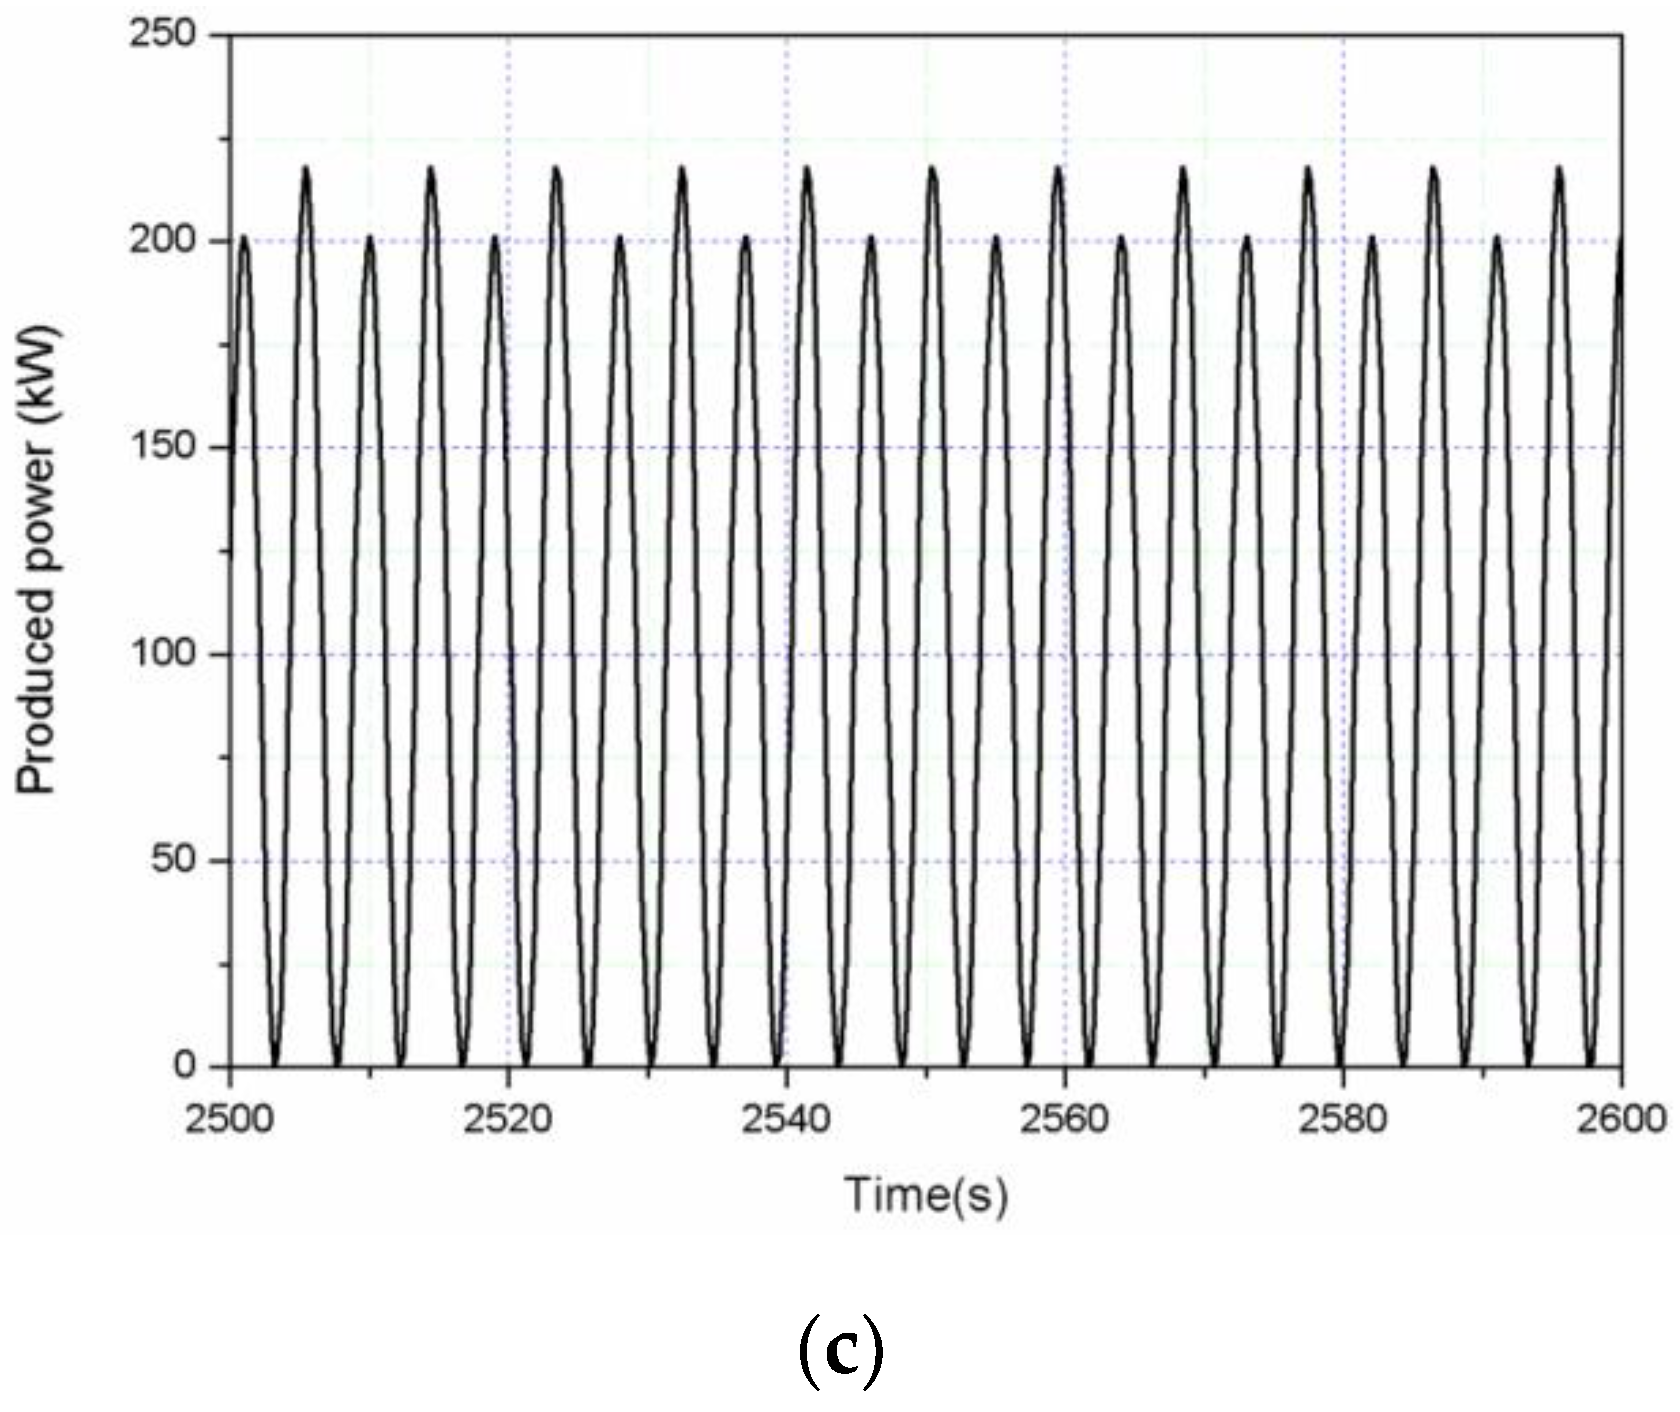
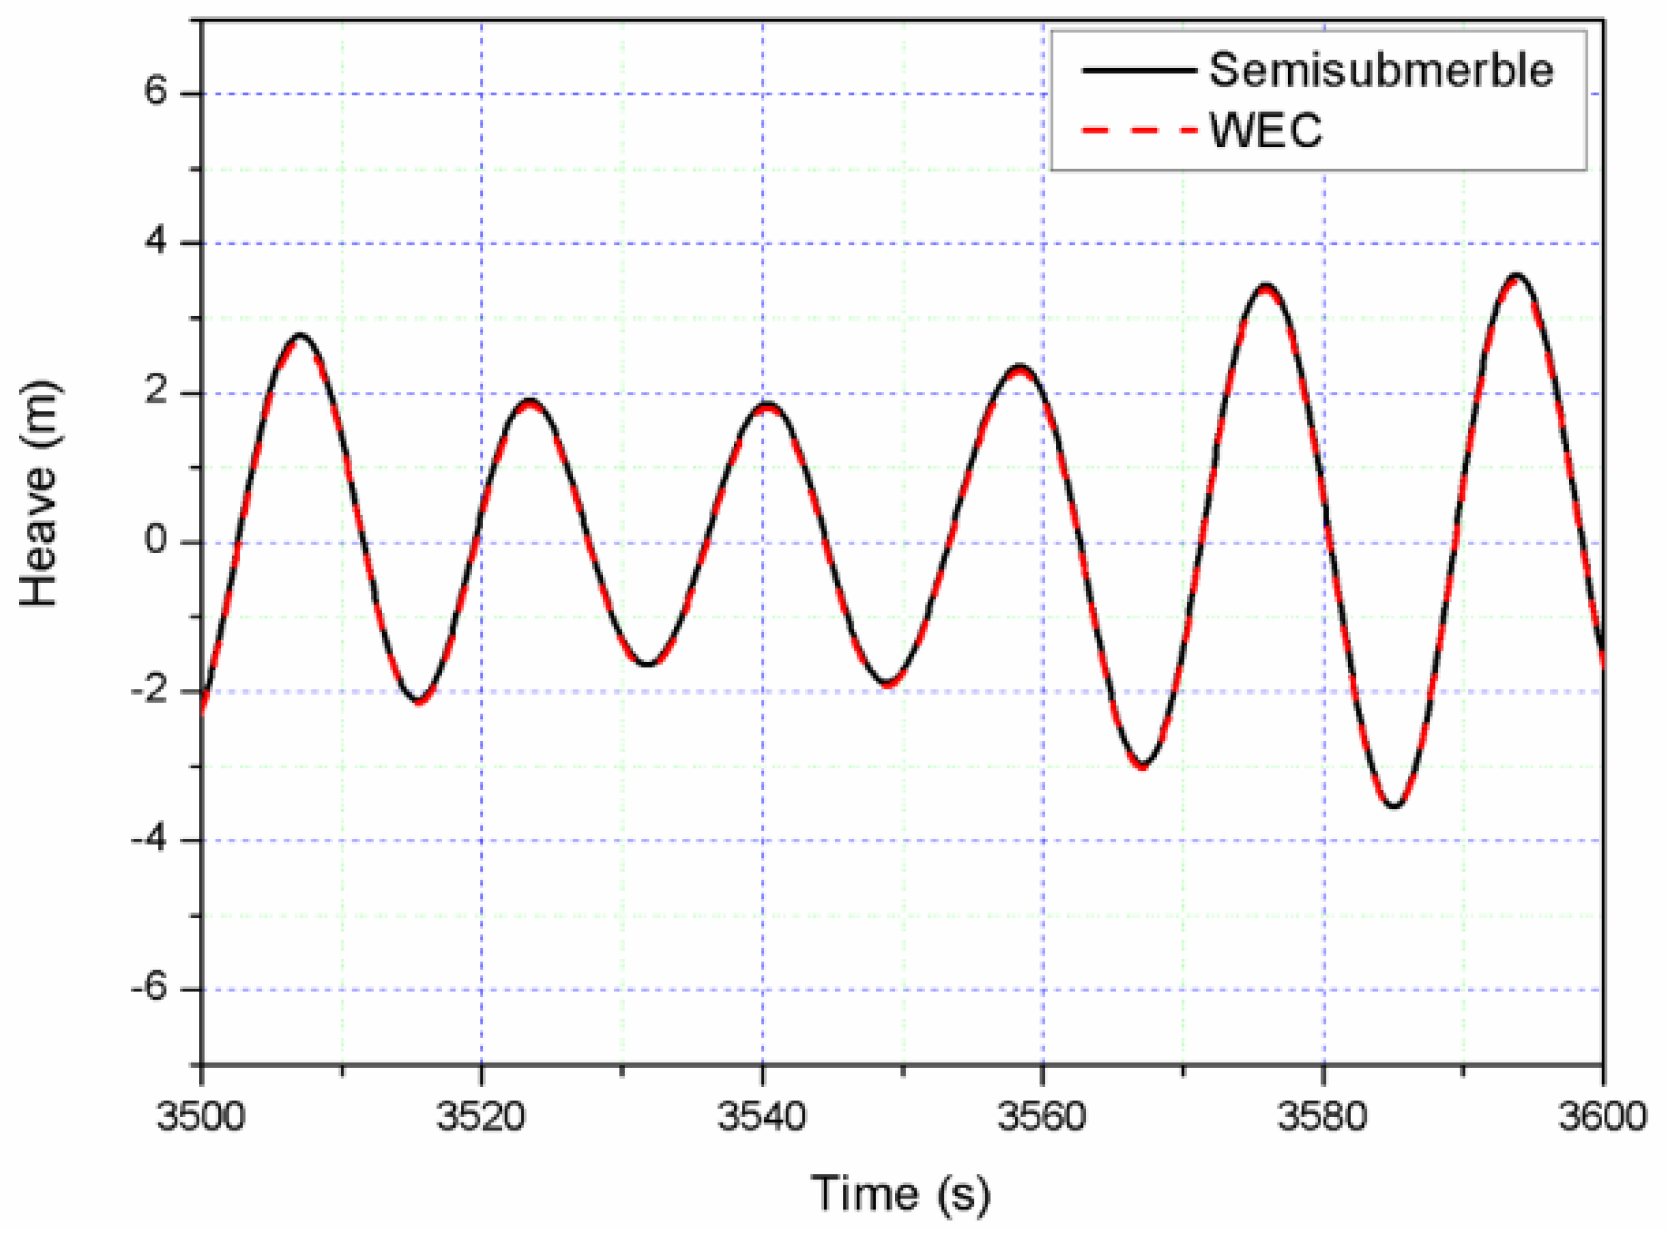
4.4.1. Regular Waves

Regular wave sea conditions with H = 2 m and T = 9 s are simulated in the time domain (Figure 10) without wind excitation loads [28]. In Figure 10a, the maximum relative heave velocity of the combined structure is smaller than 0.375 m/s while the minimum absolute value is larger than 0.375 m/s, which is an explanation why the peaks of produced power (Figure 10c) are not obtaining same values (Equation (23)). In Figure 10b, the PTO damping force induced by fenders in AQWA mode is presented. The phase of the forces is similar with relative heave, which means the damping forces are negative or positive when the WEC is up or down. Moreover, the capture width ratio, which is used to evaluate the WEC capability of absorbed wave power, is calculated by Equations (26) and (27) [29,30] as follows:
P ¯ w a v e = ρ g 2 32 π H 2 T
σ = P ¯ P T O P ¯ w a v e × 100 %
where P ¯ w a v e and P ¯ P T O are the average wave power per unit width and average PTO produced power, respectively, and σ denotes the capture width ratio.
To obtain the characteristics of the combined structure, the responses of the proposed combined structure are compared with similar work done by Wan et al. [9], Gao el al. [31] and Ren et al. [32] (Figure 11). Attention should be paid that in our work a semisubmersible platform is used while a spar platform was used in Wan and Gao’s work and a tension leg platform (TLP) was used Ren’s work. In Figure 11a,b, platform surge and WEC heave have similar tendency compared with Wan et al.’s work. The wave energy capture width ratio is compared with STC [9,31] and [32] in Figure 11d. The difference of the capture width ratio is caused by two reasons. The first one is the difference of PTO damping and stiffness coefficient, which result in the difference for the best wave period and produced power. The second reason is that the relative heave motions between the semisubmersible platform and WEC are much less than those between the spar and the TLP platforms and their WECs. This is caused by the heave motion difference of the spar, TLP and semisubmersible platforms. According to Equation (23), produced power of the combined structure will be smaller compared with those power produced by STC [9,31] and [32]. Special attention should be made that Wan’s results are based on the irregular wave case. It is stated that the comparisons are presented for having an idea about the well comparable response of the combined structure proposed in the present paper.
Figure 12 shows that the amplitudes of the responses, such as the relative heave, semisubmersible pitch, horizontal contact forces and PTO damping forces of the combined structure, almost linearly increase with the wave height, while the amplitudes of semisubmersible surge and PTO produced power have an approximately quadratic relationship with the wave height.

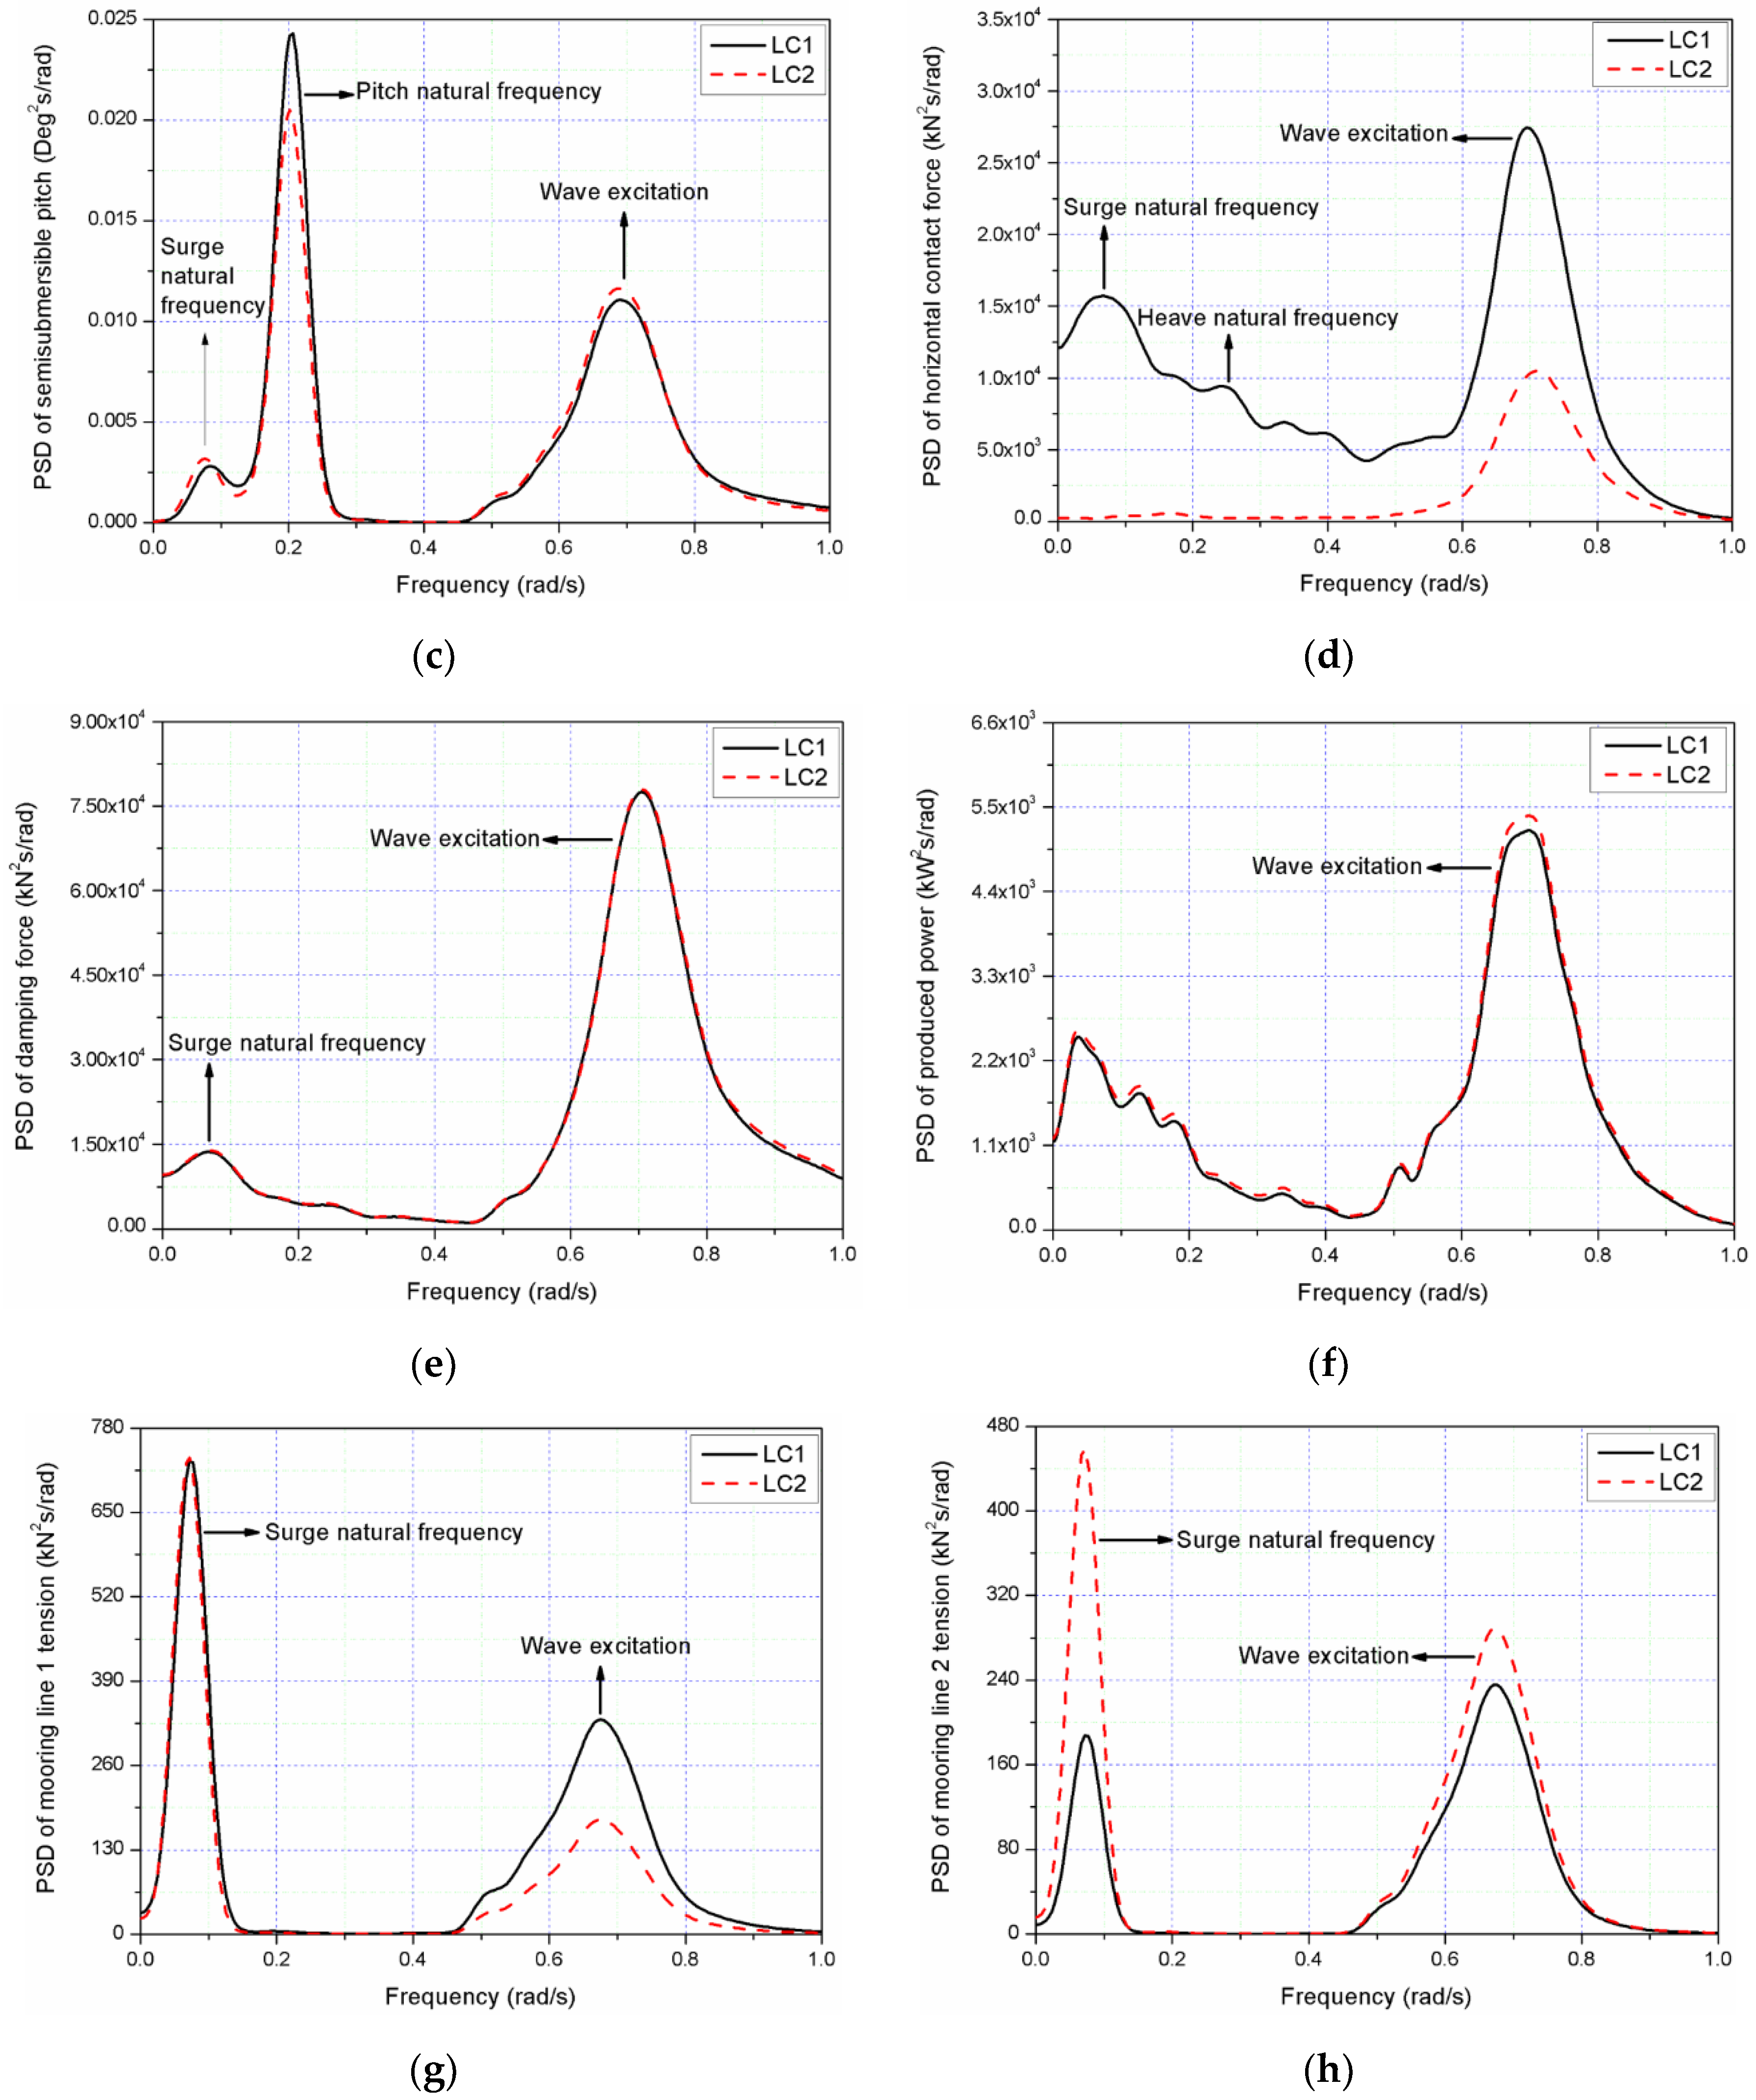
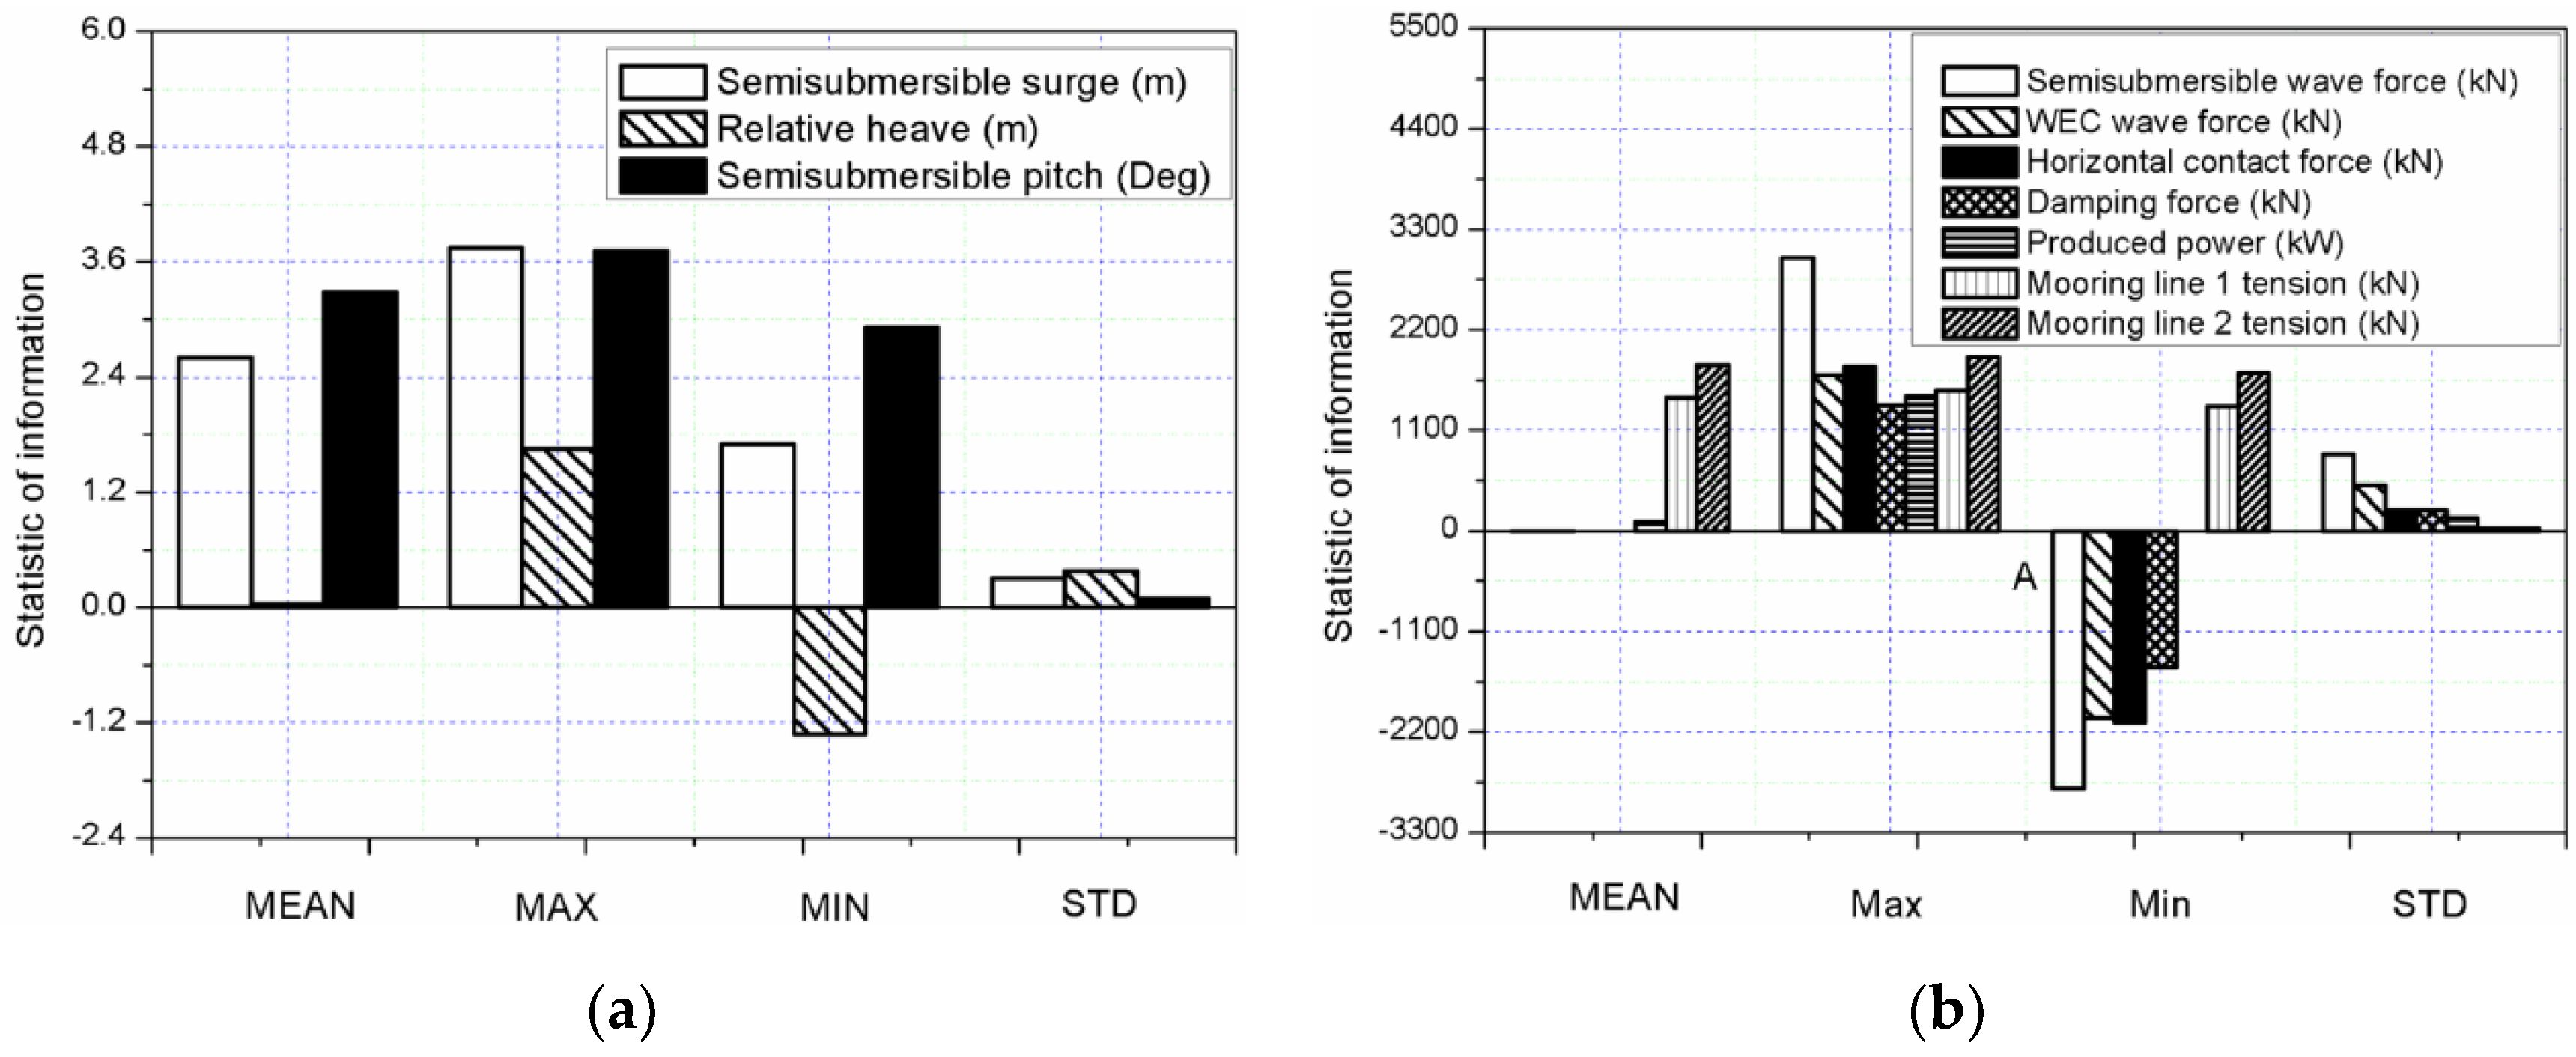
4.4.2. Irregular Wave and Wind Conditions

The sea conditions of certain sea areas in Guangdong Province, China whose location of the offshore wind farm is presented in Figure 13 have been selected, as shown in Table 2. In the paper, the aerodynamic loads from wind flow are simplified as a mean constant thrust load based on NREL 5 MW wind turbine thrust force-wind speed curve (Figure 14). The JONSWAP spectrum is used to simulate the irregular wave in this section. Comparisons of the time series and power spectral density (PSD) of motion and dynamic responses for LC1 (Hs = 2 m, Tp = 9 s) and LC2 (Hs = 2 m, Tp = 9 s and Uwind = 17 m/s) are presented in Figure 15 and Figure 16, respectively. Figure 15 shows that the semisubmersible surge and pitch motions have big differences due to wind loads. However, the values of the relative heave, PTO damping force and PTO produced power have slight differences.
The natural frequencies (surge, heave and pitch) of the semisubmersible could be identified through free decay tests (Table 3). In Figure 16, PSD of motion and dynamic responses of the combined structure under LC1 have same trends compared with those under LC2. In Figure 16a, a resonance is around 0.073 rad/s, which is contributed by surge natural frequency. At this frequency, the surge motion in LC2 is enlarged due to additional wind load compared with LC1, which can also be confirmed from Figure 15a. The second peak (around 0.7 rad/s) in Figure 16a presents the contribution from the wave frequency to the surge response. Figure 16c shows that the pitch motion response is dominant by pitch resonance frequency (0.218 rad/s). Resonances from surge natural frequency (0.073 rad/s) and wave frequency (0.7 rad/s) could also be identified from pitch motion response. For heave motion in Figure 16b, the wave frequency response is dominated in the range between 0.500 rad/s to 0.800 rad/s, in which WEC is designed to capture the energy from incident wave. For PTO damping force (Figure 16d), the surge natural frequency and wave natural frequency could be clearly identified from load responses.
The statistical values of the motion and dynamic responses of the combined structure under LC3 are shown in Figure 17. In Figure 17a, we can see that the maximum surge is less than 3.5 m and maximum pitch is less than 3.5 degrees. The maximum relative heave is larger than 1.25 m, while the absolute value of the minimum relative heave is smaller than 1.25 m, which may be caused by the lift effect induced by strong wave action [22]. Compared with LC1, it finds that large mean value of surge and pitch motion are caused by wind loads and positive surge and pitch moment presents in LC3. Figure 17b shows that the horizontal contact force between the semisubmersible and the WEC is larger than the wave force acting on the WEC due to the relative acceleration of the two bodies. The mooring line 1 tension force is larger than that of mooring line 2 because the drift of the combined structure in downwind direction due to the wind load. The mean PTO produced power is around 50 kW with maximum power around 1245 kW under LC3.
Moreover, in Figure 18, PSD of motion responses (surge, relative heave and pitch) and dynamic responses (horizontal contact force, PTO damping force, mooring line 1 tension and mooring line 2 tension) of the combined structure with considering hydrodynamic coupling have similar trend compared with those without considering hydrodynamic coupling. For surge motion (Figure 18a), the surge resonant motion is dominant at 0.073 rad/s, which is the surge natural frequency, followed by the wave frequency response in the range 0.400 rad/s to 0.800 rad/s. A large decrease of the response at the surge frequency exhibits if the hydrodynamic coupling is considered. Similar as LC1 and LC2 (Figure 16b), the most significant contribution to the relative heave motion comes from the wave frequency (Figure 18b). Considering hydrodynamic coupling will give a small increase in heave motion response near wave frequency, which is similar as in surge motion response. This enhancement of the surge and pitch responses near wave frequency can also be identified with wave period of 10 s in Figure 9a,b. For pitch motion (Figure 18c), the wave frequency response and pitch resonant response are very comparable, meanwhile, surge resonance response also visible in this motion. The pitch response considering hydrodynamic coupling at the surge natural frequency and wave frequency is larger than that without considering hydrodynamic coupling, opposite influence can be identified at pitch natural frequency. Figure 18d,e shows that the wave frequency responses are also dominant in the same range for horizontal contact force and damping force and the hydrodynamic coupling will contribute the increase of the response in the wave frequency range. For mooring line tension force (Figure 18g,h), PSD of mooring line 1 tension with surge resonance frequency occupy a dominant position compared with the value of mooring line 2 tension. Due to the hydrodynamic coupling effect, both responses of mooring line 1 and line 2 reduce at the surge.

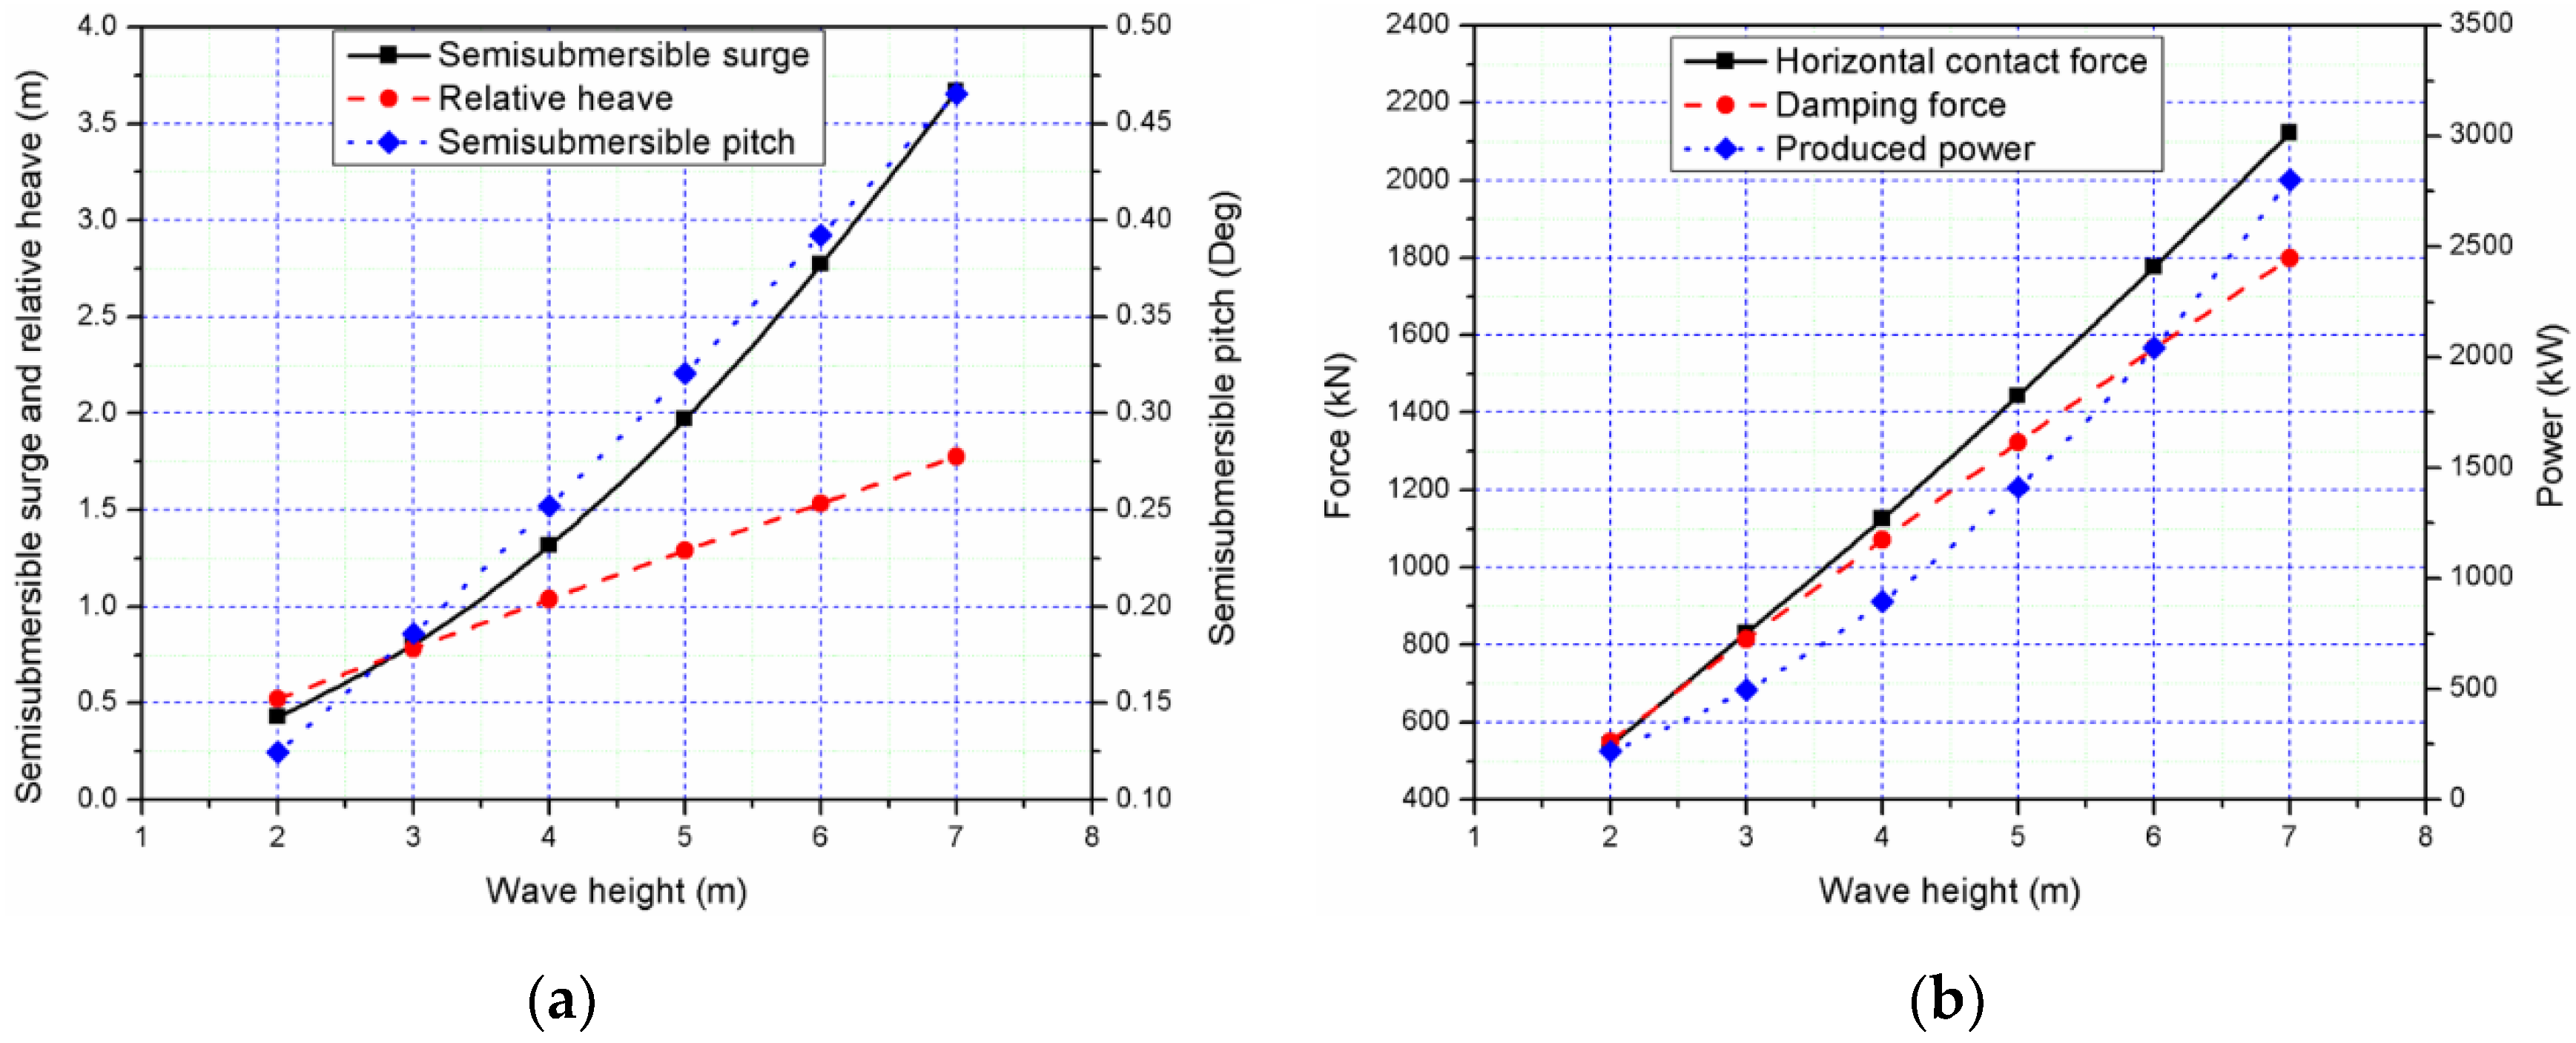
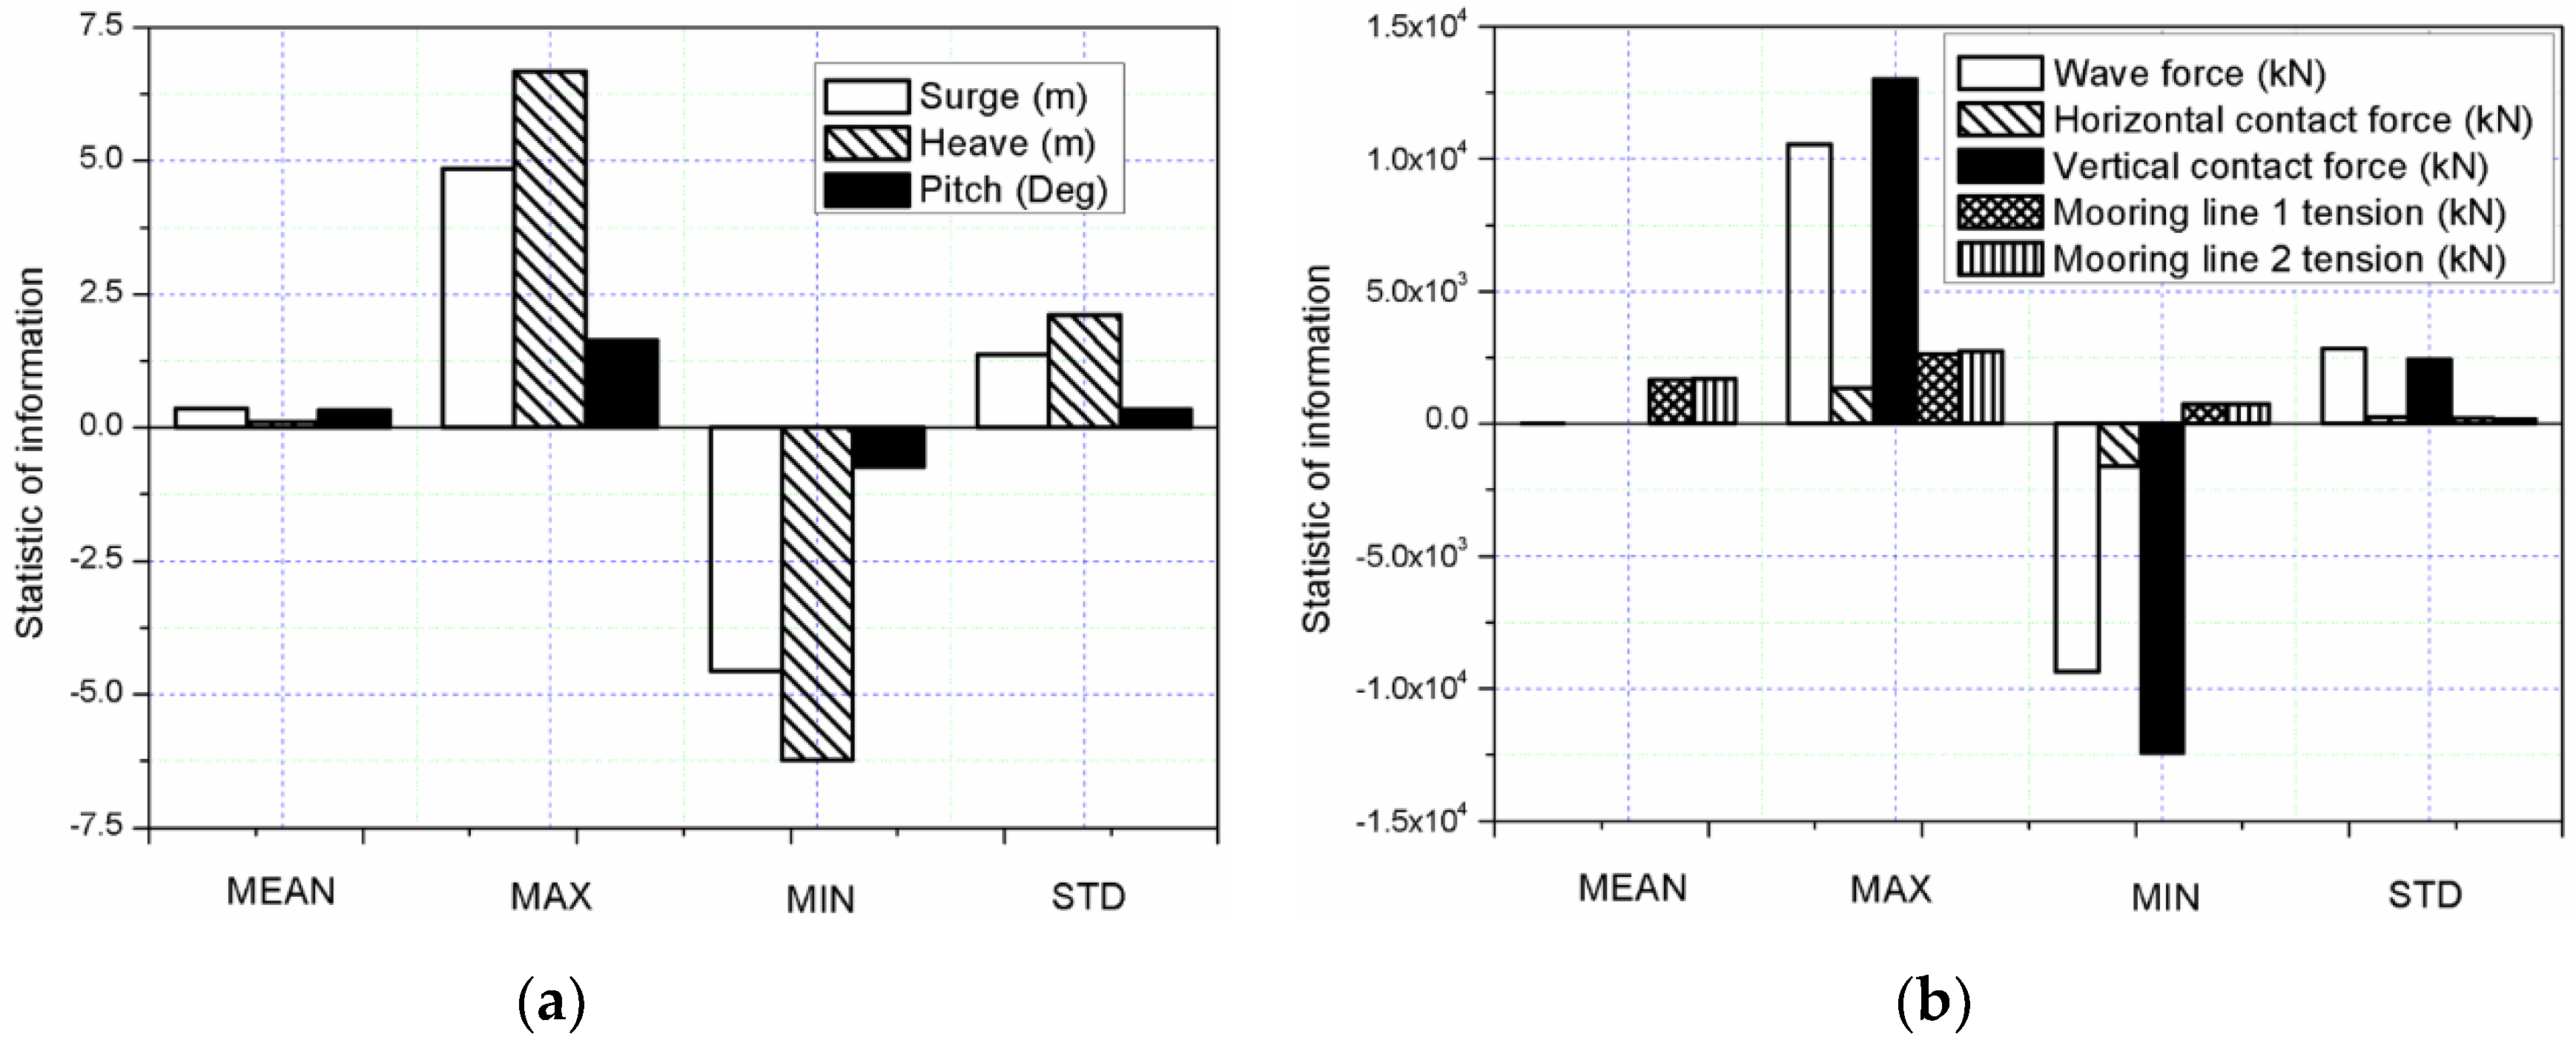
4.5. Dynamic Responses of the Combined Structure in Extreme Sea Conditions

For the LC4 with extreme sea conditions (wave height 8.6 m, wave period 15 s and wind speed of 31.2 m/s), the PTO system is released, the wind turbine is parked, and the WEC is locked mechanically to the semisubmersible at the mean sea level as a survival mode. In this case, the two bodies are locked and can move together, which can be confirmed from the relative heave motion between WEC and semisubmersible in Figure 19. The statistical value from LC4 (mean, maxi mum, minimum and STD) are presented in Figure 20. In this load case, maximum heave motion of the combined structure is approximate 6 m (Figure 20a), in which WEC may bear huge loads due to slamming forces. The mean surge and pitch responses of the combined structure in LC4 is much less than those responses in LC3 (Figure 17a). Particularly, the maximum and minimum pitch response is much less than those values in LC3 for operating conditions because the thrust load in LC4 is much smaller than the thrust load in LC3 (Figure 14). Figure 20b shows that the maximum wave force of the combined structure is smaller than the vertical contact force between the semisubmersible column and the WEC, while the horizontal contact force is far smaller than the wave force and vertical contact force, which proves the locked mode of the combined structure results to a reasonable response.
Figure 21 presents the PSD of the motion response and mooring line forces of the combined structure and pure semisubmersible platform under the extreme sea condition LC4. PSD of surge of the combined structure have same trends compared with pure semisubmersible platform and the response is dominant by the wave frequency (Figure 21a). For heave motion (Figure 21b), the response of pure semisubmersible is dominated by the wave frequency. However, for the combined structure, the response around the frequency of 0.35 rad/s is significantly larger because this frequency is the heave natural frequency of the combined structure and is near to the range of wave frequency. The shifting of the heave natural frequency of the combined structure from the pure semisubmersible (0.254 rad/s) is due to the attachment of the WEC to the semisubmersible. The surge resonant motion of the combined structure (Figure 21c) is dominant at 0.21 rad/s, which is the pitch natural frequency, followed by the wave frequency response. But the surge motion of the pure semisubmersible is dominated by the wave frequency response. Figure 21d,e shows that PSD of mooring line 1 tension and mooring line 2 tension of the combined structure are not always identical with only pure semisubmersible platform in high peak frequency region, which is caused by the coupling effect of heave resonance and incident wave for the combined structure. The most significant contribution to the mooring line 1 tension for both the combined structure and the semisubmersible platform comes from the wave frequency range. A clear peak response from the heave natural frequency for the combined structure could be identified for mooring line 1 tension. For mooring line 2 (Figure 21e), the most significant contribution to the mooring line tension for the pure semisubmersible comes from the wave frequency range from 0.300 rad/s to 0.600 rad/s, while the low-frequency response does not contribute significantly to the total response. However, for the combined structure, the heave resonance response at approximately 0.35 rad/s dominates the total response for mooring line 2.

5. Conclusions

In this paper, a combined marine renewable energy structure consisting of a 5-MW braceless floating wind turbine and a heave-type wave energy converter (WEC) is presented. A numerical model of the combined structure that is capable of simulating its motion and dynamic responses under different sea states was developed and used. Different types of analysis have been performed for examining the hydrodynamic response of the combined structure. The main results are summarized as follows:
The outer diameter of the WEC is selected to be 16 m, in term of its economy, safety and PTO produced power. In order to avoid the slamming phenomena of the WEC as far as possible motion response, the draft of the WEC with 3.5 m is selected.
The K P T O parameter has a significant impact on the performance of the WEC when its value is over 1000 N/m. A preliminary best value of the B P T O parameter for the PTO of the combined structure is selected to be 1500 kNs/m with the perspective of PTO produced power.
The trends of hydrodynamic loads of the WEC with considering hydrodynamic coupling will change compared to those without considering hydrodynamic coupling, but responses of the combined structure have the same trends. The viscosity of the heave of the WEC will have an influence on the PTO produced power and dynamic responses of the combined structure.
Under regular waves, the amplitudes of the responses, such as the relative heave, semisubmersible pitch, horizontal contact force and PTO damping force of the combined structure, have an almost linear relationship with the wave height, while the amplitudes of WEC surge and PTO produced power have an almost quadratic relationship.
Under irregular waves, the surge and pitch of the semisubmersible with considering constant thrust wind have great effects compared to those without considering constant thrust wind, but there are slight effects for relative heave, damping force and produced power of the combined structure. Moreover, the maximum relative heave of the combined structure is larger than the absolute value of the minimum relative heave, and the wave forces acting on the WEC can be transferred to the semisubmersible by means of their contacted fenders. The PSD of motion responses and dynamic responses of the combined structure with considering hydrodynamic coupling have similar trends compared with those without considering hydrodynamic coupling.
Under the extreme sea conditions, the WEC was mechanically locked to the semisubmersible platform to withstand the large impact force on WEC as a survival mode. Heave natural frequency shifting could be identified and may coincide with wave frequency. The resonance in heave motion and mooring line 2 tension could be identified near the heave natural frequency. Other survival models should be proposed and investigated in future work. Experiments and validation for this integrated structure will also be carried out in the future.

Author Contributions

Conceptualization, W.S., L.Z., C.M. and L.W.; methodology, W.S., C.M. and L.W.; investigation, Y.W., L.Z., W.S. and C.M.; writing—first draft preparation, Y.W., L.Z., W.S. and C.M.; review and editing, W.S., C.M. and L.W.; supervision, W.S. and C.M.; project administration, W.S.; funding acquisition, W.S. All authors have read and agreed to the published version of the manuscript.

Funding

This research was funded by the National Natural Science Foundation of China (Grant No. 51709039). This work is also supported by the international collaboration and exchange program from the NSFC-RCUK/EPSRC with grant No. 51761135011. This work is also partially supported by LiaoNing Revitalization Talents Program (XLYC1807208), State Key Laboratory of Hydraulic Engineering Simulation and Safety, Tianjin University and the Fundamental Research Funds for the Central University (DUT19GJ209).

Acknowledgments

The authors would like to thank the Nianxin Ren from Hainan University for his valuable discussion of simulation in AQWA software.

Conflicts of Interest

The authors declare no conflict of interest.

References

  1. European Wind Energy Association. Offshore Wind in Europe Key Trends and Statistics 2019; Wind Europe: Brussels, Belgium, 2020. [Google Scholar]
  2. Cai, S.K. Grid parity speeds up the development of offshore wind power industry—the practitioner mission of offshore wind power in the next five years. South Energy Constr. 2019, 2, 7–15. [Google Scholar]
  3. Marina Platform. Available online: https://www.msp-platform.eu/projects/marina-platform (accessed on 3 April 2020).
  4. Peiffer, A.; Roddier, D.; Aubault, A. Design of a point absorber inside the WindFloat structure. In Proceedings of the 30th International Conference on Ocean, Offshore and Arctic Engineering (OMAE), Rotterdam, The Netherlands, 19–24 June 2011. [Google Scholar]
  5. Aubault, A.; Alves, M.; Sarmento, A.; Roddier, D.; Peiffer, A. Modeling of an oscillating water column on the floating foundation WindFloat. In Proceedings of the 30th International Conference on Ocean, Offshore and Arctic Engineering (OMAE), Rotterdam, The Netherlands, 19–24 June 2011. [Google Scholar]
  6. Muliawan, M.J.; Karimirad, M.; Moan, T. Dynamic response and power performance of a combined spar-type floating wind turbine and coaxial floating wave energy converter. Renew. Energy 2013, 50, 47–57. [Google Scholar] [CrossRef]
  7. Muliawan, M.J.; Karimirad, M.; Gao, Z.; Moan, T. Extreme responses of a combined spar-type floating wind turbine and floating wave energy converter (STC) system with survival modes. Ocean Eng. 2013, 65, 71–82. [Google Scholar] [CrossRef]
  8. Wan, L.; Gao, Z.; Moan, T. Experimental and numerical study of hydrodynamic responses on a combined wind and wave concept in survival modes. Coast. Eng. 2015, 104, 151–169. [Google Scholar] [CrossRef] [Green Version]
  9. Wan, L.; Gao, Z.; Moan, T.; Lugni, C. Experimental and numerical comparisons of a combined wind and wave energy converter concept under operational conditions. Renew. Energy 2016, 93, 87–100. [Google Scholar] [CrossRef]
  10. Wan, L.; Gao, Z.; Moan, T.; Lugni, C. Comparative experimental study of the survivability of a combined wind and wave energy converter in two testing facilities. Ocean Eng. 2016, 111, 82–94. [Google Scholar] [CrossRef] [Green Version]
  11. Michailides, C.; Gao, Z.; Moan, T. Experimental study of the functionality of a semisubmersible wind turbine combined with flap-type Wave Energy Converters. Renew. Energy 2016, 93, 675–690. [Google Scholar] [CrossRef]
  12. Michailides, C.; Gao, Z.; Moan, T. Experimental and numerical study of the response of the offshore combined wind/wave energy concept SFC in extreme environmental conditions. Mar. Struct. 2016, 50, 35–54. [Google Scholar] [CrossRef]
  13. Michailides, C.; Luan, C.Y.; Gao, Z.; Moan, T. Effect of flap type wave energy converters on the response of a semi-submersible wind turbine in operational conditions. In Proceedings of the ASME 2014 33rd International Conference on Ocean, Offshore and Arctic Engineering (OMAE), San Francisco, CA, USA, 8–13 June 2014. [Google Scholar]
  14. Ren, N.X.; Ma, Z.; Fan, T.H.; Zhai, G.J.; Ou, J.P. Experimental and numerical study of hydrodynamic responses of a new combined monopile wind turbine and a heave-type wave energy converter under typical operational conditions. Ocean Eng. 2018, 159, 1–8. [Google Scholar] [CrossRef]
  15. Luan, C.; Gao, Z.; Moan, T. Design and analysis of a braceless steel 5-MW semi-submersible wind turbine. In Proceedings of the ASME 2016 35st International Conference on Ocean, Offshore and Arctic Engineering (OMAE 2016), Busan, Korea, 19–24 June 2016. [Google Scholar]
  16. Yang, S.H.; Wang, Y.Q.; He, H.Z.; Zhang, J.; Chen, H. Dynamic properties and energy conversion efficiency of a floating multi-body wave energy converter. China Ocean Eng. 2018, 32, 347–357. [Google Scholar] [CrossRef]
  17. Wavebob. Available online: http://www.wavebob.com (accessed on 3 April 2020).
  18. ANSYS, A.W., Inc. AQWA Manual Release 15.0; ANSYS A.W., Inc.: Canonsburg, PA, USA, 2013. [Google Scholar]
  19. Li, Y.C.; Teng, B. The Effect of Waves on Marine Buildings, 3rd ed.; Ocean Publication: Beijing, China, 2015; pp. 270–273. [Google Scholar]
  20. Van Rijn, L.C. Principles of Fluid Flow and Surface Waves in Rivers, Estuaries, Seas and Oceans, 3rd ed.; Aqua Publications: Amsterdam, The Netherlands, 1990. [Google Scholar]
  21. Morison, J.R.; Johnson, J.W.; Schaaf, S.A. The force exerted by surface waves on piles. J. Pet. Technol. 1950, 2, 149–154. [Google Scholar] [CrossRef]
  22. Gao, W.; Dong, L.; Huang, J. ANSYS AQWA Software Introduction and Improvement, 1st ed.; China Water Resources and Hydropower Press: Beijing, China, 2018. [Google Scholar]
  23. Cao, H.; Tang, Y.G.; Tao, H.C.; Qin, Y. Design and frequency domain analysis of semi-submersible floating foundation for offshore wind turbine. Ocean Eng. 2013, 31, 61–67. [Google Scholar]
  24. Bai, J.; Li, Y.; Qu, Z.S.; Tang, Y.G. Optimization design of heave suppression structure for new cylindrical FPSO. Ocean Eng. 2020, 38, 20–29. [Google Scholar]
  25. Wang, Y.P.; Shi, W.; Zhang, L.X.; Michailides, C.; Zhou, L. Hydrodynamic analysis of a floating hybrid renewable energy system. In Proceedings of the 30th International Society of Offshore and Polar Engineers, Shanghai, China, 14–19 June 2020. [Google Scholar]
  26. Fang, M.C.; Kim, C.H. Hydrodynamically coupled motions of two ships advancing in oblique waves. J. Ship Res. 1986, 30, 159–171. [Google Scholar]
  27. Oortmerssen, G.V. Hydrodynamic interaction between two structures, floating in waves. In Proceedings of the 2nd International Conference on Behaviour of Offshore Structures, BOSS’79, London, UK, 28–31 August 1979. [Google Scholar]
  28. Zhao, Z.X.; Li, X.; Wang, W.H.; Shi, W. Analysis of dynamic characteristics of an ultra-large semi-submersible floating wind turbine. Mar. Sci. Eng. 2019, 7, 169. [Google Scholar] [CrossRef] [Green Version]
  29. Tom, N.M. Design and Control of a Floating Wave-Energy Converter Utilizing a Permanent Magnet linear Generator. Ph.D. Thesis, UC Berkeley, Berkeley, CA, USA, 2013. [Google Scholar]
  30. Falnes, J. A review of wave-energy extraction. Mar. Struct. 2007, 20, 185–201. [Google Scholar] [CrossRef]
  31. Gao, Z.; Moan, T.; Wan, L.; Michailides, C. Comparative numerical and experimental study of two combined wind and wave energy concepts. J. Ocean Eng. Sci. 2016, 1, 36–51. [Google Scholar] [CrossRef] [Green Version]
  32. Ren, N.X.; Zhu, Y.; Ma, Z.; Wu, H.B. Comparative study of hydrodynamic responses of two combined wind turbine and wave energy converter systems under typical operational sea cases. In Proceedings of the 37th International Conference on Ocean, Offshore and Arctic Engineering (OMAE), Madrid, Spain, 17–22 June 2018. [Google Scholar]
Figure 1. Conceptual sketch of the combined structure.
Jmse 08 00253 g001
Figure 2. Connection detail between the column of semisubmersible and the wave energy converter (WEC).
Jmse 08 00253 g002
Figure 3. θ values for different outer diameters of the WEC.
Jmse 08 00253 g003
Figure 4. Effects of the daft on the WEC: (a) semisubmersible surge; (b) semisubmersible pitch.
Jmse 08 00253 g004
Figure 5. Performance of the WEC with different wave periods.
Jmse 08 00253 g005
Figure 6. Mutual effect of different KPTO and BPTO values on the WEC performance.
Jmse 08 00253 g006
Figure 7. Comparison of responses of the WEC with and without viscous effects: (a) relative heave; (b) radiation force; (c) damping force; (d) produced power.
Jmse 08 00253 g007
Figure 8. Comparison of diffraction forces and radiation forces of the combined structure between considering and without considering hydrodynamic coupling: (a) diffraction forces for semisubmersible; (b) radiation forces for semisubmersible; (c) diffraction forces for WEC; (d) radiation forces for WEC.
Jmse 08 00253 g008
Figure 9. Comparison of responses of the combined structure between considering and without considering hydrodynamic coupling cases under different wave periods (H = 2 m): (a) WEC surge; (b) relative heave; (c) WEC pitch; (d) produced power; (e) damping force.
Jmse 08 00253 g009
Figure 10. Time series of different responses of the combined structure under regular waves H = 2 m and T = 9 s: (a) relative heave velocity; (b) damping force; (c) produced power.
Jmse 08 00253 g010aJmse 08 00253 g010b
Figure 11. Responses of the combined structure under different wave periods with H = 2 m: (a) platform surge; (b) WEC heave; (c) power take-off (PTO) force; (d) capture with ratio.
Jmse 08 00253 g011
Figure 12. Responses of the combined structure under different wave heights T = 9 s: (a) semisubmersible surge, relative heave and semisubmersible pitch; (b) horizontal contact force, damping force and produced power.
Jmse 08 00253 g012
Figure 13. Location of the reference offshore site.
Jmse 08 00253 g013
Figure 14. Rotor thrust curves at different wind speeds.
Jmse 08 00253 g014
Figure 15. Comparisons of the time series of the responses for LC1 and LC2 of: (a) semisubmersible surge; (b) relative heave; (c) semisubmersible pitch; (d) damping force; (e) produced power.
Jmse 08 00253 g015aJmse 08 00253 g015b
Figure 16. Comparisons of the PSD of the motion and dynamic responses for LC1 and LC2: (a) semisubmersible surge; (b) relative heave; (c) semisubmersible pitch; (d) horizontal contact force; (e) damping force; (f) produced power; (g) mooring line 1 tension; (h) mooring line 2 tension.
Jmse 08 00253 g016aJmse 08 00253 g016b
Figure 17. Statistical values of the responses for LC3: (a) statistic of information for semisubmersible surge, relative heave and pitch; (b) statistic of information for semisubmersible wave force, WEC wave force, horizontal contact force, damping force, produced power, mooring line 1 tension and mooring line 2 tension.
Jmse 08 00253 g017
Figure 18. Power spectral density (PSD) of motion and dynamic responses for LC3: (a) semisubmersible surge; (b) relative heave; (c) semisubmersible pitch; (d) horizontal contact force; (e) damping force; (f) produced power; (g) mooring line 1 tension; (h) mooring line 2 tension.
Jmse 08 00253 g018
Figure 19. Relative heave of the combined structure under the locked mode.
Jmse 08 00253 g019
Figure 20. Statistical values of the responses for the extreme sea state LC4: (a) statistic of information for semisubmersible surge, heave and pitch; (b) statistic of information for wave force of the combined structure, horizontal contact force, vertical contact force, mooring line 1 tension and mooring line 2 tension.
Jmse 08 00253 g020
Figure 21. PSD of motion responses for the extreme sea state LC4: (a) surge; (b) heave; (c) pitch; (d) mooring line 1 tension; (e) mooring line 2 tension.
Jmse 08 00253 g021aJmse 08 00253 g021b
Table 1. Main design parameters of the combined structure.
ParametersValues
Wind turbine (NREL 5 MW)Rotor-Nacelle-Assembly350 t
Hub height90 m
Tower mass347.46 t
semisubmersible platformSemisubmersible mass9738 t
Diameter of the central column6.5 m
Diameter of the three side columns6.5 m
Operating draft30 m
Water displacement10,298 m3
Water depth200 m
WEC deviceOuter/Inner diameter16 m/8 m
Height/Draft8 m/3.5 m
Mass463.5 t
Water displacement452.2 m3
Center of mass(0, 0, −1 m)
Table 2. Sea states of the reference sea areas in Guangdong Province, China.
Sea StatesWave TypeWave Height Hs (m)Wave Period Tp (s)Wind Speed Uwind (m/s)
LC 1Irregular2.090
LC 2Irregular2.0917
LC 3Irregular3.01024
LC 4Irregular8.61531.2
Table 3. Natural frequencies (rad/s) of the semisubmersible.
SurgeHeavePitch
0.075450.25430.2108

