A Methodological Approach to Determine Sound Response Modalities to Coastal Erosion Processes in Mediterranean Andalusia (Spain)


Abstract
1. Introduction
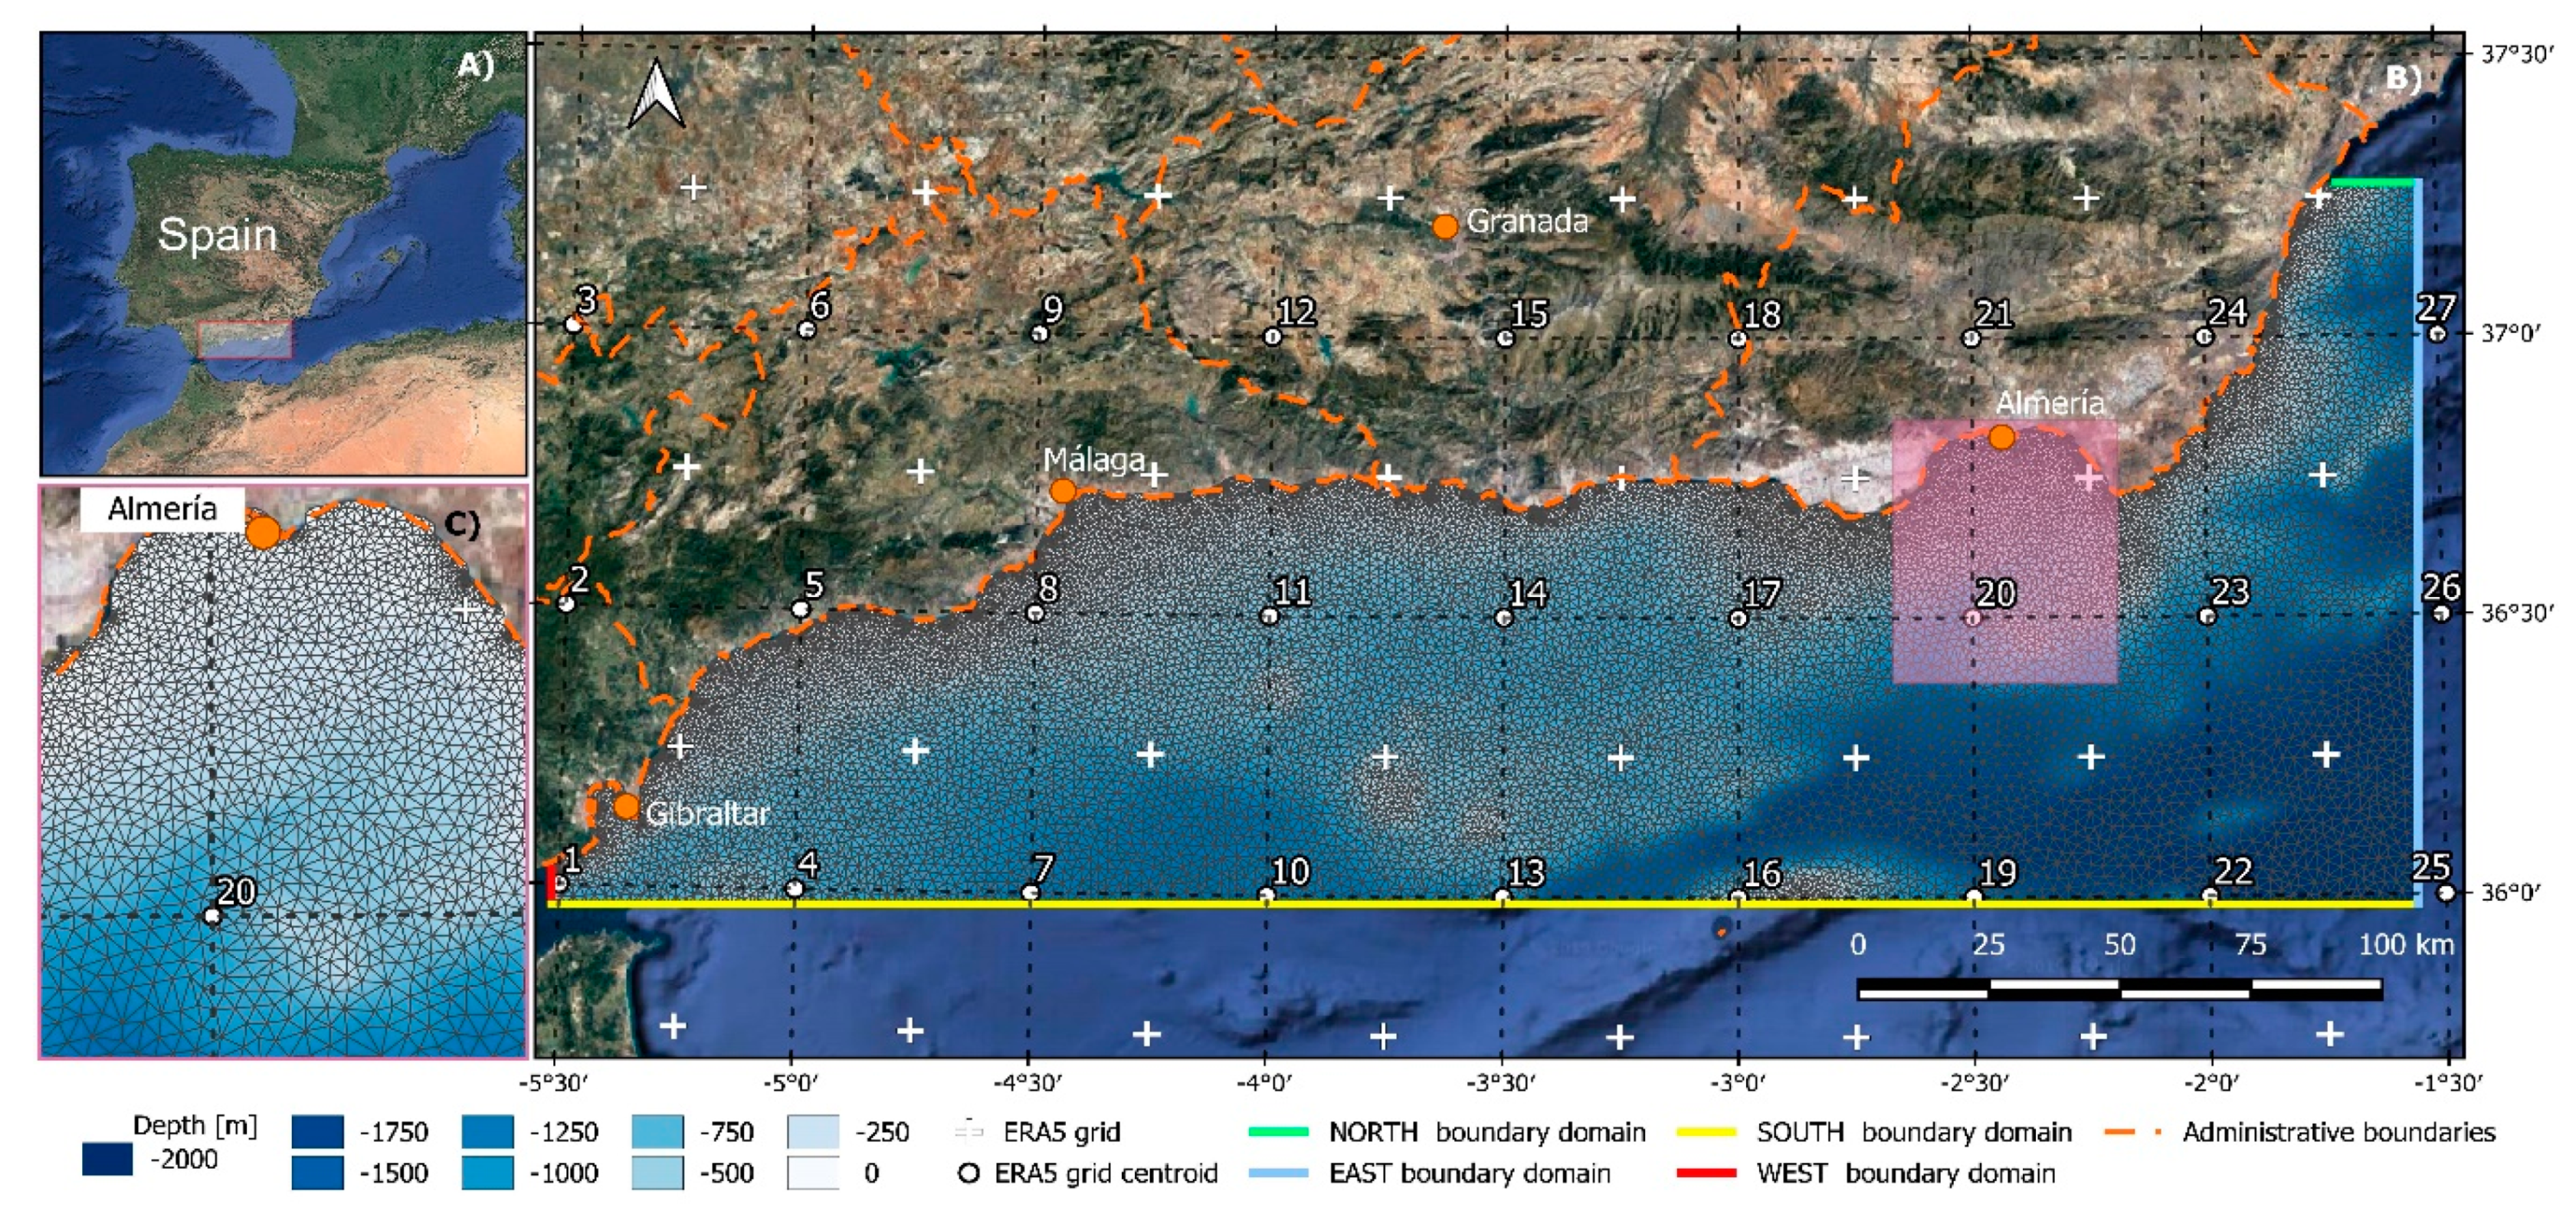
2. Study Area
3. Methodology
3.1. Coastal Forcing
3.2. Buffer Zone Assessment
3.3. Coastal Sensitivity
3.4. Land Use
3.5. Mitigation Strategies to Coastal Erosion
4. Results
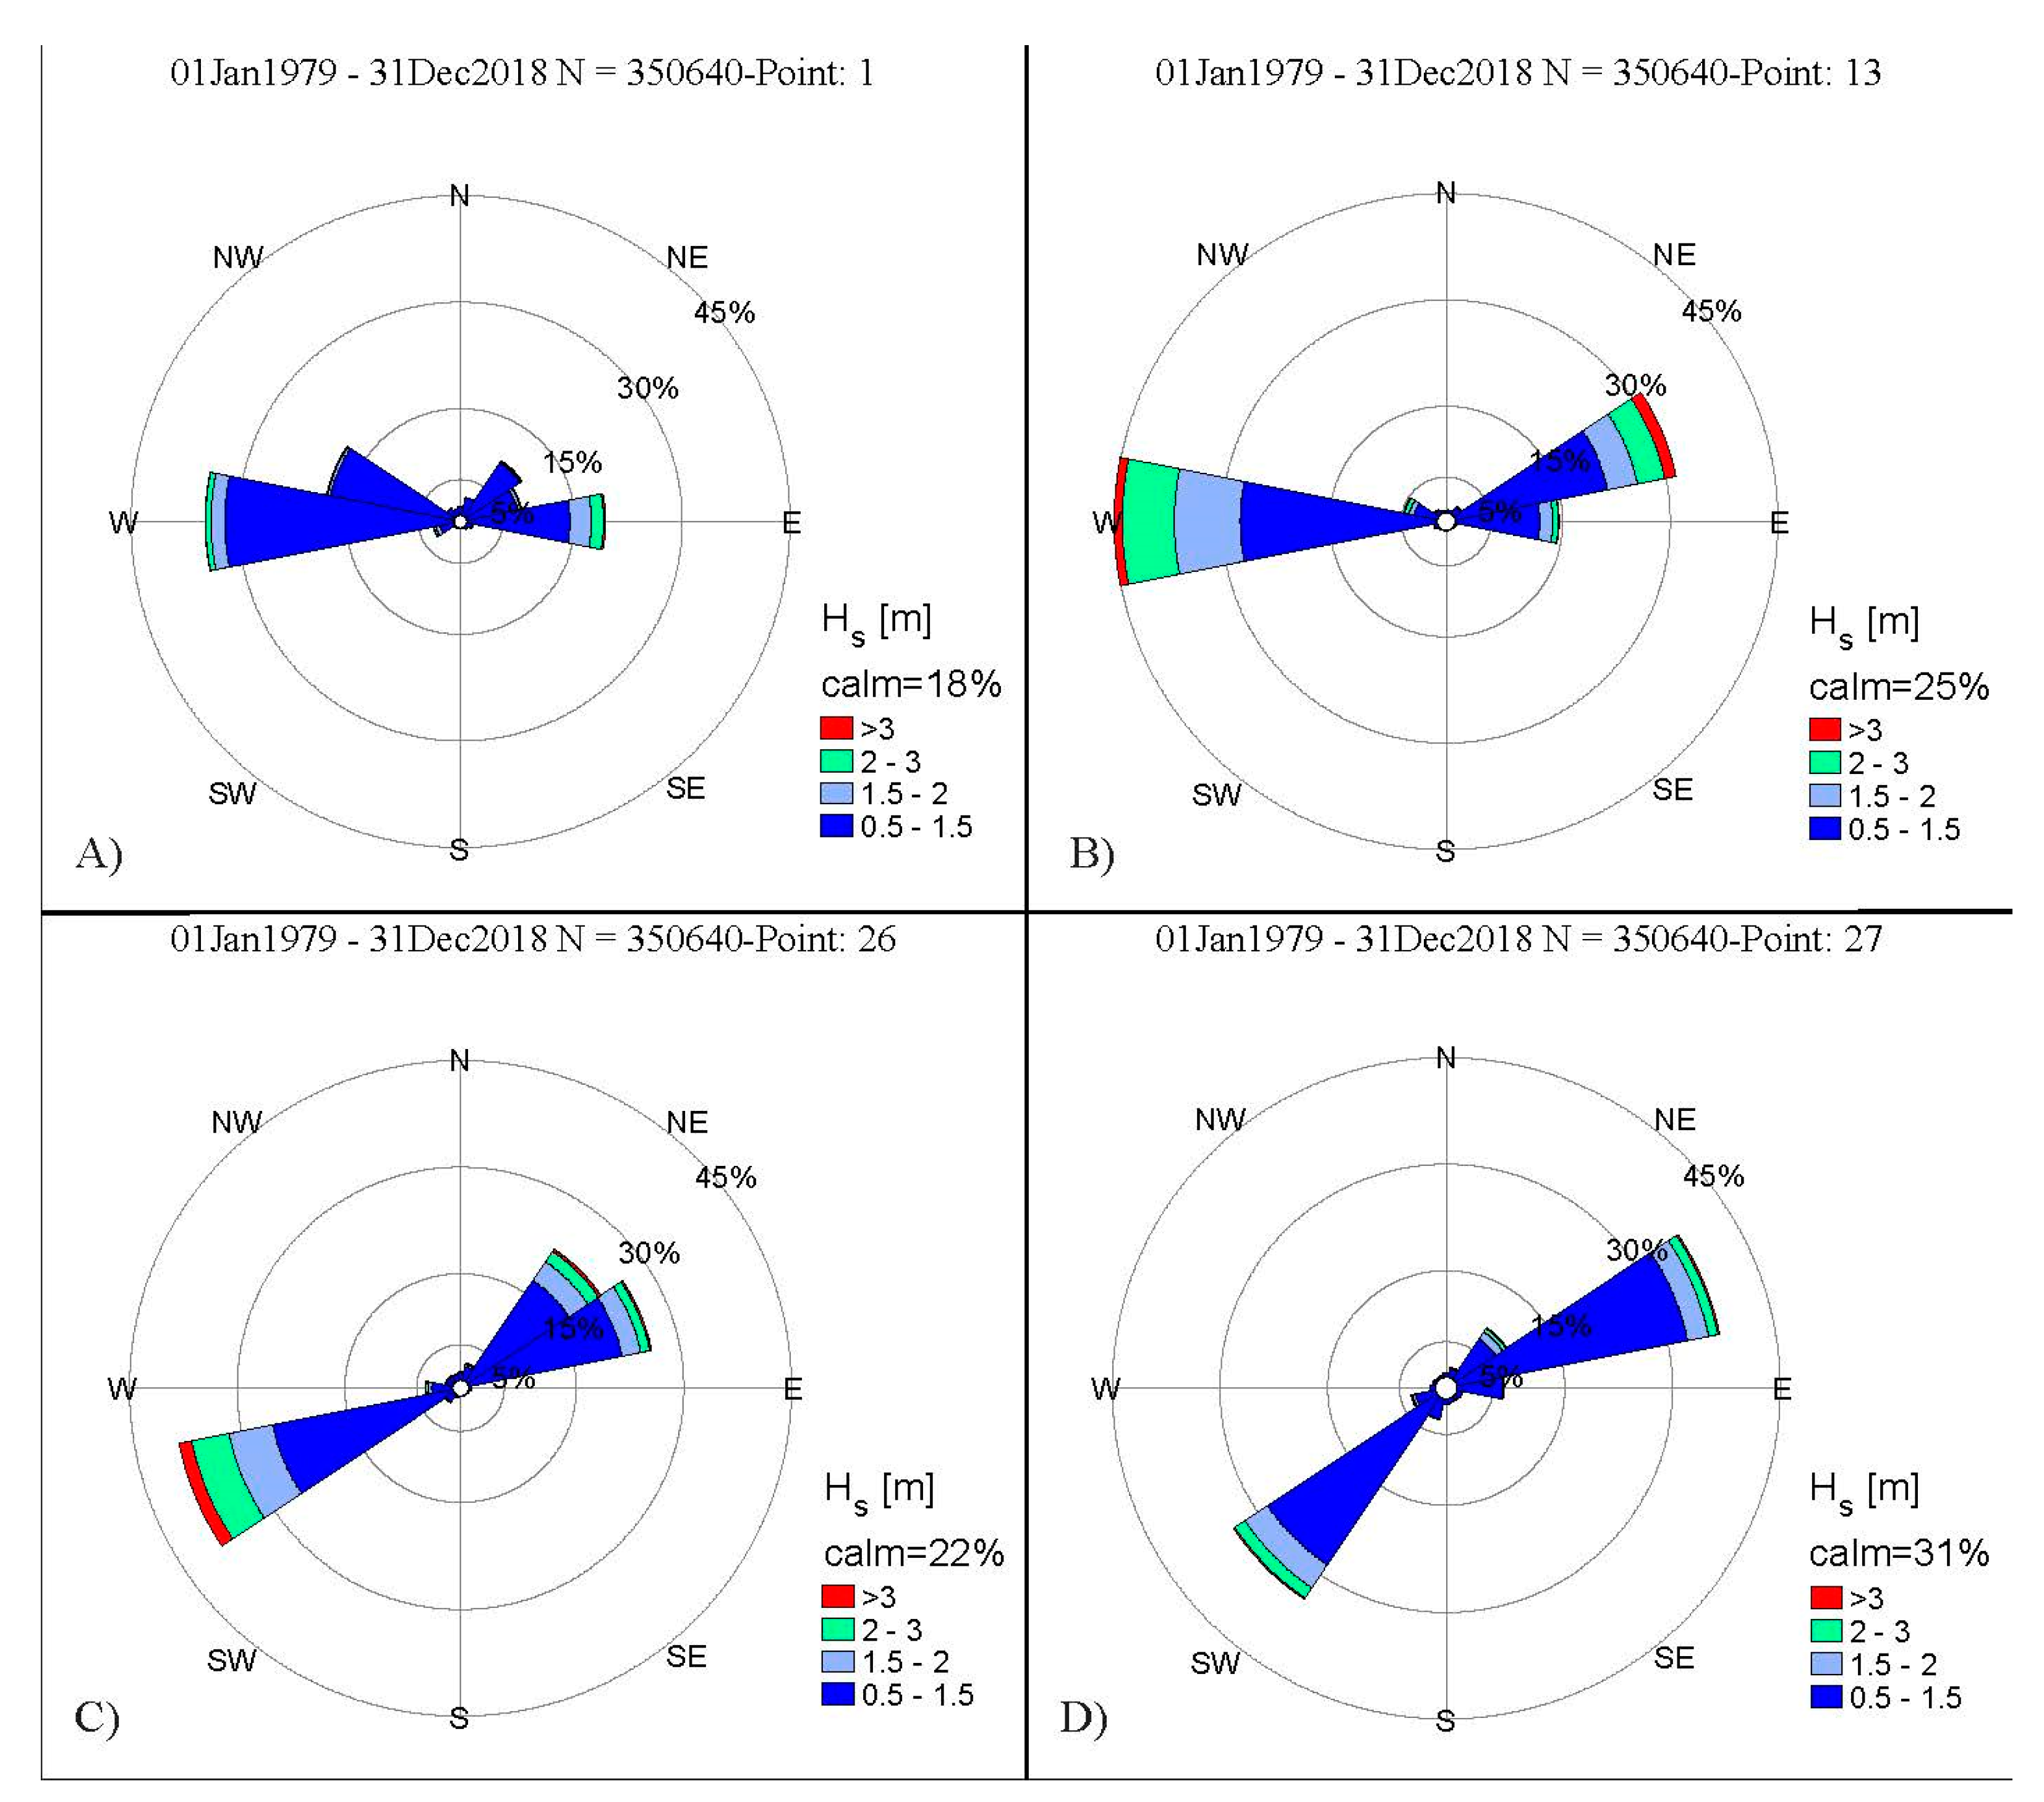
4.1. Wave Forcing
4.2. Buffer Zone
4.3. Coastal Sensivity
4.4. Mitigation or Response Strategies
5. Discussion
5.1. Wave Forcing
5.2. Buffer Zone Characteristics
5.3. Land Use
5.4. Mitigation or Response Strategies
Author Contributions
Funding
Acknowledgments
Conflicts of Interest
References
- Komar, P.D. Beach Processes and Sedimentation; Prentice Hall: New Jersey, NJ, USA, 1998. [Google Scholar]
- Dolan, R.; Davis, R.E. An intensity scale for Atlantic coast northeast storms. J. Coast. Res. 1992, 8, 840–853. [Google Scholar]
- Masselink, G.; Pattiaratchi, C.B. Seasonal changes in beach morphology along the sheltered coastline of Perth, Western Australia. Mar. Geol. 2001, 172, 243–263. [Google Scholar] [CrossRef]
- Donnelly, J.P.; Bryant, S.S.; Butler, J.; Dowling, J.; Fan, L.; Hausmann, N.; Westover, K.; Webb, T. 700 yr sedimentary record of intense hurricane landfalls in southern New England. GSA Bull. 2001, 113, 714–727. [Google Scholar] [CrossRef]
- Anfuso, G.; Gracia, F.J. Morphodynamic characteristics and short-term evolution of a coastal sector in SW Spain: Implications for coastal erosion management. J. Coast. Res. 2005, 21, 1139–1153. [Google Scholar] [CrossRef]
- Komar, P.D.; Allan, J.C. Increasing hurricane-generated wave heights along the US east coast and their climate controls. J. Coast. Res. 2008, 24, 479–488. [Google Scholar] [CrossRef]
- Carter, R.W.G. Coastal Environments; Academic Press: San Diego, CA, USA, 1988; p. 617. [Google Scholar]
- Rangel-Buitrago, N.; Anfuso, G. Winter wave climate, storms and regional cycles: The SW Spanish Atlantic coast. Int. J. Climatol. 2013, 33, 2142–2156. [Google Scholar] [CrossRef]
- Rangel-Buitrago, N.; Anfuso, G. Risk Assessment of Storms in Coastal Zones: Case Studies from Cartagena (Colombia) and Cadiz (Spain); Springer: Dordrecht, The Netherlands, 2015; p. 63. [Google Scholar]
- Manno, G.; Anfuso, G.; Messina, E.; Williams, A.T.; Suffo, M.; Liguori, V. Decadal evolution of coastline armouring along the Mediterranean Andalusia littoral (South of Spain). Ocean Coast. Manag. 2016, 124, 84–99. [Google Scholar] [CrossRef]
- Rizzo, A.; Aucelli, P.P.C.; Gracia, F.J.; Anfuso, G. A novelty coastal susceptibility assessment method: Application to Valdelagrana area (SW Spain). J. Coast. Conserv. 2018, 22, 973–987. [Google Scholar] [CrossRef]
- Cooper, J.A.G.; Jackson, D.W.T.; Navas, F.; McKenna, J.; Malvárez, G. Identifying storm impacts on an embayed, high-energy coastline: Examples from western Ireland. Mar. Geol. 2004, 210, 261–280. [Google Scholar] [CrossRef]
- Scheffers, A.; Scheffers, S.; Kelletat, D. Paleo-tsunami relics on the southern and central Antillean island arc. J. Coast. Res. 2005, 21, 263–273. [Google Scholar] [CrossRef]
- Sánchez-García, M.J.; Rodríguez-Santalla, I.; Montoya-Montes, I. Short term coastal dune evolution of Fangar Spit (Ebro Delta, Spain). In Proceedings of the International Conference on Management and Restoration of Coastal Dunes, Santander, Spain, 3–5 October 2007. [Google Scholar]
- Pranzini, E. Airborne LIDAR survey applied to the analysis of the historical evolution of the Arno River delta (Italy). J. Coast. Res. 2007, 50, 400–409. [Google Scholar]
- Pranzini, E.; Cinelli, I.; Cipriani, L.E.; Anfuso, G. An integrated coastal sediment management plan: The example of the Tuscany Region (Italy). J. Mar. Sci. Eng. 2020, 8, 33. [Google Scholar] [CrossRef]
- Orford, J.D.; Forbes, D.L.; Jennings, S.C. Organisational controls, typologies and time scales of paraglacial gravel-dominated coastal systems. Geomorphology 2002, 48, 51–85. [Google Scholar] [CrossRef]
- Shand, R.D.; Bailey, D.G.; Shepherd, M.J. Longshore realignment of shore-parallel sand-bars at Wanganui, New Zealand. Mar. Geol. 2001, 179, 147–161. [Google Scholar] [CrossRef]
- Short, A.D. Beach and Shoreface Morphodynamics; Wiley: Hoboken, NJ, USA, 1999; p. 379. [Google Scholar]
- Coelho, C.; Silva, R.; Veloso-Gomes, F.; Taveira Pinto, F. A vulnerability analysis approach for the Portuguese west coast. In Risk Analysis V: Simulation and Hazard Mitigation; Popov, V., Brebbia, C.A., Eds.; WIT Press: Southampton, UK, 2006; pp. 251–262. [Google Scholar]
- Anfuso, G.; Martínez Del Pozo, J.Á. Assessment of coastal vulnerability through the use of GIS tools in South Sicily (Italy). Environ. Manag. 2009, 43, 533–545. [Google Scholar] [CrossRef][Green Version]
- McLaughlin, S.; McKenna, J.; Cooper, J.A.G. Socio-economic data in coastal vulnerability indices: Constraints and opportunities. J. Coast. Res. 2002, 36, 487–498. [Google Scholar] [CrossRef]
- Cooper, J.A.G.; McKenna, J. Working with natural processes: The challenge for coastal protection strategies. Geogr. J. 2008, 174, 315–331. [Google Scholar] [CrossRef]
- Almeida, L.P.; Ferreira, Ó.; Vousdoukas, M.I.; Dodet, G. Historical variation and trends in storminess along the Portuguese South Coast. Nat. Hazard. Earth Syst. 2011, 11, 2407–2417. [Google Scholar] [CrossRef]
- Mattei, G.; Rizzo, A.; Anfuso, G.; Aucelli, P.P.C.; Gracia, F.J. A tool for evaluating the archaeological heritage vulnerability to coastal processes: The case study of Naples Gulf (southern Italy). Ocean Coast. Manag. 2019, 179, 1–13. [Google Scholar] [CrossRef]
- Gornitz, V. Vulnerability of the East Coast, USA to future sea level rise. J. Coast. Res. 1990, 9, 201–237. [Google Scholar]
- Gornitz, V.M.; Beaty, T.W.; Daniels, R.C. A Coastal Hazards Data Base for the US West Coast; Environmental Sciences Division Publication No. 4590, Report ORNL/CDIAC-81, NDP-043C; National Technical Information Service: Oak Ridge, TN, USA, 1997.
- Cooper, J.A.G.; McLaughlin, S. Contemporary multidisciplinary approaches to coastal classification and environmental risk analysis. J. Coast. Res. 1998, 14, 512–524. [Google Scholar]
- Committee on Climate Change. Meeting Carbon Budgets—2016 Progress Report to Parliament; Committee on Climate Change: London, UK, 2016. [Google Scholar]
- Dodds, R.; Kelman, I. How climate change is considered in sustainable tourism policies: A case of the Mediterranean islands of Malta and Mallorca. Tour. Rev. Int. 2008, 12, 57–70. [Google Scholar] [CrossRef]
- Pranzini, E.; Wetzel, L.; Williams, A.T. Aspects of coastal erosion and protection in Europe. J. Coast. Conserv. 2015, 19, 445–459. [Google Scholar] [CrossRef]
- Williams, A.T.; Rangel-Buitrago, N.; Pranzini, E.; Anfuso, G. The management of coastal erosion. Ocean Coast. Manag. 2018, 156, 4–20. [Google Scholar] [CrossRef]
- Guisado, E.; Malvárez, G.C.; Navas, F. Morphodynamic environments of the Costa del Sol, Spain. J. Coast. Res. 2013, 65, 500–506. [Google Scholar] [CrossRef]
- Prieto, A.; Ojeda, J.; Rodríguez, S.; Gracia, J.; Del Río, L. Procesos erosivos (tasas de erosión) en los deltas mediterráneos andaluces: Herramientas de análisis espacial (DSAS) y evolución temporal (servicios OGC). In Tecnologías de la Información Geográfica en el Contexto del Cambio Global, Proceedings of the XV Congreso Nacional de Tecnologías de la Información Geográfica, Madrid, Spain, 19–21 September 2012; Martínez Vega, J., Martín Isabel, P., Eds.; CSIC—Instituto de Economía, Geografía y Demografía: Madrid, Spain, 2012; pp. 185–193. [Google Scholar]
- Félix, A.; Baquerizo, A.; Santiago, J.M.; Losada, M.A. Coastal zone management with stochastic multi-criteria analysis. J. Environ. Manag. 2012, 112, 252–266. [Google Scholar] [CrossRef]
- Molina, R.; Anfuso, G.; Manno, G.; Gracia, F.J. The Mediterranean Coast of Andalusia (Spain): Medium-Term Evolution and Impacts of Coastal Structures. Sustainability 2019, 11, 3539. [Google Scholar] [CrossRef]
- Bello Smith, A.; Cerasuolo, G.; Perales, J.A.; Anfuso, G. Environmental sensitivity maps: The northern coast of Gibraltar Strait example. J. Coast. Res. 2011, 64, 875–879. [Google Scholar]
- Williams, A.T.; Micallef, A.; Anfuso, G.; Gallego-Fernandez, J.B. Andalusia, Spain: An Assessment of Coastal Scenery. Lands. Res. 2012, 37, 327–349. [Google Scholar] [CrossRef]
- Mooser, A.; Anfuso, G.; Mestanza, C.; Williams, A.T. Management implications for the most attractive scenic sites along the Andalusia coast (SW Spain). Sustainability 2018, 10, 1328. [Google Scholar] [CrossRef]
- Molina, R.; Manno, G.; Lo Re, C.; Anfuso, G.; Ciraolo, G. Storm Energy Flux Characterization along the Mediterranean Coast of Andalusia (Spain). Water 2019, 11, 509. [Google Scholar] [CrossRef]
- Pita López, M.F. El clima de Andalucía. In Geografía de Andalucía; Ariel Geografia: Barcellona, Spain, 2003; pp. 137–173. [Google Scholar]
- DGPC. Dirección General de Puertos y Costas. Actuaciones en la Costa 1988–1990; MOPV: Madrid, Spain, 1991; p. 307. [Google Scholar]
- Criado-Aldeanueva, F.; Del Río Vera, J.; García-Lafuente, J. Steric and mass-induced Mediterranean sea level trends from 14 years of altimetry data. Glob. Planet. Chang. 2008, 60, 563–575. [Google Scholar] [CrossRef]
- Tsimplis, M.; Spada, G.; Marcos, M.; Flemming, N. Multi-decadal sea level trends and land movements in the Mediterranean Sea with estimates of factors perturbing tide gauge data and cumulative uncertainties. Glob. Planet. Chang. 2011, 76, 63–76. [Google Scholar] [CrossRef]
- Puertos del Estado. REDMAR—RED de MAReógrafos de Puertos del Estado. Resumen de parámetros relacionados con el nivel del mar y la marea que afectan a las condiciones de diseño y explotación portuaria; Puertos del Estado: Madrid, Spain, 2017; p. 33. [Google Scholar]
- Dee, D.P.; Uppala, S.M.; Simmons, A.J.; Berrisford, P.; Poli, P.; Kobayashi, S.; Bechtold, P. The ERA-Interim reanalysis: Configuration and performance of the data assimilation system. Q. J. R. Meteorol. Soc. 2011, 137, 553–597. [Google Scholar] [CrossRef]
- Boccotti, P. Wave mechanics for ocean engineering; Elsevier: Amsterdam, The Netherlands, 2000; Volume 64. [Google Scholar]
- Komen, G.J.; Cavaleri, L.; Donelan, M.; Hasselmann, K.; Hasselmann, S.; Janssen, P.A.E.M. Dynamics and Modelling of Ocean Waves; Cambridge University Press: Cambridge, UK, 1996; p. 554. ISBN 0521577810. [Google Scholar]
- WAMDI Group. The WAM model—A third generation ocean wave prediction model. J. Phys. Oceanogr. 1988, 18, 1775–1810. [Google Scholar] [CrossRef]
- Weatherall, P.; Marks, K.M.; Jakobsson, M.; Schmitt, T.; Tani, S.; Arndt, J.E.; Wigley, R. A new digital bathymetric model of the world’s oceans. Earth Space Sci. 2015, 2, 331–345. [Google Scholar] [CrossRef]
- Lo Re, C.; Manno, G.; Ciraolo, G.; Besio, G. Wave Energy Assessment around the Aegadian Islands (Sicily). Energies 2019, 12, 333. [Google Scholar]
- Jenks, G.F.; Caspall, F.C. Error on choropletic maps: Definition, measurement, reduction. Ann. Assoc. Am. Geogr. 1971, 61, 217–244. [Google Scholar] [CrossRef]
- Crowell, M.; Leikin, H.; Buckley, M.K. Evaluation of Coastal Erosion Hazards Study: An Overview. J. Coast. Res. 1999, 28, 2–9. [Google Scholar]
- Crowell, M.; Buckley, M.K. Calculating erosion rates: Using long-term data to increase data confidence. In Coastal Engineering Considerations in Coastal Zone Management, Proceedings of the Coastal Zone ’93, the Eighth Symposium on Coastal and Ocean Management, New Orleans, LA, USA, 19–23 July 1993; Hughes, S.A., Ed.; ASCE: New York, NY, USA, 1993; pp. 117–129. [Google Scholar]
- Leatherman, S.P.; Douglas, B.C.; Crowell, M. Beach erosion trends and shoreline forecasting. J. Coast. Res. 1997, 13, 3–4. [Google Scholar]
- Smith, G.L.; Zarillo, G.A. Calculating long-term shoreline recession rates using aerial photographic and beach profiling techniques. J. Coast. Res. 1990, 6, 111–120. [Google Scholar]
- Pajak, M.J.; Leatherman, S. The high water line as shoreline indicator. J. Coast. Res. 2002, 18, 329–337. [Google Scholar]
- Boak, E.H.; Turner, I.L. Shoreline definition and detection: A review. J. Coast. Res. 2005, 21, 688–703. [Google Scholar] [CrossRef]
- Moore, L.J. Shoreline mapping techniques. J. Coast. Res. 2000, 16, 111–124. [Google Scholar]
- Thieler, E.R.; Himmelstoss, E.A.; Zichichi, J.L.; Ergul, A. The Digital Shoreline Analysis System (DSAS) Version 4.0-an ArcGIS Extension for Calculating Shoreline Change (No. 2008-1278); US Geological Survey: Reston, VA, USA, 2009. [Google Scholar]
- Anfuso, G.; Bowman, D.; Danese, C.; Pranzini, E. Transect based analysis versus area based analysis to quantify shoreline displacement: Spatial resolution issues. Environ. Monit. Assess. 2016, 188, 568. [Google Scholar] [CrossRef]
- Gracia, F.J.; Alonso, C.; Benavente, J.; Anfuso, G.; Del Río, L. The Different Coastal Records of the 1755 Tsunami Waves along the south Atlantic Spanish Coast (with 9 figures). Z. Geomorph. Suppl. BD 2006, 146, 195–220. [Google Scholar]
- McLaughlin, S.; Cooper, J.A.G. A multi-scale coastal vulnerability index: A tool for coastal managers? Environ. Hazards 2010, 9, 233–248. [Google Scholar] [CrossRef]
- Stockdon, H.F.; Holman, R.A.; Howd, P.A.; Sallenger, A.H., Jr. Empirical parameterization of setup, swash, and runup. Coast. Eng. 2006, 53, 573–588. [Google Scholar] [CrossRef]
- Pye, K.; Blott, S.J. Decadal-scale variation in dune erosion and accretion rates: An investigation of the significance of changing storm tide frequency and magnitude on the Sefton coast, UK. Geomorphology 2008, 102, 652–666. [Google Scholar] [CrossRef]
- Di Risio, M.; Bruschi, A.; Lisi, I.; Pesarino, V.; Pasquali, D. Comparative analysis of coastal flooding vulnerability and hazard assessment at national scale. J. Mar. Sci. Eng. 2017, 5, 51. [Google Scholar] [CrossRef]
- Pascuali, D.; Bruno, M.F.; Celli, D.; Damiani, L.; Di Risio, M. A simplified hindcast method for the estimation of extreme storm surge events in semi-enclosed basins. Appl. Ocean Res. 2019, 85, 45–52. [Google Scholar] [CrossRef]
- García-Mora, M.R.; Gallego-Fernández, J.B.; Williams, A.T.; García-Novo, F. A coastal dune vulnerability classification. A case study of the SW Iberian Peninsula. J. Coast. Res. 2001, 17, 802–811. [Google Scholar]
- Guisado, E.; Malvárez, G.C. Multiple Scale Morphodynamic Mapping: Methodological Considerations and Application for the Coastal Atlas of Andalusia. J. Coast. Res. 2009, 56, 1513–1517. [Google Scholar]
- Malvárez, G.; Navas, F.; Guisado-Pintado, E.; Jackson, D.W.T. Morphodynamic interactions of continental shelf, beach and dunes: The Cabopino dune system in southern Mediterranean Spain. Earth Surf. Process. Landf. 2019, 44, 1647–1658. [Google Scholar] [CrossRef]
- Gornitz, V.M.; Daniels, R.C.; White, T.W.; Birdwell, K.R. The development of a coastal risk assessment database: Vulnerability to sea-level rise in the US Southeast. J. Coast. Res. 1994, 12, 327–338. [Google Scholar]
- Raji, O.; Niazi, S.; Snoussi, M.; Dezileau, L.; Khouakhi, A. Vulnerability assessment of a lagoon to sea level rise and storm events: Nador lagoon (NE Morocco). J. Coast. Res. 2013, 65, 802–808. [Google Scholar] [CrossRef]
- Özyurt, G.; Ergin, A. Application of sea level rise vulnerability assessment model to selected coastal areas of Turkey. J. Coast. Res. 2009, 56, 248–251. [Google Scholar]
- Özyurt, G.; Ergin, A. Improving coastal vulnerability assessments to sea-level rise: A new indicator-based methodology for decision makers. J. Coast. Res. 2010, 26, 265–273. [Google Scholar] [CrossRef]
- Li, K.; Li, G.S. Vulnerability assessment of storm surges in the coastal area of Guangdong Province. Nat. Hazards Earth Sys. 2011, 11, 2003–2010. [Google Scholar] [CrossRef]
- Bayo Martínez, A. Tratamiento técnico del borde litoral almeriense. In Actas de las Jornadas sobre el Litoral de Almería: Caracterización, Ordenación y Gestión de un Espacio Geográfico Celebradas en Almería, 20 a 24 de Mayo de 1997; Instituto de Estudios Almerienses: Almería, Spain, 1999; pp. 207–232. [Google Scholar]
- Malvárez, G.; Pollard, J.; Rodriguez, R.D. Origins, management, and measurement of stress on the coast of southern Spain. Coast. Manag. 2000, 28, 215–234. [Google Scholar]
- Viciana Martínez-Lage, A. La costa de Almería: Desarrollo socio-económico y degradación físico-ambiental (1957–2007). Paralelo 37º 2007, 19, 149–183. [Google Scholar]
- Javaloy, A.; Lobo, F.J.; Bárcenas, P.; Azor, A.; Fernández-Salas, L.M.; Díaz del Río, V. Evolución reciente del delta del Río Adra (SE España). Geo-Temas 2008, 10, 743–746. [Google Scholar]
- Guisado-Pintado, E.; Malvárez, G. El rol de las tormentas en la evolución morfodinámica del Delta del río Vélez: Costa del Sol, Málaga. Geo-Temas 2015, 15, 189–192. [Google Scholar]
- Pethick, J. Coastal management and sea level rise. Catena 2001, 42, 307–322. [Google Scholar] [CrossRef]
- Hansom, J. Coastal sensitivity to environmental change: A view from the beach. Catena 2001, 42, 291–305. [Google Scholar] [CrossRef]
- Costa, S.; Coelho, C. Northwest Coast of Portugal—Past behavior and future coastal defense options. J. Coast. Res. 2013, 65, 921–926. [Google Scholar] [CrossRef]
- Mir Gual, M.; Pons, G.X.; Martín Prieto, J.A.; Rodríguez Perea, A. A critical view of the blue flag beaches in Spain using environmental variables. Ocean Coast. Manag. 2015, 105, 106–115. [Google Scholar] [CrossRef]
- Semeoshenkova, V.; Newton, A. Overview of erosion and beach quality issues in three southern European countries: Portugal, Spain and Italy. Ocean Coast. Manag. 2016, 118, 12–21. [Google Scholar] [CrossRef]
- Pranzini, E.; Anfuso, G.; Cinelli, I.; Piccardi, M.; Vitale, G. Shore Protection Structures Increase and Evolution on the Northern Tuscany Coast (Italy): Influence of Tourism Industry. Water 2018, 10, 1647. [Google Scholar] [CrossRef]
- Pranzini, E.; Anfuso, G.; Botero, C.M. Nourishing Tourist Beaches. In Beach Management Tools—Concepts, Methodologies and Case Studies; Botero, C.M., Cervantes, O., Finkl, C.W., Eds.; Springer: Dordrecht, The Netherlands, 2018. [Google Scholar]


| 1 | 2 | 3 | 4 | 5 |
|---|---|---|---|---|
| Very Low | Low | Medium | High | Very High |
| 0.0–7.65 | 7.65–15.45 | 15.45–40.09 | 40.09–79.75 | 79.75–146.12 |
| 1 | 2 | 3 | 4 | 5 |
|---|---|---|---|---|
| Very Wide | Wide | Medium | Narrow | Very Narrow |
| Dry beach width ≥5 times the 20-year shoreline position | 4 times the 20-year shoreline position | 3 times the 20-year shoreline position | 2 times the 20-year shoreline position | ≤1 time the 20-year shoreline position |
| A | B | C | D | E |
|---|---|---|---|---|
| Very Low | Low | Medium | High | Very High |
| Open spaces with little or no vegetation (A) Scrub and/or herbaceous vegetation associations (B) | Forests (C1) Wetlands and water bodies (C2) | Agricultural areas (D2) Artificial, non-agricultural vegetated areas (D3) | Discontinuous urban fabric (D1) | Continuous urban fabric (E1) Industrial, commercial, and transport units and mine, dump, and construction sites (E2) |
| Points | Coordinates | θ (°) | Cardinal Points | Hs (m) | Tp (s) |
|---|---|---|---|---|---|
| 1 | 36° N 5°30′ E | 247.5 | WSW | 4.68 | 9.14 |
| 13 | 36° N 3°30′ E | 247.5 | WSW | 4.85 | 6.44 |
| 26 | 36°30′ N 1°30′ E | 67.5 | ENE | 8.64 | 9.36 |
| 27 | 37° N 1°30′ E | 67.5 | ENE | 7.86 | 10.25 |
| Land Use | ||||||
|---|---|---|---|---|---|---|
| A | B | C | D | E | ||
| Coastal Sensitivity | 1 | 1A | 1B | 1C | 1D | 1E |
| 2 | 2A | 2B | 2C | 2D | 2E | |
| 3 | 3A | 3B | 3C | 3D | 3E | |
| 4 | 4A | 4B | 4C | 4D | 4E | |
| 5 | 5A | 5B | 5C | 5D | 5E | |
© 2020 by the authors. Licensee MDPI, Basel, Switzerland. This article is an open access article distributed under the terms and conditions of the Creative Commons Attribution (CC BY) license (http://creativecommons.org/licenses/by/4.0/).
Share and Cite
Molina, R.; Manno, G.; Lo Re, C.; Anfuso, G.; Ciraolo, G. A Methodological Approach to Determine Sound Response Modalities to Coastal Erosion Processes in Mediterranean Andalusia (Spain). J. Mar. Sci. Eng. 2020, 8, 154. https://doi.org/10.3390/jmse8030154
Molina R, Manno G, Lo Re C, Anfuso G, Ciraolo G. A Methodological Approach to Determine Sound Response Modalities to Coastal Erosion Processes in Mediterranean Andalusia (Spain). Journal of Marine Science and Engineering. 2020; 8(3):154. https://doi.org/10.3390/jmse8030154
Chicago/Turabian StyleMolina, Rosa, Giorgio Manno, Carlo Lo Re, Giorgio Anfuso, and Giuseppe Ciraolo. 2020. "A Methodological Approach to Determine Sound Response Modalities to Coastal Erosion Processes in Mediterranean Andalusia (Spain)" Journal of Marine Science and Engineering 8, no. 3: 154. https://doi.org/10.3390/jmse8030154
APA StyleMolina, R., Manno, G., Lo Re, C., Anfuso, G., & Ciraolo, G. (2020). A Methodological Approach to Determine Sound Response Modalities to Coastal Erosion Processes in Mediterranean Andalusia (Spain). Journal of Marine Science and Engineering, 8(3), 154. https://doi.org/10.3390/jmse8030154