Article

FiniteAmplitude Power Budget Equations for Acoustic Fish Abundance Estimation

1
Department of Physics and Technology, University of Bergen, P.O.Box 7803, N5020 Bergen, Norway
2
NORCE Norwegian Research Centre AS, P.O. Box 6031, Postterminalen, N5892 Bergen, Norway
J. Mar. Sci. Eng. 2020, 8(2), 98; https://doi.org/10.3390/jmse8020098
Submission received: 31 December 2019 / Revised: 3 February 2020 / Accepted: 4 February 2020 / Published: 6 February 2020
(This article belongs to the Special Issue Advanced Instruments for Marine Research)

Abstract

:
Finite-amplitude (nonlinear) sound propagation effects in seawater may cause measurement errors in fish and zooplankton abundance estimation and species identification for accessible echo sounder transmit electrical power levels and operating frequencies of about 100 kHz and higher. A sufficiently validated framework to quantify, control, and compensate for such errors in these applications is not available. The conventional power budget equations in fisheries acoustics are valid for small-amplitude signals only. The study aims to fill this “gap”. The conventional theory is generalized to account for finite-amplitude incident sound propagation, arbitrary electrical termination, and the range of electrical and acoustical echo sounder parameters. Equations for use in calibration and oceanic surveying are derived in terms of the backscattering cross section, σ b s , and the volume backscattering coefficient, s v . The “finite-amplitude terms” in these expressions can—for relevant transmit electrical power levels of relevant echo sounders—be measured in controlled tank experiments. Alternatively, they can be calculated using numerical models. The resulting equations enable estimation of finite-amplitude measurement errors in these applications; development of recommended upper limits for echo sounder power levels; controlled reduction of finite-amplitude errors in calibration and surveying; and development of correction factors for survey data already subjected to such measurement errors.

1. Introduction

1.1. Conventional Acoustic Fish Abundance Estimation

Acoustic methods for estimating fish stock abundance have been in regular use for several decades [1,2,3,4,5,6,7,8,9,10,11,12,13,14,15,16,17,18,19,20,21,22,23,24,25,26,27,28,29,30], and constitute a key element in national and international regulations of marine resources, such as fish, zooplankton, and krill. For fish aggregated in schools or layers, abundance measurement is based on echo integration [2,4,6,7,8,9,11], supported by biological sampling. The acoustic methods rely on power budget equations and calibrated echo sounder and sonar systems [3,6,21,27,28]. Echo-integrated measurements are used in expressions for the volume backscattering coefficient, s v , and the echo-integrator equation [4,6,7,11], to estimate stock abundance in terms of target (fish) density, ρ a [10,21,27]. Fish abundance is measured using signal frequencies typically in the 10–120 kHz range. Zooplankton measurement employs frequencies above 100 kHz. For Atlantic mackerel (Scomber scombrus L.), the use of 200 kHz is reported to be advantageous in abundance estimation to discriminate against herring (Clupea harengus) [12].
Over the recent decades, new developments have been taken into use for zooplankton, krill, and fish species identification (target classification) using multi-frequency measurement data [12,13,14,25,30]. The methods are based on interpretation of the relative frequency response of s v , R v ( f ) s v ( f ) / s v ( 38   kHz ) [25], where s v is measured over a range of frequencies, f, and normalized to its value at, e.g., 38 kHz. Typically, echo sounder frequencies in the range 10–500 kHz or higher are employed.
Recent work has shown that finite-amplitude sound propagation effects may cause errors in abundance and species identification measurements under certain operating conditions in fisheries acoustics [15,16,17,18,19,20]. The development of a theory to describe these errors is the subject of this work.
The principal acoustic quantity used in abundance estimation and species identification is s v . In current scientific echo sounders, s v is calculated from time integration of the squared transmitted and received voltage signals, measured at the transducer’s electrical terminals (“echo integration”) [2,4,6,7,8,9,11,21,22,23,24], using a power budget equation accounting for multiple-target (volume) backscattering [11,20,21,22,23,24,25,26,27,28]. s v is measured for a sequence of thin spherical shell “ping volumes", V p , at increasing range. The sequence of s v measurements is integrated over the range interval of an observation volume, V o b s [11,21,22,23,24,27], to give the fish density in V o b s , ρ a .
For at-sea calibration of scientific echo sounders prior to oceanic surveys, using a standard target (normally a metal sphere), a related power budget equation for single-target backscattering is utilized, given in terms of the backscattering cross section of the single target, σ b s [11,20,21,22,23,24,25,26,27,28]. The same equation is employed in target strength (TS) measurements of individual fish.
σ b s thus applies to the single-target backscattering used in echo sounder calibration and TS measurement of individual fish. s v and ρ a apply to the multiple-target volume backscattering used in oceanic (field) surveys. The power budget equations for σ b s , s v , and ρ a referred to above, expressed in average power formulations,
σ b s 16 π 2 r 4 e 4 α r Π R s t G 2 ( θ , ϕ ) λ 2 Π T ,
s v 32 π 2 r 2 e 4 α r Π R v G 0 2 ψ λ 2 c 0 τ p Π T ,
ρ a = 1852 2 σ b s r min r max s v ( r ) d r ,
will here be referred to as the “conventional generic power budget equations” in fisheries acoustics [21,25]1. (The quantities involved in Equations (1)–(3) are defined in Section 2 and Section 3 and summarized in Appendix D.) In this context, “generic” means “instrument independent”. Equations (1) and (2) give the echo sounder’s electrical power transfer function (ratio of received to transmitted average electrical powers) for situations with single-target and multi-target (volume) backscattering, respectively, expressed in terms of σ b s and s v . The power “flow” represented by Equations (1) and (2) is explained in Appendix B of [23] (cf. also Appendix A). Equations (1)–(3) constitute the generic fundament for abundance estimation, species identification, and target classification in modern fisheries acoustics, serving as the basis for at-sea echo sounder calibration and survey operation [28,29,30].
It may be noted that other power budget equations for σ b s and s v than those given by Equations (1) and (2) have been presented and used [2,9,11,20,22,23,24,26,27,28]. Some of these [26,27,28] are instrument-specific (i.e., depend on the specific signal processing method implemented) and not generic. Several textbooks [2,9,31,32,33,34] account solely for acoustic pressures in the fluid medium (water), without including the electroacoustic conversions in the transducer, and are thus incomplete for a voltage-to-voltage transmit–receive system description as addressed here. Moreover, there are divergences and inconsistencies2 in some of this literature [11,26,27,28] relative to Equations (1) and (2). These inconsistency issues have, however, been resolved [23,24], and Equations (1)–(3) have been shown to be valid under common assumptions being used in fisheries acoustics (cf. Section 4.2) for specific conditions of electrical termination and electrical impedances at reception [20,22,23,24] (cf. Section 4.1.1).

1.2. Finite-Amplitude Effects in Fisheries Acoustics

In fisheries acoustics, small-amplitude (linear) sound propagation has been an underlying assumption from the emergence of fishery research echo sounders in the 1930s until recently. Equations (1)–(3) rely on the assumption that no finite-amplitude (nonlinear) effects influence the propagation of sound through seawater. For typical transmit electrical power levels, e.g., some hundred W to about 2 kW, preliminary investigations indicate that this assumption is reasonably good at the lower end of the operational frequency range, such as at 18 and 38 kHz3. Finite-amplitude sound propagation effects increase, however, with increasing frequency. For operating frequencies of about 100 kHz and above, such effects may represent a source of measurement error in fisheries acoustics.
Laboratory measurements, oceanic survey measurements, and numerical simulations have demonstrated that finite-amplitude effects in the sea may cause errors in σ b s , s v , and thus ρ a measurements used in fisheries acoustics [15,16,17,18,19,20]. During the development of new echo sounders based on composite transducer technology, offering improved dynamic range, efficiency, and bandwidth, signal distortion was experienced at transmit electrical power levels commonly used with earlier types of echo sounders. Investigations have demonstrated, first experimentally [15], and later by simulations [16,17,19,20] and other experiments (in the laboratory and oceanic surveying) [19,20], significant effects caused by finite-amplitude sound propagation in seawater, for operating frequencies in the range of about 100 kHz and above, using echo sounders operated at accessible transmit electrical power levels (some hundred W and higher). The demonstrated effects are at a level that may bias abundance estimation and species identification [20]. For example, for a 200 kHz Simrad ES200-7C echo sounder calibrated and operated with the 1 kW power setting, and calibrated with the calibration sphere at 20 m distance, calculations indicate errors in s v (and thus for the abundance estimate) in the range of about 10% to 23% (−0.46 to −1.13 dB), due to finite-amplitude effects, for target ranges r = 20–300 m (cf. Figure 7.4 in [20]). The errors were shown to increase with increasing power and increasing calibration distance.
Finite-amplitude sound propagation effects refer to the nonlinear distortion an acoustic pressure signal experiences as it propagates through a fluid [35]. As the sound velocity in the fluid depends on the acoustic pressure, the positive pressure peaks of the signal waveform (crests) travel faster than the low-amplitude portions and the negative pressure peaks (rarefactions). This results in a distortion of the signal waveform during propagation in the fluid, and transfer of energy from the fundamental to the higher-frequency components of the signal’s frequency spectrum. This effect has been referred to as “nonlinear harmonic distortion” [2,9]. The excess pressure loss experienced at the fundamental frequency component due to finite-amplitude effects, in excess of the geometrical spreading and loss caused by fluid absorption and scattering, is referred to here as “nonlinear loss”. It increases with increasing sound pressure level, and therefore with the increased electrical power level used for the transducer at transmission. Nonlinear loss and harmonic distortion accumulate with distance from the source until the signal amplitude eventually becomes so small that further finite-amplitude effects are negligible [16,17,19,20,35].
In a transducer sound field, the sound pressure is usually highest along the main lobe. As nonlinear distortion effects are amplitude-dependent, such effects are thus at their strongest along the main lobe, and weaker elsewhere. Nonlinear loss of the transmitted (fundamental) frequency component thus gives rise to a “flattening” and thus “widening” of the main lobe for that frequency component [2,9,16,17,19,20,35]. An example can illustrate some typical figures in this respect. In [19], measurements and simulations have been reported for a Simrad EK60 transducer operating at 200 kHz in water. In the far field (about 22 Rayleigh distances), the −3 dB beamwidth at the fundamental frequency was measured to increase from about 7.5° to about 9.9° using “small” and “high” amplitudes, respectively (150 and 1500 W electrical power settings), i.e., an increase of 2.4° (32%)4.
The conventional expressions for σ b s and s v , Equations (1) and (2) [21,25], and alternative small-amplitude expressions [11,20,22,23,24,25,26,27,28], do not account for finite-amplitude sound propagation effects. Thus, if not avoided or corrected for, such effects may cause errors and problems for today’s methods of abundance estimation and species identification. Measurements are based on the fundamental frequency component of the received signal. When measurement data subjected to significant finite-amplitude effects are used as input to the conventional expressions for σ b s and s v , Equations (1) and (2), respectively, which are based on small-amplitude (linearized) sound propagation theory, abundance estimates are biased.
Similarly, in fish species identification (target classification), possible errors in R v ( f ) at the higher frequencies, due to error in s v , σ b s , or both (in survey and calibration, respectively), may lead to erroneous interpretation, when comparing with the "reference signature”, R v ( f ) , for candidate species. In these applications, the control of possible errors caused by finite-amplitude effects is important.
To gain reliable insight into how finite amplitude effects affect fish abundance estimation and species identification, such operations need to be modeled using a full functional relationship for the measurements, where all electrical and acoustical parameters influencing the measurements are accounted for, including the delicate balance between echo sounder calibration measurements and field (survey) operation. The influences of finite-amplitude effects appearing in one or both of the calibration and survey operations of the echo sounders need to be accounted for.
A method to estimate the magnitude of finite-amplitude errors, to avoid or correct such errors, has been proposed and used in numerical calculations by Pedersen [20] (his Equations (7.1)–(7.11)). The conventional small-amplitude power budget equation for s v , Equation (2), was generalized to account for finite-amplitude sound propagation. An expression for s v in this form was not explicitly given, but indicated (cf. Equations (7.1)–(7.5) in [20]). On this basis, a finite-amplitude correction factor was proposed and used as a multiplicative factor to the measured s v value (i.e., the erroneous value obtained under the assumption of small-amplitude sound propagation). The analysis accounted for possible finite-amplitude effects during calibration without, however, giving an explicit finite-amplitude expression for σ b s . A sufficiently detailed derivation of the correction model was not given, and the expressions constituting the model may possibly not appear highly intuitive.
An alternative theory confirming Pedersen’s correction model has been presented [36,37], where the mathematical derivations leading to the finite-amplitude power budget expressions for σ b s and s v were omitted.
Consequently, the magnitude, importance, and consequences of the error introduced by finite-amplitude effects in abundance estimation and species identification have not yet been sufficiently described and documented. Methods to estimate and compensate for such errors have been presented, accounting for finite-amplitude effects in at-sea echo sounder calibration and survey operation [20,36,37]. Recommendations for reduced echo sounder source levels and transmit electrical power levels have been proposed [11,14,18], e.g., based on calculations given elsewhere [16,17,20]. However, providing reliable and optimal recommendations for compensation and transmit power levels is difficult without a sufficiently complete and documented analysis of the subject.
The average power model proposed in [20], or the alternative model given in [36], could potentially have served as a candidate method for such analysis and recommendations. However, until mathematical derivations of the proposed expressions are presented, these models cannot be considered sufficiently validated for a reliable analysis.
For control in abundance estimation and species identification, there is thus a need to present reliable and documented power budget expressions for σ b s and s v that account for finite-amplitude signal propagation. This need relates to error analysis; the establishment of recommended upper limits for source or transmit electrical power levels; and the development of correction methods for finite-amplitude effects. The derivation of such expressions for σ b s and s v is the topic addressed here.

1.3. Objectives and Outline

The objective of this article is to derive power budget equations—for single and multiple-target (volume) backscattering, and for the fundamental frequency component of the received signal—that account for finite-amplitude sound propagation in the fluid medium (seawater).
A comment may be needed to clarify the applicability of the analysis. For classical narrowband operation of scientific echo sounders, with narrowband transducer and/or filtering used at transmission and reception (such as using, e.g., Simrad EK500, EK60, and EK80 in “EK60 modus”, or similar equipment), the harmonic content of the scattered signal is negligible, and the present analysis is expected to apply.
In modern echo sounder systems (such as Simrad EK80), with possibilities for wideband operation using “chirp” frequency-modulated signals (matched filtering), some of the harmonic contents that may be generated in the case of finite-amplitude signals with carrier frequencies in the range of 100 kHz and above may be received within the wide frequency band employed. If the full wideband waveform signal is used in signal processing, a more complete analysis would be necessary than the one presented here. In that case, the lower harmonic frequency components would have to be accounted for (represented by second moments), as well as frequency dependent absorption, and possibly also wave dispersion.
The handling of possible finite-amplitude effects in wideband operation of fisheries echo sounders is a highly complex matter, and, in practice, precautions to reduce or preferably avoid such effects are preferred. In these applications, the theory presented here may be used, e.g., to establish upper limits for echo sounder power levels, so that finite amplitude effects are reduced or become negligible.
The paper is organized as follows. In Section 2, an electroacoustic power budget equation describing backscattering from a single target is derived (giving σ b s ), accounting for finite-amplitude incident sound. From this expression, an electroacoustic power budget equation describing volume backscattering from a multitude of targets is derived in Section 3 (giving s v ), also applicable to finite-amplitude sound propagation conditions. The generic (instrument independent) expressions for σ b s and s v are given in terms of average electrical powers, averaged over a single cycle of a monochromatic wave. In Section 4, the results are discussed in relation to prior literature, also summarizing the assumption underlying the analysis. Conclusions are given in Section 5. Interpretations of the derived power budget equations for σ b s and s v in terms of average power “flow” are given in Appendix A. Appendix B and Appendix C give interpretations of important quantities involved, used for interpretation of the power budget equations and analysis of some prior literature (cf. Appendix A and Section 4.1.1). Symbols and nomenclature are summarized in Appendix D.
This article provides a generalization of the conventional expressions given by Equations (1) and (2) [21,25] (as well as alternative small-amplitude expressions [11,20,22,23,24,26,27,28]), to account for finite-amplitude incident sound, for the fundamental frequency component of the received signal. They also represent a generalization of Equations (1) and (2) [21,25] (and alternative models [11,26,27,28]) to account for arbitrary electrical termination at reception.
The description represents a generalization of [22] to account for finite-amplitude sound propagation effects in the fluid medium, and is therefore chosen to relatively closely follow the same sequence of derivation and also some phrasing used in [22], to enable convenient identification of essential similarities, differences, and assumptions in comparison of the two cases of small and finite-amplitude sound propagation in the fluid medium.

2. Single-Target Backscattering of Finite-Amplitude Incident Sound

A frequency domain description is used, with time harmonic factor e i ω t , where i = 1 , ω = 2 π f is the angular frequency of the monochromatic wave, and t is the time. Bold-face letters are used to indicate complex-numbered quantities, and vectors are represented by underlined characters [22,23].

2.1. Acoustic Backscattering from a Single Target in the Farfield

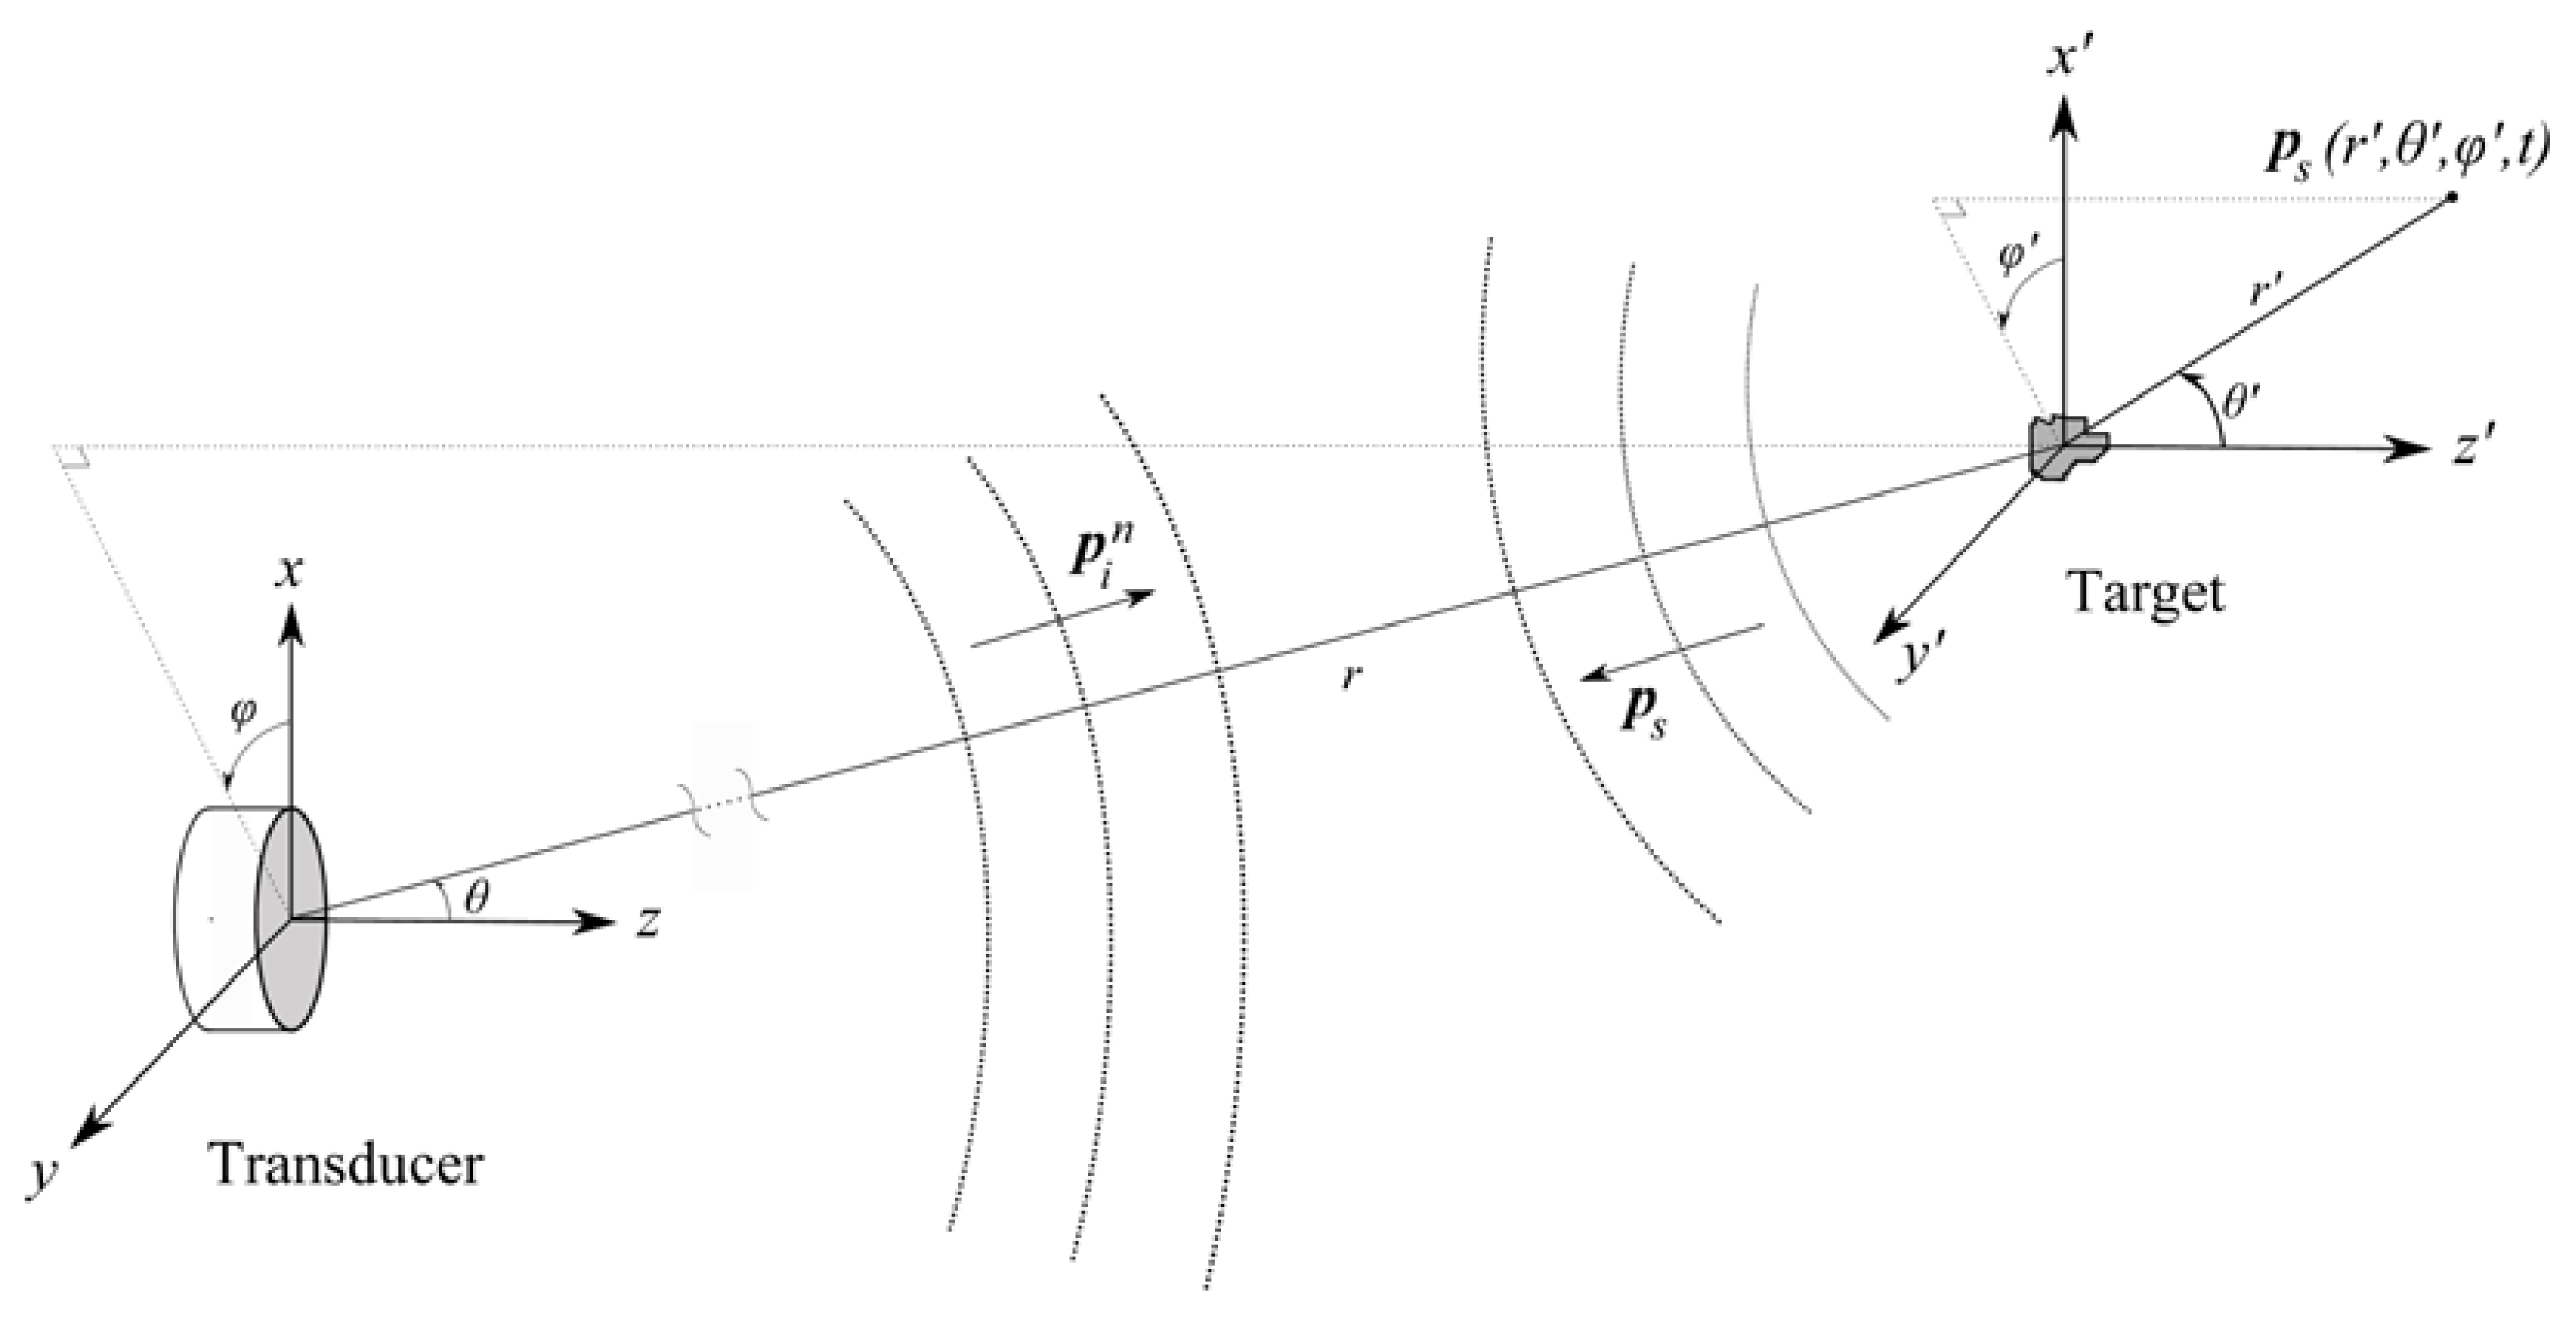
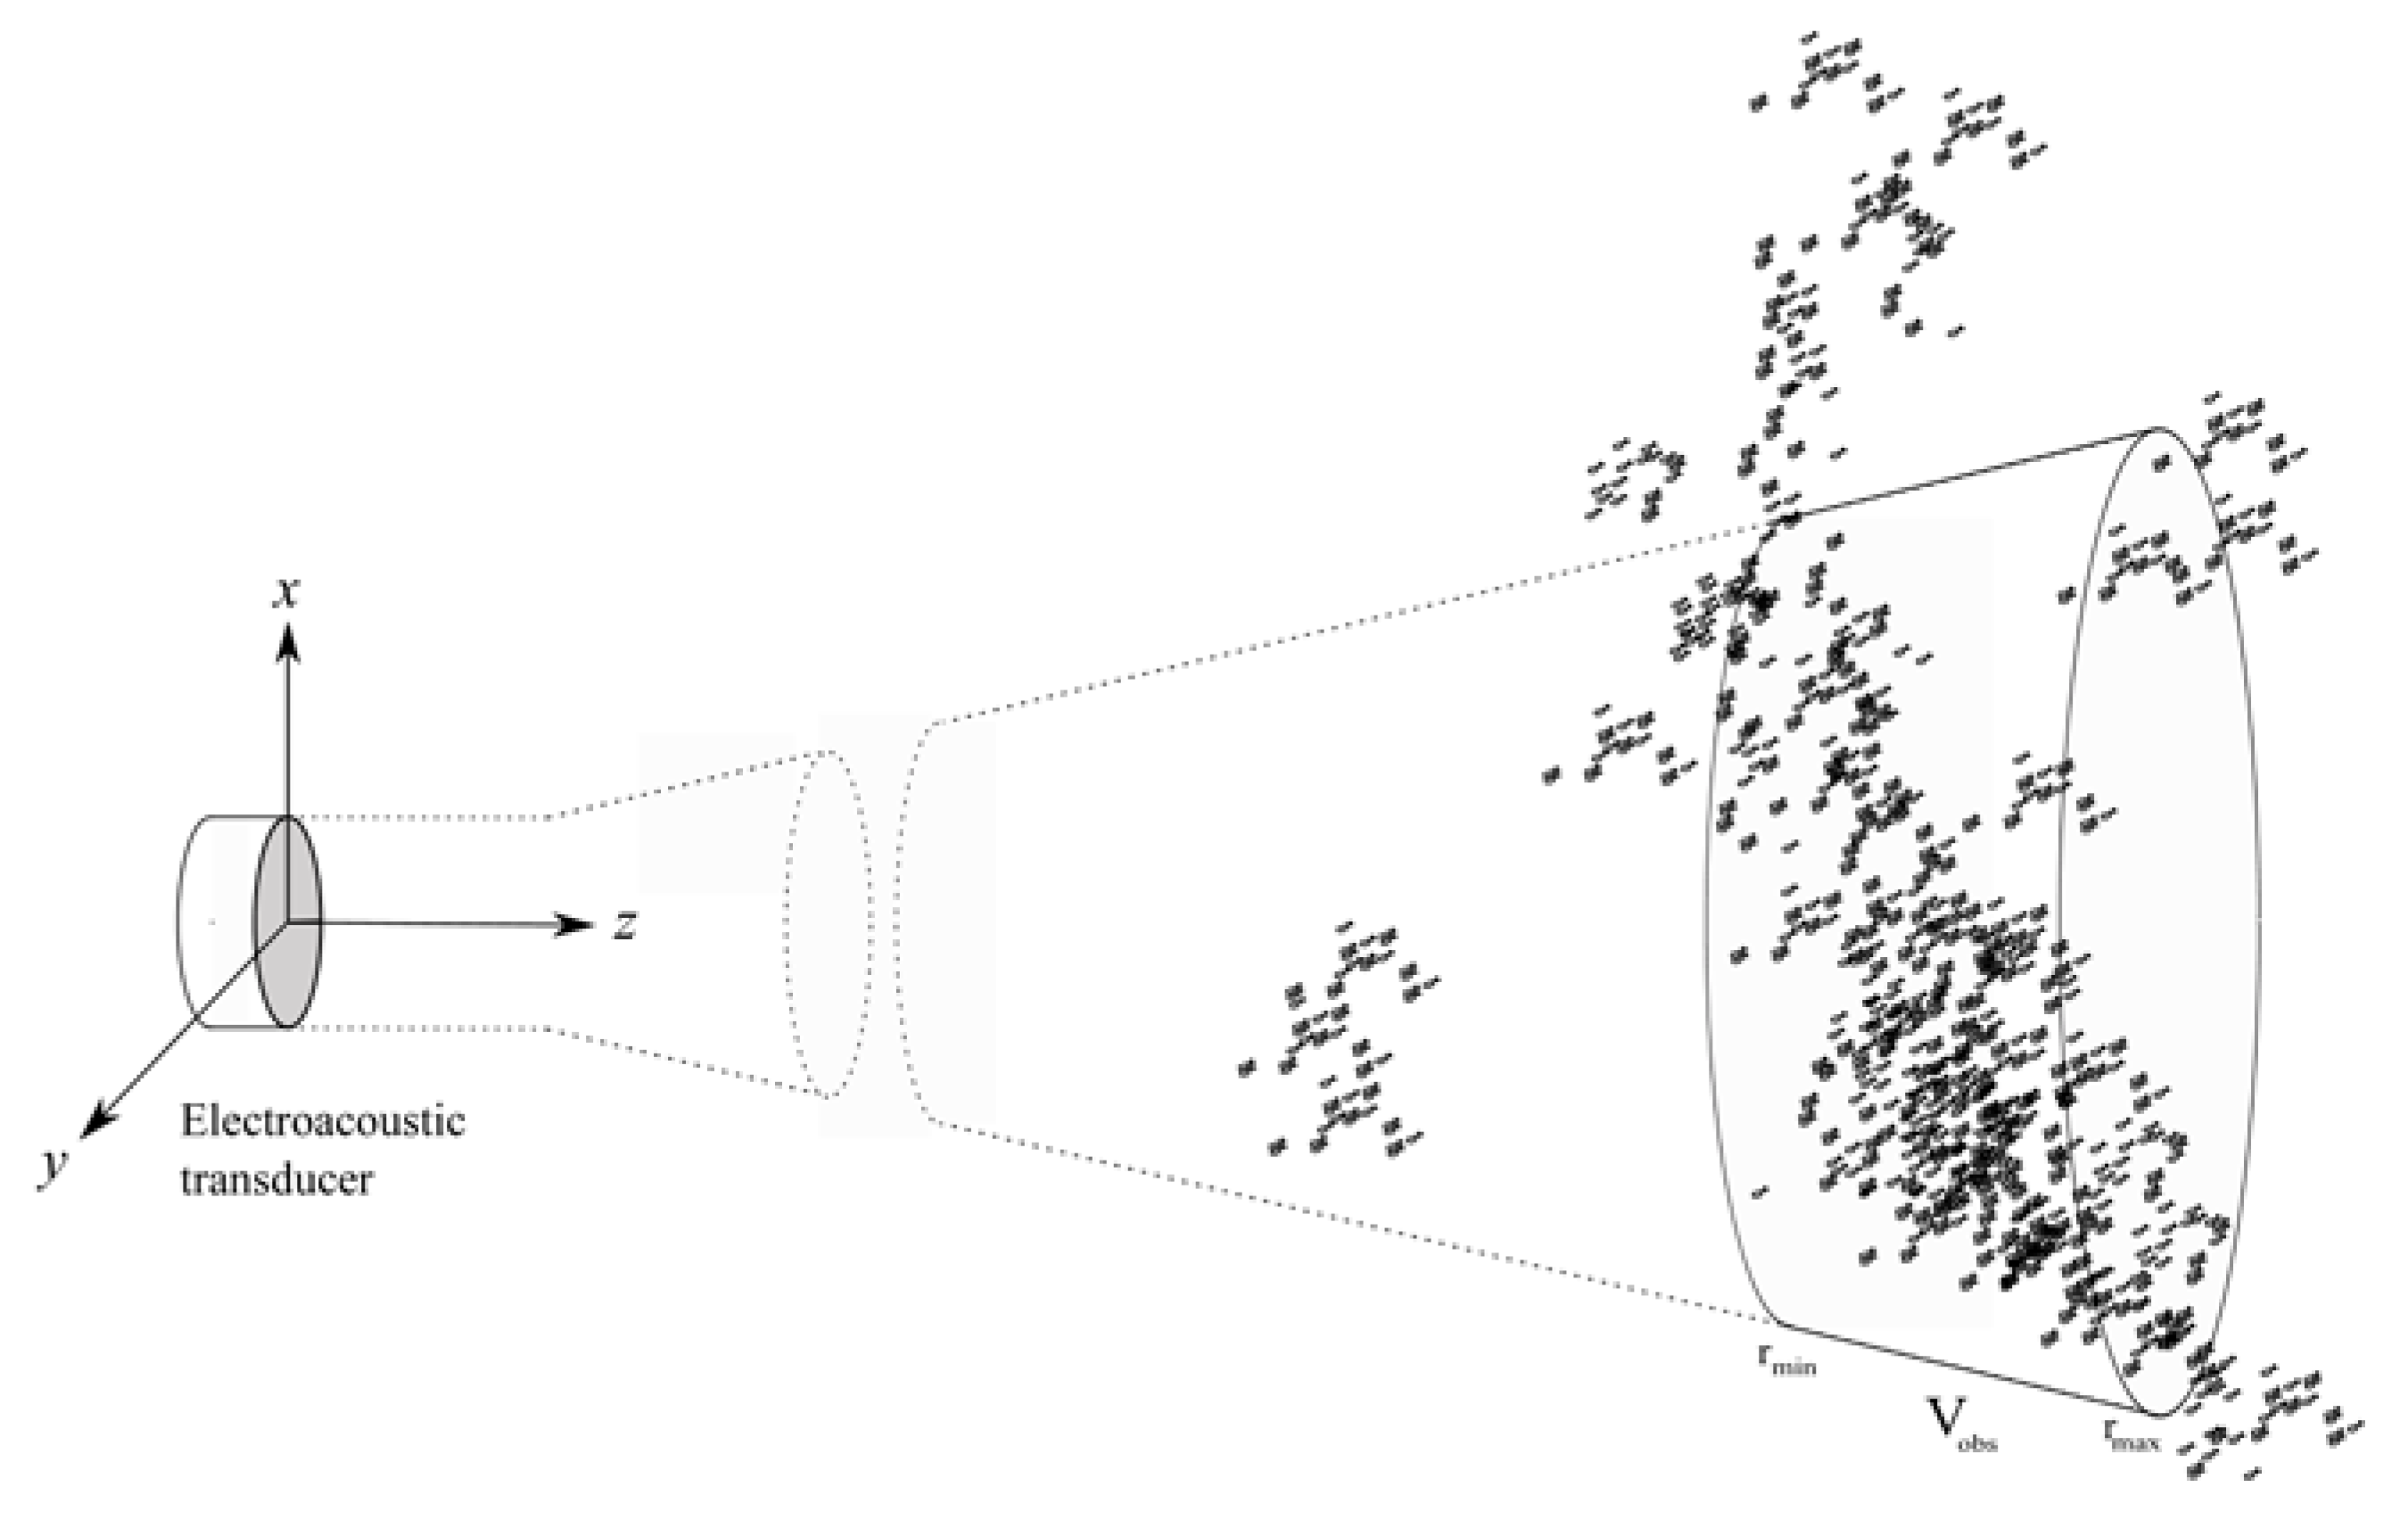
Consider the situation shown in Figure 1. An electrical signal at angular frequency ω is fed to an electroacoustic transducer, by which it is converted to an acoustic pressure wave, and radiated into a homogeneous fluid medium, i.e., with constant density and sound velocity [22]. In abundance estimation, the sound velocity is typically taken to be the average value of the sound velocity profile over the depth range in question [14,28]. In the fluid, at an arbitrary orientation relative to the transducer (on or off the acoustical axis), consider a single object of unspecified shape and material, or alternatively, a multitude of such objects, of different types, materials, and sizes [22]. It is assumed that these are confined to a sufficiently small volume in space, so that the sound backscattered from the object(s) to the transducer appears as if the scattering came from a single target5. This object, or small volume of objects, can then be treated as a single target, and is for convenience referred to as “the target”, or “the scatterer”. A monostatic situation is considered, where the backscattered sound pressure wave is received by the same transducer and converted to an electrical signal.
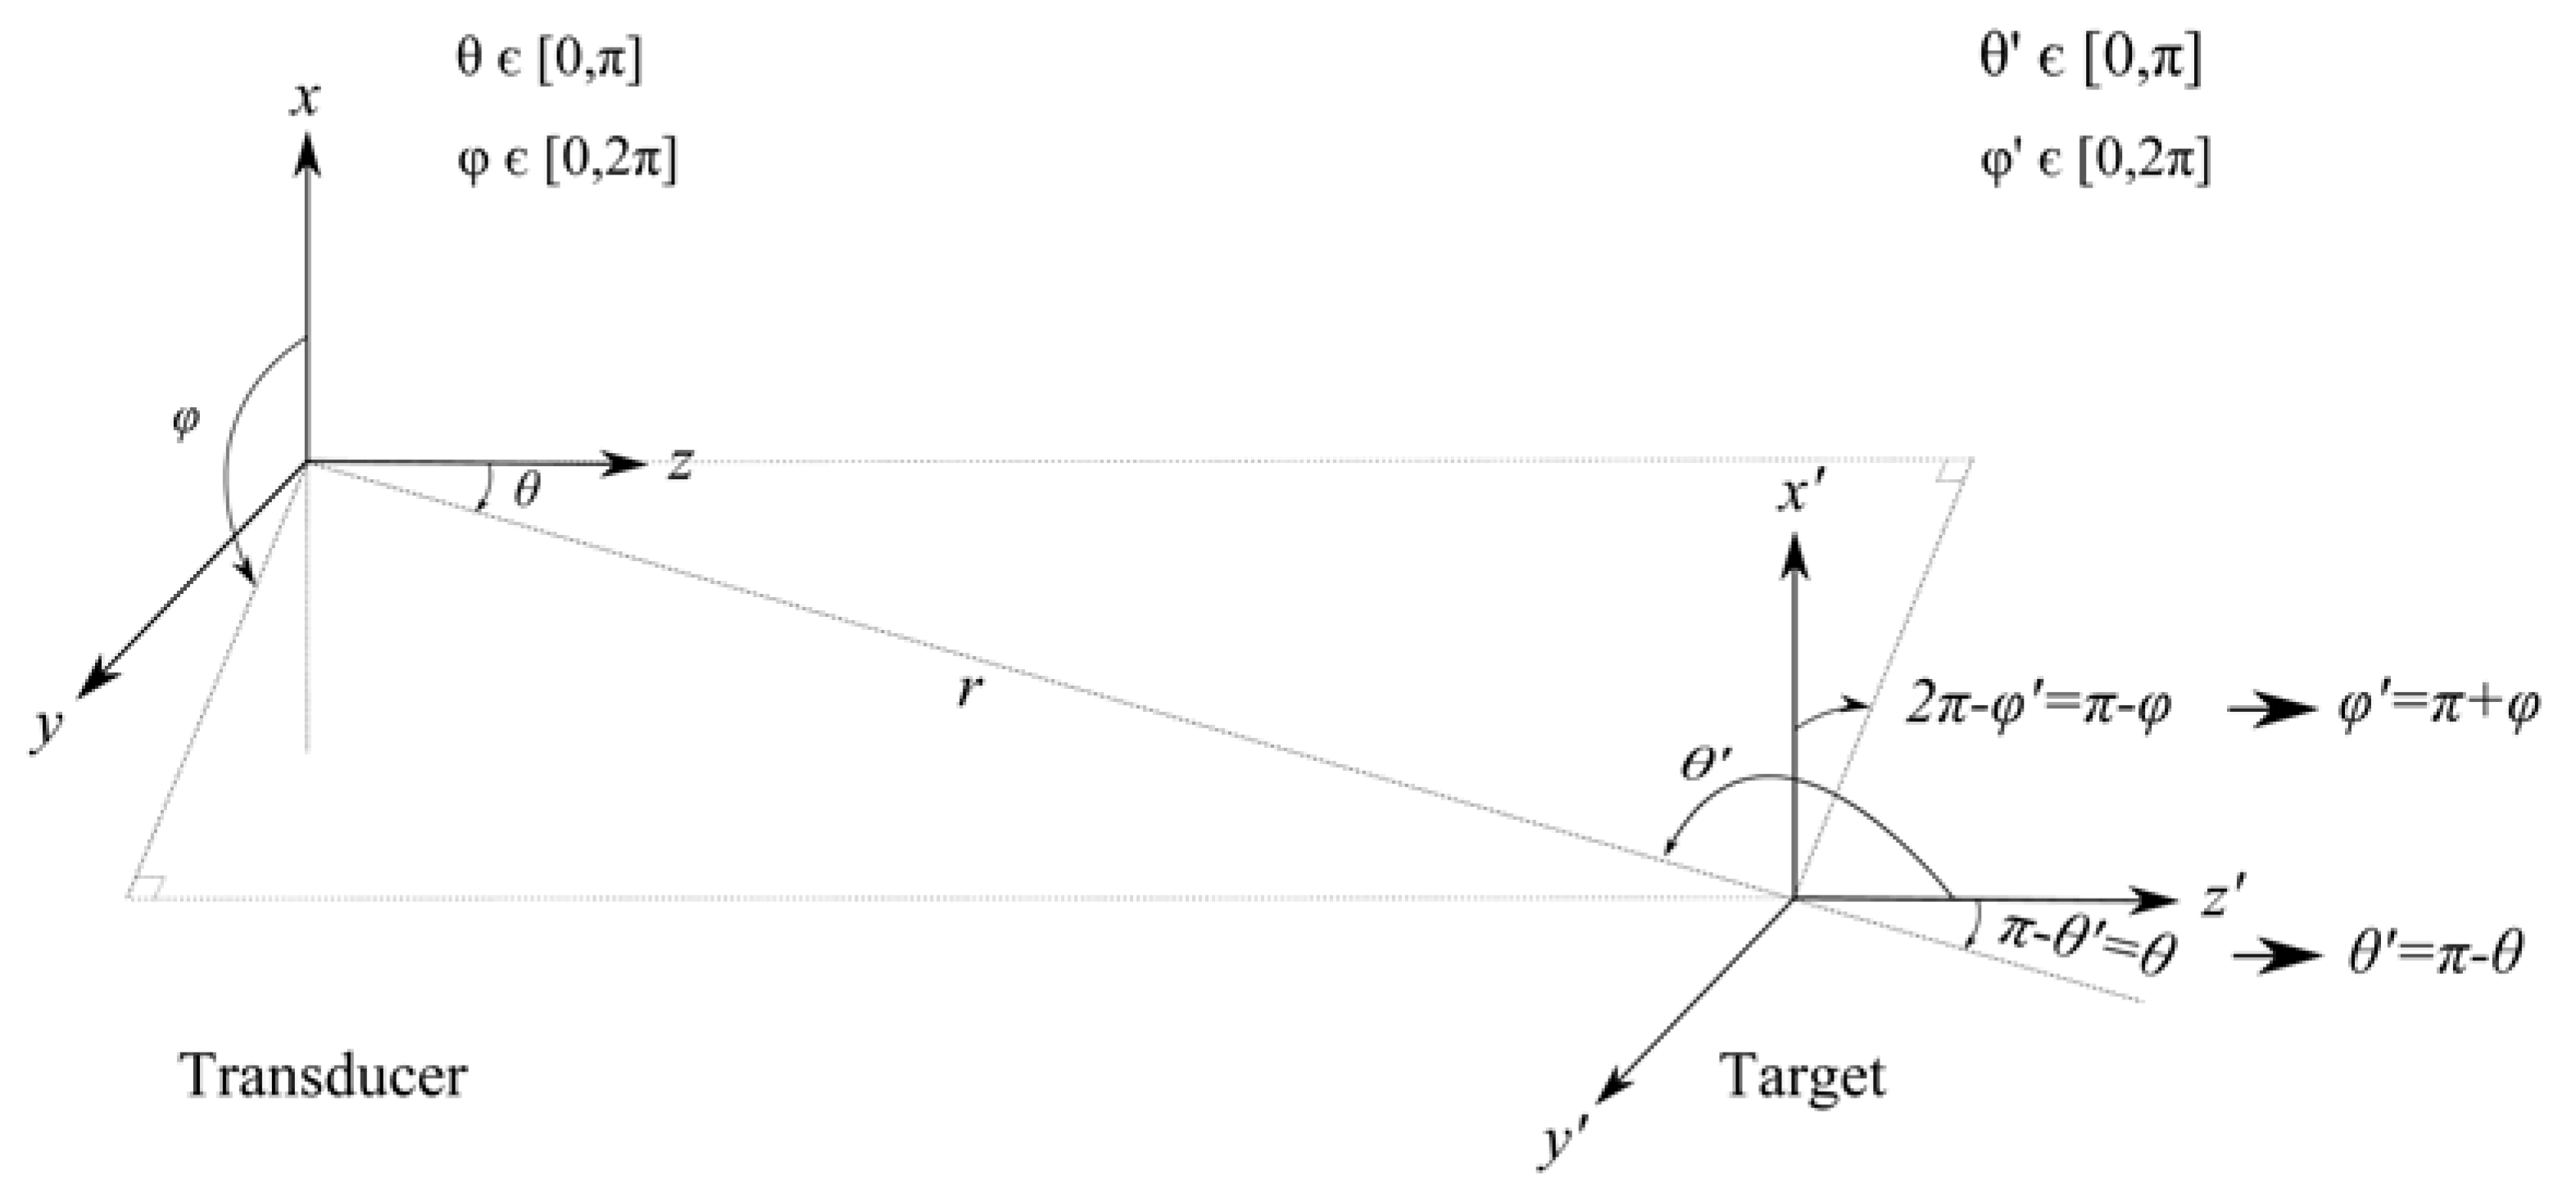
Two coordinate systems are used to describe this electroacoustic system [22]. The origin of coordinate system no. 1, used for the transmitted wave field, is located at the center of the front face of the transducer. The z-axis is chosen normal to the transducer’s front surface, and assumed to be co-incident with the transducer’s acoustic axis. Coordinate system no. 2, used for the scattered wave field, and employing primed coordinates, has its origin located at the center of the target, and the axes parallel to the respective axes of coordinate system no. 1. Figure 1 shows the Cartesian coordinates x, y, and z (x’, y’, and z’) and the spherical coordinates r, θ, and φ (r’, θ’, and φ’) for the two coordinate systems, where r (r’) is the radial distance, denoted range, θ (θ’) is the polar angle, and φ (φ’) is the azimuthal angle. The position vectors in the two coordinate systems are r _ = ( r , θ , φ ) and r _ = ( r , θ , φ ) , respectively, with x = r sin θ cos φ , y = r sin θ sin φ , z = r cos θ , θ [ 0 , π ] , φ [ 0 , 2 π ] , and x = r sin θ cos φ , y = r sin θ sin φ , z = r cos θ , θ [ 0 , π ] , φ [ 0 , 2 π ] .
Consider a target located in the farfield of the transmitting transducer, where farfield refers here to small-amplitude sound propagation. It is assumed that finite-amplitude sound propagation effects only affect the forward-radiated (transmitted) sound pressure wave (referred to here as the incident sound wave) [20,36,37]. At the position of the target, the amplitude of the incident wave is so small that finite-amplitude effects in seawater can be neglected. It is further assumed that possible nonlinear effects in the scattering process at the target itself (involving, e.g., fish with a gas-filled swim-bladder) can be neglected [22,23,24], so linear backscattering theory [2] applies. Consequently, the backscattered wave amplitude is so small that finite-amplitude effects in the scattered field can be neglected, and the scattered field is described by small-amplitude (linearized) theory. In the farfield of the target, the scattered pressure field spreads inversely proportional to range, r .
Under these assumptions, and motivated, e.g., by numerical simulation results for the finite-amplitude sound pressure field radiated by baffled piston sources [16,17,19,20] using the Khokhlov–Zabolotskaya–Kuznetsov (KZK) equation [35,38,39,40,41,42] the fundamental frequency components of the finite-amplitude incident pressure wave, p i n , and the scattered pressure wave, p s , are modeled as
p i n ( r , θ , φ , t ) = P i n ( r , θ , φ ) e i ( ω t k _ r _ ) ,
P i n ( r , θ , φ ) = A i r e α r C i n ( r ) B i n ( r , θ , φ ) ,
and
p s ( r , θ , φ , t ) = P s ( r , θ , φ ) e i ( ω t k _ r _ ) ,
P s ( r , θ , φ ) = A s ( r ) r e α r B s ( θ , φ ) ,
respectively. Subscripts “i” and “s” are used for incident and scattered waves, respectively, and the superscript “n” for quantities directly subject to finite-amplitude effects. P i n and P s are the sound pressure amplitudes, A i is a complex-valued constant, and A s ( r ) is a complex-valued function of range, r, which for increasing r decreases in magnitude proportional to P i n ( r , θ , φ ) . The functions
B i n ( r , θ , φ ) P i n ( r , θ , φ ) P i n ( r , 0 , 0 ) ,
B s ( θ , φ ) P s ( r , θ , φ ) P s ( r , 0 , 0 ) ,
are the beam patterns of the incident and scattered sound pressure waves, respectively. P i n ( r , 0 , 0 ) is the axial sound pressure amplitude (along the z axis) for the finite-amplitude incident sound field. P s ( r , 0 , 0 ) is the sound pressure amplitude along the z’ axis for the scattered sound field. k _ = k e _ k and k _ = k e _ k are the acoustic wavenumber vectors in the fluid medium, where e _ k and e _ k are the (position dependent) unit vectors normal to the incident and scattered wavefronts, respectively. k = ω / c 0 is the acoustic wavenumber in the fluid medium, c 0 is the small-amplitude (also called small-signal) sound velocity of the fluid [35], and α is the acoustic attenuation coefficient of the fluid for the sound pressure. α accounts for acoustic absorption of the fluid [43] and possible excess attenuation due to volume scattering experienced in sound propagation between the transducer and the target [2,9]. (In the conventional power budget equations, Equations (1)–(3), and in practical abundance estimates, only acoustic absorption is normally accounted for by α ).
For small-amplitude signals, the amplitude of the incident sound pressure is given as [43]
P i ( r , θ , φ ) = A i r e α r B i ( θ , φ ) ,
where
B i ( θ , φ ) P i ( r , θ , φ ) P i ( r , 0 , 0 ) ,
P i ( r , 0 , 0 ) = A i r e α r ,
are the beam pattern and axial sound pressure amplitude of the incident wave, respectively, under such small-amplitude sound propagation conditions.
The “axial finite-amplitude factor” of the incident pressure wave, defined as
C i n ( r ) P i n ( r , 0 , 0 ) P i ( r , 0 , 0 ) ,
represents the deviation from spherical spreading and attenuation (i.e., absorption and scattering) along the acoustical axis (i.e., the deviation from the small-amplitude case), as a measure of axial nonlinear loss. | C i n ( r ) | 1 for small-amplitude incident waves, and | C i n ( r ) | < 1 under finite-amplitude sound propagation conditions. C i n ( r ) depends on range, r, since nonlinear loss increases with increasing r, until the wave amplitude eventually becomes so small that further nonlinear loss is negligible [16,17,19,20,35]. Hence, at long ranges C i n ( r ) becomes approximately independent of r , and thus approximately constant, for a given frequency and source level.
The use of P s ( r , 0 , 0 ) as the normalization pressure amplitude in Equation (9) may need comment, since the z’ axis is not necessarily the direction of maximum scattering. This approach has been chosen for convenience and without any loss of generality, since the results derived in the following become independent of the choice of normalization direction for B s ( θ , φ ) [22].
It is noted that B i n ( r , θ , φ ) is range dependent, whereas B s ( θ , φ ) is not. This is due to the finite amplitude of the incident pressure wave, with flattening of the main lobe relative to the corresponding small-amplitude sound wave, which changes with distance from the transducer [16,17,19,20,35]. At long ranges, the wave amplitude becomes so small that further flattening is negligible, and B i n ( r , θ , φ ) becomes approximately invariant to r. Under conditions of small-amplitude sound propagation, B i n ( r , θ , φ ) becomes independent of r, and reduces to its range-independent small-amplitude counterpart, B i ( θ , φ ) .
From Equations (5) and (10), the incident sound pressure amplitude can be expressed as
P i n ( r , θ , φ ) = P i ( r , θ , φ ) C i n ( r ) B r e l n ( r , θ , φ ) ,
where the “beam pattern finite-amplitude factor”, defined as
B r e l n ( r , θ , φ ) B i n ( r , θ , φ ) B i ( θ , φ ) ,
represents the finite-amplitude effects on the beam pattern relative to the small-amplitude conditions (i.e., the deviation from the small-amplitude case). | B r e l n ( r , θ , φ ) | 1 for small-amplitude incident waves, and | B r e l n ( r , θ , φ ) | 1 under finite-amplitude sound propagation conditions. On the acoustical axis, | B r e l n ( r , 0 , 0 ) | = 1 for all pressure amplitudes and ranges, r. Away from the axis, B r e l n ( r , θ , φ ) depends on range, r, since the flattening of the main lobe due to finite-amplitude effects increases with increasing r until the wave amplitude eventually becomes so small that further flattening is negligible [16,17,19,20]. Hence, at large ranges, B r e l n ( r , θ , φ ) becomes approximately independent of r , θ , and φ , and thus approximately constant, for a given frequency and source level.
From Equations (5) and (12), the incident free-field pressure amplitude at the target position can be written as
P i n ( r , θ , φ ) = P i , 0 r 0 r e α ( r r 0 ) C i n ( r ) B i n ( r , θ , φ ) ,
where
P i , 0 P i ( r 0 , 0 , 0 ) = A i r 0 e α r 0
is the axial sound pressure amplitude, at the axial reference range r 0 (e.g., 1 m) from the transducer front, under small-amplitude sound propagation conditions, extrapolated spherically from the farfield.
C i n ( r ) , B i n ( r , θ , φ ) , and B r e l n ( r , θ , φ ) can be measured [19,20], or calculated using numerical models, such as, e.g., the “Bergen Code” [40,41,42] based on the KZK equation [35,38,39], or similar models [16,17,19,20].
In general, P i n , P i , P i , 0 , P s , A i , A s , B i n , B i , B s , B r e l n , C i n , and α are all functions of the angular frequency ω , but for convenience in notation, this ω dependency is omitted from the equations.
The intensity of the incident wave at a target located in the transducer’s farfield, with its center at position ( r , θ , φ ) relative to coordinate system no. 1, and the intensity of the scattered wave in the target’s farfield, at position ( r , θ , φ ) relative to coordinate system no. 2, are
I i n = | P i n ( r , θ , φ ) | 2 2 ρ 0 c 0 ,
I s = | P s ( r , θ , ϕ ) | 2 2 ρ 0 c 0 = | A s ( r ) | 2 2 ρ 0 c 0 e 2 α r r 2 | B s ( θ , ϕ ) | 2 ,
respectively, where ρ 0 is the ambient density of the fluid. From Equations (18) and (19), the intensity of the scattered field, extrapolated spherically from the farfield of the scatterer to a reference range r 0 (e.g., 1 m) from the target, I s , 0 I s ( r 0 , θ , φ ) , is given as
I s , 0 = I i n e 2 α r 0 r 0 2 S s ( θ , φ , θ , φ , ω ) A ,
S s A | A s ( r ) B s ( θ , φ ) P i n ( r , θ , φ ) | 2 ,
where S s S s ( θ , φ , θ , φ , ω ) is the scattering function6 [2], and A is the cross-sectional area of the scattering target, viewed from the transducer. Note that S s is independent of range, r, since the ratio | A s ( r ) / P i n ( r , θ , φ ) | is independent of r.
From Figure 2, the backscattering direction is given by θ = π θ and φ = π + φ . The backscattered intensity I b s , 0 I s ( r 0 , θ = π θ , φ = π + φ ) at the reference range r 0 from the target is given from Equation (20) as
I b s , 0 = I i n e 2 α r 0 r 0 2 σ b s ,
where
σ b s S b s A = I b s , 0 I i n r 0 2 e 2 α r 0 ,
S b s S s ( θ , φ , θ = π θ , φ = π + φ , ω ) ,
are the backscattering cross section of the target (m2) and the backscattering function, respectively [2]. σ b s depends in general on frequency, the direction ( θ , φ ) of the incoming (incident) wave, and the shape of the target.
Note that in this description—since σ b s is a property of the scatterer—terms accounting for attenuation and spherical spreading of the backscattered field (between the scattering object and r 0 ) are not to be included in σ b s . These are accounted for in I b s , 0 , as seen from Equation (22).
By combining Equations (18), (19), and (23), σ b s can be expressed in terms of pressure amplitudes instead of intensities, giving
| P b s , 0 | = | P i n | e α r 0 r 0 σ b s
where P b s , 0 P b s , 0 ( r 0 , θ = π θ , φ = π + φ ) is the backscattered sound pressure amplitude at the reference range r 0 from the target.
From Equation (7), the backscattered pressure amplitude at a range r’, referred to coordinate system no. 2, can be written as
P b s ( r , θ = π θ , φ = π + φ ) = P b s , 0 r 0 r e α ( r r 0 ) .
By inserting Equations (15), (16), and (25) into Equation (26), and setting r’ equal to the target range, r, the magnitude of the amplitude of the backscattered free-field sound pressure in the fluid, at the center of the transducer front, P b s = P b s ( r , θ = π θ , φ = π + φ ) , becomes
| P b s | = | P i , 0 | | B i ( θ , ϕ ) | r 0 r 2 e α ( 2 r r 0 ) σ b s | C i n ( r ) | | B r e l n ( r , θ , ϕ ) | .
Equation (27) gives the sound pressure amplitude in the fluid that is backscattered from a single target located at position ( r , θ , φ ) in the farfield, for the fundamental frequency component of the sound field, under conditions of finite-amplitude incident sound. The factor | C i n ( r ) | | B r e l n ( r , θ , φ ) | accounts for finite-amplitude effects on the incident axial pressure and beam pattern, and represents the deviation from the small-amplitude sound pressure.

2.2. Electroacoustic Transmit—Receive Transfer Functions for Single-Target Backscattering

In the following, Equation (27) is used to develop electroacoustic transmit–receive transfer functions for backscattering from a single target in the farfield, by accounting for (a) the transmit electrical power, (b) the transducer’s electroacoustic conversional efficiency, (c) the transmitting and receiving responses of the transducer, (d) the beam pattern upon reception, (e) farfield spherical reciprocity, (f) the input and output electrical impedances of the transducer, and (g) the input electrical impedance of the echo sounder’s receiving electronics.
Assume that the transducer is linear, passive, and reversible, and fulfills the reciprocity relationships [44]. The transmit voltage amplitude is thus assumed to be sufficiently small to avoid nonlinear effects in the transducer and the electronics. The transducer’s axial transmitting current response, S I , and free-field open-circuit receiving voltage sensitivity, M V , are given as [43,44]
S I = P i , 0 I T ,
M V = V 0 P b s = M V a x B i ( θ , φ ) ,
respectively. Here, I T is the input electric current amplitude delivered to the transducer during transmission. V 0 is the output voltage amplitude across the transducer’s electrical terminals at reception under open-circuit conditions. M V a x is the free-field open-circuit receiving voltage sensitivity for pressure waves incident along the acoustical axis (normally incident waves, θ = 0 , φ = 0 ). B i ( θ , φ ) is the beam pattern of the transducer upon reception, which is equal to the small-amplitude beam pattern upon transmission [44], and thus given by Equation (11).
Insertion of Equations (28) and (29) into (27) leads to the magnitude of the transmit–receive current-to-voltage transfer function under open-circuit conditions:
| V 0 I T | = | M V | | S I | | B i ( θ , ϕ ) | r 0 r 2 e α ( 2 r r 0 ) σ b s | C i n ( r ) | | B r e l n ( r , θ , ϕ ) | .
The transducer’s (one-way) electroacoustic conversion efficiency under conditions of small-amplitude and lossless sound propagation in the fluid is defined as
η = Π a Π T ,
where [43]
Π T = | V T | 2 R T 2 | Z T | 2 = 1 2 R T | I T | 2
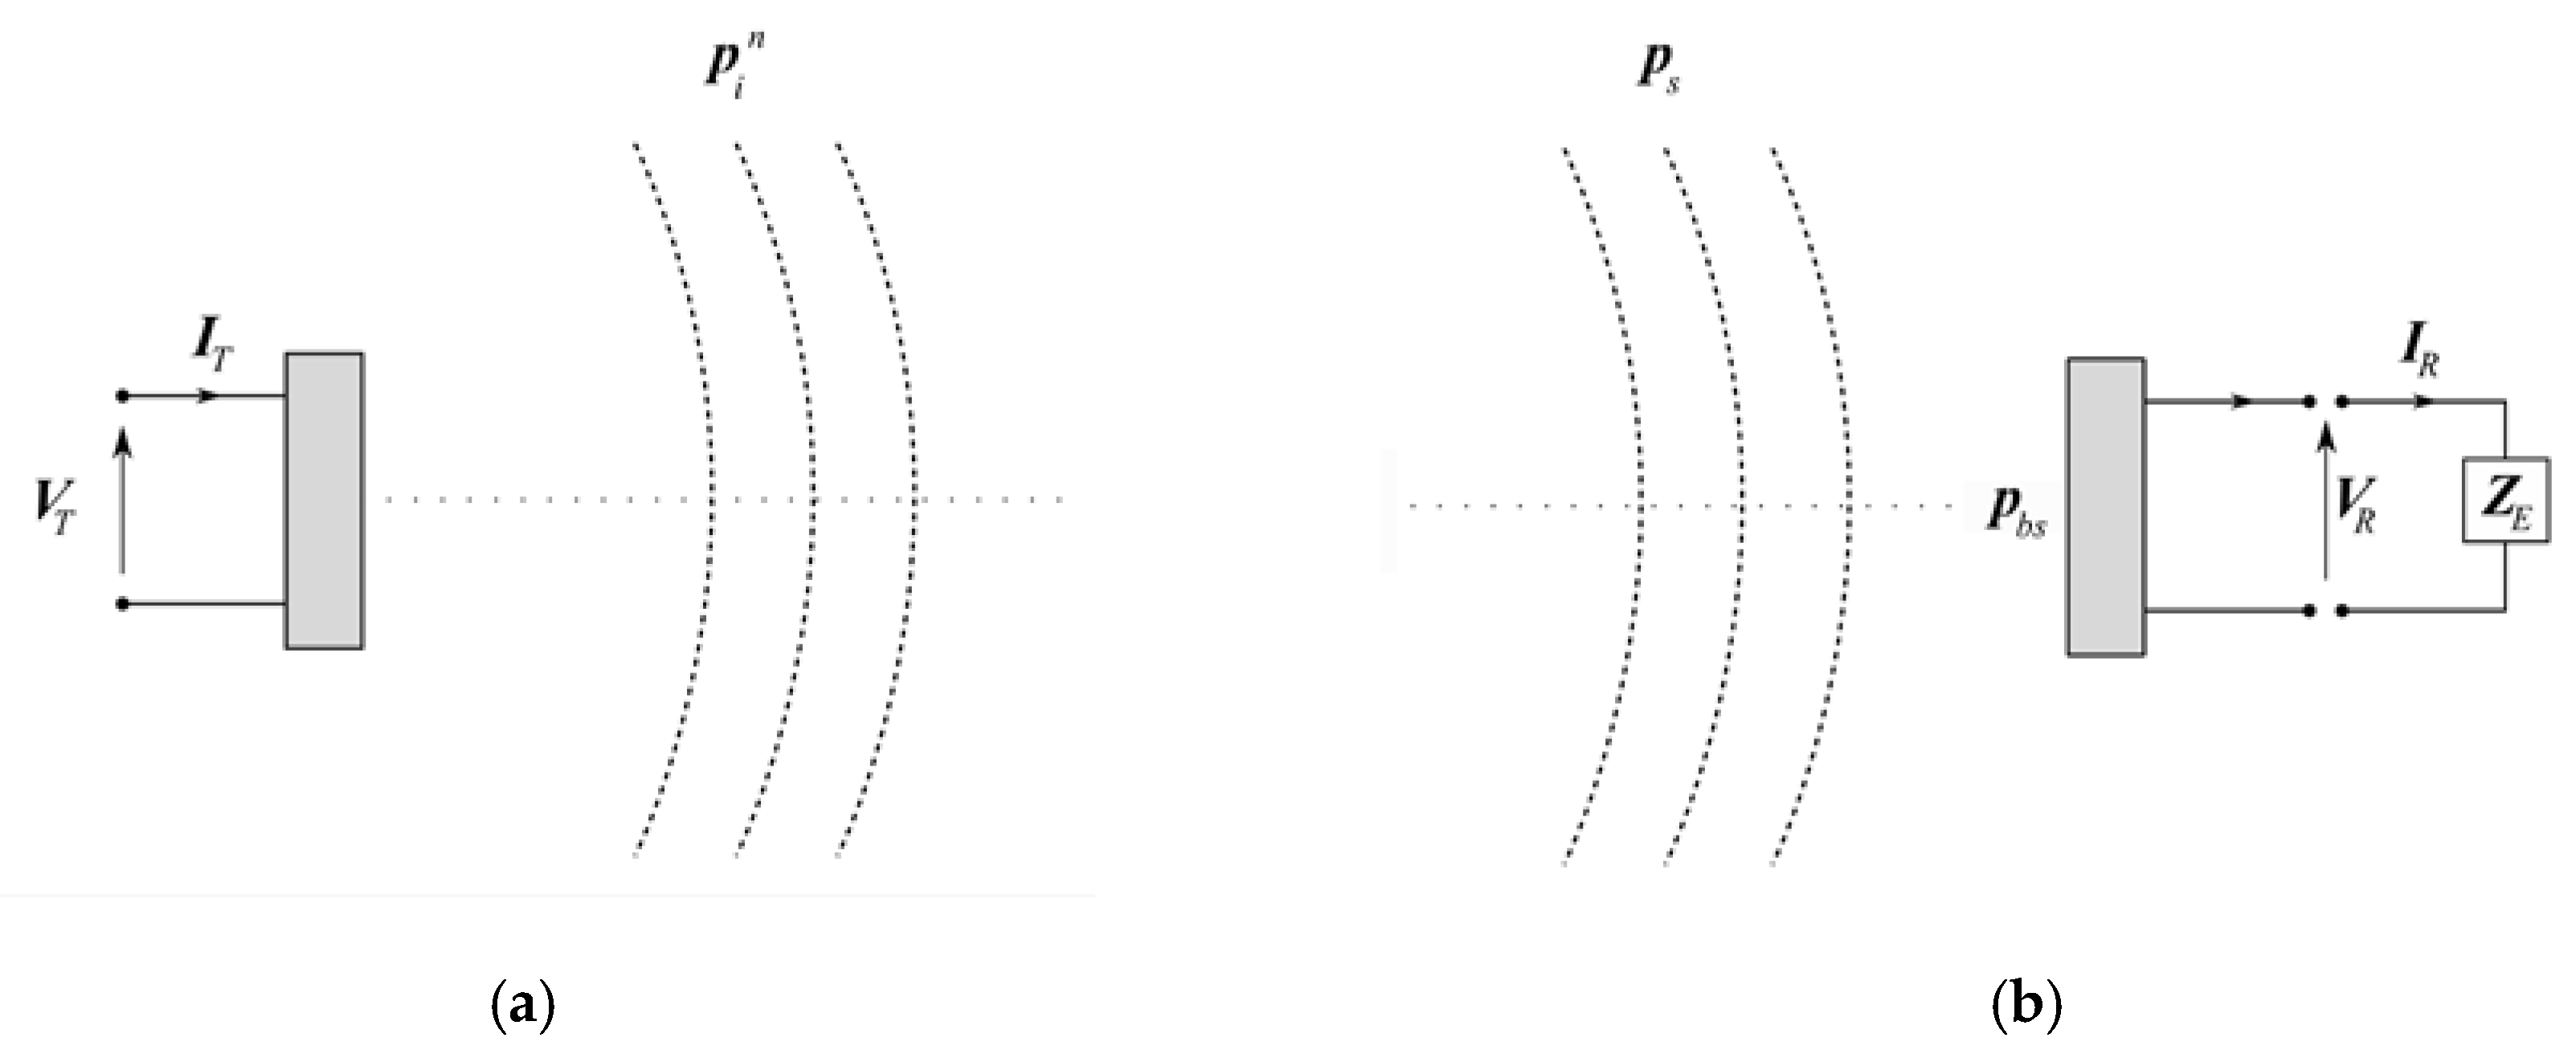
is the average electrical power delivered to the transducer during transmission, averaged over one vibration cycle of the monochromatic wave (here denoted “average transmit electrical power”). V T is the voltage amplitude across the transducer’s electrical terminals at transmission, and Z T V T / I T = R T + i X T is the transducer’s input electrical impedance when radiating into the fluid with resistance and reactance R T and X T , respectively, cf. Figure 3a. Π a is the average acoustic power radiated from the transducer into the fluid medium, averaged over one vibration cycle of the monochromatic wave, under conditions of small-amplitude and lossless sound propagation in the fluid, given in the farfield as [43]
Π a = 4 π | P i ( r , θ , φ ) | 2 e 2 α r 2 ρ 0 c 0 r 2 d Ω ,
where d Ω = sin θ d θ d φ is the unit solid angle.
Let D 0 and D ( θ , φ ) denote the axial directivity factor [43] and the directivity factor, respectively, for the transmitted (incident) sound field under conditions of small-amplitude and lossless sound propagation. These are defined as the dimensionless ratios of the transducer’s axial intensity, respectively the intensity in a given direction ( θ , φ ) to the intensity of an omnidirectional (point) source generating the same acoustic power, and can be expressed as [43]
D 0 = 4 π 4 π | B i ( θ , φ ) | 2 d Ω ,
D ( θ , φ ) = 4 π | B i ( θ , φ ) | 2 4 π | B i ( θ , φ ) | 2 d Ω = D 0 | B i ( θ , φ ) | 2 ,
respectively. Transducer gain, G ( θ , φ ) , and axial transducer gain (or “peak gain” [21]), G 0 , are defined as [20,21,45]
G ( θ , ϕ ) η D ( θ , ϕ ) = η 4 π   | B i ( θ , ϕ ) | 2 4 π | B i ( θ , ϕ ) | 2 d Ω = η D 0 | B i ( θ , ϕ ) | 2 ,
G 0 G ( 0 , 0 ) = η D 0 ,
respectively. G ( θ , φ ) and G 0 represent the transducer’s one-way electroacoustic conversion efficiency per unit solid angle, in the ( θ , φ ) and axial directions, respectively, for lossless and small-amplitude sound propagation conditions in the fluid (cf. Appendix B, interpretation 3). From Equations (5), (31), (33), and (37), one obtains
η = 2 π r 2 | P i ( r , 0 , 0 ) | 2 e 2 α r ρ 0 c 0 Π T D 0 .
Combining Equation (28) with Equations (32), (37), and (38) leads to
| S I | = G 0 R T ρ 0 c 0 4 π e α r 0 r 0
Since P i , 0 on which S I is based (cf. Equation (28)) is extrapolated from the transducer’s farfield, the spherical–wave reciprocity relationship applies, stating that7 [44,46]
M V a x S I = J s 2 r 0 λ i ρ 0 c 0 e i k r 0 e α r 0 ,
where J s is the spherical–wave reciprocity parameter, giving the relationship between the transmit and receive sensitivities of the echo sounder transducer (under the stated assumption that the transducer is linear, passive, and reversible, fulfilling the reciprocity relationships [44]). λ = c 0 / f is the acoustic wavelength in the fluid medium. Equations (29), (39), and (40) give
| M V | = G ( θ , φ ) λ 4 π 4 R T ρ 0 c 0
Insertion of Equations (39) and (41) into Equation (30) gives, for the magnitude of the open-circuit transmit–receive transfer function,
| V 0 I T | = 2 R T K n ( r , θ , φ ) ,
where
K n ( r , θ , φ ) G ( θ , φ ) λ 4 π e 2 α r r 2 σ b s | C i n ( r ) | | B r e l n ( r , θ , φ ) | .
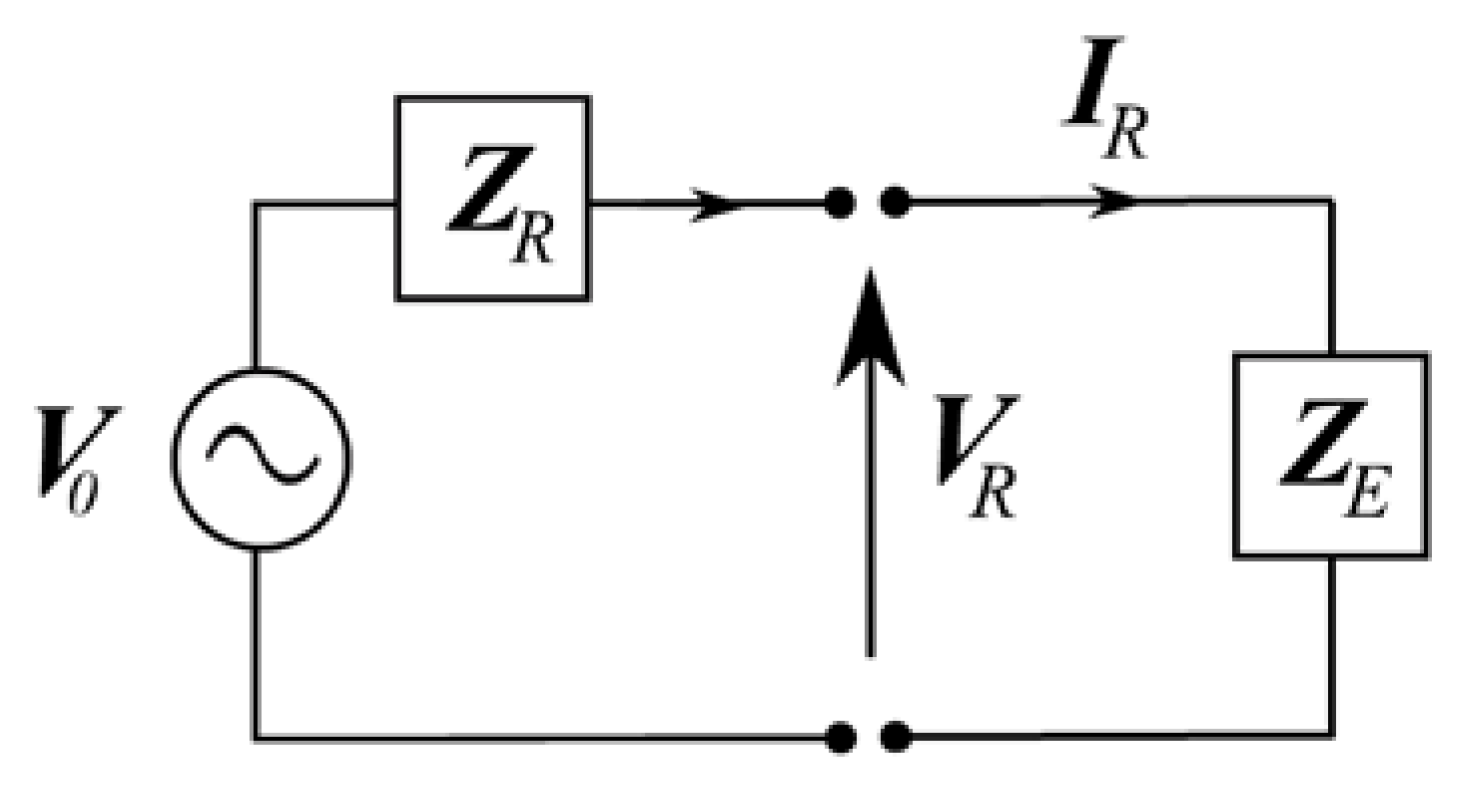
To include the effects of non-ideal electrical termination at the receiver (i.e., a finite electrical termination load), consider the situation indicated in Figure 3b, which can be represented electrically by the Helmholtz–Thevenin equivalent circuit shown in Figure 4. Here, Z R = R R + i X R is the output (internal) electrical impedance of the receiving transducer, and Z E V R / I R = R E + i X E is the input electrical impedance of the receiving electric network, involving resistances and reactances R R and X R , and R E and X E , respectively. For the transducer, the assumption Z R = Z T is often used, but for generality in the description, Z R is here distinguished from Z T . V R and I R are the voltage and current amplitudes at the transducer’s electrical terminals at reception for single-target backscattering. From Figure 4, V R is given by
V R V 0 = Z E Z R + Z E .
Insertion of Equation (44) and these electrical impedance definitions into Equation (42) yields
| V R V T | = F V V K n ( r , θ , φ ) ,   | I R I T | = F I I K n ( r , θ , φ ) ,
| V R I T | = F I V K n ( r , θ , φ ) ,   | I R V T | = F V I K n ( r , θ , φ ) ,
for the magnitudes of four transmit–receive transfer functions of interest, for a single target located at position ( r , θ , φ ) in the farfield. Here,
F V V 2 R T | Z E | | Z R + Z E | | Z T | ,   F I I 2 R T | Z R + Z E | ,
F I V 2 R T | Z E | | Z R + Z E | ,   F V I 2 R T | Z R + Z E | | Z T | ,
are electrical termination factors for the respective transfer functions in Equations (45). They represent the effect of the finite electrical termination load on the receiving transducer in terms of the electrical impedances of the transducer ( Z R ) and the receiving electronics network ( Z E ) [22]. Note that F V V and F I I are dimensionless, whereas F I V and F V I are given in units of Ω and Ω−1, respectively.

2.3. Electroacoustic Power Budget Equation for Single-Target Backscattering

The average electrical power delivered by the transducer to the receiving electronics, averaged over one vibration cycle of the monochromatic wave (here denoted “average received electrical power”), for single-target measurements, is given as [43]
Π R s t , n = | V R | 2 R E 2 | Z E | 2 .
Insertion of Equations (32) and (47) into the former of Equations (45a) yields the transmit–receive electrical power transfer function,
Π R s t , n Π T s t = F Π [ K n ( r , θ , ϕ ) ] 2 ,
where the (dimensionless) electrical termination factor for the electrical power transfer function is defined as [20]
F Π 4 R T R E | Z R + Z E | 2 .
Here, and in the following, the symbol Π T used in Equation (32) has been replaced by Π T s t , to distinguish between the transmit electrical powers used in single-target and volume backscattering situations (cf. Equation (54) and the accompanying text). Π T s t is the average transmit electrical power used in single-target measurements (e.g., sphere calibration and fish TS measurement) [22,23,24].
From Equations (48) and (43), the backscattering cross section of the single target is given as
σ b s = 16 π 2 r 4 e 4 α r Π R s t , n G 2 ( θ , ϕ ) λ 2 F Π Π T s t 1 | C i n ( r ) | 2 | B r e l n ( r , θ , ϕ ) | 2 .
Equation (48), or equivalently, Equation (50), is here denoted the “average power formulation” of the electroacoustic power budget equation for backscattering from a single target located at position ( r , θ , φ ) in the transducer’s farfield, for the fundamental frequency component of the received signal, under conditions of finite-amplitude incident sound. Appendix A.1 gives an interpretation of Equation (50) in terms of power “flow”.
It is noted that, under the assumptions used here (cf. Section 4.2), σ b s is a property of the scatterer, and is as such invariant to the sound pressure amplitude. The factor ( | C i n ( r ) | 2 | B r e l n ( r , θ , ϕ ) | 2 ) 1 in Equation (50) accounts for finite-amplitude effects in the axial pressure and beam pattern of the incident field, and represents the deviation from the small-amplitude case for σ b s . Thus, Π R s t , n accounts for the corresponding influence of finite-amplitude effects on the average received electrical power.

3. Volume Backscattering of Finite-Amplitude Incident Sound

Now, consider backscattering from a spherical shell volume in the farfield, V o b s (denoted “observation volume”), between ranges r min and r max , as shown in Figure 5. V o b s contains a distribution of scattering objects of different types (e.g., different types of fish, krill, and zooplankton). In the present section, Equation (50) is used to derive an expression for the volume backscattering coefficient, s v , for a spherical shell sub-volume, V p , in V o b s .

3.1. Electroacoustic Power Budget Equation for Volume Backscattering

In the following, assume that (a) the scattered echoes from different objects in V o b s have random phases, (b) multiple scattering effects and interaction between objects can be neglected, and (c) excess attenuation from power extinction [2] caused by volume scattering in V o b s (also referred to as the “shadow effect” [11]) can be neglected. Assumption (a) corresponds to random spacing of objects in one “ping”, and movement of the objects to the next “ping” [2,11]. Assumption (b) means that only echoes backscattered directly from the objects are significant, so that those backscattered via other objects (second-order effects) can be ignored [9,11,47]. Assumption (c) may be a reasonable approximation except for strong scatterers at high target densities distributed over an extended volume8 [9,11,48,49,50].
For a multitude of small objects in V o b s , the echoes from individual objects cannot be resolved, but combine to form a received voltage signal with varying amplitude. The echo intensity is still a measure of the biomass in the volume [1,4,11]. Under the above assumptions, the total echo intensity is the incoherent sum of the individual echo intensities [9]. The volume backscattering coefficient, s v , is the backscattering cross section per unit volume [2]. Consequently, for a multitude of scattering object types, s v can be calculated as a sum over backscattering cross sections of the individual types per unit volume [2,50] so that
s v lim Δ V 0 ( j = 1 N N j σ b s , j ) = lim Δ V 0 ( 1 Δ V j = 1 N m j σ b s , j ) .
Here, N is the number of scattering object types, Δ V is the unit volume, N j = m j / Δ V is the number of scattering objects of type j per unit volume, m j is the number of scattering objects of type j in Δ V , and σ b s , j is the backscattering cross section for an object of type j, j = 1, …, N.
From Equation (51), m j σ b s , j represents the total backscattering cross section for scatterers of type j in the unit volume Δ V . Consequently,
Δ σ b s j = 1 N m j σ b s , j
represents the total backscattering cross section over all scatterer types in the unit volume Δ V . From Equations (51) and (52), it follows that s v = lim Δ V 0 ( Δ σ b s / Δ V ) d σ b s / d V , so that
d σ b s = s v d V .
From Equations (51)–(53), it can be seen that d σ b s represents the backscattering cross section of a multitude of objects in the (infinitely small) unit volume dV, including objects of different types and objects of the same type with different sizes.
As explained in Section 2, Equations (48) and (50) apply not only to a single scattering object in the farfield, but also to a multitude of farfield objects of different types, materials, and sizes, confined to a sufficiently small volume in space, so that the backscatter at the transducer appears as if the scattering came from a single target in the farfield. Let the unit volume dV represent such a farfield “effective single target” containing a multitude of scattering objects. For backscattering from d V at range r in V o b s , Equations (48) and (43) thus yield
d Π R s t , n = Π T v F Π G 2 ( θ , ϕ ) λ 2 ( 4 π ) 2 e 4 α r r 4 | C i n ( r ) | 2 | B r e l n ( r , θ , ϕ ) | 2 d σ b s
for the average electrical power received due to volume backscattering from the unit volume d V . Here, the symbol Π T s t used in Equation (48) has been replaced by Π T v , the average transmit electrical power used in oceanic (field) surveys (volume scattering). In practice, Π T v = Π T s t is often used, but for generality in the description, Π T v is distinguished here from Π T s t .
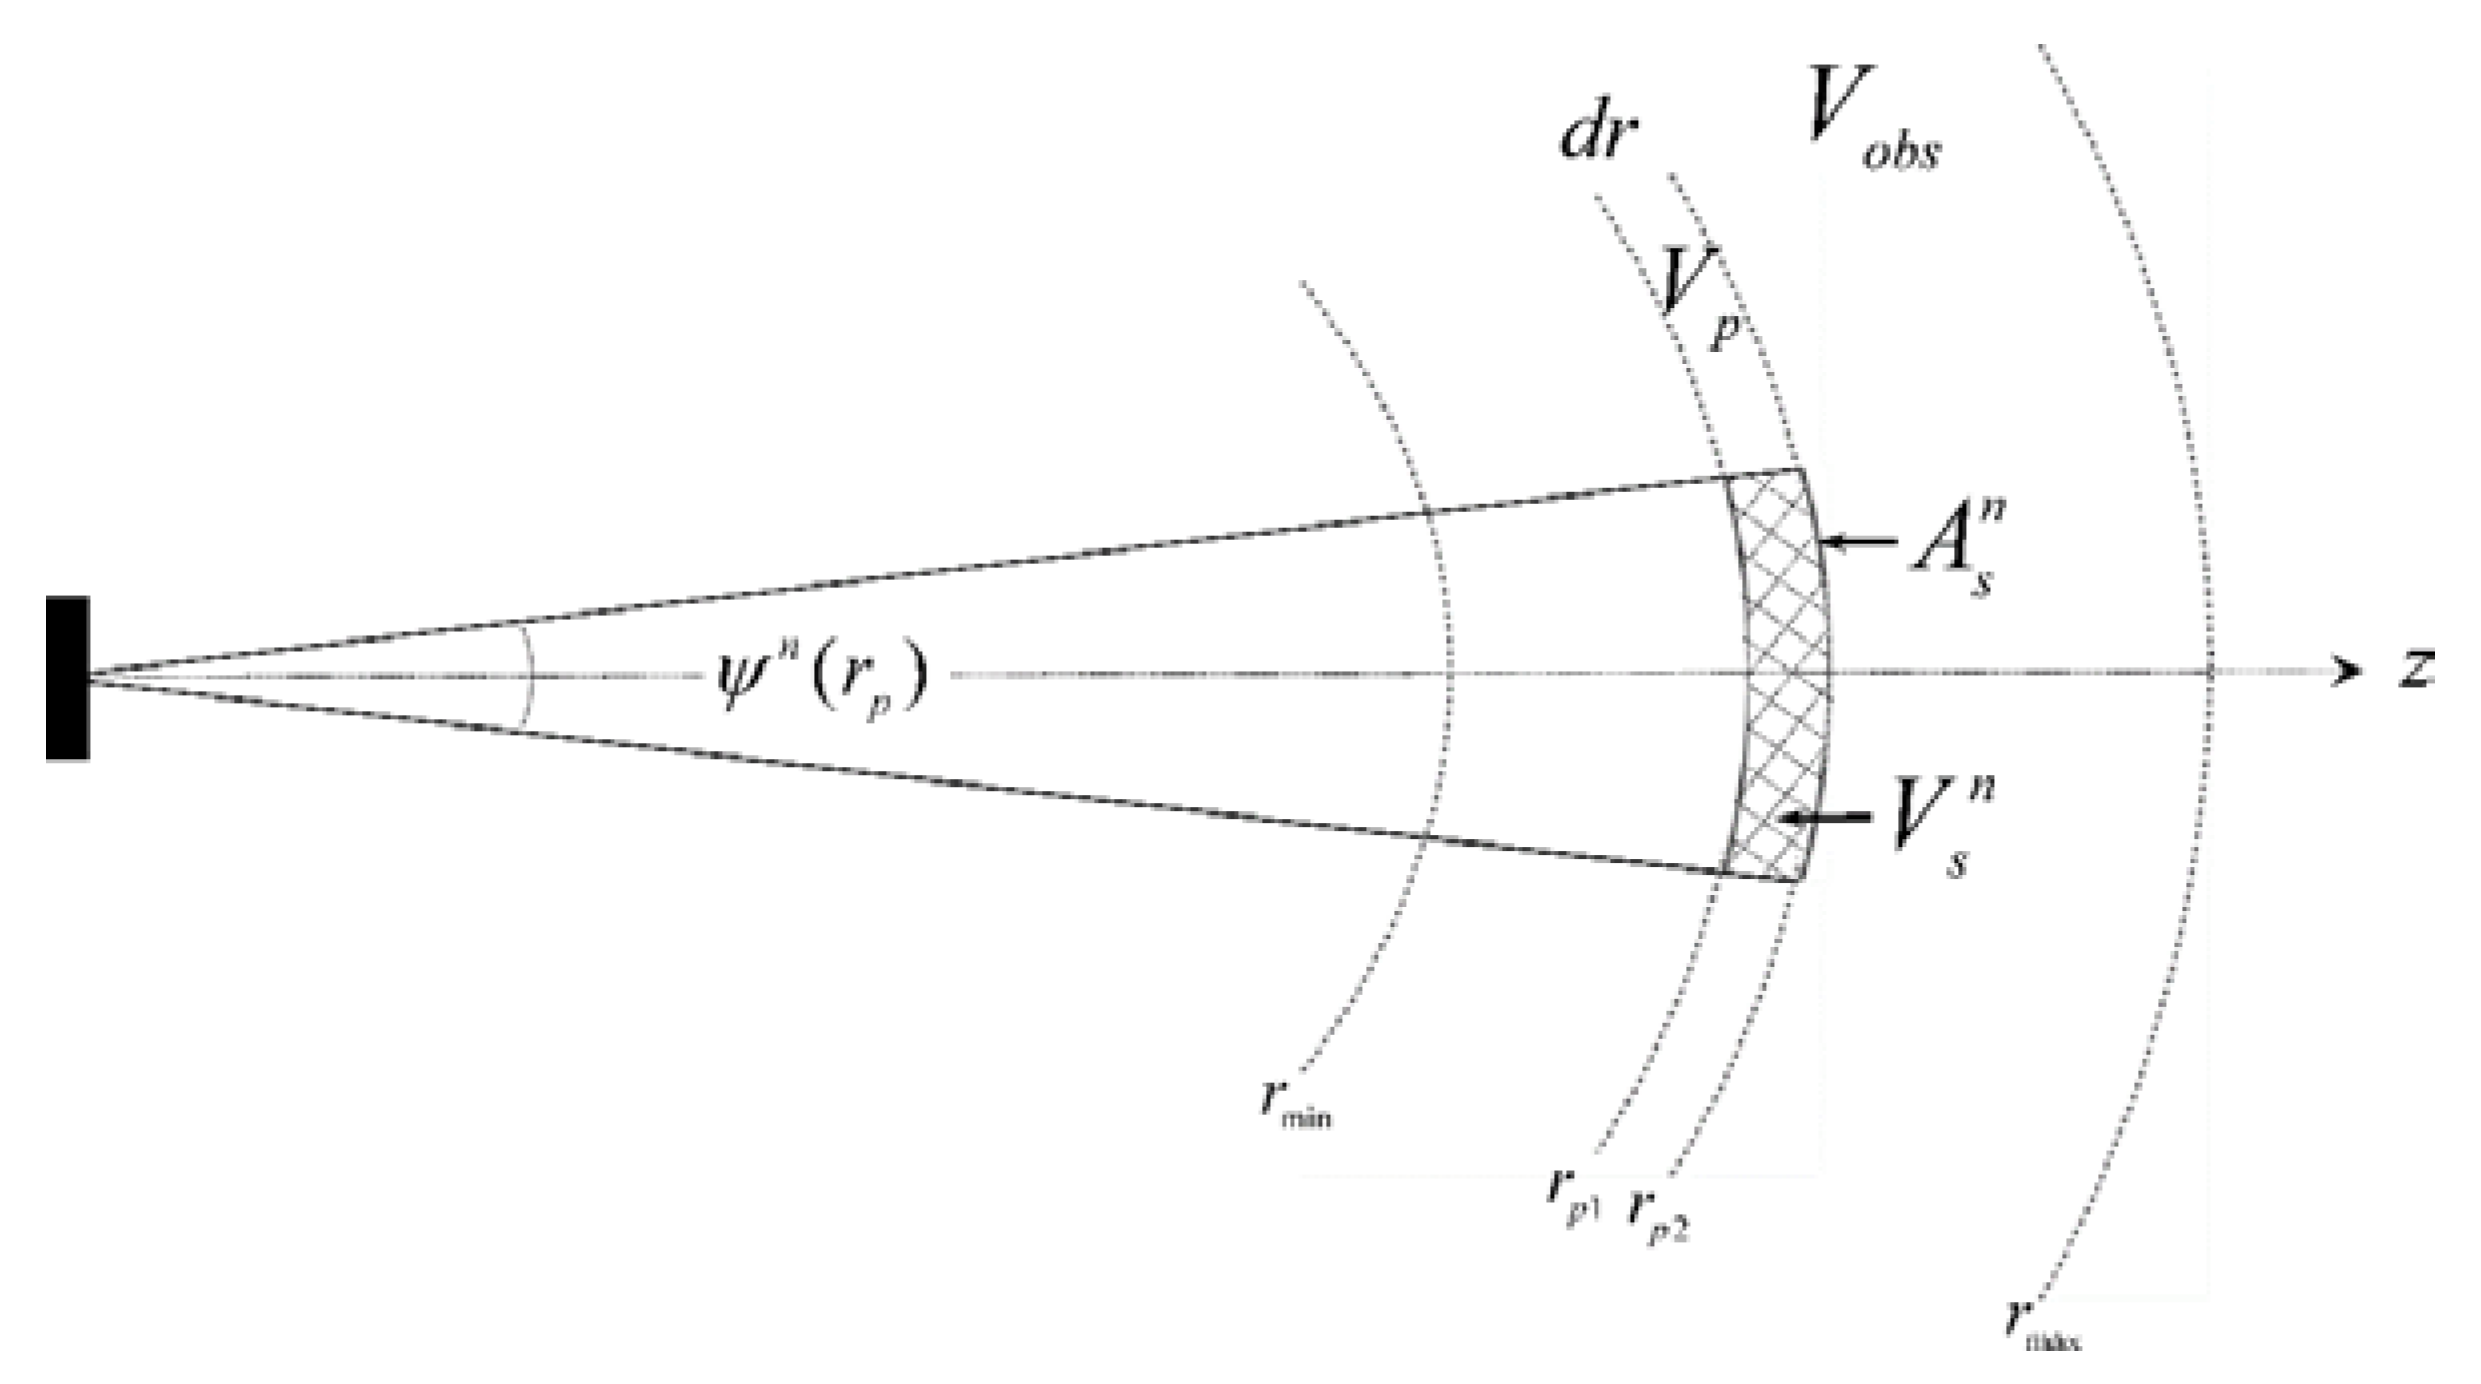
Now, assume that the observation volume V o b s in the farfield is insonified using a pulse (e.g., a tone burst, denoted here as “ping”) of time duration τ p and angular carrier frequency ω . The spatial extension of the pulse is c 0 τ p . Assume c 0 τ p < < r max r min . Within the spherical shell volume V o b s , the tone burst then covers a spherical shell sub-volume, V p (the “ping volume”), contained within ranges, say, r p 1 and r p 2 , cf. Figure 6. The arrival times for the start and end of the tone burst are t p 1 = 2 r p 1 / c 0 and t p 2 = 2 r p 2 / c 0 = t p 1 + τ p , respectively. The thickness of V p is d r = d r p r p 2 r p 1 = 1 2 c 0 τ p (i.e., 0.75 m for a 1 ms pulse, often used in practice).
Assume a uniform distribution of scattering objects in the volume V p , so that d σ b s as given by Equation (53) can be used everywhere in V p . In practice, this means that backscatter is assumed to be the same anywhere in the “sampled volume” V s n , which represents that portion (sub-volume) of V p that is effectively insonified by the acoustic beam upon radiation and reception combined [23], cf. Figure 6 and Appendix A.2. That is, the intersection of the spherical shell volume V p and the solid angle ψ n ( r p ) (to be defined by Equation (58)).
Integration of Equation (54) over V p , substitution of Equation (53), and using d V = r 2 d r d Ω , yields, for the average electrical power received due to volume scattering from V p ,
Π R v , n ( r p ) V p d Π R s t , n = V p Π T v F Π λ 2 ( 4 π ) 2 G 2 ( θ , ϕ ) e 4 α r r 4 | C i n ( r ) | 2 | B r e l n ( r , θ , ϕ ) | 2   s v ( r )   d V = Π T v F Π λ 2 ( 4 π ) 2 4 π G 2 ( θ , ϕ ) r p 1 r p 2 e 4 α r r 2 | C i n ( r ) | 2 | B r e l n ( r , θ , ϕ ) | 2 s v ( r ) d r   d Ω Π T v F Π λ 2 ( 4 π ) 2 e 4 α r p r p 2 c 0 τ p 2 | C i n ( r p ) | 2 s v ( r p ) 4 π G 2 ( θ , ϕ ) | B r e l n ( r p , θ , ϕ ) | 2 d Ω ,
where r r p ( r p 1 + r p 2 ) / 2 is the mid-radius range of V p .
The simplifications made in Equation (55) may need a comment. As explained above, the unit volume dV represents a farfield “effective single target” containing a multitude of scattering objects, sufficiently small so that the backscatter at the transducer appears as if the scattering came from a single target. d σ b s represents the backscattering cross section of this “effective single target”. In the derivation of Equation (55), the integration over “effective single targets” represented by d σ b s in the (thin) spherical shell volume V p has (by substituting Equation (53)) been replaced by volume integration using the unit volume d V = r 2 d r d Ω , so that the integration over V p is now made in terms of the range r and solid angle Ω of the spherical coordinate system. Since d V = r 2 d r d Ω , dV is limited in space by the unit thickness dr and the unit solid angle, d Ω = sin θ d θ d φ . To arrive at the final expression of Equation (55), s v has been (a) assumed to be independent of Ω (i.e., the polar and azimuthal angles) within V p (in practice within the sub-volume V s n ), and (b) approximated by its mid-radius range of V p , r r p . For this simplification to be valid, it has thus been assumed that the ratio d σ b s /dV (= s v ) is independent of Ω (i.e., the polar and azimuthal angles) within V p . Since dV contains a multitude of objects (including objects of different types, and objects of the same type with different sizes), this assumption corresponds to assuming a uniform distribution of the scattering objects within V p (in practice within V s n ).
For convenience, the subscript “p” in r p is hereafter understood and omitted (with some exceptions). As should be clear, integration over the range r in the finite volume V o b s ( r min to r max ) has not been carried out at this stage. (This range integration is accounted for in the calculation of the fish density contained in V o b s , ρ a , cf. Equation (3) [22]).

3.2. Volume Backscattering Coefficient

By rearranging Equation (55) to solve for s v , one obtains for volume scattering from the “ping volume” V p , at distance r r p ,
s v = 32 π 2 r 2 e 4 α r Π R v , n G 0 2 ψ λ 2 c 0 τ p F Π Π T v 1 | C i n ( r ) | 2 ψ r e l n ( r ) ,
where the definitions and relationships
ψ 4 π | B i ( θ , φ ) | 4 d Ω = 1 G 0 2 4 π G 2 ( θ , φ ) d Ω ,
ψ n ( r ) 4 π | B i ( θ , ϕ ) | 2 | B i n ( r , θ , ϕ ) | 2 d Ω = 1 G 0 2 4 π G 2 ( θ , ϕ ) | B r e l n ( r , θ , ϕ ) | 2 d Ω ,
ψ r e l n ( r ) ψ n ( r ) ψ ,
have been used, and the latter of the two expressions given in each of Equations (57) and (58) follow from Equations (36), (37), and (15). ψ and ψ n ( r ) are the equivalent two-way beam solid angles of the transducer, under conditions of small-amplitude and finite-amplitude incident sound, respectively. Whereas ψ is commonly used, e.g., in the fisheries and marine acoustics literature [2,6,9,11,20,21,22,23,24,25,26,27,28,31,32,33,34] and is normally provided by the echo sounder manufacturer, ψ n ( r ) has been introduced [20] as a range-dependent generalization of ψ to account for finite-amplitude effects. (The equivalent two-way beam solid angle, ψ (also denoted the “integrated beam width [2], or “integrated beam pattern” [9]), represents the effective beam width of the transducer’s intensity field in terms of a solid angle for the combined effect of transmission and reception [11].)
The “beam solid angle finite-amplitude factor”, ψ r e l n ( r ) , is introduced here as a measure of the transducer’s two-way effective beam width (in terms of a solid angle), at finite-amplitude relative to under small-amplitude conditions. ψ r e l n ( r ) 1 for small-amplitude incident waves, and ψ r e l n ( r ) > 1 under finite-amplitude conditions. ψ r e l n ( r ) depends on range, r, since the flattening of the main lobe due to finite-amplitude effects increases with increasing r until the wave amplitude eventually becomes so small that further flattening is negligible [16,17,19,20]. Hence, at long ranges ψ r e l n ( r ) becomes approximately constant for a given frequency and source level.
The latter expression in Equation (55), or equivalently, Equation (56), is denoted the “average power formulation” of the electroacoustic power budget equation for volume backscattering, for the fundamental frequency component of the received signal, under conditions of finite-amplitude incident sound. It applies to the thin spherical shell sub-volume V p (the “ping volume”) of thickness d r p = 1 2 c 0 τ p and range r r p in the observation volume V o b s . An interpretation of Equation (56) in terms of power “flow” is given in Appendix A.2.
Under the assumptions used here (cf. Section 4.2), s v is a property of the scatterers in V p , at range r, and is as such invariant to the sound pressure amplitude. The factor ( | C i n ( r ) | 2 ψ r e l n ( r ) ) 1 in Equation (56) accounts for finite-amplitude effects in the axial pressure and beam pattern of the incident field, and represents the deviation from the small-amplitude case, for s v . Π R v , n accounts for the corresponding influence of finite-amplitude effects on the average received electrical power.

4. Discussion

4.1. Consistency with Prior Literature

Consistency of Equations (50) and (56) with prior literature is described in the following for small-amplitude (Section 4.1.1) and finite-amplitude (Section 4.1.2) signals.

4.1.1. Small-Amplitude Signals (Linear Sound Propagation)

For a sufficiently small amplitude of the transmitted field so that the sound propagation is governed by the linearized set of acoustic field equations, P i n ( r , 0 , 0 ) reduces to P i ( r , 0 , 0 ) , given by Equation (12); C i n ( r ) defined by Equation (13) reduces to 1; B i n ( r , θ , φ ) defined by Equation (8) reduces to B i ( θ , φ ) , given by Equation (11); and P i n ( r , θ , φ ) defined by Equation (5) reduces to P i ( r , θ , φ ) , given by Equation (10). Consequently, B r e l n ( r , θ , φ ) defined by Equation (15) reduces to 1; and ψ n ( r ) defined by Equation (58) reduces to ψ , given by Equation (57). ψ r e l n ( r ) given by Equation (59) thus reduces to 1.
It follows that, for small-amplitude acoustic signals, Equations (50) and (56) reduce to
σ b s 16 π 2 r 4 e 4 α r Π R s t G 2 ( θ , ϕ ) λ 2 F Π Π T s t ,
s v 32 π 2 r 2 e 4 α r Π R v G 0 2 ψ λ 2 c 0 τ p F Π Π T v ,
respectively. Here, Π R s t and Π R v are the values to which the quantities Π R s t , n and Π R v , n reduce for small-amplitude signals. If Π T s t = Π T v = Π T , i.e., the same electrical transmit power is used in calibration and survey operations, Equations (60) and (61) become identical to the expressions that were derived under the assumption of small-amplitude (linear) sound propagation [22,23,24].
Furthermore, if F Π = 1 , Equations (60) and (61) become identical to Equations (1) and (2). As discussed in [22,23], this corresponds to specific cases of electrical termination: either (i) Z E = Z R * (i.e., conjugate matched electrical termination, to maximize power transfer from the transducer to the receiving electronic circuit); or (ii) Z E = Z R and X T = 0 Ω (to minimize signal reflections from the receiving electronic circuit in a frequency band close to the series resonance frequency of the transducer vibration mode used).
Consistency with the conventional generic power budget equations is discussed first. In the Simrad EK500 manual [21], expressions for the spherical scattering cross section [2,10] 4 π σ b s and the function s v / r 1 2 (somewhat incorrectly referred to as volume backscattering strength, which is defined [10] as S v 10 log ( s v r 1 ) ) were derived, where r 1 is a reference range (chosen to be equal to 1 m). These expressions correspond to Equations (1) and (2). Electrical termination and impedances were not addressed, which implicitly corresponds to setting F Π equal to 1 as discussed above. Apart from the missing factor F Π , and the absence of distinguishing between Π R s t and Π R v , and between Π T s t and Π T v , Simrad’s expressions [21] are consistent with Equations (60) and (61).
Pedersen [20] was the first to account for arbitrary electrical termination at the receiver, and derived average power expressions for σ b s and s v that include the factor F Π . Apart from the fact that Pedersen did not distinguish between Π R s t and Π R v , and between Π T s t and Π T v , his Equations (2.26) (slightly rearranged) and (2.35) for small-amplitude sound propagation conditions are identical to Equations (60) and (61), respectively.
Regarding comparison with alternative power budget equations, alternative small-amplitude power-budget equations have been proposed in [11,26,27,28]. These theories are, however, either incomplete or not consistent with [20,21,22,23,24], as discussed in the following.
Simmonds and MacLennan [11] postulated power budget equations (their Equations (3.13) and (3.15)) that (when using s v = m σ b s ) can be re-arranged to yield expressions for σ b s and s v . Here, m is the number of targets (fish) per unit volume. Apart from an apparent sign misprint in the absorption term (the exponent) of their Equation (3.15), these expressions for σ b s and s v are both lacking a factor ( λ / 4 π ) 2 to be consistent with Equations (60) and (61), as well as with [20,21,22,23,24,25,26,27,28]. This is due to a missing factor λ 2 / 4 π involved in the transducer’s “effective receiving area” (cf. Appendix A.2 and Appendix C), and a missing factor ( 4 π ) 1 needed to describe conservation of power upon transmission in lossless media, cf. Appendix A.2. Electrical termination was not addressed, implicitly implying F Π = 1 as discussed above.
Demer and Renfree [26], with reference to the EK500 manual [21], gave expressions for the spherical scattering cross section 4 π σ b s and the function s v / r 1 2 (which somewhat misleadingly were referred to as the backscattering cross section and the volume backscattering coefficient, respectively). In their expression for 4 π σ b s , G 0 2 was used instead of G 2 ( θ , φ ) , implying that the equation is limited to a single target (e.g., a calibration sphere, or an individual fish) on the acoustical axis only. Electrical termination was not addressed, implicitly implying F Π = 1 as discussed above.
Ona et al. [27] postulated expressions for σ b s and s v in logarithmic (dB) form. By converting their logarithmic expression for s v to normal units, it contains (in terms of the terminology used here) a factor τ p s a , c o r r 2 in the denominator instead of the transmitted pulse duration τ p appearing in Equation (61) [23,24]. τ p and s a , c o r r (   1 2   10 log ( s a , c o r r 2 ) ) were referred to as the “nominal pulse duration” and the “integration correction”, respectively. The apparent “ad hoc” introduction of S a , c o r r in the expression for s v was not explained nor motivated, except for a statement that “the sum of τ p and S a , c o r r equals the effective pulse duration”. In [23,24], the use of the factor S a , c o r r has been explained and justified. However, as also shown in [23,24], there seems to be some inconsistencies in the expressions given in [27] with respect to transmit and receive electrical power in relation to echo integration and the use of G 0 and G ( θ , φ ) .
As the expressions for σ b s and s v derived and used in [28] correspond exactly to those postulated in [27], the above discussion also applies to [28], cf. [23,24].
The mentioned issues with [11,26,27,28] have thus been addressed and resolved [23,24]. If the inconsistencies in [11,27,28] were corrected, and the limitations in [26] avoided, as derived and explained in [23,24], the expressions would become consistent with Equations (60) and (61). It has been found [23,24] that for small-amplitude sound propagation conditions, Equations (60) and (61) are the correct expressions under assumptions commonly used in fisheries acoustics (cf. Section 4.2).
It follows that Equations (50) and (56) represent a consistent generalization of single-target and volume backscattering theory for small-amplitude sound propagation conditions and conditions of finite-amplitude incident sound.

4.1.2. Finite-Amplitude Signals (Nonlinear Sound Propagation)

Power budget expressions for σ b s and s v in average power form that account for finite-amplitude effects have been addressed by [20,36,37].
As discussed in Section 1.2, Pedersen [20] proposed a finite-amplitude expression for s v , cf. Section 7.1.2 in [20]. A sufficiently detailed derivation of this model was, however, not given, and no explicit finite-amplitude expression was given for σ b s , although nonlinear effects in echo sounder calibration were discussed and accounted for, cf. Section 7.1.2 in [20].
Lunde and Pedersen [36] presented expressions for σ b s and s v which in the terminology used here become
σ b s = 16 π 2 r 4 e 4 α r Π R s t , n G T , n ( r , θ , ϕ ) G R ( θ , ϕ ) λ 2 F Π Π T s t ,
s v = 32 π 2 r 2 e 4 α r Π R v , n G 0 T , n ( r ) G 0 R ψ n ( r ) λ 2 c 0 τ p F Π Π T v ,
where [36]
G T , n ( r , θ , ϕ ) G 0 T , n ( r ) | B i n ( r , θ , ϕ ) | 2 ,
G R ( θ , ϕ ) G 0 R | B i ( θ , ϕ ) | 2 ,
G 0 T , n ( r ) G T , n ( r , 0 , 0 ) = η D 0 | C i n ( r ) | 2 ,
G 0 R G R ( 0 , 0 ) = η D 0 ,
ψ n ( r ) = 1 G 0 T , n ( r ) G 0 R 4 π G T , n ( r , θ , ϕ ) G R ( θ , ϕ ) d Ω ,
and the superscripts “T” and “R” denote one-way “transmit” and “receive” transducer gains, respectively. As mentioned above (Section 1.2), the mathematical derivation leading to these expressions [36] has not been published.
Equation (63) can be shown to be equivalent to the expression for s v proposed by Pedersen [20] to account for finite-amplitude incident sound. This is seen by introducing his Equations (7.3) and (7.4) into his Equation (7.1), as indicated in [20]. The resulting s v expression was, however, not given explicitly by Pedersen.
From Equations (64)–(68), (15), and (36)–(37), one has
G T , n ( r , θ , ϕ ) G R ( θ , ϕ ) = G 2 ( θ , ϕ ) | C i n ( r ) | 2 | B r e l n ( r , θ , ϕ ) | 2 ,
G 0 T , n ( r ) G 0 R ( θ , ϕ ) ψ n ( r ) = G 0 2 ψ | C i n ( r ) | 2 ψ r e l n ( r ) .
Equations (62) and (63) are thus identical to Equations (50) and (56), respectively.
It follows that the average power formulations of the power budget equations derived here are equivalent to the power budget expressions given (without sufficient detailed and documented derivations, however) for s v by Pedersen [20], and for σ b s and s v by Lunde and Pedersen [36]. The present theory thus constitutes a derivation also of those expressions.

4.2. Summary of Assumptions Underlying the Analysis

In Section 2 and Section 3, a number of assumptions have been used to derive the expressions for backscattering cross section, σ b s , and volume backscattering coefficient, s v , Equations (50) and (56), respectively. With some exceptions (cf. (d) below), these are the same as those summarized in [22,23,24] for small-amplitude sound propagation. The assumptions used here include: (a) the monostatically operated transducer is passive, reversible, and reciprocal, fulfilling the reciprocity relationships [44]; (b) the transmit voltage amplitude is sufficiently small to avoid nonlinear effects in the electroacoustic transducer and electronics (i.e., the transducer and electronics are operated in their linear ranges); (c) the fluid medium is homogeneous, with constant density and sound velocity; (d) finite-amplitude sound propagation effects in seawater are influent only for the forward-radiated (incident) sound pressure wave; (e) targets are stationary during a single transmission, and of any shape; (f) targets are in the farfield of the transducer; (g) possible nonlinear effects in the scattering process at the target itself (involving, e.g., fish with a gas-filled swim-bladder) can be neglected, so linear backscattering theory applies; (h) the volume backscattering coefficient can be calculated as a sum of backscattering cross sections per unit volume; (i) the scattering objects are uniformly distributed in the insonified (“sampled”) part of the observation volume, with (j) random phases of the scattered echoes (i.e., random spacing of scattering objects, and movement of objects from one transmission to the next); (k) possible multiple-scattering effects and interaction between objects are neglected; and (l) excess attenuation from power extinction caused by volume scattering is neglected.
Except for (d), these are all common assumptions underlying models used in fish abundance measurement [1,2,3,4,5,6,7,8,9,10,11,12,13,14,20,21,22,23,24,25,26,27,28,29,30]. Assumptions (a) and (b) relate to the transducer and electric components of the echo sounder system. Assumption (g) is discussed elsewhere [51]. Assumptions (h)–(l) are included in the set of assumptions used by Clay and Medwin [2,9] to derive the analogous small-amplitude “in-water” expressions for s v , accounting for acoustic pressures in the sea only. Relatively extensive discussions on the validity of (h)–(l) are given in other studies [2,9,11], which also summarize key literature in this field.
The discussion of the validity of these assumptions is an extensive and complex subject, beyond the scope of this article. One objective here was to clearly point out the assumptions on which the theory relies, and at which step in the derivation each of them is applied, as described in Section 2 and Section 3.

5. Conclusions

The conventional and generic small-amplitude power budget equations for fish abundance estimation and species identification, Equations (1) and (2) [21,25], and further developments of that theory [20,22,23,24], have been generalized to account for effects of finite-amplitude sound propagation in the transmitted (incident) sound field for the fundamental frequency component of the received signal. Expressions are derived for the backscattering cross section, σ b s , and the volume backscattering coefficient, s v , in terms of power budget equations for single-target and volume backscattering, respectively, averaged over a cycle of a monochromatic wave. These expressions, given by Equations (50) and (56), constitute a generic functional relationship for abundance measurement under conditions of finite-amplitude incident sound, accounting for possible finite-amplitude effects in at-sea echo sounder calibration, in survey operation, or both. Arbitrary electrical termination, and the range of electrical and acoustical echo sounder parameters involved in calibration and oceanic surveying, are accounted for.
For finite-amplitude signals, the expressions for σ b s and s v derived here, Equations (50) and (56), are shown to be equivalent to expressions that were previously proposed [20,36,37] without sufficiently detailed and documented derivations. Consequently, the present analysis represents a derivation of, and theoretical fundament, also for those expressions.
For small-amplitude signals, Equations (50) and (56) reduce to Equations (60) and (61), which correspond to expressions derived elsewhere [20,22,23,24] under such conditions. These expressions are consistent with the conventional generic power budget equations for fish abundance estimation, Equations (1) and (2) [21,25], and generalize those expressions to account for arbitrary electrical termination.
The establishment of equations for σ b s and s v with such capabilities enable the evaluation of errors caused by finite-amplitude effects in abundance estimation and species identification. Such error analysis can be based on measurements or calculations, or both. For actual transducers or echo sounders, the functions | C i n ( r ) | and | B i n ( r , θ , φ ) | , and thus | B r e l n ( r , θ , φ ) | , ψ n ( r ) , and ψ r e l n ( r ) , can—for relevant transmit electrical power levels—be measured in controlled tank or laboratory experiments, in addition to the measurements of | B i ( θ , φ ) | and ψ routinely provided by echo sounder manufacturers. Alternatively, they can be calculated using numerical models.
These capabilities provide a fundament to avoid, or, if necessary, to compensate for such errors. This includes the future establishment of recommended upper limits for echo sounder transmit electrical power levels to obtain a controlled reduction of finite-amplitude errors in calibration and surveying. It also enables the development of correction factors for oceanic survey data (current or historic) already subject to finite-amplitude errors [20,36]. The consequences of the theory and results presented here—e.g., in terms of evaluation of measurement errors, power recommendations, and correction factors, accounting for echo sounder calibration prior to survey operation and the survey operation itself—are to be addressed elsewhere.
The finite-amplitude effects of the type addressed here, and the associated errors in fishery research [15,16,17,18,19,20,36,37], originate from the properties of the fluid propagation medium (in this case, seawater) and apply to sonar and echo sounder technology in general, irrespective of manufacturer.
Although this article was motivated by challenges in fisheries acoustics and abundance estimation, and is primarily related to finite-amplitude effects, the equations presented here are quite general and are not limited to this field. Under the assumption of validity of the assumptions stated in Section 4.2, the theory and results also apply to the use of echo sounders and sonar for the measurement of acoustic single-target and volume backscattering more generally, for cases where finite-amplitude effects of the incident field are significant, as well as for conditions of small-amplitude sound propagation.

Funding

This research received no external funding.

Acknowledgments

Audun O. Pedersen, Christian Michelsen Research AS, Bergen, Norway (currently with ClampOn, Bergen); Magne Vestrheim, University of Bergen, Dept. of Physics and Technology; Rolf J. Korneliussen, Institute of Marine Research, Bergen; and Frank E. Tichy, Kongsberg Maritime AS, Horten, Norway, are acknowledged for useful discussion related to fisheries acoustics.

Conflicts of Interest

The author declares no conflict of interest. The funders had no role in the design of the study; in the collection, analyses, or interpretation of data; in the writing of the manuscript, or in the decision to publish the results”.

Appendix A. Interpretation in Terms of Power “Flow”

In the following, Equations (50) and (56), representing the average power formulations of σ b s and s v , are interpreted in terms of power propagation (or “flow”) through the electroacoustic transmit–scattering–receive system [52]. The description represents a generalization of Appendix B of [23]—which is applicable to small-amplitude propagation only—to the case of finite-amplitude sound propagation. The description is chosen to relatively closely follow the wording used in Appendix B of [23] to clarify and enable convenient identification of similarities and differences between the two cases of small and finite-amplitude sound propagation in the fluid medium.

Appendix A.1. Single-Target Backscattering

For physical interpretation of the various terms in the power budget equation for single-target backscattering, Equation (50), the following re-arrangement is convenient:
Π R s t , n = Π T s t G ( θ , ϕ ) e 2 α r 4 π r 2 | C i n ( r ) | 2 | B r e l n ( r , θ , ϕ ) | 2 σ s p h e 2 α r 4 π r 2 G ( θ , ϕ ) λ 2 4 π F Π ,
where σ s p h = 4 π σ b s is the spherical scattering cross-section [2,10] for the equivalent omnidirectional scatterer of the single target.
Π T s t is the transmitted electrical power, averaged over one cycle of the monochromatic wave, at the angular frequency ω in question. Multiplying with G ( θ , φ ) gives the acoustic power produced by a point source radiating an (omnidirectional) intensity that is equal to the transducer’s radiated intensity in the ( θ , φ ) direction at range r under lossless and small-amplitude sound propagation conditions in the fluid, cf. Appendix B (Equation (A4) and Interpretation 2). Multiplying with e 2 α r / 4 π r 2 yields the transducer’s radiated intensity at the target position, ( r , θ , φ ) , under small-amplitude conditions, and with absorption accounted for. | C i n ( r ) | 2 | B r e l n ( r , θ , φ ) | 2 accounts for finite-amplitude axial and beam pattern effects of the incident sound field at the target position. Multiplication with σ s p h gives the acoustic power scattered by the target, represented here by the target’s equivalent omnidirectional scatterer. Multiplying with e 2 α r / 4 π r 2 yields the free-field acoustic power density (i.e., the intensity) of the scattered field at the centre of the transducer front, with absorption accounted for. Multiplication with the “effective receiving area” (cf. Appendix C) of the receiving transducer, G ( θ , φ ) ( λ 2 / 4 π ) , yields the received electrical power at the transducer’s electrical terminals for the particular electrical termination case F Π = 1 (e.g., for (i) Z E = Z R * ; or (ii) Z E = Z R and X T = 0 Ω; cf. Section 4.1.1). Finally, multiplying with F Π = 4 R T R E / | Z R + Z E | 2 (cf. Appendix C) yields the average received electrical power Π R s t , n at the transducer’s electrical terminals for an arbitrary electrical termination load.

Appendix A.2. Volume Backscattering

Similarly, for physical interpretation of the various terms in Equation (56), the power budget equation describing volume backscattering from the spherical shell subvolume V p , is conveniently made using the re-arrangement
Π R v , n = Π T v G 0 e 2 α r 4 π r 2 | C i n ( r ) | 2 σ s p h v , n e 2 α r 4 π r 2 G 0 λ 2 4 π F Π ,
where V p 4 π r p 2 ( r p 2 r p 1 ) = 4 π r p 2 d r p = 4 π r p 2 1 2 c 0 τ p and the definition
σ s p h v , n s v V p ψ n ( r ) = s v V p ψ ψ r e l n ( r ) ,
have been used.
First, an interpretation of the quantity σ s p h v , n is useful. The equivalent two-way beam solid angle, ψ n ( r ) ψ ψ r e l n ( r ) , represents the transducer’s effective beam width (in terms of a solid angle) for transmission and reception combined, including finite-amplitude effects in the beam pattern of the incident wave. From the definition of a solid angle, the portion of the surface area of a sphere with radius at r p that is effectively insonified by the equivalent two-way beam solid angle equals A s n r p 2 ψ n ( r p ) , and is here denoted the “sampled area”, cf. Figure 6. Consequently, one has V p ψ n ( r p ) 4 π r p 2 d r p ψ n ( r p ) 4 π V s n , where V s n d r p A s n is interpreted as the “sampled volume” portion of the spherical shell volume, V p , that is contained within the range interval [ r p 1 , r p 2 ] and the solid angle ψ n ( r p ) , cf. Figure 6. Hence, V s n contains that portion of the assumed homogeneous distribution of omnidirectional scattering targets contained in V p , that is effectively insonified by the acoustic beam, upon radiation and reception combined. It follows that V s n V p ψ ψ r e l n ( r p ) / 4 π . Consequently, with r r p and by using Equation (53), it follows that σ s p h v , n = s v V p ψ ψ r e l n ( r ) = ( d σ s p h / d V ) V s n , where d σ s p h = 4 π d σ b s represents the spherical scattering cross section of the effective sampled volume V s n in V p , where change in the beam width due to finite-amplitude sound propagation effects is accounted for [52].
In Equation (A2), Π T v is the transmitted electrical power, averaged over one cycle of the monochromatic wave, at the angular frequency ω in question. By following the reasoning used for interpretation of Equation (A1), Π T v G 0 ( e 2 α r / 4 π r 2 ) gives the transducer’s radiated intensity in the axial direction, at the V p range, r r p , under small-amplitude conditions, and with absorption accounted for (cf. Appendix B; Equation (A4) and Interpretation 1). | C i n ( r ) | 2 accounts for the axial finite-amplitude effects of the incident beam. Multiplication with the effective spherical scattering cross section of the sampled volume V s n , σ s p h v , n , gives the acoustic power scattered from V p , including finite-amplitude effects on the incident beam width. Multiplying with e 2 α r / 4 π r 2 yields the free-field acoustic power density (i.e., the intensity) of the scattered field at the center of the transducer front. Multiplication with the “effective receiving area” of the receiving transducer (cf. Appendix C), for normally incident sound to the transducer ( θ = φ = 0 ), G 0 ( λ 2 / 4 π ) , yields the received electrical power at the transducer’s electrical terminals for the special case of F Π = 1 (e.g., for (i) Z E = Z R * ; or (ii) Z E = Z R and X T = 0 Ω; cf. Section 4.1.1). Finally, multiplying with F Π = 4 R T R E / | Z R + Z E | 2 (cf. Appendix C) yields the average received electrical power Π R v , n at the transducer’s electrical terminals for an arbitrary electrical termination load.

Appendix B. Transducer Gain, G ( θ , φ )

In fisheries acoustics, the dimensionless quantity “transducer gain” [20,27] (or “gain” [21]) is analogous to the “antenna gain” (or “gain”) used in electromagnetics [45], with a related definition and interpretation. The transducer gain G ( θ , φ ) , here defined by Equation (36), combines the transducer’s electroacoustic conversion efficiency, η , and directivity factor, D ( θ , φ ) .
Three alternative and equivalent interpretations of G ( θ , φ ) , as discussed in the following, may provide useful insight, such as for physical interpretation of the various terms in the power budget equations for σ b s and s v (cf. Appendix A).
Interpretation 1: From Equations (36), (38), (18), and (10), the transducer gain can be expressed as
G ( θ , φ ) = I i ( r , θ , φ ) 4 π r 2 e 2 α r Π T ,
where I i ( r , θ , φ ) is the intensity radiated by the transducer in the ( θ , φ ) direction and at range r, under small-amplitude conditions, and including the effects of absorption.
From Equation (A4), G ( θ , φ ) may be interpreted as “the ratio of the intensity produced by the transducer in the ( θ , φ ) direction and at range r, I i ( r , θ , φ ) e 2 α r , to the intensity Π T / 4 π r 2 produced by an omnidirectional (point) source that is radiating the amount of electrical power Π T being supplied to the transducer, both under lossless and small-amplitude sound propagation conditions in the fluid”. This “in-fluid” intensity interpretation is used in Appendix A.1. (It may be noted that Interpretation 1 corresponds to the definition of G ( θ , φ ) used in [45] for electromagnetic waves.)
Interpretation 2: Alternatively, for the given direction ( θ , φ ) , the transducer gain G ( θ , φ ) may from Equation (A4) be interpreted as “the ratio of the acoustic power produced by a point source that is radiating an (omnidirectional) intensity equal to the transducer’s radiated intensity in the ( θ , φ ) direction and at range r, I i ( r , θ , φ ) e 2 α r , to the transmitted electrical power, Π T , under lossless and small-amplitude sound propagation conditions in the fluid”. This “electroacoustic power conversion” interpretation—more closely related to the transducer’s conversional efficiency, η —is used in Appendix A.2.
Interpretation 3: Thirdly, since η and D 0 are both independent of ( θ , φ ) , it follows from Equations (36) and (35) that the transducer’s electroacoustic conversion efficiency may be expressed as
η = 1 4 π 4 π G ( θ , φ ) d Ω ,
From Equation (A5), G ( θ , φ ) may alternatively be interpreted as “the transducer’s one-way electroacoustic conversion efficiency per unit solid angle in the ( θ , φ ) direction, for lossless and small-amplitude sound propagation conditions in the fluid”. This “directional efficiency” interpretation is used in Section 2.2.
In essence, thus, G ( θ , φ ) is (a) a measure of how well the transducer converts input electrical power into acoustic waves headed in the ( θ , φ ) direction, or (b) vice versa, by reciprocity, converts acoustic waves arriving from the ( θ , φ ) direction into electrical power [22], where both (a) and (b) apply to lossless and small-amplitude sound propagation conditions in the fluid.

Appendix C. Effective Receiving Area

In the electromagnetics literature, a receiving antenna’s “effective area”, defined as the ratio of the electrical power delivered by the antenna to the electrical termination circuit to the free-field power density of the incident electromagnetic wave at the center of the antenna’s front face, is given as [45]
A e f f e m = G 0 λ 2 4 π   ,
where all symbols represent electromagnetic quantities, with the same meanings as the corresponding symbols used for acoustic quantities elsewhere in the article.
In acoustics, using an equivalent definition of the transducer’s “effective receiving area”, by noting that the free-field power density of the scattered acoustic wave at the center of the transducer’s front face is the intensity of that wave, and by accounting for the electrical termination load at the receiving transducer, it follows from Equations (41), (29), (47), (49), (44), and (19) that Π R s t = G ( θ , φ ) ( λ 2 / 4 π ) F I s (where the superscript “n” has been omitted in Π R s t , n , for small-amplitude sound propagation in scattering from a single target). Consequently,
A e f f a c Π R s t I s = G ( θ , φ ) λ 2 4 π F Π
for a pressure wave arriving in the ( θ , φ ) direction from a distant scattering object. For a scattered pressure wave arriving at normal incidence to the transducer, it thus follows that A e f f a c = G 0 ( λ 2 / 4 π ) F Π . The unit of A e f f a c is (m2), and A e f f a c is thus interpreted as the “effective receiving area” of the receiving acoustic transducer.
From Equations (A6) and (A7), it follows that in electromagnetics and acoustics (e.g., for radar and sonar) the expressions for the “effective receiving area” of the antenna/transducer are different, by the factor F Π . By revisiting the derivation of Equations (1)–(3) given in [21], in which the simplified expression A e f f a c = G 0 ( λ 2 / 4 π ) is used (valid for specific cases only, cf. below), this result may possibly explain the missing factor F Π in Equations (1) and (2). (An alternative possible explanation for the missing factor may be that—by impedance matching, and without stating it— F Π 1 may possibly have been used for the Simrad EK500 echo sounder over the relevant narrow operational frequency band in question, cf. the discussion in Section 4.1.1 and [22,23].)
In [28], the simplified expression A e f f a c = G 0 ( λ 2 / 4 π ) is used, stated to be applicable for the special case Z E = Z R . From the analysis of cf. Section 4.1.1, this is seen to be correct only for conditions at which X T 0 Ω, i.e., at (or in the vicinity of) the series resonance frequency of the employed transducer vibration mode. In this case, F Π 1 . It may be noted that this simplified expression can be used also for Z E = Z R * , cf. Section 4.1.1. Use of the general expression, Equation (A7), would, however, be more correct and accurate, and comparably simple.
From Equations (A7) and (41), it may be noted that
| M V | 2 = 4 R T ρ 0 c 0 F Π A e f f a c = | Z R + Z E | 2 ρ 0 c 0 R E A e f f a c ,
giving the general relationship between the transducer’s free-field open-circuit voltage receiving sensitivity, M V , and A e f f a c .

Appendix D. Symbols and Nomenclature

Table A1 summarizes the symbols, nomenclature, and units for the quantities used in the text. Bold-type symbols indicate a complex-valued quantity.
Table A1. List of quantities.
SymbolNomenclatureUnit
ρ 0 Ambient density of the fluid mediumkg/m3
c 0 Small-amplitude sound velocity of the fluid mediumm/s
α Sound pressure acoustic attenuation coefficient of the fluid mediumNp/m
α ^ Sound pressure acoustic attenuation coefficient of the fluid mediumdB/m
f Frequency of the monochromatic wave = fundamental frequency of the finite-amplitude wavefieldHz
ω = 2 π f Angular frequency of the monochromatic waverad/s
k = ω / c 0 Acoustic wavenumber in the fluid mediumrad/m
λ = c 0 / f Acoustic wavelength in the fluid medium m
r _ = ( r , θ , φ ) Position vector expressed in the spherical coordinate system of the echo sounder
r _ = ( r , θ , φ ) Position vector expressed in the spherical coordinate system of the target
r Range from the center of the transducer front surface m
r 0 Axial reference range from the center of the transducer front surface (e.g., 1 m) m
r 0 Reference range from a single scattering target (e.g., 1 m)m
p i Incident pressure wave radiated by the transducer, for small-amplitude sound propagation in the fluidPa
p i n Incident pressure wave radiated by the transducer, for finite-amplitude sound propagation in the fluid, for the fundamental frequency of the wavefieldPa
p s Pressure wave scattered by a single target Pa
P i Amplitude of p i Pa
P i n Amplitude of p i n Pa
P s Amplitude of p s Pa
P i , 0 Amplitude of p i at axial reference range r 0 , extrapolated from the transducer’s far-field Pa
P b s Free-field sound pressure in the fluid, backscattered from a single target, in the position of the center of the transducer front Pa
P b s , 0 Sound pressure amplitude backscattered from a single target, at reference range r 0 from the target, extrapolated from the target’s far-field Pa
A i Amplitude constant for the incident scattered fieldPa-m
A s ( r ) Amplitude function for the scattered fieldPa-m
I i n Free-field intensity of the incident wave at the center position of a single target, for finite-amplitude sound propagation in the fluid, for the fundamental frequency of the wavefieldW/m2
I s Intensity of the wave scattered from a single target, in the far-field of the targetW/m2
I s , 0 Intensity of the wave scattered from a single target, at reference range r 0 from the target, extrapolated from the target’s far-fieldW/m2
I b s , 0 Intensity of the wave backscattered from a single target, at reference range r 0 from the target, extrapolated from the target’s far-fieldW/m2
C i n ( r ) Axial finite-amplitude factor
B i ( θ , φ ) Far-field beam pattern of the incident sound pressure wave = far-field beam pattern of the transducer in transmit and receive operations, for small-amplitude sound propagation in the fluid
B i n ( r , θ , φ ) Far-field beam pattern of the incident sound pressure wave = far-field beam pattern of the transducer in transmit operation, for finite-amplitude sound propagation in the fluid, for the fundamental frequency of the wavefield
B s ( θ , φ ) Beam pattern of the sound pressure wave scattered from a single target, in the far-field of the target
B r e l n ( r , θ , φ ) Beam pattern finite-amplitude factor
D 0 Axial directivity factor
D ( θ , φ ) Directivity factor
G 0 Axial transducer gain
G ( θ , φ ) Transducer gain
ψ Equivalent two-way beam solid angle of the transducer, for small-amplitude sound propagation in the fluidsr
ψ n Equivalent two-way beam solid angle of the transducer, for finite-amplitude sound propagation in the fluidsr
ψ r e l n Beam solid angle finite-amplitude factor sr
σ b s Backscattering cross section of a single target (e.g., calibration sphere, or fish)m2
σ b s Expected value of the backscattering cross section of a single target (e.g., fish) m2
S s Scattering function
S b s Backscattering function
s v Volume backscattering coefficient m−1
ρ a Target (fish) density in the volume V o b s
N j Number of scattering objects of type j per unit volume
m j Number of scattering objects of type j in a unit volume
σ b s , j Backscattering cross section for a scattering object of type j m2
Δ σ b s Backscattering cross section over all scatterer types, in a unit volume m2
R v ( f ) Relative frequency response of s v
S I Axial transmitting current response of the transducer Pa/A
M V Free-field open-circuit voltage receiving sensitivity of the transducer V/Pa
M V a x Free-field open-circuit voltage receiving sensitivity of the transducer, for normally incident pressure waves V/Pa
I T Input electric current amplitude delivered to the transducer during transmission A
V 0 Output voltage amplitude across the transducer’s electrical terminals at reception, under open-circuit conditions V
V T Voltage amplitude across the transducer’s electrical terminals at transmission V
V R Voltage amplitude across the transducer’s electrical terminals upon reception, for single-target backscattering V
I R Current amplitude at the transducer’s electrical terminals upon reception, for single-target backscattering A
Z T = R T + i X T Input electrical impedance of the transducer in transmit operation, with resistance R T and reactance X T Ω
Z R = R R + i X R Output (internal) electrical impedance of the transducer in receive operation, with resistance R R and reactance X R Ω
Z E = R E + i X E Input electrical impedance of the receiving electronics network, with resistance R E and reactance X E Ω
F V V , F I I , F Π Electrical termination factors
F I V , F V I Electrical termination factors Ω, Ω−1
Π T Average electrical power delivered to the transducer at transmission (“average transmit electrical power”), for single-target ( Π T = Π T s t ) or volume backscattering (field survey) ( Π T = Π T v ) applications (depends on situation, cf. Equations (1)–(2))W
Π T s t Average electrical power delivered to the transducer at transmission (“average transmit electrical power”), for single-target backscattering operation (i.e., calibration sphere, individual fish)W
Π T v Average electrical power delivered to the transducer at transmission (“average transmit electrical power”), for volume scattering (field survey) operation W
Π R s t , n Average electrical power delivered by the transducer to the receiving electronics (“average received electrical power”), for single-target backscattering operation (i.e., calibration sphere, individual fish), for finite-amplitude sound propagation in the fluidW
Π R v , n Average electrical power delivered by the transducer to the receiving electronics (“average received electrical power”), for volume backscattering (field survey) operation, for finite-amplitude sound propagation in the fluidW
Π R s t Π R s t , n reduces to Π R s t for small-amplitude sound propagation in the fluidW
Π R v Π R v , n reduces to Π R v for small-amplitude sound propagation in the fluidW
Π a Average acoustic power radiated by the transducer into the fluid, under small-amplitude and lossless sound propagation conditions in the fluidW
η Transducer’s (one-way) electroacoustic conversion efficiency under conditions of small-amplitude and lossless sound propagation in the fluid
J s Spherical–wave reciprocity parameter m4·s/kg
K n ( r , θ , ϕ ) Transmit–receive transfer function factor
V o b s Spherical shell observation volume m3
V p Spherical shell sub-volume in V o b s (“ping volume"), determined by τ p m3
V s n Sampled volume portion of V p m3
r min , r max Minimum and maximum range of V o b s m
r p 1 , r p 2 Minimum and maximum range of V p m
t p 1 , t p 2 Transit time to the minimum and maximum ranges of V p s
τ p Time duration of the transmitted voltage signals, determining the thickness of V p s
r p Mid-radius range of V p m
d r = d r p Thickness of V p m

References

  1. Dragesund, O.; Olsen, S. On the possibility of estimating year-class strength by measuring echo-abundance of 0-group fish. Fiskeridirektoratets Skrifter Serie Havundersøkelser 1965, 13, 48–75. [Google Scholar]
  2. Clay, C.S.; Medwin, H. Acoustical Oceanography: Principles and Applications; John Wiley & Sons: New York, NY, USA, 1977; pp. 180–182, 205, 220, 225–235, 395–404. [Google Scholar]
  3. Foote, K.G. Optimizing copper spheres for precision calibration of hydro acoustic equipment. J. Acoust. Soc. Am. 1982, 71, 742–747. [Google Scholar] [CrossRef]
  4. Dalen, J.; Nakken, O. On the Application of the Echo Integration Method; ICES Doc. CM 1983/B:19; International Council for the Exploration of the Sea: Copenhagen, Denmark, 1983. [Google Scholar]
  5. Nakken, O.; Ulltang, Ø. A Comparison of the Reliability of Acoustic Estimates for Fish Stock Abundance and Estimates Obtained by Other Assessment Methods in Northeast Atlantic; FAO Fish. Rep. No. 300; Food and Agriculture Organization of the United Nations: Rome, Italy, 1983; pp. 249–260. [Google Scholar]
  6. Foote, K.G.; Knudsen, H.P.; Vestnes, G.; MacLennan, D.N.; Simmonds, E.J. Calibration of Acoustic Instruments for Fish Density Estimation: A Practical Guide; ICES Coop. Res. Rep. No. 144; International Council for the Exploration of the Sea: Copenhagen, Denmark, 1987. [Google Scholar]
  7. MacLennan, D.N. Acoustical measurements of fish abundance. J. Acoust. Soc. Am. 1990, 87, 1–15. [Google Scholar] [CrossRef]
  8. MacLennan, D.N.; Simmonds, E.J. Fisheries Acoustics; Chapman & Hall: London, UK, 1992; pp. 68–69, 147–151. [Google Scholar]
  9. Medwin, H.; Clay, C.S. Fundamentals of Acoustical Oceanography; Academic Press: Boston, MA, USA, 1998; pp. 153–158, 350–361. [Google Scholar]
  10. MacLennan, D.N.; Fernandes, P.G.; Dalen, J. A consistent approach to definitions and symbols in fisheries acoustics. ICES J. Mar. Sci. 2002, 59, 365–369. [Google Scholar] [CrossRef] [Green Version]
  11. Simmonds, J.; MacLennan, D.N. Fisheries Acoustics. Theory and Practice, 2nd ed.; Blackwell Science Ltd.: Oxford, UK, 2005; pp. 32, 35–38, 47, 59–60, 110, 119–121, 187–191, 195–197. [Google Scholar]
  12. Korneliussen, R.J. The acoustic identification of Atlantic mackerel. ICES J. Mar. Sci. 2010, 67, 1749–1758. [Google Scholar] [CrossRef]
  13. Holliday, D.V. Extracting bio-physical information from the acoustic signature of marine organisms. In Oceanic Sound Scattering Prediction; Andersen, N.R., Zahuranec, B.J., Eds.; Plenum Press: New York, NY, USA, 1977; pp. 619–624. [Google Scholar]
  14. Korneliussen, R.J.; Diner, N.; Ona, E.; Berger, L.; Fernandes, P.G. Proposals for the collection of multifrequency acoustic data. ICES J. Mar. Sci. 2008, 65, 982–994, Published earlier as: Korneliussen, R.J.; Diner, N.; Ona, E.; Fernandes, P.G. Recommendations for the Collection of Multi-Frequency Acoustic Data; ICES Doc. CM 2004/R:36; International Council for the Exploration of the Sea: Copenhagen, Denmark, 2004. [Google Scholar] [CrossRef] [Green Version]
  15. Tichy, F.E.; Solli, H.; Klaveness, H. Nonlinear effects in a 200 kHz sound beam and consequences for target strength measurement. ICES J. Mar. Sci. 2003, 60, 571–574. [Google Scholar] [CrossRef]
  16. Baker, A.C.; Lunde, P. Nonlinear Propagation from Circular Echo-Sounder Transducers. Numerical Simulation Results; CMR Tech. Note CMR-TN01-A10010-Rev-01; Christian Michelsen Research AS: Bergen, Norway, 2011; De-classified revision of CMR Tech. Note CMR-TN01-F10010, 2001 (confidential). [Google Scholar]
  17. Baker, A.C.; Lunde, P. Nonlinear Effects in Sound Propagation from Echo-Sounders Used in Fish Abundance Estimation. Numerical Simulation Results; CMR Tech. Note CMR-TN02-A10008-Rev-01; Christian Michelsen Research AS: Bergen, Norway, 2011; De-classified revision of CMR Tech. Note CMR-TN02-F10008, 2002 (confidential). [Google Scholar]
  18. Nonlinear Effects: Recommendation for Fishery Research Investigations; Revised Version of Simrad News Bulletin; Simrad AS (now Kongsberg Maritime AS): Horten, Norway, 2002.
  19. Pedersen, A.; Vestrheim, M.; Lunde, P. Quantification of nonlinear sound propagation effects in fisheries research echosounders. In Proceedings of the Underwater Acoustic Measurements, Technologies & Results, Heraklion, Crete, 28 June–1 July 2005; Papadakis, J.S., Bjørnø, L., Eds.; Foundation for Research and Technology: Heraklion, Greece, 2005; Volume II, pp. 751–756. [Google Scholar]
  20. Pedersen, A. Effects of Nonlinear Sound Propagation in Fisheries Research. Ph.D. Thesis, University of Bergen, Dept. of Physics and Technology, Bergen, Norway, 2006. Available online: https://bora.uib.no/handle/1956/2158?mode=full&submit_simple=Show+full+item+record (accessed on 23 December 2019).
  21. Operator Manual: SIMRAD EK500 Fishery Research Echo Sunder. Scientific Echo Sounder: Base Version; Doc. No. P2170/Revision G; Simrad AS (now Kongsberg Maritime AS): Horten, Norway, 1997; Section 7: Theory of operation, pp. 165–169, and Appendix Calibration of the EK500, pp. 211–212.
  22. Lunde, P.; Pedersen, A.O.; Korneliussen, R.J.; Tichy, F.E.; Nes, H. Power-Budget and Echo-Integrator Equations for Fish Abundance Estimation; Fisken og Havet No. 10/2013; Institute of Marine Research: Bergen, Norway, 2013; Available online: http://www.imr.no/publikasjoner/andre_publikasjoner/fisken_og_havet/nb-no (accessed on 23 December 2019).
  23. Lunde, P.; Korneliussen, R.J. A Unifying Theory Explaining Different Power Budget Formulations Used in Modern Scientific Echosounders for Fish Abundance Estimation; Fisken og Havet No. 7/2014; Institute of Marine Research: Bergen, Norway, 2014; Available online: http://www.imr.no/publikasjoner/andre_publikasjoner/fisken_og_havet/nb-no. (accessed on 23 December 2019).
  24. Lunde, P.; Korneliussen, R.J. Power budget equations and calibration factors for fish abundance estimation using scientific echo sounders and sonar systems. J. Mar. Sci. Eng. 2016, 4, 43. [Google Scholar] [CrossRef]
  25. Korneliussen, R.J. Analysis and Presentation of Multifrequency Echograms. Ph.D. Thesis, University of Bergen, Department of Physics, Bergen, Norway, 2002. [Google Scholar]
  26. Demer, D.A.; Renfree, J.S. Variations in echosounder-transducer performance with water temperature. ICES J. Mar. Sci. 2008, 65, 1021–1035. [Google Scholar] [CrossRef] [Green Version]
  27. Ona, E.; Mazauric, V.; Andersen, L.N. Calibration methods for two scientific multibeam systems. ICES J. Mar. Sci. 2009, 66, 1326–1334. [Google Scholar] [CrossRef] [Green Version]
  28. Demer, D.A.; Berger, L.; Bernasconi, M.; Bethke, E.; Boswell, K.; Chu, D.; Domokos, R.; Dunford, A.; Fassler, S.; Gauthier, S.; et al. Calibration of Acoustic Instruments; ICES Coop. Res. Rep. No. 326; International Council for Exploration of the Sea: Copenhagen, Denmark, 2015; pp. 12–16, 62. [Google Scholar]
  29. Demer, D.A.; Andersen, L.N.; Bassett, C.; Berger, L.; Chu, D.; Condiotty, J.; Cutter, G.R.; Hutton, B.; Korneliussen, R.; Bouffant, N.L.; et al. Evaluation of a Wideband Echosounder for Fisheries and Marine Ecosystem Science; ICES Coop. Res. Rep. No. 336; International Council for Exploration of the Sea: Copenhagen, Denmark, 2017. [Google Scholar] [CrossRef]
  30. Korneliussen, R.J. (Ed.) Acoustic Target Classification; ICES Coop. Res. Rep. No. 344; International Council for Exploration of the Sea: Copenhagen, Denmark, 2018. [Google Scholar] [CrossRef]
  31. Caruthers, J.W. Fundamentals of Marine Acoustics; Elsevier Scientific Publ. Co.: Amsterdam, The Netherlands, 1977; pp. 113–116. [Google Scholar]
  32. Burdic, W.S. Underwater Acoustics System Analysis; Prentice-Hall: Englewood Cliffs, NJ, USA, 1984; pp. 370–373. [Google Scholar]
  33. Lurton, X. An Introduction to Underwater Acoustics. Principles and Applications, 2nd ed.; Springer: Berlin, Germany, 2010; pp. 98–100, 205. [Google Scholar]
  34. Bjørnø, L. Applied Underwater Acoustics; Neighbors, T.H., Bradley, B., Eds.; Elsevier: Amsterdam, The Netherlands, 2017; pp. 346–348. [Google Scholar]
  35. Hamilton, M.F. Sound beams. In Nonlinear Acoustics; Hamilton, M.F., Blackstock, D.T., Eds.; Academic Press: San Diego, CA, USA, 1998; Chapter 8. [Google Scholar]
  36. Lunde, P.; Pedersen, A.O. Sonar and power budget equations for backscattering of finite amplitude sound waves, with implications in fishery acoustics for abundance estimation of marine resources. In Proceedings of the Scandinavian Symposium on Physical Acoustics, Geilo, Norway, 29 January–1 February 2012; Kristiansen, U., Ed.; Norwegian Physical Society: Oslo, Norway, 2012. ISBN 978-82-8123-012-5. Available online: http://www.ntnu.edu/sspa/sspa2012 (accessed on 23 December 2019).
  37. Lunde, P. Equations describing finite-amplitude effects in acoustic fish abundance estimation. J. Acoust. Soc. Am. 2015, 138 Pt 2, 1949. [Google Scholar] [CrossRef]
  38. Zabolotskaya, E.A.; Khokhlov, R.V. Quasi-plane waves in the nonlinear acoustics of confined beams. Sov. Phys. Acoust. 1969, 15, 35–40. [Google Scholar]
  39. Kuznetsov, V.P. Equations of nonlinear acoustics. Sov. Phys. Acoust. 1971, 16, 467–470. [Google Scholar]
  40. Aanonsen, S.; Barkve, T.; Naze Tjøtta, J.; Tjøtta, S. Distortion and harmonic generation in the nearfield of a finite amplitude sound beam. J. Acoust. Soc. Am. 1984, 75, 749–768. [Google Scholar] [CrossRef]
  41. Hamilton, M.F.; Naze Tjøtta, J.; Tjøtta, S. Nonlinear effects in the farfield of a directive sound source. J. Acoust. Soc. Am. 1985, 78, 202–216. [Google Scholar] [CrossRef]
  42. Berntsen, J.; Naze Tjøtta, J.; Tjøtta, S. Interaction of sound waves. Part IV: Scattering of sound by sound. J. Acoust. Soc. Am. 1989, 86, 1968–1983. [Google Scholar] [CrossRef]
  43. Kinsler, L.E.; Frey, A.R.; Coppens, A.B.; Sanders, J.V. Fundamentals of Acoustics, 4th ed.; John Wiley & Sons: New York, NY, USA, 2000; pp. 15, 181–184, 189. [Google Scholar]
  44. Foldy, L.L.; Primakoff, H. A general theory of passive linear electroacoustic transducers and the electroacoustic reciprocity theorem. I. J. Acoust. Soc. Am. 1945, 17, 109–120. [Google Scholar] [CrossRef]
  45. Balanis, C.A. Antenna Theory: Analysis and Design, 3rd ed.; John Wiley & Sons: Hoboken, NJ, USA, 2005; pp. 50, 66, 89–95. [Google Scholar]
  46. ANSI S1.20-1988 (R2003): Procedures for Calibration of Underwater Electroacoustic Transducers; American National Standards Institute: New York, NY, USA, 1988.
  47. Stanton, T.K. Multiple scattering with applications to fish-echo processing. J. Acoust. Soc. Am. 1983, 73, 1164–1169. [Google Scholar] [CrossRef]
  48. Foote, K.G. Correcting acoustic measurements of scatterer density for extinction. J. Acoust. Soc. Am. 1990, 88, 1543–1546. [Google Scholar] [CrossRef] [Green Version]
  49. Zhao, X.; Ona, E. Estimation and compensation models for the shadowing effect in dense fish aggregations. ICES J. Mar. Sci. 2003, 60, 155–163. [Google Scholar] [CrossRef] [Green Version]
  50. Foote, K.G. Linearity of fisheries acoustics, with addition theorems. J. Acoust. Soc. Am. 1983, 73, 1932–1940. [Google Scholar] [CrossRef]
  51. Foote, K.G. Rather-high-frequency sound scattering by swimbladdered fish. J. Acoust. Soc. Am. 1985, 78, 688–700. [Google Scholar] [CrossRef]
  52. Lunde, P.; Pedersen, A.O. Volume backscattering of finite-amplitude acoustic waves: Power flow, sampled volume, and scattering cross section. In Proceedings of the 38th Scandinavian Symposium on Physical Acoustics, Geilo, Norway, 1–4 February 2015; Norwegian Physical Society: Oslo, Norway, 2015. ISBN 978-82-8123-015-6. Available online: http://www.norskfysikk.no/nfs/faggrupper/akustikk2015/index.html (accessed on 3 January 2020).
1
Note that except for [22,23,24], prior literature does not appear to distinguish between Π R s t and Π R v (i.e., the received powers in calibration and survey operations, cf. Equations (1) and (2)), although these are obviously not equal. In practical implementations and operation, however, these are normally handled as two different quantities. For clarity, thus, different symbols Π R s t and Π R v are used in Equations (1) and (2).
2
Other small-amplitude power budget equations for σ b s and s v than those given by Equations (1) and (2) [21] have been proposed [11,20,22,26,27,28]. The various expressions proposed are not necessarily equivalent nor consistent. The expressions given in [20] and [22,23,24] represent further developments of [21] to account for arbitrary electrical termination, and are otherwise consistent with [21], cf. [23,24]. The equations postulated by Simmonds and MacLennan [11] [their Equations (3.13) and (3.15)] may be shown [23,24] to differ from those given elsewhere [20,21,22,23,24,25,26,27,28], and power flow balance is not quite preserved (cf. Section 4.1.1). Demer and Renfree [26] used expressions for σ b s and s v that correspond to those of [21], where however the expression for σ b s is limited to the acoustic axis [23,24]. Ona et al. [27] postulated alternative expressions for σ b s and s v . A derivation of those expressions [27] was presented in [28]. The expression for s v proposed by [27,28] is however not consistent with those given in [20,21,22,23,24], and is not found to be valid [23,24]. These issues are all addressed and resolved elsewhere [23,24].
Small-amplitude power budget equations analogous or corresponding to σ b s and/or s v have been addressed in some textbooks, such as [2,9,31,32,33,34]. By Clay and Medwin [2] and Medwin and Clay [9] only “in water” expressions for σ b s and s v were discussed (i.e., in terms of sound pressures instead of electrical voltages), without accounting for the electroacoustic conversion of the transducer at transmission and reception. Apart from that, the expressions given by Clay and Medwin in [2,9] have been shown to be consistent with Equations (1) and (2) [22]. Similar “in-water” expressions for s v were given by Garuthers [31], Burdic [32], Lurton [33] and Bjørnø [34].
3
At-sea target strength measurements conducted with the Simrad EK60/38 kHz echosounder system in seawater, using a Cu60 copper sphere reflector at a constant range 15.5 m below the transducer (the transducer being 8 m below the surface), and several transmit electrical power settings in the range 200–2000 W, have shown no sign of significant nonlinear loss. The deviations between target strength measurements at 200 W and 2000 W were less than 0.01 dB. (Pers. comm., R.J.; Korneliussen, Institute of Marine Research, Bergen, Norway, 2011.) Preliminary and tentative simulations using the Bergen Code solution of the KZK equation [16,17,19,20,35,36,37,38,39,40,41,42] indicate that—for 2000 W transmit electrical power—nonlinear loss in seawater at 38 kHz operating frequency is less than 0.08 and 0.25 dB, at 10 and 100 m ranges, respectively. (Pers. comm., Pedersen, A., Christian Michelsen Research AS, Bergen, Norway, 2011).
4
These directivity figures apply to a single frequency (the fundamental frequency). Most fish-finding sonars transmit about 10% bandwidth in each pulse. Lurton [33] have discussed the directivity of wideband signals and given expressions for a non-weighted linear array. It was demonstrated that the major lobe is not severely affected by the frequency bandwidth, while the sidelobes are decreased by an amplitude modulating term, and the beampattern throughs are smoothed (filled in) at a degree depending on frequency bandwidth. Although these results for a linear array are not directly applicable to circular echo sounder transducers, it may be expected that similar impacts of frequency bandwidth apply also to circular transducers, at least qualitatively. The figures given in the main text for the increased −3 dB beamwidth at the fundamental frequency, using “small” and “high” amplitude, and the corresponding flattening of the major lobe, are thus expected to be representative also for the directivity of a narrowband pulse transmitting e.g., 10% bandwidth.
5
This distinction is important to enable the use of the single-target expression, Equation (50), in the integration over a multitude of scattering objects contained in a volume of finite extent, to derive the volume backscattering coefficient, s v , given by Equation (56). The same assumption is implicitly underlying the conventional theory [21] for abundance estimation, Equations (1)–(3).
6
Today’s methods for fish abundance estimation and species identification are based on measurement of the signal power (“echo integration” [2,3,4,5,6,7,8,9,11,21,22,23,24,25,26,27,28,29]), for at-sea calibration as well as survey (field) operation. As part of this process the received voltage signal is squared, so that the inherent phase information about the individual scattering contributions to the received signal is not used. The conventional theoretical approach is based on the assumption of incoherent volume scattering, using sound intensity for the forward and scattered fields, with no phase information about the individual scattering contributions to the received signal.
Alternative theoretical scattering approaches employ complex-valued expressions for the scattering function, accounting for phase and amplitude of the scattered field, relevant in studies of scattering from individual objects [cf. e.g., Bowman, Senior, and Uslenghi (eds.), “Electromagnetic and Acoustic Scattering by Simple Shapes”, North-Holland Publ. Co., Amsterdam, 1969]. Use of such approaches would be beyond the scope of the present article, which is intended to represent a generalization of the conventional operational expressions used in fisheries acoustics today to account for finite amplitude effects, based on the assumption of incoherent volume scattering. For this reason the definition of the scattering function used in [2], based on sound intensity, and not sound pressure, has been used here to describe single-target and volume scattering. This leads to a real-valued expression for the scattering function.
7
Foldy and Primakoff [44] considered a lossless fluid medium, using time dependence exp(iωt), as here, and the lossless version of Equation (40) was given, corresponding to α = 0 [cf. their Equation (50)]. By repeating their derivation with fluid absorption accounted for, using a complex wavenumber κ = k in the fluid instead of the real wavenumber k = ω/c0 which was used by Foldy and Primakoff [44], Equation (40) results.
8
Excess attenuation from power extinction caused by volume scattering in V o b s (also referred to as the “shadow effect”) have been discussed e.g., by [9,11,48,49,50], and in references given therein. The shadow effect of caged fish at relevant fish densities, power levels, and four frequencies in the common operational frequency range used in fisheries acoustics, 38–120 kHz, was investigated by [50] (also reproduced and discussed in [11]), indicating errors in fish density (no. of fish per m2) of typically less than 10%. In a couple of cases errors in the range 14–16% were found, and in one case about 29%.
In comparison with the figures given by Pedersen [20] (cf. Section 1.2), the impact of finite amplitude effects may thus be at the level of the shadow effect due to power extinction, or larger, depending on frequency, power setting, and calibration distance.
Figure 1. Sketch of the acoustic system for single-target backscattering, with an electroacoustic transducer operating as a transmitter and receiver of ultrasound, acoustic backscattering from a single scattering object (target) in a homogeneous fluid medium, and the two spherical coordinate systems 1 and 2 used for the transmitted and scattered sound wave fields, respectively. The target center is located at position ( r , θ , ϕ ) relative to coordinate system no. 1. (Reproduced from [22], with permission from the Institute of Marine Research, 2020.)
Jmse 08 00098 g001
Figure 2. Sketch of an arbitrary transducer: target positions giving the relationship between ( θ , ϕ ) and ( θ , ϕ ) for backscattering from a single target at arbitrary location ( r , θ , ϕ ) . The backscattering direction is given as θ = π θ , ϕ = π + ϕ . (Reproduced from [22], with permission from the Institute of Marine Research, 2020.)
Jmse 08 00098 g002
Figure 3. Sketch of the electrical connections for the electroacoustic transducer and electrical termination operating in (a) transmit and (b) receive modes. (Reproduced from [22], with permission from the Institute of Marine Research, 2020.)
Jmse 08 00098 g003
Figure 4. Helmholtz–Thevenin electric circuit for the electroacoustic transducer upon signal reception. (Reproduced from [22], with permission from the Institute of Marine Research, 2020.)
Jmse 08 00098 g004
Figure 5. Sketch of the acoustic system under analysis, with an electroacoustic transducer operating as a transmitter and receiver of ultrasound, and acoustic volume backscattering from a multitude of scattering objects in a spherical shell observation volume, V o b s . (Reproduced from [22], with permission from the Institute of Marine Research, 2020.)
Jmse 08 00098 g005
Figure 6. Sketch of the spherical shell sub-volume V p in the spherical shell observation volume, V o b s , and the “sampled volume” portion of V p , V s n , which is determined by the intersection of V p and the solid angle ψ n .
Jmse 08 00098 g006