Article

A Sensor Web Prototype for Cabled Seafloor Observatories in the East China Sea

1
State Key Laboratory of Marine Geology, Tongji University, Shanghai 200092, China
2
Institute of Deep-Sea Science and Engineering, Chinese Academy of Sciences, Sanya 572000, China
*
Author to whom correspondence should be addressed.
J. Mar. Sci. Eng. 2019, 7(11), 414; https://doi.org/10.3390/jmse7110414
Submission received: 7 October 2019 / Revised: 28 October 2019 / Accepted: 6 November 2019 / Published: 13 November 2019
(This article belongs to the Special Issue Advanced Instruments for Marine Research)

Abstract

:
Seafloor observatories enable continuous power supply and real-time bidirectional data transmission, which marks a new way for marine environment monitoring. As in situ observation produces massive data in a constant way, the research involved with data acquisition, data transmission, data analysis, and user-oriented data application is vital to the close-loop operations of seafloor observatories. In this paper, we design and implement a sensor web prototype (ESOSW) to resolve seafloor observatory information processing in a plug-and-play way. A sensor web architecture is first introduced, which is information-oriented and structured into four layers enabling bidirectional information flow of observation data and control commands. Based on the layered architecture, the GOE Control Method and the Hot Swapping Interpretation Method are proposed as the plug-and-play mechanism for sensor control and data processing of seafloor observatory networks. ESOSW was thus implemented with the remote-control system, the data management system, and the real-time monitoring system, supporting managed sensor control and on-demand measurement. ESOSW was tested for plug-and-play enablement through a series of trials and was put into service for the East China Sea Seafloor Observation System. The experiment shows that the sensor web prototype design and implementation are feasible and could be a general reference to related seafloor observatory networks.

1. Introduction

The emergence of seafloor observatories responds to the demands of earth system science [1]. Global change research has strongly suggested that the ocean plays an important role in global climate and oceanographic studies increasingly demand long-term, continuous, in situ observations [2]. This is implemented with seafloor observatory systems, which connect in situ marine sensors with the control center on shore via submarine electro-optic composite cables, undersea junction boxes, and so on [3]. In this way, seafloor observatories enable continuous power supply of in situ sensor equipment and real-time bidirectional data transmission between undersea sensor systems and the control center on shore. Multidisciplinary measurements are thus continuously made within the water body and contribute to better understandings of the fine structure and various processes in the ocean interior [4]. Seafloor observatories are widely recognized as the third earth observation platform, the construction of which marks a new direction and way of marine environment monitoring and research [5,6].
Many initiatives and projects on seafloor observatory systems have been implemented or are being planned in different regions such as the United States, Canada, Europe, Japan, and China. The U.S. started early in the cabled seafloor observatory research and has successively established observatories such as LEO-15, MARS, OOI-RSN, and ACO [7,8,9,10]. OOI-RSN is part of the Ocean Observatories Initiative (OOI), which consists of coastal, regional, and global observatory systems integrated by a cyberinfrastructure (CI) for persistent and controllable observations [11]. VENUS and NEPTUNE operated by Ocean Networks Canada (ONC) are the first multi-node cabled seafloor observatories in the world, enabling interactive ocean research via the remote-control system and big data management [12,13,14]. Originated as GEOSTAR and SN-1, constructions of the European distributed seafloor observatory infrastructure have centered on European Multidisciplinary Seafloor and water-column Observatory (EMSO) in recent years [15,16,17]. Japan focuses on deploying seafloor observatories for earthquake early warning such as GeO-TOC and DONET [18,19].
China has also been actively designing and deploying seafloor observatory systems in the East China Sea and is in preparation for its China National Scientific Seafloor Observatory [20,21,22]. The Xiaoqushan Seafloor Observatory is the first cabled observatory established in the East China Sea, which has totally performed continuous measurement and satisfactory operation for more than five years since put into service in April 2009. The Zhujiajian Seafloor Observatory is another cabled observatory aimed to develop key technologies for constructing and protecting shallow seabed observatory networks regarding the confluence of multiple currents and frequent marine fishery activities of the East China Sea. In terms of designing seafloor observatories in the East China Sea, information processing research is a challenge to guarantee the stable operation of functional observatories. As in situ observation produces massive data in a constant way, the research involved with data acquisition, data transmission, data analysis, and user-oriented data application is equal to a whole set of system engineering and is vital to the close-loop operations of seafloor observatories.
In this paper, we design and implement a sensor web prototype for seafloor observatory information processing, based on which various sensor resources are accessed in a standardized way. The concept of sensor web was first described by Delin et al. in 1999 [23], considered as a system of spatially distributed sensor platforms deployed for coordinated sensing and environment monitoring. The notion of sensor web was later broadened increasingly as an additional layer integrating sensor networks with the World Wide Web and applications [24,25]. Largely influenced by the development of the Sensor Web Enablement initiative of the Open Geospatial Consortium (OGC), sensor webs are now understood as an infrastructure that enables the interoperation of sensor resources in a standardized way [26,27]. The sensor web is here defined as an information system integrated with marine sensors, sensor networks and the Internet, whereby sensor resources are available and interoperable via standard interfaces.
Some researches on marine sensor web systems have been conducted in recent years [28,29,30,31,32,33,34,35,36,37,38,39,40,41,42,43,44,45]. One of the most important related advances is the ONC data management and archiving system known as Oceans 2.0, which is implemented as a service-oriented architecture encompassing the most modern software technologies of the day such as Web Services and Web 2.0. Considering the observatory sensor system as an extension of the Internet to the seafloor, Oceans 2.0 contains the necessary user tools for web-based data access, remote instrument control, the Web 2.0 contribution and collaboration, and the like. Oceans 2.0 is scalable and supports from small and occasionally observing systems to large and multi-site networks with high-throughput sensors. Another key advance is the H2020 European project known as EMSODEV, of which the OGC Sensor Web Enablement suite of standards are adopted as a solution for sharing data observed from different seafloor observatories: SensorML to describe sensor systems and processes, O&M (Observations and Measurements) to upload data, SOS (Sensor Observation Service) to integrate sensor observations and descriptions, and SOS Web Client to visualize and download information, to name a few. The EMSODEV mainly comprises of the EMSO Generic Instrument Module (EGIM), the EGIM SOS Gateway, the EMSODEV Data Management Platform, and the EMSO Portal. Besides the two related advances mentioned above, the OOI Cyberinfrastructure (CI) is also of great relevance to sensor web applications. Based on industry best practices, the design and implementation of OOI CI use a decentralized, coordinated architecture for the optimization of data storage and delivery, data security and integrity, and quality of service requirements. The core of the OOI CI software is the uFrame-based OOINet, which is service-oriented and integrates a set of instruments, platform drivers, and data as well as data product algorithms to deliver various data products on demand to the user community.
The remainder of the paper is organized as follows. In Section 2, the plug-and-play sensor web architecture is proposed in terms of functional layers, plug-and-play mechanism and operational information flow. In Section 3, the feasibility of the proposed architecture is demonstrated with the prototype system implementation. In Section 4, the prototype system experiment is conducted, and its practical performance is evaluated. Section 5 discusses and concludes the paper.

2. Plug-and-Play Sensor Web Architecture

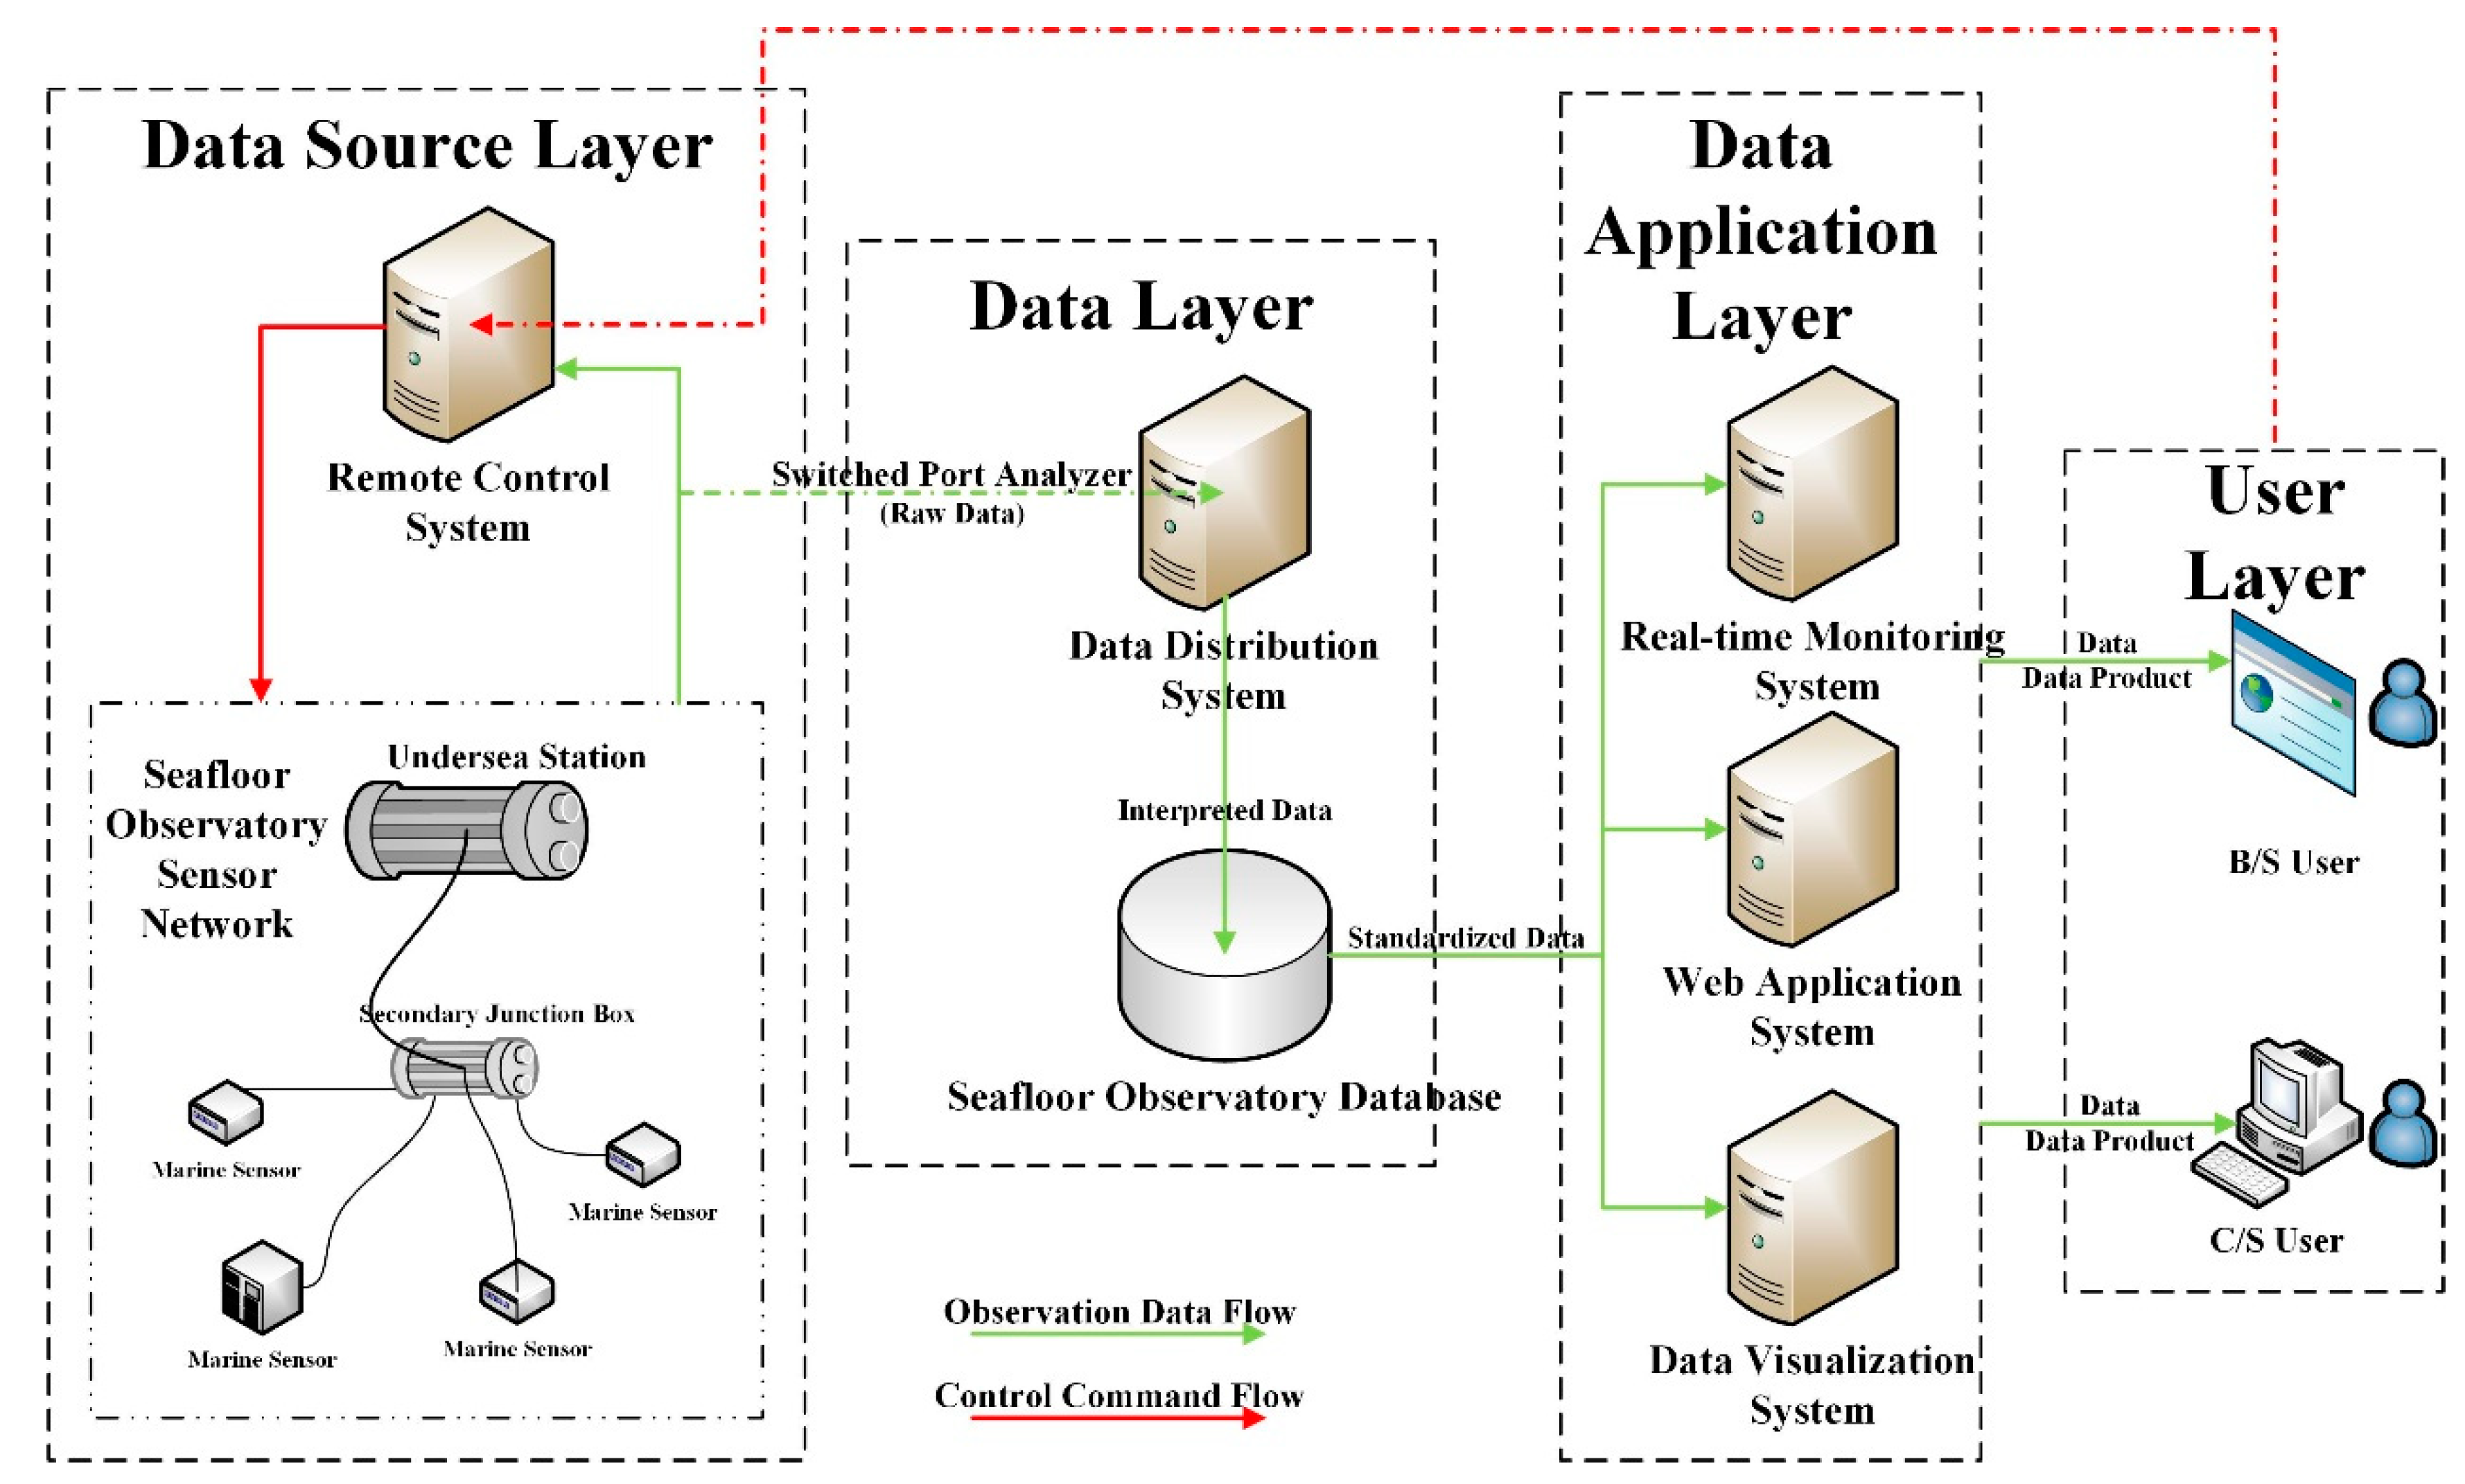
2.1. Layered Architecture

Based on the communication paths of both observation data flow (the green line in Figure 1) and control command flow (the red line in Figure 1) within the sensor web for cabled seafloor observatories, the sensor web architecture (SWA) is structured into four layers: the data source layer, the data layer, the data application layer, and the user layer. Different components within the four layers interact in an information-oriented way, fulfilling the life cycle of the two information flows within the seafloor observatory sensor web.

2.1.1. Data Source Layer

The data source layer senses the marine environment and provides the raw observation data for the SWA. The raw data are obtained by in situ sensor systems in accordance with real-time control plans and dynamic observation demands and lay the foundation for data applications of the SWA. The data source layer commonly refers to the remote-control system and undersea sensor networks comprising of undersea stations, secondary junction boxes, and various types of marine sensors. The control system guarantees that permitted users send commands to remotely control in situ marine sensor networks. The data source layer thus enables the long-term, continuous, and adaptive data acquisition for the SWA.

2.1.2. Data Layer

The data layer converts the raw data into qualified multidisciplinary datasets in the database and manages metadata and related data products. The data layer contains the data distribution system and the seafloor observatory database. The data distribution system receives the raw data from cabled seafloor observatories in a real-time and continuous way. Once received, the data distribution system interprets and standardizes the raw data before storing them in the seafloor observatory database with data processing logs provided. Real-time data reception, interpretation, processing, storage, and management for the SWA are accordingly realized in the data layer.

2.1.3. Data Application Layer

The data application layer is a function-oriented layer that builds various data application services such as observation data visualization and analysis, seafloor observatory monitoring and control, and marine sensor web data sharing. The services operate various types of data in the seafloor observatory database on demand and return the outputs to the user layer. The outputs could be returned in different forms including data tables, data curves, in situ videos, and so on. Based on the architecture protocol between the user layer and the data application layer, the outputs could be returned in client software, browsers, and web services. The data application layer mainly comprises of the real-time monitoring system of cabled seafloor observatories, the data visualization system, and the web application system. The monitoring system monitors the running state of cabled seafloor observatories and detects any system exceptions such as abnormal power supply of junction boxes in a real-time way. Meanwhile, the monitoring system provides emergency response capabilities that guarantee normal operation of the system to the maximum extent. The web application system provides functions such as data query and data downloading, making sensor resources available on the web.

2.1.4. User Layer

The user layer calls various application software systems in the data application layer and produces new observation demands for operational seafloor observatories based on data analysis results. The user layer consists of administrators, scientists, engineers, the public, government users, and so on. One special group is the administrators of the remote-control system for cabled seafloor observatories. In view of data monitoring and analysis results from the real-time monitoring system, these users generate dynamic sensor control requirements and remotely configure in situ sensors via the remote-control system. In this way, raw data are obtained in the data source layer in accordance with dynamic observation demands, and close-loop observation of the SWA is enabled.

2.2. Plug-and-Play Mechanism

Plug-and-play is defined as a process that standardizes sensor control and data processing for cabled seafloor observatories. In this process, any sensor newly added to the observatory network is interfaced and remotely controlled in a dynamic way. Any new raw data obtained by the added or reconfigured sensor are simultaneously interpreted and stored in a standardized way, without interfering current system operations. In the context of the SWA, the process of plug-and-play is mainly enabled at the data source layer and the data layer. The proposed plug-and-play mechanism differs from solutions of other observatories in no extra protocol requirements for sensor control and data acquisition at the sensor level and the expansion of dynamic sensor data interpretation and storage at the sensor web level, which will be detailed and discussed in the following sections.

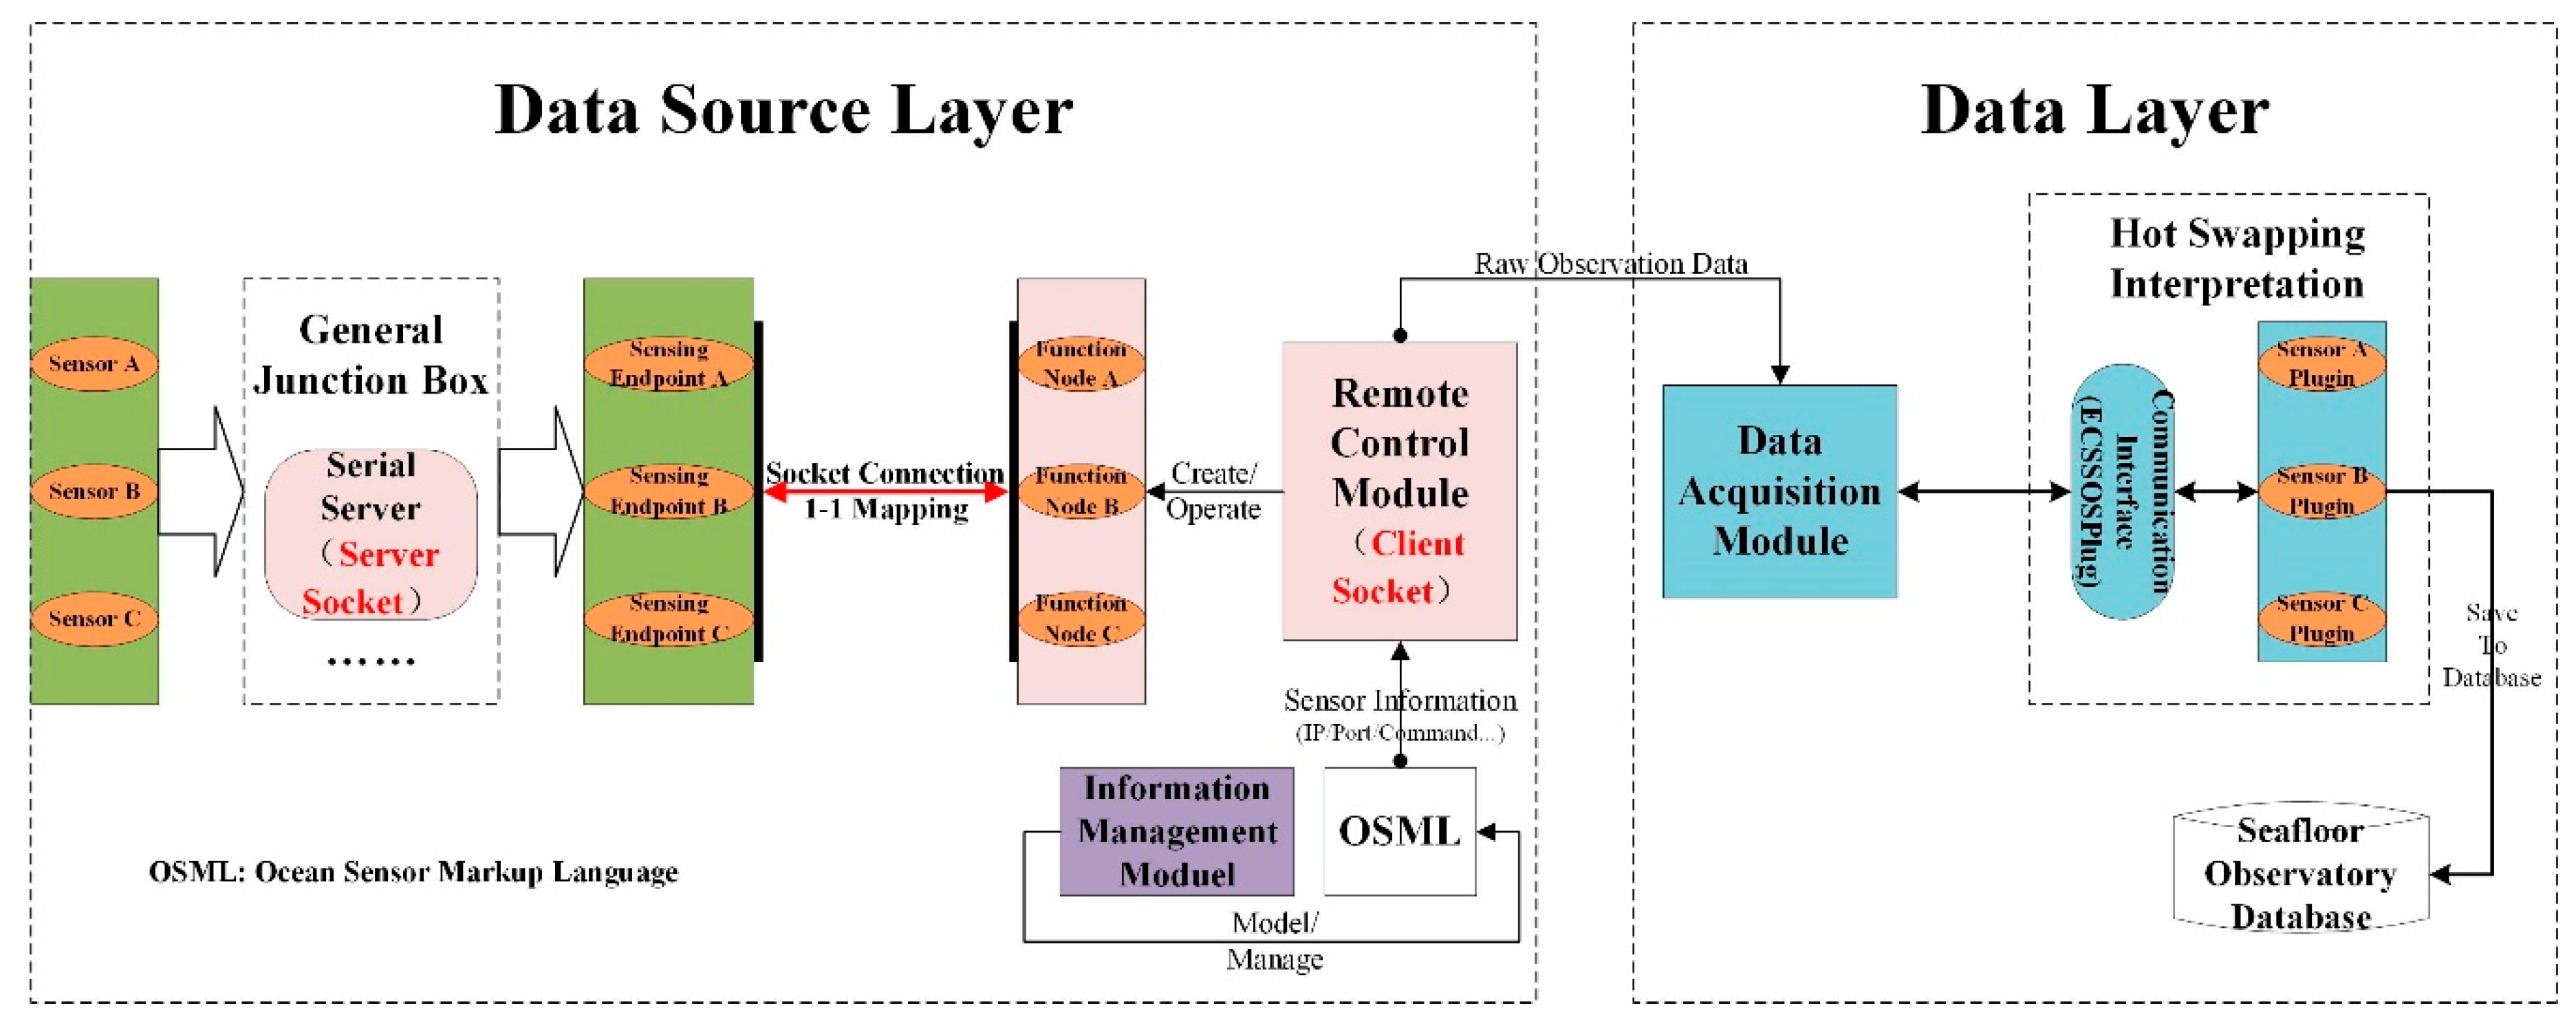
2.2.1. GOE Control Method at the Data Source Layer

Regarding the data source layer of the SWA, the general junction box (GJB) (manufacturer, city and country) dynamically interfaces and networks various marine sensors attached while the ocean sensor markup language (OSML) models the sensor information that contributes to the remote hot swapping control of in situ sensors in a standardized way [46]. The GJB-OSML enabled control method (GOE Control Method) is thus proposed as the plug-and-play solution at the data source layer. The GOE Control Method is detailed as follows.
On the one hand, GJB is designed with function modules that supply power to and communicate with all the attached observatory sensors. The modules include a communication control module, a power supply and allocation module, a photoelectric conversion module, a monitoring module, a short circuit and leakage protection module, and so on. The monitoring module is implemented with the multichannel special voltage detection board to check the working voltage of attached marine sensors and various modules of GJB and return the status data for real-time monitoring. In terms of the communication control module, GJB is particularly implemented with a smart serial server that bidirectionally completes the transparent conversion between serial communication and Ethernet communication. The serial server creates a server socket using TCP/IP protocol with the allocated independent IP address and corresponds each physical port with a unique port number. Every marine sensor attached to GJB is thus automatically allocated a unique IP address/port number pair and is dynamically represented as a Sensing Endpoint in the observatory network. A Sensing Endpoint is identified by the unique IP address/port number pair and is thus network-addressable. With the unique information provided by the Sensing Endpoint, a socket connection is established, and the sensor connected to that corresponding physical port of GJB is exposed as a sensor web resource on the Internet. The bidirectional transmission of observation data/control commands is finally enabled using this socket connection. In this way, GJB succeeds in dynamically interfacing and networking marine sensors as corresponding Sensing Endpoints that allow for bidirectional data communications in cabled seafloor observatories.
On the other hand, the object-oriented OSML is designed with customized XML elements that accurately describe all the information for remote communication and control of in situ marine sensors. The elements are grouped by different sets of tags, based on which the whole sensor control logic is stated, and all the control related parameters are mapped and encoded. The sets of tags cover sensor communication and control, sensor commands, sensor parameters, and sensor data. Regarding the sensor communication and control element, it mainly contains the tag of <SensorControl> and secondary nested tags of <Name>, <Node>, <IP>, <Port>, and <DefaultCommand>. The tags <Node>, <IP>, and <Port> basically encode the parameters of GJB level configuration; while the tag <DefaultCommand> encodes the default command of the sensor named in accordance with the tag <Name>. Based on component technology, the encoded sensor commands are managed and displayed in a tree structure using corresponding instantiated OSML files and methods provided by the dynamic link library and NET class. With the OSML elements properly nested and marked up, component-oriented modules of the remote-control system process the OSML tags in a dynamic and standardized way as shown in Figure 2. Once any new sensor is added or any current sensor is reconfigured, the information management module accordingly calls methods to update instantiated OSML files with no effects on current system operations. The remote-control module then establishes socket connections by loading the updated OSML information and executes control functions on newly added or reconfigured sensors with no interference to other oceanographic instrumentation. In this way, OSML manages to model marine sensor information and contributes to remotely controlling cabled observatory sensor systems in a standardized way.
In addition, the Function Node is particularly designed to enable the remote communication between the remote-control system and in situ marine sensors. The Function Node encapsulates the information of IP address/port number and displays as the tree node in the main interface. As every sensor in cabled seafloor observatories corresponds to a unique pair of IP address/port number, the remote-control system utilizes the same information pair modeled by OSML to create and operate a Function Node that acts as the agent of the in situ sensor. One-to-one mapping is thus built between every Sensing Endpoint and every Function Node by the IP address/port number pair, which are further passed to the socket as parameters to establish a remote connection. Control commands are finally transmitted via this remote connection for dynamically managing in situ sensors and obtaining observation data.
In this way, the GOE Control Method enables the standardization of sensor control and data acquisition at the data source level.

2.2.2. Hot Swapping Interpretation Method at the Data Layer

The second plug-and-play mechanism of the proposed SWA starts at the data layer. In terms of the data distribution system, the data interpretation and storage module is the most challenging to design. Seafloor observatory sensors are heterogeneous and dynamically updated, and observation data from each type of sensor demand a specific code for interpretation whose repeatability is low. The Hot Swapping Interpretation Method is thus proposed to enable a flexible and dynamic interpretation of all the raw observation data received by the data distribution system. In this way one particular hot-swapping process does not interfere with the interpretation and storage of other sensors, and the whole process of data interpretation and storage module does not affect the data acquisition module and the data display module [47]. This is identical to a hot-swappable U disk that has no other effects on the computer or itself.
As shown in Figure 2, the Hot Swapping Interpretation Method is formed by two parts: one is the communication interface for the information exchange between the main program and the data interpretation process; the other is the function to achieve the process of data interpretation and storage. The communication interface named “ECSSOSPlug.cs” contains two methods, of which the “OnGetData” method forwards data from the main program to the data interpretation process while the “OnShowInfo” method feeds back interpretation problems to the main program and generates log files. In terms of implementing the function, each type of sensor data interpreter is packaged into one dynamic link library (e.g., SBE26Plugin.dll) that implements these two methods of the communication interface and completes appropriate sensor data interpretation. Data interpreters run as a separate thread in the data distribution system, the loading and unloading of which are implemented by the .NET Console Class containing a reflex method called Assembly. All the plug-ins of the current system are added and shown in a list.
The communication interface contributes to data interactions between the data acquisition module and data interpreters and guarantees that the update of one particular data interpreter would not affect other parts of the data distribution system. Once the data acquisition module of the data distribution system acquires raw observation data, it triggers the communication interface and passes the data to data interpreters. Data interpreters then determine data validity by the information stamp: the valid data are interpreted and stored by the corresponding sensor data interpreter while the invalid data are discarded. If an error occurs in the interpretation process, the message is automatically returned to the main program, and the corresponding error log is generated for optimizing the subsequent program. The interpreted data are finally stored in the seafloor observatory database by the “Savetodatabase” dynamic link library.
Based on the hot swapping interpretation method, the data distribution system is enabled to dynamically interpret and standardize the raw data into physically meaningful data before storing them in the database. This data processing chain is further illustrated in the following steps: (1) acquire raw observation data; (2) check data formats and integrity; (3) process head file information such as data identifier and junction box time stamp; (4) read binary data for separate distinction; (5) normalize data formats including string manipulation, time format interpretation and log file processing; (6) interpret the raw data in accordance with corresponding sensor data descriptions; (7) encapsulate the interpreted data in a uniform format; (8) operate the seafloor observatory database for inserting new data and related data interactions. Particularly, all the basic steps above except the one-to-one mapped sensor data interpretations are written into common dynamic link libraries for improving data processing efficiencies. In this way, the Hot Swapping Interpretation Method contributes to the standardization of sensor data interpretation and storage at the data level.
With the GOE Control Method and the Hot Swapping Interpretation Method proposed at the data source layer and data layer, both sensor data acquisition and sensor data interpretation and storage are enabled in a plug-and-play way. The standardized data lay a solid foundation for the whole plug-and-play data processing chain in the sensor web architecture (SWA).

2.3. Operational Information Flow

The SWA contains two types of information flow, the lifecycle and communication path of which are completed by the interactions of different components within the four SWA layers. The observation data flow (green) contain the scientific data and status data acquired from various seafloor observatory sensors, while the control command flow (red) stand for various commands sent to in situ marine sensors from the remote-control center based on real-time observation demands.
Once the remote-control system connects with in situ marine sensor networks, various types of sensor equipment execute control commands and acquire raw data. The raw observation data and status data are remotely transmitted to the control and data center via undersea junction boxes, the submarine electro-optic communications cable and the shore station. At the shore station, SPAN (Switched Port Analyzer) is adopted to mirror all the transmitted raw data packets to the destination port for the data distribution system to interpret and standardize before storing them in the seafloor observatory database. Data application systems such as the web application system furthermore operate various types of data in the seafloor observatory database on demand and return the outputs to users, completing the data processing chain for cabled seafloor observatories (the illustration of green information flow in Figure 1). Meanwhile, the remote-control system send various commands to control in situ marine sensors based on real-time data monitoring and analysis results as well as dynamic observation demands of the observatory. The commands are reversely transmitted in the same way as the raw observation data are transmitted to the control and data center. In this process the junction box plays a role in redirecting these commands to corresponding undersea sensors to control their working status (the illustration of red information flow in Figure 1).
Based on the plug-and-play architecture, the sensor web prototype (ESOSW) is designed as a data flow processing oriented, web-based, and module-integrated sensor web prototype for cabled seafloor observatories (as shown in Figure 3). The core of ESOSW is data centered on which a series of network technologies and software engineering technologies are combined to build the seafloor observatory database and various application systems. ESOSW thus enables real-time seafloor observation data acquisition, processing, storage, analysis, and interoperation as well as remote control and monitoring of in situ sensor systems. ESOSW is implemented in a mixed mode of client-server (C/S) and browser-server (B/S), of which the remote control system, the real-time monitoring system, the data distribution system, and the data visualization system are implemented in a C/S mode while the web application system is implemented in a B/S mode.

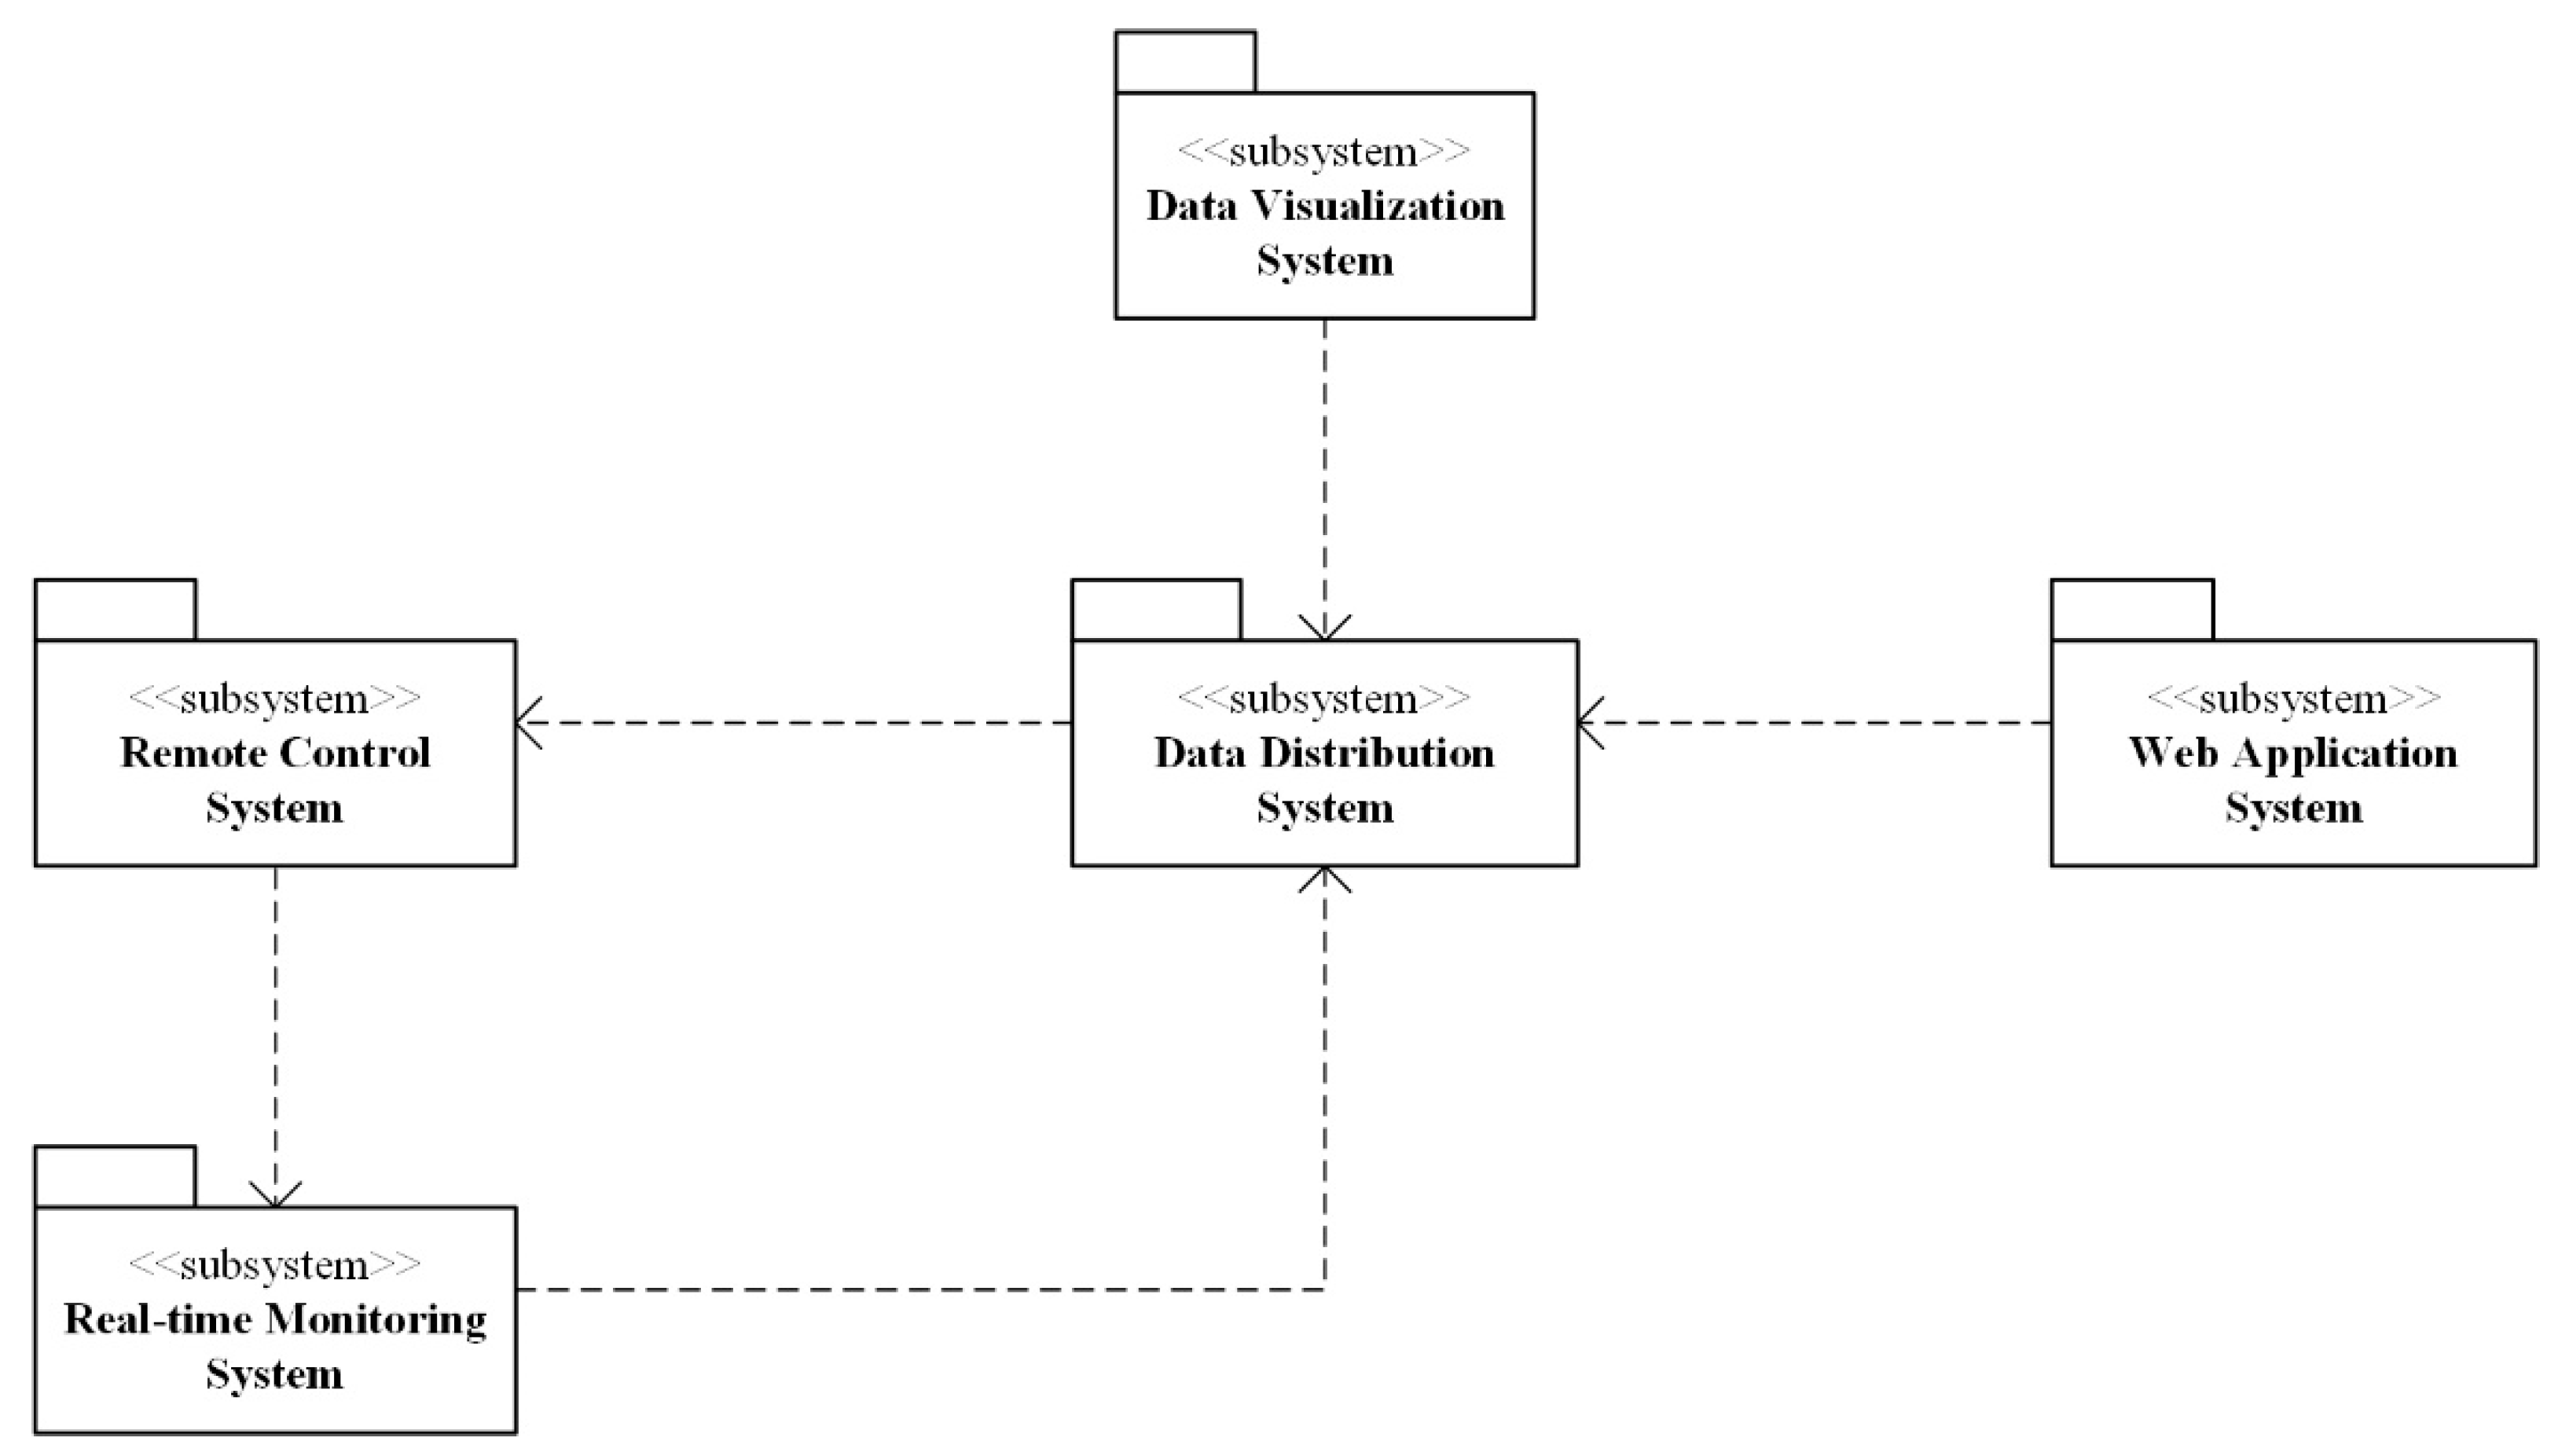
3. Prototype System Implementation

3.1. Incremental Releases

The capabilities of the seafloor observatory sensor web are designed with an incremental transition to operations. Specifically, the design supports four incremental releases of the sensor web prototype that increasingly provide the user with relevant processes from automated data storage and distribution to interactive seafloor observatories and ocean science. Even though multiple sensor web components and subsystems are developed simultaneously, each release targets a specific theme providing end users with the value built on the previously delivered. The four releases support user applications as follows.
Release 1: provides the data distribution service capable of real-time observation data acquisition, interpretation, storage, visualization, and dissemination, supporting the immediate needs of seafloor observatory data applications.
Release 2: delivers the sensor control service to add remote control of in situ marine sensors and of how raw observation data are acquired, supporting more advanced processes on-demand measurement.
Release 3: delivers the numerical model service to add real-time observation data assimilation and modelling, supporting more advanced workflows of ocean model-driven scientific seafloor observations.
Release 4: provides the complete seafloor observatory sensor web to serve the closed loop sensing, modeling and analysis, and distributed network control, supporting interactive and transformative ocean observatory science for all users.
In terms of project requirements, the sensor web prototype for cabled seafloor observatories in the East China Sea (ESOSW) conforms to Release 2, of which designing and developing the remote-control system is one priority.

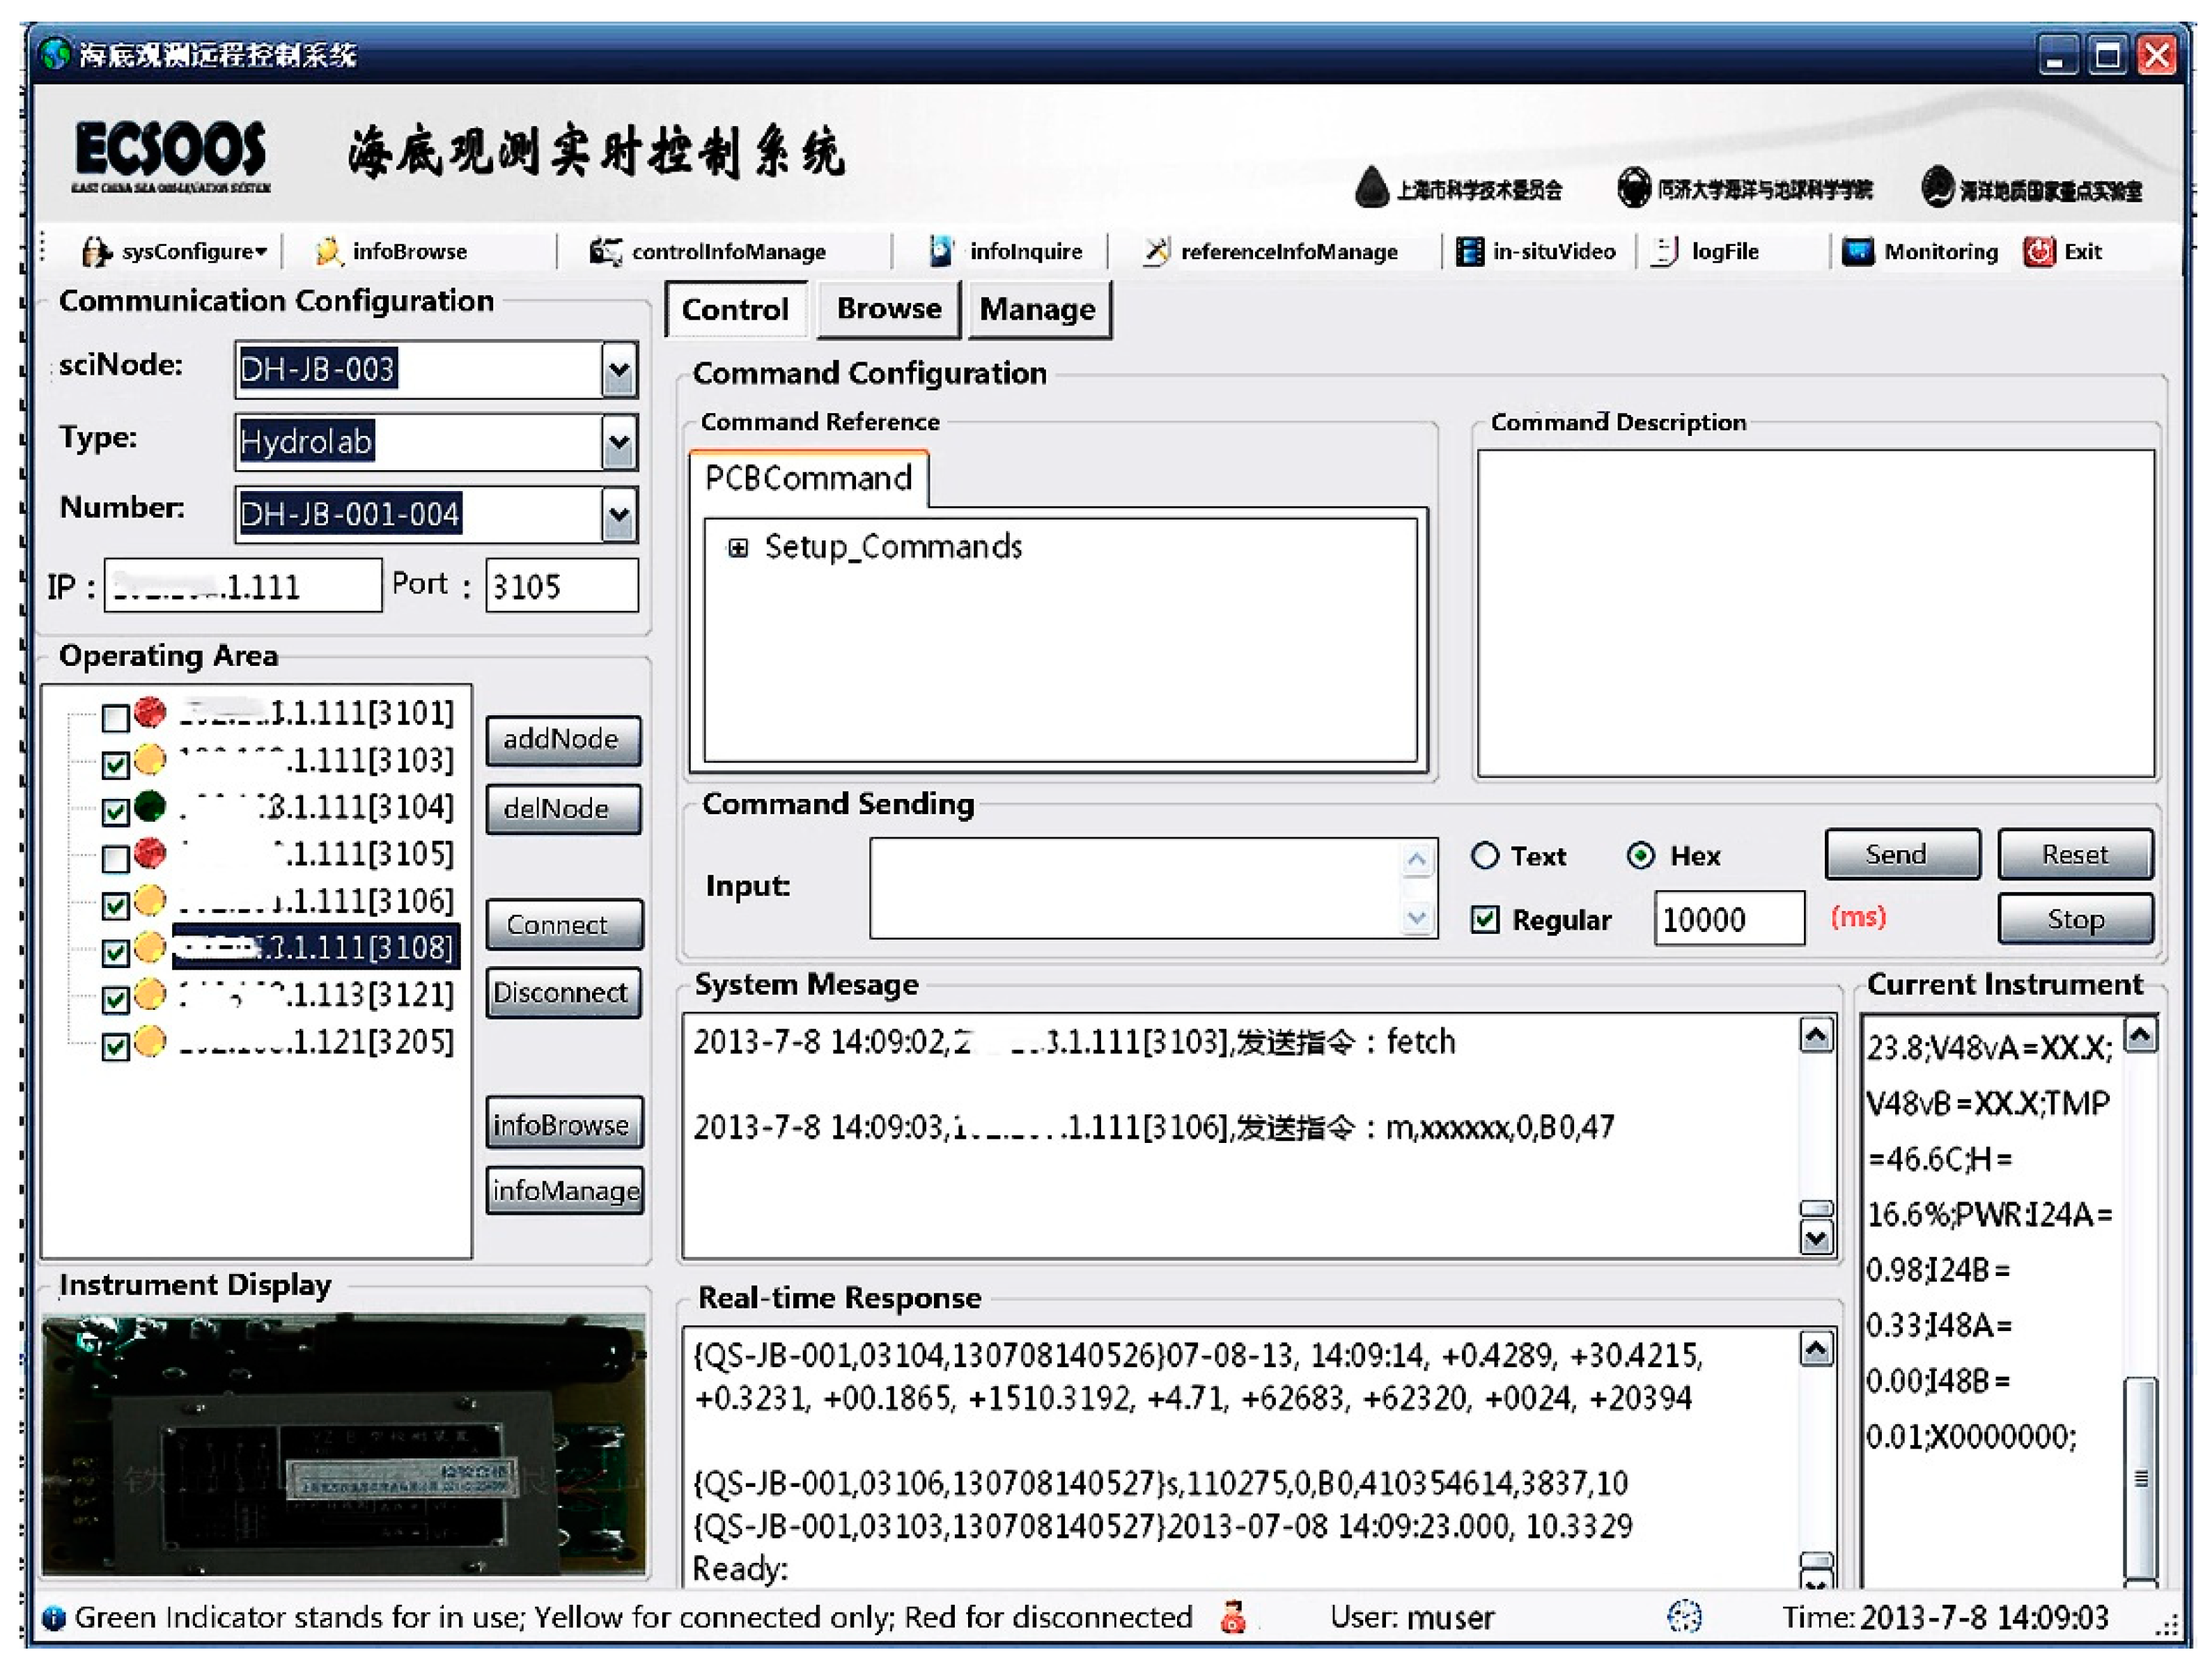
3.2. Remote Control System

The remote-control system is one of the most important subsystems of ESOSW. The remote-control system guarantees that permitted users could remotely control the deployed seafloor observatory sensor equipment by sending control commands at the control center. With the information-oriented sensor web architecture and the GOE Control Method proposed in Section 2, the remote-control system is implemented as a web-based, module-integrated, plug-and-play marine sensor control system in a C/S mode [46]. Regarding the server component, an embedded Linux programmed communication control module is introduced in the general junction box (GJB) to provide the transparent conversion between serial communication and network communication for receiving and sending data. Major business functions of the remote-control system are realized by the client component (ESOCS) consisting of five modules, namely, a remote-control module, an information retrieval module, an information management module, a system management module, and a user management module. ESOCS is programmed with.NET Framework Socket, the database of which is established with OSML.
The core module of ESOCS is the remote-control module, the functional process of which is enabled by submodule interactions. Based on real-time control demands, the communication configuration submodule first obtains the IP address and port number pair of the in situ sensor from the database and loads them in the main interface by the Function Node. The Function Node operation submodule then creates a socket endpoint to establish the remote connection with the in situ sensor and sends commands to control the specified sensor cooperating with the command configuration submodule, still all based on the Function Node. Meanwhile the interaction response submodule displays and stores all the raw seafloor observatory data and hands the status data to the real-time monitoring submodule for data interpretation and analysis. Finally, the interpreted information combined with the in situ video monitoring submodule would in return contribute to generating real-time control demands, which completes the whole control flow cycle within ESOCS. In this way, the remote-control module manages to control all the seafloor observatory sensor equipment in a real-time and dynamic way (seen in Figure 4).
The information management module of ESOCS is implemented to dynamically manage (add/delete/edit) and update the information for remote sensor control in the main interface and synchronously update the changes in the database of OSML files. This design contributes to a more dynamically reconfigurable and synchronous multisensory control. The information retrieval module of ESOCS provides all the basic information and statistical information related to the sensors deployed in cabled seafloor observatories. The system management module of ESOCS supports basic functions such as querying system log files and configuring the refresh rate for data display containers (e.g., real-time response area) while executing various control operations. The user management module of ESOCS is implemented for system security via three-layer filtering: (i) invalidated users are not allowed to use ESOCS; (ii) permitted users are assigned different levels of administrative authority to perform control operations; (iii) all the ESOCS user operations are automatically recorded in log files, defining responsibility to some extent.

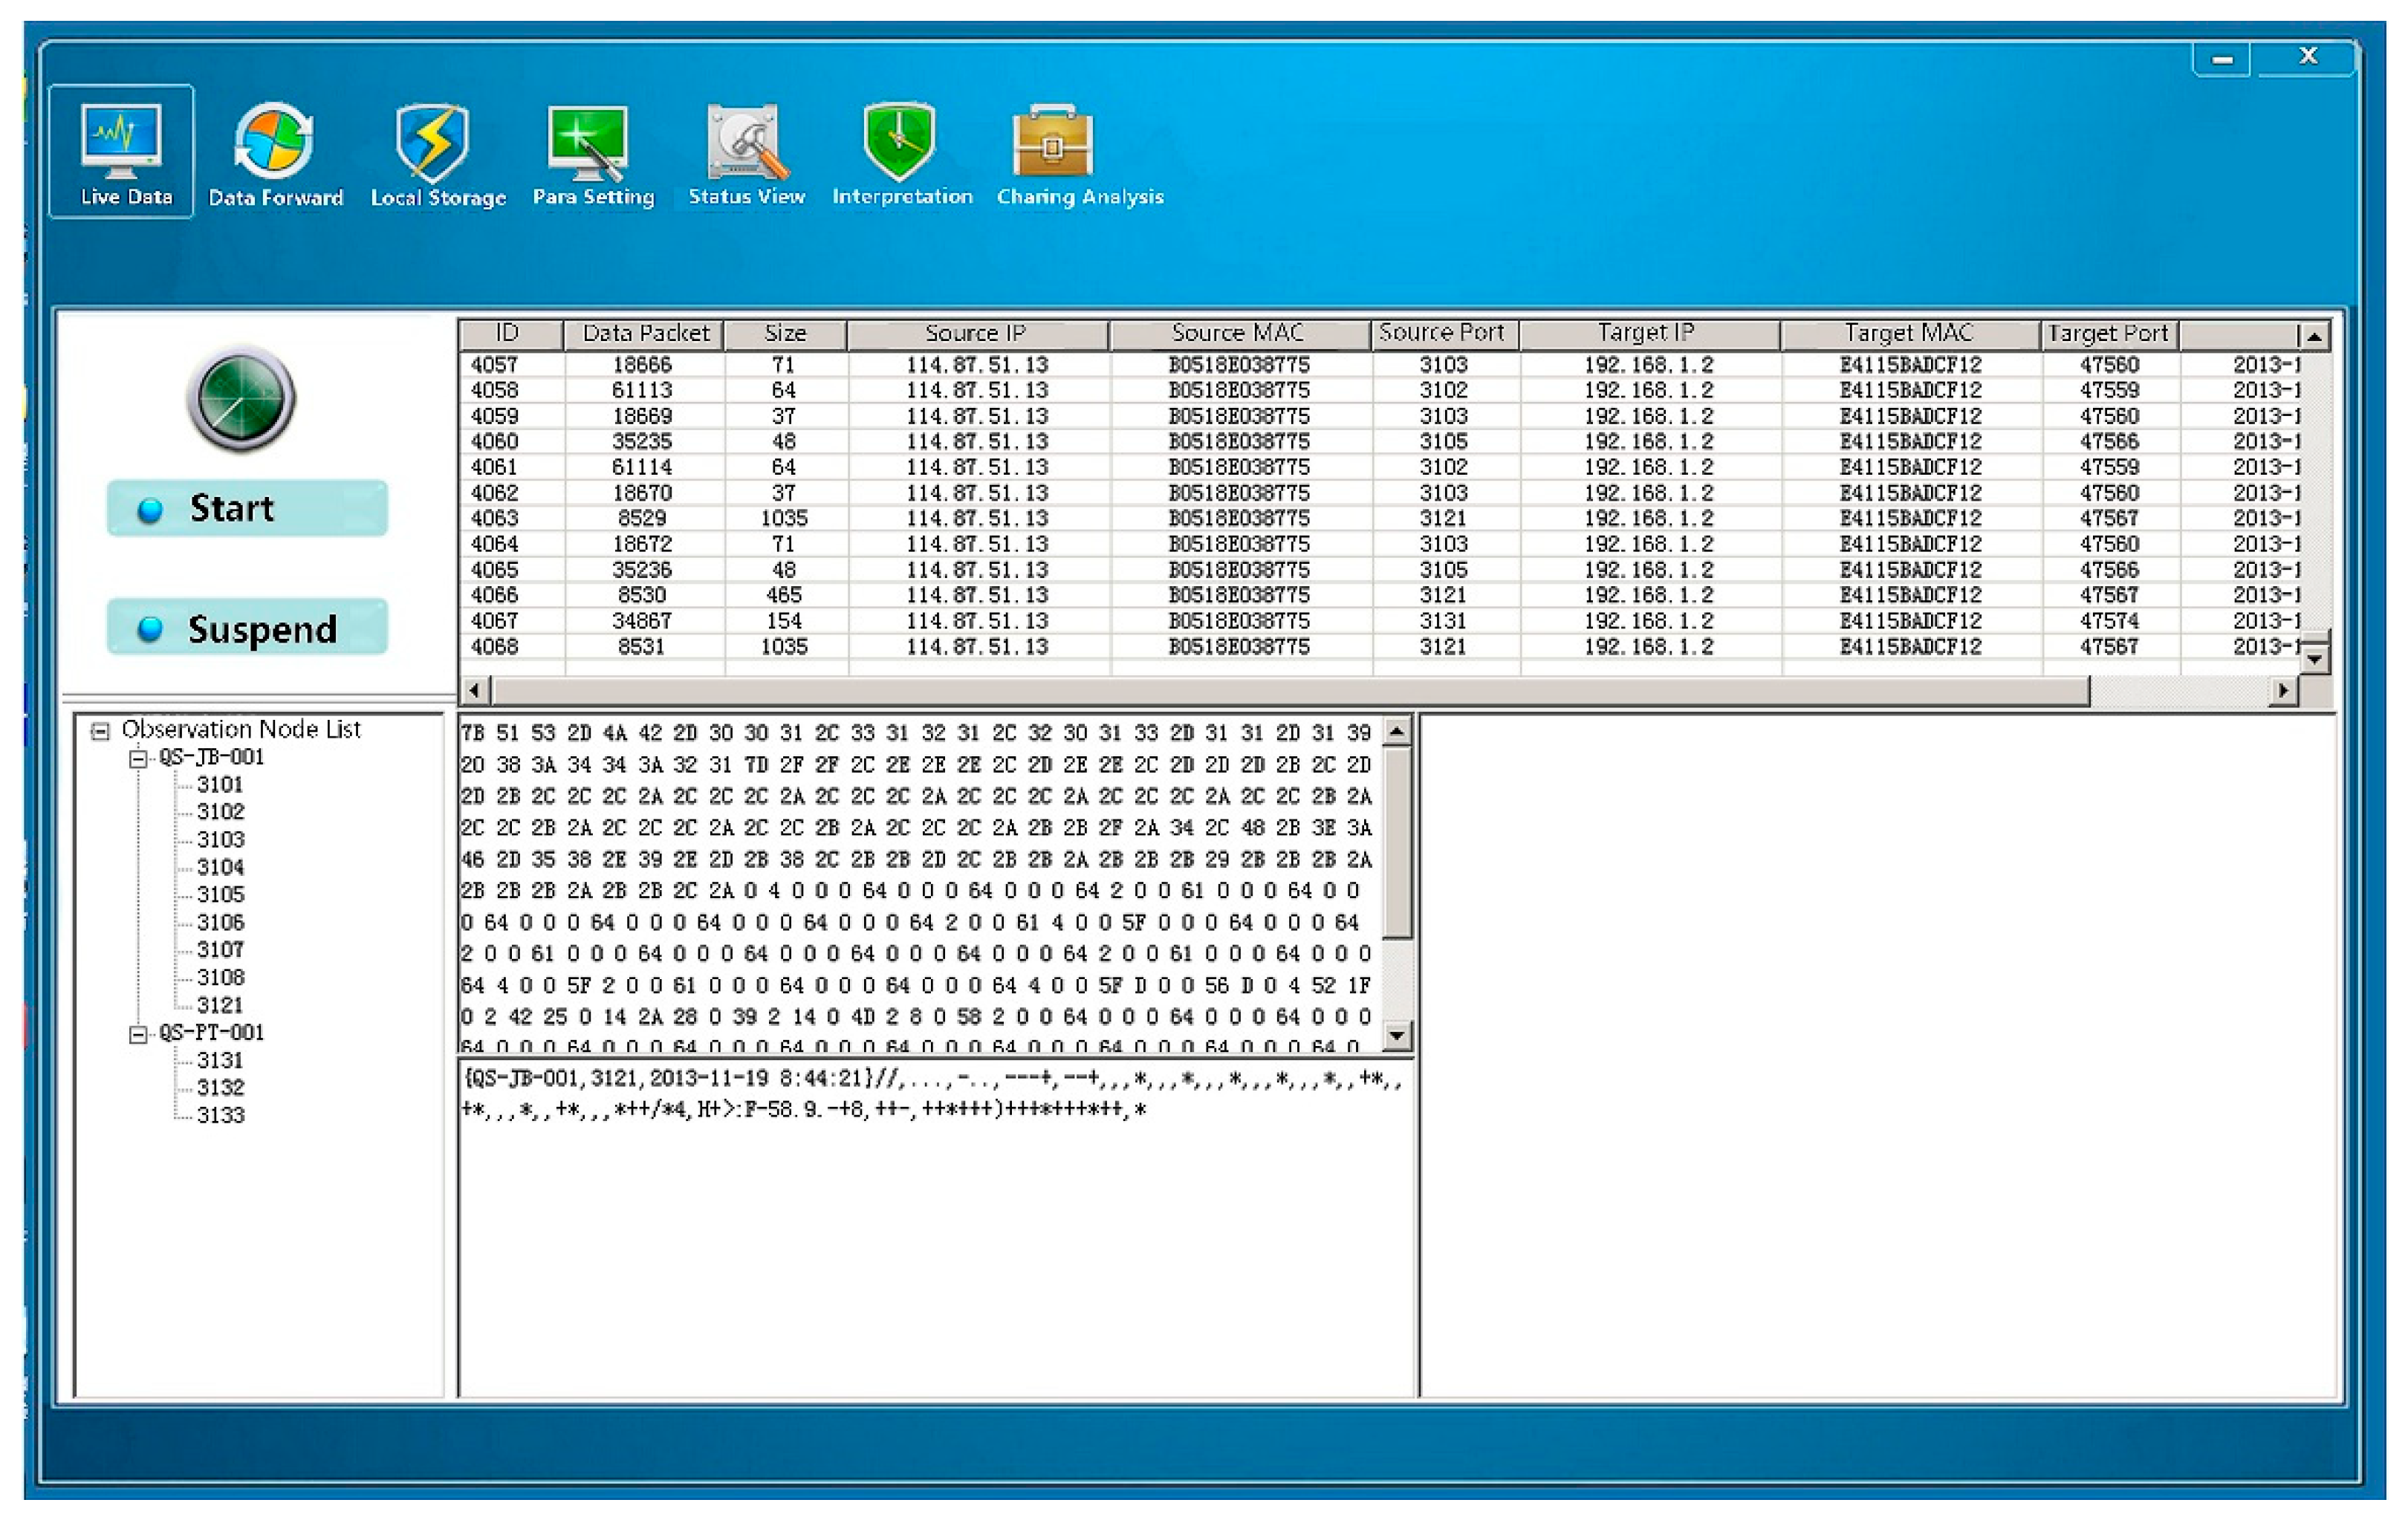
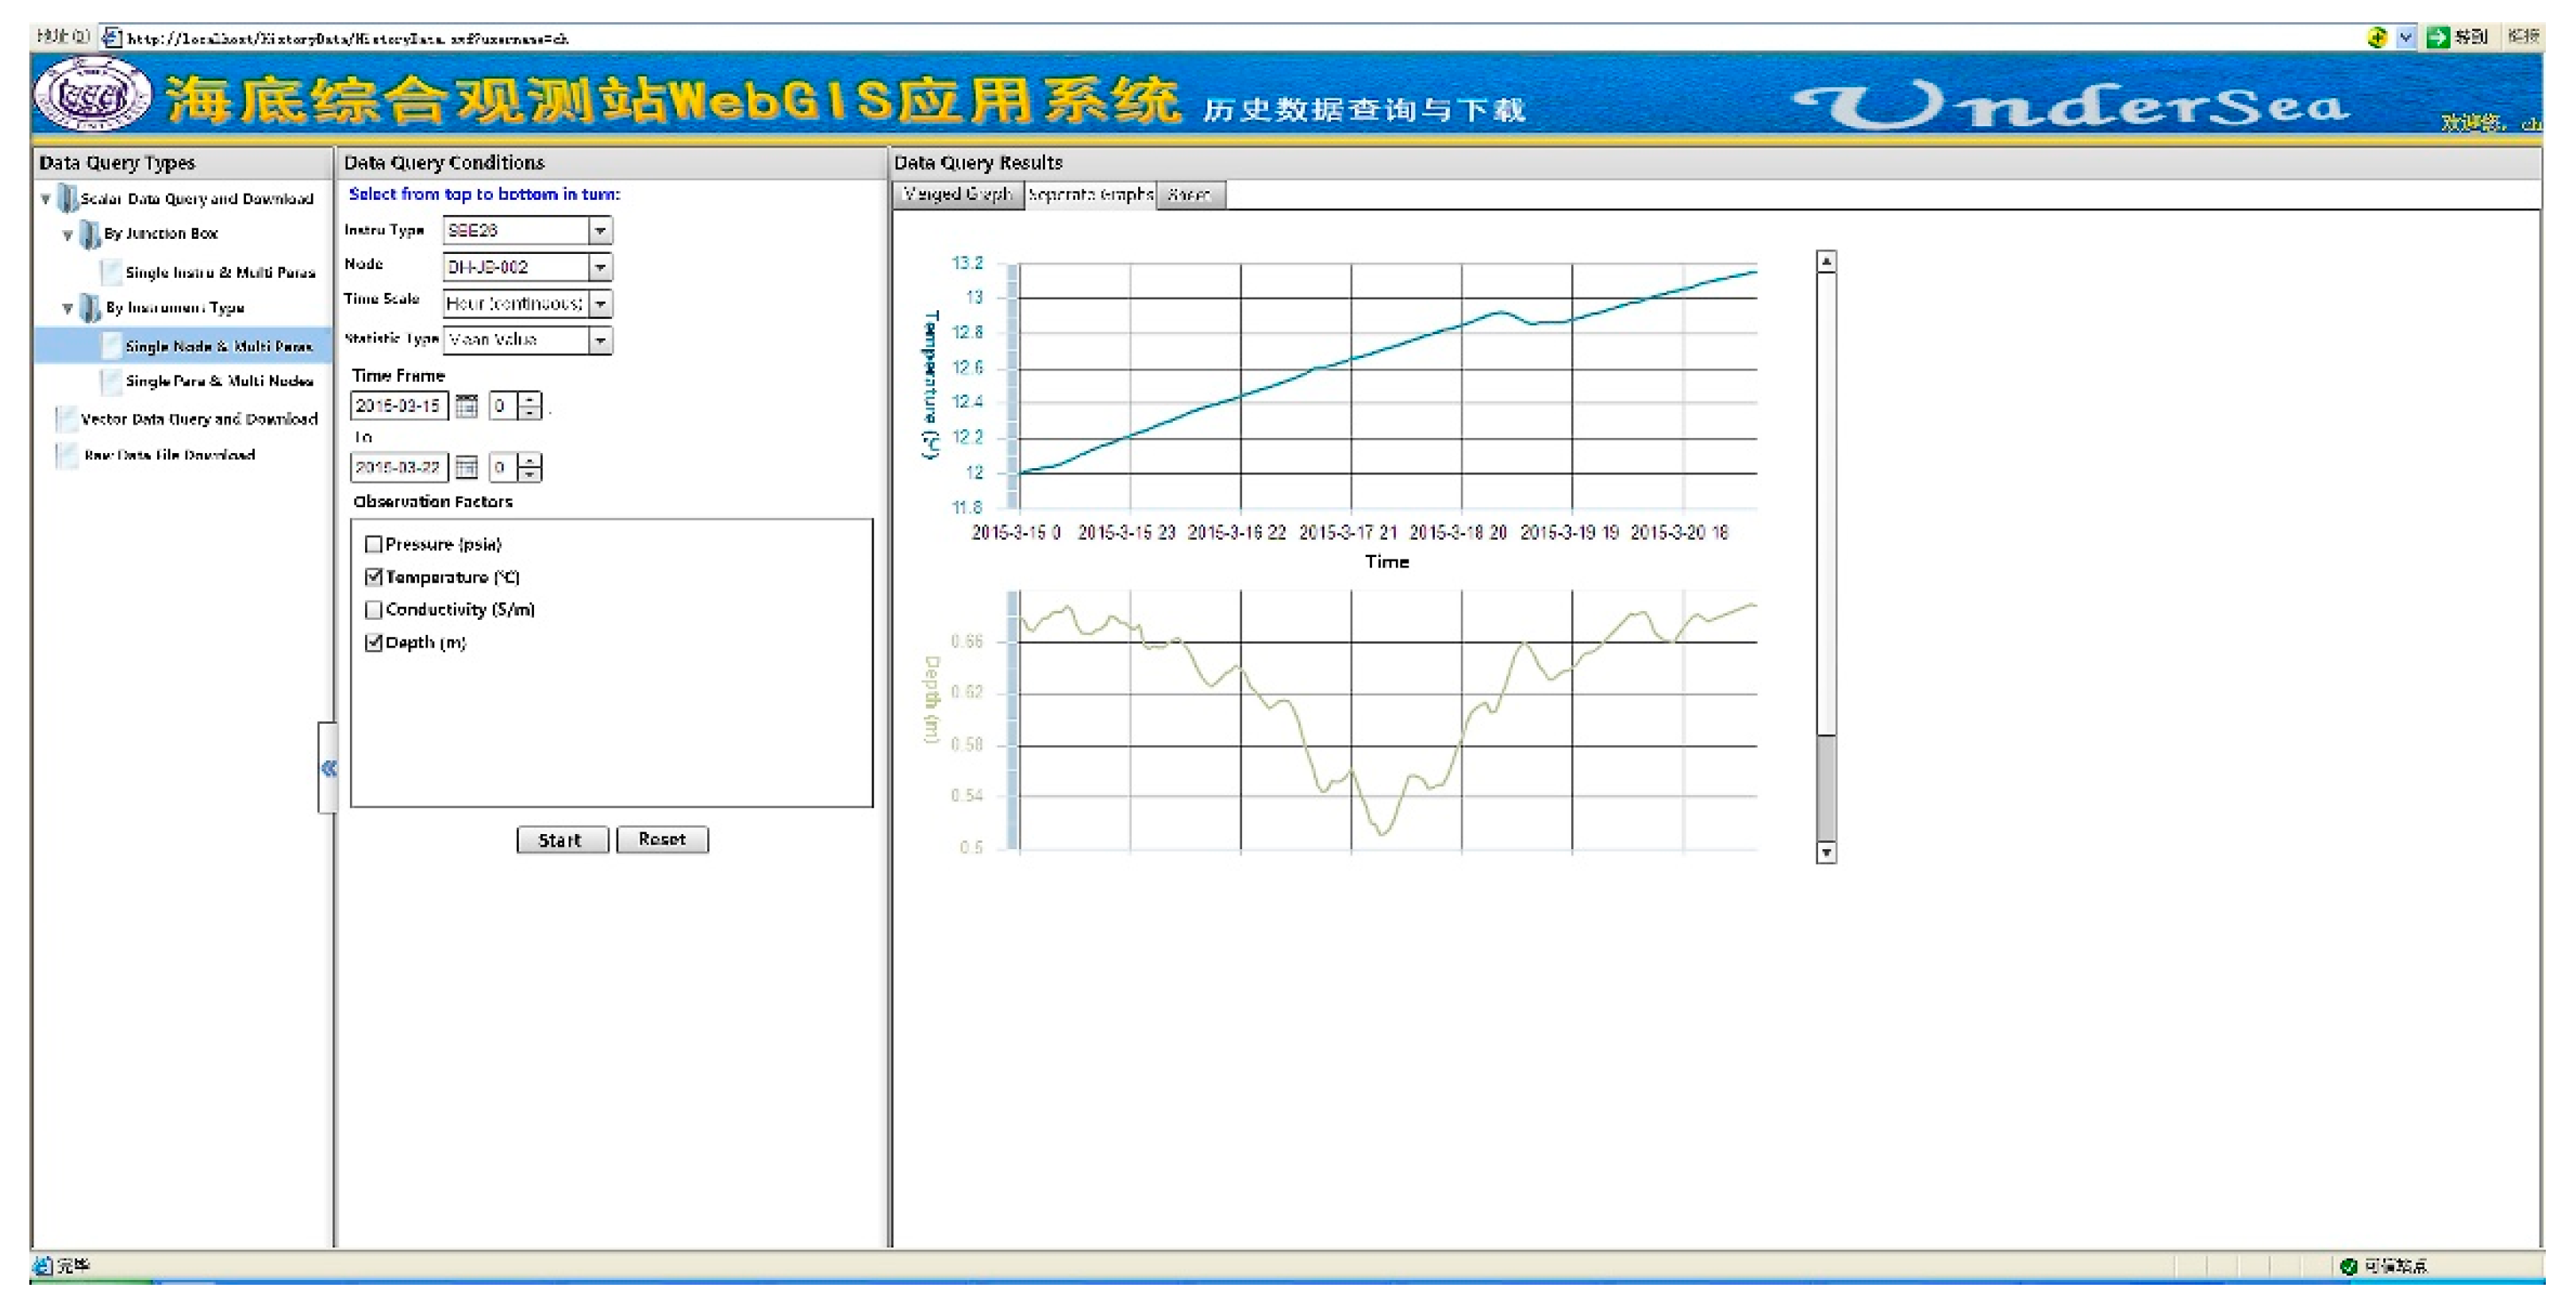
3.3. Data Management System

The data management system supports real-time observation data acquisition, interpretation, storage, visualization, and dissemination, major components of which are the data distribution system (ESODDS) and the web application system. ESODDS consists of three functional modules, namely, a data acquisition and transmission module, a data interpretation and storage module, and a data display module [47]. The data acquisition and transmission module acquires raw observation data and forwards them to secondary receiver terminals. The data interpretation and storage module interprets the real-time raw data and stores them in the seafloor observatory database, an SQL database. The data display module enables visualization of the interpreted observation data by accessing the seafloor observatory database, which could both run separately and be added to other systems like ESODDS to run as an external program. Three functional modules are developed in accordance with .NET standard components, of which the data acquisition and transmission module is the skeleton of ESODDS while the data interpretation and storage module and the data display module are added to the backbone respectively as plug-ins and add-ins in a loosely coupled way.
The data acquisition and transmission module acquires real-time raw observation data from in situ sensor systems via SPAN and forwards the raw data to secondary receiver terminals by establishing TCP socket connections. The data acquisition and transmission module is capable of connecting with and transmitting appointed raw data to multiple secondary receiver terminals in a real-time and synchronous way, in the process of which all these data and system running status data are automatically recorded by the module for subsequent data makeup and program improvements.
The data interpretation and storage module is the core module of ESODDS. The module gets data directly from the data acquisition and transmission module. This not only avoids interpretation errors caused by write faults of the data acquisition module but also reduces memory overhead caused by intermediate data access and further guarantees real-time demands of cabled seafloor observatories. As observatory sensors are heterogeneous and dynamically updated, the Hot Swapping Interpretation Method proposed in Section 2 is implemented by the module to solve the repeatability problem that observation data from each type of sensor demand a specific code for interpretation. The module thus calls different data interpreters for raw data interpretation and storage in a standardized way by unique sensor identifiers, in the process of which other functional modules are not affected.
In terms of data storage, abnormal data are eliminated by examining data repeatability, data length, and exception field. The abnormal data are particularly flagged by a data quality control method proposed for ECSSOS, which improves the autoregressive integrated moving average (ARIMA) model by using a sliding window to check and repair seafloor observatory data quality [48]. The method contains three parts: (1) a general pretest to detect and delete redundant data, label stuck values, and decide whether the data gap is suitable for interpolation; (2) data outlier detection methods to flag abnormal data points by range rationality test and ARIMA model based test; (3) a data interpolation method to repair suspect and missing data after assessment by providing alternative data values rather than removing or rejecting any data points. Furthermore, a quality control flag system is proposed to describe and append the data quality-related information with data sample records. Scientific data are thus managed in a unified manner in the seafloor observatory database, and different data access authorities are assigned to users and external systems. In addition, data entry integrality is examined by regularly accessing raw data files written by the data acquisition module and comparing the interpreted file data with data stored in the database. Real-time data interpretation of ESODDS is shown in Figure 5.
The web application system loads and processes the data on demand by connecting with the seafloor observatory database and shares observatory data resources on the Internet [49]. The web application system is developed in a B/S mode combined with Rich Internet Applications (RIA), a network application system that possesses system performance similar to traditional desktop systems and demands no extra support software when running on the browser. In the development process, web services are written in C# to operate the seafloor observatory database and are remotely invoked to provide functions such as map browsing, real-time data querying, historical data querying, and data downloading. The map browsing module mainly enables operations such as zooming in/out and moving around. The real-time data querying module provides users with real-time observation data in data tables and line charts from the specified sensor. The historical data querying module provides data in multiple statistical ways, the results of which are also displayed as data tables and line charts. As for the data downloading module, registered and authorized users are able to download data files (.dat) after submitting applications for their interested data. The prototype system is authorized to certain registered users to meet immediate demands of seafloor observatory data applications (seen in Figure 6).

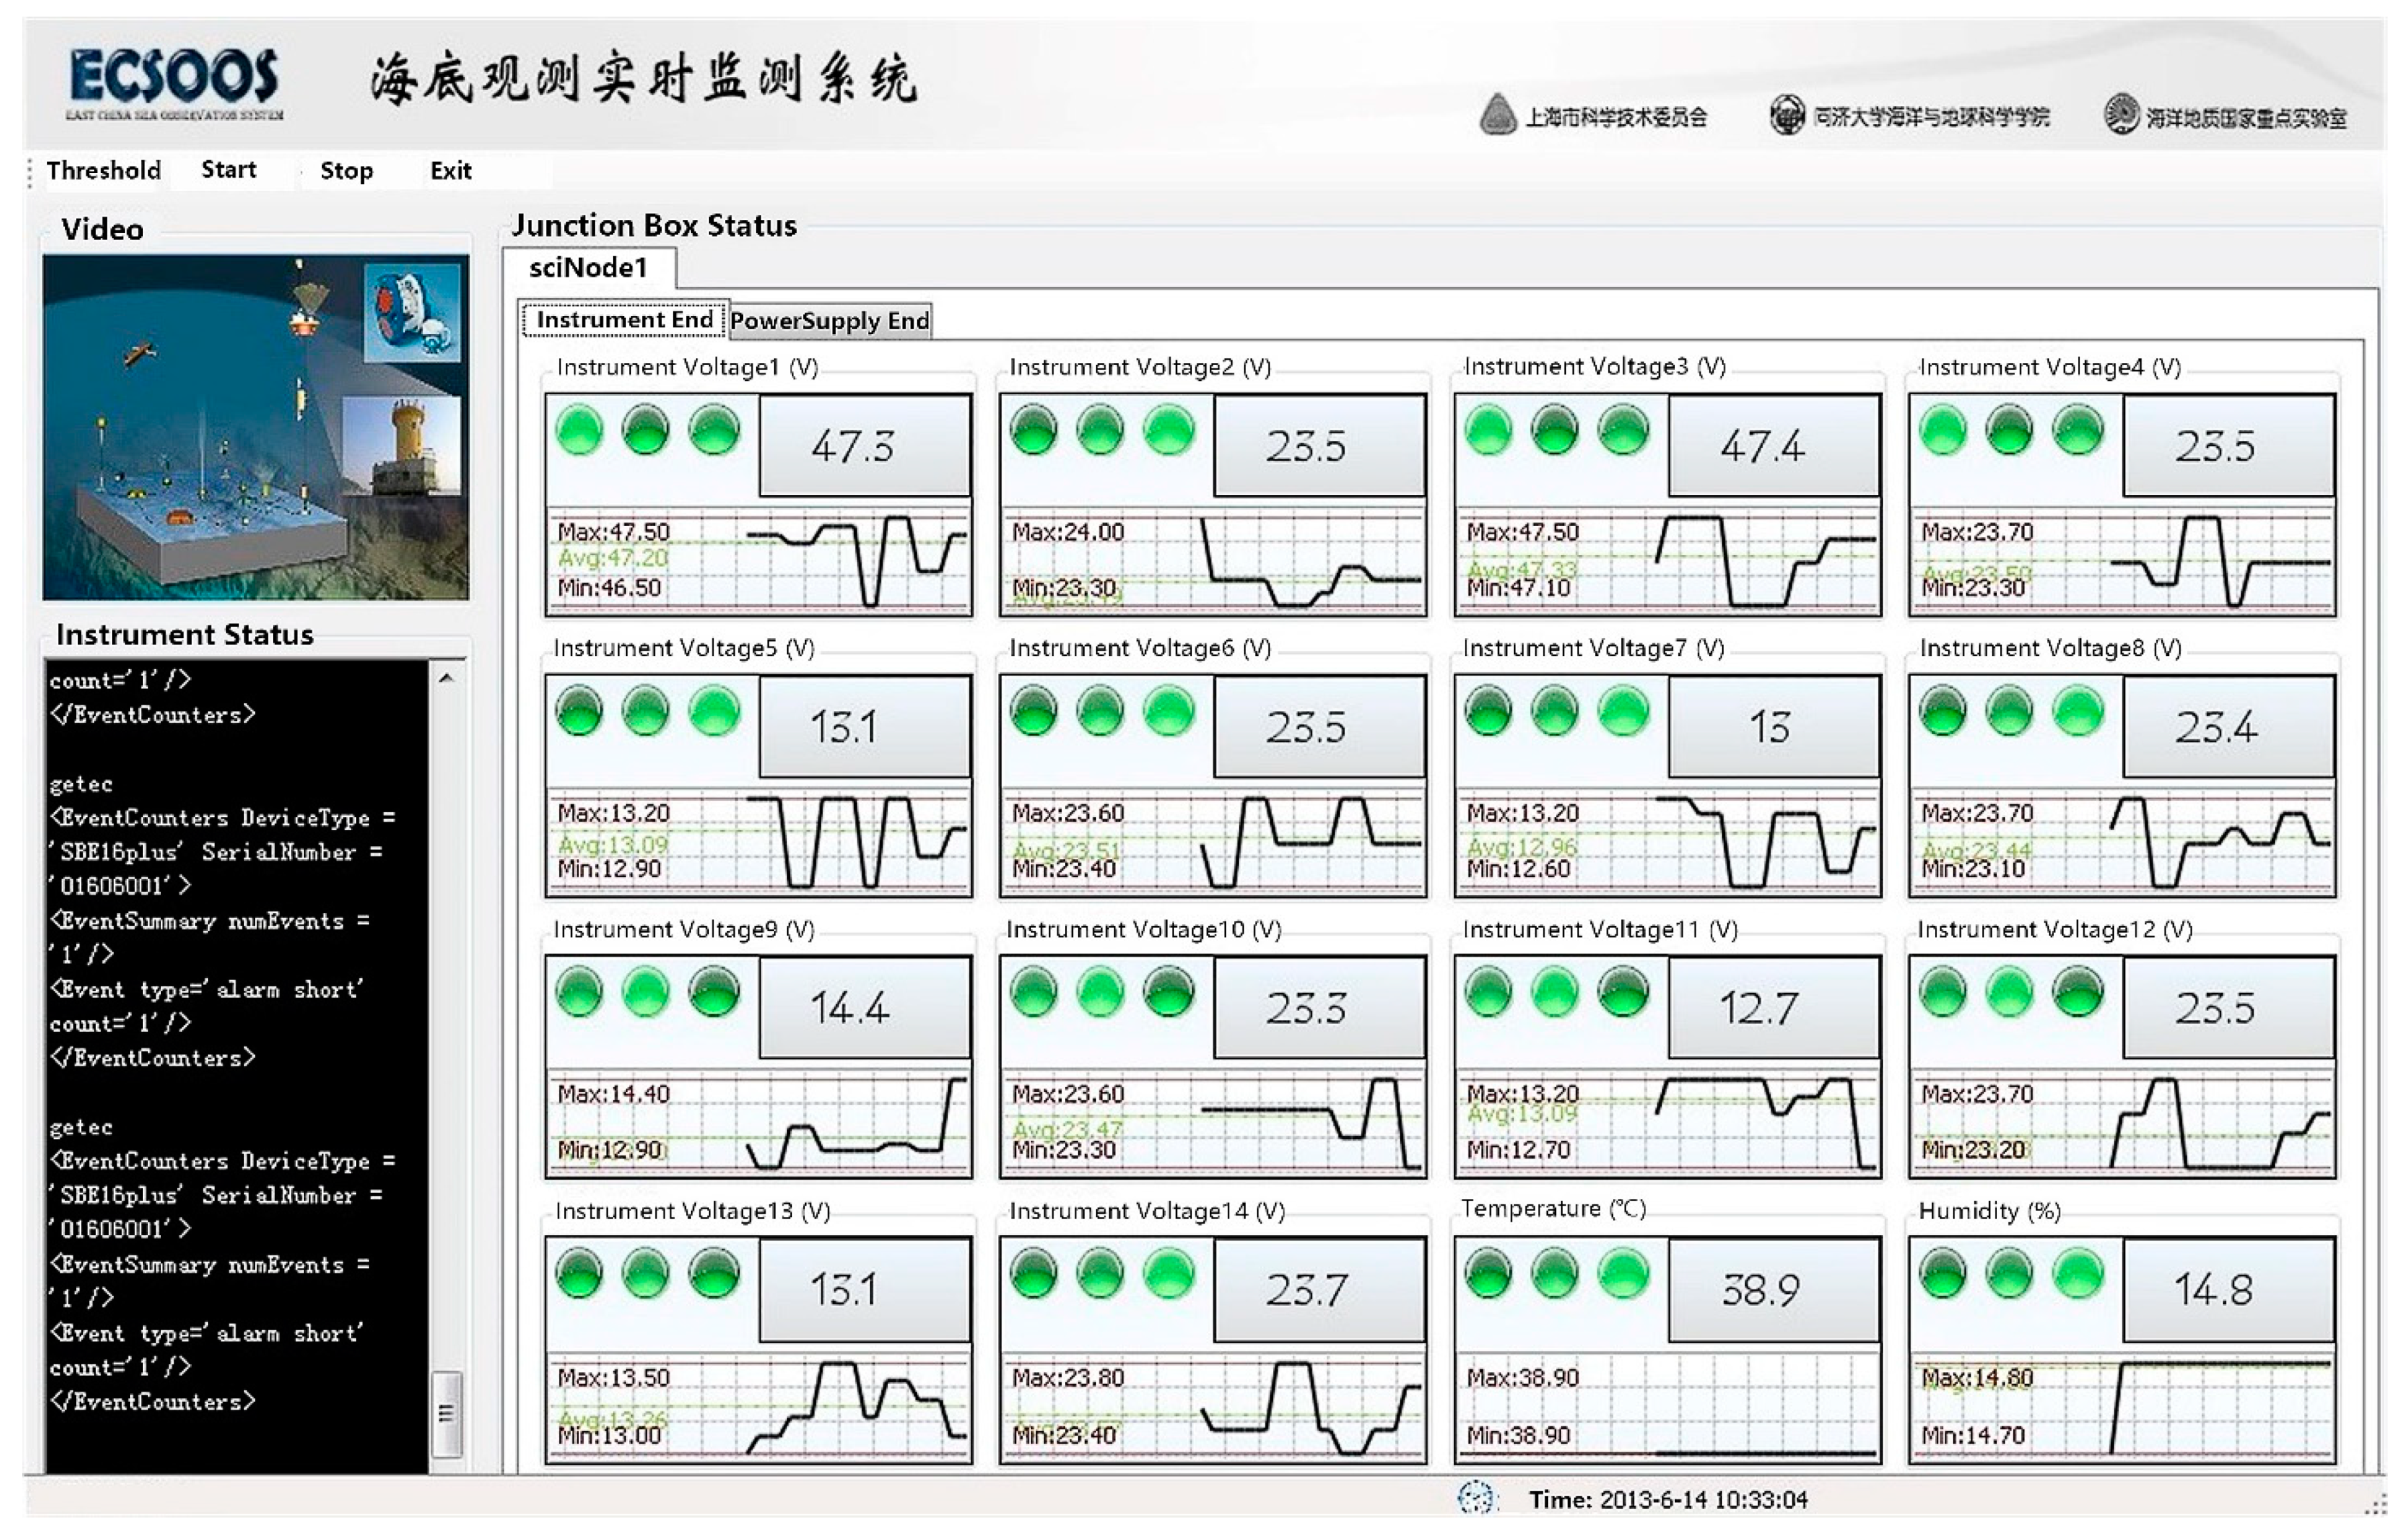
3.4. Real-Time Monitoring System

The real-time monitoring system is implemented to monitor the real-time working status of all the sensor equipment deployed at cabled seafloor observatories and quickly respond to system exceptions such as abnormal power supply of junction boxes and abnormal operation of sensors. The system also provides on-site video monitoring of in situ marine environment and the deployment and maintenance of cabled observatories. All the status data are instantly monitored and visualized in the form of line charts and light indicators, based on the abnormal information of which the SMS alarm and the command control of the remote-control system are successively performed. The real-time monitoring system mainly includes a status data fetch module, a status data analysis module, a status data visualization module, and a system exception alarm module.
The real-time monitoring system is developed with the Visual Studio, of which all the functional modules are written in C# to enable the connection with the seafloor observatory database, status data monitoring and analysis, as well as alarm and response. In the development process, a Data Monitor class and a ControlCurrentCollector control are developed to realize all the functions mentioned above. Specifically, the Data Monitor class contains methods such as readDatabase(), refreshControl(), and configExam(); while the ControlCurrentCollector control contains properties like isWarning and isMonitoring as well as methods like startMonitor(), Refresh() and warn(). Once real-time status data exceed the predefined thresholds of monitored parameters, green indicators in the monitoring interface turn into red indicating system exceptions and alarm functions of the system are started according to predefined rules. As a result, administrators receive the SMS alarm and control commands are sent to respond to the alarm. The implemented system could both run separately and be added to other systems like ESOCS to run as an external program (Figure 7).
Although the primary objective of establishing cabled seafloor observatories is to acquire long-term and continuous scientific observation data, real-time status data monitoring is equally important from the perspective that the normal operation of all the sensor equipment enabled on-demand data acquisition. Particularly, the real-time monitoring system contributes to generating dynamic control demands for the remote-control system (ESOCS), which completes the closed loop of control flow and data flow within the whole ESOSW.

4. Test and Application

4.1. Experimental Scenario: East China Sea Seafloor Observation System

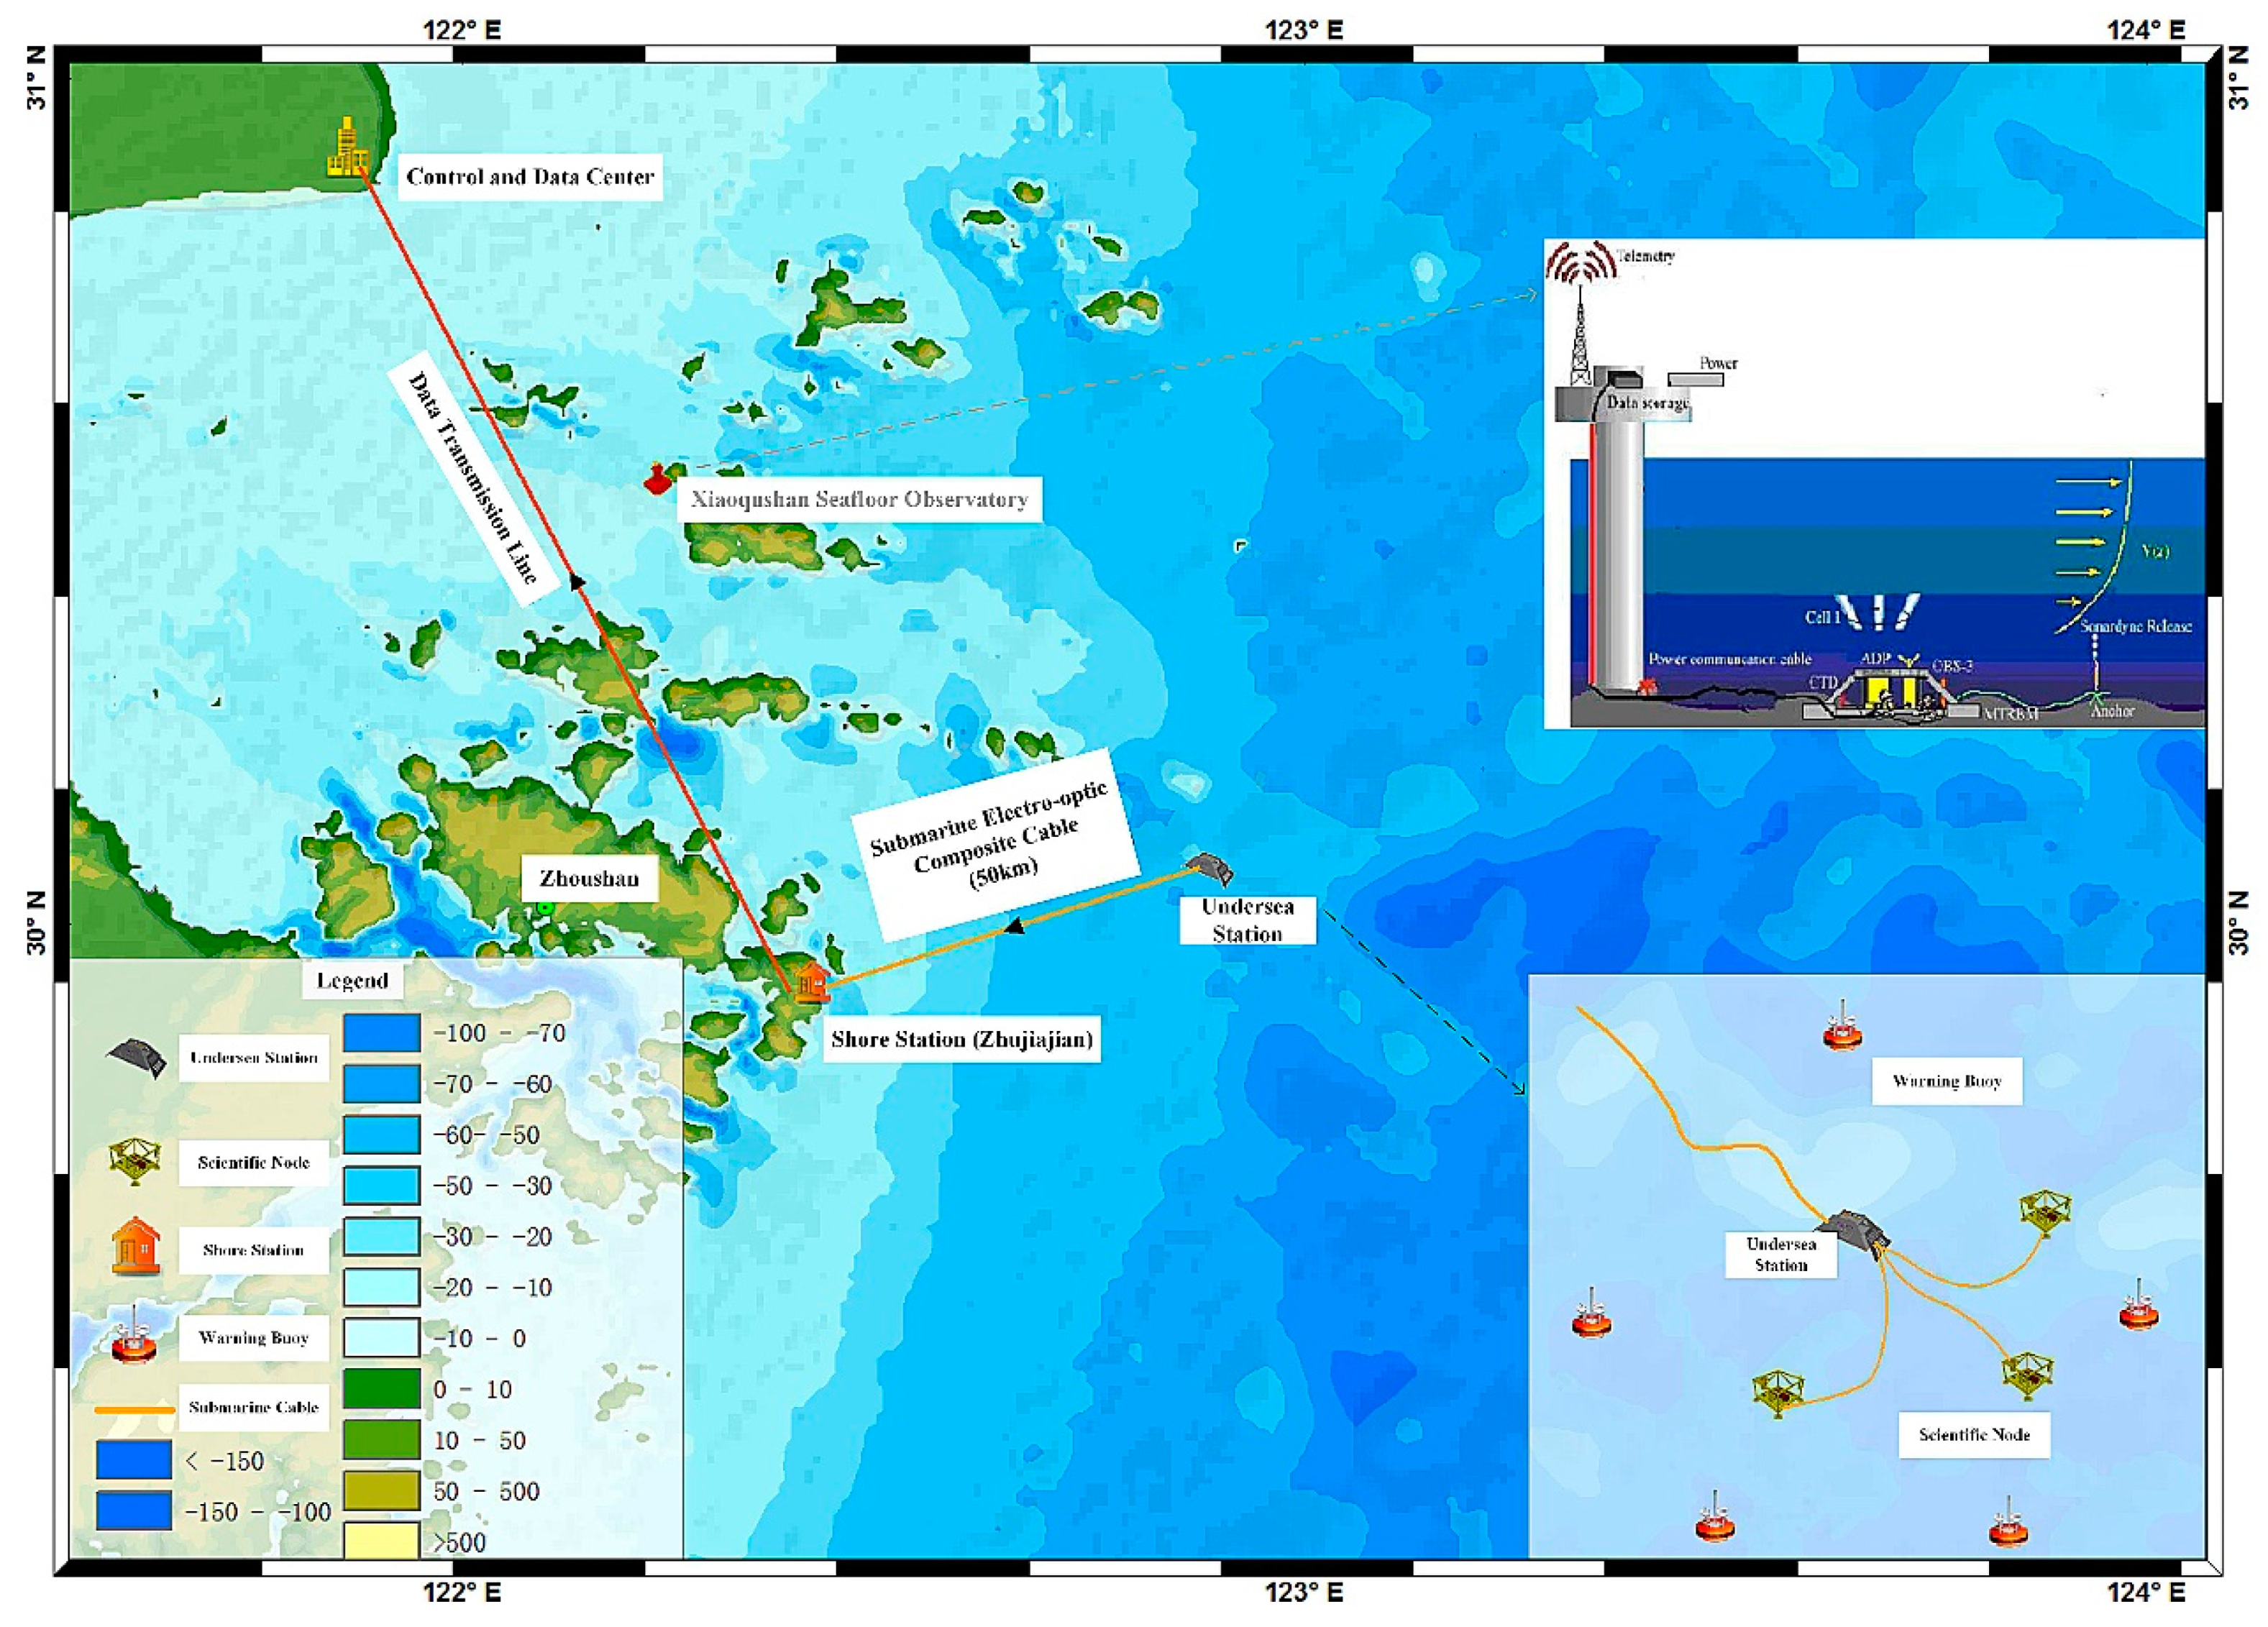
4.1.1. Xiaoqushan Seafloor Observatory

The East China Sea Seafloor Observation System (ECSSOS) consists of two observatories. As the first part of ECSSOS, the Xiaoqushan Seafloor Observatory is established geographically between 30°31′44′′N, 122°15′12′′E and 30°31′34′′N, 122°14′40′′. Strong land-sea interactions occur in the focused area as different waters originating from the Yangtze River and the Open Ocean are confluent (Figure 8).
As a coastal cabled observatory, the Xiaoqushan Seafloor Observatory was established in April 2009, originally consisting of a special junction box, an ADCP sensor, a CTD sensor, an OBS sensor, and an anti-trawl frame. The offshore platform of the East China Sea Branch of State Oceanic Administration was made as the cable landing site. The data acquired from different sensors were firstly encoded by the special junction box and then transmitted to the offshore platform, after which the data were forwarded to the control and data center via CDMA wireless transmission. Observatory upgrades lasted from October 2011 to August 2013, transforming the observatory into an integrated observation platform and oceanographic instrumentation test bed. The first and most important upgrade was designing the general junction box to interface various types of marine sensors in a plug-and-play way. The second upgrade was some reconstruction work such as adding more solar panels and a windmill on top of the platform edge and updating the platform communication equipment. The last upgrade was the integration of more sensors into the observatory for multidisciplinary observation (Table 1).
The Xiaoqushan Seafloor Observatory has operated for more than five years since put into service in 2009, during which period the incremental ESOSW supports continuous measurements and satisfactory operations of the whole observatory. This successful observatory lays a solid foundation for more advanced seafloor observatories in the East China Sea.

4.1.2. Zhujiajian Seafloor Observatory

As the second part of ECSSOS, the Zhujiajian Seafloor Observatory is located in the northeast direction of Zhujiajian Island, Zhoushan, about 50 km from the shore. It aims to develop key technologies for the construction and safety protection of shallow seabed observatory networks in view of the characteristics of the East China Sea such as high turbidity, the confluence of multiple currents, and frequent marine fishery activities.
The Zhujiajian Seafloor Observatory consists of five parts: a control and data center, a shore station, submarine electro-optic composite cables that are 50 km long, an undersea station, and three scientific observation nodes (as shown in Figure 8). The control and data center is responsible for remote sensor control as well as real-time observation data acquisition, interpretation, storage, analysis, and dissemination. The shore station is sited at the Zhujiajian Island, which is composed of the power supply system, the photoelectric separation and safety protection system, the data cache, and safe transmission system. The undersea station solves two main problems of power transmission and network communication. It converts the 2kV high voltage transmitted by the electro-optic composite cables into 375V and 48V voltage that could be used by three scientific observation nodes. Each scientific observation node is equipped with the secondary junction box and multidisciplinary marine sensors. The secondary junction box converts the 375V voltage into low voltage for sensor usage and connects all the serial marine sensors to the information transmission network for command control and data acquisition. In terms of data acquisition, marine sensors are an essential part for long-term, continuous, real-time and multidisciplinary observations. The sensors integrated into the observatory are listed in Table 2.
Routing location was selected in 2013 and the whole observatory was first deployed in August 2015. During the operation period, the cables and early warning buoys were damaged many times by trawlers. The overhaul engineering started in September 2017, and the restoration was completed in February 2018, since when the Zhujiajian Seafloor Observatory successfully operated until the project ended. In terms of supporting the whole observatory operation, ESOSW played a role in the remote control of in situ sensor equipment and real-time observation data acquisition and management.

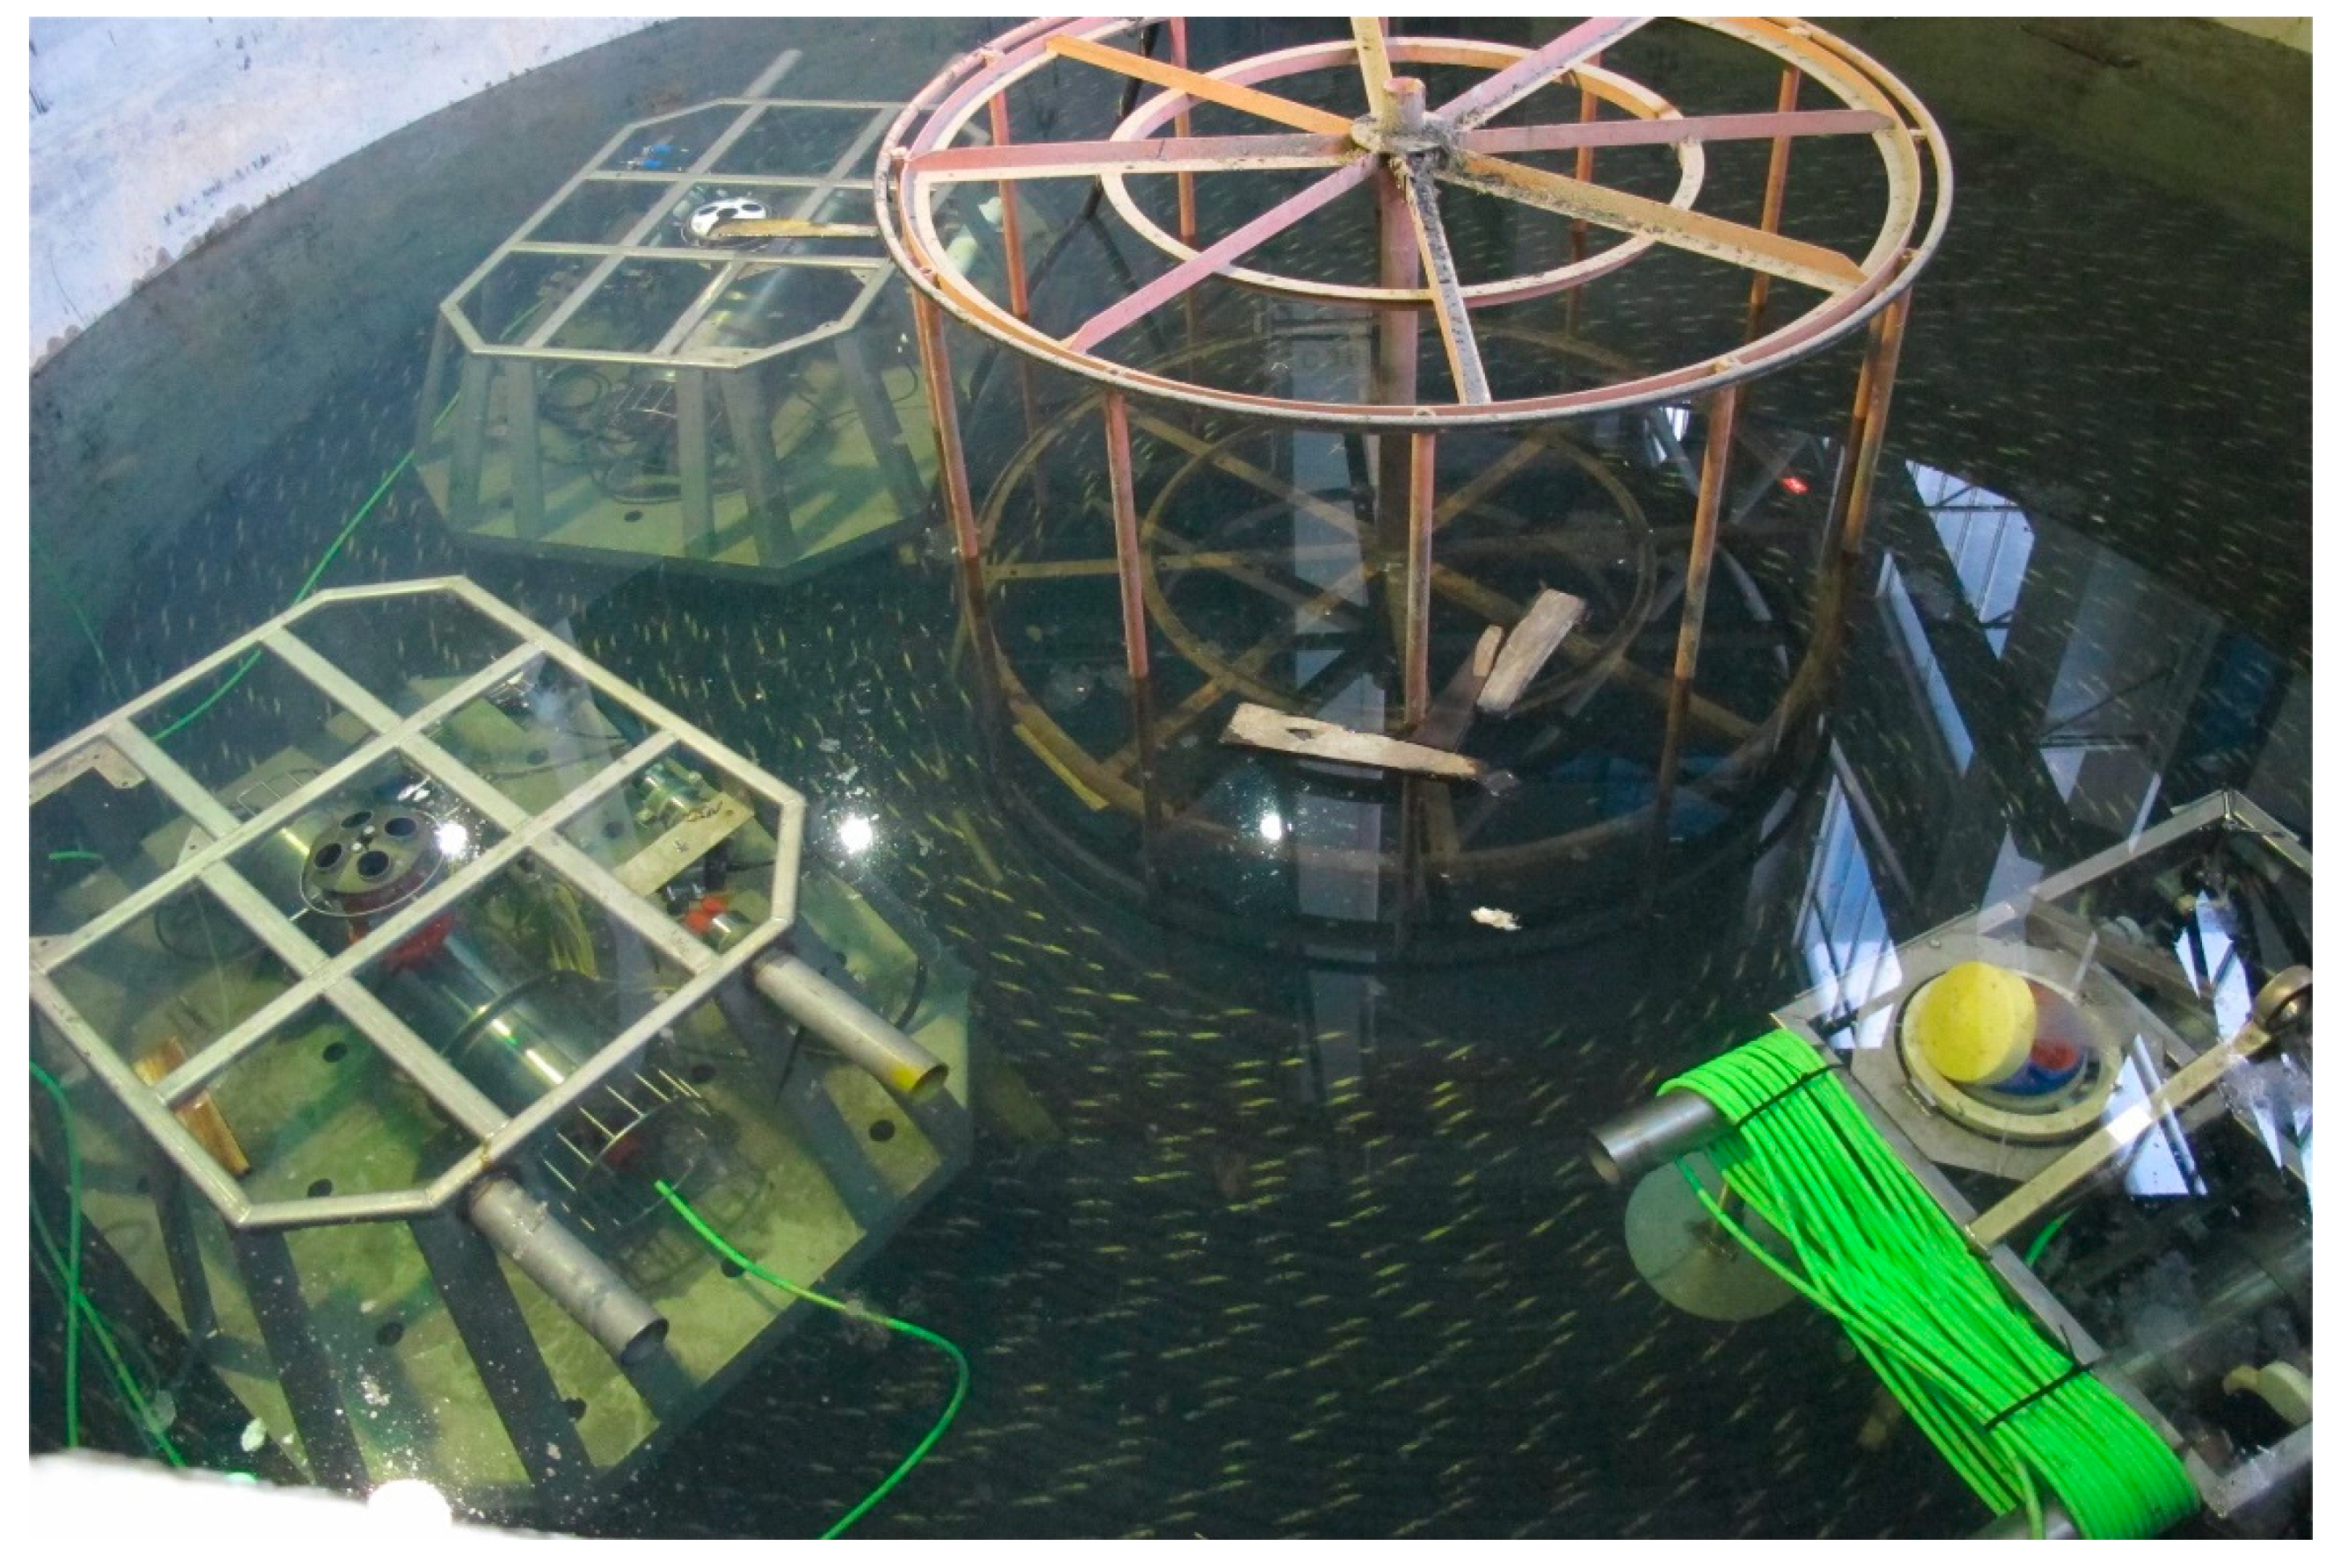
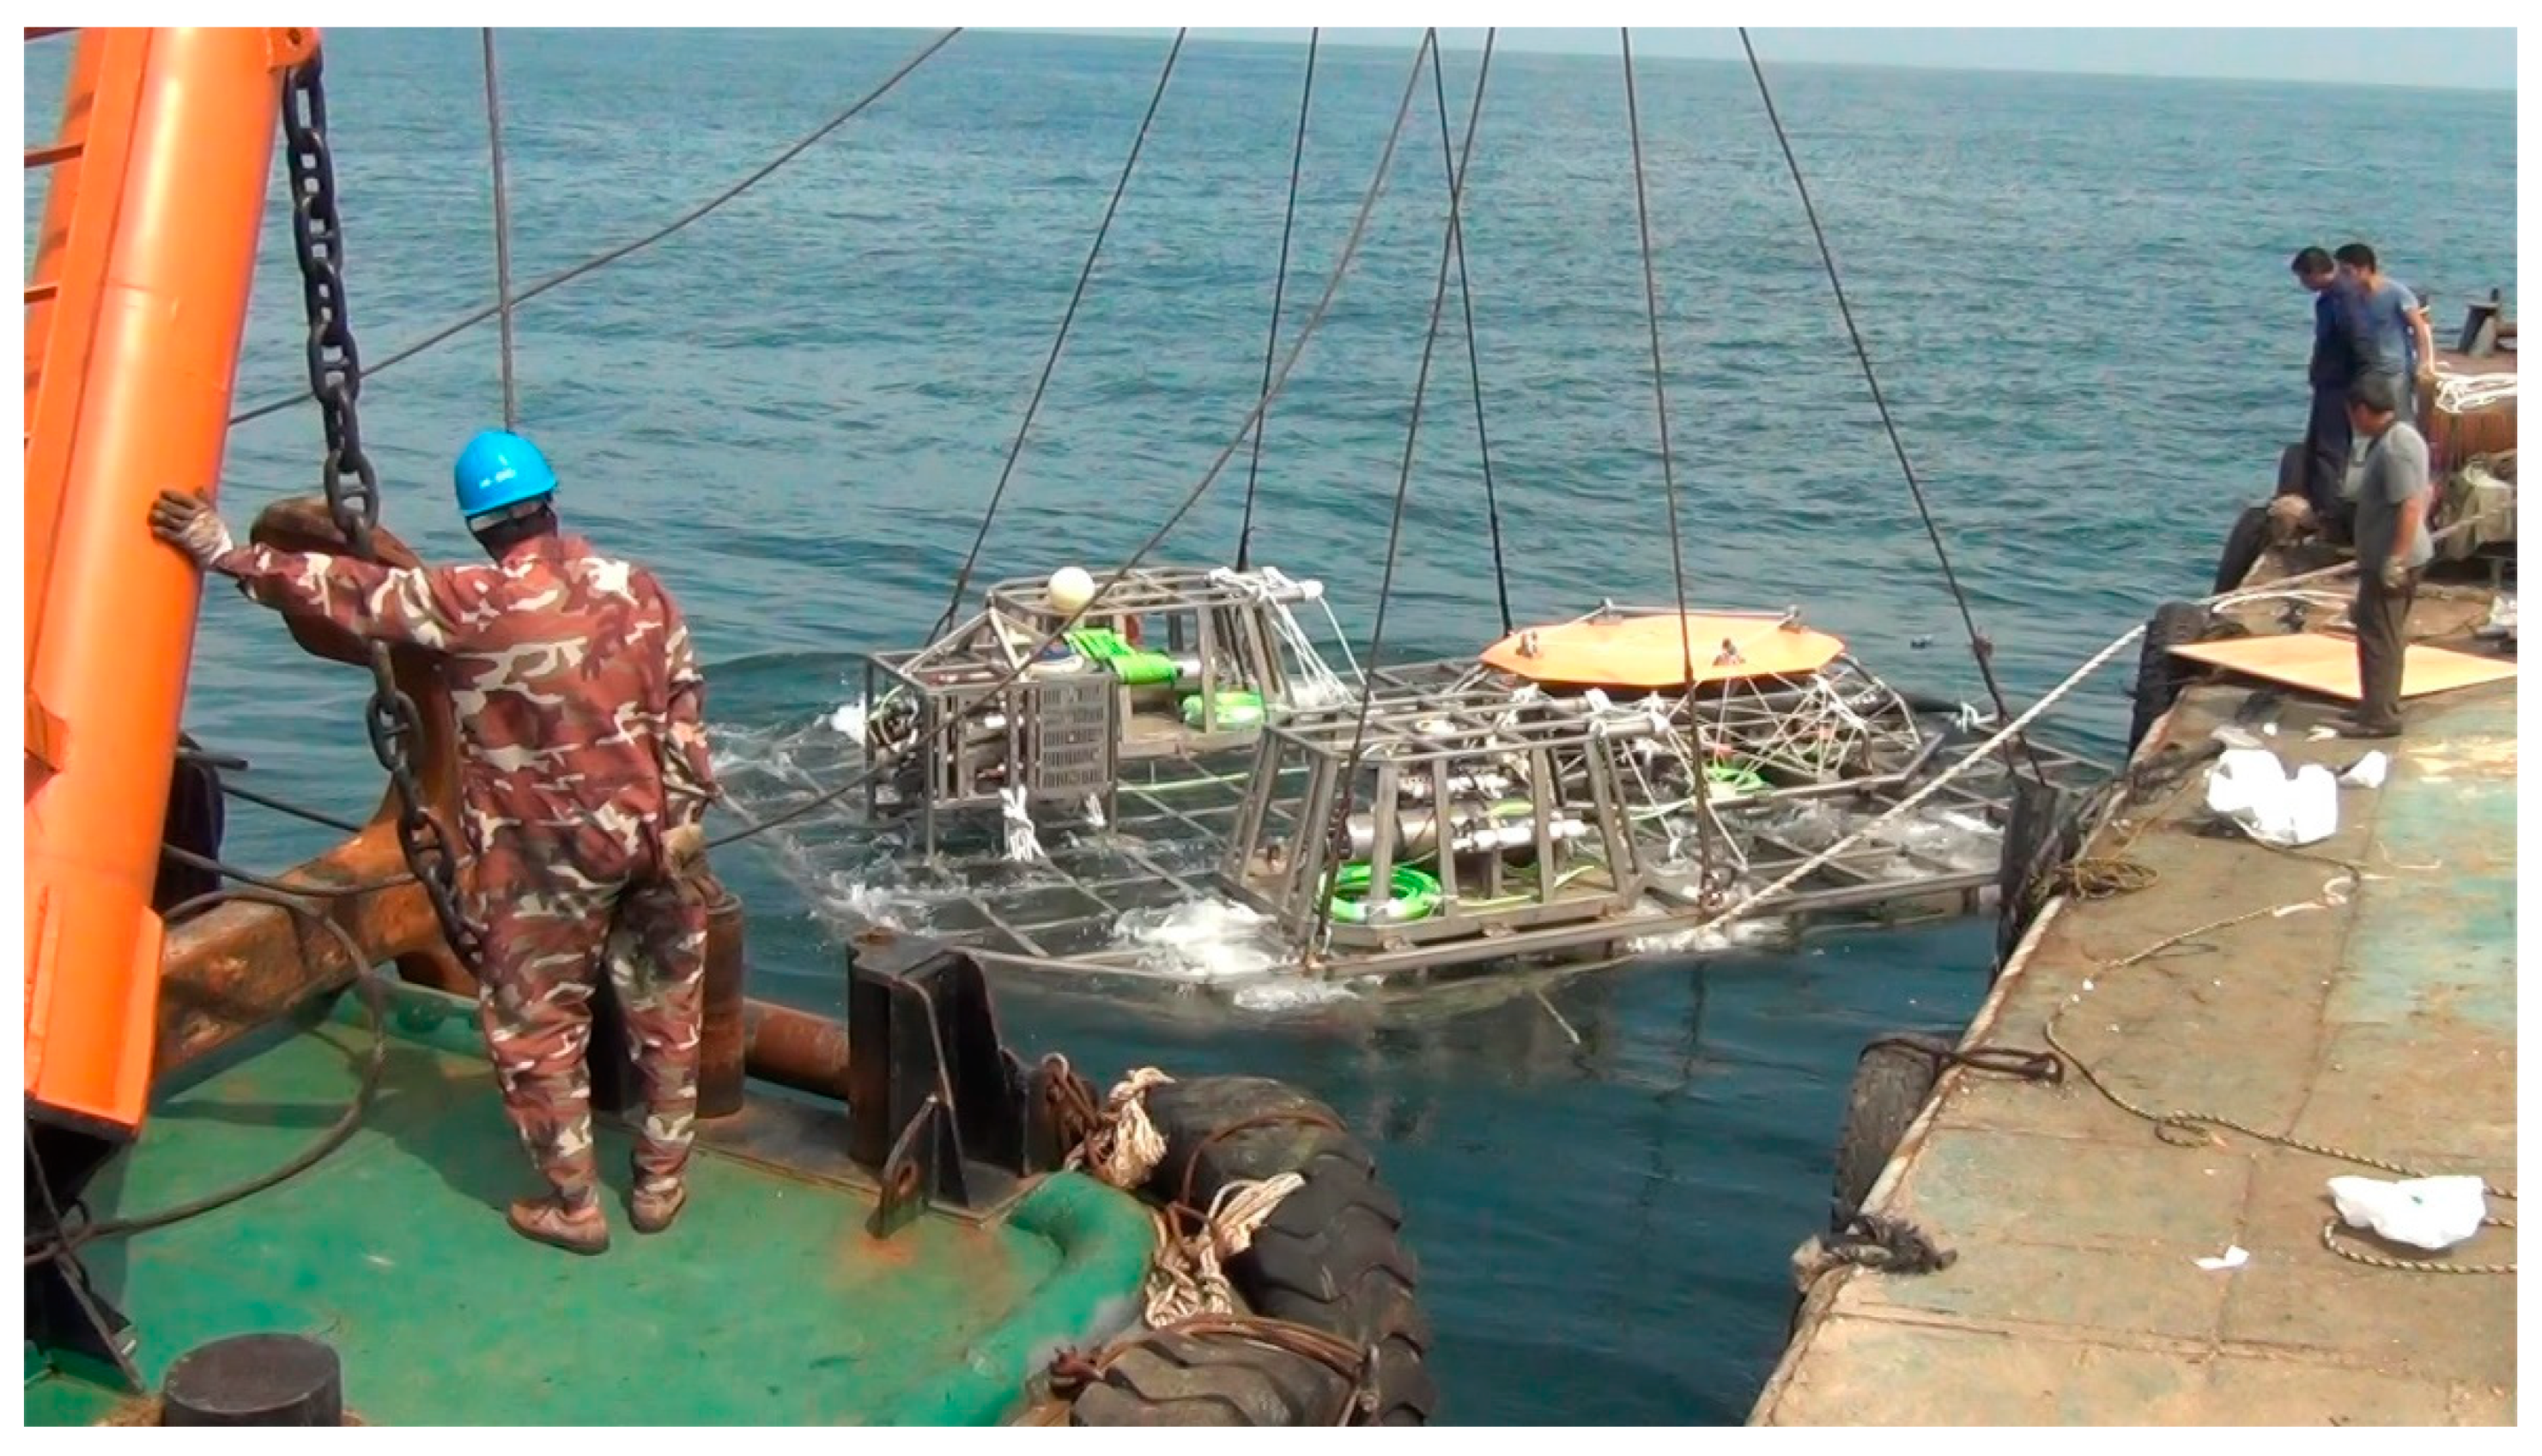
4.2. Prototype System Test: Processes and Results

As an integral part of ECSSOS and a sensor web prototype, ESOSW was tested for plug-and-play enablement through a series of trials. Air test was first performed on the remote-control system and other systems of ESOSW, in the process of which a secondary junction box connected with several marine sensors were placed on the laboratory test bench to simulate the in situ scientific observation node of cabled seafloor observatories. At this stage, ESOSW was tested to ensure that all the systems meet functional and performance requirements such as functional integrity and reliability, fault tolerance and error-handling capabilities, adaptability for changing demands, and software security.
All the systems were then integrated into ESOSW for a tank test. The tank test was first carried out in the seafloor observatory laboratory pool of the State Key Laboratory of Marine Geology at Tongji University. In the testing process, a general junction box and several marine sensors were connected and placed under the pool water to simulate the in situ observatory. The integrated ESOSW was continuously debugged with the underwater equipment for all the functional operations. This tank test proved that ESOSW enabled data acquisition and processing in a plug-and-play way and complied with all the project requirements, operating continuously for as long as 2000h.
Another tank test site was made in the test pool of Zhongtian Technology Submarine Cables Co., Ltd. to better simulate the components, the power supply and information transmission of cabled seafloor observatories. The test fully accorded with the network scheme of Zhujiajian Seafloor Observatory, consisting of an undersea station, three scientific observation nodes (secondary junction boxes connected with marine sensor equipment), and a submarine electro-optic composite cable that was 50 km long (as shown in Figure 9). With the undersea station and scientific observation nodes respectively assembled and placed in the Zhongtian submarine cable pool, the power was supplied and the relevant software of ESOSW were run for joint debugging with underwater sensor equipment. The remote connection was thus established, based on which various control commands were sent to marine sensors and real-time observation data were acquired, processed, and analyzed. The prototype system was tested for all the function points and was continuously debugged under regular and boundary conditions. The test lasted for one month continuously. Each part of the prototype system operated stably while the data and log records were complete and effective, further proving that ESOSW conformed to expected function index and performance index laid for the project.
Finally, ESOSW was conducted the shallow sea trial successively in the waters near Xiaoqushan Island and Zhujiajian Island before it was put into service for ECSSOS (as shown in Figure 10). During the process, ESOSW deployed at the control and data center conducted remote debugging with the undersea station and scientific observation nodes via the shore station and the submarine optoelectronic composite cable. The working status of in situ sensor equipment was remotely controlled and observation data were acquired and analyzed in a real-time way. All parts of ESOSW and in situ observatory components proved to function well during the whole sea trial, after which ESOSW continuously guaranteed the whole observatory operation of ECSSOS and presented satisfactory practical performance as described below.

4.3. Practical Performance

4.3.1. General Descriptions against Specifications
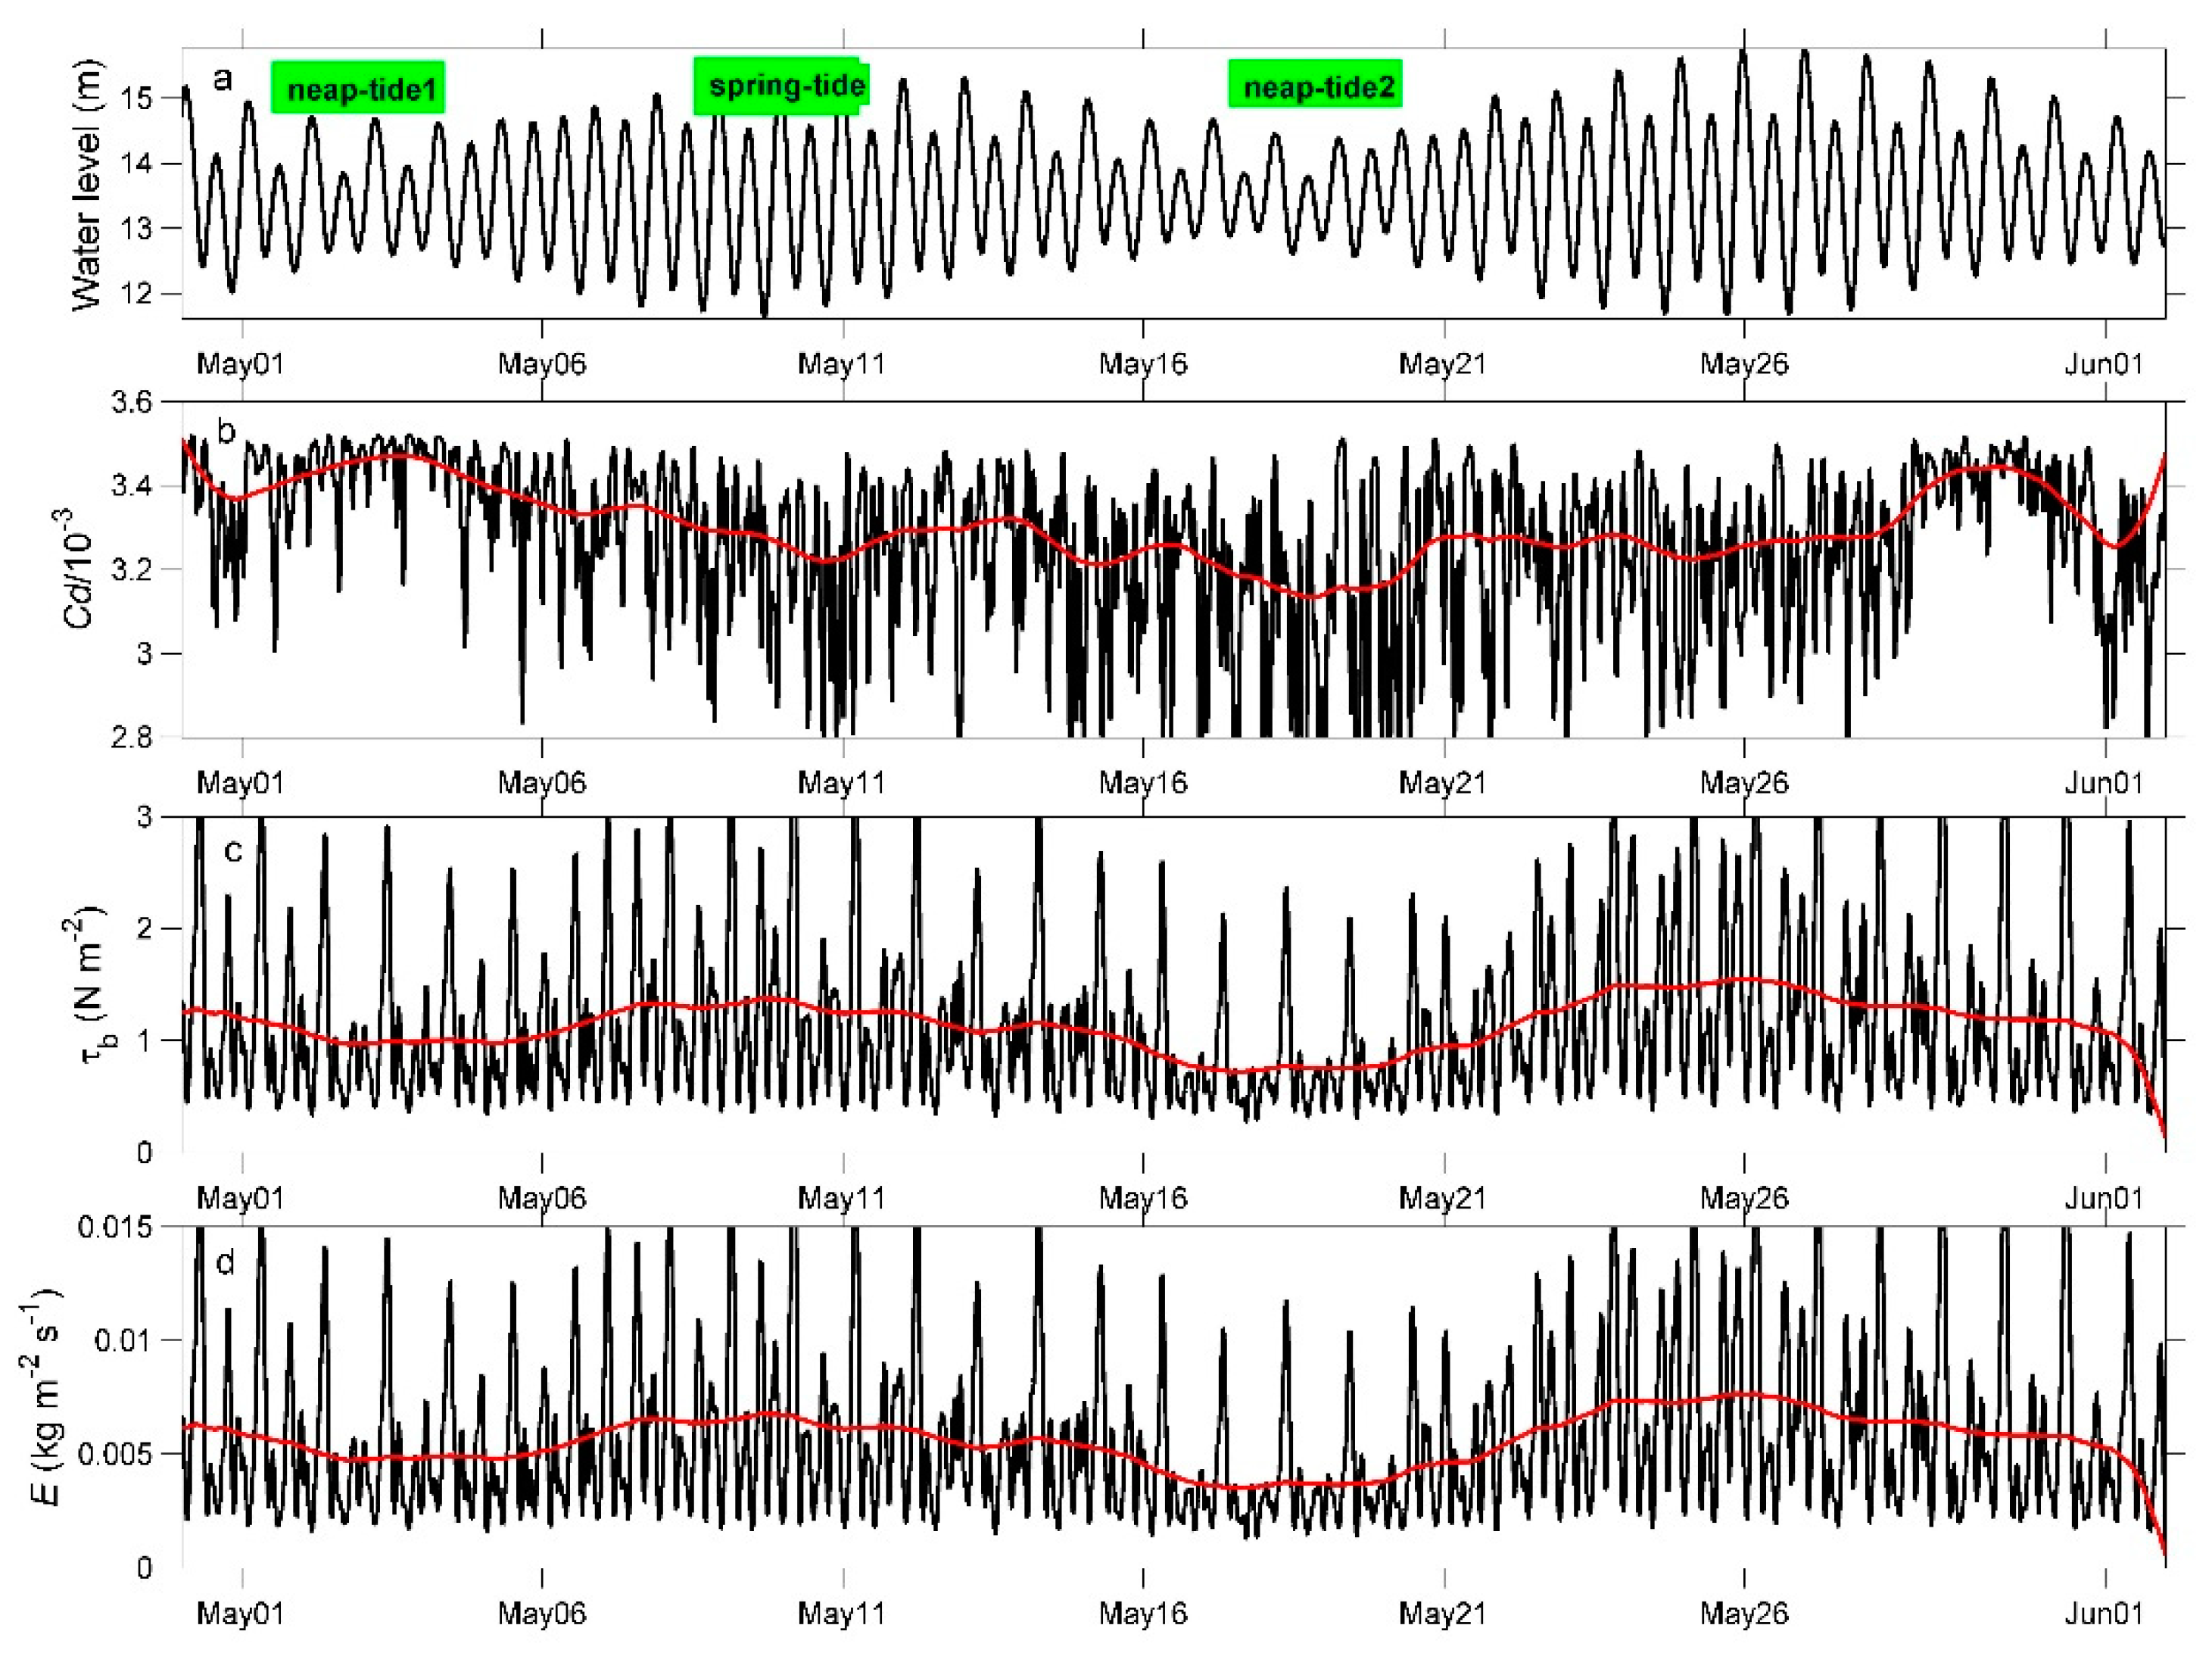
From the design specifications of ESOSW it follows that ESOSW has to (i) acquire and interpret raw observation data in real-time, store and manage the interpreted data with metadata associated and data quality control performed; (ii) remotely control all the in situ sensor equipment in a plug-and-play, online monitor, controlling the running state of the whole observatory with predefined responsiveness for system exceptions; (iii) analyze and visualize the multidisciplinary observation data with support from visualization in scientific computing and GIS; (iv) distribute and share observation data or data products via standard interfaces, making sensor resources accessible on the Internet.
During the whole operation period of servicing ECSSOS, ESOSW consistently functioned against all specifications listed above. Data (video data excluded) at the Xiaoqushan Seafloor Observatory were collected up to 30 Mb day−1, including near-bottom temperature, conductivity, pressure, turbidity, current profiles, and status parameters of all underwater sensor equipment. Data integrity was assessed no less than 95%. In terms of the Zhujiajian Seafloor Observatory, multidisciplinary observation parameters from different sensors (as shown in Table 2) were acquired and processed by ESOSW in a consistent and dynamic way. Citing the operation period from February 2018 to August 2018 as an example, the prototype system obtained more than 1.7 million pieces of data from SBE 26 sensor, 2 million pieces of data from LISST-100x sensor, and 400 thousand pieces of velocity data from AWAC sensor.
Given the harsh marine environment of the East China Sea to in situ sensor equipment, the remote control and data processing capabilities of ESOSW guarantee that the two observatories of ECSSOS provide long-term, real-time and continuous data records. The available operation period that ESOSW functioned on ECSSOS shows a very clear record with considerable variability of time scales that are not captured by the routine boat sampling schedule. The practical performance of ESOSW is further supported by the case study as described below, in which some observations at the Xiaoqushan Seafloor Observatory are initially analyzed [20].

4.3.2. Case Study

In the case study, drag coefficient, shear stress and sediment transportation rate of the bottom boundary layer in coastal East China Sea were calculated from the ADCP and CTD measurements of the Xiaoqushan Seafloor Observatory. Periodic variations of the three physical parameters during flood/ebbtide and spring/neap tide in May 2009 were respectively recorded in the subgraphs of b, c, and d in Figure 11. The black lines and red lines respectively represent hourly and daily averaged data.
On the one hand, the time series of three physical parameters are distinguished by the notable daily cycle. During ebb tide the drag coefficient maintained large values of 3.3 × 10⁻³ to 3.5 × 10⁻³; while during flood tide it first decreased and then increased. In contrast, the transportation rate value first rose from 2.0 × 10⁻³ to 15.0 × 10³ kg∙m−2∙s−1 and then decreased during ebb tide; while during flood tide it remained low. On the other hand, the drag coefficient values calculated for monthly cycle ranged from 2.8 × 10⁻³ to 3.6 × 10⁻³, the average value of which was larger in neap tide than in spring tide. The shear stress varied little with the hourly and daily averaged value respectively in a range of 0.5 to 3.0 N∙m−2 and 0.8 to 1.5 N∙m−2. The transportation rate varied the same as the shear stress trended, exhibiting spring-neap tide cycle with a mean value of 7.0 × 10⁻³ kg m−2∙s−1 during spring tide and 5.0×10⁻³ kg∙m−2∙s−1 during neap tide.
This calculation of parameters near bottom boundary layer clearly describes how the sediment net flux varies during floor-ebb tide cycle in daily scale and also contributes to resolving the sediment distribution during spring-neap tide cycle in monthly scale. Furthermore, this case study demonstrates both the potential use of observed data from the two observatories of ECSSOS and the practical performance of ESOSW from the perspective of data provision and usage.

5. Discussion

This paper reports the progress in designing and developing a sensor web prototype (ESOSW) for cabled seafloor observatories and also presents the practical applications of ESOSW in the East China Sea Seafloor Observation System. The most original contribution of this study is the plug-and-play mechanism of the sensor web architecture designed for seafloor observatory information processing. The sensor web architecture is structured into four layers enabling bidirectional information flow of observation data and control commands, based on which different seafloor observatory components within the four layers are designed for plug-and-play enablement and interact in an information-oriented way. The plug-and-play mechanism is particularly characterized by the GOE Control Method and Hot Swapping Interpretation Method enabled at the data source layer and the data layer, which not only standardize the process of seafloor observatory data acquisition and interpretation but also prepare the physically meaningful data for the whole plug-and-play data processing chain in the sensor web architecture. In the context of the plug-and-play sensor web architecture, ESOSW is implemented to support more advanced processes of managed sensor control and on-demand measurement as well as immediate needs of observatory data applications. Although individual parts of the implementation technology adopted are not all necessarily new, it is the combination of system architecture, junction box and sensor interfacing, network communication and control, object-oriented modelling and programming, and observation data processing and management that form the novel and robust base of ESOSW for seafloor observatory sensor control and data processing.
Compared with related observatory solutions as described or cited in Section 1, this plug-and-play mechanism demands no extra protocol such as IEEE 1451 and PUCK at the sensor level while the whole sensor identification and communication are enabled at the sensor web level. As marine sensors are traditionally developed by different manufacturers with high cost and little standardization of protocols, this mechanism maximizes the range of various sensors that can be dynamically networked and controlled without extra requirements of upgrading the sensor hardware and firmware. In terms of this advantage, this plug-and-play mechanism contributes to the observatory sensor integration and control in a more universal and flexible way. Another advantage is that this mechanism expands the plug-and-play enablement of sensor control and data acquisition with dynamic sensor data interpretation and storage. The expansion enables real-time data analysis and observatory monitoring and lays a solid foundation for the whole plug-and-play data processing chain in the sensor web architecture. This plug-and-play mechanism thus contributes to the observatory sensor data processing and management in a more comprehensive and effective way. Based on these two advantages, this plug-and-play mechanism further supports closed loop observation and adaptive control of the whole observatory network. Consequently, various sensor resources can be accessed in a standardized and dynamic way.
As shown in Section 4, ESOSW has presented satisfactory practical performance against all the design specifications through a series of trials and applications. Although the two observatories of ECSSOS are diverse in oceanographic sensors and sensor data, the plug-and-play enablement of ESOSW guarantees that the prototype system consistently functions in both the remote control of observatory sensor equipment and the real-time observation data acquisition and management. This plug-and-play enablement can vertically manage bidirectional information flow within a cabled seafloor observatory and horizontally integrate a network of cabled observatories for sensor control and data processing in a standardized way. The case study not only demonstrates the potential use of observed data from ECSSOS but also further proves that ESOSW contributes to the observatory outcome in terms of data provision and usage. The real-time, continuous, and multidisciplinary seafloor observatory combined with the plug-and-play and close-loop sensor web thus facilitates both scientific researches and engineering practices, benefiting a broad range of marine science and engineering communities. In this way, the plug-and-play sensor web architecture design and prototype system implementation proposed in this paper could be a useful reference to related seafloor observatory networks and could also be extended to other in situ ocean observation sensor systems. With some future upgrades, the sensor web prototype designed and developed in this study will continue to support the dynamic instrument interfacing and control, real-time data acquisition and processing, and standardized sensor resources access for both the separate constructions of ECSSOS and the China National Scientific Seafloor Observatory. All the continuous and long-term scientific datasets obtained will in return promote the temporal scale resolution and the research progress in the East China Sea, the major topics of which include source-to-sink sediment transport and depositional dynamics, biogeochemical processes, and ecosystem health.
The sensor web prototype design and implementation of this study are thus feasible to resolve seafloor observatory sensor control and data processing in a plug-and-play way. The outcome will not only promote the theoretical research progress in seafloor observation information processing but also contribute to the new application research of sensor webs. Future work includes the sensor web architecture optimization and the implementation of other sensor web prototype releases which will support complete close-loop sensing, modeling and analysis, and distributed network control for interactive seafloor observatories.

6. Conclusions

A sensor web prototype, namely ESOSW, is described which acts as an integrated and interoperable tool for seafloor observatory information processing. An information-oriented and layered sensor web architecture is proposed, based on which the plug-and-play mechanism for seafloor observatory sensor control and data processing is designed at the corresponding layers. The feasibility of the proposed architecture is implemented with ESOSW. ESOSW is tested through a series of trials and applications and has presented satisfactory practical performance in accordance with all the design specifications. By means of this study, we want to demonstrate that the sensor web prototype design and implementation are beneficial for ocean observatory sciences.

Author Contributions

Conceptualization, Y.Y.; methodology, Y.Y. and H.X.; software and validation, Y.Y., H.X., and C.X.; writing—original draft, Y.Y.; writing—review and editing, Y.Y., H.X., and C.X.

Funding

This research was funded by the Fundamental Research Funds for the Central Universities grant number 22120180003, the Teaching Reform Funds of Tongji University grant number 1350104093, Shanghai Sailing Program grant number 18YF1424100, and the National High Technology Research and Development Program of China grant number 2012AA09A407.

Acknowledgments

The authors thank other members of the research group for their participation in the sensor web prototype study.

Conflicts of Interest

The authors declare no conflict of interest.

Abbreviations

The following abbreviations are used in this paper:
ECSSOSEast China Sea Seafloor Observation System
EMSOEuropean Multidisciplinary Seafloor and water-column Observatory
ESOCSthe remote-control system for ECSSOS
ESODDSthe data distribution system for ECSSOS
ESOSWthe sensor web prototype for ECSSOS
GJBgeneral junction box
GOEGJB-OSML enabled
OGCOpen Geospatial Consortium
ONCOcean Networks Canada
OOIOcean Observatories Initiative
OSMLOcean Sensor Markup Language
SPANSwitched Port Analyzer
SWASensor Web Architecture

References

  1. National Research Council. Illuminating the Hidden Planet—The Future of Seafloor Observatory Science, 1st ed.; National Academies Press: Washington, DC, USA, 2000; pp. 1–160. [Google Scholar]
  2. National Science Foundation. Ocean Sciences at the New Millennium, 1st ed.; Geosciences Professional Services, Inc.: Washington, DC, USA, 2001; pp. 1–152. [Google Scholar]
  3. Favali, P.; Beranzoli, L. Seafloor Observatory Science: A Review. Ann. Geophys. 2006, 49, 515–567. [Google Scholar]
  4. Ruhl, H.A.; André, M.; Beranzoli, L.; Çağatay, M.N.; Colaco, A.; Cannat, M.; Dañobeitia, J.J.; Favali, P.; Géli, L.; Gillooly, M.; et al. Societal need for improved understanding of climate change, anthropogenic impacts, and geo-hazard warning drive development of ocean observatories in European Seas. Prog. Oceanorgr. 2011, 91, 1–33. [Google Scholar] [CrossRef]
  5. Wang, P.X. Seafloor Observatories—The Third Observation Platform for Earth System. Chin. J. Nat. 2007, 29, 125–130. [Google Scholar]
  6. Wang, P.X. Current Development in Marine Science and Technology: A Retrospect. Adv. Earth Sci. 2011, 26, 644–649. [Google Scholar]
  7. Glen, S.M.; Dickey, T.D.; Parket, B.; Boicourt, W. Long-term real-time coastal ocean observation networks. Oceanography 2000, 13, 24–34. [Google Scholar] [CrossRef]
  8. Massion, G.; Raybould, K. MARS: The monterey accelerated research system. Sea Technol. 2006, 47, 39–42. [Google Scholar]
  9. Cowles, T.; Delaney, J.; Orcutt, J.; Weller, R. The Ocean Observatories Initiative: Sustained Ocean Observing Across a Range of Spatial Scales. Mar. Technol. Soc. J. 2010, 44, 54–64. [Google Scholar] [CrossRef]
  10. Howe, B.M.; Lucas, R.; Duennebier, F.; Karl, D. ALOHA cabled observatory installation. In Proceedings of the OCEANS Conference, Waikoloa, HI, USA, 19–22 September 2011; IEEE: Piscataway, NJ, USA, 2011. [Google Scholar]
  11. Chave, A.D.; Arrott, M.; Farcas, C.; Farcas, E.; Krueger, I.; Meisinger, M.; Orcutt, J.A.; Vernon, F.L.; Peach, C.; Schofield, O.; et al. Cyberinfrastructure for the US Ocean Observatories Initiative—Enabling Interactive Observation in the Ocean. In Proceedings of the OCEANS Conference, Bremen, Germany, 11–14 May 2009; IEEE: Piscataway, NJ, USA, 2009. [Google Scholar]
  12. Dewey, R.; Round, R.; Macoun, P.; Vervynck, J.; Tunnicliffe, V. The VENUS Cabled Observatory: Engineering Meets Science on the Seafloor. In Proceedings of the OCEANS Conference, Vancouver, BC, Canada, 29 September–4 October 2007; IEEE: Piscataway, NJ, USA, 2008. [Google Scholar]
  13. Wang, K.L.; Moran, K. NEPTUNE Canada: Science, Operation, and Management. Adv. Earth Sci. 2013, 28, 521–528. [Google Scholar]
  14. Taylor, S.M. Transformative ocean science through the VENUS and NEPTUNE Canada ocean observing systems. Nucl. Instrum. Meth. A 2009, 602, 63–67. [Google Scholar] [CrossRef]
  15. Favali, P.; Smriglio, G.; Beranzoli, L.; Braun, T.; Calcara, M.; Colore, D.; Campaci, R.; Coudeville, J.-M.; De Santis, A.; Di Mauro, D.; et al. European seafloor observatory offers new possibilities for deep-sea study. EOS Trans. Am. Geophys. Union 2000, 81, 45–49. [Google Scholar] [CrossRef]
  16. Monna, S.; Falcone, G.; Beranzoli, L.; Chierici, F.; Cianchini, G.; De Caro, M.; De Santis, A.; Embriaco, D.; Frugoni, F.; Marinaro, G.; et al. Underwater geophysical monitoring for European Multidisciplinary Seafloor and water column Observatories. J. Mar. Syst. 2014, 130, 12–30. [Google Scholar] [CrossRef]
  17. Favali, P.; Chierici, F.; Marinaro, G.; Giovanetti, G.; Azzarone, A.; Beranzoli, L.; De Santis, A.; Embriaco, D.; Monna, S.; Bue, N.L.; et al. NEMO-SN1 Abyssal Cabled Observatory in the Western Ionian Sea. IEEE J. Ocean. Eng. 2013, 38, 358–374. [Google Scholar] [CrossRef]
  18. Kasahara, J. Geophysical observations at the ocean bottom. In Proceedings of the 2004 International Symposium on Underwater Technology, Taipei, Taiwan, 20–23 April 2004; IEEE: Piscataway, NJ, USA, 2005. [Google Scholar]
  19. Shinohara, M.; Kanazawa, T.; Yamada, T.; Machida, Y.; Shinbo, T.; Sakai, S. New Compact Ocean Bottom Cabled Seismometer System Deployed in the Japan Sea. Mar. Geophys. Res. 2013, 35, 231–242. [Google Scholar] [CrossRef]
  20. Xu, H.P.; Zhang, Y.W.; Xu, C.W.; Li, J.R.; Liu, D.; Qin, R.F.; Luo, S.Q.; Fan, D.D. Coastal Seafloor Observatory at Xiaoqushan in the East China Sea. Chin. Sci. Bull. 2011, 56, 2839–2845. [Google Scholar] [CrossRef]
  21. Yu, Y.; Xu, H.P.; Xu, C.W.; Qin, R. A study of the remote control for the East China Sea Seafloor Observation System. J. Atmos. Ocean. Technol. 2012, 29, 1149–1158. [Google Scholar] [CrossRef]
  22. Yu, Y.; Xu, H.P.; Xu, C.W. A Sensor Control Model for Cabled Seafloor Observatories in the East China Sea. Sensors 2018, 18, 3027. [Google Scholar] [CrossRef]
  23. Delin, K. The Sensor Web: A Macro-Instrument for Coordinated Sensing. Sensors 2001, 2, 270–285. [Google Scholar] [CrossRef]
  24. Gibbons, P.; Karp, B.; Ke, Y.; Nath, S.; Seshan, S. Irisnet: An Architecture for a Worldwide Sensor Web. IEEE Pervasive Comput. 2003, 2, 22–33. [Google Scholar] [CrossRef]
  25. Liang, S.; Tao, C. A distributed geospatial infrastructure for the sensor web. Comput. Geosci. 2005, 31, 221–231. [Google Scholar] [CrossRef]
  26. Zyl, T.L.; Simonis, I.; McFerren, G. The Sensor Web: Systems of sensor systems. Int. J. Digit. Earth 2009, 2, 16–30. [Google Scholar] [CrossRef]
  27. Bröring, A.; Echterhoff, J.; Jirka, S.; Simonis, I.; Everding, T.; Stasch, C.; Liang, S.; Lemmens, R. New Generation Sensor Web Enablement. Sensors 2011, 11, 2652–2699. [Google Scholar] [CrossRef] [PubMed]
  28. Barnes, C.R.; Best, M.M.R.; Johnson, F.R.; Pautet, L.; Pirenne, B. Challenges, Benefits, and Opportunities in Installing and Operating Cabled Ocean Observatories Perspectives from NEPTUNE Canada. IEEE J. Ocean. Eng. 2013, 38, 144–157. [Google Scholar] [CrossRef]
  29. O’Reilly, T.C.; Headley, K.; Edgington, D.R.; Rueda, C.; Lee, K.; Song, E.; Zedlitz, J.; del Rio, J.; Toma, D.; Manuel, A.; et al. Instrument Interface Standards for Interoperable Ocean Sensor Networks. In Proceedings of the OCEANS Conference, Bremen, Germany, 11–14 May 2009; IEEE: Piscataway, NJ, USA, 2009. [Google Scholar]
  30. Talukder, A.; Panangadan, A.V.; Georgas, N.; Herrington, T.; Blumberg, A.F. Integrated Operational Control of Unattended Distributed Coastal Sensor Web Systems With Mobile Autonomous Robots. IEEE J-Stars. 2010, 3, 442–450. [Google Scholar] [CrossRef]
  31. Gokaraju, B.; Durbha, S.S.; King, R.L.; Younan, N.H. Sensor Web and Data Mining Approaches for Harmful Algal Bloom Detection and Monitoring in the Gulf of Mexico Region. In Proceedings of the 2009 IEEE International Geoscience and Remote Sensing Symposium, Cape Town, South Africa, 12–17 July 2009; IEEE: Piscataway, NJ, USA, 2010. [Google Scholar]
  32. Durbha, S.S.; King, R.L.; Amanchi, S.K.; Bheemireddy, S.; Younan, N.H. Standards-Based Middleware and Tools for Coastal Sensor Web Applications. IEEE J-Stars. 2010, 3, 451–466. [Google Scholar] [CrossRef]
  33. Rio, J.; Toma, D.M.; O’Reilly, T.C.; Bröring, A.; Dana, D.R.; Bache, F.; Headley, K.L.; Manuel, L.A.; Edgington, D.R. Standards-Based Plug & Work for Instruments in Ocean Observing Systems. IEEE J. Ocean. Eng. 2014, 39, 430–443. [Google Scholar]
  34. Smith, L.M.; Barth, J.A.; Kelley, D.S.; Plueddemann, A.; Rodero, I.; Ulses, G.A.; Vardaro, M.; Weller, R. The Ocean Observatories Initiative. Oceanography 2018, 31, 16–35. [Google Scholar] [CrossRef]
  35. Río Fernandez, J.d.; Toma, D.; Martínez, P.E.; O’Reilly, T.C.; Delory, E.; Pearlman, J.S.; Waldmann, C.; Jirka, S. A Sensor Web Architecture for Integrating Smart Oceanographic Sensors into the Semantic Sensor Web. IEEE J. Ocean. Eng. 2018, 43, 830–842. [Google Scholar]
  36. Ontrup, J.; Ehnert, N.; Bergmann, M.; Nattkemper, T.W. Biigle—Web 2.0 enabled labelling and exploring of images from the Arctic deep-sea observatory HAUSGARTEN. In Proceedings of the OCEANS Conference, Bremen, Germany, 11–14 May 2009; IEEE: Piscataway, NJ, USA, 2009. [Google Scholar]
  37. Danobeitia, J.; Garcia, O.; Bartolome, R.; Cannat, M.; Cagatay, M.N.; Danobeitia, J.J.; Delory, E.; de Stigter, H.; Ferre, B.; Gillooly, M.; et al. European Multidisciplinary seafloor and water column Observatory for Development; The setup of an interoperable Generic Sensor Module. In Proceedings of the AGU Fall Meeting, San Francisco, CA, USA, 11–16 December 2016. [Google Scholar]
  38. Best, M.M.R.; Favali, P.; Beranzoli, L.; Cannat, M.; Cagatay, M.N.; Danobeitia, J.J.; Delory, E.; de Stigter, H.; Ferre, B.; Gillooly, M.; et al. European multidisciplinary seafloor and water-column observatory (EMSO): Power and Internet to European waters. In Proceedings of the OCEANS Conference, St. John’s, NL, Canada, 14–19 September 2014; IEEE: Piscataway, NJ, USA, 2015. [Google Scholar]
  39. Partescano, E.; Brosich, A.; Lipizer, M.; Cardin, V.; Giorgetti, A. From heterogeneous marine sensors to sensor web: (near) real-time open data access adopting OGC sensor web enablement standards. Open Geospatial Data Softw. Stand. 2017, 2, 1–9. [Google Scholar] [CrossRef]
  40. Rio, J.; Delory, E. From ocean sensors to traceable knowledge by harmonizing ocean observing systems. Earthzine: IEEE Committee on Earth Observations, 14 September 2010; 1–11. [Google Scholar]
  41. Puillat, I.; Person, R.; Leveque, C.; Drogou, J.-F.; Diepenbroek, M.; Garreau, P.; Waldmann, C.; Auffret, Y. Standardization Prospective in ESONET NoE and a Possible Implementation on the ANTARES Site. Nucl. Instrum. Meth. A 2009, 602, 240–245. [Google Scholar] [CrossRef]
  42. Ohki, T.; Yokobiki, T.; Matsumoto, H.; Nishida, S.; Kodera, T.; Toizumi, M.; Kawaguchi, K. Survey and data management method based on geographic information system for cable based observatory development. In Proceedings of the OCEANS Conference, Kobe, Japan, 6–8 October 2016; IEEE: Piscataway, NJ, USA, 2017. [Google Scholar]
  43. Conover, H.; Berthiau, G.; Botts, M.; Goodman, H.M.; Li, X.; Lu, Y.; Maskey, M.; Regner, K.; Zavodsky, B. Using sensor web protocols for environmental data acquisition and management. Ecol. Inform. 2010, 5, 32–41. [Google Scholar] [CrossRef]
  44. Li, X.; Zhou, L.F.; Gao, F.X. Application of SOA in the Prototype System for Seafloor Observatory Network. In Proceedings of the ICSS, Shenzhen, China, 11–13 April 2013; IEEE: Piscataway, NJ, USA, 2013. [Google Scholar]
  45. Jiang, Y.G.; Dou, J.F.; Guo, Z.W.; Hu, K. Research of Marine Sensor Web Based on SOA and EDA. J. Ocean Univ. China 2015, 14, 261–268. [Google Scholar] [CrossRef]
  46. Yu, Y.; Xu, H.P.; Xu, C.W. Development of a Plug-and-Play Monitoring System for Cabled Observatories in the East China Sea. Sensors 2015, 15, 17926–17943. [Google Scholar] [CrossRef] [PubMed]
  47. Chen, H.; Xu, H.; Yü, Y.; Qin, R.; Xu, C. Design and Implementation of a Data Distribution System for Xiaoqushan Submarine Comprehensive Observation and Marine Equipment Test Platform. Comput. Geosci. 2015, 82, 31–37. [Google Scholar] [CrossRef]
  48. Zhou, Y.; Qin, R.; Xu, H.; Sadiq, S.; Yu, Y. A Data Quality Control Method for Seafloor Observatories: The Application of Observed Time Series Data in the East China Sea. Sensors 2018, 18, 2628. [Google Scholar] [CrossRef] [Green Version]
  49. Chen, J.; Xu, H.P.; Qin, R.F. Implementation of the WebGIS of East China Sea seafloor observatory system. In Proceedings of the OCEANS Conference, Taipei, Taiwan, 7–10 April 2014; IEEE: Piscataway, NJ, USA, 2014. [Google Scholar]
Figure 1. Information-oriented sensor web architecture.
Jmse 07 00414 g001
Figure 2. Plug-and-play mechanism of the sensor web architecture.
Jmse 07 00414 g002
Figure 3. Subsystems of the sensor web prototype.
Jmse 07 00414 g003
Figure 4. Main interface of the remote-control system.
Jmse 07 00414 g004
Figure 5. Main interface of the data distribution system.
Jmse 07 00414 g005
Figure 6. Historical data interface of the web application system.
Jmse 07 00414 g006
Figure 7. Main interface of the real-time monitoring system.
Jmse 07 00414 g007
Figure 8. Zhujiajian Seafloor Observatory.
Jmse 07 00414 g008
Figure 9. Tank test for sensor web prototype (ESOSW).
Jmse 07 00414 g009
Figure 10. Shallow sea trial for ESOSW.
Jmse 07 00414 g010
Figure 11. Case study for near bottom boundary layer processes in coastal East China Sea.
Jmse 07 00414 g011
Table 1. Xiaoqushan Seafloor Observatory sensor upgrade.
SensorOriginal ObservatoryUpgrade Observatory
Video
CO2×
OBS×
CTD
Turbidity
Underwater CO2×
PH×
Tide and Wave×
ADCP
Imaging Sonar×
Magnetometer×
Table 2. Zhujiajian Seafloor Observatory sensors.
Observatory NodeSensorObservation ParameterSampling Interval
Node 1
(Node of Shanghai Science and Technology Commission)
CTD/SBE16Temperature, Conductivity, Dissolved oxygen, Depth50 s
CTD/SBE26Temperature, Conductivity, Depth10 s
LISST-100xGranularity, Temperature10 s
AWACSeawater flow field25 min
CameraReal-time Videocontinuous
Node 2
(Node of State Oceanic Administration)
Chlorophyll Meter (SDIOI)Chlorophyll concentration5 s
CTD (SDIOI)Temperature, Conductivity, Depth, Turbidity5 s
CTD (NOTC)Temperature, Conductivity, Depth8 s
ADCP (Linkquest)Seawater flow field5 min
CameraReal-time Videocontinuous
Node 3
(Node of National High-tech Research and Development Plan)
RBR concertoTemperature, Conductivity, Depth30 s
Chlorophyll MeterChlorophyll concentration30 s
Dissolved Oxygen SensorDissolved oxygen concentration30 s
Turbidity SensorTurbidity30 s
SUNA SensorNitrate concentration5 min
HydroC PAHConcentration of polycyclic aromatic hydrocarbons5 s
CO2-Pro CVCarbon dioxide concentration30 min
Methane SensorMethane concentration10 s
ADV/Nortek Vector Current MeterSingle point velocity10 min
ADCP/WHMW300-I-UG11Profile velocity1 min
TDO-33BSeismic data0.01 s
CameraReal-time Videoprogram control

