Article

Management of Dredging Activities in a Highly Vulnerable Site: Simulation Modelling and Monitoring Activity

Department of Civil, Environmental, Land, Building Engineering and Chemistry (DICATECh), Polytechnic University of Bari (Italy), via Orabona 4, 70125 Bari, Italy
*
Author to whom correspondence should be addressed.
J. Mar. Sci. Eng. 2020, 8(12), 1020; https://doi.org/10.3390/jmse8121020
Submission received: 27 October 2020 / Revised: 6 December 2020 / Accepted: 8 December 2020 / Published: 13 December 2020
(This article belongs to the Section Coastal Engineering)

Abstract

:
Unfortunately, more and more contaminants, such as heavy metals and other organic micro-pollutants, degrade the good ecological status of marine systems. The removal of contaminated sediments from harbours through dredging activities may cause harmful changes in the environment. This present work shows how monitoring the activity and validated numerical models can be of great help to dredging activities that can cause environmental impacts due to the increase of the suspended solid concentration (SSC) and their dispersion and deposition far from the dredging point. This study is applied to a hypothetical dredging project in a very vulnerable coastal site in Southern Italy, the Mar Piccolo Basin. A statistical analysis of the simulated parameter SSC was carried out to numerically estimate its spatial (vertical and horizontal) variability, thereby allowing an evaluation of the potential environmental effects on the coastal area.

1. Introduction

In the last years, the problem of contaminated marine sediments has become a worldwide environmental issue, because it threatens the marine systems and human health. However, contamination often involves large volumes of sediment but with low contamination levels; in this case, “no action” may be a preferred alternative in cases in which the remedy may be worse than the disease [1].
However, when dredging is a fundamental element of the economic/environmental performance of a basin, it is very important to define an environmental monitor strategy to assess the state of the marine ecosystem in order to avoid any adverse effects to the environment and prepare also the eventual adoption of mitigation measures.
All types of dredging operations create turbidity in the water column, depending on the type of dredges (hydraulic or mechanical), of the sediment bed and hydrodynamic conditions.
The most important environmental problems on marine organisms are reductions in dissolved oxygen and the decrease of sunlight in surface water due to turbidity.
In the last years, increasing attention has been paid to environmental impacts during dredging activities, and therefore, mitigating measures to reduce these effects have been adopted [2].
This has led to the development of new types of ecological dredges in order to reduce suspended sediment and turbidity, especially to remove and to relocate contaminated materials. In particular, special watertight buckets called “environmental” buckets are used to reduce the turbidity of dredging operations in the presence of contaminated sediments [3,4,5,6].
As shown by previous studies [7,8,9,10,11], heavily anthropized coastal basins can be a very vulnerable site, thus requiring strict monitoring actions by local authorities and stakeholders. Therefore, the monitoring activity is a useful tool to assess the status of an environment, mostly in sensitive coastal sites characterised by anthropic pressure factors. The synergistic use of numerical models and monitoring activity can facilitate decision-making during an environmental dredging activity [12]. However, all these numerical models need to be calibrated with reliable field data to have consistent and accurate results.
It is important to define quantifiable tolerance limits for the suspended solid concentration (SSC) as supporting environmental studies and the subsequent indirect monitoring and modelling in a management context during a dredging activity. In this paper, we focused our attention on a coastal site considered one of the most polluted marine ecosystems in Europe.
More recent research paid attention to the hydrodynamic, hydrology, geology and topography characterisations of the area in order to estimate the potential environmental impacts induced by dredging activities [13,14,15,16].
This paper is organised as follows: firstly, a thorough calibration of a 3D hydrodynamic flow model is performed using a set of measured data; after this, a transport module is coupled to the hydrodynamic model to study the response of the basin to a hypothetical dredging activity.

2. Materials and Methods
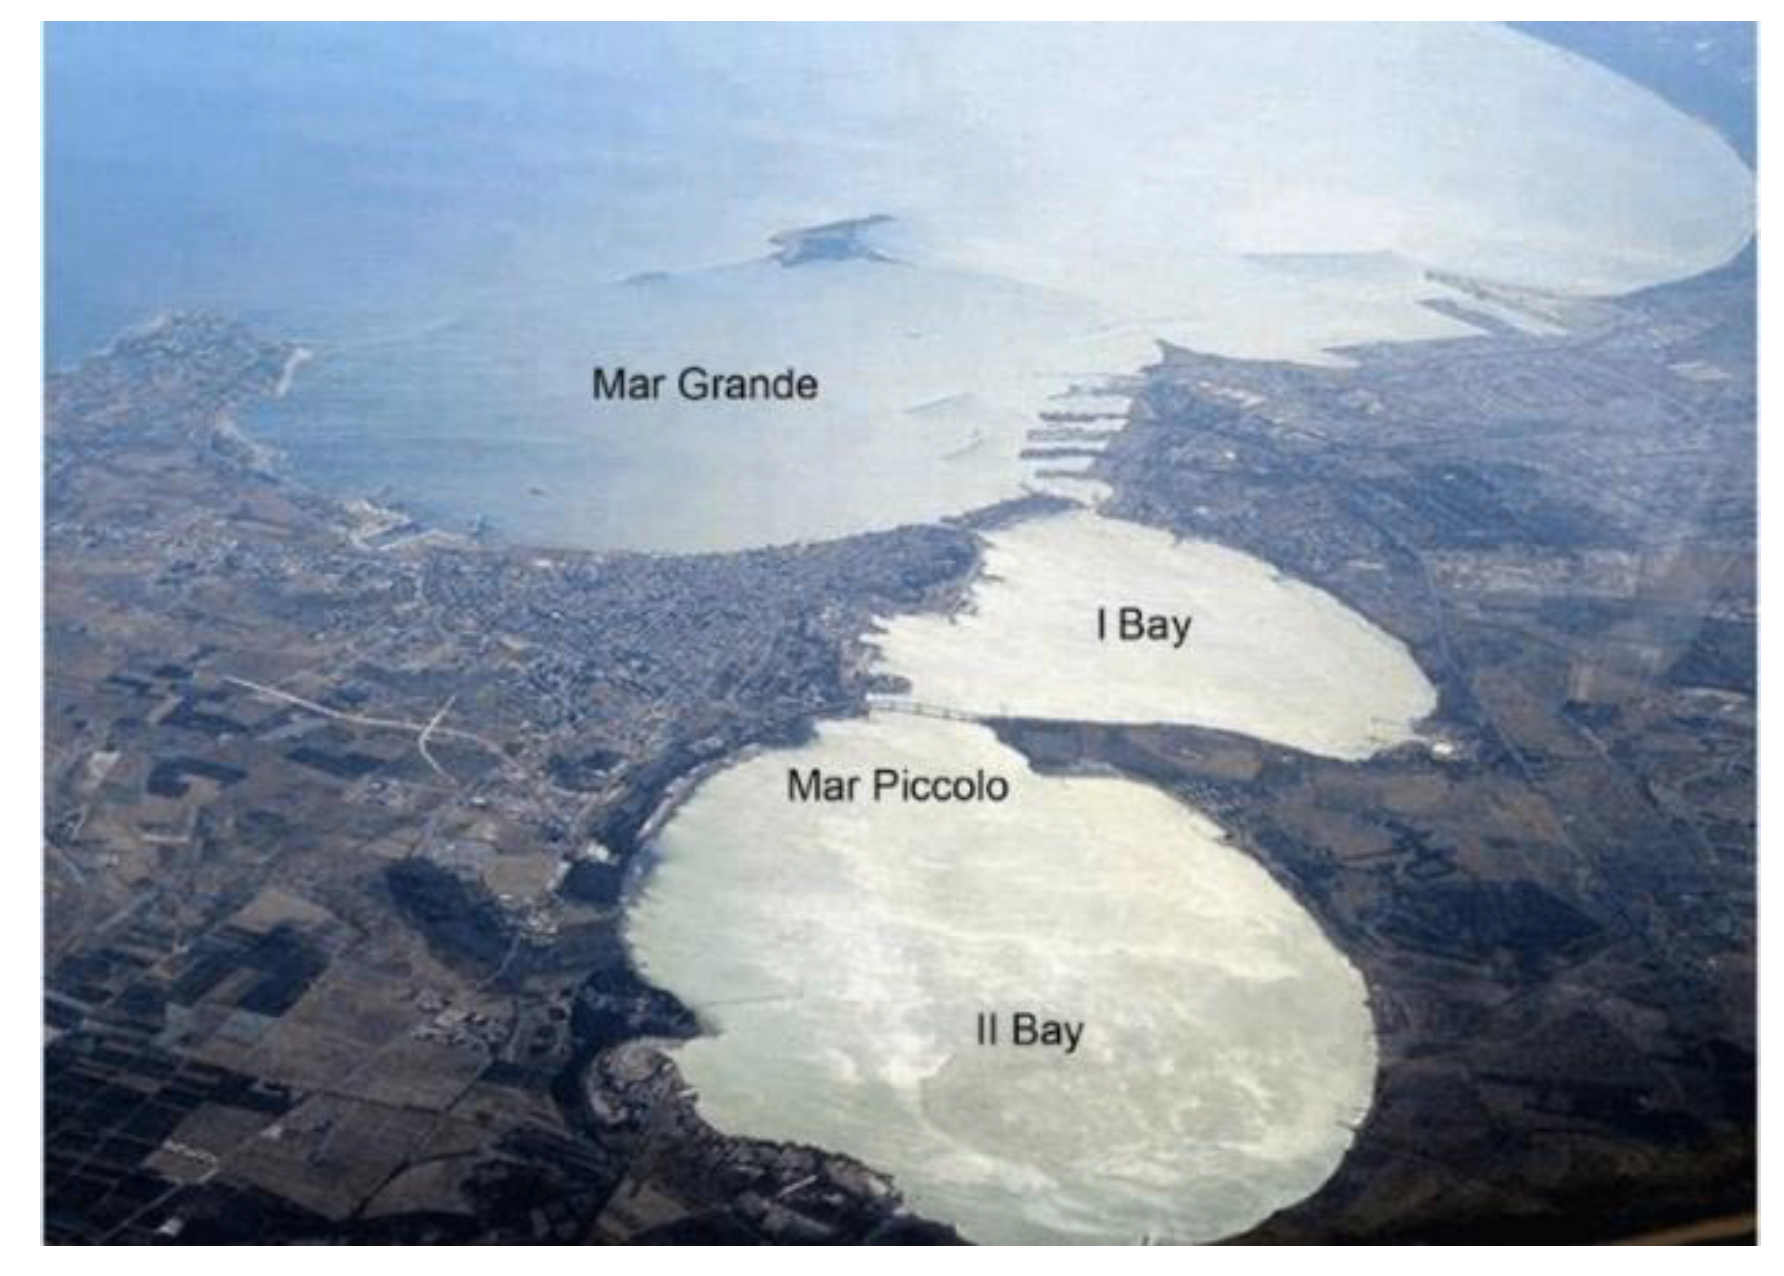
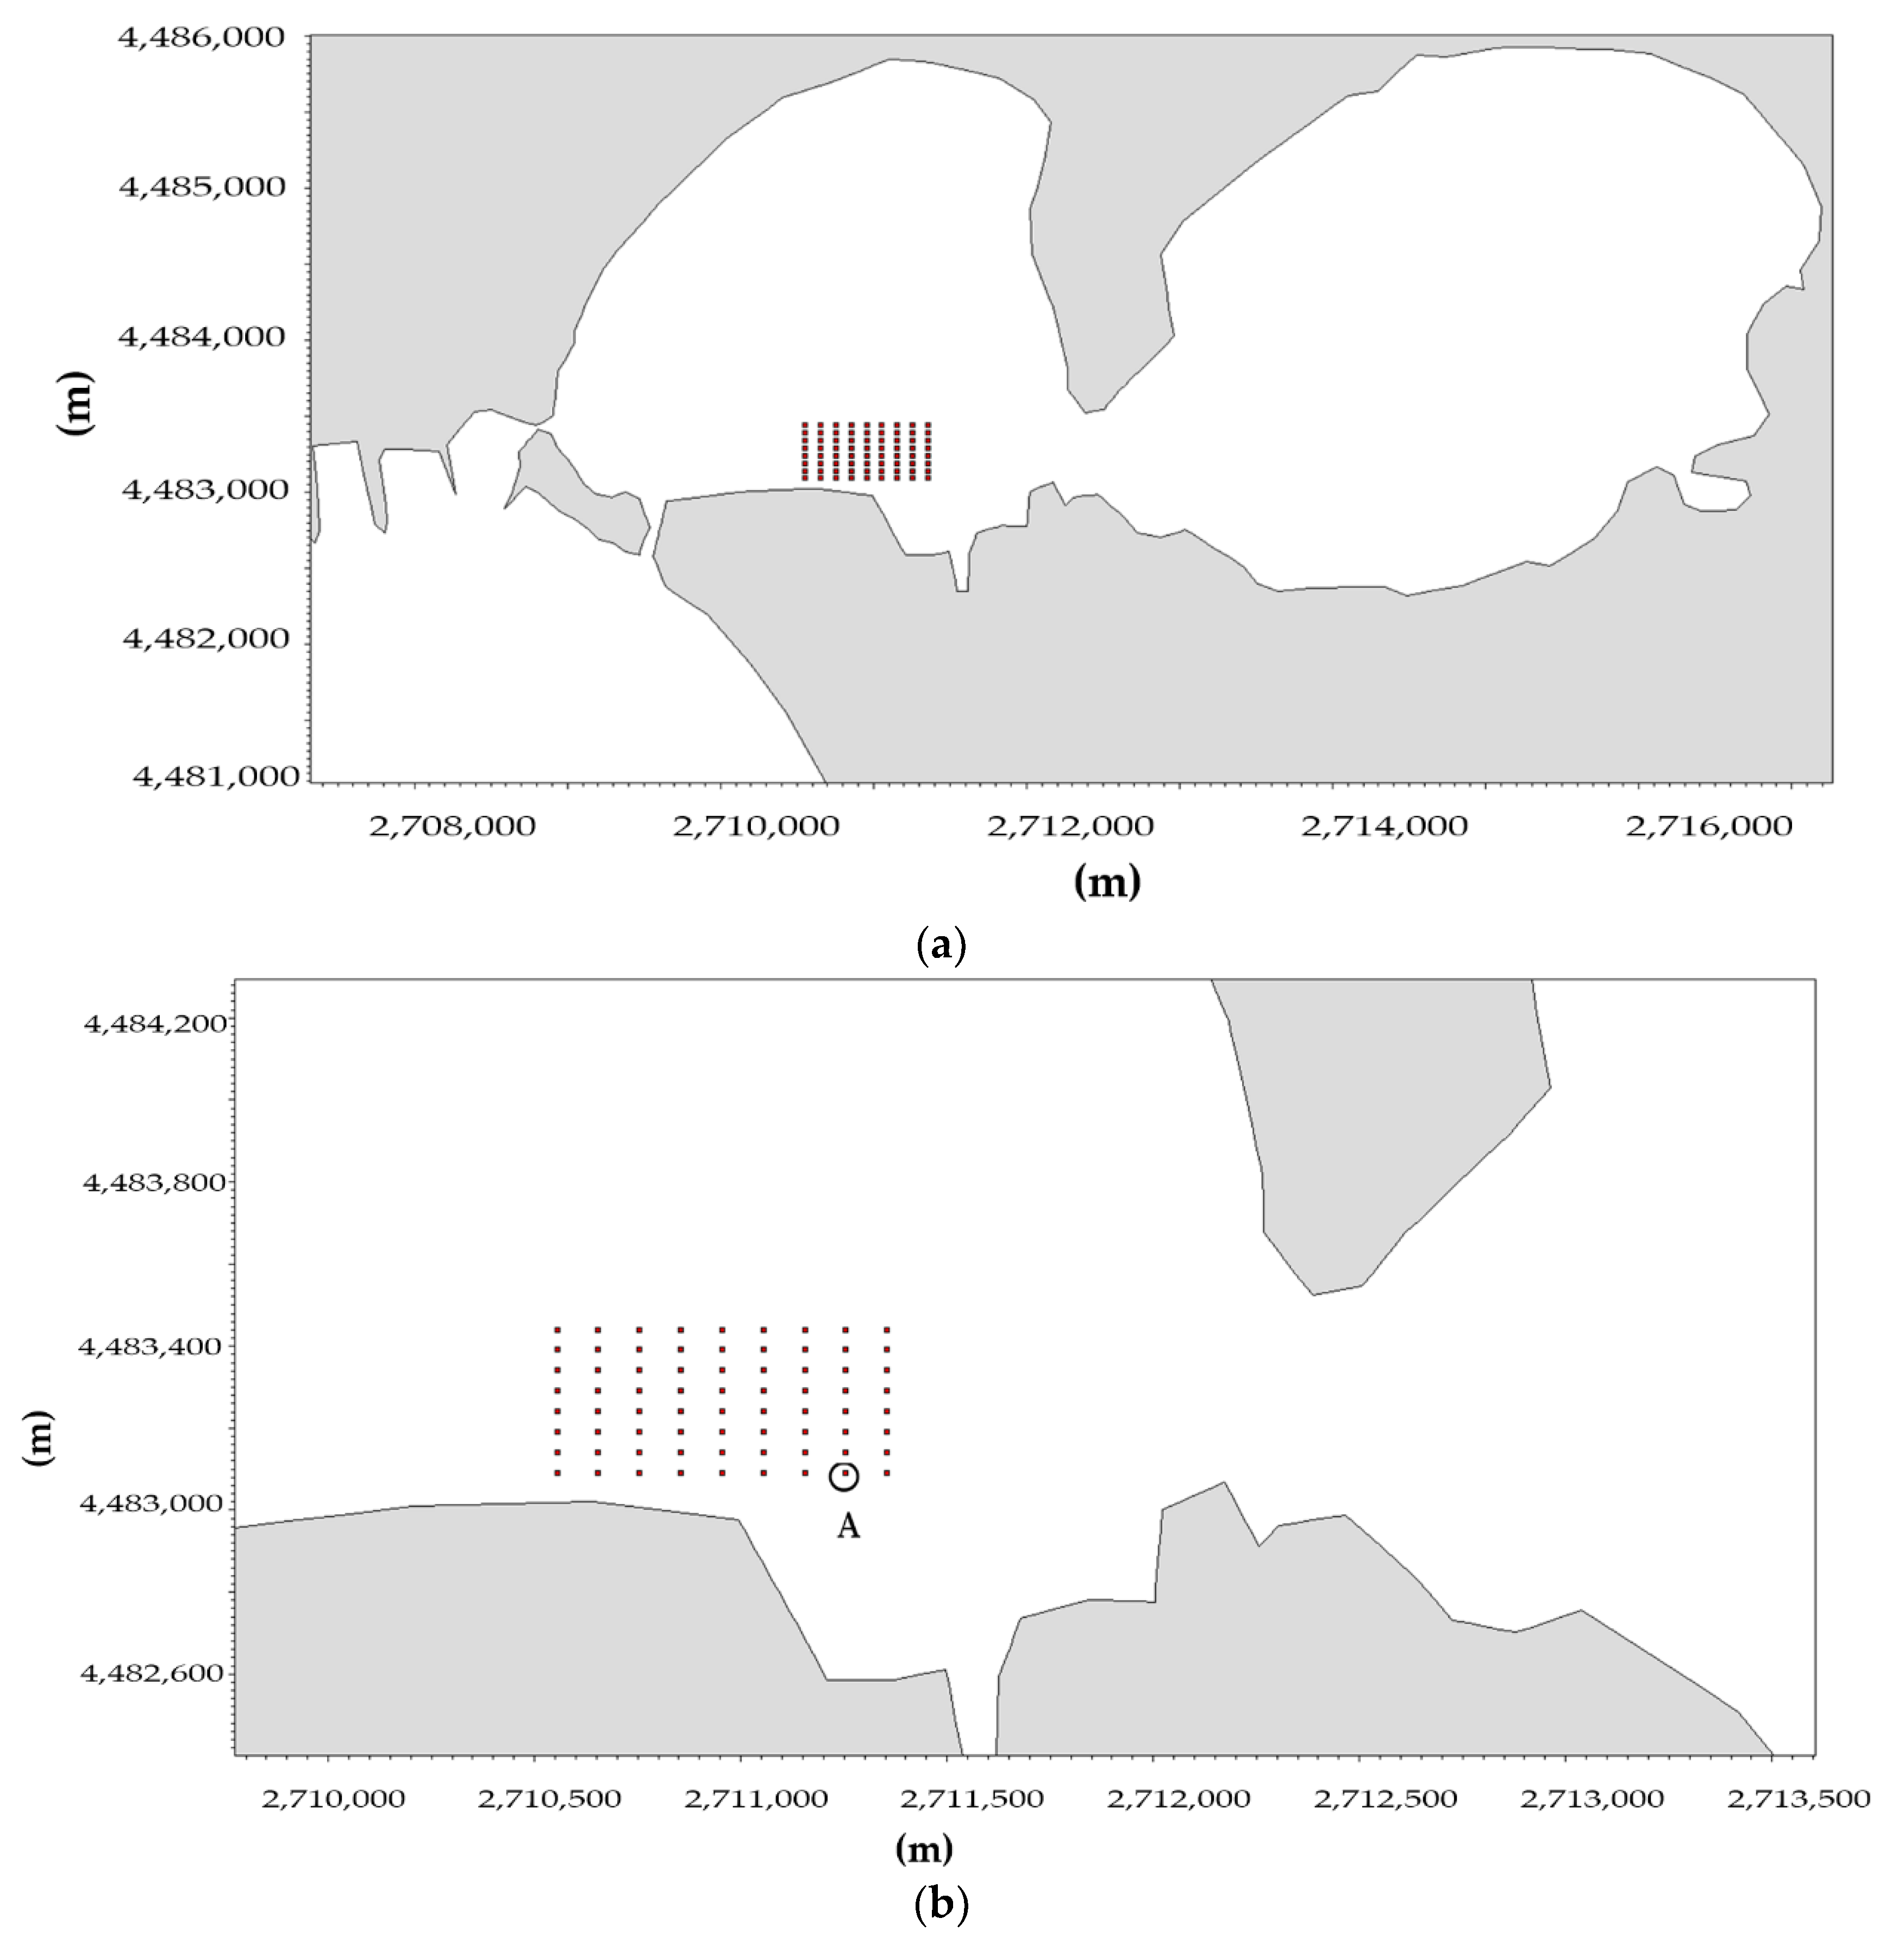
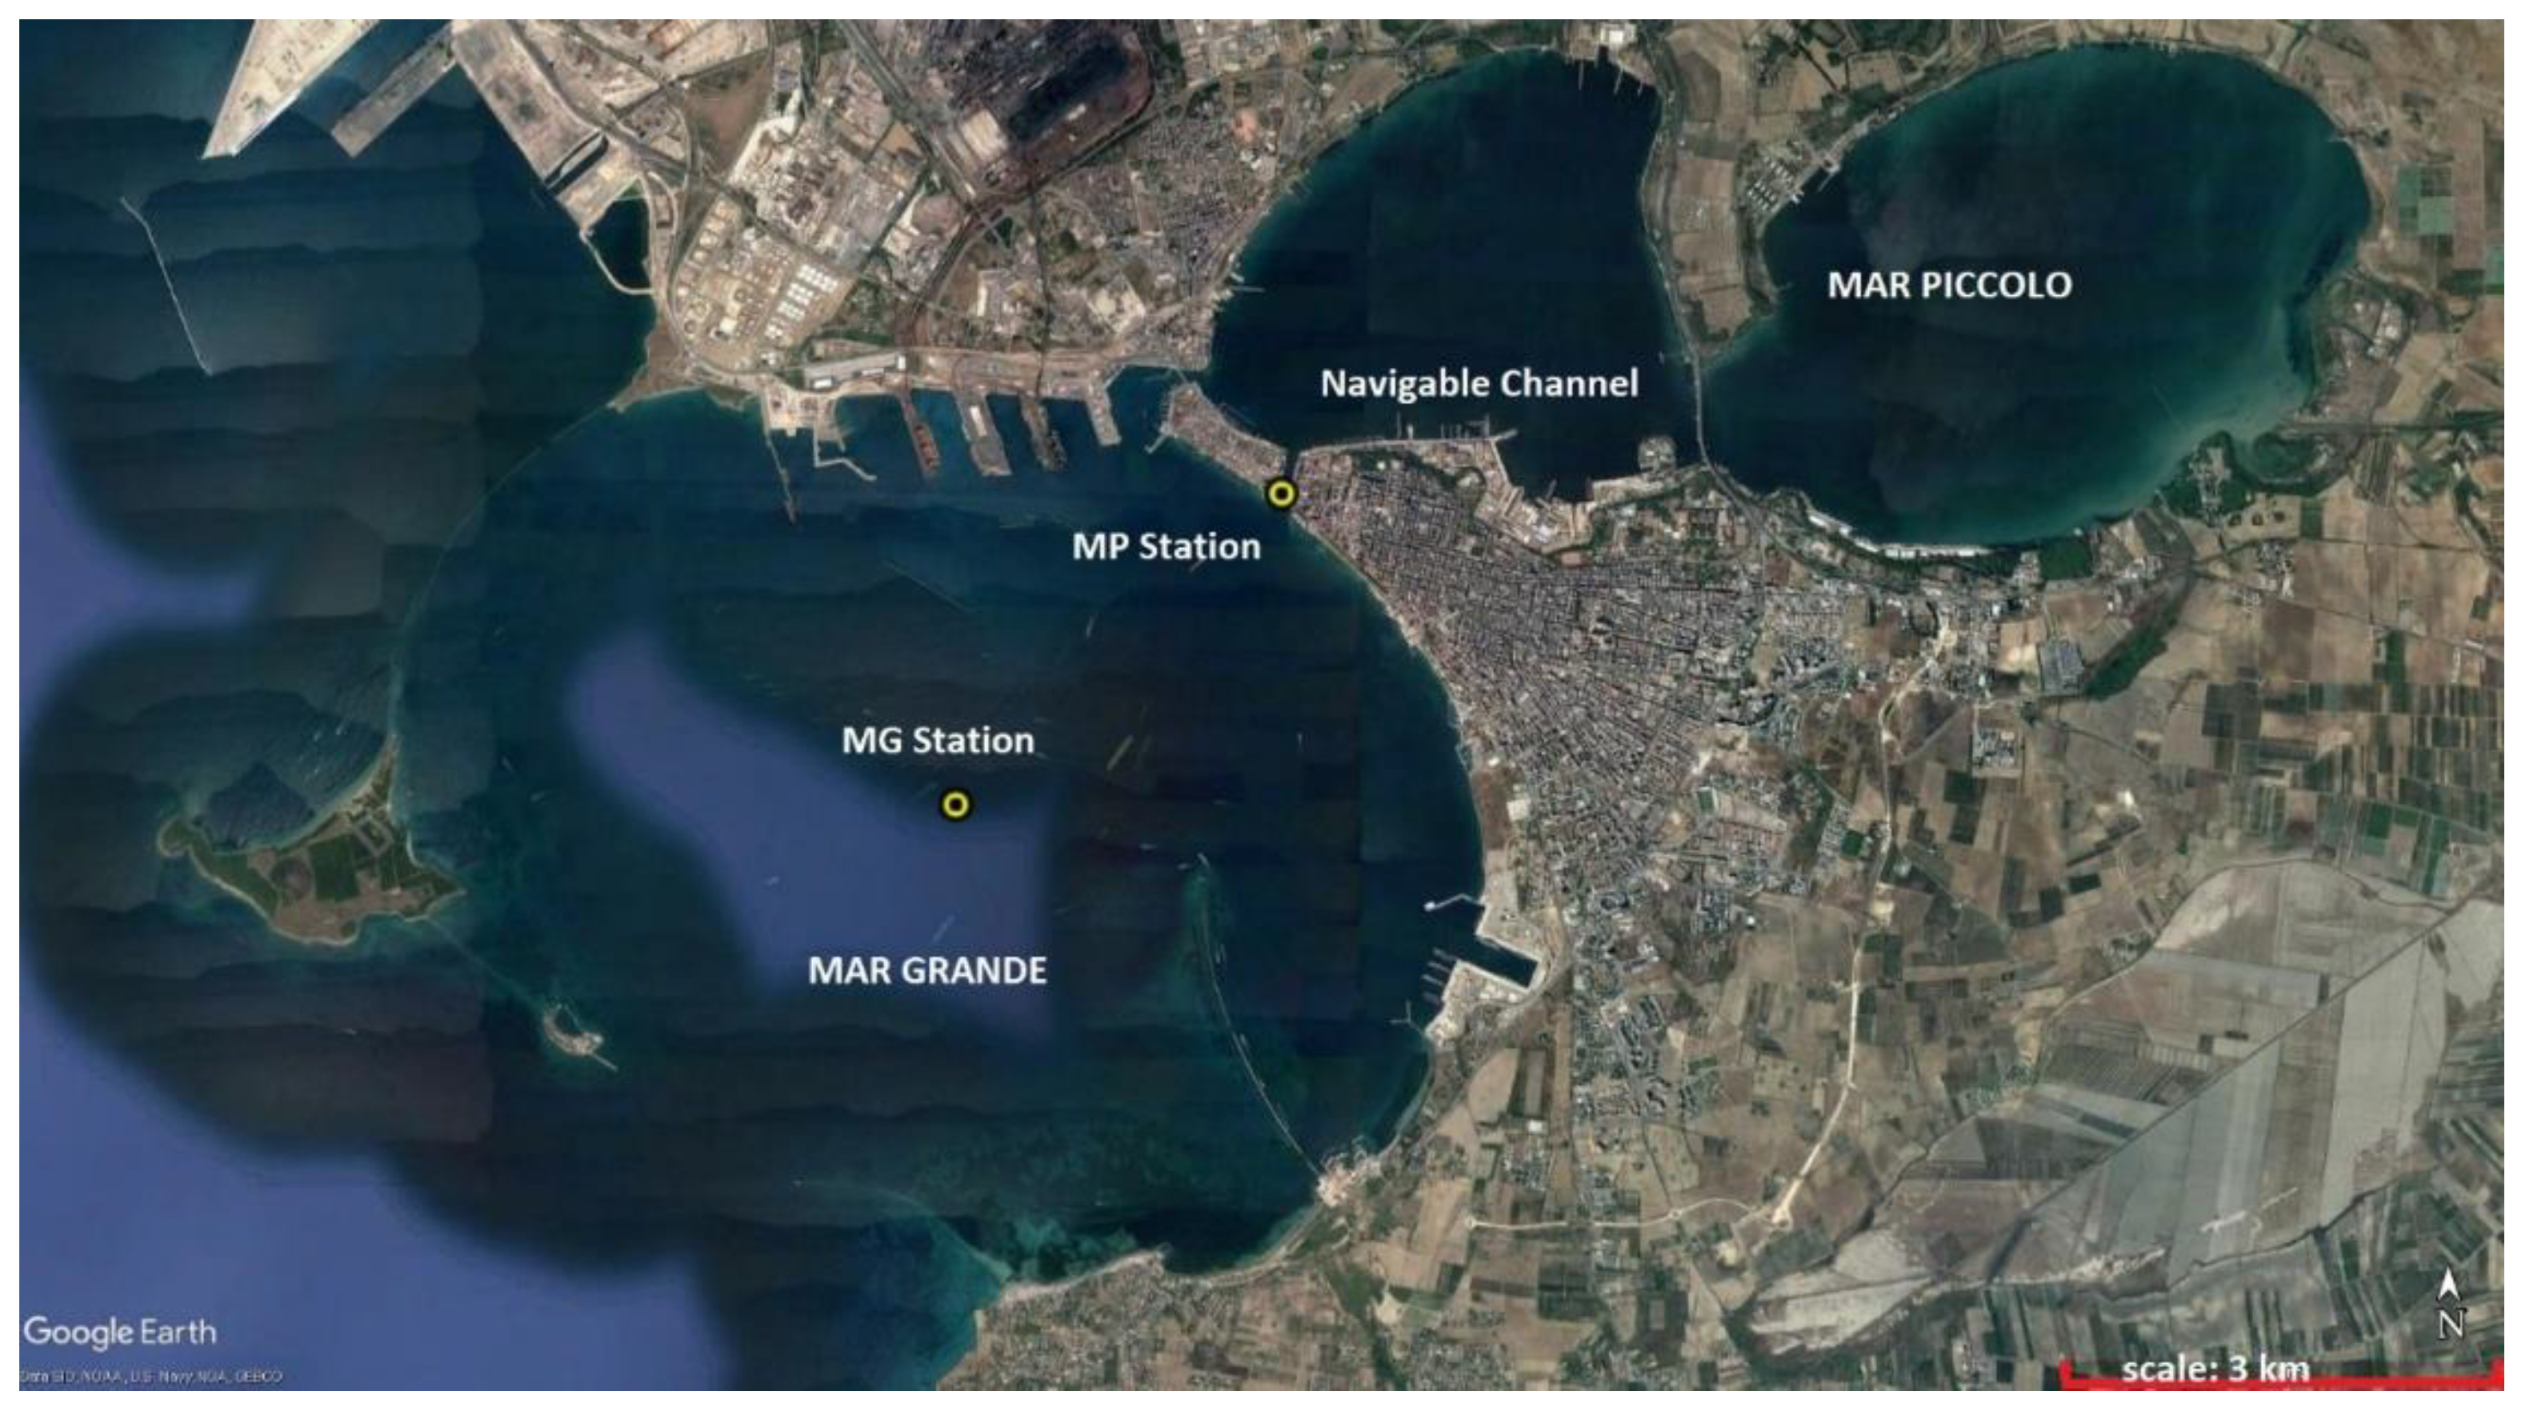
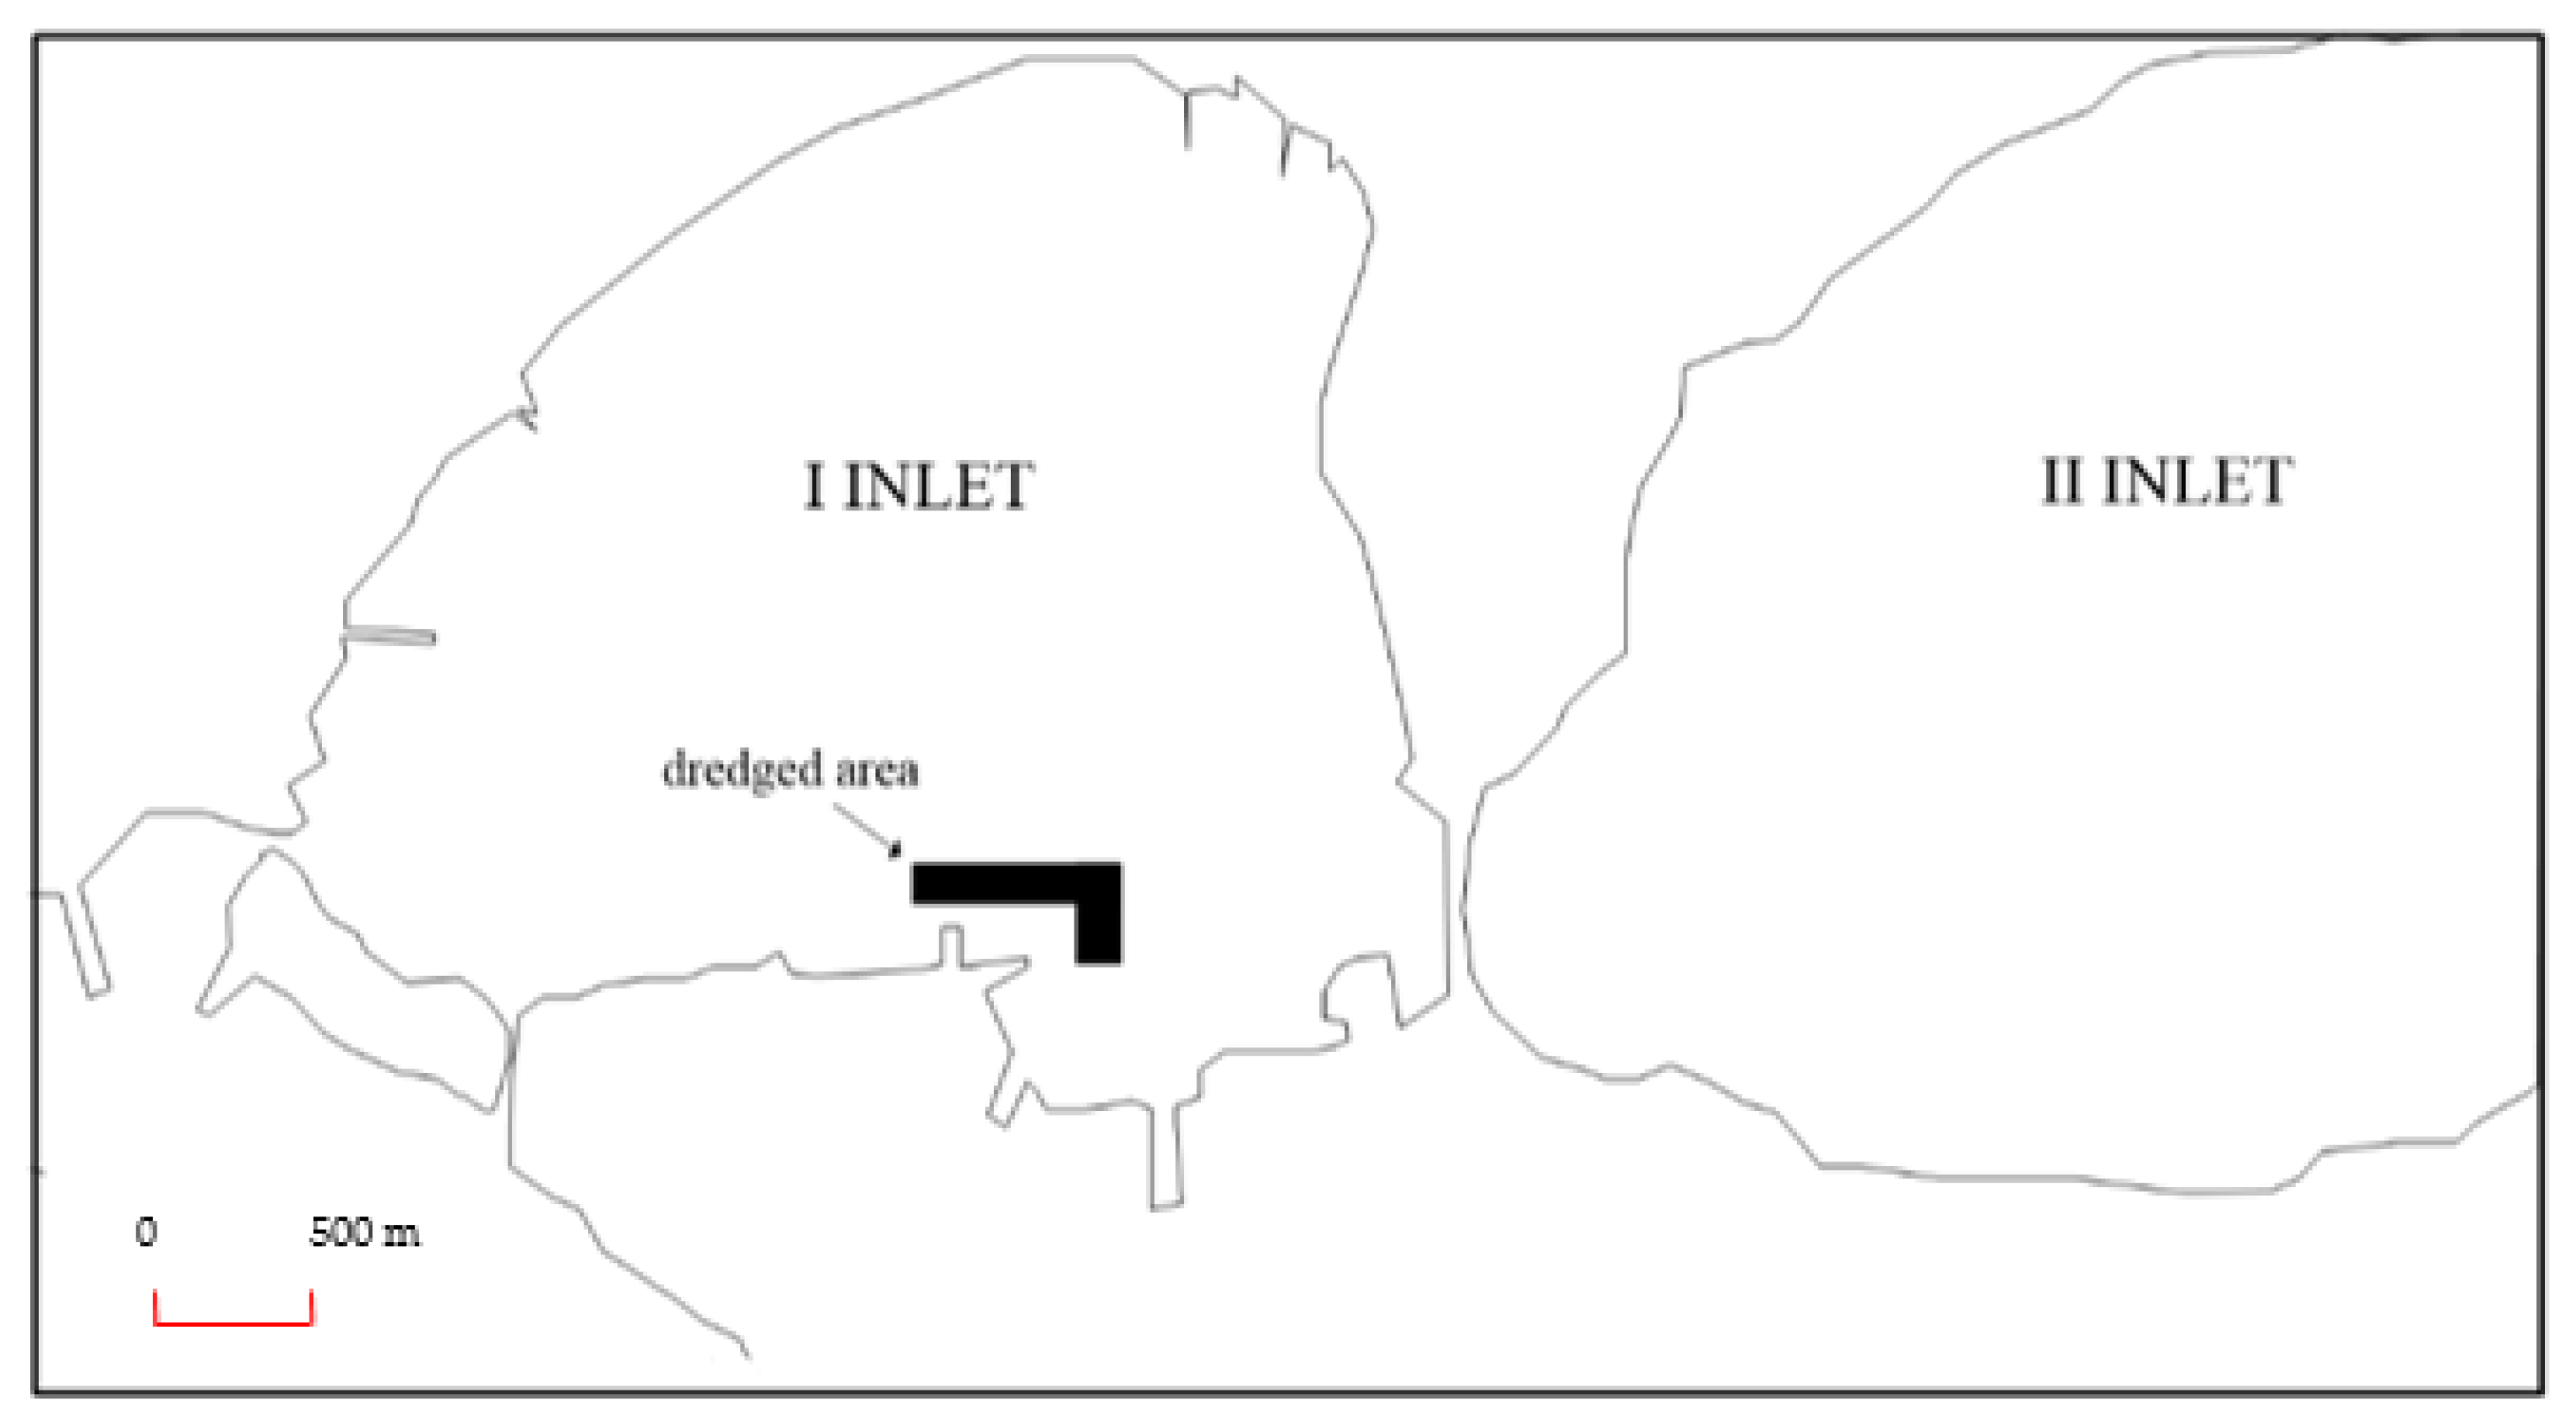
2.1. Study Site

The Mar Piccolo of Taranto, located in Southern Italy (Ionian Sea), is a complex marine ecosystem model important in terms of ecological, social and economic activities for the presence also of extensive mussel farms [17] (Figure 1). It is composed of two bays and joined to the external basin named Mar Grande by means of two channels, i.e., the Navigable Channel and the Porta Napoli Channel. The two bays of the Mar Piccolo are considered as two different ecosystems influencing each other, and the Mar Piccolo basin was assimilated into an estuary by many authors [18,19,20].
The area of the Mar Piccolo Basin is roughly 20.72 km2 and is characterised by the presence of a large number of submarine springs and of two small rivers, called Galeso into Bay I and Ajedda into Bay II. The maximum depth is about 12 m in Bay I and about 9 m in Bay II.
Mar Piccolo, with typical lagoon features and with a suffering scarce circulation, is extremely vulnerable, and unfortunately, this area is characterised to continue the release and diffusion of contaminants with strong chemical–ecological risks towards the marine ecosystem and human health [21,22,23,24,25,26]; therefore, it is important to test potential remediation strategies for contaminated sediments.
The lagoon features of the Mar Piccolo are mainly due to the presence of 34 submarine freshwater springs (locally called “citri”), of which 20 are in the first inlet and 14 in the second inlet.

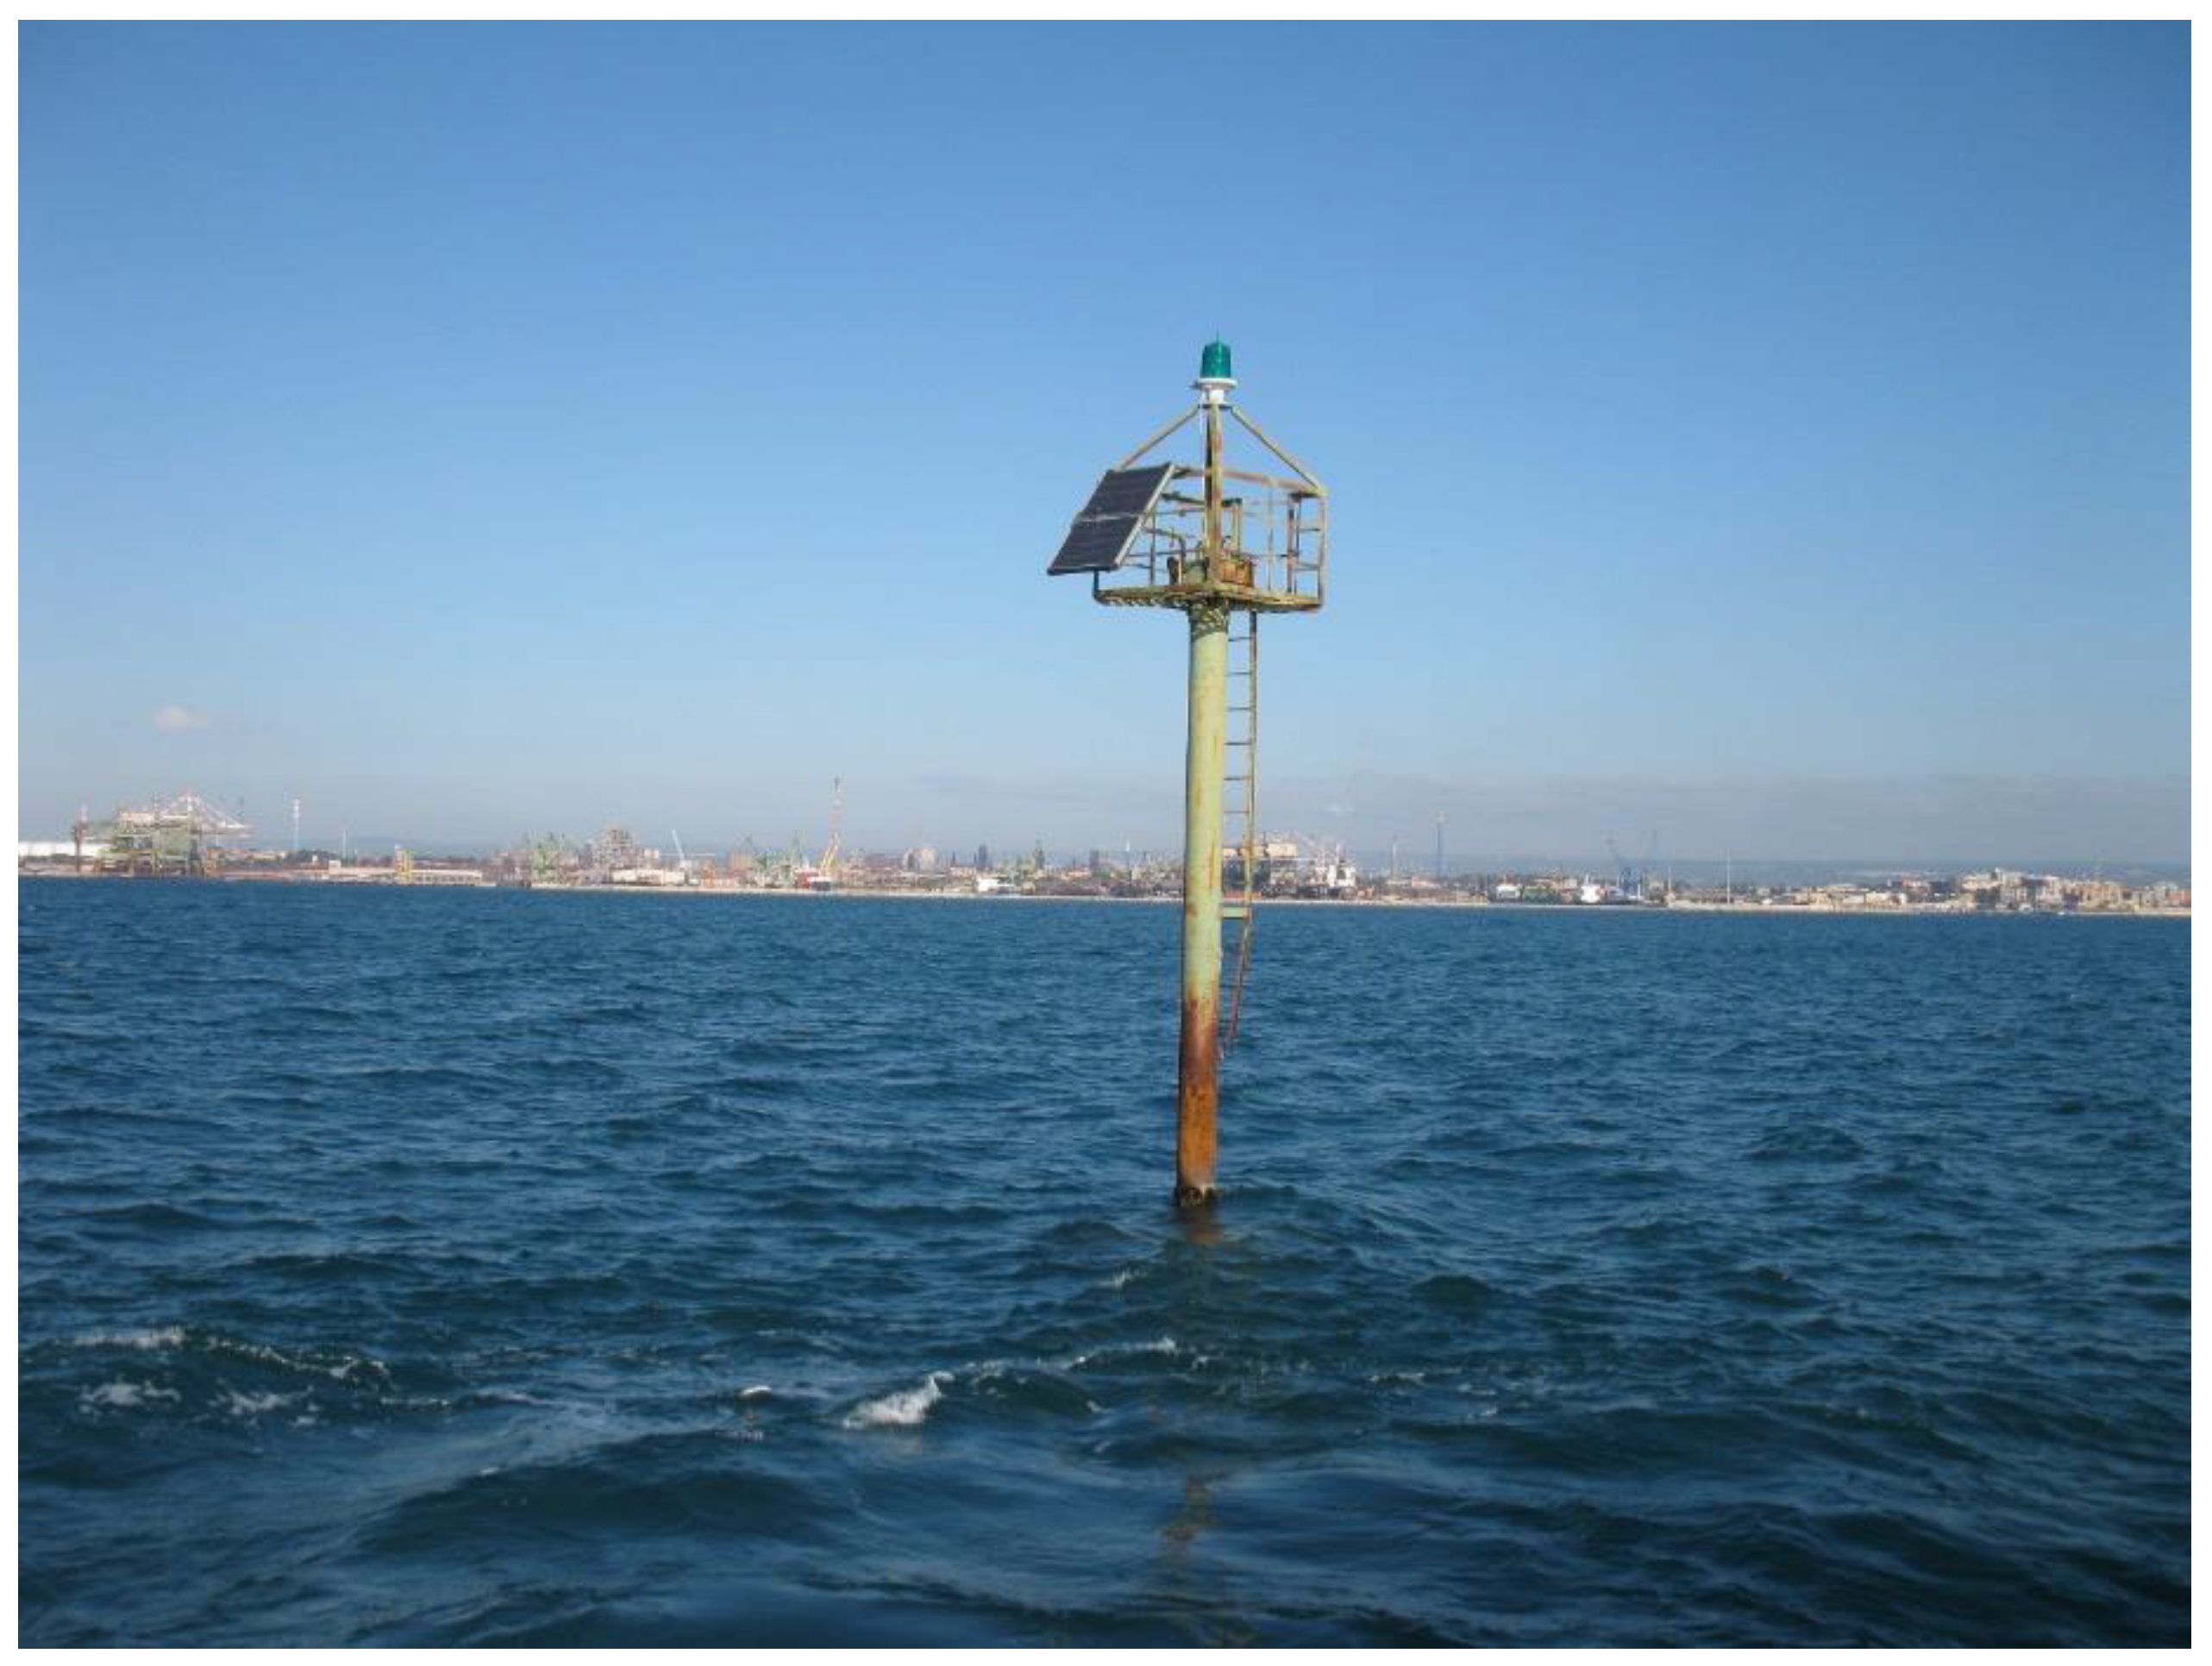
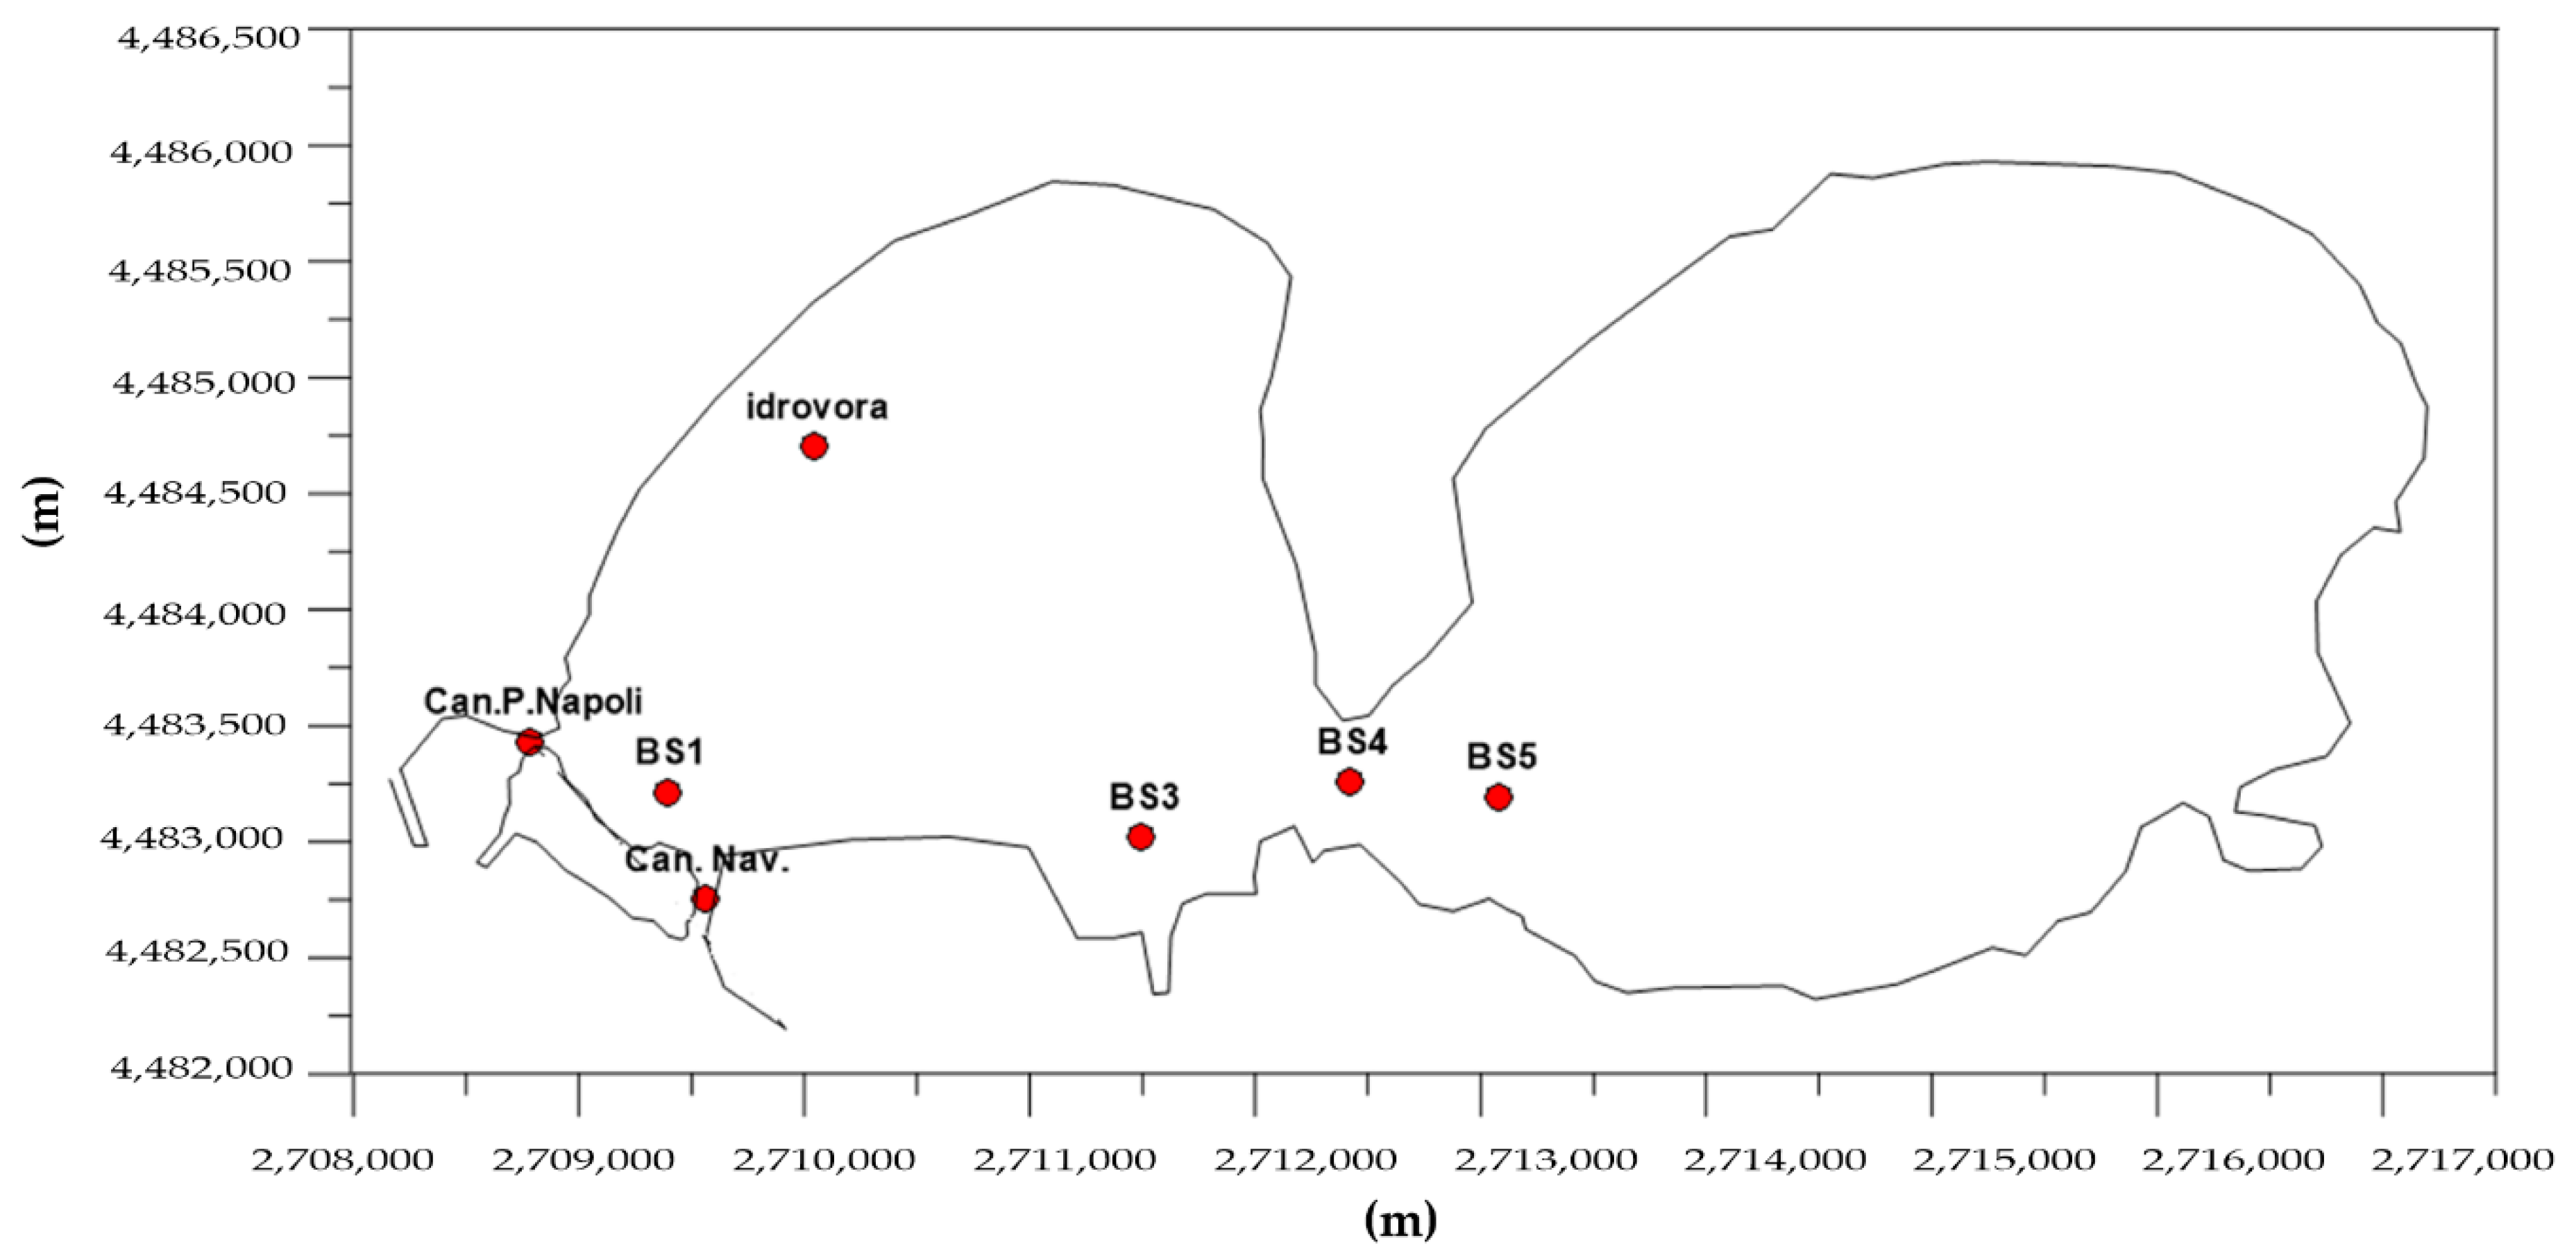
2.2. Environmental Monitoring Action

Environmental monitoring in the Mar Grande and Mar Piccolo of Taranto includes two fixed stations briefly described below (Figure 2).
In the Mar Grande Basin (Figure 3), a bottom-mounted acoustic doppler current profile (ADCP); a multidirectional wave array; a weather station and a CTD (measuring water conductivity, water temperature and depth) were installed. In the Navigable Channel, a second bottom-mounted ADCP and a wave array were installed (Figure 2). More details on the stations can be found in De Serio and Mossa [27].
Moreover, some field data were collected by using a Nortek AWAC vessel-mounted acoustic doppler current profiler (VM-ADCP) on 26 November 2014 between 9:30 a.m. and 13:00 p.m. (GMT) by the research group of the Department of Civil, Environmental, Land, Building Engineering and Chemistry of the Polytechnic University of Bari (Italy) in the frame of the RITMARE Project. Figure 4 shows the points where the measurements were assessed.
The data recorded during the monitoring survey were used to validate the hydrodynamic model.

3. Numerical Simulation

Hydrodynamic and transport modules are used to evaluate how the sea circulation affects sediment transport for different dredging techniques within the target area. In particular, hydrodynamic (HD) and mud transport module (MT) modules of MIKE 3 FM, produced by the Danish Hydraulic Institute (DHI) [28], were used to model the sea current field and the sediment plume dynamics.

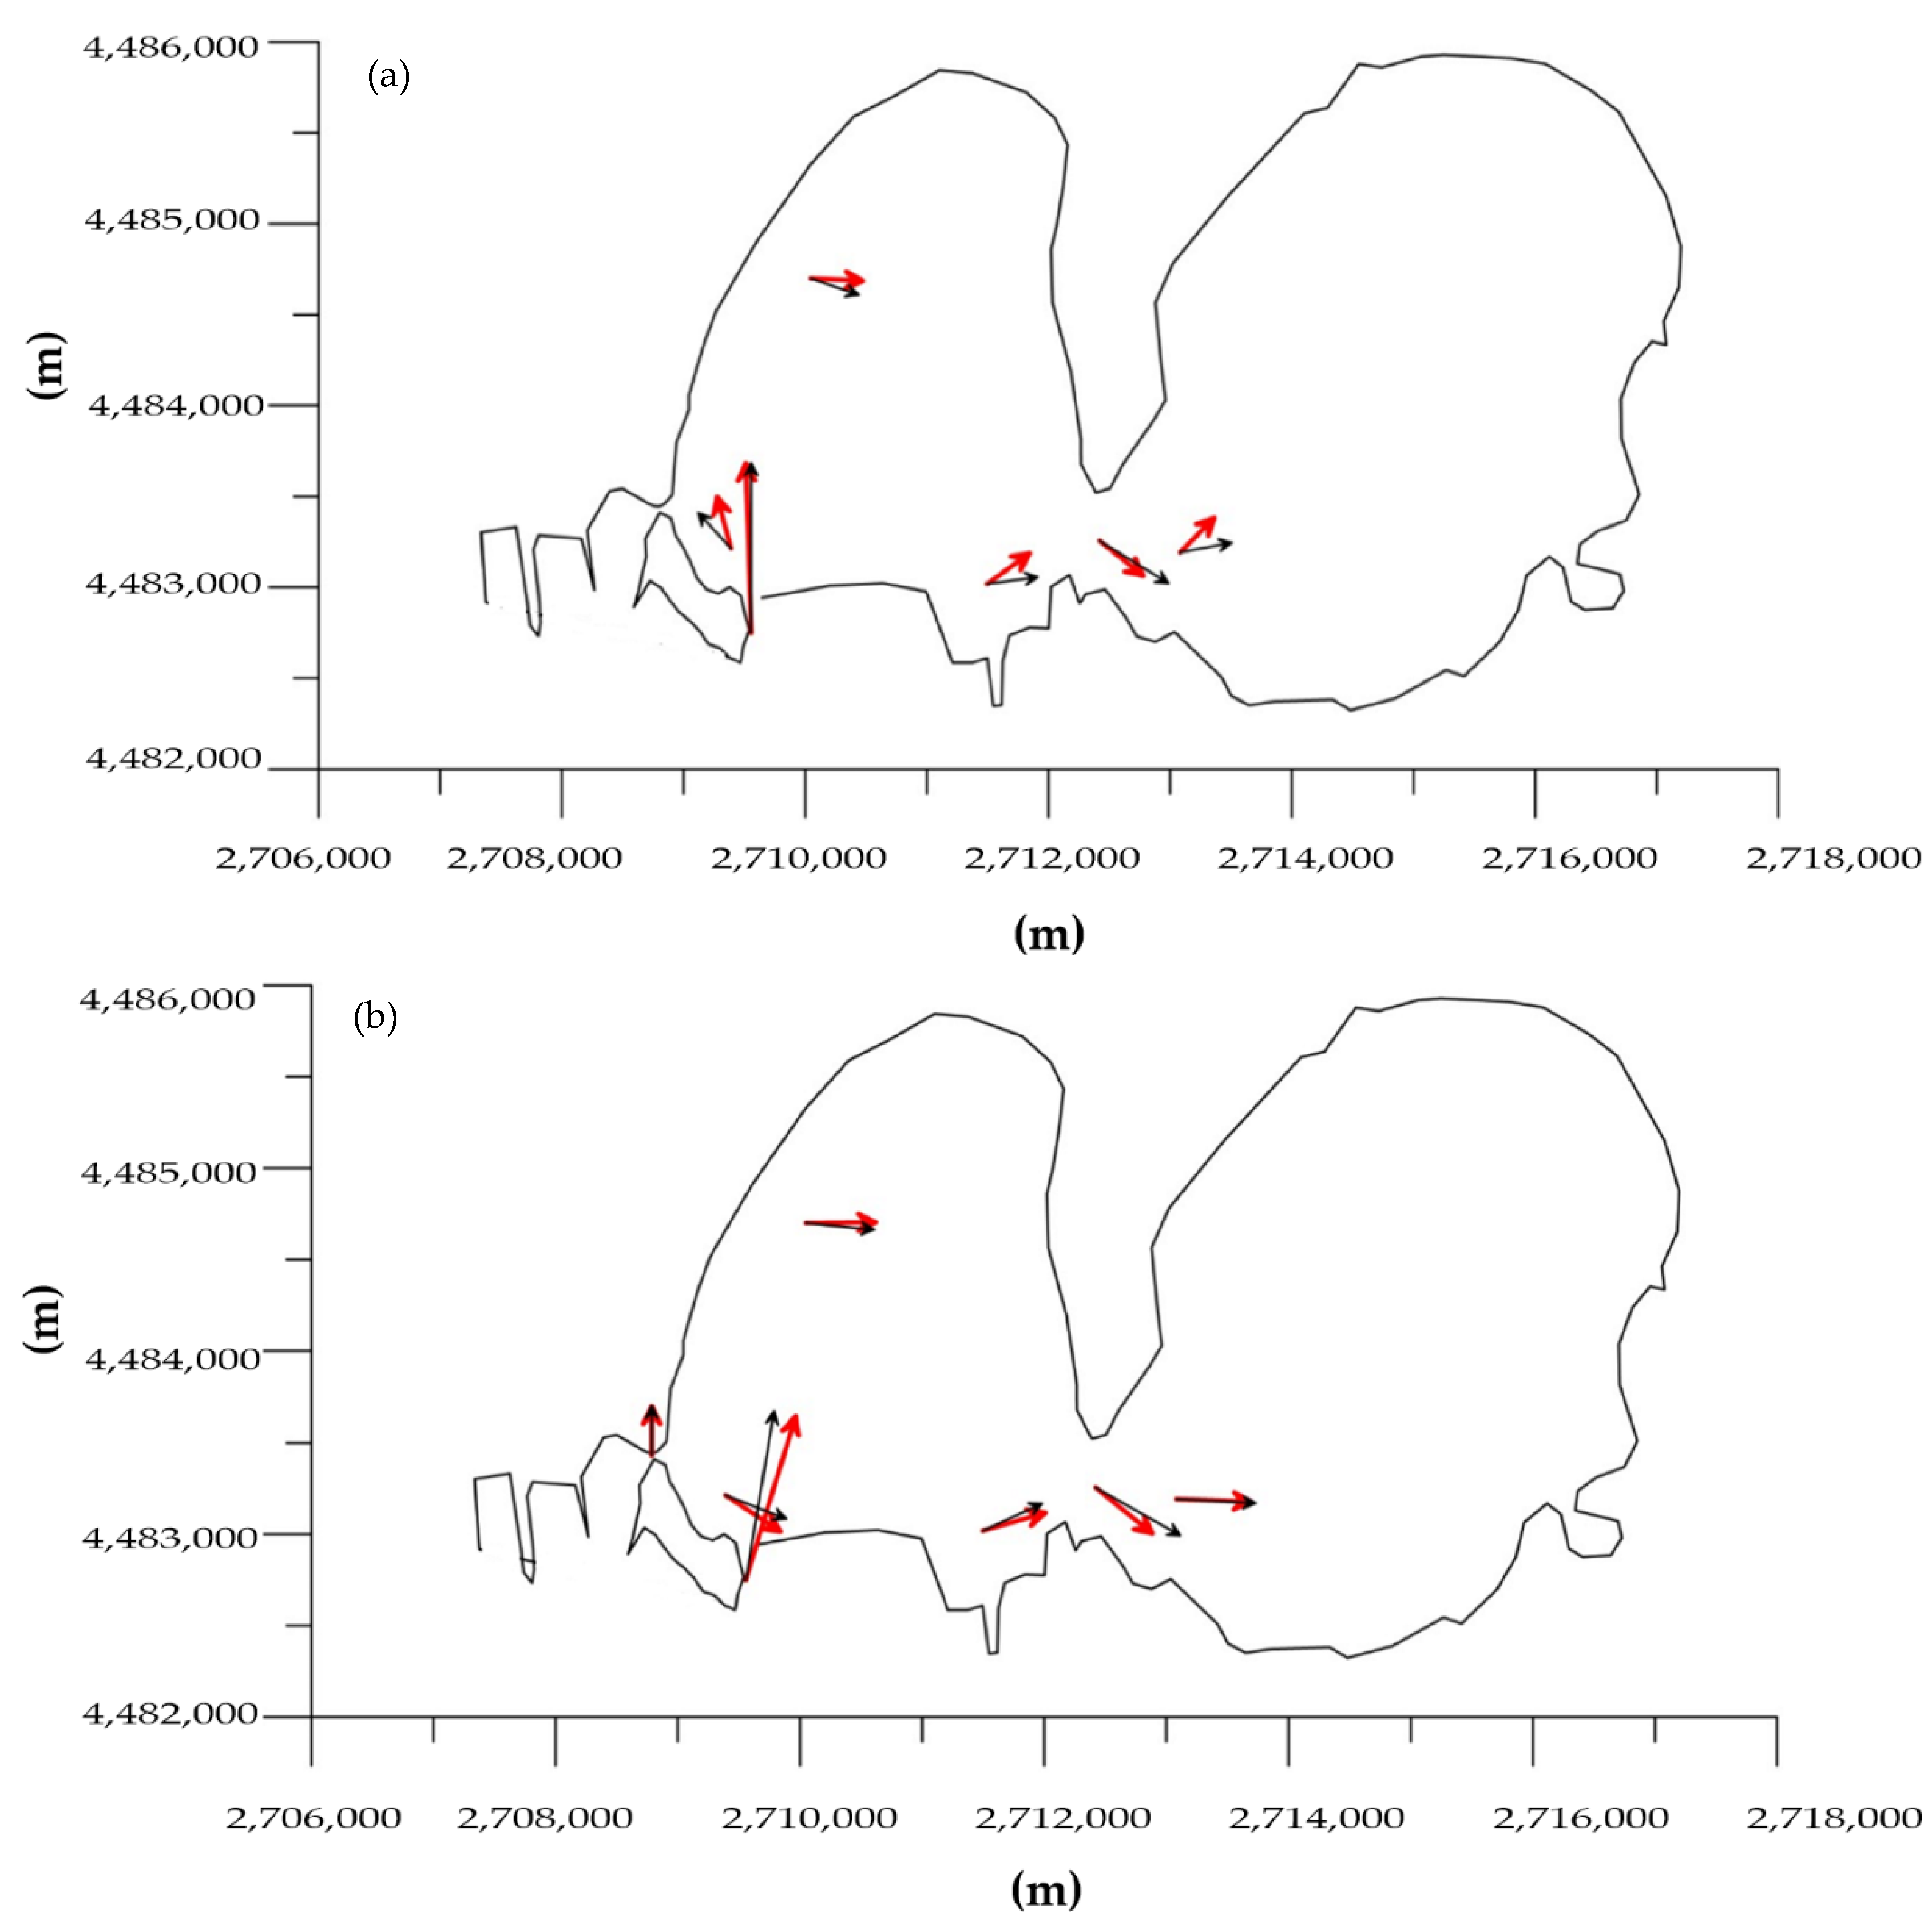
3.1. Modelling of Marine Currents and Calibration

The basic characteristics, numerical formulation and process equations of the model MIKE 3 FM are provided by DHI [29]. A finite mesh of 7235 triangular elements with ten vertical layers was used. The simulation was forced at the sea open boundary by the Temperature and Salinity vertical profiles and the u − v velocity vertical profiles extracted by the Mediterranean Sea physics reanalysis model [29]. The atmospheric data (u and v components of wind (m/s), atmosphere pressure (Pa), total cloud cover (%), solar radiation (J/m−2) and air temperature (°C)) were extracted by ERA5 developed through the Copernicus Climate Change Service (C3S). The precipitation data (mm/d) was extracted by CPC Merged Analysis of Precipitation (CMAP) [30].
A k-ε formulation for the vertical direction [31] and on the Smagorinsky formulation for the horizontal direction [32] were used.
Figure 5 shows the comparison between the computed motion field (grey vectors) and the measurements (red vectors). For the sake of brevity, only two selected depths are shown, i.e., −4 m and −7 m.

3.2. Mud Transport Modelling

The mud transport module (MT) coupled with the validated hydrodynamic model (HD) were used. It is able to reproduce the SSC spatial and temporal evolution during a hypothetical dredging activity in an area of 50 ha with a bed thickness equal to 50 cm (Figure 6). For more details on this module (MT), the reader can refer to [33,34].
The Mar Piccolo is mainly characterised by silty bottom sediments (particle diameter d < 0.004 mm) with medium consolidation; consequently, a critical shear stress τce = 0.2 N/m2 was derived for these sediments [28]. In the present work, we used a value of the coefficient of erodibility E equal to 1 × 10⁻⁴ kg/s/m2, following [28].
Therefore, two simulation runs, denoted as T1 and T2, were carried out with the aim of comparing the effects due to a conventional hydraulic dredge and an environmental mechanical dredge.
The dredging activity was modelled over a period of 12 days, starting on 2 July 2014 at 8:00 a.m. for two tests. The hydraulic and mechanical dredges work 8 h a day with a production capacity of dry mass Qs = 0.1388 m3/h.
Numerous researchers have developed approaches for estimating resuspension rates associated with the typical operation of hydraulic and mechanical dredges, showing a very large range of possible values.
The mean resuspension factor R provided by the USEPA [35] is equal to 2.5% for the hydraulic dredge cutter head (T1); for test T2, a conservative mean resuspension factor R was taken to be 1% based on studies by [36] for releases from an environmental bucket dredge.
Moreover, following the literature data [37], the imposed mass flow rate of suspended solids was 5.56 kg/s for the hydraulic dredge (T1) and 3.44 kg/s for the mechanical dredge (T2). Table 1 summarises the model simulations.

4. Results

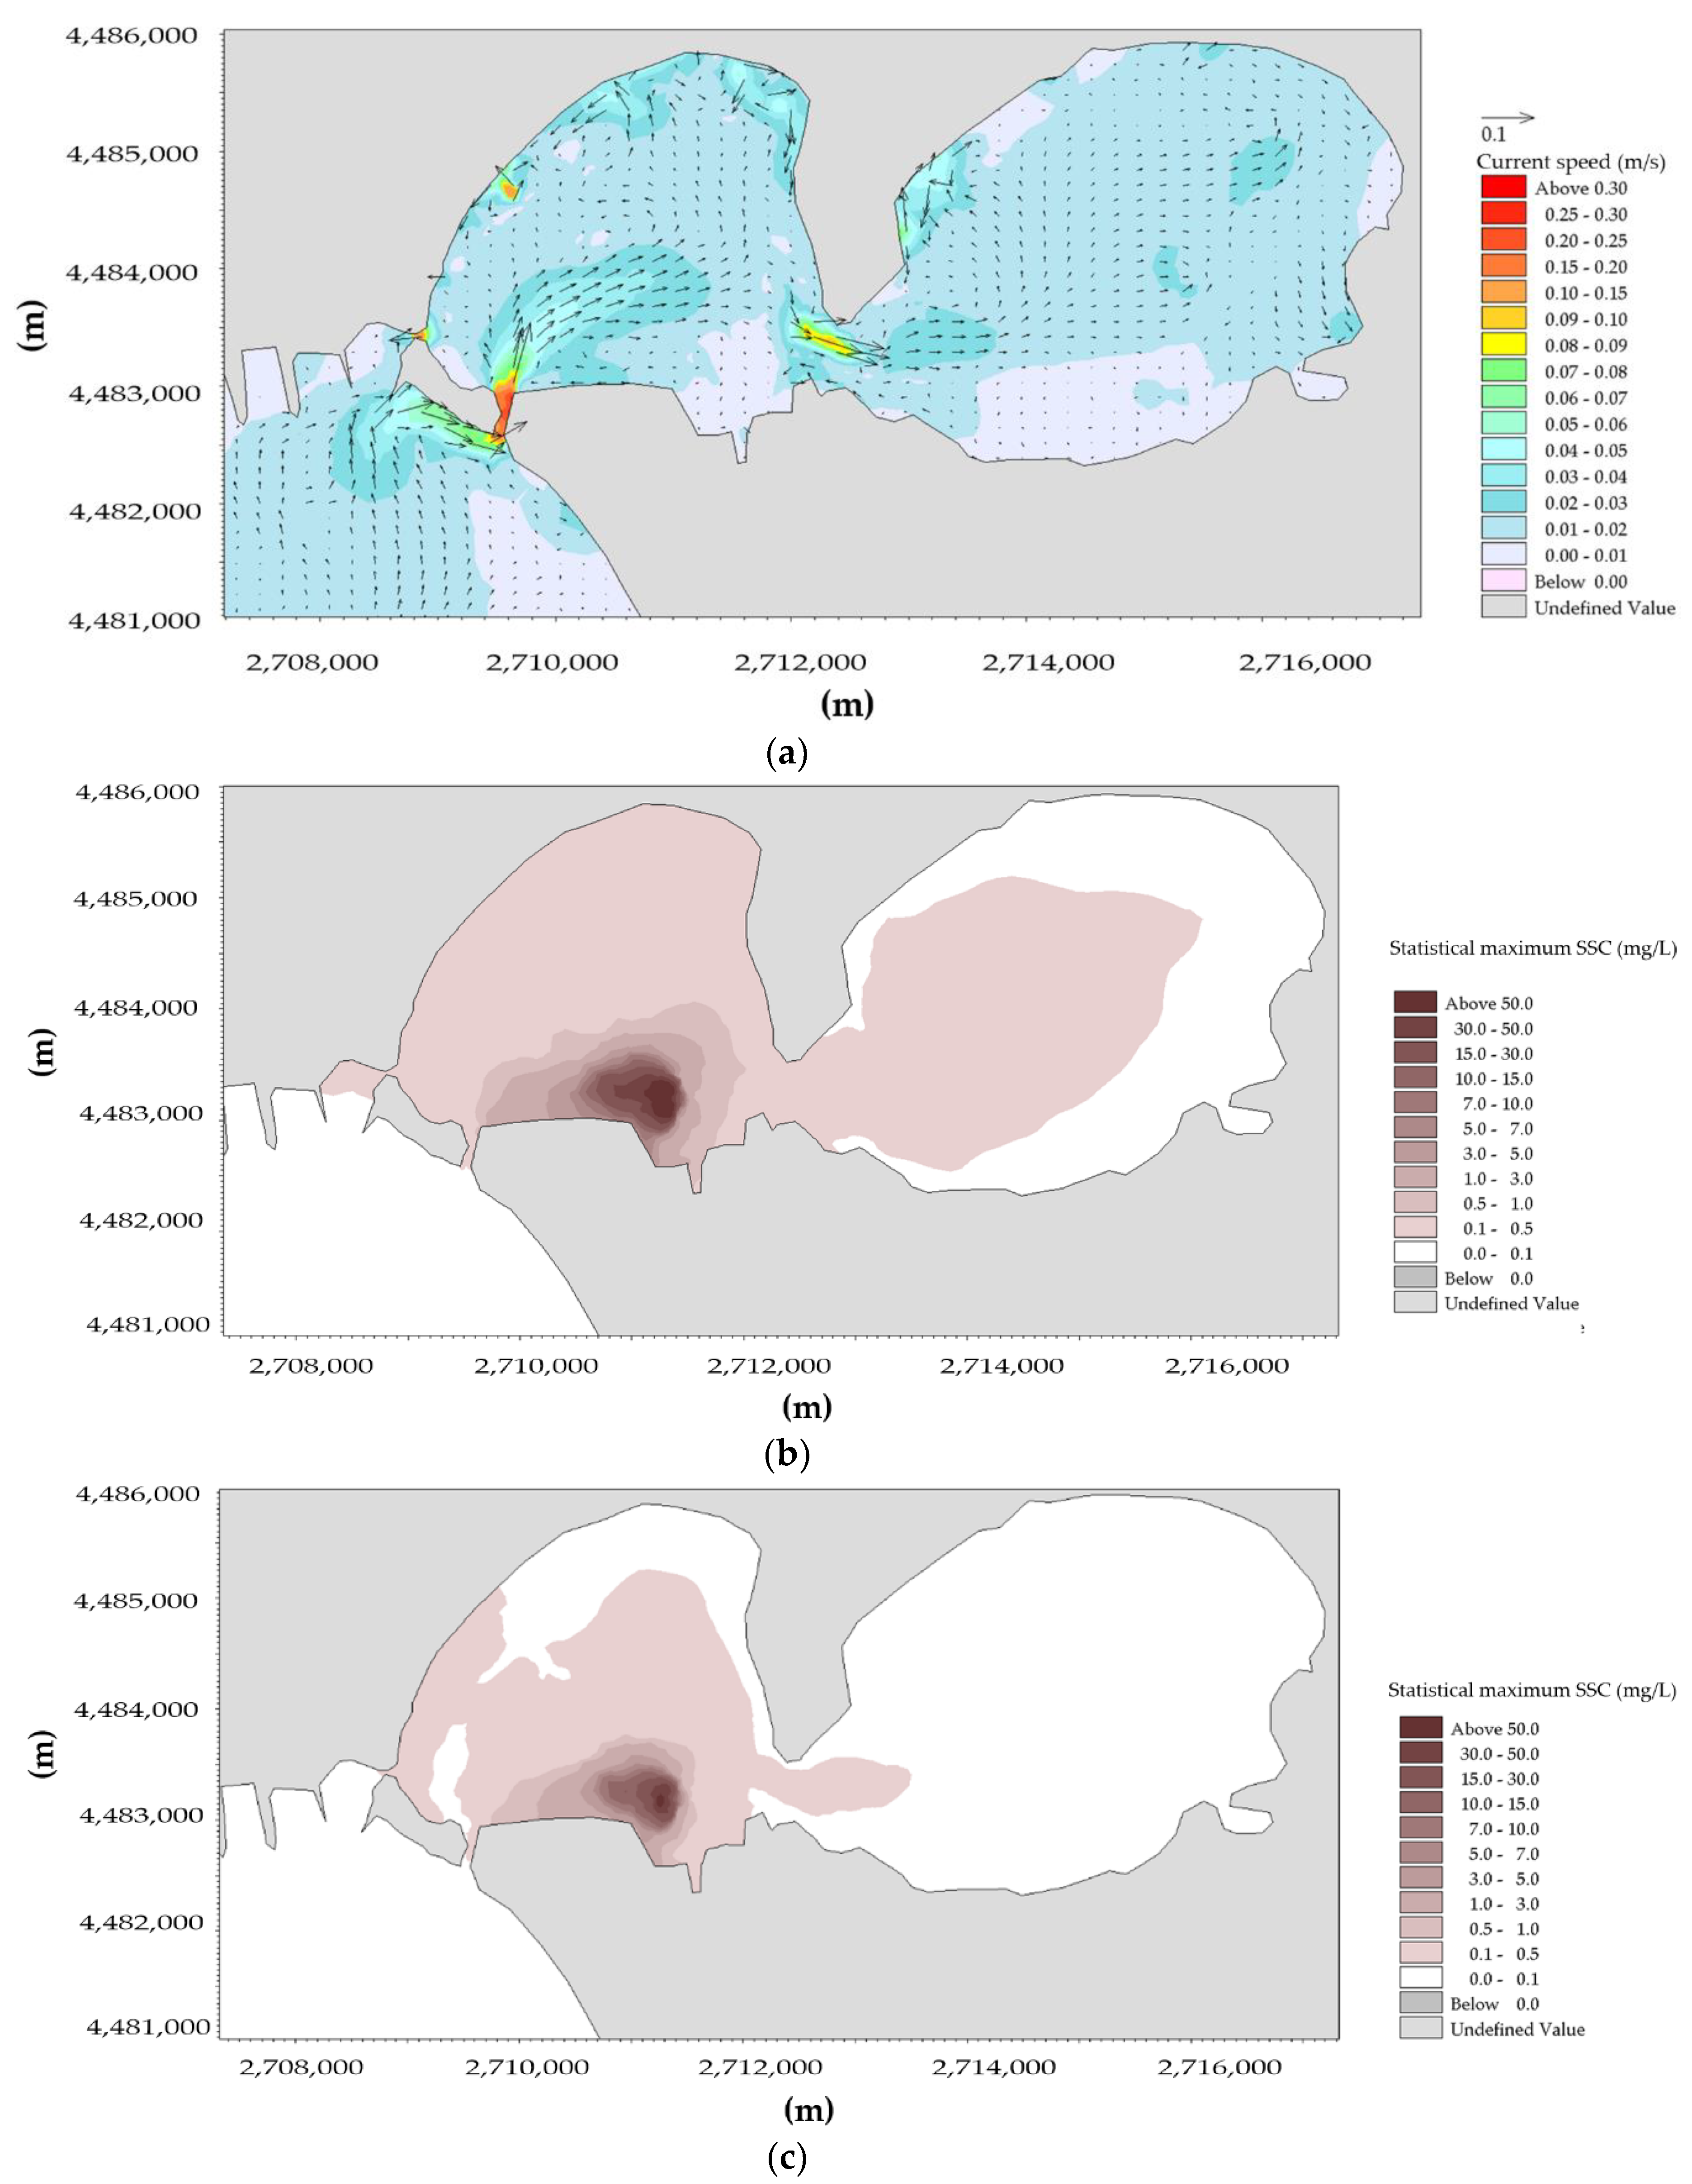
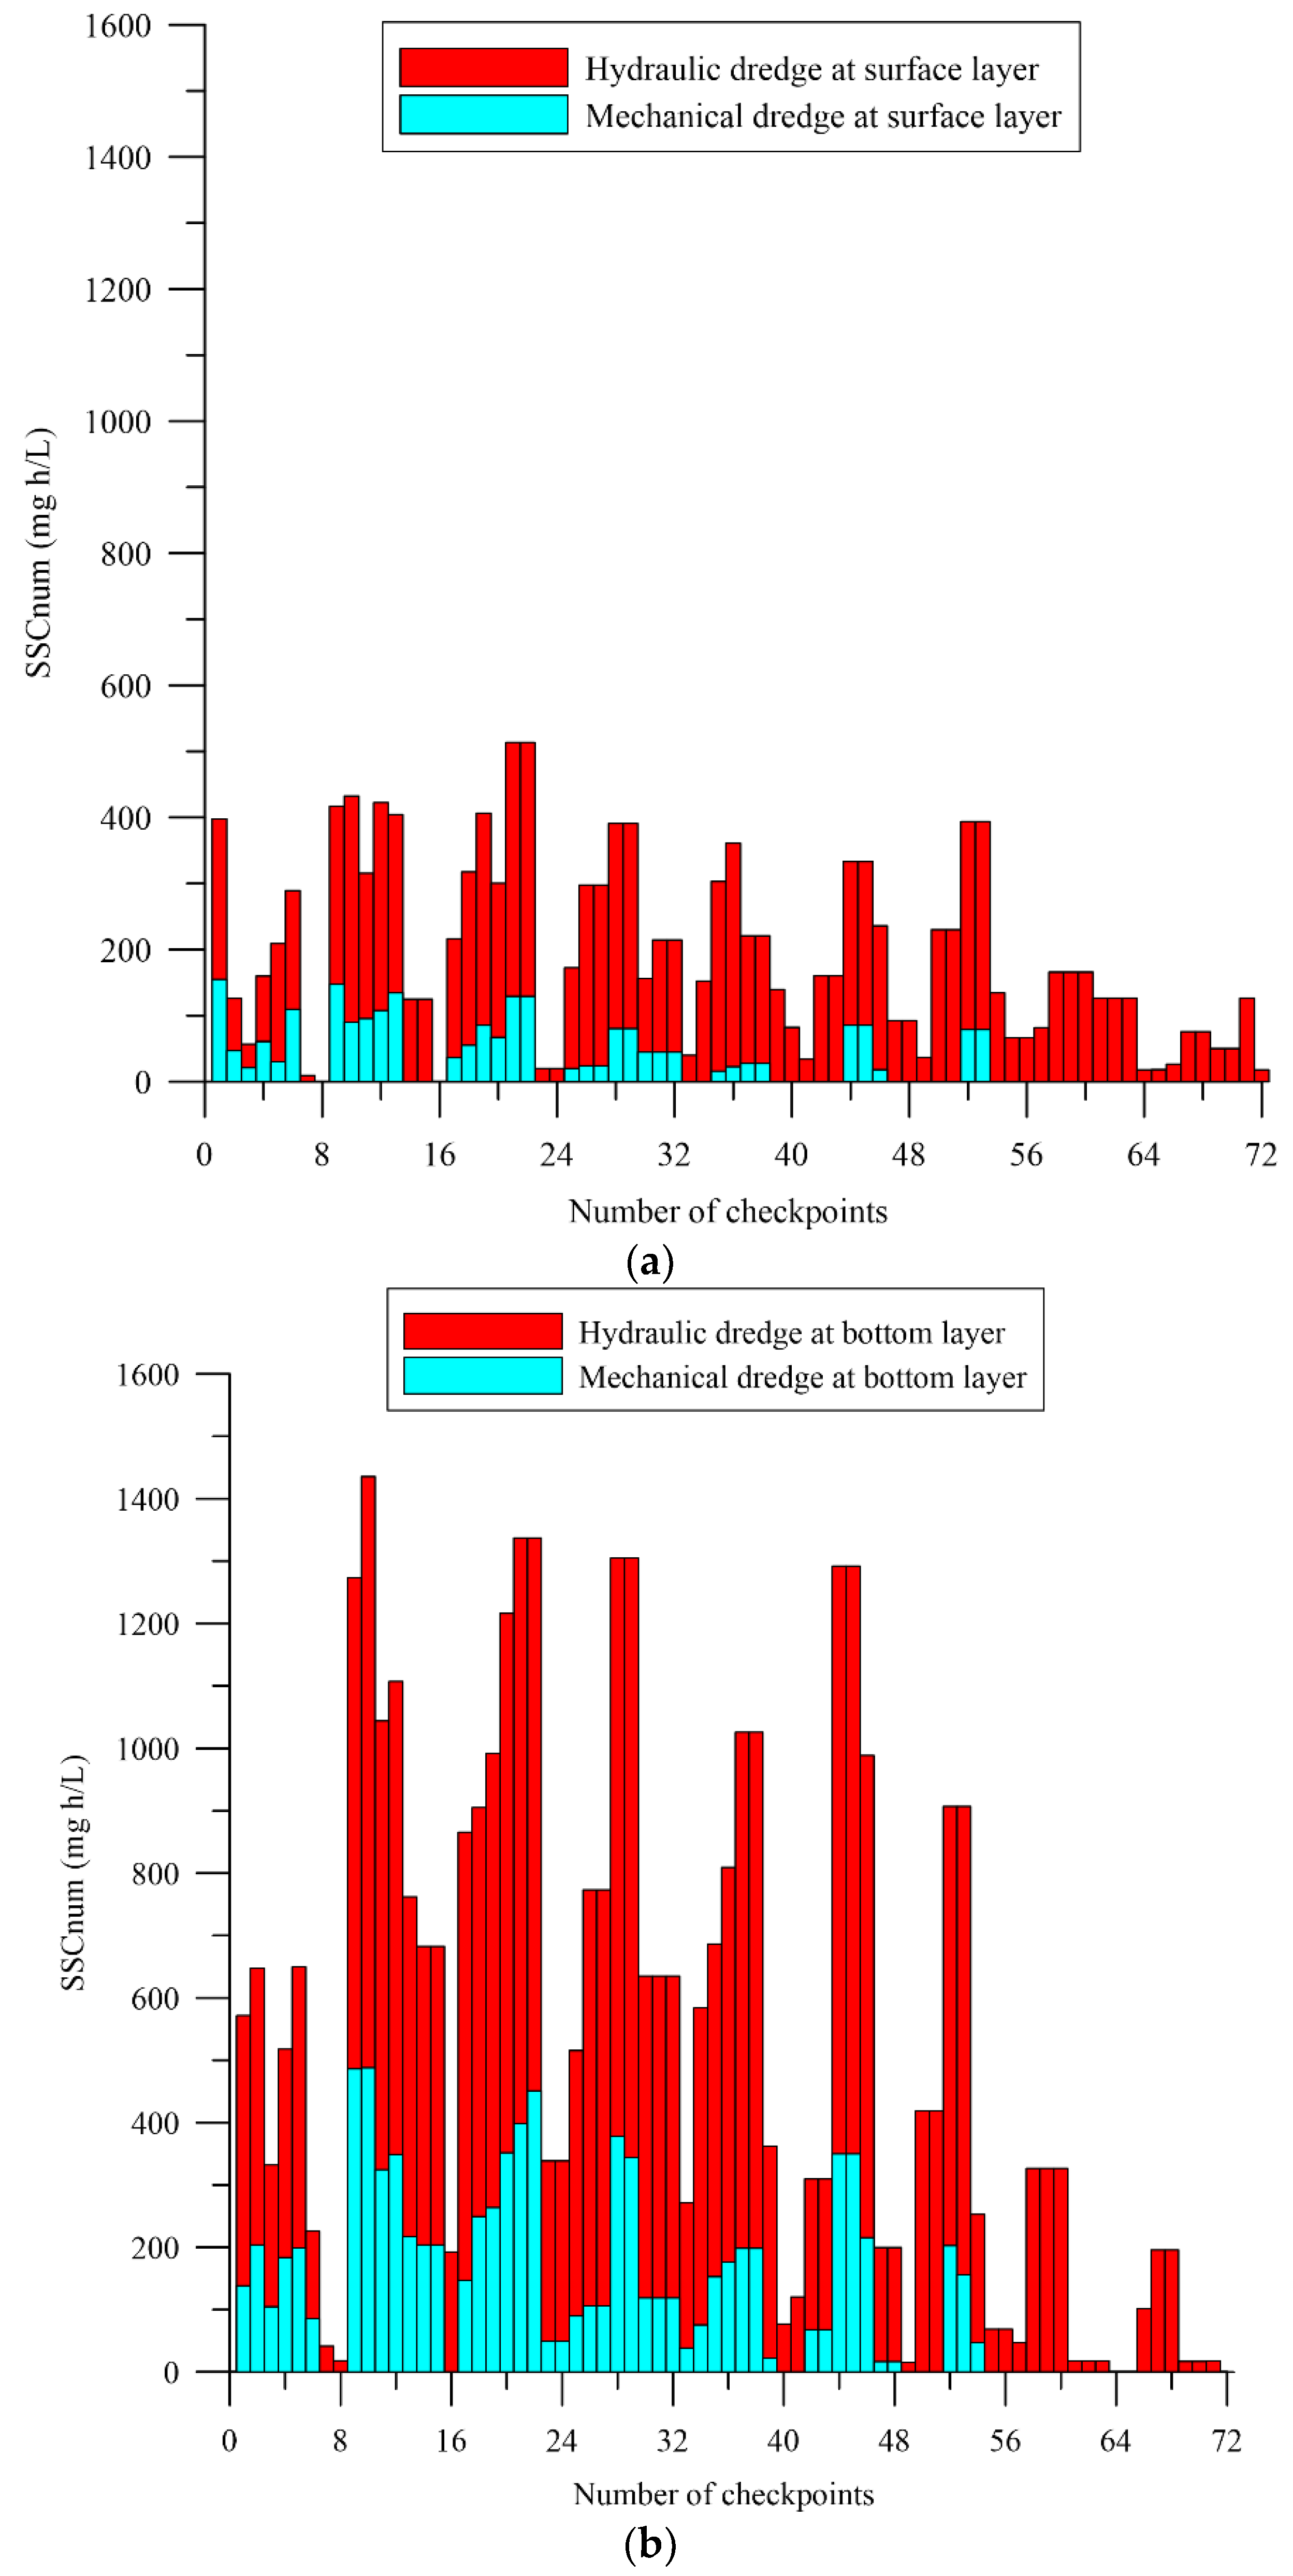
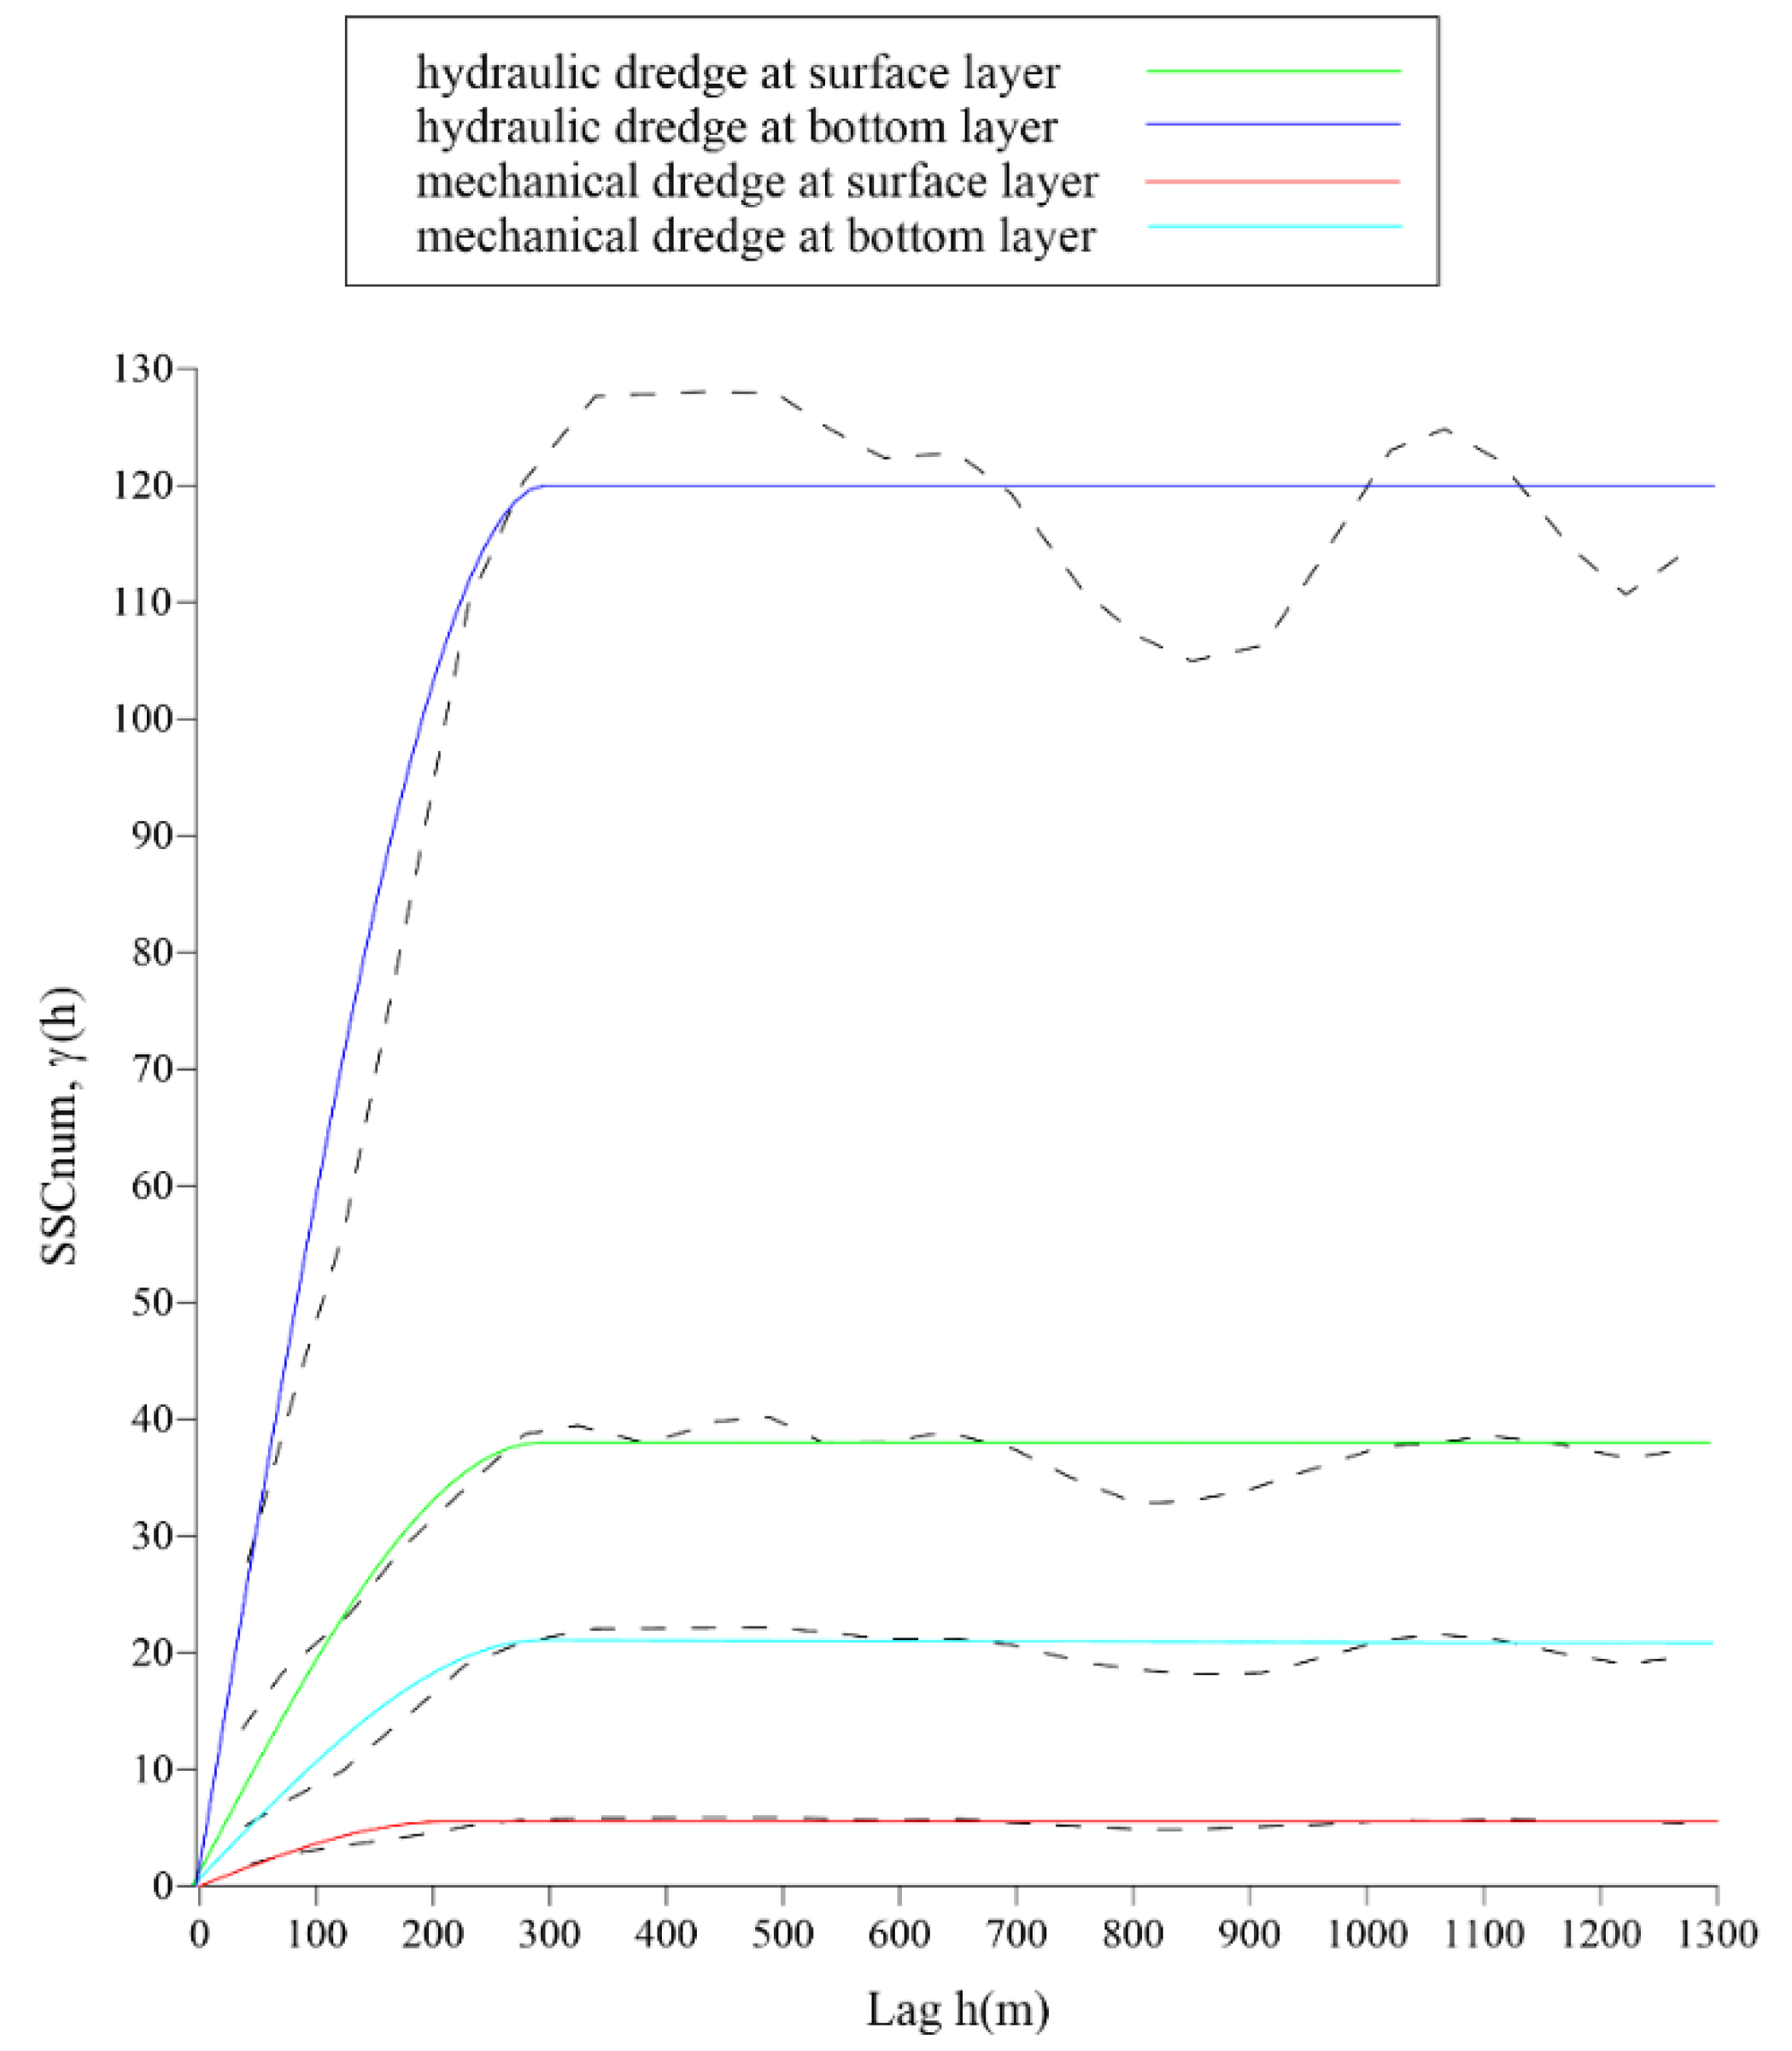
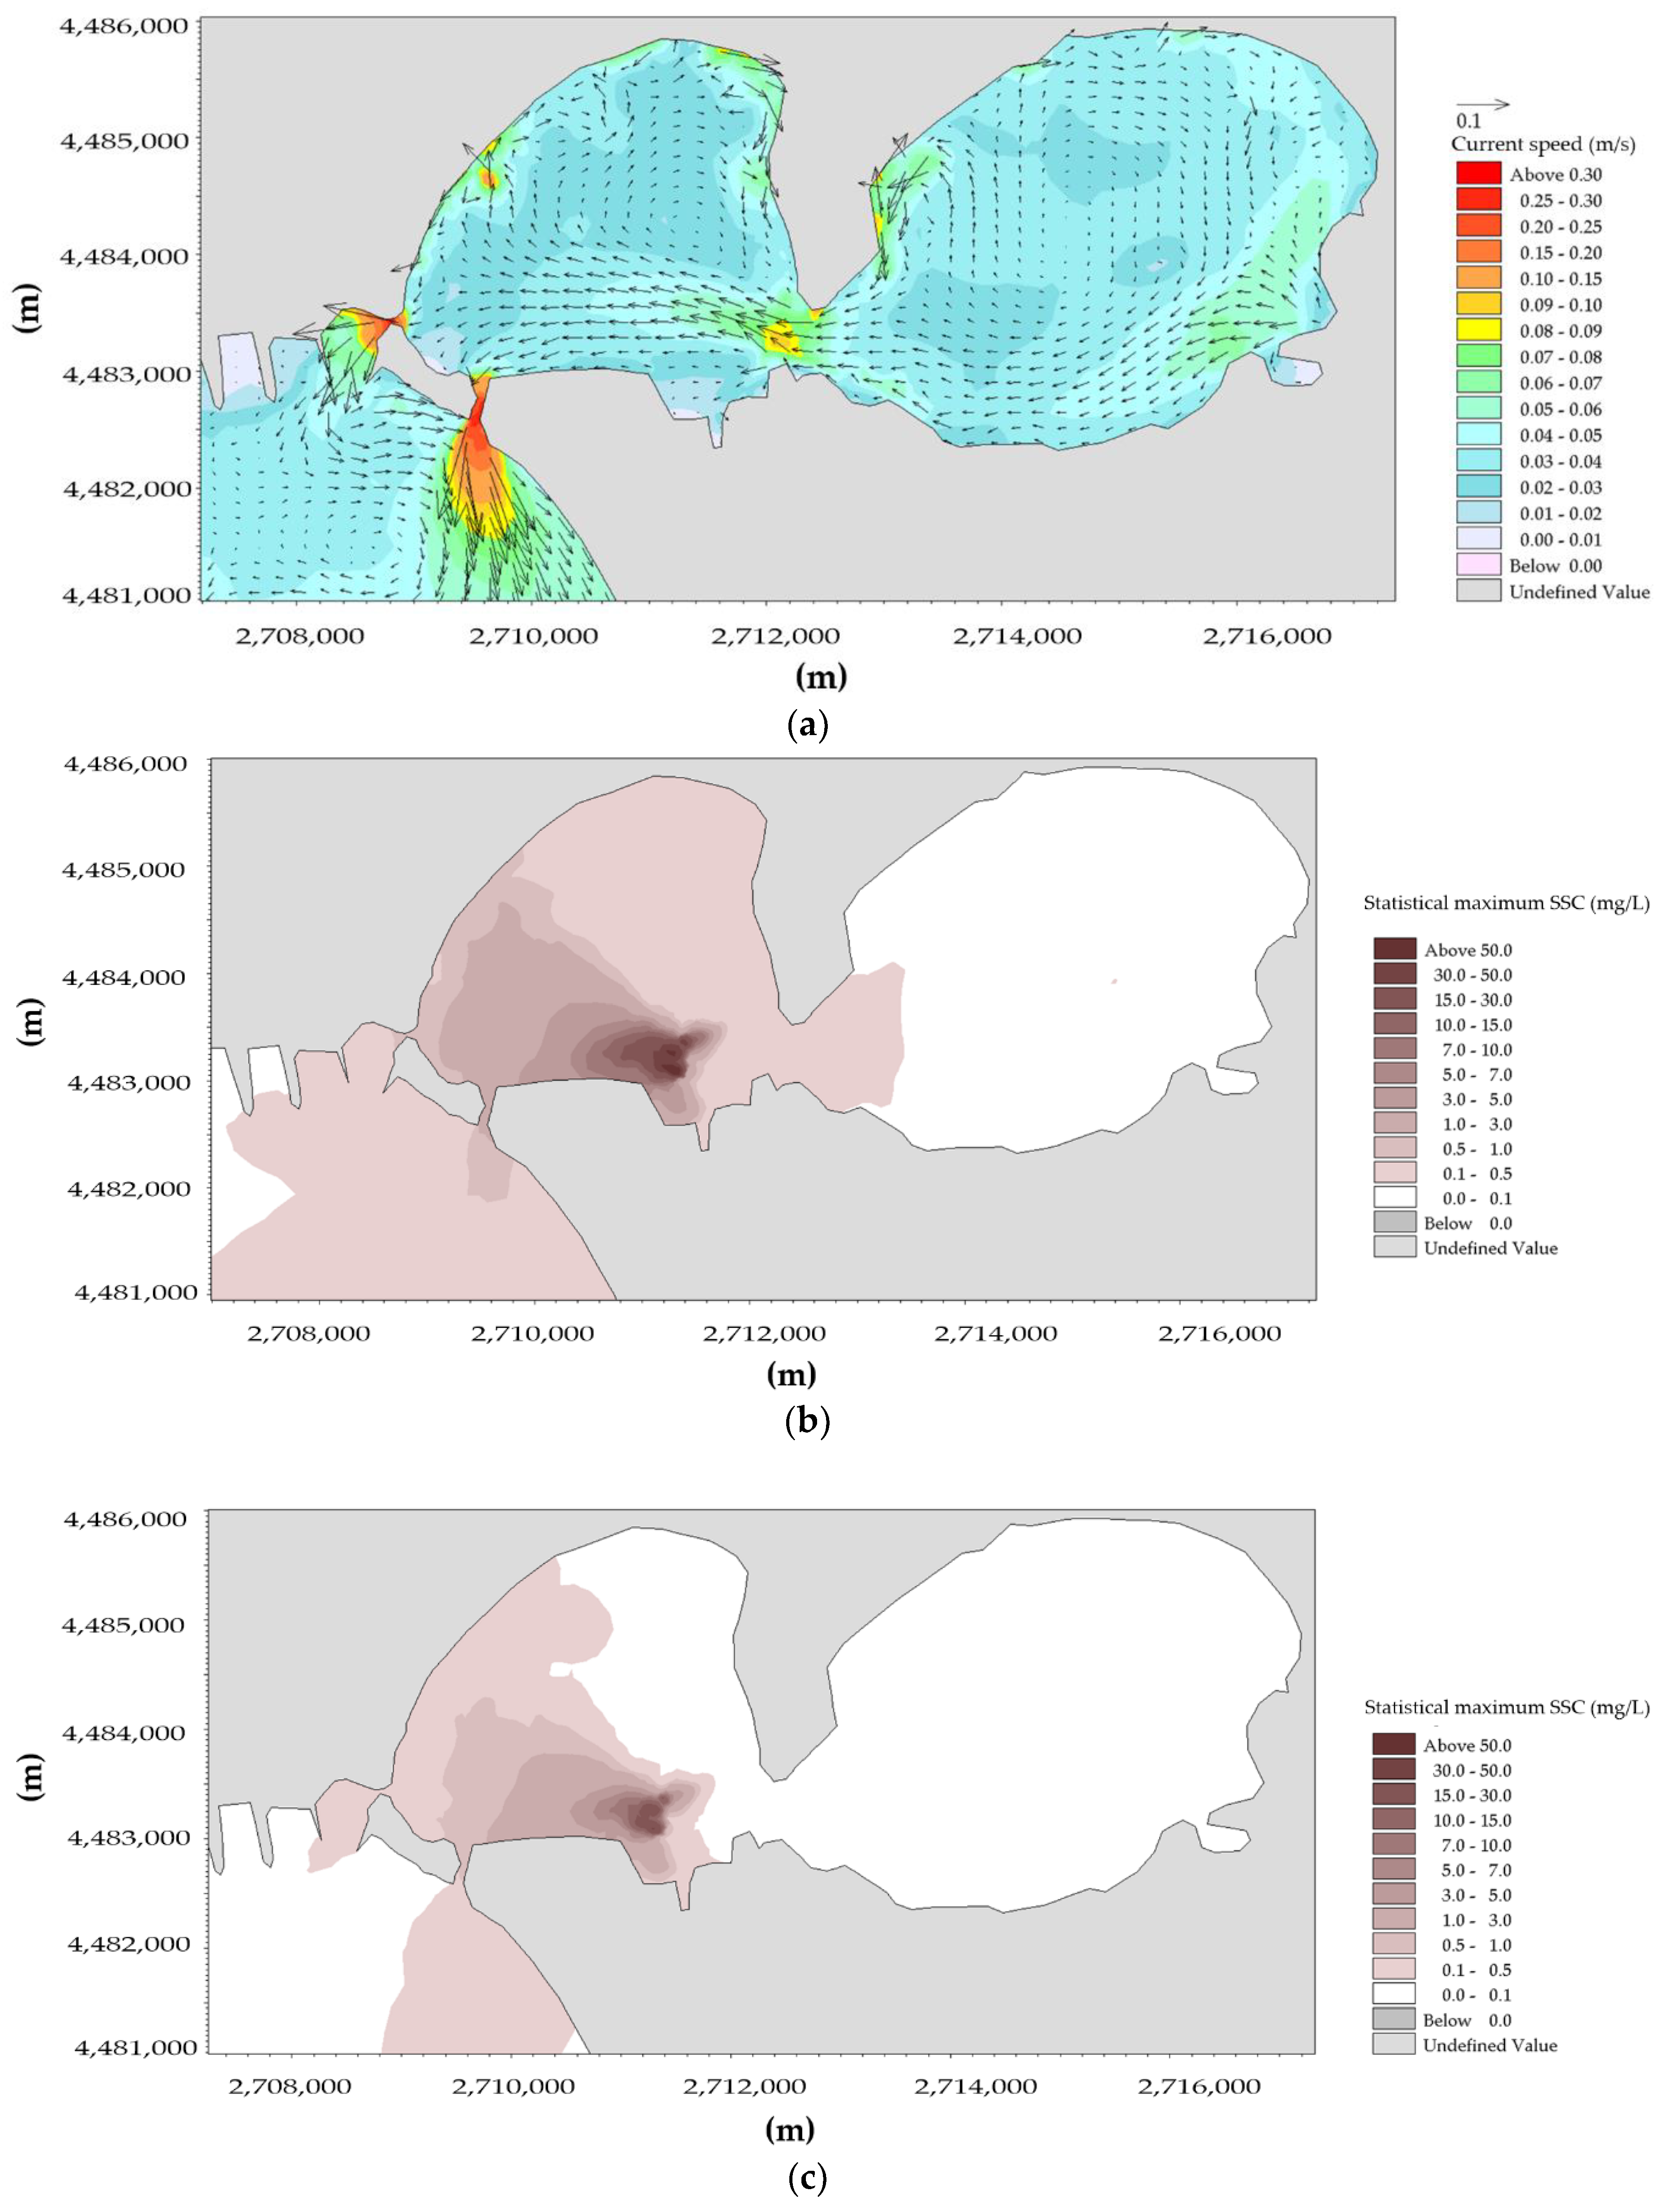
Sea Circulation and Sediment Plume Dynamics

During a dredging activity, it is necessary to calculate the spatial distribution of SSC and to characterise sensitive resources (receptors). Therefore, a statistical analysis of the simulated parameters SSC is carried out to numerically estimate their spatial (vertical and horizontal) variability in order to have an evaluation of the potential environmental effects on the coastal area. For both type of dredges, the SSCmax distribution was studied for two different layers during the dredging activity.
Figure 7 and Figure 8 represent the maps of SSCmax elaborated for the surface and bottom layers, respectively. The typical patterns, already observed by [38,39], are still evident, with a prevailing mean surface current outflowing from the basin during the dredging activity (Figure 7a). The dredged plume is transported from the dredged area towards the navigable channel, directed towards the Mar Grande (Figure 7b,c). Focusing on the bottom, the average current during the dredging activity inflows towards the Mar Piccolo Basin, as shown in Figure 8a. Generally, the reproduced velocity values are in the range 0.02–0.1 m/s, with some peaks (0.3 m/s) along the navigable channel of the Mar Piccolo. The simulation output confirms the double-flux along the navigable channel and, further, proves the hydrodynamic mechanism of the water–mass exchange between the Mar Grande and the Mar Piccolo.
Consequently, the Mar Piccolo Basin is seriously exposed to the plume pollution load. In fact, the plume is confined in Mar Piccolo Basin and reaches also Inlet II (Figure 8b,c).
Moreover, in the case of the hydraulic dredge, a higher intensity of the SSCmax in the immediate vicinity of the dredging point is shown at the surface and bottom layers (Figure 7a and Figure 8a).

5. Discussion

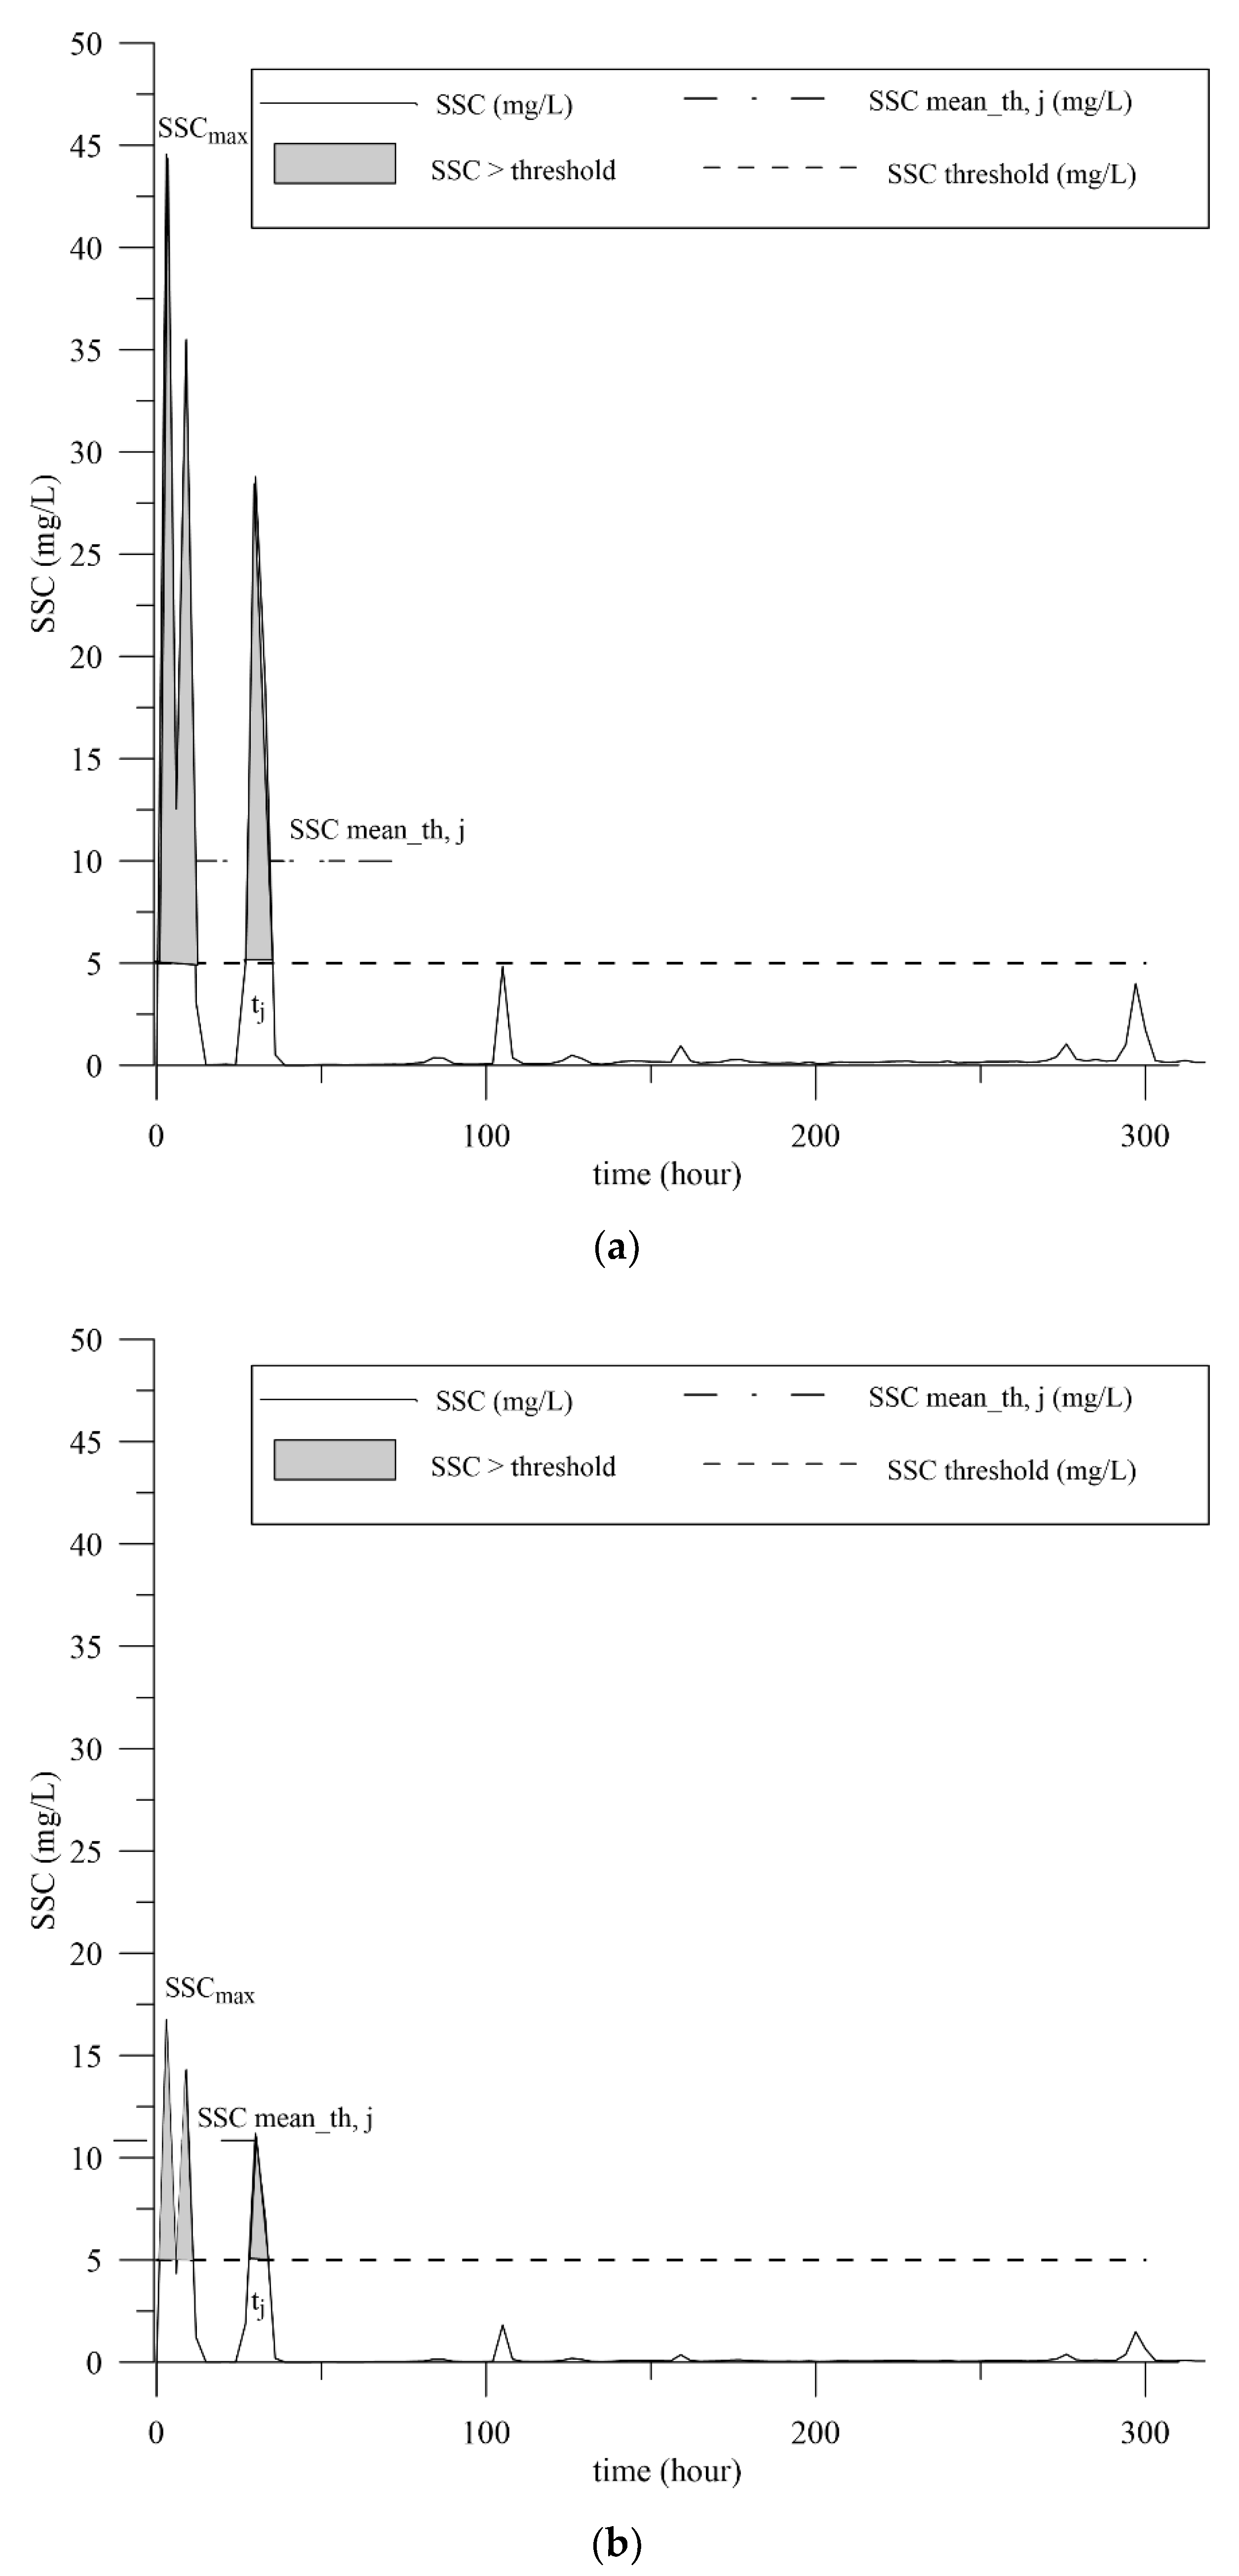
Detecting Sensitive Areas around the Dredging Site

During the monitoring of a dredging activity, quantitative impact thresholds for the suspended solid concentration (SSC) must be established. In this study, a threshold of SSC was arbitrarily considered equal to 5 mg/L [40], and a regular grid of checkpoints (Figure 9) in the zone with a high impact was considered [41].
For all checkpoints, starting from the SSC time series, the mean and maximum values (SSCmean and SSCmax) were calculated (Figure 9).
According to Equation (1) by Feola et al. [40], the SSCnum—SSC number (mg s/L) was evaluated as the sum of the products of intensity and duration of the single events.
For the sake of brevity, only the checkpoint A, highlighted with a black circle in Figure 9b, is shown (Figure 10 and Figure 11). Figure 12a,b shows the distribution of SSCnum for hydraulic and mechanical dredging plumes at the surface and bottom layers for all checkpoints (Figure 9).
Maps of the SSCnum distribution are shown for the hydraulic and mechanical dredgings at the surface and bottom layers (Figure 13 and Figure 14).
Figure 13a and Figure 14a highlight a greater “affected” area in terms of the SSCnum variation at the surface and bottom layers, and therefore, the hydraulic dredging produces the worst conditions.
In order to study the effects of the plume dynamic as a function of distance from the dredging zone, the variogram function γ(h) [42] was derived (Figure 9).
If the variogram reaches a limit value (sill), it means that there is a distance (range) beyond which the variable does not have spatial dependence (Figure 15).
The variograms of the SSCnum presented in Figure 16 were obtained, for both hydraulic and mechanical dredges, at the surface and bottom layers.
By analysing Figure 16, the experimental variogram starts out straight, then bends over sharply and levels out; therefore, the spherical model matches in a better way the shape of the empirical variogram γ(h).
Considering the relative differences for contiguous values lower than 5 × 10⁻¹, the spatial extent of the bottom layer SSCnum correlation can be identified around 1300 m and 700 m for hydraulic and mechanical dredges, respectively (Table 2).
Using the same criterion, the spatial extent of the surface layer SSCnum correlation can be identified around 850 m and 380 m for hydraulic and mechanical dredges, respectively (Table 2).
Coherently with the maps of the SSCnum distribution (Figure 13a,b), this result highlighted that the most dangerous conditions are observed for hydraulic dredge at the bottom layer.
Choosing a SSCnum meaningful threshold equal to 100 mg/L × h, circles that can be considered as the limit between “not affected” and “affected” areas are introduced in Figure 13a and Figure 14b.
The diameters of the circles are about 1300 m and about 700 m at the bottom layer and about 850 m and about 380 m at the surface layer for hydraulic and mechanical dredges, corresponding to the range shown by the variograms analysis.

6. Conclusions

The numerical model MIKE 3D FM MT was implemented to evaluate the response of the Mar Piccolo Basin to a hypothetical dredging activity during the spring season. To reproduce the sea circulation structure in the target area, a calibrated MIKE 3D FM model was used.
Environmental improvements to dredging techniques have become increasingly important over the last 25 years. Therefore, two simulation runs, denoted as T1 and T2, were carried out with the aim of comparing the effects due to two different dredges (i.e., hydraulic dredge cutter head and environmental mechanical bucket dredge).
A statistical analysis of the simulated parameter SSC was carried out to numerically estimate its spatial (vertical and horizontal) variability, thereby allowing an evaluation of the potential environmental effects on the coastal area.
For both types of dredges, the SSCmax variability distribution was evaluated at the surface and bottom.
In the case of a hydraulic dredge, a higher intensity of SSCmax in the immediate vicinity of the dredging point is shown at the surface and bottom layers. For both tests, T1 and T2, at the surface level, the dredged plume is transported from the dredged area towards the navigable channel of the Mar Piccolo, directed towards the Mar Grande Sea. Confined at the bottom the plume is the Mar Piccolo Basin, reaching also Inlet II.
Although, for careful management during a dredging activity, site-specific evaluations must be carried out, in this case study, a preliminary SSC threshold and an integrated index, SSCnum, were proposed.
Moreover, to study the effects of the plume dynamics due to two different dredges as a function of distance from the dredging zone, a geostatistical analysis of function SSCnum was carried out.
In this way, the variogram upper-bound value (sill) was used to estimate the severity of the effects. Table 2 shows that the most dangerous conditions are shown for hydraulic dredge at the bottom layer. It is evident that the correct prediction of contaminant transport depends on the reliability of the input data, as well as on the calibration made.

Author Contributions

M.M. devised and funded the research, M.M. conceived and coordinated the monitoring activities and D.D.P. performed the numerical modelling and analysed the results. D.D.P., M.B.M., F.D.S. and M.M. discussed and revised the paper. All authors have read and agreed to the published version of the manuscript.

Funding

This research received no external funding.

Acknowledgments

The monitoring stations were set up in the framework of the RITMARE Project and with funds from PON R&C 2007–2013.

Conflicts of Interest

The authors declare that there is no conflict of interest regarding the publication of this article.

References

  1. Demars, K.R.; Richardson, G.N.; Raymond, N.Y.; Ronald, C. Remediation, and Containment of Contaminated Sediments; ASTM International: West Conshohocken, PA, USA, 1995. [Google Scholar]
  2. John, S.A. Scoping the Assessment of Sediment Plumes from Dredging; CIRIA: London, UK, 2000. [Google Scholar]
  3. Palermo, M.R.; Averett, D.E. Environmental dredging—A state of the art review. In Proceedings of the 2nd International Symposium on Contaminated Sediments: Characterization, Evaluation, Mitigation/Restoration, Management Strategy Performance, Quebec City, QC, Canada, 26–28 May 2003; pp. 12–17. [Google Scholar]
  4. US Army Corps of Engineers (USACE). A Review of Environmentally Improved Techniques for Dredging Contaminated Mud; TECHNICAL NOTE TN 3/2003; Fill Management Division GEO: Hong Kong, China, 2003; p. 29.
  5. Eisma, D. Dredging in Coastal Water; Taylor & Francis Publishing: London, UK, 2006; p. 244. ISBN 978-0-415-39111-5. [Google Scholar]
  6. Bridges, T.S.; Gustavson, K.E.; Schroeder, P.; Ells, S.J.; Hayes, D.; Nadeau, S.C.; Palermo, M.R.; Patmont, C. Dredging processes and remedy effectiveness: Relationship to the 4 Rs of environmental dredging. Integr. Environ. Assess. Manag. 2010, 6, 619–630. [Google Scholar] [CrossRef] [PubMed]
  7. Chimienti, G.; De Padova, D.; Mossa, M.; Mastrototaro, F. A mesophotic black coral forest in the Adriatic Sea. Sci. Rep. 2020, 10, 8504. [Google Scholar] [CrossRef] [PubMed]
  8. De Carolis, G.; Adamo, M.; Pasquariello, G.; De Padova, D.; Mossa, M. Quantitative characterization of marine oil slick by satellite near-infrared imagery and oil drift modelling: The Fun Shai Hai case study. Int. J. Remote Sens. 2013, 34, 1838–1854. [Google Scholar] [CrossRef]
  9. De Padova, D.; Mossa, M.; Adamo, M.; De Carolis, G.; Pasquariello, G. Synergistic use of an oil drift model and remote sensing observations for oil spill monitoring. Environ. Sci. Pollut. Res. 2017, 24, 5530–5543. [Google Scholar] [CrossRef]
  10. Armenio, E.; Ben Meftah, M.; De Padova, D.; De Serio, F.; Mossa, M. Monitoring System in Mar Grande Basin (Ionian Sea). In Proceedings of the IEEE International Workshop on Metrology for the Sea, Learning to Measure Sea Health Parameters (Metrosea), Bari, Italy, 8–10 October 2019; pp. 104–109. [Google Scholar] [CrossRef]
  11. Armenio, E.; Ben Meftah, M.; De Padova, D.; De Serio, F.; Mossa, M. Monitoring Systems and Numerical Models to Study Coastal Sites. Sensors 2019, 19, 1552. [Google Scholar] [CrossRef] [Green Version]
  12. Great Barrier Reef Marine Park Authority (GBRMPA). Guidelines: The Use of Hydrodynamic Numerical Modelling for Dredging Projects in the Great Barrier Reef Marine Park; Great Barrier Reef Marine Park Authority (GBRMPA): Townsville, Australia, 2012; p. 8. Available online: http://hdl.handle.net/11017/970 (accessed on 10 October 2020).
  13. Lisco, S.; Corselli, C.; De Giosa, F.; Mastronuzzi, G.; Moretti, M.; Siniscalchi, A.; Marchese, F.; Bracchi, V.; Tessarolo, C.; Tursi, A. Geology of Mar Piccolo, Taranto (southern Italy): The physical basis for remediation of a polluted marine area. J. Maps 2016, 12, 173–180. [Google Scholar] [CrossRef] [Green Version]
  14. Sollecito, F.; Cotecchia, F.; Mali, M.; Miccoli, D.; Vitone, C. Geo-chemo-mechanical characterization of a polluted marine basin. E3S Web Conf. 2019, 92, 18001. [Google Scholar] [CrossRef]
  15. De Serio, F.; Armenio, E.; Ben Meftah, M.; Capasso, G.; Corbelli, V.; De Padova, D.; De Pascalis, F.; Di Bernardino, A.; Leuzzi, G.; Monti, P.; et al. Detecting sensitive areas in confined shallow basins. Environ. Model. Softw. 2020, 126, 104659. [Google Scholar] [CrossRef]
  16. Labianca, C.; De Gisi, S.; Todaro, F.; Notarnicola, M. DPSIR model applied to the remediation of contaminated sites. A case study: Mar Piccolo of Taranto. Appl. Sci. 2020, 10, 5080. [Google Scholar] [CrossRef]
  17. Cardellicchio, N.; Annicchiarico, C.; Di Leo, A.; Giandomenicom, S.; Spada, L. The Mar Piccolo of Taranto: An interesting marine ecosystem for the environmental problems studies. Environ. Sci. Pollut. Res. 2016, 23, 12495–12501. [Google Scholar] [CrossRef]
  18. Vatova, A. Osservazioni fisico chimiche periodiche nel Mar Grande e Mar Piccolo di Taranto (1962–1969). Boll. Pesca Piscic. Idrobiol. 1972, XXVII, 43–79. [Google Scholar]
  19. Cerruti, A. Le sorgenti sottomarine (Citri) del Mar Grande e nel Mar Piccolo di Taranto; Annali Istituto Superiore Navale: Napoli, Italy, 1948; Volume 7, pp. 171–196. [Google Scholar]
  20. Strusi, A.; Pastore, M. Osservazioni idrografiche del Mar Grande e nel Mar Piccolo di Taranto. Campagna 1970–71. Oebalia 1975, 17, 1–64. [Google Scholar]
  21. De Serio, F.; Mossa, M. Environmental monitoring in the Mar Grande basin (Ionian Sea, Southern Italy). J. Environ. Sci. Pollut. Res. 2016, 23, 12662–12674. [Google Scholar] [CrossRef] [PubMed]
  22. De Serio, F.; Mossa, M. Assessment of hydrodynamics, biochemical parameters and eddy diffusivity in a semi-enclosed Ionian basin. Deep Sea Res. Part II Top. Stud. Oceanogr. 2016, 133, 176–185. [Google Scholar] [CrossRef]
  23. Armenio, E.; Ben Meftah, M.; Bruno, M.F.; De Padova, D.; De Pascalis, F.; De Serio, F.; Di Bernardino, A.; Mossa, M.; Leuzzi, G.; Monti, P. Semi enclosed basin monitoring and analysis of meteo, wave, tide and current data. In Proceedings of the IEEE Conference on Environmental, Energy and Structural Monitoring Systems, Bari, Italy, 13–14 June 2016. [Google Scholar] [CrossRef]
  24. Armenio, E.; De Serio, F.; Mossa, M. Analysis of data characterizing tide and current fluxes in coastal basins. Hydrol. Earth Syst. Sci. 2017, 21, 3441–3454. [Google Scholar] [CrossRef] [Green Version]
  25. Armenio, E.; De Serio, F.; Mossa, M.; De Padova, D. Monitoring system for the sea: Analysis of meteo, wave and current data. In Proceedings of the IMEKO TC19 Workshop on Metrology for the Sea, MetroSea: Learning to Measure Sea Health Parameters, Naples, Italy, 11–13 October 2017; pp. 143–148, ISBN 978-151085211-2. [Google Scholar]
  26. De Padova, D.; De Serio, F.; Mossa, M.; Armenio, E. Investigation of the current circulation offshore Taranto by using field measurements and numerical model. In Proceedings of the 2017 IEEE International Instrumentation and Measurement Technology Conference, Turin, Italy, 22–25 May 2017; ISBN 978-1-5090-3596-0. [Google Scholar] [CrossRef]
  27. De Serio, F.; Mossa, M. Meteo and Hydrodynamic Measurements to Detect Physical Processes in Confined Shallow Seas. Sensors 2018, 18, 280. [Google Scholar] [CrossRef] [Green Version]
  28. DHI. Mike 3 Flow Model: Hydrodynamic Module—Scientific Documentation; DHI Software: Hørsholm, Denmark, 2016. [Google Scholar]
  29. Simoncelli, S.; Fratianni, C.; Pinardi, N.; Grandi, A.; Drudi, M.; Oddo, P.; Dobricic, S. Mediterranean Sea Physical Reanalysis (CMEMS MED-Physics) [Data Set]. Copernicus Monitoring Environment Marine Service (CMEMS). 2019. Available online: https://doi.org/10.25423/MEDSEA_REANALYSIS_PHYS_006_004 (accessed on 10 October 2020).
  30. Xie, P.; Arkin, P.A. Global precipitation: A 17-year monthly analysis based on gauge observations, satellite estimates, and numerical model outputs. Bull. Am. Meteorol. Soc. 1997, 78, 2539–2558. [Google Scholar] [CrossRef]
  31. Rodi, W. Examples of calculation methods for flow and mixing in stratified fluids. J. Geophys. Res. Ocean. 1987, 92, 5305–5328. [Google Scholar] [CrossRef]
  32. Smagorinsky, J. Large eddy simulation of complex engineering and geophysical flows. In Evolution of Physical Oceanography; Galperin, B., Orszag, S.A., Eds.; Cambridge University Press: New York, NY, USA, 1993; pp. 3–36. [Google Scholar]
  33. Partheniades, E. Erosion and deposition of cohesive soils. J. Hydraul. Div. 1965, 91, 105–139. [Google Scholar]
  34. Lumborg, U. Modelling the deposition, erosion, and flux of cohesive sediment through Øresund. J. Mar. Syst. 2005, 56, 179–193. [Google Scholar] [CrossRef]
  35. USEPA. Contaminated Sediment Remediation Guidance for Hazardous Waste Sites; OSWER 9355.0-85; Office of Solid Waste and Emergency Response, U.S. Environmental Protection Agency: Washington, DC, USA, 2005. Available online: http://www.epa.gov/superfund/resources/sediment/guidance.htm (accessed on 10 October 2020).
  36. Finch, M.; Fisher, R.; Palmer, A.; Baumgard, A. AnIntegrated Approach to Pipeline Burial in the 21st Century. In Proceedings of the Deep OffshoreTechnology2000 Conference, New Orleans, LA, USA, 7–9 November 2000. [Google Scholar]
  37. Hayes, D.; Wu, P.Y. Simple approach to TSS source strength estimates. In Proceedings of the Western Dredging Association Twenty-first Technical Conference and Thirty-third Annual Texas A and M Dredging Seminar Special PIANC Session/Texas A and M University, Center for Dredging Studies, Houston, TX, USA, 25 June 2001. [Google Scholar]
  38. De Serio, F.; Mossa, M. Streamwise velocity profiles in coastal currents. Environ. Fluid Mech. 2014, 14, 895–918. [Google Scholar] [CrossRef]
  39. De Pascalis, F.; Ghezzo, M.; Umgiesser, G.; De Serio, F.; Mossa, M. Use of SHYFEM open source hydrodynamic model for time scales analysis in a semi-enclosed basin. In Proceedings of the Environmental, Energy, and Structural Monitoring Systems (EESMS), Bari, Italy, 13–14 June 2016; pp. 1–4. [Google Scholar]
  40. Feola, A.; Lisi, I.; Salmeri, A.; Venti, F.; Pedroncini, A.; Gabellini, M.; Romano, E. Platform of integrated tools to support environmental studies and management of dredging activities. J. Environ. Manag. 2016, 166, 357–373. [Google Scholar] [CrossRef] [PubMed]
  41. SKM, Sinclair Knight Merz Pty Ltd. Improved Dredge Material Management for the Great Barier Reef Region; Great Barrier Reef Marine Park Authority: Townsville, Australia, 2013.
  42. Matheron, G. Principles of geostatistics. Econ. Geol. 1963, 58, e1246–e1266. [Google Scholar] [CrossRef]
Figure 1. Target area.
Jmse 08 01020 g001
Figure 2. Location of the fixed monitoring stations in the target area.
Jmse 08 01020 g002
Figure 3. Seamark where the monitoring station in Mar Grande was installed.
Jmse 08 01020 g003
Figure 4. Displacement of the stationing points.
Jmse 08 01020 g004
Figure 5. Comparison between the numerical and the measured flow fields on 26 November 2014. Red vectors are the measured velocities, while the black ones are the modelled velocities at (a) z = −4 m and (b) z = −7 m.
Jmse 08 01020 g005
Figure 6. Dredged area.
Jmse 08 01020 g006
Figure 7. Computational maps of (a) the mean surface currents during the dredging activity, (b) SSCmax at the surface–hydraulic dredge and (c) SSCmax at the surface–mechanical dredge.
Jmse 08 01020 g007
Figure 8. Computational maps of (a) the mean surface currents during the dredging activity, (b) SSCmax at the bottom–hydraulic dredge and (c) SSCmax at the surface–mechanical dredge.
Jmse 08 01020 g008
Figure 9. Location of discrete check points for result extractions: (a) whole area and (b) zoom.
Jmse 08 01020 g009
Figure 10. Point A: Time series for the SSC at the surface layer due to (a) hydraulic dredge and (b) mechanical dredge.
Jmse 08 01020 g010
Figure 11. Point A: Time series for the SSC at the bottom layer due to (a) hydraulic dredge and (b) mechanical dredge.
Jmse 08 01020 g011
Figure 12. Distribution of the SSC number (SSCnum) for the mechanical and hydraulic dredging plumes at (a) the surface layer and (b) bottom layer.
Jmse 08 01020 g012
Figure 13. Distribution of the SSCnum at the surface layer due to (a) hydraulic dredge and (b) mechanical dredge.
Jmse 08 01020 g013
Figure 14. Distribution of the SSCnum at the bottom layer due to (a) hydraulic dredge and (b) mechanical dredge.
Jmse 08 01020 g014aJmse 08 01020 g014b
Figure 15. Variogram γ(h) plot with indication of the sill and range parameters.
Jmse 08 01020 g015
Figure 16. SSCnum variogram models evaluated at the surface layer due to (a) hydraulic dredge and (b) mechanical dredge.
Jmse 08 01020 g016
Table 1. Parameters of the dredging implementation.
ParametersT1T2
Type of dredgerHydraulic dredgeEcological Mechanical dredge
Volume to be dredged (m3)50,00050,000
Dredging time (d)1212
Production capacity (m3/h)0.13880.1388
Mean resuspension factor R (%)2.51.5
Table 2. Sill and range values for the suspended solid concentration number (SSCnum) variogram models evaluated for mechanical and hydraulic dredges at the surface and bottom layers.
Hydraulic DredgeMechanical Dredge
SurfaceBottomSurfaceBottom
Sill371205.521
Range (m)8501300380700
Publisher’s Note: MDPI stays neutral with regard to jurisdictional claims in published maps and institutional affiliations.

